


Please enter the answer below before you can view the full text.


2025
Volume: 54 Issue 6
34 Article(s)

Zichen ZHANG, Dong SUN, Jianjian RUAN, Shufan LI, Wei QIAO, and Hongyi LIN
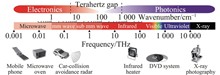
Significance Terahertz (THz) technology, due to its unique non-contact measurement and non-destructive testing capabilities, has shown remarkable potential in a wide range of marine applications. The ability to detect pollutants, assess the condition of marine infrastructure, and monitor ecological health in real time offers significant advantages over traditional methods. As such, THz technology holds great promise for advancing marine environmental protection and resource management.Progress Firstly, the application of terahertz (THz) waves in marine environment monitoring is first introduced. In the THz waveband, the normalized radar cross section (NRCS) is used to measure variations in reflection intensity at different incident angles, which helps evaluate the characteristics of the oil film. NRCS reflects the interaction of THz waves with the oil film surface, providing insights into its thickness, distribution, and surface properties. As the propagation properties of THz waves differ between the oil film and the water surface, factors such as the thickness, composition, and surface conditions of the oil film directly influence the reflection characteristics. By measuring the reflection intensity at different incident angles, detailed information about the oil film can be obtained, allowing for precise assessment of its thickness and distribution (Fig.5). For water quality classification, THz waves are incident at a specific angle onto an ATR prism, generating evanescent waves that penetrate the sample through total reflection. Fourier transform is applied to extract the reflection coefficient and calculate the complex permittivity. Optical parameters are modeled and classified to achieve water sample classification (Fig.6-Fig.7). Next, the application of THz technology in marine non-destructive testing is introduced. This part is divided into three sections: non-destructive testing of ship hull fiberglass materials, protective coatings and paint layers, and PE pipes. Non-destructive testing of ship hull fiberglass materials (Fig.8, Fig.10-Fig.11) and PE materials (Fig.16-Fig.17) is carried out using THz time-domain spectroscopy (THz-TDS). The principle involves exciting THz pulses to pass through the sample, collecting transmitted and reflected signals. By sampling these signals in the time domain and applying Fourier transform, the data is converted into the frequency domain, creating imaging for internal structure and defect visualization. This process enables the non-destructive evaluation of internal features and defects. For the non-destructive testing of ship protective coatings and paint layers (Fig.12-Fig.14), time-domain THz technology is used to record the time delay and amplitude variations of reflected signals. Deconvolution techniques are applied to calculate the coating thickness, and stationary wavelet transform (SWT) is utilized to extract characteristic signals for internal defect identification. Finally, the application of THz technology in marine ecosystem monitoring is discussed. This includes the detection of microalgal and microbial metabolites (Fig.18-Fig.20) to assess the potential for ecological issues, such as red tide phenomena, and the detection of radioactive cesium ions in seawater (Fig.22). The use of THz waves in marine ecosystem monitoring offers a promising approach for early detection of ecological disruptions and contamination in aquatic environments. The results shown in Fig.18 and Fig.22 highlight the potential of THz technology in enhancing marine environmental monitoring, ensuring a safer and more sustainable marine ecosystem.Conclusions and Prospects THz technology has demonstrated substantial potential in various marine applications, particularly in pollution detection, material integrity assessment, and ecological monitoring. Its non-contact and non-destructive characteristics make it an ideal tool for safeguarding marine infrastructure and ecosystems. As THz technology continues to evolve, its applications in the marine field are expected to expand, offering more efficient and accurate methods for real-time monitoring and early warning systems. In the future, THz technology is poised to play a crucial role in marine resource protection, contributing to sustainable marine management and environmental conservation.
Jun. 25, 2025Vol. 54 Issue 6 20240605 (2025)
Yuqiang LIU, Shengqun SHI, Mengsheng ZHANG, Yebin XU, and Lianbo GUO
ObjectiveAstragalus membranaceus, a widely recognized traditional Chinese medicinal herb, is extensively employed for its immunomodulatory and health-enhancing properties. The quality and therapeutic efficacy of Astragalus are profoundly influenced by its geographical origin, underscoring the necessity for reliable methods to authenticate its provenance, ensure product integrity, and mitigate adulteration risks. Conventional identification techniques, encompassing morphological, chemical, and DNA-based approaches, are often constrained by their time-intensive, laborious, and costly nature, thereby limiting their applicability in large-scale industrial contexts. Spectroscopic techniques, such as Laser-Induced Breakdown Spectroscopy (LIBS) and Near-Infrared Spectroscopy (NIR), have emerged as rapid, non-destructive, and efficient analytical tools for quality assessment and geographical origin determination. Nevertheless, the inherent complexity of Astragalus, characterized by its diverse elemental and molecular profiles, often renders single-spectral techniques inadequate for comprehensive characterization. Data fusion methodologies, which integrate complementary information from multiple sources, offer a promising avenue to enhance classification accuracy. By leveraging advanced data fusion strategies to combine LIBS and NIR spectral data, the accuracy of geographical origin discrimination for Astragalus membranaceus can be substantially improved.MethodsAstragalus samples were collected from five different geographical origins: Gansu, Heilongjiang, Inner Mongolia, Shanxi, and Shaanxi (Fig.1). Complementary elemental and compositional information was obtained using LIBS and NIR techniques (Fig.2). Initially, Support Vector Machine (SVM), Logistic Regression (LR), and Linear Discriminant Analysis (LDA) models were developed based on individual LIBS and NIR spectral data, and LDA was selected as the base model for investigating fusion classification outcomes based on the single-spectral classification results (Tab.1). To improve classification performance, lower-level and mid-level data fusion strategies were employed to integrate LIBS and NIR spectral information. Lower-level data fusion involves the direct concatenation of LIBS and NIR spectral data to form a new lower-level fused spectral dataset for model classification (Fig.4). Mid-level data fusion, on the other hand, extracts the most representative features from LIBS and NIR spectra separately and then concatenates these features to form a mid-level fused spectral dataset for model classification (Fig.4). The model's performance was evaluated using various metrics, including classification accuracy (ACC), macro-precision (M-P), macro-recall (M-R), macro-F1 score (M-F1), and the Area Under the Curve (AUC), to assess the effectiveness of spectral fusion strategies compared to single-spectral approaches.Results and DiscussionsIn single-spectrum analysis, the LDA model for LIBS achieved an optimal classification accuracy of 88% on the test set (Tab.1). In comparison, the lower-level fusion LDA model attained an accuracy of 92.00% and an AUC value of 0.9964 on the test set (Tab.3). The most notable enhancement, however, was observed in the mid-level fusion approach, which utilized the Stepwise Projection Algorithm (SPA) for feature selection on both LIBS spectral lines and NIR data. This mid-level fusion LDA model achieved a classification accuracy of 96.00% and an AUC value of 0.9998 on the test set (Tab.3), showing substantial improvements in both precision and reliability. The mid-level fusion approach successfully eliminated redundant data, enabling more efficient and accurate classification. Finally, an importance analysis was conducted on the features in the mid-level fusion (Fig.9), with key features being interpreted. The results indicate that integrating complementary spectral data from LIBS and NIR significantly outperforms single-spectrum analysis in terms of classification accuracy and robustness.ConclusionsThe results demonstrate the efficacy of combining LIBS and NIR spectral data through data fusion for the accurate and efficient identification of the geographical origin of Astragalus membranaceus. The mid-level fusion model, which integrates feature selection techniques, provided the highest classification performance, indicating its potential for non-destructive and rapid origin authentication. The findings not only highlight the advantages of spectral fusion in enhancing classification accuracy but also propose a reliable and scalable solution for the quality control and traceability of medicinal herbs in the pharmaceutical industry. The successful application of LIBS-NIR spectral fusion paves the way for more comprehensive analytical approaches in the quality assessment of traditional Chinese medicinal materials.
Jun. 25, 2025Vol. 54 Issue 6 20250003 (2025)
Xuehai ZHANG, Wenbo LIU, Yao LI, Yiwen LI, Xinhui ZHANG, Shuguang ZOU, Weidong LI, and Yanchuang ZHAO
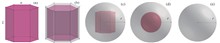
ObjectiveIce crystal particles form complex mixed-state features during the melting process, which in turn affects their optical and radiative properties, with important implications for studies of global radiation effects and weather forecasting. Early researchers assumed the shape of ice crystal particles as spherical for theoretical studies. Recently, various standard nonspherical particle models such as hexagonal, cylindrical, and bullet have been developed to study the optical properties of ice crystal particles. However, the real ice crystal particle morphology is much more complex than the standard models. For example, the melting process of ice crystal particles is a very common but extremely important process, which is important for the study of microphysical and optical properties of ice crystal particles. During rainfall process, ice crystal particles are transformed into raindrops in the melting layer, and the microphysical properties such as the morphology and mixing state of ice crystal particles undergo a complex change. For the study of the melting process of ice crystal particles, there are advantages and shortcomings in both field observations and radar observations. Therefore, it is important to construct an accurate melting ice crystal particle model to study the optical properties of ice crystal particles during the melting process.MethodsIn this paper, a non-spherical non-uniform model is proposed to simulate the morphology and mixing state of ice crystal particles during the melting process, and the Discrete Dipole Approximation (DDA) method is used to systematically study the effect of frequency, aspect ratio, and Ice-to-Water Mixing Ratio (IWMR) on the optical properties of melting ice crystal particles.Results and DiscussionsThe results show that the optical properties (extinction efficiency factor, scattering efficiency factor, asymmetry factor, and scattering phase matrix) of ice crystal particles at different melting stages have large differences. Specifically, the larger the particle size of melting ice crystal particles, the larger the oscillation amplitude of its extinction efficiency factor, scattering efficiency factor and asymmetry factor with frequency change, and the larger the oscillation of the scattering phase matrix element of melting ice crystal particles, with the increase of frequency. With the melting of the ice crystal particles, these optical parameters show regular changes with the decrease of IWMR, which also implies that ignoring the melting process of the ice crystal particles may lead to misestimation of their optical properties. The results also show that the influence of ice crystal particle morphology on extinction efficiency factor, scattering efficiency factor and asymmetry factor is mainly in the lower melting stage. When the melting degree is low, the aspect ratio of the ice crystal nuclei has a significant effect on all the optical property parameters. When the melting degree is high, the effect of the nuclear aspect ratio on the non-scattering optical parameters such as the particle extinction efficiency, scattering efficiency and asymmetry factor is basically negligible, but with the increase of the particle size, the nuclear aspect ratio of the ice crystals still has a significant effect on the particle scattering matrix elements. The results of the study can provide a reference for further understanding of the evolution law of microphysical properties of ice clouds and improving the accuracy of ice-water content inversion and other studies.ConclusionsThis paper presents a parameterized model of melting ice crystals, which is based on the actual scenario of the complex evolution process of particle morphology and mixing state exhibited during the melting process of ice crystal particles. This model has been developed in order to address the practical needs of microwave remote sensing and inversion algorithm research of ice crystal particles. A particle model is constructed and the DDA method is employed to conduct a comprehensive investigation into the influence of various factors, including particle size, frequency, morphology and melting degree, on the optical characteristics of ice crystal particles. These characteristics include extinction efficiency factor, scattering efficiency factor, asymmetry factor and scattering matrix elements.
Jun. 25, 2025Vol. 54 Issue 6 20240547 (2025)
Xu GAO, Jianzhong CHAI, Jingyao WANG, Hao TIAN, and Minghui GAO
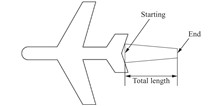
Objective This study aims to analyze the detection capabilities of space-based high-orbit infrared sensors, specifically the retired SBIRS-GEO and the upcoming Next-Gen OPIR, for identifying low-temperature exhaust plumes of aircrafts. The research focuses on understanding how these sensors perform under different operational states of aircraft engines and various observation angles, providing effective measures to escape space infrared detection for aircraft design.Methods With the GEO orbital detection model and specified early warning scene, U.S. two generation of advanced space infrared sensors, carried by SBIRS-GEO and Next-Gen OPIR satellites, is analyzed for their detectability on aircraft tail flame. The research employs a high-orbit infrared detection model and constructs corresponding space-based detection scenarios. The study models the infrared radiation characteristics of aircraft exhaust plumes under different engine states (with and without afterburner) and observation angles. The analysis is conducted in two observation bands: 2.8-4.3 μm and 8.0-10.8 μm. The study also considers the impact of atmospheric spectral transmittance and the geometric and thermodynamic parameters of the exhaust plumes. The performance of SBIRS-GEO and Next-Gen OPIR sensors is compared based on their energy signal-to-noise ratios (SNR) and detection thresholds.Results and Discussions The results show that, with the observation bands of 2.8-4.3 μm and 8.0-10.8 μm, the infrared radiation energy of the tail flame of the aircraft can reach up to 400-600 W/sr under non-afterburner state, and up to 2600-10000 W/sr under afterburner state. Both can be detected by the infrared sensors carried by SBIRS-GEO and Next Gen OPIR, but the energy SNR of SBIRS-GEO is only 4.0-12.37, significantly lower than the 18.92-41.72 of Next Gen OPIR. When the radiation area of the tail flame is amplified by 1.5 times, the energy signal-to-noise ratio of both infrared detectors is significantly improved, with SBIRS-GEO showing the most significant improvement, reaching 6.92-20.31, significantly increasing the probability of infrared detection, indicating that plume control is still necessary. Through further analysis, it was found that under the non-afterburner state, when the initial temperature of the tail flame is below 750 K and the final temperature is below 360 K, the SBIRS-GEO detector theoretically cannot detect the aircraft tail flame. Therefore, the effective measures to escape space infrared detection will include: downsizing the tail flame, lowering its temperature, and flight with specified angles.Conclusions Space-based infrared warning sensors deployed in geostationary orbit at 36000 km can effectively detect and image low-temperature aircraft exhaust plumes. The afterburner state of the aircraft engine and the observation angle of the satellite are critical factors influencing the performance of space-based infrared detection. The SBIRS-GEO infrared sensor cannot detect low-temperature exhaust plumes in non-afterburner states. While the SBIRS-GEO sensor can identify exhaust plumes in afterburner states, its low pixel radiance results in lower identification success rates. The Next-Gen OPIR system, equipped with a new generation of 4 K large-array infrared detectors, offers higher energy resolution and can accurately identify exhaust plumes in both afterburner and non-afterburner states. Reducing component temperature, optimizing plume control, increasing observation elevation angles, and decreasing azimuth angles can effectively reduce the infrared radiation energy of engine exhaust plumes, thereby lowering the probability of detection by space-based infrared sensors. This study provides valuable theoretical references for the development of next-generation space-based infrared warning systems, emphasizing the importance of advanced sensor technology and optimized plume control strategies in enhancing detection capabilities.
Jun. 25, 2025Vol. 54 Issue 6 20240539 (2025)
Yunmeng LIU, Yang WANG, Lei DING, Huixian DUAN, and Jinguang CHAI
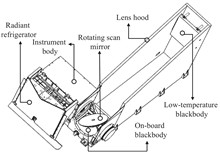
ObjectiveThe primary objective of this study is to address the effectiveness in improving the calibration accuracy of the low-temperature part based on the low-temperature blackbody. With the improvement of inversion accuracy of the ground object target from remote sensing, the quantitative level of the spaceborne equipment is increasing. Typically, on-board blackbody, variable-temperature blackbody, or reference blackbody are installed to solve the problems of on-orbit calibration and reference transfer measurements. From the ground applications, the temperature field of on-orbit instruments is different from tank, it means that the calibration coefficients obtained before launch cannot be directly applied to on-orbit calibration equations. Consequently, the on-orbit calibration coefficients calculated using two-point method based on the "on-board blackbody + cold space" exits significant deviations, especially for detecting targets below 200 K. Therefore, in order to enhance the inversion accuracy at the low-temperature infrared spectrum, a low-temperature blackbody is added to calibrate combined with the on-board blackbody.MethodsFor the center wavelengths of 10.8 μm and 12 μm, the in-orbit calibration method using the dual blackbody for spaceborne infrared spectral imager is researched, and the fusion calibration of "on-board blackbody+low-temperature blackbody", "low-temperature blackbody+cold space" and "on-board blackbody+cold space" is proposed. Based on the in-orbit calibration data, the calibration accuracy and the response consistency of the fusion calibration method for spaceborne infrared spectral imager are analyzed, combined with the laboratory calibration data. Firstly, using the two-point fitting method based on "low-temperature blackbody+on-board blackbody" the temperature deviations at different radiation targets are calculated (Fig.3-Fig.4). It is shown that when the errors of the two blackbodies remain constant, the larger temperature difference between the low-temperature and on-board blackbodies can lead to the smaller inversion errors, while a smaller temperature difference can lead to the greater extrapolated radiance deviations. Similarly, using the two-point fitting methods based on "cold space+on-board blackbody" and "low-temperature blackbody+cold space", temperature deviations at various radiation targets are calculated (Fig.6, Fig.8). The results indicate that the "low-temperature blackbody+cold space" calibration method produces relatively consistent temperature deviations at the low-temperature section compared to the "on-board blackbody+cold space", but exhibits larger deviations at high-temperature section @350 K. Additionally, the response consistency of the infrared detection systems before and after launch is calculated (Tab.1), it is shown that the responsivity ratio of dual blackbodies using on-orbit calibration method and pre-launch calibration method is consistent. Finally, based on 370 sample datasets, on-orbit calibration coefficients of the infrared detection system are calculated using the two-point method with three calibration sources: low-temperature blackbody, on-board blackbody, and cold space. The radiance of Earth’s low-temperature targets is computed (Fig.11, Fig.13) to analyse the calibration effectiveness.Results and DiscussionsThrough extensive experiments, it is found that: the brightness temperature results calculated using "on-board blackbody+low-temperature blackbody", "low-temperature blackbody+cold space" and "on-board blackbody+cold space" are different in the low-temperature region, the brightness temperature results calculated using "low-temperature blackbody+cold space" and "on-board blackbody+cold space" are approximate; The calibration accuracy using "on-board blackbod+low-temperature blackbody” is depended on the calibration accuracy of two blackbodies, the calibration accuracy using "low-temperature/on-board blackbody+cold space" is depended on the calibration accuracy of the blackbody and cold space energy. To acquire more accurate radiance of the cold space, the low-temperature blackbody should be controlled to 180 K. When the blackbody calibration error is 0.5 K, a calibration accuracy of 0.5 K can be achieved for the low-temperature section of radiation targets.ConclusionsAccording to the laboratory calibration data and the on-orbit calibration data, before and after injection, the response of the on-board blackbody and the low-temperature blackbody is consistent using the current calibration scheme. Based on the on-orbit calibration data, through the fusion calibration method—"on-board blackbody+low-temperature blackbody", "on-board blackbody+cold space", and "low-temperature blackbody+cold space”, it is found that the brightness temperature results from the "on-board blackbody+cold space” and "low-temperature blackbody+cold space” are similar, they all have calibration differences in low-temperature region. To obtain a more detailed low-temperature nonlinear curve, it is necessary to increase the dynamic range of the low-temperature blackbody, and the temperature at the lower-temperature part is below 180 K.
Jun. 25, 2025Vol. 54 Issue 6 20240574 (2025)
Jialin DING, Yong MENG, Qi ZHANG, Weiwei SONG, Qingwei LI, and Chunsheng CHEN
ObjectiveSince the 1960s, precision-guided weapons have demonstrated powerful strike capabilities on the battlefield with the development of opto-electronic technology. As one of the important passive jamming measures, smoke screen play an important role in the modern opto-electronic guided weapons countermeasure. Accurately and reliably evaluating the obscuring power has become one of the important research interests in the field of smoke screens. Currently, some scholars have proposed using image correlation indexes to evaluate the jamming effectiveness, but most analyses are based on changes in correlation before and after smoke screen jamming, without considering the applicability of evaluation indexes for matching and tracking performance of guidance systems. Therefore, a method for selecting image correlation indexes based on simulation and field experiments is proposed, with a comprehensively analysis of the change in image correlation and matching performance before and after smoke jamming.MethodsNormalized Mean Squared Similarity (NMSS), Normalized Product Correlation Coefficient (NProd), Pearson's Correlation Coefficient (PLCC), and Structural Similarity Index Measure (SSIM) are proposed as functions for evaluating image correlation. The factors influencing image correlation due to smoke jamming are analyzed (Fig.1), and a method for selecting image correlation indexes based on simulation and field experiments is established. The simulation dataset includes 70 images featuring various typical targets such as aircraft, ships, and vehicles (Fig.2). It constructs a simulated jamming dataset based on attenuation rates, target occlusion ratios, and overall image grayscale variations (Fig.3). The smoke-emitting equipment used in the field experiments, along with targets and basic parameters, is detailed (Tab.1). The layout of the experimental site and data processing methods are depicted (Fig.5-Fig.6).Results and DiscussionsNMSS, NProd, PLCC, and SSIM indexes are utilized to evaluate the image correlation of target areas within the simulation jamming dataset and to analyze target matching performance. The NMSS and NProd are significantly affected by attenuation rates, target area occlusion, and overall image grayscale changes. The PLCC and SSIM correlation values show sensitivity to changes in attenuation rates, target area occlusion, and overall image grayscale, with their matching accuracy trends aligning with the correlation curve variations. This suggests that they can be preliminarily considered suitable as smoke jamming effectiveness evaluation indexes (Fig.4). In field experiments, the attenuation rate, occlusion ratio, and overall image grayscale changes exhibit an initial rise followed by a decline with increasing image frame. The amplitudes of attenuation rate and occlusion ratio changes are similar, while the overall image grayscale variation is less than 30%, primarily due to the flame produced by the smoke-emitting equipment combustion (Fig.8). In field experiment, the correlation values of the PLCC and SSIM are consistent with the trend in matching accuracy, making them suitable as quantitative and graded evaluation indexes for smoke jamming effectiveness (Fig.9).ConclusionsThe evaluation indexes for smoke jamming effectiveness based on image correlation are proposed according to the tracking mechanism of guidance systems, making the evaluation results more realistic in combat scenarios. However, current research mainly focuses on the changes in correlation before and after smoke jamming, with few studies analyzing the applicability of indexes in conjunction with target matching performance. The reliability of these evaluation results remains to be verified. Therefore a method for selecting image correlation indexes based on simulation and field experiments is proposed, which can effectively evaluate the applicability of indexes. The PLCC and SSIM are more sensitive to smoke jamming effectiveness and can be used as quantitative and graded evaluation indexes for smoke jamming effectiveness.
Jun. 25, 2025Vol. 54 Issue 6 20240602 (2025)
Zhiling LIU, Bin YANG, Zhiwei LI, Zhen WANG, Yifeng AN, and Zhifeng HUANG
ObjectiveWith the continuous advancement of infrared thermal imaging detection and guidance technologies, research on infrared radiation has become pivotal for mitigating threats to ships. The exhaust plume is one of the main sources of infrared radiation, the suppression of the plume is critical for the overall infrared stealth characteristic of ships. Experimental investigations serve as the principal means for understanding the infrared radiative characteristics of ship exhaust plumes and are important for the design and optimization of exhaust systems. In practical applications, experimental systems are often scaled down to reduce testing costs. Consequently, examining the similarity in infrared radiative characteristics between scaled and full-scale systems provides a foundation for applying experimental results. Existing studies mainly consider the similarity of temperature and concentration fields as prerequisites for achieving radiative similarity. However, whether optical thickness should remain consistent before and after scaling remains unresolved. In practical scaled model experiments, when the exhaust gas composition is consistent across scaled and full-scale systems, variations in geometric dimensions often result in changes to optical thickness. Exploring the impact of optical thickness on radiative similarity is therefore of significant academic and practical importance for validating and applying the results of scaled model experiments.MethodsRadiative similarity is investigated firstly in one-dimensional media. The analytical solution for radiative intensity is derived through solving the radiative transfer equation. Single-layer media with only high temperature gas and multi-layer media containing high temperature and surrounding low temperature gases are considered. Similarity conditions including consistent temperature and medium concentration distribution as well as equal optical thickness are examined. In order to check the applicability of the radiative similarity rules in a practical system, the plume of a ship exhaust system is investigated. Computational fluid daynamic are conducted to obtain the temperature field and the molar fraction fields of CO2 and H2O in the plume. The reverse Monte Carlo method is then employed to compute the radiative intensity of the exhaust system. This approach enables a detailed analysis of the infrared radiative similarity of different scaled models under actual exhaust conditions.Results and DiscussionsFor one-dimensional media, under the condition of the same temperature and gas concentration distribution as well as equal optical thickness, the maximum deviation between scaled and full-scale systems is 1.37%, regardless of whether the medium consists of a single layer or multiple layers of gas. When the gas concentration remains unchanged (resulting in significant variations in optical thickness), the infrared radiative intensity exhibits some differences between scaled and full-scale systems. For two-layer and three-layer media where there is a low temperature surrounding media, the deviation is less than 10%. The spectral distributions are illustrated in Fig.2 and Fig.3, while the results of the spectrally integrated radiative intensity are summarized in Tab.1. For the plume of a ship exhaust system, the infrared images are shown in Fig.9. Radiative intensity results in Tab.3 show that if the optical thickness is the same for scaled and full-scale systems, the biggest deviation is 2.15%. If the Mole fractions of the gases keep unchanged (with optical thickness changed), the biggest deviation is 10.47%.ConclusionsUnder the conditions of consistent temperature distribution and similar flow fields as well as the same optical thickness, the scaled and full-scale exhaust systems exhibit high similarity in their infrared radiation characteristics. The integrated radiative intensity of the exhaust plume area is proportional to the square of the scaling ratio. When the scaled and full-scale systems satisfy similar temperature and flow fields but maintain a constant Mole fraction of the gas medium (resulting in changes in optical thickness), deviations in infrared radiation intensity are observed. Nevertheless, the results from the scaled model remain valuable for predicting the infrared radiation characteristics of the full-scale system. In scaled experiments of exhaust system, ensuring similar temperature and flow fields is crucial for maintaining radiation similarity. Although changes in optical thickness introduce some impact on radiative similarity, the deviations are relatively small and do not undermine the predictive value of the scaled model results.
Jun. 25, 2025Vol. 54 Issue 6 20250016 (2025)
Wenpei ZHENG, Xiaoru SUN, and Zikai WANG
ObjectiveThe welding joints of small-diameter nozzles of pressure vessels usually have complex structures and groove types. During the production and manufacturing process, defects such as porosity, lack of penetration, and lack of fusion are prone to occur, which can easily cause stress concentration, resulting in fatigue cracks, leakage, and even explosion accidents. Structural damage detection of small-diameter nozzles is of great significance for the safe service of pressure vessels. However, the current technology applied to the welding seam detection of small-diameter nozzles of pressure vessels is limited by the special structure of small-diameter nozzles and the high requirements for surface quality. Therefore, the detection effect is limited. Research on detection technology suitable for the complex structure, poor surface quality, and narrow space of small-diameter nozzles is of great significance for effectively evaluating the safety status of small-diameter nozzles. Eddy current thermography detection can detect objects within a large field of view from a distance, especially suitable for complex structures such as small-diameter nozzles of pressure vessels.MethodsBased on the principle of eddy current thermography (Fig.1), a small-diameter nozzle of a pressure vessel model and an excitation coil model were constructed using SolidWorks (Fig.4-Fig.5). Using COMSOL finite element software for electromagnetic thermal coupling simulation analysis, the temperature distribution around the weld defect of the small-diameter nozzle under the excitation of the arc-shaped double coil and the adaptability of the coil are studied. Exploring the thermography method for small-diameter nozzle defects in pressure vessels using the intersecting line scanning mode in simulation, achieving intelligent detection of defect signals in the intersecting line dimension, and laying the foundation for the industrial application of this technology. Meanwhile, an eddy current thermography experimental simulation system was set up in the laboratory to simulate the welding defects of small-diameter nozzles of pressure vessels (Fig.13), and the results were compared with the simulation for verification. Finally, using MATLAB to extract grayscale and pixel positions from the thermal imaging results, thus completing the quantitative evaluation and detection of defect length.Results and DiscussionsThrough COMSOL simulation, it can be concluded that under static inspection, the temperature difference between the defective area and the non-defective area of the small-diameter nozzle weld seam in the pressure vessel can reach a maximum of 10 ℃ or more (Fig.8), therefore the effect is good. In the dynamic detection of intersecting line scanning mode, defects of different sizes showed significant temperature changes, and the highest heating temperature could reach 283 ℃ (Fig.12). The laboratory has set up an eddy current thermal imaging detection system, and through actual simulation under non ideal conditions, the temperature in the defect area has increased by about 5 ℃ (Fig.18). The above research results indicate that eddy current thermography technology can meet the demand for defect detection of small-diameter nozzle welds in pressure vessels. The quantitative evaluation of defect length was achieved through MATLAB and related formulas. The calculated values of defect length were 7.74 mm and 3.91 mm, respectively, with errors of 3.25% and 2.25% compared to the actual length.ConclusionsBased on eddy current thermography technology, a new type of excitation coil suitable for defect detection of small-diameter nozzle welds in pressure vessels was designed. Through COMSOL simulation, it was found that when the excitation coil heats the defect, the temperature change in the defect area is significant, and the defect causes disturbance in the induced eddy current, mainly concentrated at the two ends of the defect, forming the high-temperature zones. And completed the intersection line scanning mode of thermography along the spatial curve for detecting small diameter nozzle defects in pressure vessels. Preliminary verification has been conducted on the effectiveness of eddy current thermography technology in detecting small diameter nozzle welds in pressure vessels. In the experimental simulation, the heating effect of the excitation coil on small-diameter nozzle welds defects is significant, and the existence of defects can be effectively detected. This indicates that the arc-shaped double coil has good applicability to the welding seam of small-diameter nozzle, and verifies the effectiveness of eddy current thermography technology in the detection of welding seams of small-diameter nozzle in pressure vessels. By using MATLAB to extract grayscale and pixel positions from thermal imaging images, quantitative evaluation and detection of the length of small-diameter weld defects in pressure vessels have been achieved.
Jun. 25, 2025Vol. 54 Issue 6 20250053 (2025)
Qinglin NIU, Zengjie ZHOU, Wenqiang GAO, and Xiaying MENG
ObjectiveAerospike is considered a relatively simple and effective technique to reduce drag for hypersonic vehicles. Aerospike reconstructs the flow field and reduces drag, as well as modifying the magnitude and distribution of the skin temperature, thus influencing the radiation signatures of the blunt body. To explore the impacts of diverse aerospike on infrared radiation over blunt body, this study focuses on aerospikes respectively equipped with conical, hemispherical, and flat-faced aerodisks. The aerodynamic force, thermal property, and infrared radiation of the blunt body affected by the aerospike with three typical aerodisks are numerically simulated. This study provides theoretical reference for the design of low signatures aerospike and the infrared detection of related targets.MethodsThe Navier-Stokes equation was solved based on the Reynolds averaging method to obtain the flow field of the plume. The flow field parameters were computed through finite rate chemical reactions with seven components. The skin temperature was calculated based on the thin-wall approximation and the radiative equilibrium wall. By Planck's blackbody radiation law, the infrared radiation signatures of the blunt body considering the wall occlusion effect are predicted with the ray tracing method. Two representative cases (H=15 km and H=40 km) were selected to analyze the effect of the aerospike on the blunt body, including the aerodynamic force, thermal property, and infrared radiation signatures.Results and DiscussionsThe drag reduction efficiency of the aerospike at 40 km decreases by about 1%–7% compared to that at 15 km. The aerospike with flat-faced aerodisk maintains drag reduction efficiency above 50%, exceeding the other two structures by 5%-13% (Tab.4). The aerospike reduces the temperature near the nose of blunt body by 35%–50%, and the heat reduction effect on the downstream of the blunt body is not obvious. (Fig. 15). For the flat-faced aerodisk, the peak radiation intensities decrease by 25.3% and 39.4% at side viewing and front viewing observation angles respectively (Fig.16). The maximum in-band radiance suppression rate reaches 19.3%, which is 2%–16% higher than the other aerodisks (Tab.5-Tab.6).ConclusionsAerodisk shape directly affects the aerodynamic force, thermal property, and infrared radiation signatures of the blunt body. The aerospike has the best thermal suppression effect in blunt nose. The aerospike with flat-faced aerodisk features high drag reduction efficiency and is less susceptible to environmental impacts. Among the three types of aerospike structures, only the aerospike with flat-faced aerodisk demonstrates a heat reduction effect behind the blunt nose. The infrared radiation suppression capability of the aerospike is more effective in the MWIR band than in the LWIR band at 15 km, while the reverse holds at 40 km. At different observation angles and in different bands, the aerospike with flat-faced aerodisk mainly suppresses infrared radiation intensity, while the other types of aerospike only show such suppression at the front-view observation angle.
Jun. 25, 2025Vol. 54 Issue 6 20250138 (2025)
Wei WANG, Wei WANG, Tianhao YAO, Dong JI, Shuo TIAN, Weijun LIU, and Hongyou BIAN
ObjectiveCarbon fiber composites are widely used in aircraft fuselage, wing, engine casing and other key structures because of their high specific strength, excellent fatigue resistance and lightweight characteristics. Compared with mechanical connection, adhesive connection will not cause damage to the connection material, can effectively avoid the problem of connection stress concentration, and show excellent fatigue resistance. The presence of resin on the surface of the carbon fiber composite material will affect the strength of the bonded joint. In order to ensure the excellent strength and durability of the bonded joint, it is necessary to remove the resin on the surface of the composite material as much as possible while avoiding damage to the carbon fiber substrate. Laser cleaning technology has outstanding advantages such as green, good cleaning effect, wide application range and non-contact, and has been applied in related fields.MethodsThe laser cleaning test of the resin on the surface of carbon fiber composite materials (CFRP) was utilized by a pulsed fiber laser. The study examined the effects of laser energy density and travel speed on the cleaning outcomes. An analysis of the microstructure and elemental composition of the cleaned samples was conducted. Additionally, the contact angle post-cleaning were evaluated. A bonding experiment was performed, followed by tensile testing and tensile fatigue testing of the bonded parts. The fracture morphology was then assessed to verify the impact of laser cleaning on bonding properties.Results and DiscussionsThe results showed that with the increase of energy density, the removal effect of resin was improved initially, but excessive energy resulted in fiber damage. At a lower energy density (4.77 J/cm2), the resin began to fracture. At higher densities (above 6.37 J/cm2), fiber burn-out and breakage become apparent. Travel speed range from 6 mm/s to 2 mm/s. Higher travel speed reduce the interaction time, resulting in incomplete resin removal. Lower speed leads to better cleaning but risk damaging fibers due to heat accumulation. The analysis showed that effective cleaning corresponded to higher carbon content and lower oxygen content, indicating successful resin removal. As can be seen from Fig.8 (b), the surface bonding strength after S3 treatment can reach 13.02 MPa, which is higher than that of untreated and mechanically polished samples. According to the analysis of tensile fatigue performance, the number of load cycles of the joint after laser treatment is 144000, which is higher than the 95374 after mechanical polishing. At a laser energy density of 6.37 J/cm2 and a laser travel speed of 4 mm/s, the resin is thoroughly cleaned and the carbon fiber matrix is completely exposed, which makes it more conducive to the penetration of the adhesive during the bonding process. At this time, the surface contact angle is lower than other laser treated and mechanically ground surfaces. Through analysis of tensile stress and cross-section, it is found that the laser cleaned sample has better adhesion performance with the metal.ConclusionsLaser energy density and laser travel speed both affect the removal of resin layer on the sample surface. With the increase of laser energy density, the removal amount of resin layer increases gradually. With the decrease of laser travel speed, the removal amount of resin layer increases gradually. Reasonable selection of laser energy density and travel speed can obtain the ideal cleaning effect. When the energy density is 6.37 J/cm2 and the travel speed is 4 mm/s, the surface morphology is the cleanest, the surface contact angle is the smallest 63.29°. At a laser energy density of 6.37 J/cm2 and a laser travel speed of 4mm/s, the interface failure mode is a mixed failure of carbon fiber adhesive layer aluminum alloy, with a shear strength of up to 13.02 MPa, which is more than twice that of untreated and it has good fatigue performance. Processing the surface of carbon fiber composite materials under appropriate laser process parameters can significantly improve the shear strength after bonding.
Jun. 25, 2025Vol. 54 Issue 6 20240556 (2025)
Ning XU, Yupeng CHANG, Jiaming SONG, Zheng KONG, and Liang MEI
ObjectiveDifferential Absorption Lidar (DIAL) is capable of detecting temperature profiles within the atmospheric troposphere by measuring the variation of oxygen (O2) absorption coefficient with altitude or temperature. However, in practical applications, the detection accuracy of the O2 absorption coefficient and thus the temperature profile is influenced by various factors. Currently, the temperature detection error of O2-DIAL is at 3-10 K. Therefore, it is necessary to establish theoretical models and systematically analyze various influence factors of the O2-DIAL technique to improve the temperature detection accuracy. For this purpose, this paper focuses on the effects of noise (signal-to-noise ratio, SNR), Doppler broadening of molecule scattering, specific humidity, and laser wavelength stability on the temperature retrieval results for the O2-DIAL technique. Consequently, this study provides important theoretical support and guidance for the design and implementation of an O2-DIAL system and lays a crucial foundation for optimizing the retrieval algorithm of the temperature profile.MethodsBased on the O2 absorption spectrum (Fig.1) and the atmospheric model (Fig.2-3), a simulation model of the O2-DIAL technique operating at 770 nm has been developed. The on-resonance wavelength and the off-resonance wavelength are selected to be 769.7958 nm (λon) and 769.8156 nm (λoff), respectively. The impacts of noise (SNR), Doppler broadening of molecular scattering, specific humidity, and laser wavelength stability on the retrieved temperature profile have been investigated based on the Monte Carlo method and the O2-DIAL model. Lidar signals added by random noise with different SNRs are used for the retrieval of the O2 absorption coefficient and thus the temperature profile based on an iterative approach. The Doppler broadening effect of molecular scattering has also been added into the simulation model, while it is neglected in the retrieval process to evaluate its influence on the retrieved temperature profile. In addition, the temperature retrieval results of three atmospheric models with different aerosol distributions are also compared to illustrate the influence of the aerosol gradient. Besides, the temperature retrieval results under different specific humidities are simulated to show the influence of specific humidity. Finally, the influence of laser wavelength stability (including wavelength shift and fluctuation), has also been investigated based on Monte Carlo method.Results and DiscussionsSimulation studies have shown that these factors have different impacts on the retrieval accuracy of the temperature profile. As the increasing of the measurement altitude, the SNR decreases (Fig.4), and the temperature deviation will significantly increase. In addition, the larger the segmented fitting distance, the smaller the retrieval error (Fig.5). Therefore, in order to accurately retrieve the temperature profile, it is crucial to improve the SNR. At the same time, in low SNR situations, the segmented fitting distance can be prolonged to reduce retrieval errors. If the influence of the Doppler broadening effect is neglected during the retrieval process, the temperature retrieval error (Fig.8) may increase significantly (up to 12 K) especially at the altitude with large gradients in aerosol load. Therefore, the influence of the Doppler broadening effect should be carefully considered during the retrieval process for high accuracy retrieval of the temperature profile. When the deviation of specific humidity is less than 0.02, the temperature retrieval deviation will be less than 1 K (Fig.11). Therefore, to accurately retrieve the temperature profile, it is necessary to obtain an accurate specific humidity profile. If the frequency shift and fluctuation of the laser are controlled within 50-100 MHz, the retrieval deviation of temperature profile will be less than 1 K (Fig.15).ConclusionsAccording to the above discussion, the noise (SNR), Doppler broadening of molecular scattering, specific humidity, and laser wavelength stability are important factors affecting the retrieval accuracy of temperature profile. In practical measurements, if the frequency shift and fluctuation of the laser source should be controlled within 50-100 MHz, the corresponding temperature retrieval deviation will be less than 1 K or even negligible. The influence of specific humidity on the retrieved temperature results is relatively small. In actual measurements, by using the specific humidity profile data from radiosondes, the measurement error caused by the uncertainty of specific humidity can be effectively reduced. If the influence of aforementioned factors can be reduced to a negligible level, the noise and the Doppler broadening effect become the main factors influencing the retrieval accuracy of the temperature profile, which should be carefully considered in practical measurements.
Jun. 25, 2025Vol. 54 Issue 6 20240583 (2025)
Zixun WANG, and Bo LIU
ObjectiveSingle-photon lidar is widely used as an active detection technology with high accuracy and high temporal resolution for 3D high-precision imaging in a variety of scenes. However, weak echo scenarios corresponding to limited signal photon counts and low signal-to-noise ratio scenarios corresponding to high background noise counts pose a great challenge to efficiently and accurately solve the depth. For the single-point ranging scenario of single-photon lidar applied to the above challenging scenarios, this paper proposes a convolutional neural network based on a soft-threshold denoising module and a self-attention mechanism.MethodsA convolutional neural network based on a soft-threshold denoising module and a self-attention mechanism is proposed in this paper. The initial feature extraction and data enhancement of the photon sequence histogram data are carried out by the sliding time window module matched with the pulse width of the transmitting laser pulse. And the self-attention mechanism module is introduced to capture the long-range correlation of the photon sequence histogram and to improve the distance solving accuracy and robustness. Then the soft-threshold denoising module is introduced to adaptively generate the threshold value and to filter out the noisy photons, then the echo waveforms of denoised signals are outputted and the depth of the solution is solved. At the same time, this paper uses multi-loss function constraint for network training to focus on the distribution characteristics of the photon sequence histogram and the task demand for a combination of constraints. And we through the ablation experiment to prove its effectiveness. Compared with other histogram techniques, comprehensive experiments on simulated datasets and real datasets show that the proposed model can achieve optimal quantization results, improve the quantization index by at least three times and have better distance resolution performance under different signal-to-noise ratio environments.Results and DiscussionsBased on the comparison of the quantization results of the simulated dataset, the method proposed in this paper is able to identify the signal photon time correlation features and solve the depth with high accuracy and robustness. It can be seen that in the first two signal-to-noise ratio scenarios (2∶10 and 2∶20), removing a small amount of anomalous data, the method proposed in this paper is able to achieve high accuracy and stability with achieving centimeter-level resolution. In the very low signal-to-noise ratio scenario (2∶50), the extractable data features, i.e., the temporal correlation, are affected by a large number of noise photons. The presence of a large number of noise photons gathering anomalously throughout the detection leads to a decrease in the accuracy of the distance solution. Still, the best quantization effect is achieved in the comparison of different methods, which proves the effectiveness and better development prospect of the deep learning method in the weak echo and low signal-to-noise ratio scenarios.ConclusionsFor the single-point ranging scenario of single-photon lidar applied to the above challenging scenarios, this paper proposes a convolutional neural network based on a soft-threshold denoising module and a self-attention mechanism. With modules proposed as sliding time window module, self-attention mechanism module, and soft-threshold denoising module, the proposed network achieve high accuracy and stability with achieving centimeter-level resolution in multiple signal-to-noise ratio scenarios in the comparison of different methods.
Jun. 25, 2025Vol. 54 Issue 6 20240587 (2025)
Xingguo GAO, Doudou YAN, Zengliang CHANG, Chaoshuai YOU, Haojie LAI, Anxiu YANG, Dianpeng SU, and Fanlin YANG
ObjectiveDuring the measurement process of Airborne LiDAR Bathymetry (ALB), there are problems such as difficulties in setting control points and residual calibration errors. At the same time, due to the inconsistent accuracy of underwater measurement points, there is an elevation inconsistency phenomenon between ALB survey strips.MethodFirst, the overlapping area between strips is extracted based on the eight-neighborhood method to limit the point-surface matching range. Then, by constructing a Triangulated Irregular Network (TIN) and matching points of adjacent strips to determine approximate corresponding points, the relationship between strips is established. The Random Sample Consensus (RANSAC) algorithm is used to optimize the matching, a regional network strip adjustment model is constructed, and the optimal transformation matrix of the strips is solved. Finally, a polynomial surface is used to represent the complex terrain, and the correction values of each point are calculated and corrected according to the point-surface matching distance and the least-squares solution of the polynomial coefficients.Results and DiscussionsTo verify the effectiveness of the proposed method, experiments were carried out using data collected by the ALB system Mapper 20KU, and the data accuracy before and after adjustment was evaluated based on land RTK points and shipborne single-beam bathymetry points. After the ALB strip adjustment, the land and underwater measurement deviations decreased by 8.8 cm and 7.5 cm respectively, and the processed data bathymetry accuracy was 24.0 cm.ConclusionsThis paper takes into account the data characteristics of the ALB system and the limitations of measurement operations. Considering that the ALB point cloud data in coastal zones lacks obvious features, and the strip data is approximately planar with sparse point clouds, the eight-neighborhood overlap region extraction method is introduced to improve the data matching efficiency and avoid local optimal solutions caused by iteration. In view of the elevation discrepancies between strips that affect the representation of real terrain data, the regional network adjustment with point-to-surface matching, combined with the RANSAC iterative method, effectively improves the internal consistency accuracy of ALB. To address the uncertainty of external consistency accuracy caused by the lack of control point constraints in regional network adjustment, the intersection area of the adjusted survey lines and inspection lines is used as a control, and the Bursa model is employed for correction. Considering the inconsistent accuracy of ALB point clouds above and below the water, a nonlinear adjustment model is utilized to weaken the distortion within the strips.
Jun. 25, 2025Vol. 54 Issue 6 20240589 (2025)
Heying WANG, Haiyang ZHANG, Changming ZHAO, Lin WANG, and Weichen XU
ObjectiveSolar-pumped laser is a device that directly converts sunlight into laser light, holding promising applications in fields such as space laser communication, space laser wireless energy transmission, chemical energy cycling, and material processing. The structure of a solar-pumped laser is typically divided into three major components: a sunlight concentration device, a pumping cavity, and a laser gain medium. Existing research has made certain advancements in the design methods for the size and pumping structure of the gain medium in solar-pumped lasers. However, the intrinsic correlation between the size of the laser and its laser output power has not yet been fully explored. When designing lasers for specific output power requirements, reliance is often placed on empirically selected sizes, leading to frequent mismatches between laser size and desired output power. For example, lasers may be excessively bulky without a corresponding increase in output power, or they may have moderate sizes but suffer from inefficient performance. Due to the lack of a systematic theoretical framework to guide the size design of lasers in addressing these issues, a model of a solar-pumped laser incorporating Fresnel lenses and a liquid optical waveguide structure is established based on existing research foundations. This model is used to explore the potential correlation mechanism between laser output power and laser size, providing a scientific basis for designing more efficient and compact solar-pumped lasers.MethodsA simulation model for a solar-pumped solid-state laser with a liquid optical waveguide structure, incorporating Fresnel lenses, is constructed, with corresponding materials assigned based on structural characteristics. Simulations are conducted for Fresnel lenses with diameters of 400, 600, 800, 1000, 1200, 1500, 1800 mm by varying their sizes. Optical ray tracing software is utilized to obtain the optimal sizes of the quartz tube and metal conical cavity for each Fresnel lens diameter. Furthermore, the optimal length range of the crystal rod is theoretically calculated using formulas, and the precise optimal length is determined using the laser simulation software ASLD. Finally, based on the obtained optimal sizes of the quartz tube, metal conical cavity, and crystal rod for different Fresnel lens diameters, the theoretical laser output power is calculated using ASLD software.Results and DiscussionsThe solar-pumped laser system is simulated using optical tracing software, yielding fitting curves between the optimal dimensions of the quartz tube, the optimal input aperture of the metal conical cavity, and the diameter of the Fresnel lens (Fig.3). Additionally, the optimal length of the crystal rod as a function of the Fresnel lens diameter is determined using the laser simulation software ASLD (Fig.5). Based on the optimal dimensions of each optical component, further simulations are conducted to obtain the fitting curve between the laser output power and the Fresnel lens diameter (Fig.6). The results show that when the relative aperture of the Fresnel lens is 1, the optimal dimensions of the crystal rod, quartz tube, and metal conical cavity increase as the Fresnel lens diameter increases. This indicates that as the diameter of the lens increases, the optical flux incident on the system is enhanced, necessitating adjustments in the dimensions of the optical components to maintain optimal optical performance. Furthermore, by varying the relative aperture of the Fresnel lenses, simulations are conducted to calculate the relationship between laser output power and Fresnel lens diameter. The results indicated that the laser output power increased with the increase in the relative aperture of the Fresnel lenses (Fig.7).ConclusionsA model of a solar-pumped laser based on Fresnel lenses and a liquid optical waveguide structure is constructed to investigate the relationship between the sizes of quartz tubes, metal conical cavities, crystal rods, and Fresnel lenses. Through simulation calculations using various sizes of Fresnel lenses, a fitting curve is obtained that relates output power to the diameter of the Fresnel lens. When the relative aperture of the Fresnel lens is 1, the optimal sizes of the crystal rod, quartz tube, and metal conical cavity increase with the diameter of the Fresnel lens. Based on these optimal sizes, the simulated laser output power increases with the diameter of the Fresnel lens, exhibiting an upward parabolic trend with an open upper end. This paper theoretically establishes the relationship between the size of the Fresnel lens and the output laser power, providing guidance for the design of solar-pumped lasers.
Jun. 25, 2025Vol. 54 Issue 6 20240608 (2025)
Yuan SUI, Mingheng YUAN, Xiaopeng LIU, Yuan WU, Wen HUANG, Nan LIN, Li ZHONG, Lin LI, Zhenao BAI, and Zhongwei FAN
ObjectiveLaser has good directionality, high brightness, good monochromaticity, and strong coherence, making it significantly advantageous in the field of ranging. Satellite laser ranging (SLR) is the most accurate satellite ranging technology, and the kilohertz picosecond laser is the iconic light source of the fourth-generation satellite laser ranging. In kilohertz picosecond lasers, regenerative amplifiers are commonly used to amplify the mode-locked pulses, typically using Nd:YAG as the gain crystal with a gain bandwidth of 0.15 nm. In addition, the smaller the bandwidth of the narrowband filter used for satellite ranging, the less the influence of ambient light, and the higher the signal-to-noise ratio. The narrowband filter bandwidth used by several observatories we cooperate with is 0.2 nm, so the laser spectrum width needs to be less than 0.2 nm. To match the gain bandwidth of the regenerative amplifier with the bandwidth of the narrowband filter, a requirement of an output spectrum width of 0.15 nm was proposed for the oscillator. Semiconductor saturable absorber mirrors (SESAM) have the advantages of stable performance, simple structure, low mode locking threshold, and the ability to achieve full fiber integration. It has been widely used in mode-locked fiber lasers and has achieved product commercialization. Most commercial applications of picosecond lasers are generated by SESAM passive mode locking technology. SESAM products on the market have low selectivity and the consistency of each batch is poor. There may be unpredictable differences between the physical parameters of SESAM and the design requirements, resulting in uncontrollable oscillator parameters. Therefore, this study improved the passive mode locking model of SESAM to guide the design of oscillator parameters.MethodsBy using the Split-Step Fourier Transform (SSFT) to solve the Ginzburg-Landau equation, a simulation model is established, and SESAM parameter requirements are proposed. The simulation results meet the design requirements (Fig.1) and can achieve dual peak, triple peak, and quad peak mode locking by adjusting the cavity length (Fig.3). When using this model to simulate oscillators with large bandwidth chirped fiber Bragg gratings (CFBG) as output couplers, the results are distorted (Fig.9). The chirp dispersion brought by CFBG was introduced into the Ginzburg-Landau equation.Results and DiscussionsSESAM was prepared by low pressure metal organic compound vapor deposition (LP-MOCVD) method, and its parameters were tested as modulation depth 11.5%, non-saturated loss 7.6%, saturation fluence 39.3 μJ/cm2, relaxation time 5.5 ps, and damage threshold 21.8 mJ. The linear cavity oscillator achieves laser output with an average power of 30.00 mW, a repetition rate of 44.57 MHz, a peak wavelength of 1 064.07 nm, a spectrum width of 0.14 nm and a pulse width of 31.50 ps when injected with a pump power of 150 mW (Fig.6), meeting the design requirements. It can also achieve dual peak, triple peak, and quadruple peak mode locking by adjusting the cavity length. The chirp dispersion brought by CFBG was introduced into the Ginzburg-Landau equation. The improved model was used to guide parameter design and obtain picosecond laser output with an average power of 55.70 mW, repetition rate of 26.32 MHz, peak wavelength of 1030.15 nm, spectrum width of 0.58 nm, and pulse width of 7.62 ps after fiber pre-amplification.ConclusionsIn response to the SLR, we used the SSFT to solve the Ginzburg-Landau equation and established a simulation model and designed a set of SESAM parameters. The parameters of the linear cavity oscillator built on the basis of this SESAM meet the design requirements, and its application in SLR systems will improve the ranging signal-to-noise ratio and achieve better SLR accuracy. To solve the problem of the distortion in the simulation results of oscillators using large bandwidth CFBG as output couplers, the chirp dispersion brought by CFBG was introduced into the Ginzburg-Landau equation. An equation was established to describe the grating reflection spectrum. The improved model was used to guide parameter design, and the experimental results were consistent with the simulation results, verifying the rationality of the simulation model.
Jun. 25, 2025Vol. 54 Issue 6 20250030 (2025)
Xiaosong GUO, Yunlong WAN, Tong YANG, Lei YANG, and Hongbo XIE
ObjectiveOptical imaging technology is widely used in military and civilian fields. With the deepening of application requirements, people hope to achieve more imaging details, larger imaging range, further detection target detection effect. This requires an optical system with higher resolution and wider field. For an imaging optical system, wide field and high resolution are difficult to meet at the same time. In order to obtain a large field imaging, the imaging resolution will be greatly reduced; On the contrary, to achieve a higher imaging resolution, the imaging field can only be reduced. At present, in order to achieve wide-field high-resolution imaging detection, the existing research methods are non-single aperture, non-single detector imaging, which is complex in structure, large in volume, and requires post-image processing and stitching, and it is also difficult to achieve real-time detection. However, the traditional single-aperture and single-detector optical imaging system is limited by the optical system aperture size, off-axis aberration and other factors. So it is difficult to meet the requirements of large field and high resolution detection. The wide field means that the optical system has a larger off-axis aberration, and the optical aberrations have a direct effect on the imaging resolution.MethodsTo solve the problem, a new method for constructing wide-field high-resolution systems is proposed. In the initial stage of design, the inverse telephoto structure is used as the starting point. The front and rear lenses of the structure are complicated and replaced with lens groups respectively to bear different aberrations. By tracing the main ray and the edge ray, the Seidel aberration expression of the system can be obtained. Seidel aberration is a function of the radius of curvature, lens spacing, air spacing and refractive index of the system. When the function is solved, some specific constraints are added to make the initial structure adapt to improve the resolution in the subsequent optimization process. The specific constraint is to control the angle of incident light at the stop, so that the angle difference of different aperture light in each field is less than a certain range. In addition, the constraints of the system itself should also be taken into account, and the optimal solution of the function under the corresponding constraints is finally obtained, which is the initial structure of the optical system. To improve the resolution, the initial structure was further optimized. The Seidel aberration of the initial structure has been corrected and balanced, but there is still a large residual wave aberration, and the MTF curve cannot approach the diffraction limit in the middle and high frequency band, in which the high-order aberration is the main influencing factor. The wave aberration of the system can be decomposed by Zernike polynomial, and the constraint conditions are set up to correct the specific order aberration, so that the PSF can be distributed centrally and the MTF can be improved.Results and DiscussionsAfter design, an optical system structure composed of 9 lenses is proposed. In the process of optimization, two kinds of high order aberration constraints are added to the original first order aberration optimization function based on high order spherical aberration and high order astigmatism. With the increase of the number of iteration optimization, the optimization function gradually becomes stable. After optimization, the absolute value of aberration decreases greatly, which realizes the purpose of controlling the balance of high order aberration. The final system field angle is 70 degrees, and the MTF curves are close to the diffraction limit, and better than 0.2 at 550 lp/mm, indicating that the system has high resolution and good imaging effect. The focal length of the system is 24.04 mm, the total length of the system is 208.8 mm, the diameter of the entrance pupil is 12.02 mm, the maximum optical diameter D=37.04 mm, and the system contains four high-order even aspheres.ConclusionsAberrations are the main factors affecting imaging resolution, so the study of aberration is the key to achieve high resolution with wide field. Based on Seidel's aberration theory and by controlling the angle of the diaphragm, an initial structure design of wide-field high-resolution imaging optical system is proposed. On this basis, a high order aberration correction algorithm based on Zernick polynomials is proposed. Through the constraint correction of some high order aberrations, the optimal path to improve the resolution is quickly found, and the high resolution imaging design of wide-field optical systems is realized. The method effectively solves the problem of low imaging resolution and difficult optimization design of wide-field optical system, and has certain reference value for wide-field optical system design. However, the method only considers some high-order aberrations, and the decomposition of aberrations is not complete. Therefore, further research is still necessary.
Jun. 25, 2025Vol. 54 Issue 6 20240524 (2025)
Jingsong QIN, Guodong ZHU, Mingyou GAO, Zhimin ZHANG, and Weiguo ZHANG
ObjectiveThe laser beam splitter is capable of dividing a laser beam into multiple beams with controllable energy and direction, thereby significantly enhancing the efficiency and flexibility of optical systems. It finds extensive applications in various fields such as laser communication, laser processing, laser scanning, and medical treatment. The existing types of laser beam splitters primarily include Diffractive Optical Element (DOE) beam splitter, microlens array beam splitter, and free-form lens beam splitter. While these can be applied to different scenarios for beam splitting purposes, they do have certain limitations in terms of processing tolerance and working distance. Therefore, we propose a design method for a microprism array-based laser beam splitter that offers a novel approach towards developing long-distance beam splitters with arbitrary energy distribution.MethodsThis paper proposes a laser beam splitter based on a microprism array, investigates the design principle of the beam splitter, establishes a functional relationship model between the structural parameters and optical properties of the microprism unit, develops an algorithm for designing the microprism, and analyzes fabrication and detection schemes for microprism arrays with different structural characteristics. Using a 1×3 microprism array beam splitter with an interval angle of 0.15° and an energy distribution ratio of 0.365∶0.225∶0.365 as an example, we conducted modeling and geometric ray tracing simulations for the beam splitter, designed its target structure using lithography to achieve precise fabrication, built a test light path, and used spot image processing algorithms to characterize its optical performance. Result and Discussions The output light spot of the 1×3 beam splitter is shown in Fig.15(b), where the energy utilization rate exceeds 91%. The energy utilization rate can be effectively improved by further optimizing and developing the preparation process and reducing the occlusion of invalid areas. Due to the alignment error in the experiment, there is an energy distribution error of less than 6%, which can be alleviated by using a high-precision alignment device for assembly. The deflection Angle error is less than 0.04%, which can be optimized by improving the hardware facilities. The spot shape exhibits excellent consistency in long-distance application scenarios where the light source can be considered a point light source. Overall, laser beam splitters based on microprism arrays exhibit exceptional performance in achieving high energy utilization and arbitrary distribution of sub-spots.ConclusionsThe design methodology of the microprism array laser beam splitter proposed in this paper primarily focuses on solving the incident energy distribution and microprism array parameters. By analyzing various existing micro and nano processing technologies, we propose optimization and selection methods for micro-prism structures with different parameters. We conducted a design and fabrication experiment on a 1×3 array beam splitter. The performance of the microprism beam splitter was evaluated through microstructure characterization and optical testing. The results demonstrate that the prepared beam splitter achieves an energy efficiency of approximately 91%, with a spot energy distribution error below 6% and deflection angle error less than 0.4%. Compared to diffraction-based beam splitters (DOE), the beam splitter exhibits significantly improved energy efficiency and uniformity.
Jun. 25, 2025Vol. 54 Issue 6 20240557 (2025)
He HUANG, Binzhi ZHANG, Yinghuai ZHANG, Xin LI, and Zhong ZHENG
ObjectiveIn the precision manufacturing industry, the measurement of the thickness and tolerance of small parts is a crucial step. Common measurement methods mainly include contact and non-contact schemes. Contact measurement may cause damage to the measured parts due to contact with the surface, and the contact area can generate stress on the measured parts, potentially causing minor displacements that lead to inaccurate measurement results. Non-contact measurement offers the advantages of not needing to touch the measured parts, fast measurement speed, and flexible integration. Recent advancements in optical technologies have further enhanced the precision and reliability of non-contact methods, making them increasingly viable for industrial applications. Spectral confocal measurement systems are one type of non-contact measurement; therefore, designing a compact, high-precision, low-cost spectral confocal system is essential.MethodsBy analyzing the components of spectral confocal systems, it was determined that the system to be designed mainly consists of two parts: the dispersive objective lens and the spectrometer, with defined design specifications. The complex and cumbersome entire spectral confocal system was divided into three subsystems using the concept of modular design. This approach not only simplifies manufacturing and assembly but also improves system maintainability and scalability.Results and DiscussionsA hybrid diffractive/refractive spectral confocal system with a wavelength range of 400-800 nm based on APC (Angled Physical Contact) port type Y-fibers was designed, with a working distance of 10 mm and a working range of 2.1 mm. The design of each subsystem reaches or approaches the diffraction limit, and the lens shapes and tolerances are in line with manufacturing processes. The theoretical measurement resolution of the entire system is 350 nm.ConclusionsDesigned a hybrid diffractive/refractive spectral confocal measurement system with a working distance of 10 mm and a working range of 2.1 mm. Compared to other confocal spectral measurement systems, this design utilizes the concept of modular design to modularize the complex and cumbersome entire ranging system. Furthermore, the hybrid diffractive refractive design effectively corrects chromatic aberrations while maintaining a compact structure, making it suitable for integration into automated production lines. The dispersive objective lens and the spectrometer share the same collimation module, which can be installed in conjunction with other modules, and the structure is unified. Future work will focus on experimental validation and further optimization for industrial deployment. In the optical system design, each system has good manufacturability and the relative cost of lens materials is low. Third-order and linear polynomials were used to fit the chromatic focal shift curves and position curves of the dispersive objective lens and the spectrometer, with minimum residual coefficients of 0.9996 and 0.9999.
Jun. 25, 2025Vol. 54 Issue 6 20240588 (2025)
Hanyang XIE, Yan AN, Wenbin XU, Jiaxuan LIU, Xinhang LI, Lei ZHANG, Yansong SONG, and Keyan DONG
ObjectiveWith the advancement of technology and the upgrading of information-based equipment, laser target imaging echo simulators have become essential tools for simulating target characteristics in complex scenarios and evaluating system performance. These simulators provide high-precision echo characteristic reconstruction, offering reliable data support for the testing and optimization of information-based equipment. The accuracy of echo signals and the ability to acquire depth information directly influence the simulator’s capability to replicate real-world scenarios, thereby determining its effectiveness in supporting key technologies such as target recognition, tracking, and ranging. However, traditional target simulators, constrained by single-light-source imaging methods, struggle to effectively obtain target depth information, resulting in insufficient simulation accuracy in complex scenarios and limiting the accurate representation of target spatial structure characteristics. To address these limitations, a novel optical system for a laser target imaging echo simulator is proposed.MethodsA laser target imaging echo simulator optical system with a wavelength of 1064 nm has been designed to achieve precise simulation of dynamic target scenes. The system utilizes a high-uniformity 3×5 fiber array illumination scheme (Fig.9). It also integrates silicon-based liquid crystal and a relay system to construct a regionalized multi-wavefront superimposition imaging technique (Fig.12). Additionally, the projection system features a dual field-of-view optical system, allowing flexible switching between 2° and 3° field of view angles (Fig.15). Based on this, the stray light characteristics and energy uniformity of the optical system are analyzed, and potential accuracy and imaging errors between the theoretical design and actual processing of the optical system are evaluated to ensure the system’s imaging quality and stability.Results and DiscussionsThe illumination system can accommodate up to 15 channels, with each channel achieving a uniformity greater than 91% (Fig.10). The radius of the diffraction spot for each subchannel of the relay system is smaller than the Airy disk radius, while the optical system exhibits a distortion value of 0.7112% and a field curvature of <0.1 mm (Fig.13-Fig.14). The Modulation Transfer Function (MTF) exceeds 0.4 at 26 lp/mm, and the energy concentration in the imaging optical system is high, with S.D≥0.9 (Fig.17-Fig.18). The polarization filter and stray light elimination stop reduce the system's stray light to 0.3%, improving suppression by a factor of 10.56 (Fig.23). The average energy uniformity at the system exit pupil remains consistent with the illumination system (Tab.5). Combining the tolerance analysis results, the system offers high imaging quality and good stability (Tab.8).ConclusionsThe study provides a detailed description of an optical system for a laser target imaging echo simulator. Comprehensive analysis shows that the system features high illumination uniformity and excellent imaging quality, with the diffraction spot radius smaller than the Airy disk radius, approaching the diffraction limit. Additionally, the optical system exhibits low distortion and minimal field curvature. The projection system adopts a dual field-of-view optical system, ensuring adaptability to the aperture requirements of various devices under test. The system's tolerance distribution is well-balanced, meeting current manufacturing precision requirements and offering good assembly tolerance. The designed optical system delivers high-quality target image information, providing essential design guidance for accurately simulating training scenarios and target signals.
Jun. 25, 2025Vol. 54 Issue 6 20240591 (2025)
Xiangxiang MENG, Chengyuan JIA, Mingjie QIU, and Zhanxin LI
ObjectiveFluorescence laparoscopy is an important and indispensable instrument in minimally invasive surgery, combining traditional laparoscopy and fluorescence imaging technology, which is inserted into the abdominal cavity through a small incision to provide real-time, high-precision images for surgery, and especially has significant advantages in tumour detection and precise localisation. 5 mm laparoscopes are widely used in a variety of surgical scenarios due to their thin rods and small footprint, however, their small aperture leads to However, its small aperture results in less fluorescence flux received, limiting its ability in deep lesion detection. In recent years, NIR-Ⅱ fluorescence imaging has been widely investigated due to its higher sensitivity and enhanced deep penetration ability, but most of the existing fluorescence laparoscopy systems are only applied in the visible and NIR-Ⅰ bands, and have not yet taken full advantage of the potential of the NIR-Ⅱ band in deep tissue imaging. In order to enhance the capability of 5 mm fluorescence laparoscopy in lesion detection, designs a visible/NIR-Ⅰ/NIR-Ⅱ tri-band composite 5 mm fluorescence laparoscopy system to improve its detection accuracy and sensitivity of lesions by multi-band imaging.MethodsTo design a complete three-band fluorescence laparoscopy optical system, the system is divided into two parts, the optical observation lens and the camera adapter, and the two parts are optimised and designed independently. The optical viewer consists of an objective lens, a relay lens group and an eyepiece. The objective lens and relay lens group were first optimized separately before undergoing integrated optimization, while the eyepiece was designed independently to achieve confocal imaging across three bands: visible, NIR-Ⅰ and NIR-Ⅱ (Fig.6). The camera adapter section was divided into two optical paths, which were similarly optimised to ensure that the size of the three bands imaging was the same (Fig.7). Finally, the optical viewer and camera adapter were combined by pupil docking to complete the overall laparoscopic system design (Fig.8). The ability of this laparoscope to detect tumour foci in the tissue body in NIR-Ⅰ and NIR-Ⅱ bands was also simulated and analysed using TracePro software.Results and DiscussionsThe designed laparoscope system has an entrance pupil diameter of 0.3 mm, a field of view of 80°, and a working distance of 300 mm. In the full-field range of all three bands, the system's root mean square radius is smaller than the Airy disk radius, and the energy is completely distributed within the Airy disk radius. Meanwhile, in the field of view of each band, the MTF values are close to the diffraction limit, and the maximum distortion is less than 20.13% (Fig.9). The optical system designed exhibits excellent image quality, meeting both design and usage requirements. TracePro software was used to simulate the laparoscope's ability to detect tumor lesions in the NIR-Ⅰ and NIR-Ⅱ bands. When 2 W total power, 45° emission half-angle, and 808 nm wavelength incident light were used to excite a tumor with a 0.5 mm radius located 4 mm deep in the tissue, the detection signal-to-noise ratio in the NIR-Ⅰ band was 3.14 dB. In the NIR-Ⅱ band, at a cooling temperature of -20 ℃, the SNR was 5.52 dB, and at -80 ℃, the SNR was 6.95 dB (Tab.6). Similarly, when the tumor with a 7 mm radius was located 8.8 mm deep in the tissue, the detection SNR in the NIR-Ⅰ band was 1.78 dB. In the NIR-Ⅱ band, at a cooling temperature of -20 ℃, the SNR was 4.94 dB, and at -80 ℃, the SNR was 6.87 dB (Tab.7).ConclusionsA 5 mm fluorescence laparoscope with visible/NIR-Ⅰ/NIR-Ⅱ composite imaging was designed. Simulation analysis shows that the NIR-Ⅱ band has a higher signal-to-noise ratio compared with the NIR-Ⅰ band at the same tissue depth, which can effectively detect deeper tumours and improve the sensitivity and accuracy of tumour detection. Multi-band imaging technology enables laparoscopy to show higher flexibility and accuracy in complex tissue environments, which can meet the needs of deeper tumour detection and can enhance the detection performance of 5 mm laparoscopy for tumour lesions.
Jun. 25, 2025Vol. 54 Issue 6 20250090 (2025)
Liping LAI, Wenfa WANG, and Zhiming CHEN
ObjectiveIn recent years, 3D display technology has developed rapidly and has been widely applied in fields such as science and technology, education, medicine, military, and entertainment. Currently, most of 3D displays need to wear special glasses for the 3D effect which would cause visual fatigue with long-term use. Therefore, the main direction development of 3D display technology is free stereoscopic display technology which users can see the stereoscopic effect without wearing 3D glasses. Currently, the main naked-eye 3D display methods include: parallax stereoscopy, volumetric stereoscopy, integral imaging display technology, and holographic stereoscopy. The principle of parallax stereoscopy is that the light modulated by optical devices which allows the user's left and right eyes to see two images with parallax and the three-dimensional fusion produces a sense of space and hierarchy to realize the 3D effect. Because the parallax stereoscopy can be laminated with the existing 2D screens with low cost, and can provide better brightness and higher resolution so it is widely used in the field of 3D. At present, the technology of parallax stereoscopy to realize 3D display is mainly cylindrical lens which uses the principle of spectroscopic and refraction of cylindrical lens, so that the light rays of each pixel through the display only enter the left eye and the right eye respectively, so people can see different pictures. However, the cylindrical lens technology still has some drawbacks, such as low brightness uniformity, high crosstalk, low light efficiency, short viewing distance, and the manufacturing is difficulty.MethodsBased on the principle of naked eye 3D display and the Fresnel optical theory, this paper designs a Fresnel lens array structure and the star-shaped switch of unit liquid crystal display screen to achieve a four-view naked-eye autostereoscopic 3D display with low-crosstalk and high brightness uniformity (Fig.2). The thickness $ l $ of the Fresnel lens array influences the light intensity distribution curve and the crosstalk (Fig.7). And the structure of the star-shaped switch is designed to reduce the central light intensity of the beam to achieve uniform light intensity distribution, so the center height $ a $ and the center length $ b $ of star-shaped switch also influence the light intensity distribution curve and the crosstalk (Fig.9-Fig.10).Results and DiscussionsFirstly, we simulate and optimize the influence of the thickness $ l $ the Fresnel lens array on crosstalk and the light intensity distribution curve, the simulation results are shown in Fig.7-Fig.8. From the figure, we can see that as the thickness $ l $ increases, the width corresponding to a central light intensity of 0.9 at the viewpoint gradually widens, and the overlapping part between viewpoints becomes smaller. When $ l = 2.772\;{\text{mm}} $, the crosstalk is small. As $ l $ continued to increase, the crosstalk and the width corresponding to the center light intensity of 0.9 at the viewpoint remained essentially unchanged. Therefore $ l = 2.772\;{\text{mm}} $. Then we simulate and optimize the influence of the center height $ a $ and the center length $ b $ which influence the light intensity distribution curve and the crosstalk. As $ a $ decreases, the central light intensity distribution at each viewpoint tends to be flat-topped, and the 0.9 width of light intensity increases (Fig.9). And as $ b $ decreases, the 0.9 width of light intensity decreases and 91% of the viewing area has a crosstalk degree of less than 0.5%. Therefore, when $ a=0.03\;{\text{mm}}$, $ b = 0.04\;{\text{mm}} $, the crosstalk of the star-shaped switch is relatively low.ConclusionsThe unit parameters of a 55 in 4K model autostereoscopic 3D displayer are provided and they are optimized by TracePro software. The results show that when the pitch of the Fresnel lens on the exit surface is 0.304 mm, the width of each serration of Fresnel lens is 0.0234 mm, the length of the Fresnel lens is 2.772 mm, and the center height of star-shaped LCD switch is 0.03 mm, center length is 0.04 mm, the width of the star-shaped LCD switch is 0.05 mm, the crosstalk is almost zero on the receiving surface range of 2.5 m, and the problem on the brightness of the image in different positions in improved. In addition, the structure of the Fresnel lens array and the star-shaped LCD switch is simple and easy to manufacture which has significant for achieving a better 3D effect of the naked-eye 3D display.
Jun. 25, 2025Vol. 54 Issue 6 20250098 (2025)
Shen WANG, Yun CAO, and Lisong YAN
ObjectiveAs the core component of high-performance space cameras, off-axis mirrors can be used to realize the design of space cameras with large fields of view and long focal lengths. The high-precision surface map is the guarantee of high-quality imaging of space cameras. In order to solve the high-precision surface map testing of off-axis aspheric mirrors and ensure the imaging effect of space remote sensing cameras, a high-precision surface map testing method for off-axis aspheric mirrors is established based on computer generated hologram optical components, and the high-precision testing of off-axis aspheric mirrors is realized. This provides the necessary conditions for the fabrication of ultra-precision optical systems.MethodsIn order to improve the utilization of light energy and improve the detection accuracy, the off-axis aspheric surface was moved to the axis by adding translation and tilt to carry out the null compensation design. This method can avoid the compensation design of the coaxial parent mirror corresponding to the entire off-axis aspheric surface, so as to greatly improve the energy utilization. The spatial position of the mirror to be measured can be determined by designing the reference spot, the interference testing of the mirror to be measured can be realized with high precision through aberration adjustment, and the interference diffraction order can be effectively separated by using the carrier frequency, so as to achieve high-precision measurement of the mirror surface to be measured.Results and DiscussionsNull compensation design is performed by adding translation and tilt to move the off-axis aspheric surface onto the axis. It avoids the compensation design of the whole coaxial mirror corresponding to the entire off-axis aspheric surface, thus greatly improving the energy utilization. The relevant design results are shown in Figure 3-Figure 8. The author conducted a detailed analysis of the optical path structure, including the spatial relative positions of the interferometer, the CGH, and the off-axis aspheric mirror. To properly position the aforementioned optical components, auxiliary zones were designed to achieve precise alignment among them. The fitting residual of the main zone is zero, indicating that the design accuracy meets the requirements of the test results. The fringe density in the main zone does not exceed 137 lp/mm, with a periodic spacing of no more than 7.3 μm, which meets the fabrication capability of laser direct writing systems and enables high-quality patterning of CGH fringes. The alignment zone pattern was designed using the +3rd diffraction order, featuring an annular fringe configuration. With a fringe density not exceeding 251 lp/mm and a periodic spacing no greater than 3.98 μm, this design remains compatible with laser direct writing systems for high-precision fabrication. Additionally, during testing, the diffraction spots of various orders can be fully separated. This effectively prevents light from other diffraction orders from interfering with the measurement results as stray light during testing.ConclusionsA high-precision surface map testing method for off-axis aspheric mirrors are proposed based on computer generated hologram optical elements. By adding translation and tilt to move the off-axis aspheric surface to the axis for null compensation design, this method effectively avoids the null compensation design of the whole coaxial mirror corresponding to the entire off-axis aspheric surface, so as to greatly improve the energy utilization rate of the system. Combined with engineering examples, it analyzes in detail how to consider the precise alignment of each optical element, how to effectively separate each diffraction order in the design of the main region, and how to design the fringe density of each region in combination with the actual manufacturing level when using the design method for off-axis aspheric compensation design. From the design results, it can be seen that based on the method, the null compensation design for off-axis aspheric surface can be effectively realized, and the establishment of this method will provide some technical support for the manufacturing and testing of high-precision optical systems.
Jun. 25, 2025Vol. 54 Issue 6 20250156 (2025)
Jinheng JING, Xiangbin LING, Yuhao XIONG, Wenyuan QI, and Jian LI
To address the problem of inadequate background motion compensation in complex scenarios for infrared images, this paper introduces a novel image registration algorithm using the LGB (Location-Gray-BEBLID) descriptor. Initially, a quadtree algorithm is applied to remove excessive feature points, efficiently managing the issue of overcrowded feature points. The proposed LGB descriptor combines feature point location and grayscale data, significantly improving the precision of feature point matching. Next, a block matching technique is utilized for initial feature point matching, followed by a refinement process to enhance the matching outcomes. Ultimately, the background motion is calculated using the matched feature points, enabling effective compensation. Experimental findings demonstrate that this algorithm surpasses existing methods in compensation performance on various test image sequences, with exceptional real-time capabilities, reducing processing time by around 59% compared to the traditional ORB algorithm. This advancement in background motion compensation is a significant step towards enhancing infrared dim target detection.ObjectiveBackground motion compensation is a crucial technique in the processing of infrared images with complex backgrounds, offering significant practical value. In certain intricate infrared scenes, targets are small, have low energy, and are often heavily obscured by background clutter. Traditional spatial domain infrared small target detection algorithms, such as the Top-Hat algorithm and the MPCM (Multiscale Patch-based Contrast Measure) algorithm, tend to perform inadequately in these challenging conditions. Background motion compensation effectively mitigates these algorithms’ shortcomings when handling complex background images. This compensation is usually achieved by calculating the parameters of the background motion. By differencing the current frame image with the previous frame image after applying background motion compensation, the interference from the background can be significantly reduced, thereby improving the conditions for detecting infrared dim targets. Among various background motion compensation techniques, methods based on image registration are widely used due to their high accuracy.MethodsThe core steps of image registration include feature point detection and feature point descriptor generation. This paper introduces an innovative image registration method based on LGB descriptors for effective background motion compensation (Fig.1). To address the issue of redundant feature points, a quadtree algorithm is utilized (Fig.3). The LGB (Location-Gray-BEBLID) descriptor is introduced for the first time, enhancing the BEBLID descriptor by incorporating both the position and grayscale information of feature points, thereby significantly improving the precision and discriminability of feature point matching (Fig.4). During the feature point matching phase, a block matching strategy is implemented. This strategy constructs a hash function to map the coordinates of feature points in different regions to distinct key values, limiting the matching process to feature points with the same key values. This approach effectively reduces the search range and time required for matching (Fig.8). The Random Sample Consensus (RANSAC) algorithm is then employed to refine and optimize the matching results. By calculating background motion parameters from the feature point coordinate information, the algorithm successfully achieves background motion compensation.Results and DiscussionsFig. 13 analyzes the efficiency of different matching strategies. Points near the upper left indicate shorter processing times and higher correct matching rates, indicating better performance. Dividing the image into 2×2 blocks strikes the best balance between performance and efficiency. Tab. 4 compares OLE, NFAM, and correct matching rates of various algorithms, with optimal results in bold. The proposed algorithm shows a higher average correct matching rate, indicating richer information from correct feature point pairs in Equation (9), leading to more accurate parameters and better background motion compensation. The Ours* algorithm outperforms others in OLE, NFAM, and correct matching rate, suggesting the proposed descriptor is more effective in capturing feature point characteristics, resulting in more precise matching and superior background motion compensation compared to other descriptors. The comparison between the ORB and BRIEF algorithms demonstrates the effectiveness of the quadtree algorithm.Tab.5 details time consumption, where the proposed quadtree algorithm significantly reduces feature detection time. The proposed descriptor generation is the quickest, 38% faster than BEBLID, due to its efficient location and grayscale computation. The proposed block matching reduces matching time by 58% versus point-by-point methods. The proposed algorithm is the most time-efficient, reducing total time by 43% compared to BEBLID and 59% compared to ORB.ConclusionsTo address the challenge of inadequate background motion compensation in complex infrared scenes, this paper introduces a novel image registration method based on LGB descriptors. Initially, the algorithm employs a quadtree technique to optimize the distribution of feature points, mitigating the issue of redundancy. Building upon the BEBLID descriptor, the LGB descriptor is proposed, incorporating both the position and grayscale information of feature points. This enhancement significantly improves the precision and discriminability of feature point matching. Then the matching time is reduced by the proposed block matching strategy. The RANSAC algorithm is then utilized to refine and enhance the matching results. By calculating background motion parameters from the feature point information, effective background motion compensation is achieved, thereby eliminating background interference. Experimental results demonstrate that this algorithm excels in background motion compensation for complex infrared images, outperforming other methods in terms of the OLE, NFAM and correct matching rate metrics. The time efficiency of generating descriptors is impressive, showing a reduction of approximately 38% compared to the BEBLID algorithm. Moreover, the proposed algorithm reduces matching time by approximately 58% compared to point-by-point matching.The total processing time of our algorithm is about 59% less than that of the ORB algorithm. This method not only improves the effectiveness of background motion compensation in complex infrared scenes but also enhances its efficiency, paving the way for more effective infrared dim target detection.
Jun. 25, 2025Vol. 54 Issue 6 20240478 (2025)
Guangpan HUANG, Linxuan ZHANG, Feng REN, Qingsong ZENG, and Rui ZENG
ObjectiveImage alignment technology can combine the advantages of infrared and visible light images to provide a strong basis for condition assessment and fault location of low-voltage electrical equipment. Aiming at the alignment of infrared and visible images of low-voltage electrical equipment, due to the existence of a single responsive mapping relationship between the two images and the large difference in their spectral characteristics, the infrared image shows a weak contour, low texture, poor resolution caused by the poor alignment effect, low correctness, etc., a homography estimation model based on the dual backbone network is proposed.MethodsFirstly, the binocular camera composed of infrared thermal imager and visible light camera captures the different feature information presented in the infrared and visible light images of low-voltage electrical equipment under the operating state using the corresponding backbone network for feature information extraction; Secondly, the self-attention and cross-attention structures consisting of efficiently aggregated linear transformers enhance the expressiveness of the feature descriptors extracted from the network backbone, emphasising the ability of the feature descriptors within the feature map to focus on the global feature information and the descriptors in the infrared feature map to focus on the feature information in the visible light feature map; Then, the full connectivity layer is used to form the homography estimation model to estimate the 8-degrees-of-freedom information of the homography matrix and the 9-degrees-of-freedom information of the homography inverse matrix for evaluation; Then, the supervised learning model is constructed using the results of the homography evaluation matrix and reversibility constraints; Finally, the image matching information is calculated based on the homography evaluation matrix to complete the multi-source image alignment.Results and Discussion In order to verify the effectiveness of the designed supervised homography estimation model, this paper has conducted comparative experiments on the dual backbone network, the feature aggregation module and the loss function of the evaluation model for verification. Through a large number of experiments, in the process of extracting features from the backbone network, using the global average pooling layer to weight the feature channels cannot better reflect the feature distribution among the feature layers. In this regard, this paper introduces the concept of standard deviation pooling layer based on global average pooling, and uses the combination of global average pooling layer and standard deviation pooling layer to weight the channel information for aggregation. The experimental data show that the number of parameters and the inference time are increased by using the channel aggregation method that combines the global average pooling layer and the standard deviation pooling layer, but there are different degrees of changes in the two indicators of RMSE and CMR, which makes the image alignment effect more accurate, and the correct matching rate is improved by 16.4% and 17.5%. The designed VSNet and IRNet network backbone can effectively extract the feature information of low-voltage electrical equipment in visible light images and infrared images. The self-attention and cross-attention structure composed of efficiently aggregated linear transformers reduces the RMSE after matching by a maximum of 0.697 and a minimum of 0.357, and the CMR increases by a maximum of 2.4% and a minimum of 0.4%, compared to the self-attention and cross-attention structure composed of transformers and linear transformers, and the inference speed decreased by 12 ms. Compared with the loss function constructed without reversibility constraints, the RMSE after matching is reduced by a maximum of 1.107 and a minimum of 0.734, and the CMR of alignment is increased by a maximum of 3.2% and a minimum of 2.3%. The homography estimation model for dual backbone network has a relatively low RMSE of 7.895 after matching and a correct matching rate of 91.8%.ConclusionsThe supervised dual backbone network homography estimation model designed in this paper can effectively complete the image alignment of infrared and visible light of low-voltage electrical equipment. Through a series of experiments, the following conclusions can be drawn: 1) The dual backbone feature extraction network designed for the image features and information content of infrared and visible light can effectively extract the feature information in heterogeneous images, and compared with the single backbone homography estimation model, the proposed model in this paper has a good matching effect, and the RMSE and CMR are at the best performance value. 2) The introduction of reversibility constraint matrix in the homography estimation model for dual backbone networks improves the accuracy of the assessment model, with a decrease of 0.734 in RMSE and an improvement of 3.2% in CMR. 3) Compared with the eight matching methods of SIFT, SURF, ORB, LightGlue, SuperGlue, SuperPoint, Loftr, and DeephomoGraphy, the designed dual-trunk homography estimation model is able to effectively deal with the characteristic cases of weak contour and low texture in the infrared diagrams of low-voltage electrical equipment, and the RMSE values are maximum 10.557, 1.848, and 8.8% increase in CMR. 4) The homography estimation model developed takes 0.14 seconds to reason about a pair of multi-source images, which meets the requirements of real-time evaluation and matching, and provides favourable support for subsequent fault diagnosis and localisation of low-voltage electrical equipment.
Jun. 25, 2025Vol. 54 Issue 6 20240528 (2025)
Dongyang SHI, Sheng HUANG, Liu YANG, and Liujiang GUO
ObjectiveHaze is a complex atmospheric phenomenon formed by the combined effects of fog and haze that widely affects the environment, health, and economy in many parts of the world. Haze can reduce image contrast and blur details, affecting the visual effect. The existence of haze also seriously impacts our production and life. For vision-based intelligent machines, haze seriously reduces the quality of images captured by vision-based intelligent devices, affecting the next step of image processing and analysis. Image defogging is divided into defogging algorithms based on image enhancement, defogging methods based on image restoration, and defogging methods based on deep learning. The above three defogging methods have corresponding advantages and disadvantages, but the defogging effect in the bright region of the image and the model's anti-noise performance is not ideal. To ensure that the defogging model has a good defogging effect in the bright region, and at the same time has a good anti-noise performance, this paper designs an image defogging algorithm based on the transmittance multi-guidance and sharpening compensation (Fig.1).MethodsThe image defogging algorithm based on transmittance multi-guidance and sharpening compensation firstly applies the method of threshold segmentation to solve the atmospheric light value, which not only sets zero the pure white pixel points in the original and dark channel images but also defines the segmentation of the white region in the original image, which solves the problem that the atmospheric light value takes the value of the bright region such as white in the original image (Fig.2); Secondly, to ensure that the proposed model can effectively deal with different areas in the image, a multiple bootstrap method is designed for transmittance taking, which converts the distortion problem of bright regions into a transmittance taking error reduction problem. In addition, Gaussian filtering is introduced into the three-channel image for noise reduction, which realizes the defogging and improves the noise resistance of the model; Finally, image sharpening is used to enhance the defogging results to improve the model's ability to recover the details at the edges. The brightness is adjusted by setting the target to complete the depth compensation of the current brightness to the target brightness, to achieve the joint optimization of the edge details of the image after defogging and the visualization effect.Results and DiscussionsThe SOTS dataset is firstly investigated to calculate the magnitude of the mean transmittance of bright and non-bright regions to determine the transmittance multiple bootstrap parameters (Tab.1). To verify the de-fogging effect and generalization performance of the proposed model, this paper applies the proposed algorithm and the mainstream de-fogging algorithms to conduct comparative experiments on the thin fog, medium fog, dense fog, and real haze datasets, respectively. From the experimental results under the foggy dataset, it can be seen that the results processed by the DTGSC algorithm obtain the most excellent defogging performance on the foggy dataset, and the average value of the image SSIM reaches 91.99%. It shows that the de-fogged image obtained by using the proposed model is the closest to the original image with the lowest distortion, and verifies the effectiveness of the proposed algorithm (Fig.3, Tab.2); As can be seen from the experimental results of the ablation of image sharpening and luminance compensation (Fig.4-Fig.5, Tab.3-Tab.4), after image sharpening and luminance compensation, the overall performance of the image after defogging is enhanced, which helps improve the defogging effect; as can be seen from the experimental results in a medium haze scene, the overall defogging effect obtained by the DTGSC algorithm is better in medium haze scenes (Fig.6, Tab.5), but there is some room for improvement in the image edge detail recovery, there is some room for improvement. The average SSIM value of the image obtained by the DTGSC algorithm reaches 89.80%, which has an obvious advantage over other mainstream defogging algorithms, indicating that the resultant image obtained by applying the proposed defogging algorithm has a higher degree of similarity with the original image; from the experimental results in the foggy scenario, it can be seen that the average value of the performance obtained by applying the DTGSC algorithm is still on a relatively high trend (Fig.7, Tab.6). The average PSNR performance obtained in the fog scene is 38.89 dB, and the average image SSIM performance reaches 86.29%, which also has obvious advantages over other defogging algorithms; from the experimental results under the real foggy dataset, it can be seen that the average value of the image PSNR obtained by using the DTGSC algorithm is 38.94 dB, and the average value of the image SSIM is 83.25%. 83.25%, the above results fully verify the effectiveness of the proposed defogging method (Fig.8, Tab.7). From the defogging efficiency, it is known that the DTGSC algorithm has good defogging efficiency (Tab.8).ConclusionsThe DTGSC algorithm obtains an average image MSE value of 11.07, an average PSNR value of 39.78 dB, an average SSIM value of 87.83% under the four datasets, and an average de-fogging time on the thin fog dataset of 0.63 s. Relative to the DCMPNet algorithm, the average MSE value is scaled down by 20.54 dB, the average PSNR value is improved by 5.57 dB, the SSIM value is improved by 2.52% on average, and the de-fogging efficiency is improved by 0.08s on average. The above experimental results illustrate that the DTGSC algorithm has good performance under all three foggy datasets, verifying the effectiveness and superiority of the proposed algorithm.
Jun. 25, 2025Vol. 54 Issue 6 20240600 (2025)
Jianhua SHANG, Gang WANG, Yang LIU, Haiqin XU, and Jiatong SUN
ObjectiveFringe Projection Profilometry (FPP) is a three-dimensional imaging technique based on phase demodulation algorithms. Its non-contact nature, high precision, and low cost make it highly valuable and promising for applications in precision measurement fields such as biological imaging, robotic vision, and industrial scenario. This technology utilizes a digital projector to project multiple frames of cosine fringe patterns with fixed phase shifts or specially encoded fringe images onto the surface of the object under measurement. The surface morphology variations of the object cause distortions in the projected fringes. An industrial camera captures these deformed fringe images, and phase information is demodulated from multiple fringe projection images to ultimately reconstruct the three-dimensional morphology of the object. Therefore, the key technology lies in using the Phase-shifting algorithm (PSA) to calculate the phase information of the fringe patterns. Unlike classical algorithms that rely on capturing multiple frames and predefined mathematical models, methods based on neural network learn the nonlinear mapping between fringe patterns and phase distributions through extensive data training process, thereby achieving efficient and accurate phase prediction. Existing models have solved some challenges in various aspects but still exhibit certain errors. Additionally, in the process of enhancing the network's performance, the balance between the number of parameters and computational complexity is often overlooked. For this purpose, a wavelet attention based multi-scale phase extraction network (WA-MSPNet) is proposed in this paper.MethodsThe proposed network is based on an encoder-decoder architecture, which employs wavelet transforms to replace traditional pooling layers for down-sampling and implements a channel-spatial mixed attention mechanism in the wavelet domain. During the phase prediction, the network fully leverages semantic features from different levels to achieve multi-scale feature enhancement and prediction output. The encoder is composed of a wavelet mixed attention mechanism and convolution operations. The down-sampling module employs Discrete Wavelet Transform (DWT), which halves the size of the output images, and uses the wavelet low-frequency components extracted by DWT as inputs to the mixed attention mechanism, thereby implementing a wavelet-domain-based attention mechanism. Following the channel-spatial mixed attention module, two layers of 3×3 convolutions, batch normalization, and ReLU activation functions are implemented. Furthermore, unlike traditional decoders that perform predictions at the final layer, the proposed network adopts a multi-scale feature fusion prediction output strategy. This approach fully leverages features from different levels of the decoder, enhancing prediction performance through multi-scale fusion. It ensures the refinement and retention of both deep and shallow features, thereby improving the overall phase extraction performance.Results and DiscussionsQuantitative and qualitative comparative analyses of the proposed WA-MSPNet with the classic UNet, Attention Gate-enhanced UNet (Att-UNet) and Transformer-based Swin-UNet on a test dataset (Tab.1). Firstly, the average errors of the numerator component $ M $ and the denominator component $ D $ is calculated. Compared to UNet, the proposed method achieved a 14.92% reduction in MAE and a 3.82% reduction in RMSE. Compared to Att-UNet, the proposed method reduced MAE by 9.79% and RMSE by 5.56%. Compared to Swin-UNet, the proposed method reduced MAE by 44.53% and RMSE by 42.88%. For the PSNR metric, the proposed method improved by 0.153 dB, 0.532 dB and 5.012 dB compared to UNet, Att-UNet and Swin-UNet, respectively. The proposed network can accurately predict the two components necessary for phase information extraction. Secondly, the phase distribution is obtained by taking the arctangent of the two components. The proposed method outperforms the other methods. The proposed method performs more accurate phase prediction compared to UNet, Att-UNet and Swin-UNet when the fringe pattern involves single object (Fig.4) or multiple objects (Fig.6). Additionally, while achieving better performance, the proposed network has a parameter count of 14.509M and requires 152.566 GFLOPs (Tab.2). The inference time of the proposed WA-MSPNet is 17.59 ms (Tab.3) when dealing with a single fringe pattern.ConclusionsIn order to reduce phase prediction errors while balancing between the number of parameters and computational complexity, a wavelet attention based WA-MSPNet is proposed. The network utilizes wavelet domain features to constructs a channel-spatial mixed attention mechanism, which enhances multi-scale feature perception and improves the quality of cross-layer feature fusion. Additionally, during the prediction stage, a bottom-up multi-scale fusion strategy is employed to integrate both deep and shallow features and connect features from different layers, effectively enhancing phase prediction accuracy. Experimental results demonstrate that the proposed WA-MSPNet achieves excellent phase extraction performance. Compared to UNet, Att-UNet and Swin-UNet, WA-MSPNet extract phase information more precisely while maintaining lower parameters and FLOPs, making it a promising approach for phase extraction applications.
Jun. 25, 2025Vol. 54 Issue 6 20250076 (2025)
Yijie WANG, Xinru ZHANG, Lei ZHANG, Lei FAN, and Qiulin TAN
ObjectiveCarbon dioxide (CO2) is one of the main greenhouse gases, and its massive emissions can lead to an increase in the concentration of greenhouse gases in the atmosphere, thereby causing global temperature rise. The frequent occurrence of extreme weather events, rising sea levels, and glacier melting caused by global warming pose a serious threat to the environment and human society. Industrial activities are one of the main sources of carbon dioxide emissions, so it is necessary to strictly control carbon dioxide emissions in industry. By installing and using carbon dioxide concentration sensors, real-time monitoring of carbon dioxide emissions in industrial processes can be achieved, accurately grasping the emission amount and providing scientific basis for formulating carbon reduction measures. This article introduces the design of a small dual channel non dispersive infrared (NDIR) carbon dioxide concentration sensor with a long optical path chamber, aimed at improving detection accuracy and flexibility.MethodsThis article adopts a dual channel infrared differential detection method to optimize the sensor design from three aspects: chamber structure, hardware circuit, and signal processing software. Firstly, a multi-stage folded gas chamber was designed to achieve a long optical path within a small volume, in order to enhance detection sensitivity. Using SolidWorks and TracePro for the structural design and luminous flux simulation of gas chambers, continuously optimizing the optical path design based on simulation results, and ultimately determining the optimal gas chamber structure (Fig.2). Secondly, a dual channel signal readout and processing circuit based on a second-order bandpass filter was developed (Fig.3), and amplifiers and filters were reasonably configured to ensure the stability and accuracy of the system. In addition, a data acquisition and preprocessing program was developed, and a neural network model was constructed based on the processed data on the upper computer. The initialization parameters of the backpropagation neural network were optimized using genetic algorithm, and the optimal relationship model between the detector dual channel output values, chamber temperature, and carbon dioxide concentration was established (Fig.4). Finally, a gas sensitivity testing platform was built to comprehensively test the performance indicators of the sensor, such as response time, repeatability, stability, and accuracy, verifying the feasibility of the system.Results and DiscussionsAccording to the simulation results of the gas chamber, an effective optical path of 208.47 mm was achieved in a small volume gas chamber of 30 mm×30 mm×12 mm, significantly improving the sensitivity of the sensor. The dual channel output voltage of the sensor indicates that temperature drift and nonlinear factors have a certain impact on the measurement results, which need to be corrected through compensation algorithms (Fig.6). The performance indicator test results show that under the condition of 20 ℃, the response time of the sensor is 34 s, demonstrating good repeatability and stability (Fig.7). The backpropagation neural network model optimized by genetic algorithm was used for concentration prediction, resulting in an R2 of 0.9999, an average absolute error (MAE) of 0.606 1, a root mean square error (RMSE) of 0.994 7 (Fig.9), an average error of less than 0.043%, and a relative error of less than 0.015% (Tab.1). These results indicate that the designed sensor has high measurement accuracy and excellent gas sensing performance.ConclusionsThis article successfully designs a small dual channel NDIR carbon dioxide concentration sensor for monitoring carbon dioxide emissions in industrial production processes. This sensor has the characteristics of small size, simple structure, good stability, and high accuracy. It can achieve high-precision measurement at a concentration of 0%-3% in the temperature range of -10 ℃ to 40 ℃, with an average error of less than 0.043% and a relative error of less than 0.015%. This study provides valuable reference for the development of miniaturized NDIR gas sensors.
Jun. 25, 2025Vol. 54 Issue 6 20240577 (2025)
Yi GAO, Bingfeng LIU, Yumin ZHANG, Qisheng HUANG, and Yanming SONG
ObjectiveChirped Fiber Bragg Grating (CFBG) has the characteristics of small nonlinear effect, large dispersion range, and easy control. It is widely used as a dispersion control element in fiber femtosecond laser systems for precise dispersion management. The spectral and dispersion characteristics of CFBG directly determine the pulse stretching effect. Accurately measuring the dispersion of CFBG is not only an essential basis for the preparation and optimization of high-quality CFBG, but also an important means to evaluate their quality. Therefore, it is necessary to study the fabrication and dispersion measurement techniques of CFBG. This paper proposes a method for fabricating CFBG and measuring its dispersion to achieve higher precision in dispersion measurement.MethodsA large dispersion CFBG for pulse stretcher in the 1 μm is fabricated using a linear phase mask combined with beam scanning exposure technology. Based on the dispersion measurement principle of Michelson white light interferometry, a method combining wavelet threshold denoising and Extended Kalman Filtering (EKF) is proposed to achieve accurate dispersion measurement for a large dispersion CFBG.Results and DiscussionsA large dispersion CFBG designed for pulse stretcher in the 1 μm is simulated (Fig.4), and a CFBG with a central wavelength of 1035 nm, a bandwidth greater than 30 nm, and a reflectivity of approximately 90% is fabricated (Fig.5). The large dispersion CFBG is connected to the dispersion measurement system, and the high-frequency noise in the signal is filtered out using wavelet threshold denoising (Fig.8), The interference spectrum and phase estimation is realized by combining EKF (Fig.9). After multiple measurements, the dispersion value is 20.9283 ps/nm@1030 nm, with a maximum error range within ±0.025 ps/nm (Fig.10). To verify the accuracy of the method, the traditional Fourier Transform (FT) is used for comparison (Fig.11). By comparing the error range and standard deviation of the two methods (Fig.12), it is verified that the method proposed is more effective and accurate.ConclusionsA high-reflectivity CFBG with a central wavelength of 1035 nm, a 3 dB bandwidth greater than 30 nm, and a reflectivity of about 90% is fabricated by combining linear phase mask technology with beam scanning exposure technology under long grating conditions. A method combining wavelet threshold denoising and EKF is proposed for dispersion measurement based on Michelson white light interferometry. Multiple measurement results show that its dispersion value is 20.9283 ps/nm@1030 nm, with the maximum error range within ±0.025 ps/nm. Compared to the traditional FT method, this method proves to be more effective and accurate. The fabricated large dispersion CFBG and its dispersion measurement method are expected to be applied to the pulse stretcher in all-fiber femtosecond laser systems. If combined with the correlated dispersion tuning technology, it has potential application prospects in precise dispersion management in the CPA systems.
Jun. 25, 2025Vol. 54 Issue 6 20250033 (2025)
Junfeng CUI, Zhulian LI, Dongsheng ZHAI, Haitao ZHANG, Hu TAO, and Yuqiang LI
ObjectiveLaser ranging, a high-precision measurement technique, is widely utilized in satellite orbiting, space debris tracking, lunar exploration, and deep space missions. Due to their high mobility and adaptability, mobile stations have become critical components of space target monitoring networks. However, the instability of the ground and the frequent changes in operational conditions exacerbate the issue of laser pointing deviations in mobile stations, compromising both measurement efficiency and accuracy. Current correction methods primarily rely on spot image processing to dynamically adjust the laser pointing by extracting the position of the laser spot. However, the accuracy of spot extraction is often impaired under conditions of weak spot visibility or high noise levels. Moreover, these approaches fail to address the underlying system errors contributing to the deviation. In this study, we propose an automatic correction method based on a laser pointing deviation model that accounts for these factors. The model enables real-time prediction of pointing deviations during observations and provides feedback to the control system for correction.MethodsBy analyzing the system errors between the laser emission axis and the mechanical axis of the telescope, a theoretical model of laser pointing deviation is established. In continuous operation mode of the laser, dense sampling is conducted within the ranges of azimuth (0° to 360°) and elevation (20° to 80°), with an azimuth interval of 3° and an elevation interval of 2°. After sampling, the images are processed in batches to extract the laser spot, as shown in the flowchart (Fig.3). Once batch processing is complete, the data is cleaned using a moving window smoothing method to remove outliers, and data points with deviations exceeding 3 are excluded through pre-fitting of a function. After data cleaning, the theoretical model is fitted using the measured data to obtain a high-precision pointing deviation model.Results and DiscussionsThe laser pointing deviation model is nonlinear and sensitive to both initial values and boundary conditions. To derive a high-precision model, the laser spot distribution at different elevation angles was fitted to determine the center and radius of the circular distribution. The center was then refined to obtain the initial model parameters, as shown in Fig.5. Appropriate boundary conditions were applied, and the initial values were input into the model, which was subsequently optimized using the least squares method. The resulting accuracy of the model is better than 2.5".ConclusionsThis paper proposes a method for predicting the laser pointing deviation in a ranging system. The theoretical model derived from the angular deviation between the optical axis and the mechanical axis matches well with the measured data. The prediction accuracy of the deviation model reaches the arc second level, comparable to the precision of real-time processing of the light spot image. The ranging station can deploy the model to the computer and dynamically correct the laser pointing based on the predicted deviation. This method exhibits strong robustness, even under conditions of faint light spots or strong background noise, and can effectively improve the success rate and efficiency of the ranging process.
Jun. 25, 2025Vol. 54 Issue 6 20240603 (2025)
Jing ZHANG, Jian bo WANG, Cong YIN, Tao JIN, Wenwen BI, Lu LIU, and Ming KONG
ObjectiveThis study aims to investigate the performance of sensor heads with different configurations of low-finesse fiber Fabry-Pérot interferometers in displacement sensing. A systematic analysis was conducted to examine the effects of parameters such as target reflectivity, tilt angle, and working distance on interference signals under different interference models. The primary goal is to simplify the design and development process of sensor heads, thereby supporting the optimization of new sensor designs. Additionally, this study addresses the lack of systematic performance comparisons for different configurations in the existing literature, offering a comprehensive evaluation of how various configurations impact the sensor's overall performance in practical applications.MethodsAn experimental system was constructed using a 1550 nm laser, and both simulation and experimental methods were employed to evaluate the performance of the sensor heads. The study analyzed the interference signal characteristics of four typical sensor configurations in both collimation and focusing modes. The working distance and tilt angle of the target reflectors were varied during the experiments to assess the contrast, angular tolerance, and measurement range of the interference signals. To verify the reliability of the proposed model, experimental data were compared with simulation results. Furthermore, targets with reflectivities ranging from low (4%) to high (96%) were tested to ensure the general applicability of the research findings across various real-world scenarios.Results and DiscussionsExisting studies often focus on single-reflectivity targets and fail to fully consider how configuration differences affect the performance of low-finesse systems. This study proposes an improved optical interference model that encompasses a broad range of target reflectivities, from low reflectivity (4%) to high reflectivity (96%). The performance of the sensor heads in both collimation and focusing modes was systematically compared and optimized.In the collimation mode, for high-reflectivity targets, as shown in Fig.6(a) and Fig.6(b), the configuration demonstrates a self-alignment mechanism with a large angular tolerance, exceeding ±0.5° as illustrated in Fig.7(b). This configuration also achieves a measurement range of over 60 mm, making it suitable for long-distance displacement measurements. However, for low-reflectivity targets, as shown in Fig.4, this configuration becomes more sensitive to tilt changes. As illustrated in Fig.5, precise control of the tilt angle is essential to maintain signal quality and measurement accuracy in practical applications. In the focusing mode, high-reflectivity targets, as shown in Fig.11, achieve peak contrast (approximately 1.0) in the defocus mode (Fig.12(b)), making this configuration suitable for high-precision measurement scenarios. The working distance must be maintained within ±5 mm of the focal point to ensure accurate displacement measurement. For low-reflectivity targets, as shown in Fig.9, the configuration provides a larger angular tolerance, reaching ±0.75°, as depicted in Fig.10(b). Over a wide range of working distances, the contrast remains above 0.9, making it suitable for complex measurement environments that may involve significant variation in tilt angles. By combining simulation and experimental data, the accuracy of the proposed model was validated, with deviations between experimental and simulation results being less than 5%. This confirms the reliability of the model and ensures that it can be applied to a wide range of practical applications. A comprehensive analysis of target reflectivities, ranging from 4% to 96%, was conducted in both modes (Fig.13(a) and 13(b)), ensuring the universality of the research findings. This highlights the model’s ability to predict sensor performance in real-world scenarios with varying target characteristics.ConclusionsThis study has clarified the performance of low-finesse fiber Fabry-Pérot interferometers under different configurations and conditions through systematic experimental and simulation analysis. The collimation mode demonstrates superior long-distance measurement capability, making it ideal for high-precision applications involving high-reflectivity targets. In contrast, the focusing mode exhibits higher fault tolerance in environments with large tilt angles and is more adaptable to low-reflectivity targets. These findings not only validate the reliability of the proposed model but also provide a theoretical basis for optimizing sensor head designs. By streamlining the development and testing process, the model contributes to the efficient creation of new sensor heads for a wide range of applications. Future work will focus on further optimizing the performance of high-finesse fiber Fabry-Pérot interferometers, addressing the potential impact of complex environments on interferometer performance, and integrating multi-mode measurement technologies to meet the diverse and evolving demands of various industries.
Jun. 25, 2025Vol. 54 Issue 6 20250005 (2025)
Qinglong YANG, Chenbo ZHANG, Yinqiao LI, and Yixiao ZHU
ObjectiveInter-satellite laser communication demands a precise pointing, acquisition, and tracking (PAT) system. Establishing a thorough and efficient digital model for the acquisition and tracking system is crucial. It provides a robust groundwork for designing and developing high-precision coarse-fine compound-axis tracking systems. However, previous digital models for compound-axis systems have been overly generalized and lacking in accuracy, manifesting four key shortcomings. Firstly, the coarse and fine loops have been oversimplified, with fewer specific mechanism models and unclear relative motion relationships between components. It results in a significant disconnect from real-world physical contexts. Secondly, devices such as detectors and feedback systems exhibit varying sampling rates, delays, and errors, yet quantitative analyses of these aspects are sparse. Thirdly, error sources are singularly considered, with incomplete identification of their application points. Fourthly, models for friction torque and inertial torque are distorted. To aid in the design of high-precision PAT systems, this paper has tackled these issues by establishing a comprehensive digital model for the compound-axis tracking system. Using this model, simulations have been conducted to elucidate the characteristics and primary-secondary relationships of various error sources. Furthermore, focusing on specific in-orbit laser link scenarios like stationary tracking, satellite attitude adjustments and satellite maneuvers, the causes of tracking accuracy decline and link interruptions have been scrutinized. Additionally, recommendations for optimizing the design of PAT systems and selecting parameters for various devices and controllers are provided in this paper.MethodsCommencing with the foundational theories of the coarse and fine subsystems, and integrating the physical characteristics of actual in-orbit products, a comprehensive digital model for compound-axis tracking has been established (Fig.1). Through an examination of the mechanics behind each error source and merging it with existing data, the mechanisms of satellite-body micro-vibrations, detector noise, static and dynamic friction torques, inertial torques, feedback errors, and gear transmission noise have been quantified (Fig.2). These error sources are all applied at corresponding positions in the digital model. Utilizing this model, a Simulink simulation system has been constructed to delineate tracking errors, servo bandwidth, and other dynamic characteristics. Subsequently, by conducting simulations, specific excitations and boundary conditions have been introduced for in-orbit laser link scenarios encompassing stationary tracking, satellite attitude adjustments, and satellite maneuvers. The time and frequency characteristics of tracking errors have been thoroughly analyzed.Results and DiscussionsBuilding upon the proposed digital model, a sophisticated simulation system has been implemented. This system characterizes the open-loop and closed-loop response curves of the coarse tracking subsystem, the fine tracking subsystem, and the compound-axis system (Fig.3-Fig.4). The simulation yielded a servo bandwidth of 201 Hz for the compound-axis system, which closely aligns with actual in-orbit operational conditions. Tracking errors under different satellite-body micro-vibration models were simulated (Fig.5). Contributions of each error source were calculated (Tab.1), with satellite-body micro-vibrations identified as the primary cause of performance degradation. For the stationary tracking scenario, an analysis unveiled that the "spike"-type decline in tracking accuracy stemmed from the influence of friction torque on the turntable. The rapid oscillation of the friction torque between positive and negative extremes left the turntable in a slow crawl state, leading to abrupt spikes in tracking errors (Fig.7). Regarding satellite attitude adjustments, it was discerned that high-frequency harmonic vibrations of the satellite body primarily undermined tracking performance (Fig.8). In satellite maneuvers, diverse constraints on mechanisms were found to be the cause of laser communication link interruptions (Fig.9). Specific strategies were proposed for each of the aforementioned scenarios.ConclusionsDrawing on a comprehensive assessment of disturbances impacting the onboard laser communication terminal, this paper undertakes a thorough and accurate digital modeling of the compound-axis PAT system. Using the digital model, all key performance has been characterized. Moreover, through simulations and analyses of stationary tracking, satellite attitude adjustments and satellite maneuvers, this paper has pinpointed the factors contributing to the decline in inter-satellite laser communication tracking precision and link disruptions. Tailored enhancement strategies have been devised for each scenario. This study holds significant implications for the design, development, and test of compound-axis control systems for onboard laser communication payloads.
Jun. 25, 2025Vol. 54 Issue 6 20250029 (2025)
Zhekai LI, Dawei TANG, Kenan WU, Tianwen WEI, and Haiyun XIA
Significance Bioaerosols are significant suspended particles in the atmosphere, such as pollens, viruses, and bacteria. They are widely dispersed due to atmospheric movement and have a considerable impact on human health and the environment. Lidar, as an advanced atmospheric remote sensing detection instrument, is well-suited for bioaerosols’ remote detection due to its high sensitivity to atmospheric particles. Bioaerosols lidar can be applied to the early warning of biological warfare agents, real-time monitoring of pollen, and comprehensive atmospheric studies. A significant number of infections can be attributed to bioaerosols attacks. In order to implement effective countermeasures, it is essential to detect bioaerosols in the atmosphere with minimal delay. The current point detection methodology requires the collection of samples for subsequent laboratory analysis, which can take a period of 12 to 36 hours. In contrast, lidar-based detection presents a promising alternative. Based on the optical system, lidar enables real-time, long-distance detection and early warning, thereby allowing people to take action to prevent potential harm in a timely manner. In the context of pollen research, lidar is able to observe pollen in the atmosphere over a wide range, which is conducive to the study of pollen propagation and distribution patterns. Additionally, it can provide travel advice for individuals with pollen allergies and help assess pollen sensitization in the clinic. In the context of atmospheric research, ground-based lidar allows for long-term, stable observations, leading to the accumulation of substantial data, which supports statistical analyses of the spatial and temporal distribution of bioaerosols in the atmosphere.Progress At present, Lidar for the remote detection of bioaerosols is founded upon four principal tenets: polarization, laser-induced breakdown spectroscopy (LIBS), differential scattering (DISC), and laser-induced fluorescence (LIF), LIF lidar is highlighted. Different fluorophores produce fluorescence spectra with different characteristics when excited by laser light. Therefore, it is theoretically possible to detect and distinguish fluorescent bioaerosols signals in the atmosphere at long distances by combining the LIF principle with a lidar system that emits laser light of a certain wavelength and receives fluorescent signals within a specific band. The wavelength is one of the most important factors affecting the performance of LIF lidar. Then different wavelengths of LIF lidar are analyzed (Tab.1), which need to take into account the fluorescence properties of the target substance. The LIF lidar can be categorized into two primary wavelength bands: one is mainly to excite the fluorescence of specific aromatic amino acids (under 300 nm), while the other is mainly to excite the molecules related to biological metabolism (above 300 nm). Due to the need for mature and reliable lasers for practical applications, most researchers have chosen 266 and 355 nm wavelengths, although some have used 294 nm in order to minimize ozone attenuation. Different photodetectors are also discussed. The LIF lidar bioaerosols detection-related research institutions are marked on a world map provided by the Standard Map Service system (Fig.3), and a list of lidar parameters is also given (Tab.2). After that, the article is divided into 266 nm single-wavelength-excited lidar, 355 nm single-wavelength-excited lidar, other single-wavelength-excited lidar and multi-wavelength-excited lidar to be described. 266 nm-excited lidar is mostly used in the detection of biological warfare agents, which has a high variability of the excitation spectrum, but the detection distance is not far due to the strong absorption of ozone. But as in Fig.4, bioaerosols signals were detected by some researchers at 2.5km during the daytime. 355 nm-excited lidar has been applied to the following aspects: water vapor Raman signals interferes with fluorescence (Fig.5), and some research groups have proposed some optimization algorithms based on the fluorescence principle; 355 nm receives less interference in the air, so many research groups use it to detect long-distance bioaerosols fluorescence signals, and they have built up multi-wavelength lidars, which can detect the integral fluorescence signals of some air pollutants and pollens; also, some research groups have experimented with the ability to detect biological warfare agents and pollens (Fig.6) using bioaerosols fluorescence spectrum. Less research has been done on other wavelengths, but a number of researchers have demonstrated that multi-wavelength lidar provides rich spectral data and has great potential for bioaerosols identification.Conclusions and Prospects The characteristics as well as limitations of LIF lidar bioaerosols technology are summarized. The well-performing designs are highlighted for the two types of systems: lidar systems intended for long-term stable atmospheric monitoring and those designed for the rapid identification of biological warfare agents, respectively. In the context of air pollution, epidemic outbreaks, and bioterrorism, bioaerosols lidar, based on LIF technology, has great potential for development as a means of detection with long range, high speed, and remarkable accuracy.
Jun. 25, 2025Vol. 54 Issue 6 20240580 (2025)
Yanze GAO, Junjie LU, Renjie LI, Yuan MU, and Zhuo LI
Significance Optical target simulators, also known as optical scene simulators, are used to generate simulated targets and backgrounds that approximate the optical characteristics of real targets and backgrounds in a laboratory environment. They offer the advantage of flexible and controllable simulation scenes, supporting the construction of various extreme and edge test scenarios. These simulators are widely applied in hardware-in-the-loop (HIL) simulations for optical guidance systems and in the performance testing of various optical imaging systems. In recent years, optical target simulators have also gained attention in the field of autonomous driving, being used for the performance testing of vehicle-mounted optical sensors or participating in HIL simulations for autonomous vehicles. With the development of optical guidance technology, more dimensions of target optical characteristics are being utilized, leading optical target simulation technology to evolve toward the simulation of multi-dimensional optical scenes. This paper reviews the research progress of image-based optical target simulators, multispectral target simulators, and LiDAR target simulators, analyzing the working principles, technical specifications, core components, major research institutions, and the current research status both domestically and internationally. The aim is to help readers quickly understand the relevant knowledge in this field and grasp the trends in technological development.Progress First, this paper introduces image-based optical target simulators, which include infrared scene projectors, ultraviolet scene projectors, and visible light scene projectors. These image-based optical target simulators are evaluated based on technical specifications such as spectral range, image resolution, temperature range, temperature resolution, non-uniformity, frame rate, and other parameters, all of which directly affect their performance and application outcomes. Taking the infrared scene projector as an example, the paper discusses three mainstream infrared image generation devices: resistor arrays, DMDs (digital micromirror devices), and visible-to-infrared image conversion chips. Resistor arrays offer excellent performance but are expensive, making them the mainstream choice internationally. DMDs, being more affordable, are widely used but suffer from diffraction effects, which impact image quality in the long-wave infrared spectrum. Visible-to-infrared image conversion chips, developed by Beijing Institute of Technology, represent a class of infrared image generation devices that have undergone three generations of upgrades, with the current versions supporting larger array sizes.Next, the paper introduces ultraviolet and visible light scene projectors. The basic architecture of these projectors is similar to that of infrared scene projectors, with the primary differences being in the choice of light sources and image generation devices. Ultraviolet light sources mainly include halogen lamps, xenon lamps, or deuterium lamps, while visible light sources predominantly use xenon lamps. Image generation devices for ultraviolet scene projectors primarily include DMDs, silicon-based liquid crystals, and liquid crystal spatial light modulators. Visible light scene projectors, on the other hand, primarily use DMDs, LCOS (liquid crystal on silicon), and TFT-LCDs. Following this, the paper discusses multispectral scene projectors. Compared to image-based optical target simulators, multispectral optical scenes incorporate an additional spectral dimension. Consequently, the technical specifications expand to include spectral range and spectral resolution. A comparative analysis of three multispectral scene projector solutions—developed by Kent Optronics, the National Institute of Standards and Technology (NIST), and Beijing Institute of Technology—is presented, highlighting the differences among these multispectral projectors.Finally, the paper introduces lidar scene projectors. Compared to image-based optical target simulators, laser 3D scenes incorporate a temporal dimension. The technical specifications are extended to include distance simulation range, distance simulation resolution, distance simulation accuracy, spatial resolution, and depth of field, among others. Three representative technical solutions are described: FLASH lidar scene projectors, lidar scene projectors based on temporal downscaling and integral imaging technology, and scanning lidar scene projectors. The first solution faces challenges in achieving large array scales due to limitations in circuit board design. The second solution addresses this bottleneck by using a small number of delay channels to generate large-array laser delay signals, overcoming the technical limitation of insufficient array size in traditional lidar scene projectors. The third emerging solution, compared to traditional approaches, offers a wider field of view and enables in-situ testing. However, its technical challenges lie in real-time tracking of the measured lidar’s emission beam and the design of spatially large-field optical transmission and reception for laser echo signals.Conclusions and Prospects Optical scene projectors play a vital role in hardware-in-the-loop (HIL) simulations for optical guidance and autonomous driving, with growing applications in military, civilian, and research fields. This review highlights the principles, features, and applications of conventional, lidar, and multispectral scene projectors. Conventional projectors simulate scenes across multiple wavebands, while multispectral and lidar projectors enhance spectral and depth dimensions for advanced system testing. Future advancements will focus on integrating AI and multidimensional simulations to improve realism and adaptability.
Jun. 25, 2025Vol. 54 Issue 6 20250037 (2025)
Chunning PAN, Riwa HAO, Weimin WANG, Zixin ZHOU, Yanqing LU, and Junlong KOU
Significance Bound states in the continuum (BIC) lasers have garnered significant attention in the field of photonics due to their ultra-high quality factor (Q-factor) and low-threshold lasing characteristics. The concept of BIC originally emerged from quantum mechanics and was later introduced into optical systems, where it has been extensively studied in photonic crystals, metasurfaces, and microcavity systems. The fundamental principle of BIC lasers lies in the precise engineering of optical structures to suppress radiation loss for specific modes, thereby creating highly localized high-Q states. This mechanism breaks the limitations of traditional optical cavities and enables the realization of ultra-high Q values and highly efficient laser emission. By leveraging symmetry protection, parametric tuning, or topological design, BIC lasers can achieve high-Q modes, offering a new pathway for the development of low-loss, high-coherence light sources.Progress BIC is a unique optical phenomenon in which certain optical modes, despite being located in the radiation continuum, remain bound and do not couple with external radiation. This phenomenon is caused by specific symmetries and designs of structures, which, under certain conditions, can confine light in a specific region without radiation leakage. The characteristics of BIC modes include low loss, high Q factor, and strong localization. They are often applied to enhance the performance of optical devices, especially in the design and optimization of lasers. The introduction of BIC has provided new breakthroughs in improving efficiency and optimizing output. Firstly, BIC plays a crucial role in optimizing the high Q factor of lasers. The Q factor represents the quality factor of the system, measuring the light storage capacity within the cavity and the efficiency of the interaction between light and matter. Traditional laser Q factor optimization typically depends on the cavity structure and the choice of gain media. However, the introduction of BIC modes offers a more efficient path for this optimization. BIC modes, with their low loss and strong localization, allow light to remain within the cavity for extended periods, significantly improving the Q factor of the laser. Moreover, the unique properties of BIC enable mode selectivity across different wavelength ranges, further enhancing the stability and efficiency of the laser. Therefore, BIC not only improves the Q factor of the laser but also shows great potential in miniaturized lasers and high-precision laser systems. In terms of optimizing laser output, BIC also plays a key role, especially in optimizing single-mode output. Single-mode output is one of the core performance indicators of a laser, ensuring that the laser outputs stable and consistent modes. However, traditional lasers often face the issue of multi-mode output, which leads to instability and reduced precision. By incorporating BIC modes, lasers can avoid multi-mode competition and achieve single-mode output. BIC modes have strong mode selectivity, allowing precise control over the resonant conditions of the laser and limiting the output to specific resonant modes, thus preventing interference from traditional multi-mode outputs. Additionally, the localization characteristics of BIC ensure that the laser can operate stably without external disturbances, greatly enhancing the stability and efficiency of single-mode output.Conclusions and Prospects With the rapid advancement of intelligent manufacturing and autonomous driving, the demand for high-performance lasers has increased significantly. BIC lasers, as an emerging field, have shown great potential due to their ultra-high Q factors and enhanced mode control. Key optimizations include merging multiple BICs to form new modes, utilizing photonic bandgap effects to enhance localization, and introducing phase-change materials for improved tunability. Expanding high Q regions in momentum space also strengthens robustness against external variables and fabrication imperfections. However, challenges remain, such as balancing high Q factors with increased threshold currents, reducing complex manufacturing costs, and mitigating nonlinear effects and thermal instabilities. Despite these obstacles, advancements in optical materials and nanofabrication technologies provide promising prospects. BIC lasers are expected to play a crucial role in high-performance laser applications, including optical sensing, quantum information, and optical manipulation, driving the future of photonic technology.
Jun. 25, 2025Vol. 54 Issue 6 20250207 (2025)
© Copyright 2018-2021 | Chinese Laser Press.
All Rights Reserved 沪ICP备15018463号-20