


Please enter the answer below before you can view the full text.


2025
Volume: 45 Issue 8
34 Article(s)

Bowen Yang, Chunsheng Sun, Li Kai, and Jingbo Sun
ObjectiveThe infrared search and track (IRST) system has characteristics such as good concealment, long detection range, and strong anti-jamming capabilities, and is widely used in airborne, shipborne, vehicle-mounted, and spaceborne systems. The operating range is an important indicator of the detection capability of IRST systems. Accurately analyzing the operating range is significant for improving design quality and evaluating comprehensive performance. Traditional operating range models for IRST systems generally do not consider the spectral radiation characteristics of both the target and the background. Many studies have made improvements in this area, but they have not simultaneously considered both the efficiency of target radiation received by the pixels and the short-term random errors in system tracking. In response to the current research gap, this study establishes an optimization model for the operating range of a staring IRST system and presents a novel method for solving this range. The model accounts for both the number of pixels occupied by the target’s image on the focal plane and the efficiency with which these pixels receive the target’s radiation. During the solution process, the theoretically calculated target spectral radiation intensity and background spectral radiation brightness are normalized and treated as weights, which are then multiplied by the actual measurement results. This approach balances the advantages of both theoretical calculations and actual measurements, thus improving calculation accuracy. We hope that this model can serve as a reference for analyzing factors related to the operating range of IRST systems and assist in the optimization and performance evaluation of such systems.MethodsWe improve the existing IRST system operating range model by using the number of pixels n occupied by the target to handle the system’s short-term random tracking errors, and by using the pulse visibility factor (PVF) to address the efficiency of pixel response due to target radiation. During the solution process of the operating range model, a normalization method is proposed. First, the target radiation intensity and background radiation brightness, obtained from theoretical calculations, are separately normalized to obtain the normalized target radiation intensity and normalized background radiation brightness. These values are then used as weights and multiplied by the actual measurement results to derive new spectral radiation characteristics for the target and background. The integral part is then fitted to obtain a hidden function equation that is only related to distance, which is then solved. Finally, the optimized operating range model and normalization method are used for example calculations and experimental verification.Results and DiscussionsAccording to the optimized operating range model and solution method proposed in this study, the operating range is calculated to be 15.4461 km, with a relative error of 2.97%. In contrast, if the unoptimized solving method is used, the operating range is calculated to be 17.5512 km, with a relative error of 17.01%. Therefore, the calculation results based on the optimized operating range model and solution method in this study are closer to the measured values. Without changing other conditions, the relationship between n and the entrance pupil diameter and operating range (Fig. 7) shows that the operating range decreases as n increases, but the rate of decrease slows down; it increases as the entrance pupil diameter increases, though the rate of increase also slows down. Therefore, optimizing the IRST system tracking device can reduce the short-term random errors in system tracking, lower the n value, and thereby increase the operating range. The operating range of the IRST system can also be increased by appropriately enlarging the optical system’s aperture.ConclusionsWe establish an optimization model for the operating range of a gaze-type IRST system. The operating range model corrects the traditional derivation method, which assumes a uniform distribution of the energy of the speckle pattern formed by point targets on the focal plane, while also considering the speckle effect caused by short-term random tracking errors, thereby improving the accuracy of the calculations. Finally, the operating range model is applied to calculate instances of aircraft targets, and the effect of the number of pixels n occupied by the target on the focal plane, as well as the optical system aperture, on the operating range, is analyzed. The calculation results indicate that the operating range decreases as n increases, but the rate of decrease slows down; the operating range increases as the entrance pupil diameter increases, though the rate of increase also slows down. Finally, the reliability of the operating range model is verified through field experiments. The research indicates that both the number of pixels occupied by the target on the focal plane and the efficiency of these pixels in receiving target radiation are important factors affecting the operating range of IRST systems and should be considered in calculations. The theoretically calculated target spectral radiation intensity and background spectral radiation brightness fully take into account the spectral radiation characteristics of the target and background. However, there may be some deviation between theoretical calculations and actual measurements. While actual measurements are highly accurate, they often reflect the overall radiation characteristics and cannot reveal the detailed spectral radiation characteristics. Normalizing the theoretical calculation values as weights for the actual measurement values can yield new spectral radiation characteristics for the target and background. This method combines the advantages of both theoretical calculations and actual measurements, which makes it more aligned with real-world situations. Additionally, optimizing the IRST system tracking device or appropriately increasing the optical system aperture can enhance the operating range of the IRST system. For large-aperture optical systems, further increasing the system aperture will have a diminishing effect on the improvement of the operating range.
Apr. 27, 2025Vol. 45 Issue 8 0804001 (2025)
Jianguo Zhao, Rui Yin, Ru Xu, Hui Zhang, Jiangyong Pan, Yiying Zhang, Xunpeng Li, Shuchang Wang, and Jianhua Chang
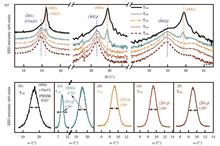
ObjectiveAmong the five polymorphs of Ga2O3, β?Ga2O3 is notable for its superior thermal stability and a breakdown field strength of approximately 8 MV/cm. In addition, β?Ga2O3 demonstrates high selectivity and exceptional photoresponse characteristics towards solar-blind ultraviolet light, making it an ideal candidate for solar-blind photodetectors (SBPDs). In contrast, ε?Ga2O3, the second most stable polymorph, exhibits ferroelectric properties and a significant spontaneous polarization coefficient of 24.44 μC/cm2. However, a major challenge is the lack of mature commercial metal-organic chemical vapor deposition (MOCVD) equipment specifically designed for Ga2O3, as well as the absence of suitable epitaxial growth substrates. In this paper, we utilize a self-developed MOCVD system, which demonstrates stability and reliability, enabling significant advancements in Ga2O3 growth. This leads to high system stability and moderate-scale production capabilities. Recent studies employ c-plane sapphire as the substrate for heteroepitaxial growth of Ga2O3, with controlled growth conditions such as temperature, gas flow rates, and pressure to yield various Ga2O3 polymorphs. Lower growth temperatures favor the formation of hexagonal ε?Ga2O3, while temperatures above 500 ℃ promote a gradual transition to β-Ga2O3. In this paper, we investigate the influence of growth temperature on the properties of Ga2O3 thin films and SBPDs at temperatures below 700 ℃, providing a feasible approach for the heteroepitaxial MOCVD growth of Ga2O3 thin films. We aim to overcome existing limitations by offering practical insights into optimizing growth conditions for enhanced material quality and device performance.MethodsDuring epitaxial growth, the MOCVD system’s reactor pressure is maintained at 50 mBar while the temperature is gradually increased to the target level. Upon reaching the target temperature, oxygen (O2) and triethylgallium (TEGa) are introduced as O and Ga sources onto a (002) c-plane sapphire substrate with a molar flow ratio of O to Ga of 1600 for a growth duration of 1 hour. Five sets of Ga2O3 thin films are grown at temperatures of 500, 530, 580, 630, and 680 ℃, labeled as T500, T530, T580, T630, and T680, respectively. Post-growth characterization is performed using X-ray diffraction (XRD), scanning electron microscopy (SEM), X-ray photoelectron spectroscopy (XPS), and ultraviolet-visible spectrophotometry to analyze the structural, surface, elemental composition, and optical properties of the Ga2O3 thin films. Metal hard masks are used for pattern transfer, and Ag interdigitated electrodes are sputtered onto the films to fabricate planar metal-semiconductor-metal (MSM) SBPDs. The current-voltage characteristics of the detectors are measured under dark conditions and illumination at 254 nm and 365 nm wavelengths (both with a light power density of 600 μW/cm2) using a Keithley 2450 SourceMeter. The transient photoresponse characteristics are evaluated by recording current-time (I-t) curves while periodically turning the 254 nm light source on and off at 60-second intervals.Results and DiscussionsXRD analysis reveals that T500 predominantly consists of ε-Ga2O3, T530 is a mixture of ε and β phases, while T580, T630, and T680 are composed entirely of the β?Ga2O3 [Fig. 1(a)]. This indicates that temperature is a critical factor influencing the crystalline phase of Ga2O3, with a transition from ε to β phase occurring around 530 ℃. The XRC full width at half maximum (FWHM) results for all films align with those typically reported for heteroepitaxial growth [Figs. 1(b)?(f)]. All Ga2O3 thin films exhibit high crystalline quality, as evidenced by a sharp absorption edge near 255 nm in their transmission spectra [Fig. 3(a)]. SEM images show that film surfaces become smoother at lower temperatures but increasingly rougher as the growth temperature rises [Figs. 2(b)?(f)], likely due to the stronger crystal orientation of β-Ga2O3 at higher temperatures. The bandgap, derived from the absorption spectrum using the Tauc plot, increases with temperature [Figs. 3(b) and (c)], attributed to a reduction in oxygen vacancy defects and improved stoichiometry relative to bulk Ga2O3. XPS results show that the binding energies of Ga 2p1/2, Ga 2p3/2, and Ga 3d increase and then decrease with temperature [Fig. 4(b)], indicating that lower binding energies suggest more Ga—O bond formation. A similar trend is observed in the relative concentration of oxygen vacancies [Fig. 4(c)], suggesting that the T500 and T680 films exhibit enhanced structural stability. The fabricated SBPDs demonstrate excellent overall performance, particularly the device based on T680, which achieves a light-dark current ratio (PDCR) of 3.75×10⁷, a responsivity (R) of 0.5 A/W, a detectivity (D) of 3.11×10¹² Jones, an external quantum efficiency (EQE) of 242.4%, and an R254 nm/R365 nm of 1.35×10⁶. In transient photoresponse testing, reduced oxygen vacancy defect concentrations result in diminished photoconductivity effects and enhanced response speeds. For the SBPD based on T680, the response time constants are τr1=0.067 s, τr2=0.366 s, τd1=0.008 s, and τd2=0.063 s [Fig. 5(b)].ConclusionsUsing the MOCVD system, pure ε-phase Ga2O3 can be grown heteroepitaxially at 500 ℃. At 530 ℃, the onset of β?phase Ga2O3 occurs, and further heating to 580 ℃ results in the formation of pure β?phase Ga2O3. Simultaneously, the bandgap of Ga2O3 increases from 4.83 eV to 5.00 eV with rising temperature. All Ga2O3 thin films exhibit high crystalline quality, as evidenced by a sharp absorption edge near 255 nm in their transmission spectra. In addition, XPS analysis indicates that the crystal structures of the pure ε?phase Ga2O3 film (T500) and the highest-temperature-grown pure β?phase Ga2O3 film (T680) are relatively more stable. The fabricated MSM-type SBPDs demonstrate rapid photoresponse characteristics, along with good repeatability and stability. Specifically, under a bias voltage of 5 V and a light power density of 600 μW/cm2, the SBPD based on T680 achieves a PDCR of 3.75×10⁷, a D of 3.11×10¹² Jones, an EQE of 242.4%, and an R254 nm/R365 nm of 1.35×10⁶, indicating excellent overall performance. In transient photoresponse tests conducted at a light power density of 600 μW/cm2, the rise time and fall time are measured to be 0.067 and 0.008 s, respectively.
Apr. 27, 2025Vol. 45 Issue 8 0804002 (2025)
Qi Feng, and Feng Zhao
ObjectiveIn the upcoming sixth-generation (6G) mobile communication systems, new intelligent applications and services have emerged, such as autonomous driving and machine-type communication. Currently, the separate design of sensing and communication cannot meet the simultaneous requirements of high data transmission rates and high-precision sensing. Therefore, the integrated sensing and communication (ISAC) system has become one of the key technologies for 6G. ISAC technology combines communication and sensing functions, resolving the spectrum conflict between these systems and effectively alleviating the scarcity of spectrum resources. In recent years, the development and application of terahertz (THz) technology have promoted the implementation of ISAC. The abundant spectrum resources in the THz frequency band meet the growing demand for high-speed communication, and the short wavelength of THz waves enables fine spatial resolution, making them suitable for applications in imaging, localization, and environmental sensing. THz ISAC technology can provide real-time precise mapping and localization capabilities while maintaining high-speed communication links, presenting great potential for intelligent applications. Currently, THz signals are mainly generated by electronic and optical methods. The communication rate of THz signals generated via electronic technology is constrained by the microwave signal prior to the frequency multiplication, and its performance is limited by the bandwidth of electronic devices. In contrast, THz signals generated by optical methods directly leverage the large bandwidth advantage of THz communication, effectively overcoming the bandwidth bottleneck of electronic devices. This significantly simplifies the system structure and offers advantages such as high sensitivity and low power consumption. Orthogonal frequency-division multiplex (OFDM) is increasingly utilized in ISAC systems due to its excellent anti-multipath performance and high delay-Doppler resolution. By integrating minimum-shift keying (MSK) and linear frequency modulation (LFM) technologies, the fuzzy function can be further optimized, yielding better sensing performance. Therefore, we propose an optically loaded THz ISAC system based on OFDM-MSK-LFM, which provides a reference model for the fusion of communication and sensing functions in 6G.MethodsThe ISAC signal is generated in MATLAB, where a certain number of pseudo-random binary sequences are mapped to MSK signals. Subsequently, series-parallel conversion and inverse Fourier transform are applied to perform OFDM modulation. The signal is then modulated onto an LFM carrier. The ISAC signal is converted into an analog signal and drives the I/Q modulator, which is modulated onto the continuous-wave optical source generated by an external cavity laser. The optical signal is coupled with another local oscillator light source, and finally, a THz signal is generated by the photodetector. A portion of the terahertz signal is sent to the communication receiver, where the communication signal is recovered after de-chirping, Fourier transform, and channel equalization. The remaining signal is reflected by the target and received by the sensing receiver. The range and velocity of the target are recovered after estimating the sensing channel from both the echo signal and the original signal.Results and DiscussionsThe proposed ISAC system achieves both high-rate communication and high-precision sensing. The fuzzy function of the ISAC signal is thumbtack-shaped, indicating excellent sensing performance (Fig. 8). The peak sidelobe ratio increases with the LFM bandwidth (Fig. 9), enhancing the anti-interference ability of ISAC. In the close-range static dual-target simulation test, the ranging error is kept within 5 mm (Fig. 10). In the high-speed dynamic dual-target test, relatively high precision for both range and velocity measurements is achieved (Fig. 11). After transmitting the 10 GBaud ISAC signal over a 25 m wireless link, the bit error rate reaches the threshold for hard decision forward error correction [Fig. 13(b)]. However, the bit error rate of the ISAC signal deteriorates as the LFM bandwidth ratio increases [Figs. 13(c) and (d)]. The partial sequence transmission algorithm can suppress the peak-to-average power ratio (PAPR) by up to 3.30 dB. As NFFT increases, the system’s PAPR also increases, while the theoretical maximum measurement error decreases. A balance is achieved when NFFT is 256, with simulated distance and speed errors of 0.4 cm and 10.83 m/s, respectively. The complementary cumulative distribution function for PAPR of >8 dB is 0.123.ConclusionsIn this paper, we propose an optical carrier ISAC system based on OFDM-MSK-LFM. Compared to traditional OFDM, MSK and LFM suppress Doppler sidelobes, concentrating energy towards the main lobe, thus improving the anti-interference performance and high-speed target detection capabilities of the ISAC signal. Due to the nonlinear effects of LFM, the bit error rate (BER) of the integrated signal exacerbates as the LFM bandwidth ratio increases. The adopted multi-carrier modulation enhances the overall sensing performance of the system but also increases the PAPR. The PTS algorithm, while adding some computational complexity, effectively suppresses the PAPR. The proposed system allows for flexible adjustment of the ISAC signal’s bandwidth and NFFT according to system requirements, enabling optimization of the detection range, sensing resolution, communication rate, and PAPR. This provides a valuable reference for the future development of 6G ISAC technology.
Apr. 27, 2025Vol. 45 Issue 8 0806002 (2025)
Jiahao Zou, Yang Cao, Xiaofeng Peng, Yunxiang Gao, Jing Zuo, and Fen Chen
ObjectiveWith the rapid growth in the number of low-Earth orbit (LEO) satellites, especially with the increasing application of satellite optical communication networks, efficiently and flexibly managing and optimizing the communication links and network traffic between satellites has become an urgent problem. Traditional satellite network routing and load balancing methods often perform poorly in the face of high dynamics, complex topologies, and unbalanced satellite-ground traffic distribution, which leads to issues such as link congestion, traffic bottlenecks, and resource utilization inequality. This reduces satellite resource utilization and causes network load imbalance. Therefore, it is particularly important to study an adaptive load balancing algorithm that can effectively handle network load fluctuations, reduce the blocking rate, and improve throughput.MethodsWe address the problem from the perspective of satellite-ground traffic balancing, considering the onboard and satellite-ground traffic distribution characteristics of LEO satellite optical networks. Using the polar Walker constellation model, a LEO satellite optical network scenario is constructed, and two load balancing algorithms are proposed: the redundancy-aware load balancing (RALB) algorithm and the detour multipath routing algorithm for satellite-ground traffic (DMRA-SGT). First, the RALB algorithm optimizes the Dijkstra path search logic by utilizing multiple equivalent paths in inter-satellite links. It removes overloaded links, prioritizes lightly loaded ones, and effectively alleviates network bottlenecks, thereby improving resource utilization efficiency. Second, the DMRA-SGT algorithm combines the congestion distribution index and uses traffic packet transmission to redirect some traffic from the default route to detour paths located farther from the core satellite region, which loads are lighter. The routing tables for both detour paths and shortest paths are updated synchronously to avoid temporary loops. To quickly respond to data forwarding and congestion paths, a fast distributed routing protocol (FDR) is designed as the default routing scheme for the satellite-ground traffic detour algorithm. This protocol requires fewer onboard resources for calculating the shortest and long-distance detour paths, thus achieving effective traffic distribution and mitigating cascading congestion.Results and DiscussionsOn MATLAB R2018b and satellite simulation software STK 11.6, we build a polar-orbiting satellite constellation, including 288 satellites (constellation parameters: 288/12/24, 1400 km) and 16 ground stations, and use OPNET Modeler 14.5 for simulation verification. To measure the degree of network congestion under different algorithms, we use the traffic blocking ratio (TBR) as an indicator. Simulation results show that the DMRA-SGT algorithm performs the best among the four algorithms, while the Dijkstra algorithm performs the worst. When the total traffic volume is lower than 5.7 Tbit/min, the TBR of Dijkstra’s algorithm is zero. However, when the traffic volume exceeds this threshold, the network becomes congested, and the TBR increases rapidly. When the system reaches the maximum of 9.9 Tbit/min, the TBR reaches 26.28%. This is because Dijkstra’s algorithm needs to store the entire network information, resulting in excessive memory consumption in complex networks. In contrast, the RALB algorithm begins to show congestion when the total traffic volume reaches 6 Tbit/min and the TBR peaks of 21.71% at 9.9 Tbit/min. Although the RALB algorithm considers link loads to avoid heavily loaded links, its effect is limited. The SGC-LB algorithm works by directing congestion traffic to the nearest gateway, but as the link load is not taken into account, the network begins to experience congestion at 6.6 Tbit/min, with the final TBR peak of 2.08%. However, the congestion in the DMRA-SGT algorithm only appears when the total traffic volume reaches 6.6 Tbit/min, and when it reaches 9.9 Tbit/min, the peak value of TBR is only 0.49%. This is 25.79 percentage points, 21.22 percentage points, and 1.59 percentage points lower than those of Dijkstra, RALB, and SGC-LB, respectively. Regarding the evaluation of the average packet loss rate and total throughput, the simulation results show that the DMRA-SGT algorithm performs the best in terms of packet loss rate. Especially when the total traffic is 10 Tbit/min, the packet loss rate of DMRA-SGT is 3.17%, which is much lower than that of the other algorithms. The reason for this is that DMRA-SGT reduces congestion and packet loss by bypassing routes to avoid high-traffic areas. SGC-LB and RALB also reduce the packet loss rate by choosing lower load paths, although not as effectively as DMRA-SGT. The Dijkstra algorithm, however, selects the congested links, which results in the highest packet loss rate, reaching 14.12%. In terms of total throughput, the DMRA-SGT algorithm also demonstrates the best performance. When the total traffic is 9.9 Tbit/min, the total throughput of DMRA-SGT is 9821.6 Gbit, which is 18.2% higher than that of Dijkstra’s algorithm. Although the increase in total throughput is not as significant as that of the blocking rate and packet loss rate, it still highlights the advantages of DMRA-SGT under high loads. In summary, the DMRA-SGT algorithm outperforms the Dijkstra, RALB, and SGC-LB algorithms in terms of traffic blocking rate, packet loss rate, and total throughput, which demonstrates superior network performance.ConclusionsIn this paper, we consider the effect of traffic load on satellite optical networks and propose a satellite-based redundancy-aware load balancing algorithm. This algorithm utilizes on-board resource redundancy to reduce network congestion and improve network throughput. We then introduce the DMRA-SGT algorithm, which combines the shortest path with long-range detour paths. Based on network state information, the algorithm computes a congestion distribution index and selects long detour paths using a detour multipath algorithm according to a fast distributed routing protocol. Through simulation, we compare and analyze the performance of the DMRA-SGT algorithm under high-throughput traffic, which shows that it outperforms other algorithms in terms of traffic blocking rate, packet loss rate, and total throughput. Specifically, compared to the widely used Dijkstra algorithm, the blocking rate is reduced by 25.79 percentage points, the packet loss rate is reduced by 10.95 percentage points, and there is a significant improvement in total throughput.
Apr. 14, 2025Vol. 45 Issue 8 0806003 (2025)
Bowen Yu, Shiqing Cheng, Jiaxin Gao, Yajun Jiang, Fajun Xiao, and Jianlin Zhao
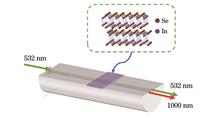
ObjectiveAs society and the economy continue to advance, there is an increasing demand for real-time monitoring of temperature and strain in fields such as oil extraction, aerospace, and renewable energy. Traditional methods, which rely on thermocouples and resistance strain gauges, often suffer from low accuracy, environmental sensitivity, and limitations in measurement (typically only at a single point). Fiber optic sensors are widely used in engineering due to their corrosion resistance, immunity to electromagnetic interference, and ease of integration into networks. However, traditional fiber optic sensors tend to be bulky, which limits their ability to meet the increasing demand for smaller, lighter designs in modern applications. In addition, addressing temperature-strain cross-sensitivity in these sensors often requires complex fabrication processes, and the specialized structures involved may not be practical for real-world use. To address these challenges, we propose a dual-parameter sensing structure for temperature and strain, combining indium selenide and fiber Bragg grating (FBG) technologies.MethodsThe D-shaped fiber in this structure is prepared by side-polishing a standard single-mode optical fiber. Due to the small distance between the polishing surface and the core, along with the flatness of the polishing area, a large evanescent field is generated. This facilitates the integration of the two-dimensional material, indium selenide, enabling efficient fluorescence excitation and collection. Using a femtosecond laser, the FBG structure is inscribed point by point in the polished area of the D-shaped fiber. The mechanically stripped indium selenide material is then transferred onto the polished surface of the fiber, which is inscribed with the FBG, via a dry transfer technique. When the fiber core is excited by 532 nm light, the evanescent field of the D-shaped fiber stimulates indium selenide to emit fluorescence at approximately 1000 nm. The central wavelength of the FBG is primarily influenced by changes in the effective refractive index and the periodic spacing of the grating. As the temperature changes, thermal expansion and thermal optical effects alter both the refractive index and the period of the grating, resulting in a shift in the central wavelength. Similarly, when strain is applied to the FBG, both the periodicity of the grating and the effective refractive index in the grating region are modified due to the elastic-optic effect, causing a shift in the central wavelength. By establishing the relationship between environmental parameters and the Bragg wavelength drift, it is possible to monitor a variety of environmental conditions. Moreover, experimental results indicate that as temperature increases, the bandgap energy of the fluorescent material decreases, leading to a linear redshift in the fluorescence peak. This redshift is much larger than the Debye temperature of the material in the temperature range of interest, allowing for real-time temperature monitoring through the linear relationship between the fluorescence peak wavelength and temperature. Importantly, the side-polished D-shaped fiber disrupts the structural symmetry of a conventional cylindrical fiber, but the axial strain within the mechanical strength range (0?5000 με) is insufficient to significantly alter the bandgap of indium selenide. Thus, it can be concluded that the fluorescence peak of indium selenide in this composite structure is primarily sensitive to temperature.Results and DiscussionsIn the temperature test, the sensor is subjected to a temperature range from room temperature to 350 ℃. As the temperature increases, the reflection peak of the D-shaped FBG exhibits a redshift. The temperature sensitivity of the D-shaped FBG is found to be 13.5 pm/℃ [Fig. 9(a)]. For strain testing, the D-shaped FBG is subjected to strains ranging from 0 to 3000 με. As strain increases, the reflection peak also redshifts, with the strain sensitivity measured at 1.28 pm/με [Fig. 9(b)]. The fluorescence temperature response is tested between room temperature and 150 ℃. As the temperature increases, the fluorescence peak wavelength redshifts and the peak width broadens. The temperature sensitivity of the fluorescence signal is 207.4 pm/℃ [Fig. 11(a)]. Next, the effect of axial strain on the fluorescence wavelength of indium selenide is examined within the range of 0 to 3000 με. The results show that the fluorescence wavelength of the composite structure remains largely unaffected by strain, demonstrating that its axial strain sensitivity is negligible (approximately 0 pm/με) within this range [Fig. 11(b)]. Based on these findings, a sensor matrix can be developed, enabling dual-parameter monitoring of temperature and strain. By tracking both the Bragg reflection wavelength shift of the D-shaped FBG and the fluorescence wavelength drift of indium selenide, the system can effectively distinguish and measure temperature and strain independently, resolving the issue of cross-coupling between the two parameters.ConclusionsIn this paper, we present a composite structure combining indium selenide and a D-shaped FBG, fabricated using PMDS-assisted transfer and femtosecond laser point-by-point inscription. This structure leverages the fluorescence properties of the two-dimensional material and the temperature and strain response characteristics of the D-shaped FBG, enabling simultaneous detection of both parameters. Experimental results demonstrate that the composite structure achieves a temperature sensitivity of 207.4 pm/℃ and a strain sensitivity of 1.28 pm/με. Future work will focus on the packaging and material protection of the composite structure to expand the temperature detection range of the indium selenide fluorescence signal. The proposed composite structure effectively resolves the cross-sensitivity issues between temperature and strain commonly encountered in traditional optical fiber sensors. Compared to conventional devices, it offers superior sensing performance and shows promising potential for practical engineering applications.
Apr. 27, 2025Vol. 45 Issue 8 0806004 (2025)
Xinkang Song, Xiang Wang, Xin Li, Shanghong Zhao, Xiwen Zhang, and Haotong Fu
ObjectiveUnmanned aerial vehicle (UAV) radio frequency (RF) communication is vulnerable to attacks such as interference and eavesdropping due to its open channel and broadcast nature, which poses significant threats to communication reliability and security. The introduction of artificial interference can conceal communication activity by confusing malicious users on the legitimate communication process, thus ensuring communication security. However, both artificial interference and legitimate signals operate within the RF band, which can reduce the communication rate of legitimate signals. Free-space optical (FSO) communication offers high transmission rates, resistance to RF interference, and greater security against eavesdropping. However, it requires precise alignment and is sensitive to channel conditions. We propose a UAV covert communication strategy based on a hybrid RF/FSO link, where FSO is used to compensate for RF communication to mitigate the self-interference effects of artificial interference on RF signals.MethodsUnder the condition that the hostile user implements communication monitoring, we focus on the UAV relay communication scenario, specifically by adding a relay UAV to assist the reconnaissance UAV in realizing information transmission to the ground receiving station. Communication between the UAVs is realized through RF and FSO links, with the relay UAV generating artificial interference to enable covert communication. The maximum ratio combination (MRC) scheme is adopted to process the received RF/FSO signals. The information is transmitted to the receiving station over the RF link using the decode-and-forward protocol. In this paper, we first derive the minimum total detection error probability of the hostile user, then construct an optimization model with covert communication requirements, transmit power, and deployment location as constraints, and link transmission rate as the objective. An iterative solution algorithm based on block coordinate descent (BCD) and successive convex approximation (SCA) is proposed to obtain a suboptimal solution through the joint optimization of UAV relay deployment location, interference, and RF/FSO transmit power.Results and DiscussionsWith the increase in the covert communication requirement, the transmit power of both RF and FSO signals shows a decreasing trend. However, as the maximum transmit power of the UAV increases, the transmit power of RF and FSO signals shows an increasing trend. The trend in the transmit power of RF signals is mainly affected by the transmit power of artificial interference, and it has a linear relationship with both variables. The transmit power of FSO signals varies with the transmit power of RF signals, which exhibits a linear relationship between the square of FSO transmit power and RF transmit power (Figs. 2 and 3). As the covert communication requirement rises, the transmit power of artificial interference decreases, though its rate of change increases. To satisfy heightened covert communication needs, both the transmit power of artificial interference and RF signals can be appropriately reduced. When the maximum transmit power increases linearly, artificial jamming power also rises linearly, as the fixed demand for covert communication requires only the jamming and RF signals to adjust linearly (Fig. 4). The proposed strategy leverages the fast transmission rate of the FSO signal, which maintains around 4 Mbit/s under various conditions, while the baseline scheme struggles to maintain approximately 0.03 Mbit/s due to interference on the RF link. Furthermore, increasing the maximum transmit power enhances the FSO signal’s transmission rate by allowing a corresponding rise in RF signal power. In contrast, the baseline scheme’s transmission rate remains largely constant due to the linear increase in both interference and RF transmit power (Figs. 5 and 6).ConclusionsWe propose a covert communication strategy for UAV communication based on a hybrid RF/FSO link to achieve both covertness and effectiveness. We construct an optimization model with constraints on covert communication requirements, transmit power, and deployment position while aiming to maximize the link transmission rate. An iterative solution algorithm based on BCD and SCA is introduced for the joint optimization of deployment location, artificial interference, and RF/FSO power. Simulation results indicate that a transmission rate of 4 Mbit/s can be achieved with the hybrid RF/FSO link, which significantly outperforms schemes that rely solely on RF links. Furthermore, increasing the UAV’s maximum transmit power can further enhance the transmission rate. The proposed algorithm reformulates the problem as a convex optimization task, which allows for polynomial-time solutions and convergence to approximate optimal solutions, in contrast to traditional heuristic methods. Future research will focus on the flexible allocation of RF/FSO power under complex channel conditions and on extending RF/FSO cooperative covert communication to multi-user or network scenarios, thereby improving the technology’s adaptability to various communication environments.
Apr. 27, 2025Vol. 45 Issue 8 0806005 (2025)
Yong Chen, Weiwei Zhang, Huanlin Liu, Hao Chen, Dexing Wang, and Jiaxin Liu
ObjectiveVisible light communication (VLC) has emerged as a promising solution for indoor communication due to its high efficiency and low power consumption. However, in practical applications, the uneven distribution of received power in indoor three-dimensional space significantly affects both the system’s communication quality and the fairness of received signals across different heights of receiving planes. This power unevenness can degrade communication performance and negatively affect user experience. Consequently, optimizing the layout of indoor light sources to enhance the uniformity of received power has become a key research area in VLC. We introduce an optimization method for optical power uniformity based on an improved Harris hawk optimization (IHHO) algorithm. The proposed algorithm integrates strategies such as the best point set, adaptive t-distribution perturbation mutation, and dynamic selection probability, combined with a nonlinear escape energy factor to enhance the global search capability during the exploration phase and the local search capability during the exploitation phase. This improves the algorithm’s adaptability, convergence speed, and accuracy. Building upon this, an optimization method is proposed for the LED transmitter light source layout. By simultaneously considering critical variables such as LED light source placement and transmission power, an optimization model is established to maximize coverage and ensure optimal uniformity of received optical power. The proposed algorithm is applied to refine the model further, which improves the uniformity of received optical power and the communication system’s coverage efficiency. This addresses the issue of uneven received power distribution in three-dimensional communication spaces, thereby enhancing signal transmission performance and ensuring fairness for users.MethodsWe propose a method based on the IHHO to optimize the light source layout of the indoor VLC system and improve the uniformity of optical power distribution in the receiving plane. First, an indoor VLC channel model is developed, and the transmission characteristics between the LED light source and the receiver photodiode (PD) are analyzed using the Lambert radiation model. We adjust the light source layout optimization scheme by assessing the effect of different light source configurations on the distribution of received optical power. The IHHO algorithm combines multiple strategies for optimization, with key enhancements including the introduction of an optimized point set strategy to improve the initial population and prevent premature convergence to local optima during initialization; the use of an adaptive t-distribution mutation strategy along with a nonlinear escape energy factor to balance global exploration and local exploitation, thereby improving convergence speed; the incorporation of a dynamic selection probability strategy to mitigate the risk of early convergence to suboptimal solutions. With these improvements, the IHHO algorithm effectively optimizes the light source layout, selects a more suitable LED light source configuration and transmission power scheme, reduces optical power dead zones in the receiving plane of the three-dimensional communication space, ensures a more uniform power distribution, and extends the effective communication coverage range.Results and DiscussionsIn this study, the IHHO algorithm is employed to optimize the light source layout of the indoor VLC system, which leads to a significant improvement in the light power distribution in the receiving plane. In the initial (non-optimized) light source layout (Fig. 6), the receiving plane exhibits noticeable uneven power distribution, with lower received power in the edge regions. This unevenness is primarily due to the distance of the light sources and the effects of light reflection after it passes through the walls [Fig. 6(a)]. Additionally, at a receiving plane height of h=1.5 m, the variation in received power between the center and edge regions is substantial, which results in a marked power difference [Fig. 6(b)]. These uneven distributions negatively affect communication quality and lead to a lack of fairness in user communication. In the optimized LED layout (Fig. 8), the light source placement is optimized across three height planes (upper, middle, and lower) to improve the light power distribution. This optimization significantly enhances the uniformity of received light power throughout the communication space (Fig. 7). At h=0 m, the optimized layout notably improves the power uniformity of the receiving plane, with the received power quality factor rising to 1.82 [Fig. 7(a)]. At h=1.5 m, although there is still a power gap of approximately 5 dBm between the maximum and minimum received power, the overall power distribution is much more uniform compared to the unoptimized layout, and the received power quality factor increases to 1.51 [Fig. 7(b)]. Furthermore, Table 4 compares the system performance indicators before and after optimization, showing that the optimized layout not only enhances the power uniformity of the receiving plane but also increases the LED coverage. The LED coverage before optimization is 55%, while after optimization, it increases to 82% (Table 4).ConclusionsIn this study, we investigate the issue of uneven distribution of received optical power in indoor VLC systems and propose an optimization method for the light source layout based on the IHHO algorithm. The indoor three-dimensional communication space is divided into three planes—upper, middle, and lower, and the overall performance of received optical power at various heights is used as the objective function. An optimization model is established to maximize coverage and achieve uniformity of received optical power. By considering key variables such as the LED light source layout and transmission power, the model is finely optimized using the IHHO algorithm to determine the optimal light source layout. Compared to other traditional intelligent algorithms, the IHHO algorithm demonstrates clear advantages in optimization accuracy, convergence speed, and the ability to avoid local optima. Simulation results demonstrate that optimizing the light source layout with the IHHO algorithm effectively reduces optical power dead zones in the receiving area, improves the uniformity of received optical power distribution within the VLC system, enhances the effective coverage of the communication signal range, and improves communication fairness for indoor users.
Apr. 27, 2025Vol. 45 Issue 8 0806006 (2025)
Maonao Wu, Jianping Li, Jianbo Zhang, and Yuwen Qin
ObjectiveWith the continuous enrichment of mobile services and the explosive growth of internet traffic, the architecture of cloud radio access networks (C-RAN) has garnered significant attention. Mobile fronthaul is a crucial part of the C-RAN architecture. As we step into the sixth generation of mobile communications technology (6G), the fronthaul system is required to support data rates equivalent to the common public radio interface (CPRI) exceeding terabits, along with high-order modulation formats such as 1024 quadrature amplitude modulation (QAM) and above, to meet the demands for large-capacity and high-speed transmission in the 6G era. However, traditional digital radio-over-fiber and analog radio-over-fiber schemes both have shortcomings, and it has been found that they struggle to meet these requirements. In recent years, the widely studied digital-analog radio-over-fiber (DA-RoF) technology has demonstrated a signal to noise ratio (SNR) gain of over 12 dB at the cost of sacrificing half of the spectral efficiency. Meanwhile, due to the cost sensitivity of operators in mobile fronthaul scenarios, intensity-modulation and direct-detection (IM-DD) technology shows great potential because of its cost advantage. Against this background, relying on the DA-RoF system based on IM-DD to balance cost, explore transmission capacity, and optimize fidelity has become a key issue in the mobile fronthaul field. We propose a high-capacity DA-RoF scheme based on space-division multiplexing (SDM). Focusing on the IM-DD system, we adopt an improved modulation factor optimization strategy to achieve an SNR gain exceeding 15 dB, which facilitates the stable transmission of 1024-QAM signals and promotes the development of 6G fronthaul technology.MethodsThe terabit DA-RoF communication system proposed in this work is primarily based on DA-RoF modulation technology and an improved modulation factor optimization strategy, combined with the space-division multiplexing technology of multi-core fiber. At the transmitting end, the 1024-QAM modulated signal generated by the digital signal processing (DSP) module is converted into an orthogonal frequency division multiplexing (OFDM) signal through the inverse fast Fourier transform to simulate the wireless waveform. Then, DA-RoF modulation is applied to divide the wireless waveform into a digital part with probabilistic constellation shaping and an analog part with quantization residual error. Joint optimization is performed on the amplitudes of the digital part, the analog part, and the original wireless waveform to achieve the maximum recovered SNR. At the receiving end, a third-order Volterra equalizer is used to compensate for the link impairments, and finally, the corresponding DA-RoF demodulation and OFDM demodulation are carried out to recover the original signal. The experimental setup uses 10 km of single-mode fiber, 10 km of 7-core fiber, and 1 km of 7-core fiber to explore the effectiveness of the proposed method in different scenarios. Through the experimental implementation, terabit DA-RoF transmission of the 1024-QAM signal has been successfully realized.Results and DiscussionsThe optimization outcome of the modulation factor under a back-to-back configuration is presented in Fig. 5. When considering the 1024-QAM signal with a 2.5% error vector magnitude (EVM) threshold, the received optical power (ROP) sensitivity reaches -11 dBm. Upon transmission through a 10-km single-mode fiber, the recovered SNR of the 1024-QAM signal exceeds 32 dB, which features a symbol rate of 40 GBaud and a CPRI equivalent data rate of 313 Gbit/s, thus fulfilling the 1024-QAM transmission criteria, as illustrated in Fig. 6(b). Fig. 6(c) depicts the variation in SNR corresponding to different symbol rates. Evidently, as the symbol rate rises, the in-band noise increases, causing the recovered SNR to correspondingly diminish. After the 30 GBaud 1024-QAM signal is transmitted over a 10-km 7-core fiber, the average recovered SNR of the signals across all cores is measured at 33.54 dB. This indicates that the proposed scheme attains an SNR gain exceeding 15 dB and accomplishes a CPRI equivalent rate-distance product of 16.4 Tbit/(s·km-1) (Fig. 8). Moreover, the 60 GBaud 1024-QAM signal has been successfully transmitted over a 1 km 7-core fiber, achieving a CPRI equivalent data rate of 3.28 Tbit/s (Fig. 10).ConclusionsWe propose and experimentally demonstrate a large-capacity, high-fidelity mobile fronthaul transmission scheme utilizing a C-band IM-DD configuration. By employing DA-RoF modulation technology and jointly optimizing the modulation factors, an SNR gain of over 15 dB is achieved, which enables the successful transmission of 1024-QAM signals. The system capacity is significantly enhanced through the use of SDM technology with 7-core fibers. Specifically, the experiment shows the transmission of 1024-QAM signals with a symbol rate of 30 GBaud over 10 km of 7-core fiber, achieving a record 16.4 Tbit/(s·km-1) CPRI equivalent rate-distance product. Additionally, the transmission of 1024-QAM signals with a symbol rate of 60 GBaud over 1 km of 7-core fiber is also demonstrated, achieving a record 3.28 Tbit/s CPRI equivalent data rate. These experimental results indicate that the proposed IM-DD DA-RoF scheme offers a promising large-capacity, high-fidelity, and cost-effective solution for future beyond 5G/6G mobile fronthaul scenarios.
Apr. 15, 2025Vol. 45 Issue 8 0806007 (2025)
Yu Shen, Jiaying Liu, Jiarong Yan, Ruoxuan Wang, Yukun Ma, Jiangcheng Li, Shan Bai, Ziyi Wei, Yangyang Li, and Zhenkai Qiang
ObjectiveMedical image fusion is a crucial technology for assisting doctors in making accurate diagnoses. However, existing medical image fusion techniques suffer from issues such as blurred lesion boundaries, loss of detailed information, and high texture similarity between normal tissues and lesion regions. To address these problems, we propose a dual-branch multimodal medical image fusion method based on the collaboration of local and global information. This method not only reduces the loss of detailed information but also effectively improves the clarity and accuracy of the fused images, which ensures more precise identification of lesion regions, thereby providing more reliable and accurate support for medical image diagnosis.MethodsWe propose a dual-branch multimodal medical image fusion model based on the collaboration of local and global information. Firstly, the model utilizes a multi-scale depth-separable convolutional network to extract feature information with different receptive fields from the input images. Subsequently, the extracted features are fed into a dual-branch structure, which mainly consists of two modules: the deep local feature enhancement module and the global information extraction module. The local feature enhancement module focuses on enhancing image details, especially those in the lesion areas, to improve the clarity of these regions. The global information extraction module, on the other hand, emphasizes capturing the global structural context of the input images, which ensures the overall consistency of the images and the integrity of their organizational structures during the fusion process. To further optimize the feature fusion process, we introduce two advanced fusion units: the Multidimensional Joint Local Fusion Unit (MLFU) and the Cross-Global Fusion Unit (CGFU). The MLFU efficiently fuses the local features extracted by the two branches, which ensures that important fine-grained information is retained and enhanced during the fusion process. The CGFU promotes the fusion of global features, which facilitates information sharing and complementarity between different modalities. Finally, a convolutional layer is used to adjust and reconstruct the fused features, and a fused image with richer details and higher clarity is output.Results and DiscussionsThe effectiveness of the proposed model in medical image fusion tasks has been validated through extensive comparison and ablation experiments. The experimental results demonstrate that our model significantly outperforms nine other mainstream methods in several key objective evaluation metrics on the Harvard public medical image dataset. Specifically, our model achieves improvements of 3.14%, 0.95%, 13.66%, 16.81%, and 1.12% in EN, SD, SF, AG, and CC, respectively (Table 4). The model enhances local feature extraction through the deep local feature enhancement module, which accurately captures subtle differences in the input images and significantly improves the clarity of lesion boundaries. Furthermore, to further optimize the fusion results, the model employs different fusion strategies for different feature types, which effectively integrates local features with global information and achieves more efficient information complementarity and collaboration between modalities. As a result, the fused images exhibit richer texture details and clearer structural features, thereby significantly enhancing image readability and diagnostic value (Figs. 6, 7, and 8). Ablation experiments further validate the effectiveness of each module in the model. The results show that removing the deep local feature enhancement module leads to a noticeable decline in lesion boundary clarity and texture detail, particularly in high-contrast lesion areas, where the fusion quality deteriorates. Furthermore, removing the global information fusion module results in a significant loss of global consistency and information complementarity between different modalities, which leads to a fusion result with a lack of necessary global coherence (Figs. 11, 12, and 13).ConclusionsThe algorithm proposed in this paper effectively integrates local and global information, achieving excellent detail preservation and structural representation in medical image fusion tasks. This method not only accurately fuses normal tissue structures to ensure global consistency but also highlights the details of abnormal lesion areas, which improves the visibility and recognizability of lesions. By combining deep local feature extraction with global context information, the algorithm ensures the preservation of local details while effectively enhancing the texture features and boundary clarity of lesions. The fused images exhibit richer texture details and clearer structural features. Experimental results, verified through numerous comparative experiments, demonstrate that this algorithm is effective in improving the diagnostic accuracy of medical images. Compared with other mainstream methods, the proposed algorithm performs outstandingly in multiple key objective evaluation metrics, especially in terms of detail preservation, structural clarity, and lesion prominence.
Apr. 27, 2025Vol. 45 Issue 8 0810001 (2025)
Peng Peng, Yucheng Dong, Jiachun Li, and Yitao Yao
ObjectiveVisibility refers to the maximum horizontal distance at which an individual with normal vision can identify and distinguish an object against the sky background under prevailing weather conditions without external assistance. It is a critical parameter reflecting atmospheric transparency and serves as a key indicator in the transportation sector. Various factors influence visibility, with fog and haze having the most significant influence. In foggy and hazy weather, the fine particles suspended in the air hinder light transmission and absorb light reflected from object surfaces, significantly reducing visibility. On highways, reduced visibility due to fog and haze is a major cause of traffic accidents, posing severe risks to public safety and economic stability. The accurate and efficient acquisition of visibility data is essential for effective traffic management. Therefore, developing a high-precision visibility detection method that provides reliable data support for transportation authorities has become a key research focus in ground-based meteorology. To address this, we propose an advanced visibility detection method based on a depth estimation network and an atmospheric scattering model.MethodsIn this paper, we propose a novel visibility detection method leveraging an encoder-decoder structured depth estimation network. Using highway surveillance videos, the method determines visibility by integrating principles of the atmospheric scattering model to extract atmospheric transmission coefficients and scene depth information. First, the K-means clustering algorithm is applied to segment video frames into foggy and visible road regions, enabling the identification of the maximum scene depth area of the road. Next, the dark channel prior algorithm is enhanced using a regional entropy method to refine the selection of atmospheric light intensity, ensuring a more precise estimation of atmospheric transmission coefficients. Subsequently, an encoder-decoder-based depth estimation network extracts depth information from the images. Finally, visibility is calculated based on the atmospheric scattering physical model.Results and DiscussionsThe depth information obtained using the DenseNet-169 network is compared with that derived from five other depth estimation networks: BTS, LapDepth, MonoDepth, CADepth, and Lite-Mono (Table 1). The results show that DenseNet-169 outperforms these models in terms of root mean square error (RMSE), absolute relative error (AR), and accuracy. This demonstrates that the depth information generated by DenseNet-169 is highly precise and effectively supports visibility estimation. To further enhance network performance, four attention modules—coordinate attention (CA), convolutional block attention module (CBAM), separable self-attention (SSA), and efficient channel attention (ECA)—are integrated into DenseNet-169 and compared against the original network without attention modules (Table 2). Among these, the integration of the CBAM module achieves the best performance, yielding the lowest RMSE and AR values while attaining the highest accuracy at a threshold of 1.252. As a result, we adopt the Dense+CBAM encoder-decoder network for depth estimation. Experimental data are collected from surveillance video recorded on November 24, 2024, between 14:25 and 15:15. A sample video frame is shown in Fig. 11, while Table 4 and Fig. 12 present visibility detection results and error variations across different timestamps. The proposed method’s visibility estimation results are compared with those of a visibility monitoring device and four alternative networks. The findings indicate that the proposed method closely aligns with the monitoring device, with only minor deviation observed at 15:00. Overall, the proposed method demonstrates high accuracy in both short-range and long-range visibility estimation, achieving an accuracy rate of 89.83% and an average error of approximately 73 m. Furthermore, the method exhibits strong generalization capabilities, highlighting its reliability and precision in visibility measurement.ConclusionsWe propose a novel visibility detection method based on an encoder-decoder depth estimation network and an atmospheric scattering model. This method employs the atmospheric scattering physical model as its theoretical foundation to calculate visibility by deriving atmospheric transmittance coefficients and scene depth information from images. To enhance accuracy, a regional entropy method is introduced to refine atmospheric light intensity estimation, leveraging stable gray-level variations in foggy regions. Image segmentation techniques are applied to locate the boundary between visible road surfaces and foggy sky regions, focusing on pixel information within the target area to minimize the interference from irrelevant features. In the depth estimation network, the encoder-decoder structure of DenseNet-169 is optimized by incorporating the Dense Block-B module, which suppresses redundant features in the input and enhances feature extraction efficiency. In addition, to mitigate interference from the original image background, the CBAM is embedded in the encoder’s convolutional module, improving road surface feature extraction while reducing the influence of irrelevant features. Experimental results demonstrate that, compared to existing methods, the proposed approach achieves higher accuracy in both long-range and short-range visibility estimation, with an accuracy rate of 89.83%, reduced overall error, and enhanced generalization capability. This method enables efficient and precise visibility measurement, providing reliable data support for traffic management.
Apr. 25, 2025Vol. 45 Issue 8 0810002 (2025)
Yi Zhang, and Da Mu
ObjectiveAugmented reality (AR) helmet-mounted displays (HMDs) hold significant promise for applications in education, healthcare, industry, and military fields, emerging as a crucial platform for next-generation human-computer interaction. The design and optimization of optical systems are critical for enhancing AR-HMD performance. Traditional optical design methods primarily involve identifying initial structures from patent literature and subsequent optimization, which not only demand substantial human resources but also rely heavily on designers’ personal experience. This makes it challenging to meet the rapid development needs of AR technology. Given the successful application of deep learning technology across various fields, integrating it into optical system design has become increasingly feasible. In this paper, we propose a design method combining optical simulation software with deep learning, aiming to automate the construction of AR optical systems, thus improving design efficiency and reducing reliance on designer experience.MethodsIn this paper, we utilize xy polynomial freeform surfaces based on quadric surfaces to design an optical structure that combines freeform prisms and compensation prisms. This structure integrates the display light path (one total internal reflection, one reflection, and two transmissions) with the real-world light path. For dataset acquisition, initial structures are created via Python-Zemax software interaction, with half-XFOV (Fhalf?X), half-YFOV (Fhalf?Y), and F-number (F) as key input parameters, with their respective ranges determined. Several base systems with good imaging performance and reasonable optical structure are obtained by optimizing the prism structures’ edges and total internal reflection. Based on these base systems, system samples covering the entire input parameter range are generated through gradual parameter variation (step size 0.2). The system performance is evaluated using merit function results and the root-mean-square (RMS) radius of each field. Finally, samples with optical structure errors are filtered out, leaving only those that meet imaging quality requirements (Fig. 3). The deep neural network training employs a multi-layer perceptron (MLP) structure (Fig. 4). The input layer consists of three features (Fhalf?X, Fhalf?Y, F), while the output layer includes the optical system’s structural parameters (radius of curvature, thickness, conic value, decentration, tilt degree, and freeform surface coefficients). The network comprises four hidden layers, uses a tanh activation function, and employs the MSELoss function and Adam optimizer for training. System verification is carried out by using the trained model to predict optical system structures, importing the predicted results into Zemax for optimization, and validating the design results through RMS radius evaluation of system performance.Results and DiscussionsAfter 80000 training iterations, the loss function decreases to 0.995 and stabilizes (Fig. 5). System performance testing with 100 randomly generated parameter combinations (Fhalf?X, Fhalf?Y, F) shows that 91 systems have an average RMS spot radius within 0?500 μm, with only 9 systems exceeding 500 μm in RMS radius. Among them, 3 systems have an average RMS spot radius approaching 2000 μm due to excessive position parameters (Fig. 6). Although these 91 systems may not directly qualify, they can be used as is or further optimized to improve the optical system structure. For example, with Fhalf?X=20, Fhalf?Y=15, and F=4, model prediction and post-optimization results are obtained (Fig. 7). After Zemax optimization, the system’s average RMS radius decreases from 30.34 to 22.67 μm, which is less than 1 arc minute after unit conversion, meeting human eye’s imaging standards (Figs. 8 and 9). Regarding modulation transfer function (MTF) performance, most fields maintain sagittal and meridional MTF values above 0.2 at 30 lp/mm spatial frequency (Fig. 10). The maximum grid distortion in the AR optical system’s perspective light path is controlled within 3.4%, meeting the human visual system’s tolerance for distortion (Fig. 12). The final AR optical system’s three-dimensional diagram is shown after adding the compensating prism (Fig. 11), and the overall performance of the final design meets AR display optical requirements.ConclusionsThe design method proposed in this paper combines optical simulation software with deep learning technology, enabling rapid generation of freeform prism optical structures within required spaces, followed by further optimization to enhance system image quality. This method significantly improves the design efficiency of freeform systems and reduces dependence on designer experience. The feasibility of the method is verified using 100 randomly generated parameter combinations (Fhalf?X, Fhalf?Y, F), as well as a specific case with Fhalf?X=20, Fhalf?Y=15, F=4, where the image quality meets human eye requirements. The method provides new insights into the rapid design and development of AR glasses optical systems. In addition, it can be effectively applied to other optical systems featuring freeform surfaces, offering vital technical support for AR-HMD applications in education, healthcare, industry, and military fields. The success of this method opens new possibilities for automated optical design in related fields such as virtual reality systems and advanced imaging devices. Its adaptability and scalability suggest that it can be extended to address other complex optical design challenges in various industrial and scientific fields. Future work may focus on refining the deep learning model, incorporating additional optical parameters, and exploring more complex optical system configurations to further expand the method’s applicability and effectiveness.
Apr. 16, 2025Vol. 45 Issue 8 0811001 (2025)
Jiaan Xue, Su Qiu, Weiqi Jin, Xia Wang, Lin Luo, and Qiwei Liu
ObjectiveThe division of focal plane polarization camera is a widely used, integrated polarization imaging system. Crosstalk between the pixels of the micro-polarizer array is a unique interference factor in such systems, which introduces errors in the measurement of the target’s polarization information. The value and superposition ratio of the crosstalk light intensity vary with the polarization state of the incident light in the scene. Previous polarization crosstalk models generally regard crosstalk as random temporal noise, which assumes that it is difficult to eliminate the crosstalk effect through pre-calibration methods. A mathematical model describing the relationship between crosstalk and the system’s polarization parameters has not been established or verified. The main solution to restraining the crosstalk effect is typically through the optimization of the polarization imaging system’s structure.MethodsWe consider the factors influencing crosstalk in application and establish a whole-process crosstalk model that includes the parameters of the hardware, crosstalk, and polarization analyzer. The result of crosstalk is regarded as the linear superposition of constant weights of multiple analyzed intensities at different polarization analyzed directions. The intensity response containing crosstalk can still be accurately characterized using the cosine form, which is equivalent to a constant deviation in parameters such as the extinction ratio and analyzed directions, and can be distinguished from the random error caused by temporal noise. Through our experiment correlating the polarization state and crosstalk, we demonstrate the calibrability of the crosstalk-influenced analyzer parameters, the non-correlation of the incident light’s polarization state, and the correctability of the crosstalk deviation. The experiment uses a Sony polarization sensor to sample polarized light emitted from the integrating sphere, which rotates through a full cycle via a motor-driven mechanism, to fit the analyzer parameters and inversely infer the crosstalk coefficient with high precision. The light intensity and degree of polarization correlation experiments are respectively judged by the linear characteristics of the denoised unpolarized-light and pure-polarized-light response, while the angle of polarization correlation experiment is judged by the cosine response characteristics of the full angle of polarization periods.Results and DiscussionsThe simulation shows that the transverse electric (TE) wave transmittance can be ignored, and the diffraction crosstalk distribution only needs to consider the transverse magnetic (TM) wave component in the incident light. Therefore, the crosstalk coefficient can be regarded as constant (Fig. 6). Increasing the exposure time leads to an increase in dark noise and a decrease in the extinction ratio (Figs. 10?12), which highlights the necessity of pre-calibration and denoising to eliminate interference in crosstalk measurement. The simulation shows that crosstalk is independent of the target’s angle of polarization and degree of polarization (Fig. 6). This can be verified by varying the target polarization state and measuring the change in the system extinction ratio coefficient. The average change in the crosstalk coefficient is <0.1% within the measuring range (Figs. 13?15), which proves that no correlation exists.ConclusionsCrosstalk will lead to degradation of the extinction ratio, the deviation in the analyzer polarization angle and non-uniformity of the light intensity response coefficient. However, as long as the crosstalk coefficients do not change during use, the system analysis model remains a simple cosine form with constant coefficients, and this crosstalk effect can be calibrated. The crosstalk coefficient only needs to consider the TM wave diffraction distribution, and the polarization state of the target/scene is not correlated with the crosstalk. The crosstalk coefficient is a function of the effective aperture (working F-number) and pixel position.
Apr. 25, 2025Vol. 45 Issue 8 0811002 (2025)
Shengyao Xu, Zhijie Hu, Yizhong Wu, Feng Huang, and Weijie Chang
ObjectiveTraditional spectral imaging systems, which rely on spatial or temporal scanning, face significant limitations in practical applications, including narrow spectral coverage, low photon throughput due to sequential acquisition, and the unresolved tradeoff between spatial resolution and spectral fidelity. To address these challenges, we propose a metasurface-enabled snapshot compressive spectral imaging system, which fundamentally redefines the system architecture through two key innovations: 1) a spectrally-encoded metasurface array that performs parallel light field manipulation across 28 spectral channels within the visible range (450?650 nm); 2) a physics-informed window channel attention-deep unfolding network (WCA-DUN) that synergizes computational optics with deep learning for real-time hyperspectral cube reconstruction. Compared to existing snapshot spectral imaging systems based on coded apertures or dispersive optical elements, our approach leverages the unique capability of metasurfaces to engineer spectral-spatial responses at subwavelength scales, enabling a compact, lightweight, and integrated spectral imaging system.MethodsIn this paper, we design a snapshot compressive spectral imaging system based on a metasurface array. By leveraging this metasurface array for efficient spectral encoding and integrating the proposed WCA-DUN algorithm, real-time hyperspectral image reconstruction with high spectral resolution can be achieved. For the metasurface design, a randomly generated binary pattern is used to construct a meta-atom library. This approach enriches the meta-atom library while ensuring the minimum feature size, making fabrication easier. Meta-atoms with low correlation are selected using the Pearson correlation coefficient as criteria. For the reconstruction algorithm, we propose the WCA-DUN algorithm, which integrates window segmentation into channel attention, achieving a larger receptive field to capture more global information. In addition, it combines amplitude and phase feature learning of the optical field to suppress artifacts and minimize cross-talk between spectral channels.Results and DiscussionsOur system demonstrates excellent robustness to noise. The reconstruction results of our proposed system decrease by only 0.61 dB in PSNR under Gaussian noise, while the results of other existing systems (GAP-TV, ADMM-net, and PnP) decrease by 4.58, 0.56, and 9.1 dB, respectively. Moreover, our system achieves a significantly faster reconstruction speed. Compared to systems using traditional iterative algorithms, our proposed system improves the reconstruction speed by three orders of magnitude. In addition, our algorithm ensures both high reconstruction speed and spectral reconstruction accuracy, outperforming depth-unfolding-network-based algorithms. Specifically, a reconstruction rate of 30 Hz can be achieved with a spectral resolution of 1 nm.ConclusionsIn summary, we propose a novel snapshot-based compressive spectral imaging system based on a metasurface array, enabling real-time hyperspectral image reconstruction with high spectral resolution. By leveraging the unique capabilities of metasurfaces to manipulate light at subwavelength scales, the designed metasurface array facilitates the development of a compact, lightweight, and high-performance spectral camera with superior spatiotemporal resolution. To achieve real-time and high-fidelity hyperspectral reconstruction, we introduce WCA-DUN, a deep unfolding network framework that synergistically integrates computational optics with deep learning. This advanced approach not only enhances reconstruction accuracy but also significantly improves processing efficiency, making real-time applications feasible. The proposed system provides a groundbreaking solution to the long-standing tradeoff between spatial, temporal, and spectral resolutions in spectral imaging. By overcoming the fundamental limitations of traditional systems, it enables broader spectral coverage, higher photon throughput, and superior resolution without the need for bulky optical components or mechanical scanning. While our current implementation focuses on the visible range, the system architecture and design methodology can be easily extended to other spectral regions, including the near-infrared and terahertz ranges. This adaptability makes it a promising candidate for a wide range of applications, such as aerospace exploration, remote sensing, biomedical imaging, and machine vision, where compact and high-resolution spectral imaging is crucial. We believe that this innovation will pave the way for the next generation of spectral imaging technologies, driving advancements across multiple scientific and industrial fields.
Apr. 27, 2025Vol. 45 Issue 8 0811003 (2025)
Suqin Nan, Yang Guo, Shuming Jiao, Zhibing Zhang, Xuanpengfan Zou, Lin Luo, Wei Tan, Xianwei Huang, Yanfeng Bai, and Xiquan Fu
ObjectiveIn recent years, the demand for efficient and accurate object localization technology has been increasing with the rapid development of computer vision, radar detection, and biomedicine. Traditional object localization technology mainly depends on image acquisition, typically adopting the ‘image first, localization later’ method, combined with object localization algorithms for positioning. However, image-dependent object localization is often limited by the resolution of image reconstruction. Due to the complexity of the object, scene, and environmental uncertainties, existing object localization technology faces many challenges, such as severe occlusion, blurring, changes in illumination, and distance variations, which may lead to object loss. Additionally, geometric deformation and attitude changes may result in positioning failures, thus reducing localization accuracy. In contrast, single-pixel detection technology shows unique advantages in object localization, especially in low-light detection environments, with strong robustness and anti-interference capabilities. Furthermore, most existing research on single-pixel, image-free detection in complex scenes focuses on known object information, which improves object localization performance in complex environments through algorithmic enhancements. However, there are relatively few studies on image-free target localization for unknown object information. Therefore, we aim to propose a single-pixel, image-free object localization method that works with unknown scene information. This method can effectively protect image privacy, save storage space, and provide a new approach for object localization.MethodsWe propose a single-pixel, image-free object localization strategy based on global search (SPIF-GSOL) for single-pixel imaging. We use an improved genetic algorithm to perform a global search when the object information is unknown. The template projection position is updated through continuous feedback iterations, and the optimized reference point coordinates are obtained. The template and the pure white pattern are projected onto the coordinate point, and the R-value is calculated at this stage. This process is repeated to obtain a continuously optimized population, and the projection position is updated iteratively. The method checks whether the number of iterations meets the termination condition. If the termination condition is satisfied, the highest R-value and the corresponding coordinate point position after convergence are output. If the termination condition is not satisfied, the global search is performed based on the fitness value, and the matching position is continuously updated until the iteration count is met, which ultimately achieves image-free object localization.Results and Discussions The results show that1) The method proposed in this paper can still achieve accurate positioning in the case of complex scene interference. As shown in Figs. 9?11 and Fig. 13, the method can accurately locate the object when the template position changes, its size changes, its attitude changes, or there is occlusion. 2) The proposed method (SPIF-GSOL) is compared with traditional ghost imaging (GI) localization, differential ghost imaging (DGI) localization, normalized ghost imaging (NGI) localization, and compressed sensing ghost imaging (CSGI) localization. Fig. 13(a) presents the time consumption curves for different projection times, while Fig. 13(b) shows the localization accuracy curves for the same projection times. The results reveal that the proposed method consumes the least time and achieves the highest accuracy compared to the “image first-localization later” method. 3) Compared to 74529 iterations without using the genetic algorithm, the number of iterations for our method is reduced to 5000, which represents a 93.29% reduction. This fully demonstrates that the single-pixel image-free object localization using this method effectively reduces the number of projections and avoids the problem of increasing projections with the growth of image size. 4) Compared with different fitness functions, the proposed method achieves the lowest mean absolute error (MAE).ConclusionsIn our study, we do not need to load a fixed projection sequence. We calculate the fitness value based on the received single-pixel value and use an improved genetic algorithm to continuously update the template pattern projection position during the feedback iteration process. Simulated and experimental results show that, when the object scene information is unknown, the proposed method does not require imaging to accurately localize the object in complex scenes, while also effectively protecting image privacy. The genetic algorithm also reduces the number of projections and improves the efficiency of object localization. Furthermore, the proposed method exhibits certain anti-interference characteristics for object scaling, rotation, and offset in complex scenes. Compared to other algorithms, our method achieves higher localization accuracy.
Apr. 14, 2025Vol. 45 Issue 8 0811004 (2025)
Shucheng Xu, Qun Yuan, Xiaoxin Fan, Jiale Zhang, Yicen Ma, Chen Ding, Zhenyan Guo, and Zhishan Gao
ObjectiveWhite light interferometers are typically equipped with interference microscopes of various magnifications to meet the topography measurement needs for different scenarios. Low-magnification interferometric microscopes have a large field of view and a small numerical aperture (NA), enabling them to capture low-frequency information from the sample’s surface topography and measure macro-scale structures. High-magnification interference microscopes have a small field of view but a large NA, providing higher lateral resolution and a higher cutoff frequency. These are ideal for detecting microscopic topography parameters with high-frequency features in fine structures. Compared to low-magnification interference microscopes, the larger NA allows for the collection of returning light beams at steeper angles, facilitating the detection of sharper slopes and providing more accurate surface topography measurements for curved samples. To simultaneously characterize both the micro-topography features and macro-scale features in the measured topography data, the conventional method involves performing a stitching scan across the lateral range using a high-magnification interference microscope and then fusing multiple sets of measurement data. However, fine microstructures are not evenly distributed across the sample surface, and there are regions with low-frequency features between microstructures that do not require high-resolution detection. Including these low-frequency regions in the stitching and fusion process can reduce detection efficiency. To mitigate this, a more efficient approach can be adopted by considering the characteristics of various magnifications of interference microscopes in white light interferometers. This approach involves conducting targeted detection of local areas that reflect micro-topography features, while simultaneously meeting the requirement to capture macro-scale features. The fusion of macro-scale and micro-topography features into a single dataset helps improve efficiency.MethodsThe multi-magnification data fusion technology of white light interferometers integrates topography data from different magnification interference microscopes into a unified dataset, thus enhancing the comprehensiveness of topographic feature parameters in the fused data. In this paper, we introduce two techniques, surface fitting and wavelet decomposition fusion. After evaluating the advantages and disadvantages of these methods, we propose a strategy for fusing topography data from various magnification interference microscopes in white light microscopy interferometry based on frequency filtering. The process begins with normalized cross-correlation (NCC) and normalized iterative closest point (NICP) to achieve sub-pixel level registration of the data sets. During the subsequent data fusion stage, based on multi-porous wavelet decomposition, we analyze the cut-off frequency for each magnification microscope, which provides theoretical support for wavelet decomposition and fusion strategies. This ultimately results in a more comprehensive data fusion approach.Results and DiscussionsOur fusion method fully leverages the advantages of the low-magnification interference microscope’s large field of view and the high NA and resolution of the high-magnification interference microscope. We apply this method in fusion experiments for topography data from various surface structures. The first sample surface contains multiple convex arrays. By retaining the periodic information in the data measured by the low NA interference microscope, the curvature feature parameters are refined using high NA interference microscope data through fusion. As a result, the relative errors for the period and curvature radius of the subunits in the final fused data decrease by 1.34 percentage points and 6.00 percentage points, respectively. The second sample is a step-type structure with multiple cylinders arranged on the surface according to a specific pattern. The low-magnification interference microscope can measure the overall periodic arrangement of the structure. After fusing the high-resolution data from the step structure measured by the high-magnification interference microscope, various topography feature parameters can be simultaneously characterized. In the final fusion result, the relative error compared to the scanning electron microscope (SEM) measurement data is 0.419%.ConclusionsIn this paper, we propose a fusion method that decomposes topography data from various magnification interference microscopes, fuses the sub-data with the same frequency components, and retains the feature information from each dataset. The experiment, which includes two samples with different features, demonstrates how the proposed fusion method can extend the slope measurement range of the low-magnification interference microscope, reduce measurements, and improve the efficiency of the white light interferometer in analyzing both macro- and micro-topography feature parameters simultaneously. The broad applicability of this fusion method for handling various feature samples has been validated, further enhancing the functionality of white light interferometers. The multi-magnification fusion strategy proposed in this paper can be applied not only in white light interferometers but also to topography data obtained from various detection methods. It offers an effective data processing and characterization solution for instruments that integrate multiple measurement technologies, thus enhancing their capabilities.
Apr. 15, 2025Vol. 45 Issue 8 0812001 (2025)
Yanghao Chu, Feng Ji, Mengfan Li, Yadong Hu, Zhenwei Qiu, Jingjing Shi, Xiangjing Wang, Tao Wang, Gaojun Chi, Benyong Yang, and Jin Hong
ObjectiveWe aim to analyze and correct stray light in spectrally modulated polarization spectrometers to enhance their measurement accuracy. Spectrally modulated polarization spectrometers are advanced instruments designed to perform high-precision measurements of continuous spectral radiation and polarization characteristics. These instruments are widely used in various scientific and industrial applications where accurate radiation and polarization measurements are crucial. However, stray light presents a significant challenge, as it can cause errors that compromise the overall precision and reliability of the instrument. Stray light occurs when light outside the desired optical path reaches the detector, causing unwanted signals that interfere with the measurements. Thus, it is critical to address stray light through systematic analysis, measurement, and correction methods. We investigate the effect of stray light on radiation and polarization measurement accuracy. In addition, a novel correction method is proposed to minimize stray light effects. The correction method involves three-dimensional adjustment of the field of view, polarization angle, and wavelength to create a stray light distribution matrix. The application of this matrix can significantly reduce stray light’s influence during actual measurements. Furthermore, a stray light quantification testing system based on linearly polarized monochromatic parallel light is designed for experimental validation of the correction method, which enables precise calibration of the spectrometer.MethodsTo begin, we construct a model of the spectrometer using LightTools, based on both measured data and the information available in the product manuals. The model is used to simulate the distribution of stray light paths within the instrument. During the simulation, several critical components of the spectrometer are considered, including the spectral modulation module, the telescope module, filters, the spectrometer itself, the protective window, and the detector. These components are crucial to understanding how stray light propagates through the system and affects the final measurements. The simulation results provide valuable insights into the distribution characteristics of stray light, forming the basis for the subsequent correction methodology. Next, stray light coefficients are determined through black tape method experiments. This experimental approach involves two distinct types of measurements. In the first experiment, black velvet is placed at the opening of an integrating sphere to measure the stray light coefficient in the spatial dimension of the instrument. The integrating sphere helps quantify the stray light coming from unintended directions, which is essential for understanding its effect on the measurements. The second experiment involves using a notch filter placed at the front of the optical system, which allows for the measurement of stray light in the spectral dimension. The notch filter works by selectively blocking certain wavelengths of light, thereby isolating and measuring the stray light that affects the spectrometer’s spectral measurements. These two experiments provide quantitative data on the stray light’s effect in both spatial and spectral dimensions, thus contributing to a deeper understanding of its overall effect on the instrument’s accuracy. Finally, based on the simulation results and experimental data, we introduce a new correction method involving three-dimensional adjustments of the field of view, polarization angle, and wavelength. This method is designed to generate a stray light distribution matrix, which could be applied during actual measurements to correct for the influence of stray light. By adjusting these three parameters, the stray light distribution matrix accounts for variations in the optical system’s configuration, thereby offering a flexible approach to stray light correction. To test and implement this correction method, we design a stray light distribution matrix testing system based on linearly polarized monochromatic parallel light. This system allows for precise measurements of stray light distribution and facilitates the validation of the correction method.Results and DiscussionsThe simulation of stray light paths in the spectrometer is conducted by adjusting various parameters in LightTools [Fig. 3(a)]. Simultaneously, a measured image is obtained with a 3° field of view and a full-wavelength, unpolarized light source [Fig. 3(b)]. The comparison between the simulated image and the measured image reveals a high degree of similarity, which confirms the accuracy of the simulation model and validates its use for constructing the stray light mathematical model. This comparison is crucial for establishing the reliability of the simulation results and ensuring the validity of the stray light distribution characteristics identified through the model. Next, the black tape method experiments provide stray light coefficients for both the spatial and spectral dimensions of the instrument. The stray light coefficients for the spatial dimension are obtained (Fig. 5), and the coefficients for the spectral dimension are also determined (Fig. 7). These experimental results provide quantitative data on the levels of stray light affecting the instrument, offering insights into the magnitude of the stray light issue. Such measurements are essential for understanding how stray light interacts with the instrument and influences the accuracy of measurements. The experimental results demonstrate that the proposed three-dimensional adjustment method (incorporating the field of view, polarization angle, and wavelength) is highly effective in reducing stray light. Specifically, the method can eliminate more than 86.6% of stray light (Fig. 13). This significant reduction in stray light is shown to enhance the accuracy of radiation intensity and polarization measurements (Figs. 14 and 15).ConclusionsWe address the problem of stray light in spectrally modulated polarization spectrometers by utilizing the principles of spectral modulation to analyze the distribution of stray light and quantify its effects on measurement accuracy. Through a combination of simulation and experimental methods, we successfully demonstrate the necessity of correcting stray light in these instruments. The new correction method, based on three-dimensional adjustments of the field of view, polarization angle, and wavelength, is shown to be highly effective in minimizing the impact of stray light. By employing a linearly polarized monochromatic parallel light scanning experimental setup, we also develop a testing system for measuring the stray light distribution matrix. This system enables precise calibration and further validates the correction method. The experimental results confirm that the proposed correction technique could effectively reduce stray light by over 86.6%, which leads to significant improvements in radiation and polarization measurement accuracy. This work provides valuable theoretical insights and technical support for addressing stray light in spectrally modulated polarization spectrometers, contributing to the enhancement of their performance. By reducing stray light, we overcome a long-standing challenge in optical instrumentation, thus offering a promising solution for improving the precision of these advanced instruments.
Apr. 16, 2025Vol. 45 Issue 8 0812002 (2025)
Xinchen Jiang, Peng Hong, Chunyu Huang, Yanqing Lu, and Junlong Kou
ObjectiveAs one type of non-diffracting beam, the Bessel beam can be applied in areas such as super-resolution microscopy, optical trapping, and metrology. Moreover, the infinite orthogonal modes of the Bessel beam make it a promising candidate for future high-capacity optical communication and quantum information processing. Therefore, researchers have made great efforts to develop on-chip vortex beam emitters, where the orbital quantum number can be introduced as a new degree of freedom for information transmission. The quality of the emitters can be assessed by factors such as mode purity, efficiency, high-order mode realization, bandwidth, and integrability. Among the previous works on on-chip vortex beam emitters, waveguide structures have difficulty producing high-order vortex beams, thus limiting the development of high-capacity orbital angular momentum (OAM) communication. Vortex beams generated by resonators typically exhibit high purity and efficiency, while their narrow bandwidths make it challenging to achieve wavelength and frequency division multiplexing. Additionally, on-chip holographic gratings, affected by diffraction effects, yield vortex beams with lower efficiency. Therefore, challenges persist in generating high-quality on-chip vortex beams. In this work, we propose an inverse design of a Bessel-Gaussian beam emitter based on an adjoint optimization method. After hundreds of iterations, we obtain the optimized structure with outstanding performance, which is confirmed through finite difference time domain (FDTD) simulations. The final on-chip emitter achieves a correlation of over 86% at a communication wavelength of 1550 nm. In addition, we analyze the stability of the on-chip emitter under fabrication errors, including over-etching, under-etching, and variations in the operating wavelength. This proposed on-chip emitter is expected to play an important role in optical communication and optical computing.MethodsThe design is conducted on a Silicon on Insulator (SOI) platform (Fig. 1), which takes advantage of the higher refractive index contrast of SOI for compact device dimensions and stable mode propagation. The structure consists of a pair of SOI waveguides and a square area of 5 μm×5 μm for inverse design, denoted by dashed lines. This design area includes two materials: silicon and silica. The operating wavelength is set to 1550 nm, and a second-order Bessel-Gaussian beam with a waist of 1.5 μm and a transverse wave number of 4×10⁴ rad/m is chosen as the emitted light. The waveguide’s cross-section has a width of 0.5 μm and a height of 0.22 μm. These parameters ensure that the waveguides can only support the fundamental transverse electric mode, namely TE0 mode, thereby preventing interference from other modes. Next, we describe the process of generating the Bessel-Gaussian beam. The second-order Bessel-Gaussian beam is used as the source incident in the design area, and the interaction between light and materials in the design area causes the beam to couple from free space to the waveguides. The desired result is a total transformation of the Bessel-Gaussian beam into the fundamental TE mode. Two monitors are placed on the cross-sections of the two waveguides, respectively, which are used to calculate the transmittance of the fundamental TE mode. The figure of merit (FOM) in the optimization algorithm of inverse design is set as the sum of the normalized transmittance of the fundamental TE mode in both waveguides. Thus, the optimization target is to maximize FOM, with the FOM close to 1 indicating a high conversion efficiency from the Bessel-Gaussian beam to the two fundamental TE modes. Considering reciprocity, when we excite the fundamental TE mode simultaneously in both waveguides, the emitter can generate a Bessel-Gaussian beam above the design area. The entire optimization process consists of the following steps (Fig. 2). 1) Determine the initial structure of the design area, which is divided into 41 pixel×41 pixel. Each pixel is a small rectangular dielectric with dimensions of 125 nm in length and width, 220 nm in height. The dielectric constant ε(x′) of each pixel ranges from εSiO2 to εSi. 2) After the forward and adjoint simulation, the FOM will be calculated and the algorithm determines if the target is met. If not, calculate the gradient of the FOM and use the L-BFGSB method, based on the gradient, to update the dielectric constant distribution in the design area for the next iteration. 3) If the target FOM is met or convergence is achieved, discrete dielectric distribution in the design area will be binarized, which results in a region composed solely of silicon and silica. 4) Apply design for manufacturing (DFM) constraints to the optimized structure, removing parts that are smaller than the minimum manufacturable size. 5) Test the stability of this device and export the layout file.Results and DiscussionsAfter 349 iterations, the FOM converges to 0.7, which corresponds to a 70% conversion efficiency from the Bessel-Gaussian beam to the fundamental TE mode of the two waveguides (Fig. 3). To verify whether the structure meets the requirement of emitting a Bessel-Gaussian beam, we perform a normalized overlap integral with the theoretical second-order Bessel-Gaussian beam to calculate the correlation coefficient. The result of the overlap integral between the two electric fields is 0.8649, which demonstrates that after optimization, this beam is highly similar to the second-order Bessel-Gaussian beam (Fig. 3). Additionally, we analyze the effect of etching errors on the performance of the on-chip Bessel-Gaussian beam emitter. We also consider the deviations from the central wavelength, which may affect the propagating mode and the quality of the emitted Bessel-Gaussian beam (Fig. 4). In the cases of over-etching or under-etching, blue or red shifts occur in the correlation peaks, respectively, with the correlation at the central wavelength dropping to around 0.64. Despite the peak shifts, the device under all three etching conditions can maintain a correlation above 0.64 within a bandwidth of 30 nm.ConclusionsVortex beams have become a hot topic in the fields of optical computing and optical communication in recent years. The Bessel-Gaussian beam emitter is expected to emerge as a key research direction in the future, due to its compact size, feasibility for high-order orbital quantum numbers, and large bandwidth. The dual-port Bessel-Gaussian beam emitter proposed in this work leverages the reciprocity characteristics of the device and uses maximum conversion efficiency from the vortex beam to the dual-port TE0 mode as the optimization goal for inverse design, which is innovative. Furthermore, a gradient descent algorithm is employed based on the adjoint method. The advantage of this machine learning algorithm is that the gradient of the FOM can be calculated with just two simulations per iteration, which greatly reduces the time and computing resources required for reverse design. Lastly, the inverse design structure optimized in this work achieves a second-order Bessel-Gaussian beam correlation of over 86%. The correlation of the outgoing beam remains above 0.64, from an under-etching of 7 nm to an over-etching of 9 nm, and is maintained above 0.64 within a 30 nm wavelength bandwidth.
Apr. 27, 2025Vol. 45 Issue 8 0813001 (2025)
Tao Song, Hongyao Tang, Bin Xing, Yichen Yang, Yao Xiao, Shengjie Lei, Jianxu Wang, and Zourong Long
ObjectiveAs a technology that transforms real-world objects or scenes into digital models, three-dimensional (3D) reconstruction plays a crucial role in today’s technological landscape. With the rapid development of computer vision, graphics, machine learning, and related fields, vision-based 3D reconstruction technology has become widely applicable in fields such as artificial intelligence, autonomous driving, robotics, simultaneous localization and mapping (SLAM), and virtual reality, due to its speed and excellent real-time performance. In recent years, many researchers have integrated traditional geometry-based multi-view techniques with deep learning-based 3D reconstruction methods, using neural networks to implicitly represent 3D scenes and combining them with computer graphics to render and complete the scene reconstruction task. However, the 3D reconstruction method using neural radiation field (NeRF) may lead to loss of details and the generation of jagged edges when sampling density is insufficient, resulting in poor image quality. Therefore, it is crucial to develop a reconstruction method that achieves higher quality and stronger anti-aliasing capabilities, allowing for more efficient (faster and higher-quality) scene reconstruction to improve the practical user experience.MethodsTwo public datasets, LLFF and Realistic Synthetic 360°, are used for experimentation. The images are arranged in order, and one out of every seven images is selected as the test data. Five scenes are randomly selected for experiments. The experiments are conducted on the AutoDL AI cloud platform with the following setup: the operating system is Ubuntu 20.04 with a 12-core Xeon? Silver 4214R CPU, two RTX 3080 GPUs, and the Pytorch deep learning framework in a Python 3.10 environment. The parallel computing ability of CUDA 11.5 is utilized to accelerate the algorithm’s execution. The position encoding frequency filter is applied to screen the frequency numbers corresponding to each viewpoint. This process does not affect the model’s inference speed before training. The point cloud prior replaces the coarse sampling layer in NeRF to accelerate the model’s training. During the experimental setup, 128 points are non-uniformly sampled to ensure efficient and accurate scene information capture, with 1024 rays sampled per batch. The mean squared error loss function and Adam optimizer are used, with each scene undergoing 150000 iterations. To rigorously assess the performance of this method in new view reconstruction, three common image quality metrics (PSNR, SSIM, and LPIPS) are used. PSNR evaluates the pixel-level error between the reconstructed image and the original image, with higher values indicating better fidelity in terms of signal purity and noise suppression. SSIM measures structural similarity, with higher values indicating that the reconstructed image better retains the original image’s layout and texture. LPIPS evaluates human perceptual similarity. To assess the effectiveness of the proposed method, ablation experiments are conducted for each module. In experimental group A, only the position encoding frequency filter is used; group B adds the gating channel transformation module to multilayer perceptron (MLP); group C uses only the point cloud prior; and group D combines all three: the position encoding frequency filter, gating channel transformation module, and point cloud prior. To evaluate the anti-aliasing and detail improvements, comparisons are made between the NeRF, MIP-NeRF, and the proposed method. Five scenes from the LLFF and Realistic Synthetic 360° datasets are selected for comparative testing under the same experimental parameters.Results and DiscussionsThe anti-aliasing-high detail (AA-HD) neural radiation field algorithm, based on position-based coded frequency number filter (PE-FNF) and point cloud prior, is shown in Fig. 2. The sparse 3D space points are obtained using the SFM algorithm, leveraging the given images and corresponding poses for each dataset. The geometric center is calculated to fit the center position of the reconstructed object, and the distance between the camera pose and the geometric center is used to estimate the number of position encoding frequency filters. This frequency is then dynamically adjusted to enhance the detailed expression of the sampling points. In addition, the SFM algorithm generates sparse point clouds from the continuous images of the reconstructed object, which serves as the point cloud prior, eliminating the need for rough sampling in NeRF. This accelerates reconstruction while effectively capturing spatial points at different depths. Even with significant changes in viewpoint, the reconstruction remains effective. During the feature reasoning process, a gated channel transformation MLP module is introduced to capture feature information between high-frequency signals. Key high-weight features are finely filtered, further enhancing the details of the reconstructed object. The ablation experiments in Table 1 and Fig. 10 demonstrate the positive effects of each module both quantitatively and qualitatively, with improvements in the three evaluation metrics. In comparative experiments, the proposed algorithm outperforms the original NeRF in terms of detail and anti-aliasing (Figs. 11 and 12). Compared to NeRF and MIP-NeRF, the algorithm achieves the highest average values for PSNR, SSIM, and LPIPS (Tables 2 and 3). In addition, the computational cost of the proposed method is significantly lower than that of both NeRF and MIP-NeRF (Table 4).ConclusionsIn this paper, we propose an optimized version of the original NeRF, improving its sampling, position encoding, and MLP structure. We introduce an AA-HD neural radiation field method, based on PE-FNF and point cloud prior. The detailed representation of the reconstruction target is enhanced using the position encoding frequency filter and the gating channel transformation. The point cloud prior improves the anti-aliasing ability of the method and reduces computational costs. Through ablation experiments, the effectiveness of each module and the overall method are proved. Through comparative experiments, it is proved that, when applied to the Realistic Synthetic 360° and LLFF public datasets, the proposed method outperforms NeRF in new view reconstruction. Specifically, on the Realistic Synthetic 360° dataset, the three image quality metrics (PSNR, SSIM, and LPIPS) improve by 3.77%, 3.01%, and 27.59%, respectively. On the LLFF dataset, the improvements are 16.36%, 10.87%, and 31.33%, respectively, with qualitative results further confirming the effectiveness of the method.
Apr. 27, 2025Vol. 45 Issue 8 0815001 (2025)
Yuanbin Chi, Xiangyin Meng, Shide Xiao, Xiujie Lu, and Shouye Wu
ObjectiveWith the rapid development of micro-electromechanical systems, the internet, and sensor technologies, robotics has advanced significantly and has been widely applied in manufacturing, rescue operations in hazardous environments, and field exploration. For a robot to autonomously navigate in unfamiliar environments, it must recognize its surroundings and determine its position, which enables it to move independently, adapt to complex conditions, and perform diverse tasks. This challenge is commonly addressed by a process known as simultaneous localization and mapping (SLAM). With the deepening research on SLAM problems, the scenarios faced by SLAM algorithm have shifted from structured indoor environments to weakly textured and unstructured complex environments. When faced with challenging complex scenarios, traditional single-sensor SLAM algorithms often suffer from insufficient feature extraction, inter-frame matching errors, and sensor degradation, which leads to reduced localization accuracy, trajectory drift, and inconsistent mapping. To address the aforementioned challenges, we present a multi-sensor SLAM algorithm that fuses lidar, vision, and inertial measurements by integrating both point- and line-feature optical flow tracking. The proposed method aims to improve the localization accuracy and robustness of SLAM algorithms when operating in weakly textured, unstructured environments.MethodsThe proposed algorithm integrates a visual-inertial system (VIS) incorporating line feature optical flow and a LiDAR-inertial system (LIS). In the front end of VIS, the improved ELSED algorithm is employed to extract robust line features from the environment, which enables adaptive parameter adjustment and ensures the uniform distribution of extracted features. Line features are tracked across consecutive frames using the LK optical flow, with image pyramids utilized to enhance the stability of inter-frame tracking for line features. In the backend of the visual system, residuals are computed based on the angular deviation of line feature reprojection, and a sliding-window bundle adjustment (BA) is employed to optimize point and line feature residuals, which achieves feature fusion and estimates the robot’s coarse pose. In LIS, the spatial coordinates of line feature endpoints are obtained through LiDAR point cloud projection, which accelerates the initialization of visual features. Factor graph optimization is applied in the backend to refine the robot’s precise pose by combining residuals from the inertial measurement unit, LiDAR point clouds, and prior information, which help to adjust the coarse pose initially estimated by the VIS algorithm. The two algorithms jointly perform loop closure detection: VIS identifies potential loop closure frames using a bag-of-words model, while LIS retrieves the nearest loop closure candidate frames in terms of Euclidean distance using a KD tree. Candidate frames are refined through scan matching to select the optimal loop closure frames, which are then added to the factor graph as new constraints.Results and DiscussionsThe line feature tracking experiment (Fig. 4) demonstrates that the ELSED+LK strategy extracts and tracks more line feature pairs compared to the LSD+LBD matching strategy. The retained line feature pairs, after edge detection and nearest-neighbor filtering, are sufficient to establish constraints for backend optimization. Moreover, the ELSED+LK strategy requires only approximately 90% of the time consumed by traditional extraction and tracking strategies (Table 1), thus offering superior real-time performance. In the multi-scenario experiments using the M2DGR dataset (Table 3), compared to a single-sensor inertial system, the proposed multi-sensor fusion system exhibits significant advantages. The fusion of OFPL-VIS and LIS improves the system’s localization accuracy. Compared to FAST-LIO2, the proposed algorithm achieves a 41.66% improvement in average localization accuracy without utilizing loop closure detection. Furthermore, the introduction of visual line features enhances the system’s robustness in handling weakly textured and unstructured environments. Compared to the LVI-SAM algorithm, the proposed algorithm improves average localization accuracy by 11.53% and 18.36% in scenarios without and with loop closure, respectively. A real-time performance analysis of the proposed algorithm and LVI-SAM on the same sequence (Table 4) reveals that, although the inclusion of line feature optical flow increases the processing time for visual odometry and backend optimization, the frame rate of the proposed algorithm still exceeds the measurement frequencies of both the camera and LiDAR, meeting real-time requirements.ConclusionsWe propose a multi-sensor fusion SLAM algorithm integrating line feature optical flow, offering a novel solution for autonomous robot localization and mapping in complex environments. The algorithm employs an improved ELSED algorithm and LK optical flow tracking to extract and track more robust line features from the environment, enhancing the visual system’s robustness in weakly textured and unstructured environments. Compared to traditional single-sensor SLAM algorithms, multi-sensor fusion enhances the robot’s environmental perception, ensuring its capability for autonomous navigation and operation across diverse environments. Experiments demonstrate that the multi-sensor SLAM algorithm with integrated line feature optical flow not only extracts and tracks line features at a higher frequency than traditional methods in weakly textured environments but also achieves more accurate localization and mapping in complex scenarios. In conclusion, the proposed algorithm integrates line and point features with LiDAR point clouds, which significantly improves localization accuracy in dynamic scenarios and complex environments. This work establishes a critical technical foundation for the broader application of robots.
Apr. 27, 2025Vol. 45 Issue 8 0815002 (2025)
Farong Kou, Kan Wang, Yajun Zhao, Tianxiang Yang, and Gengyi Lü
ObjectiveIn autonomous driving, accurate perception of the environment is critical for ensuring the safety and efficiency of self-driving vehicles. One of the most significant challenges in this domain is the accurate depth estimation of atypical semantic objects, such as damaged vehicles, trees, or debris that may unexpectedly appear on the road. These objects often have unclear semantics and irregular shapes, which makes it difficult for conventional perception systems to detect and model their 3D occupancy accurately. Traditional 3D perception methods rely on multimodal inputs like images and point clouds to estimate depth and spatial distribution. However, these methods struggle with the complexities introduced by atypical objects, such as sparse depth maps or the need for precise temporal alignment across frames. To address these issues, we propose a novel occupancy network, semantics contour enhanced-forward and backward projection occupancy (SCE-FBOcc) networks, which enhances depth estimation by incorporating contour-aware depth features. By using contour features to clarify the boundaries of atypical semantic objects, we aim to improve occupancy prediction and depth estimation in scenarios where semantics are unclear, thus offering a more robust solution for autonomous driving systems.MethodsTo address the challenges associated with atypical semantic object perception and depth estimation, we propose a novel occupancy model, SCE-FBOcc. The model integrates multiple components designed to enhance the accuracy of depth prediction by leveraging contour-based features. First, the contour-aware depth network (CADN) is introduced to extract image contour features, which provide additional information to assist the model in distinguishing object boundaries that are often unclear or irregular. These contour features are critical in cases where traditional depth estimation methods fail to provide precise boundary definitions, particularly in the context of atypical objects such as damaged vehicles or road debris. By integrating these contour features into the depth estimation process, CADN enables the model to refine and improve its understanding of object contours and enhance depth perception. Subsequently, the contour feature attention module (CFAM) is applied to establish the relationship between the semantic contour features and high-resolution geometric features. This attention-based module selectively focuses on the most relevant contour information, allowing the model to prioritize the most important features for occupancy prediction. By dynamically adjusting attention to contour features, CFAM ensures that the model focuses more on the boundaries and shapes of objects that are crucial for accurate 3D occupancy estimation. This is particularly beneficial in situations where irregular shapes or occlusions obscure the full geometry of objects. Furthermore, the semantic contour assisted learning module (SCALM) is employed to model the associations between semantic categories and geometric contour features. SCALM helps the model suppress irrelevant contour features, which ensures that only the contours related to the semantic categories are extracted. By doing so, SCALM prevents the model from focusing on irrelevant contours, thus enhancing its ability to recognize important geometric features. This module ensures that the model not only aligns with the semantic understanding of objects but also performs well in more complex scenarios involving atypical or occluded objects. By learning the relationships between semantic information and geometric contours, SCALM improves the model’s robustness, enabling it to handle diverse environmental conditions and object types effectively. Together, these components contribute to improved occupancy prediction performance in challenging scenarios, where conventional models might struggle due to unclear semantics or ambiguous boundaries. By incorporating contour features and designing specialized modules that emphasize the importance of both semantic and geometric information, SCE-FBOcc achieves enhanced depth estimation and better 3D occupancy mapping, particularly in environments characterized by complexity and uncertainty.Results and DiscussionsSCE-FBOcc outperforms the baseline by 1.27 percentage points in average accuracy, with notable improvements in obstacles, construction vehicles, and traffic cones, achieving increases of 1.98 percentage points, 2.23 percentage points, and 1.91 percentage points, respectively. This highlights its superior performance in handling atypical semantic objects (Table 1). To assess the effect of contour features, the baseline model struggles with trees, as they are similar to the background. In contrast, SCE-FBOcc effectively distinguishes the foreground from the background, improving depth estimation (Fig. 8). In the case of construction vehicle misclassification, FBOcc misclassifies the vehicle’s tail, while SCE-FBOcc predicts correctly, which showcases the effectiveness of CFAM and SCALM in enhancing semantic understanding (Fig. 9). Ablation results show that performance drops significantly when only CEAM is used, particularly for artificial structures. This suggests that without SCALM’s geometric supervision, contour information extraction is insufficient. Incorporating SCALM improves performance across all categories (Table 2). Regarding inference latency, FPN+CM DepthNet achieves an inference delay of 5.66 ms, while CADN has a higher latency of 12.22 ms. However, by utilizing compute unified device architecture (CUDA) operators to reduce the computational overhead of deformable attention, inference latency is reduced to 9.12 ms. Overall, the inference time of SCE-FBOcc is only 3.4% higher than the baseline model, which demonstrates the efficiency of the proposed model despite its enhanced complexity (Table 3).ConclusionsWe present a 3D perception method that enhances the detection of atypical semantic objects through semantic contour features. The proposed approach improves accuracy in recognizing these objects by addressing issues such as foreground occlusion and incomplete semantic information. Experimental results demonstrate the effectiveness of the (SCALM and the CADN, with the model achieving significant improvements of 0.36% and 1.07% in detection accuracy for atypical categories, respectively. Overall, the model achieves a 1.43% increase in accuracy for atypical semantic categories, thereby validating the importance of contour features in enhancing depth estimation and occupancy tasks. Additionally, it is found that the extraction capability of contour information plays a crucial role in model performance. Future work can focus on improving the semantic understanding of contour extraction, particularly in eliminating irrelevant contours, to further enhance the model’s accuracy and robustness.
Apr. 25, 2025Vol. 45 Issue 8 0815003 (2025)
Xiujian Yang, Jialong Huang, Shengbin Zhang, and Haicheng Xiao
ObjectiveAccurately perceiving drivable surfaces and ground obstacles from 3D LiDAR point clouds is a core task in the environmental perception of autonomous driving systems. Therefore, developing efficient and reliable point cloud segmentation algorithms is of paramount importance. Compared to structured environments, unstructured environments typically exhibit characteristics such as rough terrain and complex, unevenly distributed obstacles. These traits pose significant challenges to most existing point cloud segmentation algorithms, leading to issues such as low accuracy and poor real-time performance, which in turn severely affect the safety of navigation decisions made by autonomous vehicles in complex environments. To address these challenges, we propose a cascaded point cloud segmentation algorithm aimed at enhancing both the accuracy and efficiency of point cloud segmentation and providing reliable support for the safe operation of autonomous vehicles in unstructured environments.MethodsTo address the challenges in real-time performance and accuracy of LiDAR point cloud segmentation algorithms in complex, rugged, and unstructured environments, we propose a cascaded point cloud segmentation algorithm tailored for such environments. The algorithm consists of two main processes: ground point cloud segmentation and above-ground object segmentation. Given the characteristics of unstructured environments, such as complex terrain and unordered obstacle distribution, we first introduce inertial measurement unit (IMU) pre-integration to correct distortions in the LiDAR point clouds. The corrected point clouds are then projected into the dynamic concentric zone model (DCZM), and the principal component analysis (PCA) algorithm is used to classify the point clouds into ground and non-ground points. Based on the spatial distribution characteristics of LiDAR point clouds, a hierarchical clustering algorithm is proposed to segment above-ground objects. For high-density point clouds near the sensor, a 3D voxel clustering algorithm based on spherical coordinates is applied, which fully exploits the spatial continuity of the point cloud data to achieve efficient and accurate clustering. For sparse point clouds at greater distances from the sensor, a point cloud clustering algorithm is utilized based on key eigenvalues and normal vector angle constraints. Compared to traditional clustering algorithms, this method better characterizes the local geometric structure of the point clouds, thus enhancing segmentation performance in sparse regions.Results and DiscussionsIn this study, we select sequences 01 (highway scenario), 09 (rural occlusion scenario), and 10 (undulating terrain scenario) from the Semantic KITTI dataset as experimental data for point cloud segmentation. These sequences reflect the effect of dynamic objects, occlusion, sparsity, and ground undulation on point cloud data in unstructured environments, thereby providing representative scenarios for algorithm validation. To quantitatively evaluate the effectiveness of the proposed algorithm, we use five key metrics for ground point cloud segmentation: precision (P), recall (R), F1 score (F1), accuracy (A), and time (T). For above-ground object segmentation, we use three key metrics: segmentation entropy (SE) and scene accuracy (ACCscene). For ground point cloud segmentation, we conduct both qualitative (Fig. 9) and quantitative (Table 3) comparisons between the proposed algorithm and existing open-source algorithms, including GPF, LineFit, Patchwork, and Patchwork++. The results indicate that the proposed method outperforms the others in overall performance, particularly excelling in time. Compared to Patchwork++, the proposed method reduces time by 11.57 ms, which demonstrates significant improvement in real-time performance. For above-ground object segmentation, we compare the proposed algorithm with existing open-source algorithms, such as CVC, Travel, and Adaptive Clustering, and conduct both qualitative (Fig. 10) and quantitative (Table 4) analyses. The results show that the proposed method outperforms the others in overall performance, especially in terms of scene accuracy and time. Compared to the Travel method, the proposed algorithm improves these two metrics by 23.01% and 14.09 ms, respectively, which indicates its substantial advantage in segmentation accuracy and processing efficiency. To comprehensively evaluate the performance of the algorithm, we also conduct qualitative validation of ground point cloud segmentation (Fig. 11) and above-ground object segmentation (Fig. 12) using an all-terrain unmanned vehicle in a complex forest environment with significant slopes. The experimental results indicate that the proposed method still exhibits considerable advantages over the aforementioned algorithms in complex environments, which further demonstrates its effectiveness and reliability in unstructured environments.ConclusionsWe address the problem of point cloud segmentation in complex and dynamic unstructured environments, proposing a cascaded point cloud segmentation algorithm that processes ground and above-ground object point clouds separately. The algorithm corrects radar point cloud motion distortions through IMU pre-integration and introduces a DCZM for dynamically partitioning radar perception areas. Subsequently, we propose a hierarchical clustering algorithm for above-ground object segmentation, considering factors such as point cloud density, angular resolution, and sparsity, based on the spatial distribution characteristics of 3D point clouds. Experimental results on the Semantic KITTI dataset and all-terrain autonomous vehicle tests demonstrate that the proposed algorithm meets real-time requirements while achieving high segmentation accuracy and robustness, which shows strong practical value. This work focuses on enabling real-time navigation in unknown, unstructured environments by recognizing relevant objects. In the future, the algorithm will be combined with advanced deep learning models to further optimize its segmentation capability in complex scenarios and enhance its practical application value.
Apr. 25, 2025Vol. 45 Issue 8 0815004 (2025)
Zengguang Tang, Yitao Cui, Lei Li, Chenggong Zhang, and Zhenjiang Xing
ObjectiveThe monolithic Wolter mirror is an effective and promising solution for providing stable X-ray micro- and nano-focusing beams for synchrotron radiation or free-electron laser beamlines. In scientific experiments, nanometer-scale X-ray probes play a crucial role in resolving intricate sample features through scanning. The stability of the beam is a critical factor, especially for scanning nanoprobe applications. Wolter optics approximately satisfies Abbe’s sine condition, making it an advanced optical design for X-ray imaging applications, particularly for imaging off-axis object points. Despite their long history, Wolter mirrors have not been widely used in beamlines due to the extremely high surface figure accuracy required. In recent years, improvements in manufacturing processes have made their gradual application in practical X-ray facilities feasible. Currently, few studies focus on design optimization methods for Wolter mirrors under machining capacity constraints. Wave propagation simulation methods are insufficient for guiding the application of Wolter mirrors in X-ray micro- and nano-probes, as they fail to account for aberration effects and coating material reflectivity. Manufacturing these tube-like mirrors with high precision presents significant challenges in metrology and fabrication. To address these challenges, mirror shapes can be optimized during the design phase, taking metrology and fabrication constraints into account.MethodsThe optimization of parameters for Wolter mirrors in X-ray beamlines under machining and experimental constraints is proposed. By incorporating Abbe’s sine condition and considering the relationship between the lengths of ellipsoidal and hyperbolic surfaces, five parameters are selected: working distance, aperture angle, source-to-focus distance, mirror length, and magnification factor. The monolithic and closed Wolter configuration is then determined. The optical performance of the Wolter mirrors, including focused spot size and transmission efficiency, is evaluated through ray-tracing simulations. Working distance and magnification factor are limited by experimental conditions, while practical constraints related to mirror metrology and fabrication, such as mirror length and downstream aperture diameter, also play a role. The highest transmission efficiency is achieved by optimizing the distance between the source and the focus, as well as the aperture angle. The ray-tracing program uses five parameters to establish the Wolter model, as in the design phase. The rotating hyperboloid surface and the rotating ellipsoid surface are integrated into one optical element. The ray-tracing code can track multiple reflections within such a single optical element while adhering to coated material reflectivity, which is useful for investigating alignment errors. The angle and position of each ray obtained through ray tracing are used to calculate the smallest spot size at the focal plane. An ellipsoidal mirror with the same magnification factor as the Wolter mirror is built and the effects of rotational and translational alignment errors on optical performance are compared. By analyzing variations in focused spot size and transmission efficiency, the tolerance limits for alignment errors are determined.Results and DiscussionsThe optimization process for a Wolter mirror with specific constraints such as experimental requirements and fabrication challenges is demonstrated. The designed Wolter mirror achieves the highest transmission efficiency. The results show that when the divergence angle of the light source is large, Wolter mirrors are unsuitable for high-energy X-rays due to their lower transmission efficiency, a disadvantage compared to 1D reflective mirrors. This is primarily due to practical fabrication constraints, such as mirror length and downstream aperture diameter. In the alignment error study, the full width at half maximum (FWHM) of the spot size increases to 120%, and transmission efficiency drops to 80% of the original value as the tolerance limit. The results show that for rotational alignment errors, the tolerance limit of the Wolter mirror is 60 times that of the elliptical mirror with the same magnification factor. The tolerance limit for translational alignment errors in the Wolter mirror is also significantly higher. These results demonstrate that Wolter mirrors have commendable tolerance to fluctuations in beam angle, ensuring stable focused spots. These simulations validate the efficacy and robustness of the designed Wolter mirror and the proposed optimization approach.ConclusionsThe approach that integrates constraints into the optimization framework discussed in this paper enhances the efficiency and reliability of the Wolter mirror design. In addition, the ray-tracing code, based on the XRT program, allows the practical application to beamlines, providing insights into the actual performance of the Wolter optical system and facilitating smoother transitions from concept to implementation. The alignment error tolerance analysis during the design phase assists in designing the control system and developing a compact experimental setup, including both the mirror and sample mounting stages.
Apr. 27, 2025Vol. 45 Issue 8 0822001 (2025)
Chong Wang, Jiashen Zhou, Le He, Depeng Kong, Xingtao Yan, Yantao Xu, and Haitao Guo
ObjectiveThe 3?5 μm mid-infrared spectrum covers the majority of radiation from high-temperature objects and the characteristic spectra of various molecular structures. Thus, mid-infrared spectral detection has crucial applications in fields such as medicine, national security, industry, and environmental monitoring. Mid-infrared coherent fiber bundle (CFB), as devices for delivering mid-infrared images, offer advantages such as light weight, flexibility, and resistance to electromagnetic interference, which makes them suitable for mid-infrared imaging in extreme environments. Currently, the performance testing of mid-infrared CFB remains underdeveloped due to limitations in mid-infrared light sources and testing conditions. This is especially evident in crosstalk rate testing, where controlling the size of the lens’s focal spot is challenging. Temperature resolution testing is influenced by numerous factors and requires strict control of experimental variables to ensure the reliability of the image data. Using As-S glass as the base material, we adjust the ratio of As to S to modify the refractive index of the core and cladding materials to meet the numerical aperture requirements of the imaging system. A stack-and-draw process is employed to fabricate the mid-infrared CFB. A mid-infrared imaging system based on the CFB is constructed, and experiments are conducted to evaluate the CFB’s breakage rate, spatial resolution, crosstalk rate, and temperature resolution.MethodsThe core diameter of the fiber preform is 11 mm, with an internal diameter of 11.6 mm and an external diameter of 14 mm for the cladding. A PEI tube, used as the coating material, has an internal diameter of 14.3 mm and an external diameter of 15.6 mm. Calculations show that for a core diameter of 30 μm, the internal cladding thickness is 3.3 μm, which meets the transmission requirements for the 3?5 μm wavelength range. High-purity S and As elements are utilized to prepare rods (As40S60) and tubes (As38S62). S distilled at 200 ℃ and As sublimed at 350 ℃ are encapsulated in the ampoule and then melted at 750 ℃ for 12 hours to obtain preform glasses. Mid-infrared fibers with a diameter of 280 μm are fabricated using the rod-in-tube method, and their optical loss in the mid-infrared range is tested using the cutoff method. The fibers are then drawn into CFBs via the stack-and-draw process. The theoretical filling factor and the measured filling factor of the CFB are determined using formulaic calculations and image processing techniques, respectively. The average loss of the CFB is also tested following the cutoff method. A 940 nm light source is used to observe the transparency of the CFB through a near-infrared microscope. Spatial resolution is evaluated by imaging a USAF1951 resolution target. The crosstalk rate is tested using a tungsten lamp as the radiation source and a 30 μm aperture created with femtosecond laser machining on aluminum foil, which ensures the light is coupled into the CFB’s core. The crosstalk rate is calculated based on the grayscale distribution captured by a mid-infrared camera. For temperature resolution testing, a heated iron nail is used as the target, and both the mid-infrared imaging system and thermal imager are employed to capture and record the grayscale and temperature distribution. The temperature resolution of the mid-infrared imaging system is calculated, and the effect of incorporating the CFB into the system is analyzed.Results and DiscussionsThe optical loss baseline of the 280 μm fiber in the mid-infrared range is less than 0.2 dB/m, with a strong H—S absorption peak around 4 μm, resulting in absorption intensity of approximately 4.5 dB/m (Fig. 2). The optical microscope of the CFB reveals that the individual fiber diameters are approximately 40 μm (Fig. 3). The average optical loss of the CFB in the mid-infrared detection range is 0.99 dB/m. The increase in loss can be attributed to two factors: 1) The mid-infrared camera’s response range is between 3.8?4.7 μm, which overlaps with the H—S absorption peak; 2) Absorption caused by the PEI coating. Transparency tests show uniform light transmission across the fiber elements, with no black or dark fibers, indicating good consistency in light transmission (Fig. 4). The theoretical filling factor for the CFB is 51%, whereas the actual measured filling factor is 54%, which is marginally higher than the theoretical value. This discrepancy can be attributed to the fact that, during the stack-and-draw process, the gap is filled by the fiber cladding and coating layer, which slightly increases the overall filling factor. The theoretical spatial resolution of the CFB is calculated to be 14.43 lp/mm, and experimental results show that the resolution corresponds to the third group, the sixth element on the resolution target, but not the first element of the fourth group. Therefore, the measured spatial resolution is 14.25 lp/mm, which is close to the theoretical value (Fig. 5). The crosstalk rate of the CFB is found to be less than 1%. By adjusting the aperture position and coupling the light source to the fiber interface, it is observed that the fibers maintain a clear boundary, which indicates that the PEI layer suppresses crosstalk by absorbing the coupled light in the cladding (Fig. 6). However, a smaller cladding thickness is not always advantageous; an excessively thin cladding can result in increased light leakage into the coating layer, thereby raising the overall loss of the CFB. The temperature resolution of the imaging system is 0.25 K, and after incorporating the CFB, the resolution increases to 0.50 K. This degeneration is mainly due to two factors: 1) Fiber loss and f-number degradation result in a loss of energy reaching the detector; 2) The uncoated CFB exhibits significant Fresnel reflection loss due to the high refractive index of the material.ConclusionsA mid-infrared CFB based on As-S glass has been fabricated and thoroughly characterized through various imaging system setups. The CFB exhibits a low breakage rate, and the individual fiber elements demonstrate consistent light transmission, which ensures no degradation of image quality due to defects. The measured spatial resolution is in close agreement with the theoretical calculation. The crosstalk rate of the CFB is found to be less than 1%, and a convenient method using femtosecond laser-machined apertures has been developed to measure the crosstalk rate reliably. The PEI coating on the CFB significantly suppresses crosstalk by absorbing mid-infrared stray light. Compared to the ribbon-stacking method, this configuration reduces cladding thickness and improves the filling factor. Temperature resolution testing reveals that the introduction of the CFB into the infrared imaging system reduces the temperature resolution from 0.25 K to 0.50 K. Further improvement in temperature resolution can be achieved by reducing fiber loss, coating anti-reflection films on the bundle end faces, and optimizing the subsequent coupling lens design.
Apr. 27, 2025Vol. 45 Issue 8 0823001 (2025)
Hongji Fan, Ming Xu, Ying Su, and Tun Cao
ObjectiveThe rapid development of multi-band composite detection technology has significantly enhanced the target detection capabilities of detectors, making traditional single-band stealth techniques inadequate in evading detection. Moreover, the increasing demand for multi-band integrated stealth technology in optically transparent scenarios, such as airplane portholes and automobile observation windows, has raised the need for higher transparency in stealth materials. Therefore, the design of multifunctional, ultrathin, and multi-band compatible wave-absorbing structures has become crucial. In this paper, we propose and successfully fabricate an ultrathin transparent absorber, with both infrared low emissivity and radar broadband absorbing performance. The structure consists of a multifunctional integrated metasurface layer, a high optical transparency dielectric substrate, and an all-reflective backplane. To verify the effectiveness of the absorber, a sample is prepared and systematically tested across visible, radar, and infrared wavelength bands. The results show that the metamaterial absorber designed in this paper exhibits excellent performance and demonstrates great potential for applications in daily life, medical diagnosis, aerospace, and military multi-band stealth applications.MethodsIn the design aspect, we employ commercial electromagnetic simulation software CST Studio Suite and MATLAB for joint modeling and simulation. MATLAB is used to first calculate the range of each parameter required to satisfy the condition of infrared emissivity <0.3, and then with the help of the Optimizer tool in CST, the parameters (P, L1, L2, L3, Q, R, d) of the absorber are optimized. For electromagnetic simulations, a full-wave numerical simulation of the designed absorber is carried out using the finite element frequency domain module of CST. Floquet ports of transverse electric (TE) and transverse magnetic (TM) modes with normal incidence are set as excitation sources in the z-direction, using open boundary conditions, and periodic boundary conditions (unit cell boundary) are applied in the x and y directions to simulate an infinite periodic structure. For sample surface topography tests, dimensional parameters are measured using an Olympus optical microscope at 5× magnification. For microwave performance tests, the absorbance of the prepared absorber in the 6?14 GHz band is tested in a microwave anechoic chamber using the arch method. A pair of broadband horn antennas are connected to an Aglient vector network analyzer as the transmitting and receiving ends of the electromagnetic waves. The incidence angle of the electromagnetic waves is adjustable in the range of 0°?50°. For infrared performance, a Bruker Fourier transform infrared (FTIR) spectrometer is used to measure the transmission and reflection spectra of the metasurface functional layer. A FLIR infrared camera is also used to collect infrared images in the 8?14 μm band. To ensure uniform heating, a 60 mm×60 mm copper plate is placed as the homogenizing plate on the heating stage, which is set to 70 ℃. The metasurface functional layer of the absorber and a PET sample of the same size (30 mm×60 mm) are placed on the heating stage and heated together for 15 min, after which infrared photographs are taken with the FLIR camera. For visible light transmittance tests, a UV-2200 UV?visible spectrophotometer is used to measure the transmittance of the absorber in the 400?800 nm band.Results and DiscussionsThe designed absorber achieves an absorption rate of more than 90% in the frequency range of 8.0?12.1 GHz, with a return loss of less than -10 dB. It demonstrates excellent impedance matching with free space in the operating frequency band (Fig. 2). The absorber also exhibits good stability with respect to changes in the polarization angle and incidence angle of the electromagnetic waves. It maintains more than 70% absorption in most of the operating frequency bands when the incidence angle is less than 50° (Figs. 3 and 4). Analysis of the contributions of different structural layers to the wave absorption performance reveals that the radar stealth primarily originates from the electromagnetic interaction between the ITO metasurface layer and the electromagnetic wave (Fig. 6). The distributions of surface electric fields and currents at the resonance frequency indicate the resonance modes and loss mechanisms (Fig. 7). Stability during the actual processing is verified by robustness analysis of the metasurface structural parameters (Fig. 8). A sample consisting of 10×10 cells is fabricated, and the UV?visible spectrophotometer is used to test the transmittance in 400?800 nm waveband (Fig. 9). The machining accuracy is measured using an optical microscope (Fig. 10), and the sample is tested using the arch method, infrared spectrometer, and imager. The test results for radar and infrared stealth are in excellent agreement with simulation predictions (Figs. 11, 12, and 14).ConclusionsIn this paper, we propose a sandwich-structured metamaterial absorber consisting of a double-layer low-square-resistance (<10 Ω/sq) indium-tin-oxide (ITO) film and a high-optical transparency dielectric substrate. This absorber combines low infrared emissivity, broadband microwave absorption, and high visible transmittance, with a total thickness of only 1.8 mm. Simulation results show that the absorber can achieve more than 90% of broadband absorption in the frequency band of 8.0?12.1 GHz, which completely covers the microwave X-band. Based on the theoretical design, the absorber is fabricated and achieves more than 90% broadband absorption in the 8.1?12.6 GHz range, with infrared emissivity in the 8?14 μm band of 0.249 and optical transmittance reaching 68.1%. All performance parameters are in excellent agreement with the theoretical simulation results, making the absorber a promising solution for multi-band composite stealth technology.
Apr. 27, 2025Vol. 45 Issue 8 0823002 (2025)
Xinhua Zhang, Yuchun Liu, Cuihong Jin, and Yajuan Han
ObjectiveOptical band-gap materials are typically periodic structures composed of at least two kinds of materials. The simplest example is a one-dimensionally periodic structure arising from the ordered stacking of two layers of optically mismatched materials. Surface modes, such as surface plasmons and surface phonon polaritons, can also display band gaps if the planar surface is capped with an ordered array of stripes made from an electronically dense material. Quantum control could involve quantum dots composed of two-level or three-level atoms within a band-gap system or near a structured surface, in addition to the use of external tunable laser fields. We aim to explore the interaction between surface plasmon and quantum dots in one-dimensional periodic nanorod arrays and to explore the potential of such scenarios for realizing scalable quantum information processing.MethodsFirstly, we study two boundary conditions for the electric and magnetic field components of surface plasmons in one-dimensional periodic nanorod arrays located at the interface between vacuum and metal. Furthermore, we use Bloch’s theorem of periodic structure to derive the characteristic dispersion relationship determined by the surface plasmon wave vector and Bloch vector. By adjusting the characteristic parameters of the system, including the nanorod spacing, nanorod material properties, and the type of media involved, we probe the surface plasmon band structure while varying different parameters. Then, we carry out a theoretical analysis of how surface plasmons manipulate the excited states of quantum dots by adjusting the characteristic parameters. Finally, by quantizing the surface plasmon field, we calculate the transition rate of these quantum dots under the action of the surface plasmon.Results and DiscussionsThe results show that the surface plasmon exhibits a distinct band and a band-gap structure. By adjusting the nanorod spacing, nanorod material properties, and the type of media involved, the surface plasmon band structure varies with these parameters. It is also proved that these surface modes (SPPs) are traveling waves. Furthermore, it is shown that when the frequency of SPP is small (photon-like), the corresponding plasmon wave vector k?x is also small, and the coupling is much weaker. In contrast, when the k?x is in the range of 0.6<Ω<0.8, the surface plasmon has a strong coupling effect with the quantum dots near the interface, which means that the coupling is quite strong when the surface mode is phonon-like. Meanwhile, when k?x is larger, the lifetime of the surface modes is longer, which implies that the phonon-like surface modes have longer interaction time with quantum dots. This should provide a better opportunity to control the transition from the excited states to the ground states. The results also show that it may be possible to manipulate quantum states. 1) The transition between excited and ground states can be controlled by turning on or off specific regions of the excitation field frequency. 2) The transition is also stopped by increasing the frequency to the edge of the gap. These two methods, by physical meaning, indicate that they could provide a feasible option for manipulating quantum states flexibly in real-world applications. The calculation results show that the transition rate of quantum states involved in this system is roughly in the order of 105, so the manipulation frequency of the quantum states can reach the order of 1013 s-1. Obviously, such a frequency can provide a theoretical criterion for ultrafast quantum state manipulation. This shows that rapid manipulation and reading of qubits can be achieved by surface plasmon, and the speed and efficiency of quantum computing can be improved. Faster quantum state manipulation means swifter quantum information processing per unit time, which lays a foundation for batch quantum information processing and quantum state manipulation in the field of quantum computing.ConclusionsIn this paper, the characteristic dispersion relationship of surface plasmon, including amplitude, phase velocity, and frequency, is studied in one-dimensional periodic nanorod arrays located at the interface between vacuum and metal. The results show that the SPPs have band gap features. By adjusting the characteristic parameters of the system, the SPPs band structure varies correspondingly. It is verified that the SPPs are traveling waves. Taking advantage of this feature, we discuss a promising scheme for coupling surface mode SPPs with quantum dots within periodic nanorod arrays located near the metal-vacuum interface. Due to the small size of these modes, it is easy to couple them to the quantum dots located in each cell, which leads to a strong coupling effect between the surface plasmons and the quantum dots near the metal-vacuum interface. By adjusting the characteristic parameters, the number of quantum dots can be made to resonate with the SPPs. The transition rate of these quantum states under the influence of SPPs can be calculated, and then the coupling strength and interaction time (lifetime) can also be determined. Theoretically, it is shown that large-scale quantum state manipulation can be achieved via surface plasmons on the periodic nanoarray structure, thus providing a theoretical basis for large-scale quantum information processing. This study extends previous research on the interaction between quantum dots and SPPs, which not only verifies the characteristics of the SPP field on conventional metal-medium surfaces but also provides some easily realizable nanofabrication techniques for subsequent experimental verification, to compare the differences in scalable quantum state manipulation between theoretical calculations and experimental measurements.
Apr. 27, 2025Vol. 45 Issue 8 0824001 (2025)
Jiafei He, Hongxuan Mao, Yiyun Chen, Lin Zhang, Huabing Wu, and Shiyang Liu
ObjectiveThe advent of electromagnetic meta-atoms (EMAs) significantly alters the interaction between electromagnetic waves and subwavelength particles, enabling the emergence of novel phenomena associated with scattering and absorption, leading to promising applications. The physics behind these properties is rooted in the unique configurations of EMAs, which enable selective excitation of multipolar modes with custom-made amplitudes, resulting in phenomena such as superscattering, invisibility, Fano resonance, and Kerker effect. Ferrite materials possess intrinsic magnetic responses that allow the design of magnetic EMAs with nonreciprocal features, arising from time-reversal symmetry breaking in ferrites under a bias magnetic field (BMF). By periodically arranging an array of EMAs, magnetic metamaterials (MMs) can be constructed to manipulate electromagnetic waves nonreciprocally, particularly near the magnetic surface plasmon (MSP) resonance. By designing magnetic EMAs with two types of yttrium iron garnet (YIG) ferrite materials with different saturation magnetizations, two MSP resonances can be achieved. As a result, MMs constructed from these magnetic EMAs exhibit a nonreciprocal perfect absorption effect at two different frequencies for incident Gaussian beams with transverse magnetic (TM) polarization. Specifically, in one direction, the structure acts as a perfect absorber, while in the mirror-symmetric direction, the beam is mainly reflected. This nonreciprocal phenomenon is closely related to the lattice Kerker effect and nonreciprocal Fano resonance. The magnetic EMAs serve as fundamental elements for nonreciprocal optics and microwave photonics.MethodsThe scattering properties of magnetic EMAs can be solved using the generalized Mie theory, which relates the scattering field to the incident field via Mie coefficients. The scattering cross sections of the magnetic EMAs are calculated based on these coefficients, and nonreciprocal Fano resonances are visualized by examining the scattering cross sections. By incorporating multiple scattering theory, the scattering field generated by multiple magnetic EMAs is rigorously calculated, enabling a deeper analysis of nonreciprocal scattering behavior. In addition, photonic band diagrams, absorbance, and reflectance are calculated to optimize the configurations of magnetic EMAs and the direction of the incident Gaussian beam, ensuring perfect absorption at a specified direction while achieving substantial reflection in the mirror-symmetric direction. Effective-medium theory is also employed to retrieve the effective constitutive parameters of MMs, identifying the MSP resonance frequencies, which are compared with photonic band diagrams.Results and DiscussionsBy periodically arranging an array of magnetic EMAs in a square lattice, with a lattice constant a=9 mm, we construct MMs that serve as nonreciprocal perfect absorbers. The saturation magnetizations of the two ferrite materials in the magnetic EMAs are Ms1=0.300 T and Ms2=0.175 T, with an inner radius rc=0.9 mm, an outer radius rs=2.3 mm, and damping factors set as a1=a2=2×10⁻². The BMF is set to H0=600 Oe. By plotting transmittance and reflectance as functions of frequency f and incident angle θinc, we identify two operating frequencies f1=3.90 GHz and f2=5.56 GHz, with corresponding incident angles θinc=±70° (Fig. 2). Next, keeping other parameters constant, we plot the transmittance and reflectance as functions of a1 and a2 and optimize the damping factor to a1=a2=1.2×10⁻² (Fig. 3). Further optimization of the inner and outer radii yields rc=0.8 mm and rs=2.25 mm, achieving an absorbance greater than 97% and a reflectance exceeding 80% in the mirror-symmetric direction (Fig. 3). Using multiple scattering theory, full-wave simulations reveal nonreciprocal perfect absorption (NPA) at two different frequencies. The lower-frequency NPA corresponds to the resonant mode in the outer layer, while the higher-frequency NPA corresponds to the resonant mode in the core. By plotting the angular scattering amplitude of the unit cell at the central position, the nonreciprocal lattice Kerker effect is observed. Specifically, perfect absorption for the rightward incident beam corresponds to backward scattering, while strong reflection occurs for the leftward incident beam due to forward scattering (Fig. 4). By comparing the photonic band diagrams with effective-medium theory, MSP resonances at two different frequencies are confirmed, with the operating frequencies falling within the vicinity of the MSP resonances. In addition, the operating frequencies can be flexibly tuned upwards or downwards by adjusting the BMF, as evidenced by the frequency shift of the MSP resonances (Fig. 5). To further investigate the scattering properties of magnetic EMAs and their connection to NPA, the scattering cross section and the amplitude of Mie coefficients are calculated as functions of frequency. Two asymmetric Fano dips are identified near the operating frequencies, resulting from the interference between the broadband 0th-order mode and the narrowband -1st-order mode. Moreover, the tunability of both the Fano resonances and operating frequencies via the BMF introduces an extra degree of freedom (Figs. 6 and 7).ConclusionsMagnetic EMAs composed of two types of ferrite materials with different saturation magnetizations have been designed, serving as building blocks for MMs to achieve dual-band NPA. At a specified incident angle, the Gaussian beam is absorbed with an absorbance exceeding 97%, while in the mirror-symmetric direction, it is strongly reflected with a reflectance over 80%. The NPA effect arises from the time-reversal symmetry breaking nature of MSP resonance and the nonreciprocal lattice Kerker effect. The phenomenon is also closely related to the nonreciprocal Fano resonances of isolated magnetic EMAs, originating from the interaction between the broadband bright mode and the narrowband dark mode associated with angular momentum channels m=0 and m=-1. In addition, both the operating frequencies and Fano resonances can be flexibly controlled by the BMF, enhancing potential applications in nonreciprocal optics and microwave photonics.
Apr. 27, 2025Vol. 45 Issue 8 0826001 (2025)
Changpeng Tang, Yiting Wang, Zhi Cheng, Quanxin Na, Linlin Lu, Shangwen Rong, Lianyan Li, and Yunshan Zhang
ObjectiveFrequency modulated continuous wave (FMCW) lidar performs measurements through coherent detection and offers advantages such as high-ranging accuracy, a wide range, and the absence of a need for cooperative targets. The linearity of the laser’s frequency modulation directly influences the ranging accuracy and resolution of the FMCW lidar. Traditional software-based resampling methods require substantial memory space and extensive data processing time to achieve high-precision measurements, which poses a disadvantage for real-time applications. In this paper, we employ the equal optical frequency interval resampling correction technique to resample the target signal using an auxiliary signal, aiming to eliminate the influence of laser frequency modulation nonlinearity on the lidar. To meet the real-time and high-precision measurement requirements, and to enhance the system’s processing speed, a resampling FMCW lidar system based on field programmable gate array (FPGA) technology is designed. This approach is expected to provide a novel concept for achieving high-precision, low-cost three-dimensional (3D) imaging.MethodsThe laser’s frequency modulation nonlinearity is corrected using the equal optical frequency interval resampling method, with the entire process implemented based on FPGA. The correction system adopts a double optical path structure, comprising two parallel Mach-Zehnder interference optical paths. One path serves as the measuring optical path, while the other functions as the auxiliary interference optical path. The FPGA uses a 5 kHz triangular wave generated by a digital-to-analog converter (DAC) to modulate the laser. After modulation, the beat frequency signals generated by the measuring and auxiliary optical paths are detected by a balanced detector, collected by an analog-to-digital converter (ADC), and transmitted to the FPGA for synchronous processing. In the subsequent signal processing stage, the FPGA performs targeted digital filtering on the two beat signals. By identifying the characteristic points of the auxiliary signal and converting it into a square wave to serve as the acquisition clock for the measurement signal, the measurement signal undergoes period positioning, resampling, and uniform output processing. Finally, a spectrum free of nonlinearity is obtained through the fast Fourier transform (FFT).Results and DiscussionsIn this paper, we focus on the influence of resampling technology on the spectral characteristics and measurement accuracy of the target signal. Before resampling, the signal measured at a 5 m distance exhibits spectrum broadening, a low signal-to-noise ratio, and a large measurement error. After resampling, the signal-to-noise ratio is greatly enhanced, the spectral width is significantly compressed, and the measurement accuracy improves (Fig. 8). In the static distance measurement experiment within the 1?5 m range, the uncorrected system’s maximum error reaches as high as 257.8 m. After resampling correction, the maximum error is reduced to 3.9 mm, improving the ranging accuracy by a factor of 66 compared to the original system (Fig. 10). In the imaging experiment targeting a scene composed of two water cups at 1.6 m, the FPGA-based signal processing can process a 256 pixel×256 pixel image in approximately 19 s, clearly identifying the target outline (Fig. 11). In the dynamic measurement experiment, the system measures velocities in the ranges of 0.1?0.4 m·s-1 before correction and 0.05?0.4 m·s-1 after correction. The results demonstrate that the maximum measurement error for speed before resampling correction is 0.044 m·s-1, which is reduced to 0.012 m·s-1 after correction, improving accuracy by a factor of 3.7 (Fig. 13). Overall, the resampling technique effectively enhances the spectral characteristics of the target signal and improves measurement accuracy.ConclusionsIn this paper, the equal optical frequency interval resampling method successfully eliminates the influence of laser frequency modulation nonlinearity in FMCW lidar measurement. Compared to the limitations of software-based resampling methods in real-time, high-precision measurement, the data acquisition and signal processing system based on FPGA demonstrates excellent performance. Within the 1?5 m measurement range, the system’s maximum ranging error is only 3.9 mm, and the maximum relative error for speed measurement is 3.4%. In addition, the system achieves clear reproduction of an object at 1.6 m through target scanning and imaging. The experimental results verify the system’s real-time and effectiveness, providing a feasible solution for high-precision and low-cost 3D imaging. This research outcome holds broad application potential in fields such as autonomous driving and industrial measurement and is expected to drive the development and wide use of lidar technology in related fields. It also lays a solid foundation for future research and technological improvements.
Mar. 20, 2025Vol. 45 Issue 8 0828001 (2025)
Fengfeng Liang, Xiuhong Liu, Zhi Zhao, Haiyan Han, Sixing Xi, and Jinhua Hu
ObjectiveMicro-nano photonic structures hold immense potential in biochemical analysis, environmental monitoring, and medical detection. Chiral metasurfaces, as an emerging micro-nano photonic structure, have attracted wide attention due to their simple fabrication process and ease of integration. In recent years, chiral metasurfaces have been widely used in many practical scenarios, especially for enhancing circular dichroism (CD) and chiral biosensing. Various chiral metallic metasurfaces have been designed to improve chiral responses and CD. However, the inherent ohmic losses in metallic materials result in a low quality factor (Q-factor) for the CD spectrum. The bound state in the continuum (BIC) enables chiral metasurface sensors to achieve CD spectra with high Q-factors. Strong CD spectra with high Q-factors can be achieved by breaking in-plane or out-of-plane geometric symmetry to excite intrinsic chiral quasi-BIC (QBIC), thereby enhancing chiral sensing performance. However, most studies on BIC-based chiral metasurface sensors focus on enhancing the Q-factors of CD spectra, with limited emphasis on the stability of CD peak values. The CD peak value is usually sensitive to variations in structural parameters, which requires precise device manufacturing. In this study, we propose an inverse-S chiral all-dielectric metasurface sensor based on chiral QBIC. The sensor achieves a stabilized and strong CD peak value and exhibits excellent performance in refractive index and chiral sensing.MethodsThe proposed chiral metasurface structure consists of periodically arranged inverse-S silicon unit cells on a silica substrate (Fig. 1). The optical properties of the metasurface are analyzed using the finite element method (FEM). Periodic boundary conditions are applied in the x and y directions of the unit cell, with perfect matching layers set in the z direction to ensure result accuracy. Circularly polarized light (CPL) is incident vertically on the metasurface along the -z direction. Firstly, the eigenmodes of the inverse-S structure with in-plane C2 symmetry are analyzed. Then, the eigenpolarization state of the symmetry-breaking structure is discussed, which demonstrates that the metasurface realizes the chiral response (Fig. 2). The CD response of the structure is calculated using the Jones matrix method. The stability of the CD peak values within a 20 nm structural parameter range is further explored. The far-field scattering power of the structure is analyzed using electromagnetic multipole theory, and the physical mechanism of stabilized strong CD is discussed. Finally, the refractive index sensing performance of the chiral metasurface sensor is analyzed alongside the local enhancement of optical chirality, with the results confirming that the structure significantly enhances chiral light-matter interactions.Results and DiscussionsBy breaking the in-plane C2 symmetry of the chiral metasurface, the symmetry-protected BIC (SP-BIC) is transformed into an intrinsic chiral QBIC, which achieves a strong CD value of 0.96 with a high Q-factor of 45985. As the asymmetry parameter increases, the CD peak value consistently exceeds 0.85 (Fig. 3). The strong CD of the chiral metasurface is attributed to the main contribution of the magnetic quadrupole (MQ) at left-handed circularly polarized (LCP) incidence (Fig. 4). The metasurface consistently exhibits a strong CD peak value exceeding 0.85 when the structural parameters vary within a range of 20 nm (Fig. 6). The stable strong CD is attributed to the fact that the MQ is significantly enhanced at LCP incidence and strongly suppressed at right-handed circularly polarized (RCP) incidence (Fig. 7). The chiral metasurface sensor demonstrates a refractive index sensing sensitivity of 375.86 nm/RIU and a figure of merit (FOM) of 12453.94 RIU-1, which indicates high-performance refractive index sensing capabilities. In addition, the CD peak value consistently exceeds 0.85 as the environmental refractive index changes (Fig. 8). The biosensor based on the inverse-S chiral metasurface exhibits excellent stability and reliability for analyte detection. Driven by chiral QBIC, the metasurface achieves a local enhancement of optical chirality by up to four orders of magnitude, which significantly improves chiral light-matter interaction. The chiral enantiomers can be sensitively detected by analyzing distinct CD spectral shifts (Fig. 9).ConclusionsIn this paper, we propose an inverse-S chiral all-dielectric metasurface. By breaking the structural symmetry, the intrinsic chiral QBIC is excited, which results in a stabilized and strong CD. The eigenpolarization state, far-field scattered power, and CD spectrum of the metasurface are analyzed using FEM. Simulation results indicate that the proposed chiral metasurface maintains a stable CD peak value above 0.85 within a 20 nm range of structural parameter variations. The stable CD peak value is attributed to the fact that the MQ is significantly enhanced at LCP incidence and strongly suppressed at RCP incidence. The structure achieves a refractive index sensitivity of 375.86 nm/RIU and a FOM as high as 12453.94 RIU-1. In addition, the local enhancement of optical chirality in the metasurface is up to four orders of magnitude, which enables sensitive detection of chiral enantiomers. We provide a theoretical reference for the design of high-performance chiral metasurface sensors.
Apr. 27, 2025Vol. 45 Issue 8 0828002 (2025)
Dongmei Wu, Hangqi Ge, Ziqi Ye, Yongjin Wang, Zheng Shi, and Xumin Gao
ObjectivePulse wave monitoring is essential for evaluating cardiovascular health, as monitoring results reflect the periodic fluctuations in blood volume within the cardiovascular system caused by cardiac systole and diastole. Conventional pulse monitoring methods, such as extracting signals from electrocardiograms (ECGs) and measuring blood pressure, often limit patient mobility and engender discomfort. Photoplethysmography (PPG) technology offers a non-invasive and adaptable alternative. In this paper, we aim to develop a monolithic integrated pulse monitoring sensor based on an AlGaInP yellow light-emitting diode (LED) and photodetector (PD). The sensor is designed for low power consumption, high integration, and compact size, making it especially suitable for wearable devices and telemedicine applications. Instead of using existing sensors, we employ an optimized concentric ring structure to enhance photocurrent response sensitivity, making it applicable for health monitoring, athletic diagnostics, and remote healthcare solutions.MethodsThe sensor is fabricated using metal organic chemical vapor deposition (MOCVD) on a 4-inch (1 inch=2.54 cm) GaAs substrate. The epitaxial structure consists of an n-type GaAs ohmic contact layer, an n-type AlGaInP current spreading layer, an n-type AlGaInP confinement layer, an active region, a p-type AlGaInP confinement layer, and a p-type GaP current spreading layer. The GaAs substrate is removed by wet etching using a mixture of NH4OH and H2O2 with the ratio of V(NH2OH) to V(H2O2) of 1∶3, where V(NH4OH) and V(H2O2) are the volumes of NH4OH and H2O2, respectively, and the epitaxial layer is bonded to a sapphire substrate using a SiO2 interlayer. The final device consists of an inner circle (diameter: 400 μm) and an outer ring (width: 200 μm) separated by an electrically insulating trench (depth: 6.15 μm, width: 112 μm). The fabrication process involves several key steps: 1) defining mesa structures for the inner circle and outer ring diodes using photolithography and ICP etching (depth: 6.15 μm) to expose the p-GaP current spreading layer (mesa etch); 2) etching isolation trenches down to the SiO2 insulating layer for complete electrical isolation (slot etch); 3) depositing 1.3 μm metal alloy layers on the n-GaAs and p-GaP layers by physical vapor deposition (PVD) to form ohmic contacts (p/n ohmic); 4) depositing a Si3N4 passivation layer by plasma-enhanced chemical vapor deposition (PECVD) and creating electrode openings and metal pad areas by reactive ion etching (isolation); 5) connecting the electrodes to the metal pads by PVD and metal lift-off (pad). The sapphire substrate is thinned to ~150 μm and diced by laser cutting. Finally, the chip is wire-bonded to a printed circuit board (PCB) using ultrasonic ball bonding for subsequent performance evaluation. The sensor's performance is evaluated by measuring the photocurrent response under different LED drive currents and comparing the inner ring emission/outer ring detection mode with the outer ring emission/inner ring detection mode (Figs. 1 and 2). The physiological signal detection capability of the sensor is validated by PPG experiments.Results and DiscussionsThe optimized concentric ring structure significantly improves the photocurrent response sensitivity of the AlGaInP-based sensor. Experimental results show that the inner ring emission and outer ring detection mode achieve the highest sensitivity due to the larger detection area of the outer ring, which provides better light signal response, the photocurrent increases from 10-9 A to 10-5?10-4 A, representing an increase of four orders of magnitude, mainly due to LED illumination (Fig. 3). Electroluminescence spectra show stable emission characteristics, with the full width at half maximum (FWHM) varying by only 1.2 nm, indicating uniform indium distribution and low defect density. In addition, the overlap of approximately 50 nm between the normalized spectral response (SR) curve of the PD and the emission spectrum of the LED allows the monolithically integrated MQW devices to function as both emitter and detector (Fig. 4). In pulse monitoring experiments, the sensor effectively detects periodic changes in blood volume caused by cardiac activity and accurately identifies key features of the PPG waveform, such as the systolic peak, diastolic peak, and dicrotic notch. Long-term stability tests over 16.5 hours confirm the sensor’s reliability, with consistent photocurrent output throughout the period (Fig. 6). Compared to other sensors, such as GaN-based green-light sensors and organic PPG sensors, the AlGaInP-based sensor demonstrates superior performance in terms of low power consumption, high sensitivity, miniaturization, and integration.ConclusionsIn this paper, we develop a monolithically integrated AlGaInP yellow light sensor that combines emission and photodetection functionalities through an optimized concentric ring design. The sensor exhibits low power consumption, high integration, and enhanced sensitivity. Its ability to detect PPG signals in reflective mode by interfacing with the skin enables the detection of periodic blood volume changes associated with cardiac activity. Experimental results confirm its capability to accurately identify key blood pressure waveform features, including systolic peaks, diastolic peaks, and dicrotic notches. The sensor's adaptability to real-time pulse monitoring, wearable devices, and remote healthcare applications highlights its potential for precision medicine and health management.
Apr. 25, 2025Vol. 45 Issue 8 0828003 (2025)
Qun Yan, Tao Liang, Kaixin Zhang, Ziming Yao, Zhengui Fan, Wenzong Lai, Jie Sun, and Enguo Chen
SignificanceMicro-LED displays have excellent performance, such as high brightness, high resolution, vivid colors, long lifespan, and fast response speed. They are expected to become disruptive display technology following liquid crystal display (LCD) and organic light emitting diode (OLED), especially in fields like micro-projection, near-eye displays, and others. However, these fields urgently require display devices with high light efficiency and good directivity. The light extraction efficiency and beam shaping of Micro-LEDs have become pressing challenges for researchers and industry. Light extraction technologies, such as Micro-LED sidewall repair, surface random roughening, and surface photonic crystal technology, have been developed. For beam shaping, there are Micro-LED beam modulation designs based on structures like microlenses, metasurfaces, and resonant cavities. Due to these technologies, Micro-LEDs can be effectively used in near-eye display applications.ProgressIn this study, we have reviewed and analyzed many Micro-LED-related design solutions. We summarize the advantages and disadvantages of these options and discuss aspects related to manufacturing design, process costs, material selection, etc. Through comparison, it can be concluded that photonic crystal technology is effective in improving the light extraction efficiency of Micro-LEDs. However, there are some drawbacks, such as difficulty in obtaining a directional light source, the challenges of manufacturing photonic crystals, and the high production costs. Microlens technology performs well in light field control, but its effect on Micro-LED light extraction efficiency is not significant. Metasurface technology presents high processing difficulty and costs, but it offers significant beam-shaping effects. Resonant cavity structures can effectively enhance light extraction efficiency and achieve precise beam shaping in Micro-LEDs. However, their implementation faces substantial challenges in fabrication process and structural design complexity. Sidewall repair and rough surface technologies are more effective in improving Micro-LED light extraction efficiency. These classic examples help us better understand and study Micro-LED technology.Conclusions and ProspectsWith the development of Micro-LED technology, we believe that costs will be reduced soon. Micro-LED development is expected to usher in a breakthrough. Surface roughening and sidewall passivation technologies also have room for improvement. The Micro-lens array is easier to realize at the process level. Metasurface technology, photonic crystal technology, micro-cavity structures, and other research areas are experiencing a development boom. In the application of Micro-LED displays, they can be combined with artificial intelligence (AI) technology. We can use AI algorithms to design and optimize structures. Additionally, AI can improve accuracy and reduce labor costs, to realize the application of “AI+ Micro-LED Display”. AI algorithms can automatically identify and repair wafer defects in Micro-LED manufacturing. They can also analyze chip position deviations during mass transfer and adjust process parameters in real-time to improve yields. In terms of user demand analysis, AI optimizes color calibration, brightness adjustment, and other parameters of Micro-LED displays to enhance the immersive experience of AR/VR devices. In the field of visible light communication integration, “AI+ Micro-LED Display” can simultaneously realize display and high-speed optical communication functions, such as pulse-width modulation. The in-depth application of AI technology provides more possibilities for Micro-LED display products. Through natural language processing technology, users can interact more intelligently with devices using voice commands. However, there are also challenges to the adaptability of AI technology. AI model training requires a large amount of manufacturing data, but the lack of a data-sharing mechanism between enterprises limits the universality of the algorithm. Additionally, the technical standards for Micro-LED combined with AI have not been unified, which may lead to compatibility issues and a lack of mature software. Hardware ecosystems may also limit the expansion of application scenarios. In addition, quantum dot materials offer high color purity and saturation, which makes them highly suitable for Micro-display applications. Micro-LED light extraction and beam shaping technologies can be combined with quantum dots and other innovations to achieve high-efficiency, full-color displays. As research progresses, we believe that these technical challenges can be overcome, thus paving the way for the more widespread market adoption of Micro-LED technology.
Apr. 17, 2025Vol. 45 Issue 8 0800001 (2025)
Chenlong Zhang, Meigang Duan, Naikui Ren, Xiaojin Yin, and Jing Wang
ObjectiveIn our daily life, information about objects mainly comes into our sight through the linear propagation of light. However, when light encounters an inhomogeneous medium such as fog, ground glass, or biological tissue during its propagation, the incident photons are scattered multiple times due to the inhomogeneity of the medium’s refractive index. This scattering causes the propagation direction of the outgoing photons to become random, which forms a random speckle field. As a result, the imaging depth and resolution are reduced. This scattering phenomenon makes it more difficult to extract useful information from images and limits the application of light in imaging, focusing, and communication. In this paper, we utilize wavefront shaping technology based on feedback optimization to suppress the effects caused by this optical scattering phenomenon.MethodsFirst, wavefront shaping technology is used based on feedback optimization. Under the conditions where the wavelength of light is 6.328×10⁻⁷ m, the distance between the SLM and the scattering medium is 200 mm, the distance between the scattering medium and the CCD is 100 mm, there are 128×128 phase modulation units, and 10000 iterations are performed, the wavefront of the incident light wave is phase-modulated using the Hippopotamus optimization (HO) algorithm. Combined with the single fast Fourier transform algorithm based on the Fresnel diffraction integral, MATLAB is used to simulate the single-point focusing of light through the scattering medium and to assess the focusing quality. Then, an image projection test is carried out to obtain the Pearson correlation coefficient of the corresponding image projection, thus verifying its effectiveness. Finally, the multi-point focusing ability is tested. In this process, compared with the genetic algorithm (GA) under random noise conditions of 1%, 5%, and 10%, it is further proved that the HO algorithm can control the scattered light field and resist noise.Results and DiscussionsIn our study, the single-point focusing ability of HO is tested, and the final light intensity enhancement of the target area can reach more than 1200 (Fig. 4). The correlation of the image projection can then exceed 0.86, as measured by the Pearson correlation coefficient (Fig. 5). Compared with GA under random noise conditions of 1%, 5%, and 10%, the results show that HO has better anti-noise ability than GA (Fig. 6). Finally, by testing the multi-point focusing ability, we observe that the background speckle of HO is less (Fig. 7), and at the same time, the line chart in (Fig. 8) shows that the average light intensity enhancement and relative standard deviation of HO are better than those of GA.ConclusionsWe present an HO algorithm that can be used for wavefront phase modulation, which enables precise regulation of the speckle field by modulating the front phase of the incident light wave. The abilities of single-point focusing, multi-point focusing, and image projection under the same conditions are explored and compared with GA under varying levels of noise interference. The results show that, compared with GA, HO exhibits better control performance and anti-noise ability under the same conditions. Especially in multi-point focusing and image projection, HO can produce a more uniform focus map and clearer image transmission. The research results provide new insights for the practical application of wavefront shaping technology based on iterative optimization.
Apr. 27, 2025Vol. 45 Issue 8 0829001 (2025)
Han Zhang, Feng Zhu, Hailiang Shi, Jingjing Zhang, Xiang Cao, Xianhua Wang, Hanhan Ye, and Yunfei Han
ObjectiveSpaceborne infrared Fourier transform spectrometers are critical instruments in remote sensing and atmospheric observation, which offer high resolution, high throughput, and multi-channel capabilities to acquire high signal-to-noise ratio (SNR) spectral data. However, during the data acquisition process, the interferograms captured by these spectrometers are often affected by factors such as readout circuit noise, sampling delays, temperature variations in the interferometer, and inherent instrument characteristics. These influences result in deviations from the zero optical path difference (ZPD) position, which causes phase shifts that disrupt the symmetry of the interferogram. Such phase errors are particularly detrimental, as they can introduce significant radiometric calibration errors, compromise the accuracy of the data products retrieved, and adversely affect applications that rely on precise signal integrity, including atmospheric sounding, spectral analysis, and target detection. Conventional methods, such as the Forman and Mertz algorithms, struggle to balance accuracy and computational efficiency, particularly when addressing nonlinear phase errors or achieving sub-sampling-level correction.MethodsTo meet the demand for accurate and fast phase correction for spectrometers, we propose a phase correction algorithm, the minimum spectral imaginary part-simplex method (MSI-SM), which is based on the minimum spectral imaginary part method combined with the simplex algorithm. Through an analysis of the working principle of the Fourier transform spectrometer, the MSI-SM algorithm identifies the sources of phase error and decomposes the phase into linear and instrument phases. Target scene calibration is performed using blackbody and deep-space calibration sources during the spectrometer’s in-orbit operation, and the influence of instrument phase error is eliminated through the in-orbit calibration equation. In addition, we design an objective function for construction based on the minimum spectral imaginary part method, combined with the simplex algorithm to calculate linear phase errors and improve the computational efficiency and accuracy of the correction algorithm.Results and DiscussionsIn the experiment, we select HIRAS data from March 1st, 3rd, 5th, and 7th, 2019, conducting tests at different times of the day and for various spectral band ranges. Artificial offsets are introduced at different positions in the interferogram to validate the algorithm, and traditional methods are employed for the evaluation and analysis of our approach. As shown in Fig. 10, the comparison of phase results relative to the internal calibration blackbody demonstrates that the proposed algorithm can accurately calculate sub-sampling-level phase errors. Furthermore, the experiments are repeated across longwave, midwave, and shortwave bands to verify the algorithm’s applicability. To quantitatively assess the correction accuracy, we refer to the noise equivalent delta radiance (NEDN) of deep space (DS) scene-calibrated spectra and the average NEDN across four field of views (FOVs). As shown in Fig. 11, compared to the instrument phase alignment (IPA) algorithm, the proposed method achieves NEDN values for the imaginary spectrum of the Earth scene (ES) and the real spectrum of DS calibration that are closer to the reference. Tables 4 and 5 indicate that MSI-SM outperforms the comparison methods on these metrics. Specifically, compared to the IPA algorithm, the proposed method shows superior performance in most cases, which improves the Average NEDN metric by 0.212%, 6.935%, and 22.38% for the three spectral bands, respectively. This improvement is primarily attributed to the limitations of the IPA algorithm. It relies on fitting residual phases and calculating phase offsets based on the slope of zero-intercept straight lines. This fitting process is highly dependent on the local characteristics of the data. If noise or outliers exist in the region, they may be mistakenly identified as signals during fitting, which leads to correction errors and significant deviations, especially in midwave and shortwave bands with lower signal-to-noise ratios. In contrast, the proposed method iteratively optimizes the objective function globally to find the optimal solution, avoiding reliance on the quality of single-band data. This effectively suppresses noise interference and results in more precise phase correction. To further illustrate the advantages of the proposed algorithm, we compare the efficiency of several correction methods used in the experiments. As shown in Table 7, the proposed method also significantly outperforms other traditional algorithms in terms of timeliness.ConclusionsWe propose a phase correction method for spaceborne infrared Fourier transform spectrometers based on the minimal spectral imaginary part approach and the simplex algorithm. Through comparisons with existing methods, the proposed approach demonstrates significant advantages in both correction accuracy and computational efficiency. During the on-orbit operation of Fourier transform spectrometers, phase errors among the three observation scenes introduce correlated noise into the imaginary part of the calibrated complex spectrum, thereby amplifying the spectral imaginary component. To address this issue, we analyze the sources of phase errors and eliminate those caused by instrument characteristics and internal radiative effects using an on-orbit calibration formula. The norm of the imaginary part of the calibrated spectrum is defined as the objective function, and the simplex algorithm is employed to leverage its strengths in solving linear function problems. This allows for the accurate and rapid calculation of linear phase deviations caused by sampling errors, which achieves sub-sampling-level precision. Finally, the proposed method is tested using interferometric data from the HIRAS onboard the Fengyun-3D satellite. Experimental results further validate the superiority of the algorithm in terms of both correction speed and accuracy. Compared to existing phase correction methods, the MSI-SM algorithm exhibits significantly better performance in NEdN metrics, thus providing robust technical support for improving the observational accuracy of spaceborne infrared Fourier transform spectrometers during on-orbit operations.
Apr. 14, 2025Vol. 45 Issue 8 0830001 (2025)
Wangzheng Zhou, Chao Qi, Xiaowei Qin, Zhenzhen Wang, Yoshihiro Deguchi, Daotong Chong, and Junjie Yan
ObjectiveTo achieve in-situ online detection of hydrocarbon gases at various temperatures, we explore the use of tunable diode laser absorption spectroscopy (TDLAS) for measuring hydrocarbon gas content. A difference frequency generation (DFG) laser, with a scanning range of 3250?3400 nm, is used to construct a hydrocarbon gas detection system. The 3 μm wide-band scanning provides a significant number of characteristic absorption peaks and reveals the absorbance line shapes of the absorption band. This makes hyperspectral fitting feasible and enhances the system’s versatility.MethodsFirst, the DFG-TDLAS system and hydrocarbon gas detection experimental setup are established. The DFG-TDLAS system includes a 1060 nm ECDL, a 1582 nm DFB laser, a WDM fiber coupler, and a PPLN module. This system can achieve 3250?3400 nm laser output with a resolution of 0.01 cm-1. The hydrocarbon gas detection experimental system includes a high-temperature absorption chamber and a heating chamber. The absorbed laser signal is collected from the high-temperature chamber. Samples are heated in the chamber, and the gas produced during the decomposition process is collected. Second, the DFG-TDLAS output laser is employed to measure the absorption spectra of seven hydrocarbon molecules, including C1?C4 hydrocarbons and benzene. Standard hydrocarbon gases are measured at different temperatures and volume fractions to establish the absorption spectra database. The coal is heated to 623 K in the heating chamber, and the resulting gases from thermal decomposition are measured in the high-temperature chamber. The DFG-TDLAS system and hydrocarbon absorption spectra databases are used for qualitative analysis.Results and DiscussionsDuring the detection of standard hydrocarbon gases, the pressure in the high-temperature absorption chamber is maintained at 0.1 MPa, and the detection temperatures are 298, 423, 523, 623, and 723 K (Fig. 3). Hydrocarbon gas absorption is also measured at different volume fractions at 298 K. The experimental results demonstrate that the fitting R2 values for the characteristic absorption peak intensity of hydrocarbon gases in relation to temperature and concentration are shown in Figs. 4 and 5. As the number of carbon atoms increases (e.g., in propane, propylene, butane, and benzene), the absorption lines increase, and the absorption intensity at any given wavelength is enhanced by the superposition of adjacent spectral lines. This results in a continuous wide-band absorption range. As shown in Fig. 5, in the detection of mixed gas produced by coal pyrolysis, a strong absorption is observed at 3325?3400 nm due to the absorption of C5 (or higher) hydrocarbon macromolecules. Based on existing literature, 15 possible hydrocarbon gases and water vapor absorption spectra are used for non-negative least squares spectral fitting, followed by qualitative analysis. The detected contents are primarily methane and propane, with a lesser amount of ethane. The components identified through spectral fitting align with the principles of chemical reactions.ConclusionsFor methane and ethane, multiple relatively independent high-intensity absorption lines are present in the 3250?3400 nm range, making them suitable for identification. Ethylene, propane, propylene, and butane each exhibit a distinct high-intensity characteristic absorption peak. Due to the more complex molecular structure of benzene, its absorption lines merge into a continuous curve within the 3250?3400 nm range, influenced by the broadening effects of adjacent lines. Identifying the components and calculating volume fractions requires establishing a database and using line shape functions. In the standard hydrocarbon gas experiments, the fitting R2 values for the temperature and volume fraction change curves of the characteristic absorption peaks of hydrocarbon gases are all above 0.99, indicating high accuracy. Methane, ethane, ethylene, propane, and propylene molecules can be identified through characteristic absorption peaks in the detection of hydrocarbon mixed gases generated by coal pyrolysis. Spectral fitting and qualitative analysis reveal that methane and propane are the primary hydrocarbon components detected, with lower volume fractions of other components like ethane. These results are consistent with the expected formation patterns of hydrocarbon molecules during coal decomposition, confirming the feasibility of 3 μm hydrocarbon gas detection based on DFG-TDLAS technology.
Apr. 27, 2025Vol. 45 Issue 8 0830002 (2025)
Xunming Cai, Keqin Fan, Xin Xin, and Jiashu Lu
ObjectiveWhen electrons are accelerated by radially polarized ultrashort pulses (RPUP), it is generally believed that tighter focusing can lead to better acceleration effects. However, in the case of tight focusing, due to the diffraction effect, the peak intensity of the pulse will decrease significantly after leaving the focus, which limits the electron acceleration range. The longitudinal peak intensity distribution (LPID) of the pulse is influenced by the degree of focusing, which can be determined by the beam waist size. Therefore, the LPID can also be measured by the beam waist. Clarifying the numerical relationship between the LPID and the beam waist is beneficial for determining the effect of the LPID on electron acceleration. At the same carrier frequency, the spatiotemporal electric field gradients of pulses are higher if the duration of the ultrashort laser pulse is shorter. The ultrashort duration of the pulse allows the electron to approach the peak intensity of the pulse more easily and be accelerated by the peak electric field to obtain high final kinetic energy. The short pulse duration leads to spectral blueshift and a blueshift of the center instantaneous frequency of the pulse. In this paper, the relationships are analyzed between the spectral blueshift, the instantaneous center frequency blueshift, the spatiotemporal electric field gradients, and the beam waist. The influence of these properties on electron acceleration is also studied.MethodsWe derive the expressions for focused RPUP by using the sink-source model. We investigate how the spatiotemporal properties of sub-cycle, single-cycle, and few-cycle laser pulses influence electron acceleration. The electron is initially located on the z-axis with an initial velocity of zero. Along the optical axis, only the longitudinal electric field needs to be considered, as the transverse electric field component and magnetic field are zero. At the initial time, the pulse is far from the electron, so the interaction between the electron and the pulse at this time can be ignored. By studying the spectra blueshifts and the blueshifts of the center instantaneous frequency of the pulses for different pulse durations, the relationship is analyzed between the spectral blueshift, the instantaneous center frequency blueshift, and the spatiotemporal electric field gradients. Additionally, the relationship between the LPID and beam waist size is explored by studying the LPID of the focused pulse for different beam waist sizes. After considering the radiation-reaction force on the electron, the modified relativistic Newton-Lorenz equation is used to study electron acceleration. In this study, we examine the effect of the beam waist, pulse duration, initial phase, and electron’s initial position on the acceleration, which in turn helps us understand the role of the spatiotemporal properties of the pulses in electron acceleration.Results and DiscussionsFor the waist spot size w0=0.4 μm, the maximum final kinetic energy of the electron is 49.718 MeV for the 0.45-cycle pulse and 34.830 MeV for the 2.60-cycle pulse. The maximum final kinetic energy of the electron for the 0.45-cycle pulse is 43% higher than that for the 2.6-cycle pulse. This is because the spatiotemporal electric field gradients experienced by the electron in the 0.45-cycle pulse are significantly higher than those in the 2.6-cycle pulse during acceleration. The peak intensity of the pulse experienced by the electron in the case of the 0.45-cycle pulse is also higher than that in the case of the 2.6-cycle pulse (Fig. 7). The instantaneous frequencies of the 0.45-cycle pulse experienced by the electron are also significantly higher than those of the 2.6-cycle pulse (Fig. 7). For the waist spot size w0=5 μm, the maximum final kinetic energy of the electron is 2.92 GeV for the 0.45-cycle pulse, and is 2.04 GeV for the 2.6-cycle pulse. The maximum final kinetic energy of the electrons for the 0.45-cycle pulse is also 43% more than that of the 2.6-cycle pulse. The instantaneous frequency of the pulse at the position of the electron and the maximum kinetic energy gain of the electron in the case of the sub-cycle pulse are significantly higher than those in the case of the few-cycle pulse. The larger instantaneous frequency change of the pulse indicates a larger electric field gradient, which means that electrons can approach the peak intensity of the pulse more closely. The maximum kinetic energy of electrons for the waist spot w0=5 μm increases by more than one order of magnitude compared to that for the waist spot w0=0.4 μm. This indicates that the LPID is the most important factor affecting the electron acceleration. The electric field gradient of the pulse is another important factor affecting the electron acceleration.ConclusionsThe spectra of the sub-cycle, single-cycle, and few-cycle laser pulses are blue-shifted. The instantaneous frequencies of these pulses change with time. The central instantaneous frequency of the pulse is higher if the pulse duration is shorter. The change in the instantaneous frequency over time can be regarded as an indicator of the change in the spatiotemporal electric field gradient. The electric field gradient, the change in the instantaneous frequency, and the central instantaneous frequency of the pulse are all greater if the pulse duration is shorter. The LPID of the focused pulse is the largest at the focus. The range over which the peak intensity of the pulse remains high on both sides of the focus on the optical axis is larger if the beam waist size is larger. The LPID of the pulse and the electric field gradient are important factors affecting electron acceleration. If the peak intensity of the pulse is maintained at a high level over a larger range on both sides of the focus, the exit kinetic energy of the electron can be increased by orders of magnitude. Therefore, the upper limit of the electron kinetic energy gain is determined by the LPID of the pulse if the maximum peak intensity is constant. For the single-cycle and sub-cycle pulses, the significant blue shift in the central instantaneous frequency is a sign that the pulse has high electric field gradients in both time and space. The high spatiotemporal electric field gradients of these pulses also significantly increase the electron’s final kinetic energy, which helps to approach the upper limit of the electron kinetic energy gain.
Apr. 27, 2025Vol. 45 Issue 8 0832001 (2025)
© Copyright 2018-2021 | Chinese Laser Press.
All Rights Reserved 沪ICP备15018463号-20