


Please enter the answer below before you can view the full text.


2025
Volume: 45 Issue 7
35 Article(s)

Wenxin Yang, Yunda Li, Fangde Liu, Feifan Zhao, Xinjiang Yao, Pengjun Wang, Lianghui Huang, Liangchao Chen, Wei Han, and Zengming Meng
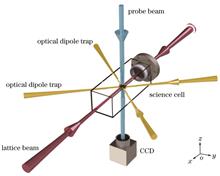
ObjectiveOptically trapped ultracold atoms in optical lattices are important physical systems for conducting quantum computing, quantum simulation, and quantum precision measurement. The study of ultracold atoms in optical lattices serves as a bridge connecting the microscopic world and macroscopic condensed matter. It can be used to simulate strongly correlated quantum many-body systems, gauge fields, and novel topological quantum states. In these experiments, the depth of the optical lattice is a key parameter for regulating interaction strength and energy level structure. It directly affects the dynamical properties of atoms in the optical lattice, including Bloch oscillations, tunneling effects, and quantum phase transitions. Therefore, high-precision calibration of the optical lattice trap depth is crucial for achieving precise quantum control of ultracold atom systems.MethodsWe propose a high-precision methodology for calibrating the trap depth of optical lattices based on the principle of multiple-pulse Kapitza?Dirac (KD) diffraction. Accurate calibration of the optical lattice depth is achieved by measuring the high diffraction efficiency of the first-order momentum state of atoms within the optical lattice. To validate the effectiveness of this method, a comprehensive comparison is made with single-pulse KD diffraction, Raman?Nath (RN) diffraction, and parametric oscillation heating. In the experimental process, Bose?Einstein condensation (BEC) of 87Rb atoms is initially realized using a crossed optical dipole trap. The atoms are then loaded into a one-dimensional optical lattice under various experimental conditions. Finally, the diffraction distribution of the atoms is observed in momentum space using time-of-flight expansion imaging. By carefully analyzing their dynamic behaviors, the depth of the optical lattice is precisely determined.Results and DiscussionsThe multiple-pulse KD diffraction method proposed in this paper utilizes the interference effect produced by a multiple-pulse optical lattice sequence to enhance the diffraction resolution of atoms, thereby improving the accuracy of calibrating the depth of the optical lattice. A comprehensive and systematic measurement of the experimental process is performed for lattice depth calibration, and the practicality and limitations of the four methods—multiple-pulse KD diffraction, single-pulse KD diffraction, RN diffraction, and parametric oscillation heating—are analyzed. The optical lattice depths obtained using the single-pulse and multiple-pulse KD diffraction methods maintain a high degree of linearity with the detection voltage over the entire range, and these two methods are applicable to a wide range of depths and time intervals. However, the single-pulse KD diffraction method determines the depth of the optical lattice through the fitting of experimental data, which requires collecting a large amount of data. This fitting process introduces potential errors and increases the complexity of the measurement. In the multiple-pulse KD diffraction method, the transmission fidelity of diffraction orders is highly sensitive to the lattice depth, and no data fitting is required during the measurement process, which ensures highly accurate calibration of the optical lattice depth. When the laser interaction time is long, the optical lattice depth measured by the RN diffraction method is consistent with the first two methods. However, as the interaction time between the optical lattice and the atoms increases, the diffraction process must account for changes in atomic momentum, and thus the optical lattice depth obtained by this method may have deviations from the true value. The parametric oscillation heating method can be used for optical lattices of different depths and is effective within a wide parameter range. However, at low depths, the wide energy band of the optical lattice increases the frequency range of atomic loss due to resonant heating, which affects the determination of the resonant frequency and further increases measurement error.ConclusionsThrough the analysis of the experimental results, we assess the practicality and limitations of the four trap depth measurement methods. RN diffraction is suitable for cases with short interaction time between the optical lattice and the atoms, and its core mechanism is phase modulation based on the momentum state. When the optical lattice interaction time becomes longer, the momentum change becomes significant, which leads to the breakdown of the diffraction mode approximation. The KD diffraction method has the advantage of a broad range of applicability in both time and depth. It can accurately describe multi-stage diffraction phenomena and remains effective even at high depths. Compared to the single-pulse method, the multiple-pulse KD diffraction method is based on the interference effect. By applying a series of pre-set optical lattice pulses, all atoms are transferred to the first-order diffraction momentum state. Compared to RN diffraction and the single-pulse KD diffraction method, this approach improves the intensity and resolution of the diffraction signal, thereby enhancing the accuracy of depth measurements. Furthermore, it has a broad range of applicability in both time and depth. The advantage of the parametric oscillation heating method is its direct detection of the lattice band structure and calibration through the relationship between band transition frequency and depth. However, at low depths, the frequency range of atomic loss caused by resonance heating increases, which can affect the determination of the resonance frequency. The multiple-pulse KD diffraction method enhances lattice depth measurement accuracy. Therefore, this method is expected to provide a technical reference for optical lattice quantum precision measurements and quantum regulation.
Apr. 27, 2025Vol. 45 Issue 7 0702001 (2025)
Zexiang Li, Yan An, Lichao Hu, Xiaohua Wang, Xinhang Li, Yansong Song, and Keyan Dong
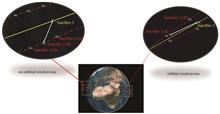
ObjectiveWith the large-scale deployment of low earth orbit (LEO) satellite constellations, the demand for inter-satellite laser communication has grown significantly. Compared to traditional microwave communication, laser communication offers higher data transfer rates, greater capacity, and higher security. However, most existing laser communication systems are designed for point-to-point configurations, which are insufficient for the communication requirements of large-scale satellite networks. In particular, traditional point-to-point systems cannot efficiently interconnect multiple satellites in LEO constellations. In this paper, we propose a novel laser communication system to address challenges related to field-of-view (FOV) and long-distance communication in LEO satellite networks. By introducing a new laser communication system that supports multipoint communication, this approach facilitates the transition from point-to-point configurations to point-to-multipoint or multipoint-to-multipoint networking. The proposed system overcomes the limitations of narrow FOV and distance constraints inherent in traditional optical systems through advanced optical designs and system integration techniques.MethodsTo address the challenges of inter-satellite communication in LEO constellations, we first analyze satellite constellations and orbital configurations, detailing the relative positions and communication distances between satellites both within the same orbit and across different orbits. This orbital analysis is crucial for determining communication link characteristics and ensuring the optical system meets the required communication distances. Subsequently, a panoramic optical system is proposed, employing a dual-mirror configuration to achieve a wide FOV, which is essential for satellite network communication. The dual-mirror design significantly reduces optical aberrations compared to traditional block lens systems. Ray-tracing techniques and vector reflection laws are applied to analyze the interaction between light rays and the system’s optical components, linking outgoing rays to the desired FOV. Furthermore, a freeform mirror is designed and optimized using a point-by-point calculation method to derive its characteristic parameters, and an XY freeform surface is subsequently generated using fitting software. Finally, the freeform mirror is integrated with the rear mirror group, relay system, and collimation-coupling system to form a complete panoramic laser communication system. To verify the feasibility of the system, indoor equivalent validation experiments are conducted, simulating space losses through reduced transmission power, active attenuation, and decreased receive sensitivity to assess the system’s performance under real-world conditions.Results and DiscussionsIn this paper, we propose a novel optical system tailored to the inter-satellite communication requirements of LEO satellite constellations. First, a panoramic optical system with a dual-mirror configuration is proposed, offering a significantly larger FOV than traditional Cassegrain optical systems (Fig. 14). This dual-mirror design effectively mitigates chromatic aberrations, thus enhancing communication link performance. Second, the integration of freeform mirror technology into the panoramic optical system further enhances light distribution and beam shaping, particularly at the FOV edges, effectively reducing optical aberrations and improving overall system performance. By optimizing the freeform mirror, the modulation transfer function (MTF) at the edges of the FOV is further improved, significantly enhancing image quality and reducing optical distortion by approximately 10%. Moreover, beam divergence is reduced by 60% compared to traditional aspheric systems, thus improving signal quality (Fig. 15). These innovations have been experimentally validated through indoor active attenuation experiments (Table 7), demonstrating the system’s long-distance communication performance. The combination of panoramic optical design and freeform mirror technology provides an innovative solution for future wide-field inter-satellite communication.ConclusionsThe proposed laser communication system successfully addresses the challenges of inter-satellite communication in LEO satellite constellations, meeting FOV requirements of 30°?70° and -30°?-70° with a maximum communication distance of 1200 km. Compared to traditional point-to-point communication systems, this design offers a wider FOV, enabling more flexible and efficient communication between satellites. The freeform mirror design further enhances image quality at FOV edges and reduces optical aberrations, which is critical for long-distance inter-satellite communication. Experimental results demonstrate that the system is capable of achieving a low bit error rate (BER) under simulated space-loss conditions, validating its feasibility for practical applications. Overall, the laser communication system proposed in this paper advances the development of point-to-multipoint and multipoint-to-multipoint systems, offering new possibilities for reliable and high-performance satellite communication networks and laying the foundation for future innovations in optical communication systems.
Apr. 22, 2025Vol. 45 Issue 7 0706001 (2025)
Xinyao Wang, Xin Zhao, Chenyan Shu, Xiaoying Ding, Zhuo Wang, and Jiahui Liu
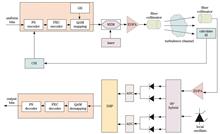
ObjectiveWhen optical signals are transmitted through atmospheric turbulence channels, the signal transmission quality is degraded due to channel attenuation caused by aerosol particles in the atmosphere, as well as beam drift and scintillation due to atmospheric turbulence. This leads to an increase in the communication bit error rate and a decrease in channel capacity, which severely affects the performance of the communication system. Therefore, based on the real-time changes in the atmospheric channel state, an efficient adaptive transmission scheme is designed at the transmitter to effectively mitigate the degradation of the transmitted signal caused by atmospheric turbulence. At the same time, M-th quadrature amplitude modulation (M-QAM) signals have become a hot topic in recent research on new modulation methods due to their high-frequency band utilization and anti-noise performance. With this modulation method, the data transmission rate can reach tera bits per second (Tbit/s). In this context, turbulence changes in the atmospheric channel can be regarded as a slow fading process. Under these conditions, it is feasible to adaptively adjust the optimal probability distribution of the transmitted signal using genetic algorithms, based on the real-time acquired turbulent channel state information in combination with probabilistic shaping technology. Furthermore, by combining geometric shaping technology, the signal’s resilience to turbulence can be further enhanced, thereby improving communication quality. In this study, research is conducted under the Gamma-Gamma turbulent channel model. The proposed scheme integrates adaptive probabilistic shaping with geometric shaping based on channel conditions and provides a system model. This scheme can effectively improve the generalized mutual information of QAM signals and alleviate the effect of atmospheric turbulence on communication systems.MethodsBased on the phase noise generated by the electrical demodulation module, treated as Gaussian noise, we consider the influence of different turbulence intensities on the laser signal. It obtains the turbulent channel state information in real time through the scintillation index calculation device and feeds this information back to the transmitter. An adaptive communication system model is then constructed based on the channel state. At the transmitter, the optimal probability distribution of the transmitted signal is determined through iterative optimization using a genetic algorithm, with the maximum generalized mutual information as the objective. The transmitted signal is adjusted to the optimal distribution through a distribution matcher. Next, combined with geometric shaping technology, the square QAM constellation is transformed into a symmetrically distributed circular arrangement, which realizes a research scheme that integrates adaptive probabilistic shaping with geometric shaping. For the low signal-to-noise ratio under different scintillation indices, we calculate and analyze the generalized mutual information of the proposed scheme, the bit error rate before forward error correction decoding, and the normalized generalized mutual information.Results and DiscussionsTo solve the problems of high bit error rates and low generalized mutual information caused by the influence of atmospheric turbulence on uniformly distributed signals in atmospheric channels, we propose an adaptive probabilistic shaping technique combined with geometric shaping, which is based on time-varying turbulent channel state information under QAM modulation. Compared with uniform distribution or the application of single probabilistic shaping or geometric shaping, the constellation diagram obtained by the scheme proposed in this paper not only significantly reduces the aliasing phenomenon (Fig. 6) but also facilitates signal judgment. In terms of generalized mutual information, the signal after joint shaping shows a gain of 0.07 bit/symbol compared with uniform distribution (Fig. 7). In addition, when the scintillation index is 0.1, the bit error rate of the joint shaping scheme proposed in this paper is reduced from 7.6×10⁻² to 9.5×10⁻³ (Fig. 9), which achieves an order-of-magnitude improvement compared with uniform distribution.ConclusionsWe propose a technical scheme for adaptive probabilistic shaping combined with geometric shaping based on channel conditions. At the transmitting end, the optimal probability distribution of the transmitted signal is explored using a genetic algorithm. The proposed scheme is simulated under turbulence intensities corresponding to different scintillation indices, and the generalized mutual information, normalized generalized mutual information, and bit error rate performances of the four schemes—uniform distribution, geometric shaping, adaptive probabilistic shaping, and adaptive probabilistic shaping combined with geometric shaping—are analyzed in detail. The results show that, compared with the uniform distribution or single constellation shaping schemes, the adaptive probabilistic shaping combined with the geometric shaping scheme proposed in this paper achieves the best communication performance. It can reduce the bit error rate of the communication system, improve the generalized mutual information of the system, and alleviate the influence of atmospheric turbulence on the signal to some extent. Due to experimental limitations, we only simulate and verify the proposed scheme. In the actual communication process, to ensure the smooth implementation of this scheme, the optimal distribution lookup table for the transmitted signal can be pre-established through simulation experiments to ensure that signal shaping and transmission are completed quickly within the atmospheric coherence time. In summary, the adaptive probabilistic shaping combined with the geometric shaping scheme proposed in this paper provides a new approach to improving the performance of laser communication systems.
Apr. 16, 2025Vol. 45 Issue 7 0706002 (2025)
Xianfei Hu, Jinbin Gui, Zhao Dong, Junchang Li, Qinghe Song, Lei Hu, and Zhuojian Tong
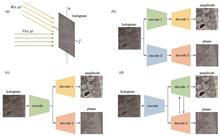
ObjectiveThe digital hologram reconstruction process has experienced significant improvements in recent years due to the rise of deep learning techniques. Unlike traditional reconstruction methods that primarily rely on complex optical setups and post-processing algorithms, deep learning-based methods provide the potential for faster, more efficient, and more accurate reconstructions. However, the effectiveness of deep learning models in digital holography is often constrained by the quality and quantity of available training data. High-quality and large-scale holographic datasets are difficult to obtain, with significant challenges in terms of both the complexity of data generation and associated costs. This creates a critical bottleneck in developing deep learning models capable of delivering high-performance hologram reconstructions. While deep learning techniques have demonstrated impressive results in holographic reconstruction with sufficient data, the problem becomes far more difficult when the available datasets are limited in size or quality. We investigate hologram reconstruction with small sample datasets and provide an innovative solution in the form of a graph neural network (GNN) model designed to enhance reconstruction performance by effectively capturing the physical relationships between amplitude and phase information in holograms.MethodsWe propose a GNN-based model for digital hologram reconstruction that addresses the limitations imposed by small sample datasets. The primary challenge in digital holography lies in the complex correlation between the amplitude and phase of the reconstructed light field. Traditional methods often struggle to capture these complex relationships accurately under scarce training data. By leveraging the capabilities of graph-based neural networks, our model can effectively encode these amplitude-phase correlations. Specifically, the GNN model constructs a graph structure that represents the physical relationships between pixels in the hologram, allowing it to learn the underlying patterns of light propagation more effectively than traditional convolutional neural network (CNN). To overcome the challenges of few-shot learning (FSL), we consider the intrinsic relationship between the amplitude and phase of the light field. The model takes the raw hologram as the input and performs joint modeling and inference of both amplitude and phase features by GNN. This approach allows the amplitude and phase to complement each other during the reconstruction process, enhancing the overall quality of the model’s output. In particular, the model first extracts initial amplitude and phase features from the input hologram. Then, by adopting the graph structure, GNN iteratively refines these features by considering the relationships between amplitude and phase during the inference process. This enables the model to restore both the amplitude and phase information of the light field accurately, even under limited data. To train the model, we employ a small dataset consisting of ten animal cell mitosis slices. Though small, this dataset provides sufficient labeled data for supervised training while adhering to the FSL scenario.Results and DiscussionsThe proposed GNN model is evaluated by a series of experiments on both synthetic and real holographic datasets. The results indicate that the GNN model consistently outperforms traditional deep learning approaches in terms of both amplitude and phase reconstruction, especially in scenarios where the sample size is limited. In particular, the GNN model demonstrates exceptional performance in recovering the phase information, which is notoriously difficult to reconstruct by employing conventional methods. The ability of the model to accurately capture amplitude-phase correlations significantly improves the overall quality of the reconstructed holograms. Compared to other models, GNN shows better generalization capabilities when faced with small sample datasets, indicating that it can leverage the existing data more efficiently and avoid overfitting. Additionally, our experiments show that the model can reconstruct the light field with minimal detail loss, even in low-light conditions, which highlights its robustness. The improvements in both amplitude and phase reconstruction are particularly notable in complex holograms with high-frequency components, where traditional methods tend to fail or require extensive data preprocessing. Furthermore, the GNN model demonstrates the ability to generalize across different types of holograms, suggesting that the model’s effectiveness is not restricted to specific datasets but can be adapted to a variety of experimental conditions. The physical insights gained from the graph-based approach provide new perspectives on the interplay between the amplitude and phase, deepening the understanding of how light field information is encoded and reconstructed in digital holography.ConclusionsWe propose a novel approach to digital hologram reconstruction by GNNs, which significantly improves the reconstruction performance in small sample conditions. The ability of the GNN model to effectively model the complex physical relationships between amplitude and phase information is a key factor in its success. Experimental results demonstrate that GNN outperforms traditional deep learning models, particularly in terms of phase reconstruction, and provides a viable solution for hologram reconstruction even with limited training data. Our study lays a solid foundation for further advancements in digital holography and deep learning applications, particularly in situations where data acquisition is limited or expensive. By addressing the challenges of small sample datasets, the proposed model provides new possibilities for the practical implementation of digital holography in real-world applications, such as medical imaging, optical testing, and industrial inspections. Future research may explore further optimizations of the GNN architecture and its application to more diverse types of holographic data, potentially broadening its applicability and improving its robustness.
Apr. 27, 2025Vol. 45 Issue 7 0709001 (2025)
Linshan Chen, Yining Zhao, Meng Wang, Shuaiming Chen, Lingxin Kong, Chong Wang, Cheng Ren, and Dezhong Cao
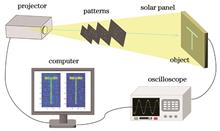
ObjectiveBucket detectors, commonly used in ghost imaging systems, include charge coupled devices (CCDs), complementary metal oxide semiconductor (CMOS) sensors, silicon photocells, single-photon detectors, and perovskite detectors. However, these detectors often come with high costs, limiting the widespread application of ghost imaging. Therefore, it is important to explore low-cost detectors to make ghost imaging more accessible. In this paper, we propose using silicon solar panels as bucket detectors in ghost imaging systems and investigate the performance of image reconstruction in this low-cost configuration. Silicon solar panels offer advantages such as broad-spectrum sensitivity and high efficiency. Additionally, with the rapid development of silicon-based photonic integrated circuits, silicon solar panels now feature high integration, which allows for the collection, processing, and analysis of experimental data on a single compact device. This integration can substantially lower the manufacturing costs of bucket detectors. Our goal is to explore the potential of silicon solar panels as a cost-effective alternative to traditional detectors in ghost imaging systems and to evaluate their performance under various sampling conditions and reconstruction algorithms.MethodsWe propose a pseudo-inverse ghost imaging system using commercial silicon solar panels as bucket detectors. In this system, the object light is captured by the silicon solar panel and converted into a voltage signal, which serves as the measurement signal, also called the bucket signal. In the experiment, a series of binary random patterns, generated by a projector, are sequentially projected onto the object, which is placed close to the silicon solar panel. The output voltage signals are digitized by an oscilloscope and then transmitted to a computer for image reconstruction. To verify the feasibility of the proposal, we first confirm the linear relationship between the output voltages of the silicon solar panel and the number of illuminated pixels. The deviation between the experimental data and theoretical predictions is minimal. For comparison, we also perform ghost imaging experiments using a CCD as the bucket detector under similar conditions. Image quality is evaluated using standard metrics. To further enhance image quality and optimize the experimental setup, various reconstruction algorithms are applied, including the correlation algorithm, pseudo-inverse algorithm, Schmidt orthogonalization, compressed sensing, and filtering techniques. The performance of ghost imaging with these methods is compared under different sampling rates.Results and DiscussionsThe verification of the linear relationship between the voltage signals from the silicon solar panel and the illuminated area demonstrates the feasibility of the proposed experimental setup (Fig. 2). Following this, 4096 speckle patterns are generated, and the object “T” is imaged. To evaluate the performance of silicon solar panels as bucket detectors, we conduct several experiments at different sampling rates and reconstruction algorithms. Similar experiments with a CCD as the bucket detector are also conducted for comparison. The experimental results are shown in Figs. 3 and 4. When the sampling rate exceeds 40%, the object’s outline becomes more distinguishable, and the results from the silicon solar panel closely match those obtained from CCD detectors. However, the silicon solar panel offers a significant cost advantage, being much more affordable than CCDs. Fig. 5 presents the peak signal-to-noise ratio (PSNR) values of the reconstructed images under various sampling rates and reconstruction algorithms. The results indicate that, in comparison to CCDs, the PSNR values for images reconstructed using silicon solar panels remain stable across different conditions. This stability highlights the robustness of the system, with the silicon solar panels demonstrating superior fault tolerance and ease in selecting an optimal sampling rate. As a result, the system can maintain high-quality image reconstruction even under variable conditions or environments. Furthermore, Fig. 6 shows the structural similarity index (SSIM) values for the reconstructed images under different sampling rates and algorithms. The SSIM results corroborate the findings from the PSNR analysis, demonstrating that the use of silicon solar panels as detectors leads to stable image recovery, even under low sampling conditions. This suggests that silicon solar panels can provide reliable and high-quality imaging performance in resource-constrained environments, making them an attractive option for practical ghost imaging applications.ConclusionsWe propose a pseudo-inverse ghost imaging system based on silicon solar panels as bucket detectors. The low-cost silicon solar panels deliver good performance in reconstructing images, demonstrating their potential as viable alternatives to traditional, more expensive detectors like CCDs. Various reconstruction algorithms such as the pseudo-inverse, Schmidt orthogonalization, and quadratic filtering techniques are applied, and the results show that high-quality, stable images can be obtained even with low sampling rates. The silicon solar panels’ excellent photovoltaic properties, broad spectral response, and low cost have made them widely used in fields such as environmental monitoring, intelligent transportation, building surveillance, security, disaster monitoring, and aerospace. Our imaging system not only broadens the application scope of ghost imaging but also integrates silicon solar panels into cost-effective, high-efficiency detection and monitoring technologies, paving the way for more practical applications in real-world scenarios.
Mar. 21, 2025Vol. 45 Issue 7 0711001 (2025)
Bingfeng Liu, Lianqing Zhu, Lidan Lu, Weiqiang Chen, and Mingli Dong
ObjectiveMid-wave infrared (MWIR) detectors, with a spectral range of 3?5 μm, are indispensable in a wide range of applications, including aerospace, missile early warning systems, infrared imaging, biochemical gas detection, and environmental monitoring. There is an increasing demand for high-performance MWIR focal plane arrays (FPAs) to support the development of compact, efficient, and high-resolution imaging systems. However, traditional MWIR materials like InSb and HgCdTe (MCT) face inherent challenges. InSb detectors, with their narrow bandgap tunability and low operating temperatures (~80?100 K), are limited in applicability to compact infrared systems. MCT, despite its tunable bandgap, suffers from poor material uniformity, high defect density, and limited scalability for large arrays. To address these issues, III-V semiconductor materials, particularly InAs/InAsSb type-II superlattices (T2SLs), have emerged as promising candidates due to their excellent material uniformity, larger bandgap tunability, and compatibility with low-cost substrate technologies. This study focuses on the design, fabrication, and performance characterization of InAs/InAsSb T2SL-based MWIR FPAs, with an emphasis on achieving high operating temperature (HOT) performance. We employ an nBn barrier structure and strain-balanced epitaxial growth via molecular beam epitaxy (MBE) to fabricate 640×512 array detectors and evaluate their material and optoelectronic properties under operational conditions.MethodsThe nBn structure is designed to minimize dark current and enhance carrier transport. The epitaxial layers are grown on n-type GaSb (001) substrates using solid-source MBE. Key parameters, including growth temperature, V/III beam equivalent pressure ratios, and layer thicknesses, are carefully optimized to achieve strain balance and high crystal quality. Real-time monitoring with reflection high-energy electron diffraction (RHEED) ensures precise control of the growth process. The complete nBn structure comprises a 200 nm n-doped InAs/InAsSb T2SL bottom contact layer, a 3 μm unintentionally doped T2SL absorber layer (AL), a 180 nm AlAsSb barrier layer (BL), a 200 nm n-doped T2SL top contact layer, and a 20 nm n-doped InAs capping layer. The T2SL layers consist of alternating InAs (3.75 nm) and InAsSb (1.3 nm) layers with constant Sb composition. Device fabrication involves ICP etching to define the mesa structure, followed by dielectric passivation to reduce surface leakage currents. Ti/Pt/Au metal contacts and In bump interconnects are then deposited to establish reliable electrical connections. The fabricated 640×512 FPAs are hybridized with readout integrated circuits (ROICs) via flip-chip bonding. The final devices are encapsulated in Dewar packages for performance testing at 130 K. Material characterization methods include atomic force microscopy (AFM) for evaluating surface morphology and high-resolution X-ray diffraction (HRXRD) for assessing crystal quality and lattice matching. Optoelectronic characterization involves spectral response measurements, dark current analysis, and imaging performance evaluation.Results and DiscussionsAFM results confirm the excellent surface morphology of the epitaxial layers. Root mean square (RMS) surface roughness values are measured at 0.239, 0.200, and 0.179 nm for scanning areas of 50 μm×50 μm, 5 μm×5 μm, and 1 μm×1 μm, respectively (Fig. 3). The presence of atomic steps in the smallest scanned area indicates high surface quality and precise control over the epitaxial growth process. HRXRD analysis further validates the structural quality of the layers. The (004) ω-2θ diffraction profile exhibits sharp and well-defined satellite peaks (SL is ±1, ±2, ±3), with the full width at half maximum (FWHM) of the primary SL0 peak measuring 25.1″ (Fig. 5). These results confirm the successful implementation of strain-balanced growth and precise lattice matching between the T2SL layers and the GaSb substrate. Additionally, the atomic number fraction of Sb of 0.35 in the absorber layer is consistent with the design specifications, while the barrier layer demonstrates excellent alignment with the substrate lattice. The fabricated MWIR FPAs exhibit outstanding performance under hot conditions. At 130 K, the detectors achieve an average peak detectivity of 4.81×1011 cm·Hz1/2·W-1, with a noise equivalent temperature difference (NETD) of 15.8 mK. The defective pixel rate is as low as 0.16%, and the responsivity non-uniformity is measured at 4.67% (Table 1). The devices exhibit a 50% cutoff wavelength of 5.18 μm and a 100% cutoff wavelength of 5.75 μm (Fig. 9), which fully meets the requirements for MWIR detection applications. Dark current analysis indicates that, at a -0.5 V bias, the device exhibits a dark current density of 4.57×10⁻⁵ A/cm2 at 150 K, which increases to 9×10⁻² A/cm2 at 295 K [Fig. 8(a)]. The Arrhenius plot of the J-V characteristics reveals an activation energy of 206 meV for temperatures above 150 K, which closely matches the material’s bandgap energy. This strongly confirms that diffusion current is dominated in this range [Fig. 8(b)]. At lower temperatures, tunneling currents become more significant, with an activation energy of 25 meV. Imaging tests at 130 K further demonstrate the detector’s capability to capture high-resolution thermal images. The device effectively resolves fine thermal details, such as facial features, flame contours, and subtle temperature variations on textured surfaces (Fig. 10). These results confirm the detector’s high temperature resolution and imaging quality, which makes it ideal for applications that require detailed infrared imaging and target detection.ConclusionsThis study demonstrates the potential of InAs/InAsSb T2SL MWIR FPAs for high-performance infrared imaging under hot conditions. The optimized nBn barrier structure and strain-balanced epitaxial growth lead to superior material quality, low dark current, and high detectivity. The 640×512 array exhibits excellent uniformity, low noise, and robust imaging performance, which confirms its suitability for MWIR imaging systems. The detector’s performance highlights its potential as a viable alternative to traditional MWIR materials like InSb and MCT, particularly in applications requiring compact, high-temperature-capable systems. Future efforts will focus on scaling the array size further, optimizing device fabrication processes, and integrating advanced ROICs to enhance system-level performance. These advancements aim to broaden the technology’s applicability in portable, high-resolution, and high-dynamic-range infrared imaging systems.
Apr. 27, 2025Vol. 45 Issue 7 0712001 (2025)
Chunmiao Xu, and Wenlin Gong
ObjectiveTraditional optical imaging systems project images of a scene at different distances onto a two-dimensional image, which results in the loss of distance information of targets in the scene. This limitation makes it difficult to meet the requirements of many fields, such as autonomous driving, biological imaging, and deep space exploration. Compared to active ranging methods, passive ranging methods have become a research hotspot in recent years due to their simplicity, low power consumption, and rich texture structure. Furthermore, they do not require additional active light sources for illumination. Currently, passive ranging methods mainly include multi-view stereo vision, monocular defocus, and monocular computational reconstruction via wavefront coding. Due to their simplicity, lower cost, and better application prospects, passive ranging systems based on monocular defocus have recently gained widespread attention. However, this method has limitations in measurement accuracy and non-unique distance decoupling. In this paper, we propose a high-precision passive ranging and refocusing method based on traditional optical imaging systems and two-frame detection signals. The proposed method can not only restore the target’s focused image when it is defocused but also solve the problem of non-unique decoupling of distance information, which is present in traditional monocular defocus ranging methods and achieve higher ranging accuracy. This work is useful for the accurate recognition of airborne targets and three-dimensional (3D) microscopic imaging.MethodsBy combining the compressive sensing image reconstruction algorithm with the gradient difference image quality evaluation function, we propose a high-precision passive ranging and refocusing method based on a traditional optical imaging system and two-frame detection signals (Fig. 2). Firstly, the point spread function (PSF) measurement matrix library is pre-calibrated/pre-computed in combination with the optical imaging system. Secondly, two frames of images of the scene target are recorded by the CCD. Thirdly, two sets of image sequences are reconstructed based on the theory and reconstruction algorithm of compressive sensing, and the image quality evaluation function (IQEF) is used to evaluate the image reconstruction results. Using the value of IQEF, the optimized image of the target can be achieved, and preliminary distance information of the target is obtained through the distance decoupling method (Fig. 3). Finally, highly accurate target distance information can be obtained by using the compressive sensing image reconstruction algorithm with an orthogonal constraint and an evaluation function based on the slice image information ratio.Results and DiscussionsTo demonstrate the validity of the proposed passive ranging and refocusing method, we build an optical imaging experimental system based on Fig. 2(a) for verification. In this case, the system’s depth of field is set as ΔL=1.43 mm. According to Eq. (4), the reconstruction results and normalized IQEF curves are shown in Figs. 4?6 based on two-frame detection signals and different PSF measurement matrices. Similar to the monocular defocus ranging method, the IQEF curve for each detection signal shows a structure of two peaks due to the symmetrical decoupling problem (Fig. 6). By combining the peak position of the IQEF curve, the coarse ranging architecture in Fig. 3, and Eq. (8), the problem of symmetrical decoupling is effectively solved in monocular defocus ranging, and it can be determined that the distance of the target is approximately 254.5 mm. Furthermore, by analyzing the influence of the searching step and the axial distance deviation (Δz) of two-frame detection signals on the accuracy of coarse ranging, the experimental results show that when the axial distance deviation Δz is greater than ΔL/2, the accuracy of coarse ranging method can reach ΔL/2 (Figs. 7 and 8). On the basis of the coarse ranging method, when the proposed TVAL3+OC reconstruction algorithm and the evaluation function of slice image information ratio are adopted, the target’s distance is confirmed near 252.8 mm and its ranging accuracy can reach ΔL/16 (Fig. 10), which is one order of magnitude higher than the existing monocular defocus ranging method.ConclusionsFaced with the low ranging accuracy and non-unique decoupling of distance information in the monocular defocus ranging method using a traditional optical imaging system, we propose a passive ranging and refocusing method based on two-frame detection signals. By combining the compressed sensing image reconstruction theory and two-frame detection signals, a clear target image can still be obtained even if the target is defocused and the accuracy of coarse ranging can reach half of the system depth of field (ΔL/2) when the axial distance deviation of two-frame detection signals is not smaller than ΔL/2. Based on the results of coarse ranging, the ranging accuracy of the target can reach ΔL/16 when the proposed precision ranging algorithm with orthogonal constraint is used. This work not only solves the problem of non-uniqueness in distance information acquisition that exists in the traditional monocular defocus ranging method, but also achieves higher-precision ranging. The proposed method has important application prospects in scenarios such as passive detection and ranging of aerial targets at medium and long distances, and three-dimensional microscopic imaging. When deep learning technology is introduced into the reconstruction process of coarse and precision ranging, the speed of target image reconstruction and distance information extraction is expected to improve dramatically. Moreover, high-precision ranging of small targets under conditions of low detection signal-to-noise ratio is an issue that needs further investigation in future work.
Mar. 20, 2025Vol. 45 Issue 7 0712002 (2025)
Xiangyi Jin, Yangyi Shen, Xinxin Kong, and Wenxi Zhang
ObjectiveLaser heterodyne interferometry is widely used in applications such as vibration measurement, velocity measurement, and displacement measurement. Traditional methods for eliminating the effect of laser frequency noise on measurements have mainly focused on reducing the laser noise itself. To suppress the effect of laser frequency noise on heterodyne interferometric signal, we study the model of laser frequency noise’s effect on the heterodyne interferometric signal, simulate the resulting tendencies and suppression extent with compensation fibers, and finally validate the suppression method through experimentation.MethodsA typical laser heterodyne interferometric structure is introduced, and the transitive relation from laser frequency noise to displacement noise is derived mathematically. A simulation system is set up, with input parameters including laser wavelength, laser emission power, laser frequency noise, coupler ratio, modulator frequency, photodetector gain, sampling rate, sampling time, and the passband and stopband frequencies of the low-pass filter. The variable is the measuring optical lengths, which are successively set to 0, 10, 20, and 30 m. The outputs are the power spectral densities of displacement. Three conditions are set: shot noise only, laser frequency noise only, and both shot noise and laser frequency noise considered. Root mean squares (RMSs) of power spectral densities in certain frequency ranges are calculated for the three conditions. The results are presented in a graph to show the trend. Similar work is conducted to show the graph of RMS-laser frequency noise at 0, 10, 20, and 30 m optical lengths. Compensation for the 30 m optical length fiber is simulated. The experiment is conducted using fibers of different optical lengths. The delay fibers with optical lengths of 30 and 154.1 m are used to simulate the real measuring optical length in air. Compensation results are recorded for comparison.Results and DiscussionsThe model analysis shows that in the non-compensation situation, the measuring optical length causes a significant time lag in light propagation. Mathematical derivation indicates that the power spectral density of displacement is directly proportional to the power spectral density of laser frequency and the square of the time lag. The results imply that differences in optical length, causing propagation time lag, may be a significant error source in the laser heterodyne interferometer. Thus, by compensating for the optical length difference, the error could be suppressed. Simulation of the power spectral density of displacement at different measuring optical lengths shows that the total noise level increases as the optical length increases. The shape of the power spectral density changes distinctly, which indicates that the effect of optical length change differs across frequency ranges. In the case of long optical lengths, the power spectral density graph consists of a main lobe and several side lobes. The 0.9?1.1 MHz results of RMS show that shot noise does not change significantly as the optical length increases. Meanwhile, in the case of long optical lengths, the system is mainly affected by laser frequency noise, and shot noise becomes negligible. When laser frequency noise is considered, RMS increases by 0.01 pm?Hz-1/2 as the optical length increases by 1 m. The 9?11 MHz results of RMS show that noise increases first and then decreases as the optical length increases from 0 to 30 m. 15 m has the largest value of 0.08 pm?Hz-1/2. The 2?30 MHz results of RMS show that the RMS speed decreases as the optical length increases. The RMS-laser frequency noise graph indicates that laser frequency noise has little effect, and displacement noise does not increase as laser frequency noise increases at 0 m optical length. When the optical length is greater than 0 m, displacement noise increases linearly as the laser frequency noise increases. The slope of the line depends on the optical length and increases as the optical length increases. Simulation of compensation with a 30-m optical length fiber shows that displacement noise is efficiently suppressed, and the total noise is reduced to the shot noise level. The experimental results are in accordance with a deduction from derivation and simulation. In the 30-m experiment, the RMSs of 1?5 MHz are respectively 0.031, 0.096, and 0.028 pm?Hz-1/2 in the conditions of no delay fiber, with delay fiber, and with delay fiber and compensation fiber. In the 154.1-m experiment, they are 0.027, 0.106, 0.024 pm?Hz-1/2. The results validate the suppression method.ConclusionsWe demonstrate the analysis of the effect of laser frequency noise on the heterodyne interferometric signal and the method for its suppression. Theoretical derivation is conducted to obtain the relationship between the power spectral density of laser frequency noise and that of displacement. The power spectral density of displacement is used to represent the magnitude of the noise effect. A numerical simulation is conducted to present the trend of the effect. The results show that displacement noise increases as laser frequency noise increases, and similarly, displacement noise increases as the detecting optical length increases. In the simulation, detecting optical length is set to be 15 m and laser frequency noise is set to be 3 Hz?Hz-1/2. After adding the compensation fiber of 30-m optical length, the RMS of power spectral density of displacement between 2 and 30 MHz decrease from 0.08 to 0.02 pm?Hz-1/2 in the simulation. The experiment using 154.1 m compensation fiber is done for compensating the effect of delay fiber. The RMS of power spectral density of displacement decreases from 0.106 to 0.024 pm?Hz-1/2. The experiment validates the method for suppression. It is implied that inserting delay fiber can sufficiently suppress the impact of laser frequency noise in heterodyne interferometry.
Mar. 20, 2025Vol. 45 Issue 7 0712003 (2025)
Jiaqi Feng, Zhongguang Yang, Zhang Zhang, Wen Chen, Jinpei Yu, and Liang Chang
ObjectivePose estimation for non-cooperative spacecraft involves determining the spatial position and attitude of spacecraft that lack active cooperation devices, such as defunct satellites or space debris. This technology is critical for advanced space applications, including autonomous rendezvous and docking, on-orbit servicing, and orbital debris removal. For non-cooperative spacecraft with unknown geometric structures, a prominent research approach involves leveraging simultaneous localization and mapping (SLAM) to reconstruct the three-dimensional (3D) structure using model-based methods for pose estimation. Current methods often rely on feature-based techniques to establish the pose constraints, followed by pose graph optimization to minimize cumulative estimation errors. However, the time-consuming nature of feature extraction poses challenges for real-time applications, and existing information matrices may inadequately represent pose estimation uncertainties. Sensors for pose estimation can be categorized as passive or active. Passive sensors are low-cost and high-frame-rate but can be affected by lighting variations. In contrast, active sensors like lidar directly acquire 3D point clouds, offering high accuracy and being less susceptible to lighting and scale variations. Therefore, we utilize lidar as the sensor for pose estimation. To enhance real-time performance and model reconstruction accuracy, we propose a non-feature-based 3D reconstruction and pose estimation method (NFRPE-3D) using lidar point cloud data.MethodsFirst, we apply the iterative closest point (ICP) algorithm to execute a keyframe registration technique to obtain the relative pose, which is then recursively used to estimate the pose of the current frame. However, this process can introduce cumulative errors. To mitigate these errors, we update the pose graph based on attitude relationships between keyframes, establishing loop constraints. Pose graph optimization is performed using the g2o framework. Notably, the loop constraints in the pose graph are established solely through attitude relationships, which eliminate the need for complex feature extraction and reduce computational overhead. To address the limitation of existing methods where the information matrix does not accurately reflect pose estimation uncertainty, we propose constructing the information matrix for graph optimization by minimizing the sum of squared distances between corresponding keyframe points, thus enhancing pose graph optimization accuracy. The optimized pose graph results are then used to reconstruct the target’s point cloud model. After model reconstruction, subsequent pose estimations are performed using a model registration strategy.Results and DiscussionsTo validate our method, we conduct a semi-physical simulation experiment using a 1∶1 satellite model under simulated space lighting conditions. We first evaluate the attitude and position estimation accuracy of various methods (Figs. 9?12, Table 2). Our methods achieve mean absolute errors of 2.34°, 1.67°, and 1.71° for the three-axis attitude, and 0.033, 0.007, and 0.025 m for the three-axis position, significantly outperforming other methods. Compared to existing feature-based methods, our method improves three-axis attitude and position accuracy by over 40%. A comparison of point cloud models before and after pose graph optimization (Fig. 13) shows that the proposed method effectively reduces cumulative errors and enhances model reconstruction accuracy. The reconstructed point cloud model (Fig. 14) delineates the overall structure, demonstrating the effectiveness of our model reconstruction step. Finally, the computational times of the methods are presented (Fig. 15). Overall, the maximum real-time computation time of our method does not exceed 0.2 s, and except for the model reconstruction step, the computation time remains below 0.1 s. The average computation time per frame is 0.040 s, demonstrating excellent real-time performance. Compared to existing feature-based methods, our approach increases the average computing speed by 95.8%.ConclusionsIn this paper, we propose a method named NFRPE-3D for point cloud model reconstruction and pose estimation of non-cooperative spacecraft using lidar point cloud data. The method establishes pose graph constraints based solely on attitude relationships between keyframes, eliminating the need for feature extraction and matching, which significantly reduces computational complexity. Furthermore, by minimizing the sum of squared distances between corresponding points in keyframes, we construct the information matrix for pose graph optimization, thus improving pose estimation accuracy. Experimental results demonstrate that NFRPE-3D effectively enables spacecraft model reconstruction and pose estimation. In the absence of target model information, pose estimation is dependent on keyframe registration, which can result in significant fluctuations due to cumulative errors. However, pose graph optimization effectively mitigates these errors, improving accuracy and stabilizing pose estimation. After model reconstruction, the model registration strategy further stabilizes pose estimation. Compared to existing feature-based methods, our approach improves three-axis attitude and position accuracy by over 40%, while also increasing the average computation speed by 95.8%.
Mar. 20, 2025Vol. 45 Issue 7 0712004 (2025)
Lei Nie, Yijun Xie, Yixin Xu, Xuanze Wang, Hang Zhao, Zhengqiong Dong, and Jinlong Zhu
ObjectiveWhite light scanning interferometry (WLSI) is a powerful technique for surface profilometry and has been widely applied in semiconductor inspection, additive manufacturing, film thickness characterization, and other precision measurements. However, in actual measurements, the hysteresis effect of piezoelectric ceramics and unpredictable environmental disturbances can distort the interference signal by increasing phase noise, leading to inaccurate localization of the zero optical path difference. Therefore, effectively suppressing phase noise without altering the structure of the white light interferometry system is significantly important in practice. In recent years, various approaches have been proposed to mitigate phase noise. Some scholars have developed advanced iterative algorithms to compensate for phase noise. However, these algorithms exhibit slow convergence and require additional computation for envelope and phase extraction, significantly increasing computational complexity, particularly for large-field interferometry. Other methods incorporate preprocessing techniques, such as short-time spectrum threshold denoising or improved complete ensemble empirical mode decomposition with adaptive noise (CEEMDAN), to filter out phase noise before integrating phase analysis for height extraction. However, these methods are constrained by pixel-by-pixel processing, limiting their efficiency. To address these challenges, we propose a multi-period moving difference phase noise preprocessing method. A multi-period difference equation is derived from the white light interference signal using a non-iterative least squares sinusoidal fitting approach. Compared to other preprocessing techniques, this method does not require additional hardware assistance or complex iterative optimization, ensuring an effective noise suppression rate while significantly reducing computational complexity. In addition, fast Fourier transform (FFT) and an improved seven-step phase shift method are combined to calculate the phase, minimizing scenarios where the phase step error is not π/2 and further improving phase calculation accuracy.MethodsIn this paper, we propose a fast multi-period differential signal preprocessing method, which is computationally efficient and can be processed using a forward recurrence operation. First, mathematical analysis is employed to separate key parameter information including step phase and phase noise from the white light interference signal. Using least squares sinusoidal fitting, a multi-period difference equation is derived. Then, leveraging the normal distribution characteristics of phase noise, the noise term in the equation is compensated, and moving differential filtering is applied to significantly suppress phase noise. Finally, FFT is utilized to extract the envelope of the interference signal after noise suppression, and the improved seven-step phase shift method is applied to enhance phase calculation, effectively minimizing the influence of residual phase noise.Results and DiscussionsSimulations and experiments are conducted to verify the computational efficiency and performance. The proposed method requires only 0.01 s to process a interference signal matrice with sampling length of 100 frame and size of 100 pixel×100 pixel, demonstrating an operational efficiency about ten times higher than that of Savitzky-Golay (S-G) filtering, continuous wavelet transform (CWT), and CEEMDAN, thus confirming its high computational efficiency. Table 1 shows the residual scanning errors of four different preprocessing methods under different noise levels. Compared to other methods, the proposed method yields the lowest residual scanning error (Δs), demonstrating superior performance in noise suppression. In addition, when the error amplitude increases to 50 nm, the residual scanning errors of the other three methods approach the Gaussian scanning error added by simulation, while the proposed method achieves a residual error that is only 30% of the simulated error value. To validate the feasibility and effectiveness of the proposed method, a standard step sample and an inner etching groove step sample are measured. The interference signal and carrier phase distribution with phase noise are illustrated in Fig. 3, while the denoised signals after preprocessing are shown in Figs. 4 and 6. The phase noise suppression rates for the two step samples after preprocessing are 92.8% and 94.6%, respectively. Repetitive measurements of 10 sets of data reveal that the average depth of the standard step height is (11.963±0.006) μm, with a relative error of 0.005% compared to the nominal value of (11.970±0.05) μm. In addition, to assess the model’s effectiveness for complex surface structures, the morphology and curvature radius of a microlens array are measured. The measurement results are shown in Fig. 9, while Table 6 demonstrates the 10-set statistical results of the curvature radius. The microlens array’s curvature radius is determined to be (1.082±0.016) mm, with a relative error of about 0.53% compared to the nominal value of (1.076±0.033) mm, further confirming the method’s effectiveness in surpassing phase noise and its applicability to complex structures.ConclusionsIn this paper, we propose a multi-period moving difference signal preprocessing method for white light interferometry, effectively mitigating unavoidable phase noise caused by mechanical vibrations and environmental disturbances. The multi-period differential filtering method, based on least squares fitting, applies a moving smoothing process to suppress phase noise efficiently. In addition, FFT-based coherence peak detection is integrated with an enhanced seven-step phase shift algorithm to accurately determine the zero optical path difference position, thus reducing the influence of residual phase noise on measurement accuracy. Comparative measurements of a standard step sample and an inner etching groove step sample demonstrate that the proposed method achieves a relative error of less than 0.7%, outperforming the frequency domain analysis (FDA) algorithm and the white light demodulation algorithm based on FFT and white light shift. The phase noise suppression rates for the interference signals of the two test samples are 92.8% and 94.6%, while the phase noise processing times are only 4.2764 s and 2.1235 s, respectively. In addition, microlens array measurements confirm that the proposed algorithm maintains high accuracy and repeatability even for complex structures. These results validate the effectiveness of the proposed phase noise suppression method and offer a new approach to anti-vibration measurement technology in low-vibration environments.
Apr. 15, 2025Vol. 45 Issue 7 0712005 (2025)
Fu Yang, Xudong Chai, Luwei Liu, Kai Wang, and Qing Xu
ObjectiveLithium niobate photonic integration represents a cutting-edge technology driving advancements in high-speed optical communication and optical information processing. On-chip power splitters are essential components in photonic integrated circuits. However, most traditional design schemes for power splitters are based on known physical effects. Geometries are typically determined by empirical models and optimized through fine-tuning of characteristic parameters. As a result, conventional designs have limited flexibility, which hinders further device integration. Unlike traditional design methods, the inverse design approach mathematically formulates the physical problem and employs various intelligent algorithms to iteratively compute the device structure based on the desired performance. This method fully explores the entire parameter space, overcoming conventional structural constraints and enabling the design of smaller, higher-performance optical devices. However, lithium niobate is an anisotropic material, meaning that the transmission characteristics of light waves within the device depend on the crystal orientation and propagation direction, necessitating future study of inverse design approaches for lithium niobate-based devices. In this paper, we incorporate the anisotropic properties of lithium niobate into the inverse design of 1×2 power splitters with different splitting ratios, utilizing both X-cut and Z-cut lithium niobate thin-film platforms. We compare the performance differences of power splitters with different crystal orientations to promote the application of inverse design methodology in highly integrated lithium niobate photonic circuits.MethodsThe device design area is divided into an M×N grid of equal-sized pixel cells. Each pixel has two possible states: etched (coded as 0) and unetched (coded as 1). In the simulation, the refractive index of lithium niobate is represented as a 3×3 diagonal matrix. The design process combines the DBS algorithm and 3D FDTD analysis, where the DBS algorithm iteratively generates new matrix states, and 3D FDTD evaluates the device’s figure of merit (FOM). The optimization continues until the target performance is reached or the maximum iteration count is achieved, at which point the final device structure is recorded.Results and DiscussionsThe inverse design of power splitters on a Z-cut/X-propagation lithium niobate thin-film platform is conducted. When the target ratio is 1∶1, the insertion losses of the optimized devices within the 1500?1600 nm wavelength range for three sizes (L1×L2=2.86 μm×2.42 μm, 2.86 μm×2.86 μm, 2.86 μm×3.30 μm) are 0.135 dB?0.188 dB (ΔIL=0.053 dB), 0.070 dB?0.097 dB (ΔIL=0.027 dB), and 0.030 dB?0.060 dB (ΔIL=0.030 dB), respectively (Fig. 4). As shown, all optimized devices exhibit low insertion loss (ξIL<0.2 dB), with IL showing minimal variation with the incident light wavelength (ΔIL<0.06 dB). When the target ratio is 1∶2, the input light wave is unevenly split into the two output waveguides, and the splitting ratio of the device closely matches the ideal target value, while the overall insertion loss remains below 0.22 dB (Fig. 5). Next, the inverse design of power splitters is carried out on an X-cut/Y-propagation lithium niobate thin-film platform. When the target ratio is 1∶1, the insertion losses of the optimized devices in the 1500?1600 nm wavelength range are 0.206 dB?0.258 dB (ΔIL=0.052 dB), 0.100 dB?0.135 dB (ΔIL=0.035 dB), 0.057 dB?0.077 dB (ΔIL=0.020 dB), respectively (Fig. 6). When the target ratio is 1∶2, the insertion loss of the device varies between 0.243?0.307 dB (Fig. 7).ConclusionsIn this paper, the inverse design of low-loss, compact 1×2 power splitters is carried out based on an anisotropic lithium niobate thin-film platform. The effects of design area sizes, splitting ratios, and crystal orientations on the inverse design results are also investigated. Firstly, three different sizes of 1∶1 and 1∶2 power splitters (2.86 μm×2.42 μm, 2.86 μm×2.86 μm, and 2.86 μm×3.30 μm) are designed on Z-cut/X-propagation and X-cut/Y-propagation lithium niobate thin-film platforms, respectively. The simulation results show that the devices exhibit low-loss characteristics within the 1500?1600 nm wavelength range. For a device size of 2.86 μm×2.86 μm, the insertion losses of the 1∶1 and 1∶2 power splitters are less than 0.14 dB and 0.31 dB, respectively, with the splitting ratios within the 100 nm operating bandwidth closely matching the target values, meeting the design requirements. The larger the design area size and the higher the number of pixels, the greater the design freedom, allowing for lower device loss, although this increases the simulation time. The inverse design results of the Z-cut/X-propagation and X-cut/Y-propagation lithium niobate thin-film platform are compared. The results indicate that devices designed based on the Z-cut/X-propagation platform are more likely to achieve lower loss due to the anisotropy of the lithium niobate crystals when TE-mode light waves are incident.
Apr. 27, 2025Vol. 45 Issue 7 0713001 (2025)
Lin Zhang, Longqin Xie, Zihan Xiang, Zhongmao Cai, Yatai Gao, and Weifeng Jiang
ObjectiveWith the rapid advancement of 5G (fifth generation of mobile communications technology), artificial intelligence, and big data, the demand for data transmission in optical communications is growing at an unprecedented rate. Conventional wavelength-division multiplexing (WDM) technology is constrained by the Shannon limit and fiber nonlinear effects, which makes mode-division multiplexing (MDM) technology essential to overcome communication capacity bottlenecks. Known for its high transmission capacity, integration, and scalability, silicon mode-division multiplexing systems are regarded as one of the most promising platforms for signal multiplexing. Among their components, the mode multiplexer/demultiplexer plays a crucial role. However, existing designs face several challenges, as conventional mode multiplexer/demultiplexer structures often suffer from large size and design complexity. While inverse design algorithms enable more compact layouts, they frequently require lengthy design cycles. To enhance device design efficiency, machine learning has been widely emphasized and studied in the field of photonics. In this study, we develop a silicon photonic device inverse design platform utilizing deep neural networks (DNN) and use it to inverse-design a silicon hybrid multiplexer/demultiplexer. The DNN-based inverse design platform for silicon photonic devices can significantly improve design efficiency and greatly expand design flexibility.MethodsThe inverse design platform is constructed using a DNN architecture, which includes one input layer, several hidden layers, and one output layer (Fig. 2). The input layer incorporates the operating wavelength, the desired transmittance, and three modes corresponding to a specific wavelength. The output layer consists of nodes that represent the distribution of subunits in the functional region. We combine the direct binary search (DBS) algorithm with the three-dimensional full-vector time-domain finite-difference (3D-FV-FDTD) method to compile the dataset, which ensures an appropriate division between the training and validation sets. The rectified linear unit (ReLU) is selected as the activation function, while the Adam optimizer is employed to approximate the nonlinear function and optimize the weights and biases during the training process. The binary cross-entropy (BCE) loss function is used to train the network model and measure the error between the predicted and actual outputs. By adjusting the number of hidden layers and neurons per layer, we identify the optimal configuration of hidden layers, neurons, and iterations. Ultimately, using the trained deep neural network model, we implement a silicon hybrid multiplexer/demultiplexer that achieves the desired performance through inverse design (Fig. 1). A silicon hybrid multiplexer/demultiplexer chip is fabricated using the complementary metal-oxide-semiconductor (CMOS) process (Fig. 8). Utilizing a self-constructed test system, we conduct performance tests on the silicon hybrid multiplexer/demultiplexer chip to evaluate the consistency between theoretical predictions and experimental results (Fig. 9).Results and DiscussionsUtilizing the established inverse design platform, the silicon hybrid multiplexer/demultiplexer can be designed within 10 ms, with a compact size of only 4.8 μm×2.56 μm (Fig. 1). Theoretical results indicate that the insertion losses for the TE0, TM0, and TE1 modes at the central wavelength are 0.48 dB, 0.19 dB, and 0.41 dB, respectively, while the 3 dB operating bandwidth exceeds 100 nm (Fig. 6). Experimental test results reveal that the insertion losses for the TM0, TE0, and TE1 modes at the central wavelength are 0.56 dB, 0.31 dB, and 0.93 dB, respectively. Within the 100 nm bandwidth range, the insertion loss remains below 3.75 dB, and the inter-modal crosstalk is less than -16.26 dB (Fig. 9). Compared to traditional ADC and AC structures, the silicon hybrid multiplexer/demultiplexer proposed in this paper effectively reduces the overall size of the device by introducing a functional area. In contrast to structures designed using conventional reverse design methods, the proposed structure enhances multiplexing/demultiplexing efficiency and minimizes the area of the required functional components by incorporating tapered waveguide units.ConclusionsIn this study, we present a photonic device inverse design platform built on DNN and conduct both theoretical and experimental studies of a silicon hybrid multiplexer/demultiplexer. Utilizing a combined approach of DBS and 3D-FV-FDTD methods, we collect 4077 data points as a dataset to train the neural networks. The architecture is optimized to include four hidden layers, each containing 120 neurons. With the developed inverse design platform, the efficient design of a silicon hybrid multiplexer/demultiplexer with arbitrary desired performance can be achieved by collecting the dataset just once. Using this platform, we successfully design a silicon hybrid multiplexer/demultiplexer with a size of only 4.8 μm×2.56 μm, which enables TM0, TE0, and TE1 mode multiplexing/demultiplexing. Theoretical results indicate that the insertion losses for the TE0, TM0, and TE1 modes at the center wavelength are 0.48 dB, 0.19 dB, and 0.41 dB, respectively, with a 3 dB operating bandwidth exceeding 100 nm. Experimental results reveal that the insertion losses for the TM0, TE0, and TE1 modes at the center wavelength are 0.56 dB, 0.31 dB, and 0.93 dB, respectively. Additionally, the insertion loss for the TE1 mode within the 100 nm bandwidth is less than 3.75 dB, and the inter-mode crosstalk is below -16.26 dB. We demonstrate the design of high-performance silicon mode-control devices using the DNN inverse design method, which serves as a crucial component for MDM networks. Furthermore, the DNN-based inverse design platform developed in this study can be extended to the design of various types of photonic devices, thus providing an effective tool for advancing photonic integration technology.
Mar. 20, 2025Vol. 45 Issue 7 0713002 (2025)
Ruiya Liu, and Bin Tang
ObjectiveWith the continuous development of optical technology, there is an increasing demand for the precise manipulation of light beams and efficient utilization of energy. However, traditional optical devices often have single functions, which makes it difficult to meet the complex and diverse needs of modern applications. In recent years, the introduction of phase change materials has not only enabled dynamic control of metasurfaces but also significantly enhanced their functionality and flexibility, which better addresses the requirements of multifunctional application scenarios. Phase change materials are highly sensitive to environmental changes and can alter their lattice states under external stimuli, which exhibits rapid phase switching and phase retention capabilities. Among various phase change materials, vanadium dioxide (VO2) has attracted attention due to its unique electrical and optical properties. Currently, most VO2-based metasurface structures can only achieve single-function control within specific wavelength ranges. However, research on metasurfaces that can integrate perfect absorption and anomalous reflection dual functions, while also possessing switchable characteristics, has not yet been reported. We theoretically and numerically propose a switchable dual-function metasurface based on the phase change characteristics of vanadium dioxide.MethodsThe designed metasurface structure consists of three layers: gold (Au) as the substrate, silicon dioxide (SiO2) as the dielectric middle layer, and a top layer made of a cross-shaped VO2 structure (Fig. 1). The electromagnetic simulations are performed by utilizing the finite-difference time-domain (FDTD) method. Circularly polarized light is incident on the metasurface along the negative direction of z-axis. To ensure the convergence of calculations, the simulation time is set to 30000 fs.Results and DiscussionsThe simulation results indicate that utilizing the reversible phase transition of vanadium dioxide between metallic and dielectric states, the metasurface can flexibly switch between a dual-band perfect absorber and a four-channel beam splitter. Specifically, when vanadium dioxide is in the metallic state, the designed metasurface structure can be regarded as a metal-insulator-metal (MIM) model, where the gold substrate and the top layer of metallic VO2 form a selective perfect absorber, which achieves dual-peak perfect absorption at wavelengths of 490 and 798 nm (Fig. 2). When vanadium dioxide is in the dielectric state, the structure can reflect the incident circularly polarized light into four equal-intensity anomalous reflected beams in the 720?770 nm wavelength range. This results in a conversion efficiency exceeding 90%, thus functioning as a broadband four-channel anomalous reflector (Fig. 3). Furthermore, as the wavelength increases, the anomalous reflection angle changes from 46.05° to 50.35° (Fig. 4). The theoretical calculations are consistent with the numerical simulation results. Finally, since the geometric dimensions of the structural parameters cannot be ignored in practical applications, we discuss the effects of the geometric parameters, i.e., thickness (h), structural period (P), cross width (w), and cross length (L), on the performance of the four-channel beam splitter. The results reveal that the structural parameters h and P significantly influence the anomalous reflection characteristics (Fig. 5), while variations in parameters w and L have a smaller impact on the anomalous reflection performance (Fig. 6).ConclusionsIn summary, we present a functional switchable metasurface based on the phase change characteristics of vanadium dioxide. By changing the temperature to alter the phase change characteristics of VO2, it is possible to switch between dual-band optical perfect absorption and beam splitting. When VO2 is in the metallic state, dual-peak perfect absorption is achieved at wavelengths of 490 nm and 798 nm. When VO2 is in the dielectric state, the structure can achieve a conversion efficiency exceeding 90% for four-channel broadband anomalous reflection in the 720?770 nm wavelength range. Ultimately, this switchable dual-function metasurface structure based on vanadium dioxide can achieve precise control over the direction, intensity, and wavelength of light beams, which facilitates dynamic optical path switching, multi-wavelength splitting, and non-traditional beam manipulation. This development provides new technological pathways for the integration of photonic chips, super-resolution imaging, and quantum optical devices, thus promoting the innovative advancement of multifunctional optical devices.
Apr. 10, 2025Vol. 45 Issue 7 0713003 (2025)
Zhengzhang He, Yiwen Liu, Sergei Turitsyn, and Xuewen Shu
ObjectiveLaser turbulence is a phenomenon caused by nonlinear interactions between millions of longitudinal modes in the cavity, which are far from the equilibrium state. The presence of turbulence can significantly alter the coherence and statistical properties of the laser, thus hindering the practical application of high-performance fiber lasers. As a typical nonlinear system, the continuous-wave fiber laser serves as an excellent platform for studying the laser turbulence phenomenon. Many phenomenological statistical methods have been applied to study laser turbulence. However, most of these methods use only a single approach. In this paper, we employ simulation experiments to demonstrate the differences between the laminar and turbulent states and analyze the effects of pump power, cavity length, and reflection bandwidth of the fiber Bragg grating (FBG) on the transition between these states in the cavity. Our simulation results provide important insights for better controlling laser turbulence and optimizing the application of high-performance Raman lasers.MethodsThe optical turbulence of the continuous-wave Raman fiber laser is modeled using the coupled nonlinear Schr?dinger equations for the pump and Stokes waves. First, by varying the pump power, we observe the transition from laminar to turbulent states in our simulations. The differences between these states are characterized by the output energy, the auto-correlation function, the intensity probability distribution, and the phase evolution. After analyzing a large dataset from simulations, we define the criteria for the laminar state as an auto-correlation background value greater than 0.94 and a spectral width of the laser less than 1/5 of the FBG’s reflection bandwidth. All other cases are considered turbulent states. Next, using the control variables method, we examine how pump power, cavity length, and FBG reflection bandwidth affect the laser’s operating state in the cavity, revealing key details of the laminar-to-turbulent transition process.Results and DiscussionsBy comparing and analyzing the differences between the laminar and turbulent states, we observe that the turbulent state exhibits unstable power distribution, weak time-domain coherence, and a probability density function close to a Gaussian distribution (Fig. 2). The spectral width of the turbulent state is significantly wider than that of the laminar state. As the pump power increases, the originally stable dark soliton structures are destroyed, and the creation and disappearance of unstable dark solitons give rise to a macroscopic turbulent structure (Fig. 4). By adjusting the cavity length of the resonant cavity, we find that shorter cavity lengths favor the generation of turbulence, while longer cavity lengths favor laminar states. However, overly long cavity lengths introduce greater background noise. In addition, increasing the cavity length results in significant undulations in the background of the dark soliton (Fig. 5). Adjusting the FBG reflection bandwidth reveals that too large a bandwidth reduces the modulation effect on the resonant cavity and introduces more spectral noise, while too small a bandwidth filters out the intrinsic modes of the resonant cavity, both of which lead to the formation of turbulence (Fig. 6).ConclusionsIn this paper, we provide mathematical conditions for delineating the laminar state and investigate the effects of pump power, cavity length, and FBG reflection bandwidth on the laminar-to-turbulent transition in the laser cavity. The results show that the realization of the laminar state is the result of the combined efforts of pump power, resonant cavity length, and FBG reflection bandwidth in maintaining equilibrium within the cavity. Our simulations demonstrate that larger pump power and shorter cavity length make the nonlinear effects in the cavity dominant, reducing the coherence of the laser and causing the transition from laminar to turbulent states. Only a very narrow FBG reflection bandwidth allows the laser system to maintain the laminar state, as the laser mode must strictly meet the requirements for steady laminar state evolution. To maintain the laminar state without disruption, factors such as low pump power, a resonant cavity length greater than the dispersion length, and a suitably narrow FBG reflection bandwidth are crucial. Our simulation results offer theoretical guidance for experimental studies on turbulence in fiber Raman lasers and contribute to improving the theory of laser turbulence. Lasers in the laminar state exhibit ultra-high time-domain coherence and extremely narrow spectral width, which may provide a reference for the future development of a new generation of high-performance fiber lasers.
Apr. 27, 2025Vol. 45 Issue 7 0714001 (2025)
Yuanyuan Peng, Haoyang Li, Wen Li, and Yuejin Zhang
ObjectiveRetinal vessel segmentation is a crucial task in ophthalmology, as it aids in the early detection and monitoring of various eye diseases, such as glaucoma, diabetic retinopathy, and hypertension-related retinopathy. Accurate segmentation can provide valuable insights into the microvasculature of the eye, which is essential for diagnosing and managing these conditions. However, retinal vessel segmentation remains challenging due to the complexity and variability of retinal images, including factors like low contrast, illumination variations, and vessel thickness discrepancies. Therefore, the objective of this study is to develop a robust and accurate segmentation algorithm that can effectively address these challenges.MethodsTo achieve this objective, we propose a novel CNN-Mamba network that integrates local intensity order transformation (LIOT) and dual cross-attention mechanisms. The proposed network architecture consists of three main components: a convolutional neural network (CNN) encoder for feature extraction, a series of Mamba blocks that incorporate dual cross-attention mechanisms to capture complex dependencies between distant regions in the image, and a segmentation head for producing the final vessel segmentation mask. In the preprocessing stage, LIOT is applied to the input retinal image to enhance its contrast and detail. LIOT works by rearranging pixel intensities within a local window so that the intensity order reflects the underlying structure of the vessels. This preprocessing step facilitates better feature extraction by the CNN encoder, as it highlights the edges and contours of the vessels. The CNN encoder is responsible for extracting local features from the preprocessed image and consists of a series of convolutional layers, batch normalization layers, and ReLU activation functions. The output of the CNN encoder is a set of feature maps that capture various aspects of the retinal image, such as texture, edges, and shapes. The Mamba blocks are the core of the proposed network. Each Mamba block contains two parallel branches: a pixel-level selective structured state space model (PiM) and a patch-level selective structured state space model (PaM). The PiM branch focuses on processing local features and capturing neighboring pixel information, while the PaM branch handles remote dependency modeling and global patch interactions. The dual cross-attention mechanisms within the Mamba blocks enable the network to capture complex dependencies between distant regions in the image, improving its ability to segment fine vascular structures. Finally, the segmentation head consists of a series of convolutional layers and a sigmoid activation function, which produce the final vessel segmentation mask.Results and DiscussionsExperimental results on benchmark retinal vessel segmentation datasets demonstrate the effectiveness of the proposed CNN-Mamba network. The network achieves superior performance in terms of accuracy, sensitivity, and specificity compared to state-of-the-art methods. In particular, the integration of LIOT and dual cross-attention mechanisms significantly improves the network’s ability to segment fine vascular structures, even in challenging cases with low contrast or high variability in vessel thickness. We also conduct ablation studies to analyze the contributions of LIOT and the dual cross-attention mechanisms to the overall performance of the network. The results show that both components are essential for achieving optimal segmentation performance. Specifically, LIOT enhances the contrast and detail of the input image, facilitating better feature extraction by the CNN encoder. The dual cross-attention mechanisms within the Mamba blocks enable the network to capture complex dependencies between distant regions in the image, which is crucial for segmenting fine vascular structures. LTDA-Mamba demonstrates excellent vessel segmentation and blood vessel pixel identification capabilities, which leads to a reduction in the subjectivity associated with manual labeling. In general, LTDA-Mamba outperforms other cutting-edge methods with high sensitivity. Specifically, for the DRIVE, CHASE~~DB1, and STARE datasets, the accuracy rates are 0.9689, 0.9741, and 0.9792, respectively. The sensitivities are 0.7868, 0.7697, and 0.7488, while the F1 scores are 0.8151, 0.8043, and 0.8219, respectively.ConclusionsIn conclusion, the proposed CNN-Mamba network, incorporating LIOT and dual cross-attention mechanisms, represents a significant advancement in retinal vessel segmentation. The network demonstrates the ability to accurately and consistently segment fine vascular structures, even in challenging cases. This capability suggests its potential for early disease detection, patient monitoring, and treatment planning in ophthalmology. The integration of LIOT and dual cross-attention mechanisms further enhances the network’s robustness and accuracy, which makes it a powerful tool for ophthalmic image analysis. Future work will focus on optimizing the network architecture and exploring additional preprocessing steps to further strengthen segmentation performance.
Mar. 19, 2025Vol. 45 Issue 7 0717001 (2025)
Baohua Wang, Huilin Jiang, Xiaoyong Wang, Yunsong Nie, Hui Xing, Chao Yang, Yang Li, and Gaojin Wen
ObjectiveDue to the all-day and all-weather information acquisition ability of infrared space remote sensing, it has application significance in the fields of environmental protection, land and resources investigation, forest fire monitoring, emergency disaster reduction, and military target detection. In recent years, with the continuous application of infrared space remote sensing data, higher requirements for the spatial resolution and imaging width of infrared space imaging remote sensors have been put forward in various application fields. At the same time, to improve the quantitative application level, the requirements of distortion and image illumination uniformity are becoming increasingly higher. Therefore, the infrared space imaging remote sensor urgently needs the optical system to realize the design of long focal length, large field of view (FOV), low distortion, and high illumination uniformity at the same time.MethodsTo effectively suppress the internal stray radiation, the traditional infrared optical system requires that the exit pupil should match with the cold stop perfectly. The large incident angle on the image plane increases the difficulty of aberration correction such as coma, astigmatism, and distortion, which results in the decline of image quality of the optical system. A novel re-imaging telecentric optical system configuration is proposed and the imaging principle is analyzed to solve the problem of traditional infrared optical systems. Then the coaxial catadioptric re-imaging telecentric optical system is constructed and the initial structural parameters are analyzed. Finally, based on the coaxial catadioptric re-imaging telecentric optical system, the off-axis catadioptric re-imaging telecentric optical system can be obtained by field bias. This optical system has the advantages of imaging with large aperture and long focal length of off-axis three-mirror optical system and imaging with large FOV of the refractive optical system. Additionally, the transmittance is improved by the elimination of obstruction.Results and DiscussionsBased on the performance requirements of the thermal infrared space imaging remote sensor with high resolution and wide imaging width, the optical system design specifications are decomposed. The working spectral band is 8?10 μm, the aperture is 435 mm, the focal length is 1038 mm, and the FOV is 8.84°×1.10°, with the image length reaching 160.4 mm. According to the imaging principle and initial structure solution method of the off-axis catadioptric re-imaging telecentric optical system, the initial structural parameters with a better structural layout and imaging quality are obtained. Due to the large aperture of the primary optical system, the field bias angle is higher at 9.54°. Therefore, large off-axis asymmetric aberrations will be produced at the intermediate image and it is difficult to conduct correction by the coaxial relay optical system. The free-form surface characterized by the XY polynomial is employed on the rear surface of relay lens 2 to achieve the correction of off-axis asymmetric aberration and further improve the imaging quality. The optimized off-axis catadioptric infrared space optical system consists of three mirrors and six relay lenses (Fig. 4). The modulation transfer function (MTF) of each FOV is greater than 0.316@25 lp/mm (Fig. 5), the relative distortion is less than 0.25% (Fig. 6), and the image illumination uniformity is better than 99% (Fig. 7). The manufacture and assembly tolerances of the optical system are analyzed, with the average MTF greater than 0.2732 at 90% probability and greater than 0.2816 at 80% probability. We carry out the manufacture and inspection verification of the free-form relay lens 2 to ensure the engineering feasibility of the optical system. The CGH compensator is designed and adopted to guide the manufacture and inspection of the free-form surface of relay lens 2 (Fig. 9). The surface shape accuracy of the free-form surface reaches 0.033λ (λ=632.8 nm). The manufacture and inspection results indicate that the free-form relay lens 2 has sound engineering feasibility.ConclusionsWe propose an off-axis catadioptric re-imaging telecentric optical system, which breaks through the match limitation of the exit pupil and cold stop in traditional infrared optical systems to achieve a perfect design with the long focal length, large FOV, low distortion, and high illumination uniformity simultaneously. Meanwhile, we analyze the imaging principle and initial structure solution method of off-axis catadioptric re-imaging telecentric optical systems. By taking the example of designing an off-axis catadioptric infrared space optical system with a working spectral band of 8?10 μm, an aperture of 435 mm, a focal length of 1038 mm, and a FOV of 8.84°×1.10°, we validate the effectiveness of the proposed method. The MTF values of each FOV at the Nyquist frequency (25 lp/mm) are all greater than 0.316, approaching the diffraction limit of the optical system. The relative distortion within the full FOV is less than 0.25%, and the image illumination uniformity is better than 0.99. The manufacture and assembly tolerances of the optical system are analyzed and the free-form relay lens 2 is manufactured to ensure the engineering feasibility. The design, manufacture, and inspection results indicate that the off-axis catadioptric infrared space optical system with a long image surface and low distortion has excellent imaging quality and sound engineering application significance, which can meet the application requirements of infrared space imaging remote sensors for high spatial resolution, wide imaging width, and high quantitative application level.
Apr. 27, 2025Vol. 45 Issue 7 0722001 (2025)
Ziheng Li, Furong Huo, Changxi Xue, Chao Yang, and Bo Dong
ObjectiveWith the rapid advancement of modern science and technology, illumination systems have become an indispensable part of daily life. In fields such as road, medical, and industrial applications, a well-designed illumination system can significantly enhance safety. Therefore, designing an illumination system with a distributed light pattern that meets human needs has become a key focus in the lighting industry. Light emitting diodes (LEDs), with their advantages of environmental friendliness, energy efficiency, and high performance, have gradually replaced traditional light sources and are now the dominant light solution in the market. However, LEDs often require secondary optical design to achieve more uniform and efficient illumination, meeting the specific lighting needs of different environments and improving overall lighting quality and experience. In this paper, we propose a new method for designing a uniform lighting lens in the context of illumination engineering.MethodsIn light of the luminous characteristics of LED light sources, a novel hypothesis is proposed for designing extended LED light sources, treating the extended light source as a collection of infinite point sources. The divergence half-angle limit for each small point source is strictly defined, and a uniform internal freeform surface is designed to serve as a secondary light source. The external freeform surface then maps the uniform secondary source to the target surface, a method called the hypothetical point source ensemble (HPE). Based on the inner freeform surface, the outer surface is designed by analyzing the point-to-point energy mapping from the light source to the illuminated plane using the source-target mapping method. We derive the corresponding theoretical model and a new formula for calculating the emitted light angle. The point convergence of the outer freeform surface is calculated using Snell’s law in vector form and the tangent iteration method. The discrete point cloud data of the double freeform lens are then obtained and imported into the 3D modeling software to create the final lens design.Results and DiscussionsUsing the proposed method, we design uniform illumination lenses for various applications. For example, with a light source diameter of 1 cm and a distance-to-height ratio of 1, the initial lens design achieves 88% uniformity (Fig. 9). After polynomial fitting and optimization of the lens profile, the final energy utilization rate is 80%, and the illumination uniformity is improved to 97.7%, demonstrating the high uniformity capabilities of our lens. To verify that the illumination lens designed using the point source ensemble method is not limited to a single illumination distance, simulations are conducted for both far-field illumination at distances of 2 and 10 m, and near-field illumination at 50 and 100 mm, all with a distance-to-height ratio of 1, as shown in Fig. 11. The results confirm that the illumination uniformity on the target surface exceeds 97%. To test the method’s flexibility, a lens is designed with a distance of 1 m and a lighting plane radius of 1.5 m. Simulation results shown in Fig. 12 indicate 95% uniformity. Additional simulations with a rectangular light source (1 cm side length) and a lighting distance of 1 m, as shown in Fig. 13, achieve 94.8% uniformity. A lens for a circular LED light source with a 2 mm diameter is also tested (Fig. 14), yielding 94.44% energy utilization and 99% uniformity. The far-field illumination lens, designed for a point source, achieves 94.6% energy utilization and 99% uniformity. These simulation results, across five different application conditions, verify the simplicity, high uniformity, energy utilization, and broad applicability of the proposed HPE method.ConclusionsTo address the issue of uneven illumination from Lambertian light sources, we propose a new hypothetical point source ensemble method for uniform illumination in lighting engineering. We outline a complete design and optimization process for uniform illumination lenses. By treating the extended light source as a set of point light sources, mathematical models are developed to solve for the inner and outer freeform surfaces of the lens, based on the illumination square law and the principle of energy conservation. Through point-by-point construction and tangent iterative calculation, a compact, high-energy utilization lens with uniform illumination is designed. The simulation results demonstrate that the method is applicable not only to circular light sources but also to rectangular ones. Compared with existing methods, the HPE method is simpler and more versatile, working for both extended and point light sources. The designed extended light source lens achieves 97.7% uniformity, while the point source lens achieves 99% uniformity and 94.6% energy utilization. This demonstrates that the HPE method makes a significant contribution to uniform illumination in lighting engineering. Future research will focus on the fabrication of lenses designed using this method and their application to off-axis lighting.
Apr. 27, 2025Vol. 45 Issue 7 0723001 (2025)
Jinsheng Liu, Shi Su, Yu Wang, Donglai Wang, Shirui Ge, Yihong Fan, Xing’an Hou, and Chunshuai Fang
ObjectiveAs the key equipment for reproducing real solar radiation characteristics in a laboratory setting, the solar simulator plays a vital role in many fields such as meteorology, aerospace, and agriculture. Among the optical components of the solar simulator, the uniform optical device is crucial for the homogenization of the Gaussian distribution radiation flux, which directly affects the irradiation uniformity and overall performance of the solar simulator. The optical integrator based on the Kohler illumination principle is favored by many researchers due to its high energy efficiency and large-area uniform irradiation. However, the traditional planar microlens array optical integrator faces challenges such as a small effective radiation area and insufficient irradiation uniformity when applied to multi-source solar simulators. To address these issues, a design scheme for a curved microlens array optical integrator is proposed to improve both the radiation uniformity and effective radiation area of multi-source solar simulators.MethodsIn this paper, based on matrix optics, we deeply analyze the beam transmission path of the optical integrator with a curved microlens array in the homogenizing process. We derive the quantitative relationship between the beam distribution on the irradiation surface and the parameters of the homogenizing system. Using diffraction theory, we construct the mathematical model of the aperture of the curved microlens array and the complex amplitude distribution on the irradiation surface. The influence of the sub-lens aperture and projection distance on irradiation uniformity is analyzed qualitatively. Based on the above theory, the optical integrator with a curved microlens array is designed and simulated. Firstly, considering the spot size of the second focal surface of the ellipsoidal condenser and the simplified integrator structure, we determine the channel number, sub-lens aperture, and relative aperture of the optical integrator. Secondly, according to the geometric light system of the field mirror microlens array and the projection mirror microlens array, the focal length and curvature radius of the front surface of each sub-lens in the field mirror microlens array are calculated by the classified design of the front surface of each sub-lens. At the same time, the feasibility of machining the optical integrator is analyzed using glass precision molding technology. Finally, the planar microlens array and curved microlens array optical integrators are modeled and imported into LightTools for Monte Carlo ray tracing. We compare the optical integrator with the traditional planar microlens array optical integrator and analyze the light smoothing performance of the curved microlens array optical integrator.Results and DiscussionsThe simulation results show that, compared with the planar microlens array optical integrator, the curved microlens array optical integrator can increase the receiving area of the incident light with its curved structure, reduce the influence of stray light between adjacent channels, and thus improve the beam uniformity of the irradiation surface (Figs. 10 and 11). The total irradiation area of the spot on the irradiation surface is 172.5 mm×172.5 mm. The effective irradiation area of the optical integrator with the curved microlens array is 122.5 mm×122.5 mm, and the effective irradiation area of the optical integrator with the planar microlens array is 117.5 mm×117.5 mm. They account for 50.43% and 46.40% of the total irradiated area, respectively. The irradiance of the curved microlens array optical integrator in the effective irradiation area is 1314.47 W/m2, with a minimum value of 1278.29 W/m2, and the irradiation uniformity reaches 98.60%. The maximum irradiance of the planar microlens array optical integrator is 1655.10 W/m2, the minimum is 1564.43 W/m2, and the irradiation uniformity is 97.18% (Fig. 12). Compared with the planar microlens array optical integrator, the edge coordinate points of the curved microlens array optical integrator are shifted by 5 mm, the proportion of the effective irradiation area in the total irradiation surface is increased by 4.03 percentage points, and the irradiation uniformity is increased by 1.42 percentage points. Although the irradiance of the curved microlens array optical integrator has decreased, its performance is still close to the standard requirement of a solar constant.ConclusionsWe propose a design method for a surface microlens array optical integrator. When applied to a multi-source solar simulator, this optical integrator can effectively increase the beam receiving area of the optical integrator without changing the sub-lens aperture, reduce the exit beam aperture angle of the field mirror, and decrease the impact of stray light within the adjacent sub-lens apertures. Simulation results show that, while meeting the requirement for a solar constant index, the surface microlens array optical integrator performs excellently in terms of effective irradiation area and irradiation uniformity. Compared to the planar microlens array optical integrator, the effective irradiation area as a percentage of the total irradiation area has increased by 4.03 percentage points, which indicates that, within the same optical system, the surface microlens array optical integrator can cover a larger working area. At the same time, the irradiation uniformity within the effective irradiation area has also improved by 1.42 percentage points, thus achieving a leap from Class B to Class A solar simulator irradiation standards. The studied surface microlens array optical integrator provides a feasible method for designing light homogenizing devices in multi-source solar simulators. Although we have conducted a detailed study on the performance of surface microlens arrays through simulation, there are inevitably some errors, such as differences in optical characteristics between ideal light sources and actual light sources, and differences between the optical parameters of materials used in simulations and actual values due to measurement errors or environmental conditions (such as temperature and humidity), which may affect the accuracy of the simulation results to a certain extent. In the future, further optimization of the simulation model will be carried out through experimental verification to more accurately evaluate the performance of the surface microlens array optical integrator.
Apr. 15, 2025Vol. 45 Issue 7 0723002 (2025)
Langlang Li, Zhen Liu, Mei Zhang, Dong Li, Yang Li, and Jiming Ma
ObjectiveImage transmission through multimode fiber (MMF) is now widely used in medical imaging, biological tissue detection, communication technology, and other fields. In multimode fiber imaging, the light pulse carrying the spatial information of the object enters the multimode fiber, and thousands of transmission modes excited in the fiber form encoded spatial information. Due to the complex mechanisms of interference, coupling, self-phase modulation, and group velocity dispersion among the fiber modes, the exit end of the fiber eventually forms a speckle image. With the development of optical modulators and computational optics, the advantages of deep learning methods in image reconstruction have become increasingly prominent. The high operational efficiency and strong resistance to fiber disturbances have pushed MMF image transmission into practical applications. Most existing studies use the MNIST handwritten digit set (28×28 resolution) for both training and testing, which is insufficient to train the generalization ability of network models. This reliance on limited data reduces the practical performance of the models. To enhance the practical application of multimode fiber imaging, we propose a hybrid model——TMnn (Transmission Matrix and Neural Network), based on complex value operations and a neural network that incorporates the physical processes of multimode fiber light field modulation. The model is applied to train and verify different natural scene image datasets, and the results show that the model training speed is significantly improved while maintaining the quality of image reconstruction. At the same time, the generalization ability of the neural network is also enhanced in the image restoration task.MethodsCombining the physical mechanisms of optical fiber and neural networks, we propose a multimode optical fiber speckle reconstruction algorithm, TMnn, based on complex value operations, which is trained on a natural scene image dataset. According to the response relationship between the input and output optical fields of multimode fiber, the inverse transmission matrix of the fiber is fitted using an iterative algorithm. The reconstruction optimization is then performed through a convolutional neural network to complete the speckle image reconstruction. The model is mainly divided into two modules. The first is the reconstruction module, which constructs the complex value deep neural network to fit the transmission matrix and initially reconstructs the images. The network consists of an input layer, complex convolution layers, complex batch normalization layers, and complex dense connection layers. The second part is the optimization module, which optimizes the initially reconstructed image by constructing a 3×3 convolutional neural network. The initial reconstructed image is taken as input, and the image features are extracted deeply. Image details are then reconstructed through the convolution layer, pooling layer, and fully connected layer in sequence.Results and DiscussionsBy comparing with traditional neural networks (SCNN, DCNN), CANN (Complex Artificial Neural Network), and USINET, we confirm the advantages of the model in terms of reconstruction effect and training speed. In terms of model training, we make a comparison with CANN on the ImageNet dataset. Compared with CANN, the SSIM index shows a significant improvement, and the number of iterations is reduced by 200. However, the addition of two complex convolution layers increases the number of parameters, which has a certain effect on the training time cost. We also compare the model with USINET, and the training information is shown in Table 2. The results show that the average SSIM index of this algorithm improved by about 0.5%, and the training time is reduced by 6.46 hours. The TMnn model outperforms USINET in the first 4 hours of training and tends to converge after about 6 hours of training, with the SSIM value stabilizing at around 0.8. This indicates that the model constructed in this paper does not compromise training speed or model performance despite the complex operations.ConclusionsWe integrate the physical mechanism of optical fiber transmission with deep learning technology to construct a deep neural network based on complex-valued operations, which achieves high-quality reconstruction with an SSIM index above 0.7. Through the reconstruction of various datasets, the validity and generalization of the model are demonstrated. By comparing it with traditional neural networks, fully connected complex networks, and USINET, the advantages of the model are confirmed in terms of reconstruction quality and training speed. However, the network still has limitations in reconstructing more complex, detailed images. The network structure and model parameters for feature extraction need optimization to better capture detailed features and further enhance the quality of natural scene image reconstruction.
Apr. 27, 2025Vol. 45 Issue 7 0720001 (2025)
Tao Wang, Xiting Han, Yanqiu Li, and Ke Liu
ObjectiveWith the advancement of modern optical technology, more and more optical elements and systems now feature aperture shapes beyond the traditional circular form. For example, rectangular optical elements are used in high-power laser measurements, and elliptical pupils are found in combined magnification extreme ultraviolet lithography objectives used in integrated circuit manufacturing. Lateral shearing interferometers offer advantages such as strong anti-interference capabilities and are not limited by the reference plane aperture. However, the Zernike mode method, commonly used for wavefront reconstruction from shearing interferograms, has typically been limited to wavefronts with circular or annular apertures. In this paper, we address the reconstruction of Zernike modes for wavefronts with arbitrary apertures.MethodsWe build upon Zernike circular polynomials as a basis, constructing corresponding Zernike polynomials through matrix transformation, ensuring their orthogonality over regions with arbitrary apertures. By combining the transformation matrix with noise-weighted least squares fitting of multi-directional differential wavefronts, we propose a difference Zernike polynomials fitting method for arbitrary aperture (DZPF-AA). The proposed method is validated through both simulations and experiments.Results and DiscussionsSimulations are conducted to reconstruct aberrated wavefronts under various aperture shapes. In ideal conditions, the relative reconstruction errors are below 0.21% (Fig. 6). With noise levels up to 50%, the reconstruction errors remain below 1.8% (Fig. 7). The method demonstrates excellent reconstruction performance with different shear amounts (Fig. 8), and the accuracy of single aberration reconstruction is high (Figs. 9?10). The experimental null test results from a quadriwave lateral shearing interferometer show reconstruction errors below 0.0033λ RMS (Fig. 14), confirming the high reconstruction accuracy of the proposed method. A comparison of test results for aberrations between the quadriwave lateral shearing interferometer and a commercial Shack-Hartmann wavefront sensor indicates that wavefronts reconstructed using the DZPF-AA method are approximately consistent with results from the Shack-Hartmann wavefront sensor (Fig. 17), validating that the proposed method effectively reconstructs wavefronts for arbitrary apertures.ConclusionsA comparative study is conducted to evaluate the performance of this arbitrary aperture wavefront reconstruction method, using four-directional differential wavefronts versus traditional two-directional differential wavefronts, across various aperture shapes, noise levels, and shearing amounts. Simulation results indicate that reconstruction using four-directional differential wavefronts offers higher noise resistance and achieves better accuracy, particularly with small shearing ratios. Experimental results from a quadriwave lateral shearing interferometer’s null test show that the method using four-directional differential wavefronts achieves measurement accuracy better than 0.004λ RMS (λ=635 nm) for wavefronts with annular, square, and rectangular apertures. Comparative aberration testing between the quadriwave lateral shearing interferometer and a commercial Shack-Hartmann sensor reveal consistent measurements of wavefronts with specific aberrations under annular, square, and rectangular apertures, verifying the correctness of the proposed method.
Apr. 27, 2025Vol. 45 Issue 7 0726001 (2025)
Jie Wang, Jingxuan Guo, Cheng Zong, Mingxi Zhang, Hao Zhang, and Jing Chen
ObjectiveMultiple Fano resonance modes can be excited by the introduction of the asymmetric notch in a single closed ring cavity, but the change of any structural parameter will cause synchronous changes in the resonance mode, which is not conducive to the flexibility of practical sensing applications. We aim to design a metal?insulator?metal (MIM) waveguide structure, which can generate uncorrelated double Fano resonance in the infrared region to prepare a label-free biosensor with high sensing performance and high flexibility.MethodsTo this end, we introduce a single metal baffle and two split-ring resonator cavities with different radii on the surface of the MIM waveguide, as shown in Fig. 1(a). Since the penetration depth of the electromagnetic field in the waveguide is much less than its wavelength, the original three-dimensional structure can be replaced by a two-dimensional structure. The metal baffle can stimulate the broadband mode, and two split-ring resonator cavities with different radii can stimulate two narrow-band modes. The broadband mode and narrowband mode are coupled to produce a double Fano resonance mode. By adopting the finite element method, the transmission characteristics of light waves and the distribution of electromagnetic fields on the structure surface are calculated theoretically. To discuss the modulation effect of structural parameters on the Fano resonance mode, we calculate and compare the transmission spectra at different radii and opening angles. In addition to studying the movement of the resonant modes and sensing sensitivity of the structure, we investigate whether the two Fano resonance modes can be modulated independently.Results and DiscussionsThe calculation results based on the finite element method show that the proposed structure can excite typical double Fano resonance, as shown in Fig. 2. The corresponding wavelengths of the two transmission peaks are 1481 nm and 2484 nm respectively. Additionally, the electromagnetic field distribution on the waveguide surface is simulated. By theoretical calculation, the sensitivity of a resonator with a radius of 200 nm is 1453 nm/RIU, and that of a resonator with a radius of 300 nm is 3793 nm/RIU. We also prove that the Fano resonance mode can be modulated effectively by changing the radius and opening angle of the ring cavity, including the resonance wavelength position, peak value of the transmission peak, sensing sensitivity, and other properties. The increase in the radius of the split-ring resonator cavity will cause the red shift of the resonance wavelength, as shown in Figs. 5(a) and (c). The opening angle increase will cause the blue shift of the resonance wavelength, as shown in Figs. 6(a) and (b). In addition, these figures confirm that both Fano resonance modes can be modulated independently, which provides unique flexibility in label-free biosensing.ConclusionsWe successfully design a MIM waveguide structure capable of exciting double Fano resonance, achieving ultra-high sensing sensitivity and unique flexibility in the near-infrared band. We introduce a single metal baffle and two split-ring resonator cavities with different radii into the MIM waveguide, which are coupled to produce double Fano resonance. The numerical results based on the finite element method show that our structure has very high sensitivity and a good quality factor. By changing the radius of the ring cavity or the size of the opening angle, the resonance mode position, peak value of the transmission peak, sensing sensitivity, and other attributes can be flexibly modulated. Additionally, since the two resonance modes originate from different resonators, they can be independently regulated, which has significant advantages in practical sensing applications. Our structure provides new ideas for highly sensitive and flexible label-free biosensing.
Apr. 27, 2025Vol. 45 Issue 7 0726002 (2025)
Shu Li, Shimiao Zhang, Xiaoxue Chu, Song Ye, Xinqiang Wang, Fangyuan Wang, Ziyang Zhang, Yongying Gan, and Jiawen Guo
ObjectiveTo explore the information that the “polarization crossfire” technique can provide for multi-layer cloud identification, we use the Monte Carlo radiative transfer model to simulate and calculate the top-of-atmosphere radiative properties of single-layer ice clouds, single-layer water clouds, and multi-layer clouds under different cloud microphysical and optical properties. We then establish a multi-layer cloud identification algorithm based on the threshold method, which provides theoretical references for the subsequent operational application of multi-layer cloud identification using the “polarization crossfire” scheme.MethodsSingle-layer clouds and multi-layer clouds exhibit significant radiative differences, and accurately identifying them is crucial for understanding their role in the radiation balance of the Earth-atmosphere system. We accurately simulate the top-of-atmosphere radiation characteristics of both single-layer and multi-layer clouds under different conditions using the Monte Carlo vector radiative transfer model. We also provide simulation data of the top-of-atmosphere radiation characteristics of cloud-containing layers, which supports the sensitivity analysis of multi-layer clouds’ radiation properties through polarization remote sensing. Through sensitivity analysis of the top-of-atmosphere radiation characteristics, we examine the polarization channel (865 nm), the oxygen A absorption band (763 nm and 765 nm), and the shortwave infrared channels (1380, 1610, and 2250 nm). This analysis yields feature information useful for identifying multi-layer clouds. Based on these findings, we propose a multi-layer cloud identification algorithm using a thresholding method and validate it with actual remote sensing data. The results show that the algorithm’s accuracy in identifying multi-layer clouds when compared to the moderate-resolution imaging spectroradiometer (MODIS) cloud products, achieves a consistency of 88.3%.Results and DiscussionsWe use the Monte Carlo vector radiative transfer model in the libRadtran software to simulate and calculate the top-of-atmosphere radiative properties under different cloud microphysical and optical properties across various channels. We analyze the sensitivity of the polarization channel, the oxygen A absorption band channel, and the short-wave infrared channel to single-layer and multi-layer clouds in the lower part of the cloud. We also establish a new set of algorithms for identifying multi-layer clouds, as shown in Fig. 5. The core idea of the algorithm is as follows: First, the polarization characteristics of the polarization channel are employed to identify the multi-layer cloud. Then, for the cloud image elements that the polarization channel fails to identify, the reflectivity ratio of the oxygen A absorption band channels (763 nm and 765 nm) is used to identify the upper-layer ice cloud. Once the upper-layer ice cloud is identified, the reflectivity difference between the short-wave infrared channels (2250 nm and 1610 nm) is applied to distinguish between single-layer and multi-layer clouds. When using the oxygen A channel to recognize the upper ice cloud, multi-layer clouds with a thin optical thickness in the upper ice cloud may be misclassified as water clouds. To resolve this, the 1380 nm channel is employed to correctly identify these misclassified elements as multi-layer clouds, thereby improving the accuracy of multi-layer cloud recognition. The experimental results show that the algorithm identifies multi-layer clouds with 92.0% consistency with MODIS cloud products, identifies single-layer clouds with 83.0% consistency with MODIS, and achieves an overall cloud identification accuracy of 88.3%. This demonstrates that the algorithm is more effective at identifying multi-layer clouds.ConclusionsBased on the characteristics of the “polarization crossfire” observation scheme, we use the Monte Carlo vector radiative transfer model in libRadtran software to simulate and analyze the sensitivity of the polarization channel, the oxygen A absorption band channel, and the short-wave infrared channel to single-layer and multi-layer clouds under different cloud microphysical and optical properties, as well as their effect on top-of-atmosphere radiative properties. The sensitivity of the polarization channel, the short-wave infrared channel, and the oxygen A absorption channel are then used to establish a new multi-layer cloud recognition algorithm, which improves the accuracy of multi-layer cloud identification.
Apr. 10, 2025Vol. 45 Issue 7 0728001 (2025)
Zijuan Liu, Yongqian Li, Lixin Zhang, and Guozhen Yao
ObjectiveIn recent years, fiber shape measurement technology has advanced rapidly. However, shape measurement technology based on fiber Bragg grating (FBG) cannot achieve completely distributed shape measurement due to limitation in the number and spacing of FBGs. The traditional single-mode fiber Brillouin optical time-domain analysis system, which suffers from low spatial resolution, limited communication capacity, and high bending loss, can no longer meet the current research requirements. Multi-core fibers (MCFs) have shown promising potential in bending strain measurement, especially due to the off-core fibers that are not located on the neutral axis of the fiber. In this paper, we employ a differential pulse Brillouin optical time-domain analysis system, with a spatial resolution of several centimeters, to measure the bending of seven-core fibers. In addition, recognizing that the temperature characteristics of each core in seven-core fibers may vary due to differences in production and processing, we calibrate the temperature coefficients of each core. A novel temperature compensation method is proposed to address the cross-sensitivity issue between temperature and strain in multi-core fibers during bending measurements. We hope that the proposed temperature method can more accurately determine the bending curvature of the fiber.MethodsIn this study, a differential pulse Brillouin optical time-domain analysis system with a spatial resolution of 20 cm is used. Seven intermediate cores and three asymmetric cores are selected for experimental measurement. First, we conduct temperature calibration experiments on four selected fiber cores over a temperature range of 20?70 ℃ (with 10 ℃ increments), and the temperature coefficients for each of these four cores are determined. Then, we apply both temperature and bending strain at the 17.5?18.5 m position on the fiber to measure temperature-compensated curvature. The proposed temperature compensation method involves extracting the Brillouin frequency shift from the intermediate core, calculating the fiber temperature using the previously measured temperature coefficients, and subtracting the Brillouin frequency shift caused by temperature from the actual measured shift. This allows the bending strain information of the core to isolated. From the resulting Brillouin frequency shift, the curvature of the bending section of the fiber can be reconstructed.Results and DiscussionsCores 1, 3, 5, and 7 of the seven-core fiber are selected for experiments, yielding temperature coefficients of 1.103, 0.962, 1.277, and 0.937 MHz/℃ respectively, which are comparable to those of single-mode fiber. Using these temperature coefficients, the fiber is wrapped around a disc with a bending radius of 4.9 cm and heated in a water bath to simultaneously induce temperature and strain effects. The curvature of the bending section is calculated using a parallel transmission frame algorithm. The results show that the maximum curvature obtained is 20.593 m-1, while the average curvature is 19.910 m-1. To reduce experimental error, we repeat the experiment for three times, and the final measurement used is the average of these three trials. The actual curvature of the bending section is 20.408 m-1. The error between the maximum measured curvature and the actual curvature is 0.91%, while the error between the average curvature and the actual curvature is 0.24%.ConclusionsAnalysis of the experimental results demonstrate that the proposed temperature compensation method for bending measurement can more accurately separate temperature and bending strain effects, and more precisely reconstruct the curvature information of the fiber. The main sources of error in curvature reconstruction are the limited spatial resolution and sampling rate of the system, which leads to a sparse dataset, and the artificial control of bending and strain application in the experiment, which introduces minor deviations. These issues will be the focus of future work to improve the accuracy of curvature measurement.
Mar. 20, 2025Vol. 45 Issue 7 0728002 (2025)
Jun Deng, Jiancong Shen, Yuting He, Jiawei Wang, Wencong He, Buyong Wan, and Xiaohong Yang
ObjectiveHydrogen, as an efficient, non-polluting, sustainable, and abundant energy source, plays an important role in addressing the pressing global energy crisis. However, the risk of hydrogen leakage and its flammable and explosive characteristics pose a threat to the safety of life and property. Consequently, developing and utilizing reliable hydrogen sensing technology is of utmost necessity. Fiber optic hydrogen sensors based on metal-oxide semiconductors (MOS) have become a research hotspot in this field due to their inherent safety, compact size, resistance to electromagnetic interference, and suitability for explosive environments. The preparation method, material selection, and micro-nanostructure of the sensing layer of fiber optic gas sensors are key factors affecting the performance of the sensors. Traditional methods, such as dip coating, drop casting, and sputtering, are difficult to use to form a sensing layer on the surface of optical fibers that has strong bonding and good stability. In addition, the sensing layer, whether it is a coating or a film, typically has a dense structure with a low specific surface area, limited gas adsorption active sites, and insufficient internal gas transmission channels, which leads to poor gas-sensitive performance. Furthermore, gas sensors based on pure MOS, such as zinc oxide (ZnO), face challenges such as high operating temperatures, low sensitivity, and poor selectivity. Incorporating noble metal-modified MOS can significantly enhance their sensing performance, but this improvement comes at a substantial cost increase. Research indicates that transition metal nickel (Ni)-doped ZnO (Ni∶ZnO), characterized by high activity and low cost, can significantly enhance gas sensing performance. In this study, we design and fabricate a fiber optic hydrogen sensor based on Ni∶ZnO nanorod arrays, which demonstrates significant advantages in terms of the fabrication process, cost, and response.MethodsWe design a fiber optic hydrogen sensor based on ZnO nanorod arrays. Firstly, we theoretically analyze the advantages of the nanorod array structure in fiber optic sensors. These advantages not only provide a high specific surface area and gas transmission channels but also change the light transmission mode and the effective transmission path. As a result, the output light intensity increases monotonically with the increase in conductivity, thus enabling effective gas detection (Fig. 2). Then, we prepare Ni∶ZnO nanorod arrays on cladding-etched surfaces using a two-step method: impregnating the ZnO seed layer followed by growing the Ni∶ZnO nanorod arrays in a water bath. The as-prepared samples, with Ni/Zn molar ratios of 1%, 1.5%, 2%, 2.5%, and 3%, are numbered Ni∶ZnO-1, Ni∶ZnO-2, Ni∶ZnO-3, Ni∶ZnO-4, and Ni∶ZnO-5, respectively. Next, the morphology and chemical composition of the nanorod arrays are characterized by scanning electron microscopy and X-ray diffractometry, respectively. ZnO nanorod array-based fiber optic hydrogen sensors with different Ni doping concentrations are then prepared to experimentally investigate the optimal Ni doping concentration. Finally, we test the ZnO nanorod array sensors with the optimal Ni doping concentration to evaluate their hydrogen-sensitive performance.Results and DiscussionsThe ZnO nanorod arrays grown on the fiber surface are hexagonal prismatic, uniformly aligned, and well-dispersed, with nanorod diameters ranging from 50 to 100 nm and an array thickness of approximately 5.5 μm (Fig. 4). The Ni element is successfully incorporated into the ZnO lattice in the form of interstitial doping, which increases the surface defects of ZnO (Figs. 4 and 5). The responsivity of the Ni∶ZnO-based fiber optic sensor firstly increases and then decreases with increasing Ni doping concentration. The response of pure ZnO is only 1.13%, while the Ni∶ZnO-4 sensor exhibits the best response at 8.44%, an enhancement of about 7.5 times, and has the fastest response time (75 s). In contrast, the response of the Ni∶ZnO-5 sensor decreases to 3.33%. Moreover, the Ni∶ZnO-4 sensor shows good linearity between the response and hydrogen volume fraction (1×10?5?1×10?3), with a sensitivity of 76.8% and its response to 1×10⁻⁵ hydrogen still being 0.42% (Fig. 6). The sensors exhibit excellent stability and repeatability. In two sets of 12 consecutive cyclic tests, the average response decrease is only 0.3% and 0.33%, and during four weeks of regular monitoring, the response of the sensors decreases by less than 0.25%. Additionally, the sensor exhibits good gas selectivity (Fig. 7). Compared to other fiber optic hydrogen sensors, the designed Ni-doped ZnO nanorod array sensors exhibit significant advantages in terms of hydrogen sensing performance and cost-effectiveness (Table 1), which makes them a very promising option for hydrogen detection.ConclusionsIn this paper, we propose a fiber optic hydrogen sensor based on ZnO nanorod arrays. The special micro-nanostructure of ZnO nanorod arrays, serving as the sensing layer material for fiber optic sensors, not only alters the light transmission mode and path within optical fibers but also provides a large specific surface area, abundant active sites, and gas transmission channels for gas-sensitive detection, which enhances the sensor’s performance. The sensor is fabricated by growing Ni-doped ZnO nanorod arrays on the fiber surface, using a ZnO seed layer followed by hydrothermal synthesis within a water bath. The Ni∶ZnO-4-based sensor, which exhibited the best gas response, achieves a response of 8.44% to a hydrogen volume fraction of 1×10⁻³, with a sensitivity of 76.8 /%, a fast response time (75 s), and a lower detection limit of 1×10⁻⁵. Additionally, the sensor maintains good repeatability, stability, and selectivity for hydrogen. Compared with similar fiber optic hydrogen sensors, this sensor offers significant advantages in terms of the fabrication process, cost, and response. In conclusion, the fiber optic hydrogen sensor based on Ni-doped ZnO has potential applications in the field of hydrogen safety monitoring.
Mar. 20, 2025Vol. 45 Issue 7 0728003 (2025)
Yingjie Li, Dongsheng Zuo, Weiqi Jin, and Su Qiu
ObjectiveEnsuring the safety of the external environment is a critical aspect of railway operation safety. Traditional manual inspections for identifying safety hazards along high-speed railway (HSR) lines are labor-intensive, costly, and inefficient due to geographical and weather conditions. Leveraging deep learning techniques for the intelligent extraction of hazard targets from remote sensing imagery can significantly improve data utilization and processing efficiency, becoming an essential trend for the intelligent development of HSR systems. However, the development of this technology still faces challenges at three levels: data quality, model performance, and application interaction. At the data level, the primary challenge lies in the lack of high-quality training datasets. High-resolution color remote sensing images are typically generated by fusing multispectral (MS) images with panchromatic (PAN) images, and the effectiveness of fusion algorithms directly influences the fidelity of ground target information. Although existing methods have made progress in preserving spatial and spectral fidelity, challenges such as spatial-spectral misalignment and information loss remain unresolved, particularly as satellite capabilities improve for observing small targets. In addition, the absence of dedicated datasets for extracting hazards along HSR lines restricts the development and training of intelligent extraction models. At the model level, challenges arise from significant variations in target scales, as well as the spectral and spatial inconsistencies of targets (e.g., identical objects appearing differently and different objects sharing similar spectral characteristics). As the resolution of remote sensing images improves, non-target background information increasingly contributes to noise, complicating the discrimination and learning of target features. At the application level, existing intelligent detection methods based on single-modal information (images) limit the understanding of image semantics and require a high level of professional expertise from users. With the new interactive experiences brought by language models to various fields, exploring how to combine language input for more flexible and efficient human-machine interaction is a key issue that needs to be addressed. In this paper, we aim to systematically investigate intelligent detection technology for hazards along high-speed rail lines based on remote sensing images, focusing on the three aforementioned aspects to promote the intelligent development of high-speed rail safety assurance.MethodsWe explore the application of optical remote sensing imagery in railway safety. It investigates intelligent hazard detection techniques for HSR by addressing two core aspects: constructing high-quality datasets of HSR hazard targets and enhancing the performance of remote sensing image extraction models. To improve image fusion quality, we analyze the pansharpening task from a frequency domain perspective. By exploring the commonalities between the multiscale decomposition capability of wavelet transforms and the multiscale structures of deep learning models, we propose a multiscale spatial-frequency domain dynamic fusion algorithm, BiDFNet. BiDFNet employs a bidirectional subnet structure: the backward subnet extracts high-frequency components of the PAN image via wavelet transform, while the forward subnet reconstructs high-frequency information from the MS image progressively through a wavelet-based adaptive fusion module. Furthermore, a dual-domain dynamic filtering module enhances the algorithm's generalizability with a parameter-efficient design. We create an HSR hazard dataset targeting typical hazard types using high-quality fused data. To address issues such as significant target scale variations, small-target omission, and severe background noise interference, we develop a deep-learning-based adaptive deformable fitting method, DFEANet, for remote sensing target extraction. DFEANet employs an encoder-decoder architecture to extract multiscale features. Deformable convolution is introduced to adaptively fit the receptive field to target shapes, while edge alignment between adjacent feature levels is enhanced using optical flow concepts, improving edge extraction precision. In addition, a gating mechanism is adopted to regulate information flow during feature fusion, effectively suppressing background noise. To enhance the model's ability to understand advanced semantics, we construct a multimodal segmentation dataset for hazards along high-speed rail lines based on the aforementioned hazard dataset. We also conduct both qualitative and quantitative comparisons of several multimodal segmentation algorithms, represented by LAVT, on the hazard multimodal segmentation task, exploring intelligent detection technology along high-speed rail lines by integrating textual data.Results and DiscussionsThe proposed pansharpening method is compared with traditional and deep learning-based methods using imagery from the GaoFen-2, SuperView-1, and WorldView-III satellites. Quantitative experimental results (Table 4) show that the proposed method achieves optimal values across five metrics in reduced resolution experiments, with minimal differences between fusion results and reference images. In full-resolution experiments, the proposed method demonstrates excellent generalization performance, especially for small objects such as vehicles. As shown in Fig. 13, it can accurately reconstruct spatial structure and spectral information. Using the established HSR hazard dataset, the proposed hazard extraction model is tested. Experimental results (Table 5 and Fig. 14) indicate that the proposed method successfully achieves complete extraction of hazard masks across different scales and effectively learns the spectral characteristics of color-coated steel sheet (CCSS) roof buildings. Both quantitative analyses and qualitative comparisons demonstrate that it outperforms other benchmark algorithms, achieving the best performance. In addition, this is the first to explore multimodal segmentation technology for hazard detection along high-speed rail lines, providing a reference for future research on more flexible and efficient intelligent hazard detection techniques. By integrating the proposed algorithm with railway geoinformation, statistical analysis and risk-level classification of hazard information are enabled. Combined with electronic maps, the visualization of hazard data is facilitated, effectively supporting the inspection of external railway safety hazards. Field verification of the algorithm's results shows that, among 20 sampled hazard sites, 17 are correctly identified, with 3 missed detections.ConclusionsIn this study, we focus on the intelligent safety hazard detection task for HSR based on optical remote sensing images. High-quality data form the foundation of intelligent hazard detection. To address the challenges of small-target reconstruction introduced by the enhanced resolution of remote sensing imagery, we integrate traditional multiresolution analysis concepts with deep learning models. By progressively extracting and processing high-frequency components from PAN images, the method mitigates issues of small-target information blending or loss during MS image fusion, achieving optimal spatial and spectral fidelity compared to deep learning methods operating purely in the spatial domain. Based on the constructed HSR hazard dataset, the proposed hazard extraction model demonstrates superior accuracy in extracting CCSS roof buildings compared to state-of-the-art deep learning methods, significantly improving the efficiency of hazard inspection along HSR lines. By incorporating textual data, we construct a multimodal segmentation dataset for hazards along high-speed rail lines. Test results of various multimodal segmentation algorithms on this dataset show that the introduction of textual data enhances the flexibility of intelligent hazard detection. Users are expected to selectively detect hazards based on their relative position to the railway line, thus building a more intelligent human-machine interaction model. Considering practical application needs and technological development trends, we discuss the future development requirements of HSR safety hazard detection technology based on optical remote sensing images. We also conduct a systematic investigation of intelligent hazard detection along HSR lines, starting from data selection and progressing to application deployment. Given the limited amount of related research in this field, the findings of this paper provide valuable references for future studies.
Apr. 27, 2025Vol. 45 Issue 7 0728004 (2025)
Maoqing Chen, Chi Zhang, Shouzheng Qiao, Yiyang He, Yingxuan Liu, and Yong Zhao
ObjectiveIn the initial diagnosis of prostate cancer, digital rectal examination is usually the preferred method. However, due to the high subjectivity of the test, more objective and accurate tools are needed to evaluate and predict the development of prostate cancer. To address this, we propose a double-layer spring Fabry-Perot (FP) pressure sensor based on femtosecond laser two-photon polymerization 3D printing technology, which is prepared on the fiber end face for mechanical characterization of prostate cancer lesions. Unlike the traditional single-layer spring structure, the sensor adopts a double-layer spring structure, with the double-layer springs spliced together. This design ensures high sensitivity while also offering a large pressure detection range, solving the problem where the single-layer spring structure is either too long, affecting sensitivity, or too short, making it prone to breaking. The double-layer spring FP pressure sensor is compact and highly sensitive, with pressure detection resolution reaching the nN level. It can serve as a stable and reliable force sensor for the early diagnosis of prostate cancer.MethodsThe structure of the double-layer spring FP pressure sensor is designed using COMSOL software, and the parameters affecting the performance of the sensor are simulated and analyzed to achieve a balance between high sensitivity and a high development success rate. After designing the sensor structure, it is fabricated using femtosecond laser two-photon polymerization 3D printing technology. First, the fiber end face is preprocessed. The processed optical fiber is then placed in the fixture, and the fixture is fixed in the printing device. Next, the photoresist is dropped onto the center of the lens, and the micro-displacement platform is used to control the position of the optical fiber. The optical fiber core is aligned with the center of the lens through the program. After that, the processed model file is exported to NanoWrite software. Finally, the printing process is carried out. Once printing is completed, the optical fiber is removed from the printing equipment and immersed in isopropanol and propylene glycol monomethyl ether acetate to develop and clean the residual photoresist. The schematic diagram is shown in Fig. 6.Results and DiscussionsWe analyze the change in the reflection spectrum under different pressures ranging from 0 to 1650 nN using a spectrometer. The fitting results show that the sensing structure exhibits good linearity in the range of 0 to 1650 nN, with a sensitivity of 2.82 nm/μN. Without changing any parameters, sample 2 is prepared, and the pressure detection experiment is carried out again. The sensitivity differs by only 0.1 nm/μN compared to that of sample 1, while maintaining good linearity, which indicates that the structure has good repeatability. To verify the stability of the sensing structure, we conduct a 4 h pressure observation experiment, and the reflection spectrum of the structure shows almost no shift. For the polymer structure, the temperature crosstalk issue could affect measurement accuracy. However, the temperature sensitivity of the sensing structure is much smaller than its pressure sensitivity. Additionally, in human prostate tissue, the temperature remains stable over a long period, so the temperature crosstalk issue can be ignored. The proposed sensor can thus be used as a stable and reliable force sensor for the early diagnosis of prostate cancer.ConclusionsA double-layer spring FP microcavity pressure sensor structure is fabricated using femtosecond laser two-photon polymerization 3D printing technology. When the pressure changes from 0 to 1650 nN, the proposed structure exhibits a sensitivity of 2.82 nm/μN and a linearity of 0.997. The experimental results show that the proposed FP microcavity pressure sensor structure has good repeatability and demonstrates excellent stability when continuously monitoring pressure. This sensor has the characteristics of small size, high sensitivity, easy preparation, and low manufacturing cost. It can achieve high force resolution and, in principle, can identify sub-millimeter cancerous tissues in the early stage of prostate cancer, which provides a new possibility for the early diagnosis of prostate cancer.
Apr. 27, 2025Vol. 45 Issue 7 0728005 (2025)
Jiamu Ling, Zhuangwei Xu, Wei Ye, Zhengguo Xu, and Kejiang Zhou
ObjectiveRaman optical time-domain reflectometers (ROTDRs) are a crucial branch of distributed optical fiber sensing (DOFS) and are widely used for online monitoring of distributed temperature variations. ROTDR relies on temperature-sensitive Raman scattering, but the weak intensity of Raman backscattered light makes it highly susceptible to noise from optical and electrical components, making it challenging to obtain clean scattering signals in practical measurements. To address this issue, machine learning methods have been explored for signal denoising. However, training denoising networks typically requires labeled data, and due to the complexity of noise, discrepancies exist between simulated and real noise. In the absence of prior knowledge about the real noise characteristics, networks trained on artificially generated labels may suffer from poor generalization to real-world data. In this paper, we propose a blind denoising autoencoder (BDAE) to overcome the challenge of training without pure signal labels. A label construction and training strategy is introduced, where noisy data are used to generate input-label training pairs. Comparing to conventional training with simulated data, we find that this approach allows unlabeled Raman scattering data to be directly incorporated into network training, enabling the model to learn real noise characteristics more effectively. Without requiring modifications to the network structure or explicit noise parameter estimation, BDAE can enhance denoising performance, preserve temperature-induced dynamic variations, and mitigate the risk of overfitting.MethodsWe leverage the retrievable nature of optical sensing signals to design a strategy for generating input-label data pairs for scattering signal denoising. Unlike conventional denoising autoencoders that require pure signals as labels, this approach only requires two noisy signals sampled from the same underlying pure signal to form input-label training pairs. Two consecutive samplings from a distributed temperature sensing (DTS) system, taken within a short time interval, are assumed to represent the same underlying signal, meeting this requirement. The structure of the convolutional autoencoder used in this paper is illustrated in Fig. 1. During experiments, it is observed that uneven intensity distribution in the distance domain can hinder the network’s ability to capture signal trends. To address this, additional training data (termed labeled data) are generated by applying noise addition to the same set of labeled data, forming input-label pairs suitable for the blind denoising strategy. This ensures a robust evaluation of network performance. The loss functions play a critical role in the training effectiveness of BDAE. The composite loss functions used in this paper consist of three components: mean square error (MSE), energy loss, and total variation loss (TV Loss). By incorporating these components, the loss function encapsulates prior knowledge of noise characteristics in Raman scattering signals, leading to a more targeted and effective denoising performance.Results and DiscussionsThe experiment is designed to validate the network’s denoising performance on dynamic temperature variations under different light source intensities. The sensing fiber outside the DTS is immersed in a water bath to observe temperature trends over time. The temperature changes compared to reference values are illustrated in Fig. 4. The denoising performance of wavelet denoising (WD) and BDAE is compared to fiber temperature scattering signals (Fig. 5). The results demonstrate that BDAE effectively learns noise characteristics from unlabeled Raman scattering data, leading to more efficient noise reduction in scattering signals. Temperature variations over the measurement period are shown in Fig. 6, while Table 1 presents the average deviation of temperature measurements. The denoising model reduces the average temperature error from 2.21 to 1.71 °C, outperforming WD. To further assess the effectiveness of the proposed blind denoising strategy, experiments are conducted under three different signal-to-noise ratio (SNR) conditions: 35 dB, 30 dB, and 25 dB. The convolutional autoencoder optimizes the denoised signals to a level comparable to that achieved with labeled training data, demonstrating the effectiveness of the approach.ConclusionsIn this paper, we propose a blind denoising training strategy based on a convolutional autoencoder for denoising Raman scattering signals in DTS systems. The method effectively addresses the challenge of acquiring pure scattering signals by enabling network training without explicit labels, using noisy data to construct input-label training pairs. The composite loss function, incorporating MSE, energy loss, and TV Loss, further enhances the model's performance. In the experiments, variations in the intensity of the DTS light source are simulated to represent three different noise scenarios, while measuring the dynamic heating and cooling processes. The trained BDAE effectively reduces temperature measurement errors when denoising dynamic scattering signals under these three noise conditions, outperforming WD methods. The experimental results validate that this method achieves training performance comparable to that obtained with labeled data. However, due to the use of convolutional layers in autoencoder-based denoising, excessive smoothing at signal inflection points is observed, which slightly influences the spatial resolution of the measurement results. Future research will focus on improving this aspect.
Apr. 27, 2025Vol. 45 Issue 7 0728006 (2025)
Peihang He, Haochi Zhang, Haoli Hong, Wen Li, Hao Wang, Dayue Yao, and Qi Yang
SignificanceTerahertz phased array technology, an emerging field within electromagnetic wave applications, operates between microwave and infrared frequencies, offering unique spectral characteristics. Its potential advantages, including large bandwidth, high resolution, high integration, non-destructive capabilities, and strong penetration are increasingly being developed. These features make it highly promising for applications in wireless communication, high-resolution imaging, biological imaging, and security inspection. In terms of architecture, terahertz phased arrays are broadly divided into active and passive types. Active arrays feature transmit/receive components for each array element, enabling independent generation, manipulation, and reception of terahertz waves. This configuration enhances beam control, integration, and reliability, leveraging semiconductor chip processes for high-resolution imaging and high-speed communication. Passive arrays distribute electromagnetic waves to phase-controllable metasurface units via passive networks or aperture-fed systems. They excel in array scalability and power capacity, utilizing materials like liquid crystals, semiconductors, phase-change materials, and graphene for greater flexibility and broad application potential. Research in this field not only advances fundamental science but also supports the development of related industries, paving the way for next-generation communication technologies and imaging devices.ProgressIn active phased arrays, researchers have developed novel terahertz transmitters and receivers using advanced chip technologies, efficient semiconductor materials, and microwave integrated circuit techniques, achieving broader phase dynamic range, higher output power, and greater control precision. For instance, a two-dimensional delay-coupled oscillator structure is constructed using a 65 nm CMOS process, leveraging the phenomenon of injection locking [Fig. 1(a)] to create a beam-scanning radiative source operating at 338 GHz with scanning angles of 50° and 45° in two directions and an equivalent omnidirectional radiation power of 17 dBm. A 1×8 phased array, operating within the 370?410 GHz band, is realized using a 45 nm CMOS process, achieving a scanning range of 75° and an in-band peak equivalent omnidirectional radiation power of 8.5 dBm. This design not only reduces power consumption but also demonstrates compatibility with efficient on-chip microstrip antennas, marking a milestone as the first CMOS-based phased array operating at 400 GHz with a wide operational bandwidth. In addition, a compact terahertz amplification and frequency doubling chain at 340 GHz is proposed, enabling 360° phase shift capabilities for phased arrays in the 324?346 GHz range [Fig. 6(a)]. A 1×4 phased array transmitter operating at 320 GHz, designed using a 130 nm SiGe BiCMOS process, achieves an equivalent omnidirectional radiation power of 10.6 dBm and an E-plane beam scanning angle of ±12° [Fig. 7(a)]. Another innovative approach involves a simplified design method for a terahertz coherent harmonic radiation array, employing mode-dependent boundary modeling on half units (Fig. 9). This method leads to the creation of a 0.41 THz radiator with 16 coherent units using 130 nm SiGe BiCMOS technology, delivering an equivalent omnidirectional radiation power of 12.7 dBm, a directivity of 21.6 dBi, and a power consumption of 212 mW at a supply voltage of 1.7 V, thus providing a robust foundation for designing large-scale terahertz coherent arrays. In passive phased arrays, researchers have explored designs based on programmable metasurfaces, enabling dynamic phase and amplitude variations in reflected or transmitted electromagnetic waves for functionalities such as terahertz beam scanning. A liquid crystal-based transmissive programmable metasurface is proposed [Fig. 12(d)], which successfully excites Fano resonance through asymmetric structures, significantly reducing radiation loss, increasing transmission rates, and extending phase tuning ranges to nearly 180°. This innovation introduces a new method for enhancing phase-shifting capabilities while maintaining transmission efficiency. Furthermore, a two-dimensional terahertz beam control method utilizing liquid crystal programmable metasurfaces is developed [Fig. 14(c)], enabling two-dimensional beam scanning with advantages such as a broad frequency range, low cost, and high reliability, demonstrating significant potential in reconfigurable intelligent surfaces and holographic imaging. A 1-bit two-dimensional reflective programmable metasurface array, sized 98×98 and fabricated with a 22 nm CMOS process, experimentally demonstrates terahertz beam control with approximately 1° beamwidth, as well as sidelobe reduction and angular correction [Fig. 16(c)]. Moreover, a programmable metasurface design driven by thin-film transistors (TFTs) achieves phase modulation of up to 270° at 0.4 THz with an average reflection efficiency exceeding 30%. Across frequencies ranging from 0.36 to 0.43 THz, phase modulation exceeding 180° is maintained, achieving a peak gain of 13 dB at far field with a deflection angle of 50° (Fig. 18). A metasurface for terahertz wave detection and modulation, based on VO2 enables a beam deflection range of 42.8° at 425 GHz and establishes a software-defined sensory response system for intelligent terahertz wave manipulation, enhancing communication security and reducing interference [Fig. 19(a)]. A dual-layer graphene metasurface unit is introduced [Fig. 21(c)], offering greater flexibility compared to single-layer designs, enabling a wide phase response range and high reflection efficiency. Simulations show that a 68×68 programmable metasurface achieves an effective focusing error of only 6%. In addition, a terahertz passive phased array with dual resonance modes, based on graphene-metal hybrid metasurfaces [Fig. 25(a)], achieves beam deflection angles of ±25° at a frequency of 1.03 THz with a reflectivity of 23%. A reflective metasurface driven by microelectromechanical systems (MEMS) enables complete polarization control, dynamic wavefront deflection, and real-time rewritable holographic displays, achieving ±70° beam deflection at 0.8 THz [Fig. 26(b)] and hologram design in two dimensions [Fig. 26(c)]. By integrating spatial and temporal dimensions into metamaterial systems, a time-space medium metasurface is proposed for unidirectional propagation and reconfigurable steering of terahertz beams [Fig. 29(a)]. Advances in perfect and symmetry-preserving Huygens metasurfaces demonstrate significant improvements in transmission efficiency, reaching up to 90%, with unit transmission spectra achieving 360° phase coverage. As research continues, terahertz phased array technology steadily progresses toward higher performance and broader applications.Conclusions and ProspectsActive phased arrays demonstrate high control efficiency but face challenges in scaling and power capacity. Conversely, passive phased arrays excel in beam control and scalability while maintaining lower efficiency in control devices. While current terahertz phased arrays are primarily suited for mid-range applications due to their shorter effective range compared to microwave and millimeter-wave bands, ongoing developments suggest significant potential for high-mobility platforms. Terahertz phased arrays are anticipated to become critical modules in high-precision radar and high-throughput communication systems, driving the future application of terahertz technology on dynamic platforms.
Apr. 10, 2025Vol. 45 Issue 7 0700001 (2025)
Dilishati Wumaier, Paerhatijiang Tuersun, Aidehaijiang Manafu, Meng Wang, and Dibo Xu
ObjectiveDiscovering Ag@TiO2 core-shell nanoparticles capable of precisely adjusting the localized surface plasmon resonance (LSPR) peak within the near-infrared biological window is crucial for improving cancer diagnosis and treatment. Conventional diagnostic approaches are restricted by high expenses, intricate procedures, and potential risks. Despite the benefits of near-infrared bioluminescence imaging technology, current methods have limitations. While Ag nanoparticles exhibit advantageous LSPR properties, their stability and biocompatibility are sub-optimal, and the problems can be addressed via core-shell formation. Previous Ag@TiO2 core-shell nanospheroids feature LSPR wavelengths beyond the near-infrared biological window, thus making them unsuitable for biological imaging. Therefore, investigating the light scattering properties of non-spherical Ag@TiO2 core-shell nanoparticles (such as rotary nanospheroids and nanorods) and optimizing their size parameters are essential for advancing near-infrared bioluminescence imaging technology, especially in the field of cancer diagnosis.MethodsWe employ the finite element method (FEM) for electromagnetic field analysis, integrating a refractive index size modification model for metal nanoparticles to simulate light scattering properties of Ag@TiO2 core-shell nanoparticles, including nanospheroids and nanorods. Meanwhile, a geometric model is built by inputting incident light, particle parameters, and environmental conditions, followed by setting material properties, boundary conditions, mesh division, calculations, and post-processing of results. To validate FEM accuracy, we conduct comparisons with the Mie theory and T-matrix method, demonstrating high agreement. Furthermore, the influence of metal nanoparticle size on the refractive index is considered, with a specific complex refractive index formula utilized for computation. This approach not only ensures precision and reliability but also provides an effective avenue for exploring the light scattering behavior of Ag@TiO2 core-shell nanoparticles with diverse shapes and dimensions.Results and DiscussionsWe investigate metal@TiO2 core-shell nanoparticles and yield the following novel findings. The first is core material selection. By carrying out simulation and comparison of volume scattering coefficients of Ag@TiO2, Au@TiO2, Cu@TiO2 core-shell nanospheroids and nanorods (Fig. 4), it is determined that Ag-core nanoparticles demonstrate the most pronounced light scattering properties at resonance wavelengths. The volume scattering coefficient of Ag@TiO2 nanospheroids peaks at 804 nm, providing a basis for future investigations. The second is the influence of size parameters. An analysis of the scattering properties of Ag@TiO2 core-shell nanoparticles under varying core lengths, aspect ratios, and shell thicknesses is conducted. With the increasing core length, the resonance wavelength initially shifts toward shorter wavelengths before transitioning to longer wavelengths, accompanied by a scattering coefficient increase. Additionally, a rise in the core aspect ratio leads to a red shift in the resonance wavelength and a decrease in the scattering coefficient, while a shell thickness increase brings about a similar red shift in the resonance wavelength and a scattering coefficient decrease (Figs. 5?7). The manipulation of these size parameters enables precise tuning of the resonance wavelength within the visible to near-infrared spectrum, which is consistent with practical application demands. Meanwhile, we investigate environmental and orientation effects to assess their influence on light scattering properties. It is observed that an increase in the environmental refractive index leads to a red shift in the resonance wavelength and an increase in the scattering coefficient (Fig. 8). Furthermore, alterations in particle orientation result in the appearance of longitudinal and transverse LSPR modes in the scattered light spectrum. The wavelength of the longitudinal LSPR mode can be adjusted from the visible to near-infrared range, exhibiting high intensity and enhanced versatility (Fig. 9). In the field of biological imaging optimization, the size parameters of Ag@TiO2 core-shell nanoparticles are fine-tuned for two commonly utilized laser wavelengths of 800 nm and 980 nm. This optimization strategy aims to achieve maximum volume scattering coefficients, thereby determining the optimal core lengths and aspect ratios (Fig. 10). The tailored Ag@TiO2 core-shell nanoparticles are identified as promising contrast agents for biological imaging applications.ConclusionsWe find that Ag@TiO2 core-shell nanoparticles outperform their counterparts with Au and Cu cores in terms of light scattering properties, especially at the commonly employed 800 nm and 980 nm wavelengths for biological imaging. By adjusting the core length, aspect ratio, and shell thickness, the resonance scattering peak position can be precisely controlled, covering the visible to near-infrared spectrum to meet diverse application requirements. An increase in the environmental refractive index leads to a red shift and reduced intensity of the scattering peaks. Although particle orientation does not change the scattering peak position, it can control the appearance of L-LSPR and T-LSPR modes, with L-LSPR providing a wider wavelength tuning range. At 800 nm, optimized Ag@TiO2 core-shell nanoparticles exhibit optimal light scattering performance, with the maximum volume scattering coefficient reached at a core length of 106 nm and an aspect ratio of 2.8. At 980 nm, both the optimal size parameters and scattering coefficients have been improved. Therefore, optimized Ag@TiO2 core-shell nanoparticles are ideal contrast agents for biological imaging.
Apr. 14, 2025Vol. 45 Issue 7 0729001 (2025)
Zhuanping Zheng, Jing Huang, Bo Wang, Shuaiyu Zhao, and Jiewei Jiang
Objective4-Hydroxy-3-methoxybenzoic acid (HVA) is one of the antibacterial components extracted from plants in nature. It is an important endogenous metabolite of adrenaline and norepinephrine, with anti-mutation and anti-cancer effects in the human body. It can also be used in food additives and pharmaceutical synthesis. 5-methoxysalicylic acid (5-MeOSA) is a natural product that serves as an effective matrix for mass spectrometry analysis of oligonucleotides when combined with spermine. It is also an important intermediate in organic synthesis in the chemical industry. 5-MeOSA and HVA are isomers, sharing the same functional group in their structures. Although these two isomers appear similar, their functions differ significantly. Many organic molecules exhibit intramolecular vibrations and intermolecular interactions in the THz range, making terahertz time-domain spectroscopy (THz-TDS) a useful method for identifying substances and studying the physicochemical properties of materials. Due to its low-photon energy and fingerprint properties, THz-TDS has become widely used for the qualitative detection and molecular interaction studies of isomers.MethodsA transmission terahertz spectrometer is used to measure the terahertz spectra of the samples. The system employs the electro-optic sampling method, with a testing range of 0.5?7.0 THz and a spectral resolution of 0.008 THz. Solid-state samples of HVA and 5-MeOSA are prepared for experimental measurement by pressing them into tablets with a 13 mm diameter. Theoretical simulations are performed using the method of linear combination of atomic orbitals, employing the hybrid functional of B3LYP and the Grimme’s hexamethylcyclotrisiloxane dispersion correction, with a 6-311g (d, p) basis set. Vibrational modes are analyzed using Bayesian linear regression’s vibrational mode automatic relevance determination (VMARD) method to identify the sources of the THz absorption peaks. The weak interaction forces within the molecular systems are analyzed using energy decomposition analysis based on force field (EDA-FF).Results and DiscussionsAs shown in Fig. 2, HVA exhibits six characteristic absorption peaks at 1.10, 1.63, 1.76, 2.19, 2.59, and 3.08 THz. 5-MeOSA displays four clear characteristic absorption peaks within the testing range, located at 1.30, 1.49, 2.20, and 3.24 THz. The THz experimental and theoretical spectra for HVA and 5-MeOSA are shown in Fig. 3. Theoretical calculations effectively reconstruct the experimental spectra, which provide a basis for explaining the vibrational modes of the absorption peaks. Table 1 shows the assignment of the THz experimental absorption peaks and theoretical optical modes for both isomers. Figures 4 and 5 show the vibrational modes of HVA and 5-MeOSA at specific frequency values. The results indicate that the vibrational modes of HVA in the THz low-frequency range are due to dihedral angle and bond angle bending, while the vibrational modes of 5-MeOSA mainly result from dihedral angle torsion and out-of-plane angle bending. Specifically, dihedral angle torsion contributes most to the vibrations and is the primary source of THz characteristic absorption peaks for both isomers. The absorption peaks of HVA and 5-MeOSA at 2.20 THz are mainly due to the vibration of methoxy functional groups, which are influenced by weak intermolecular interactions. Furthermore, Tables 2 and 3 show the interaction energy components for the HVA and 5-MeOSA fragments. Finally, Figs. 6 and 7 illustrate the total binding energy atomic coloring diagram and dispersion atomic coloring diagram for both isomers. The results show that the electrostatic attractions between Flag1-Flag2 and Flag3-Flag4 in HVA are -12.78 kJ/mol and -33.93 kJ/mol, respectively. A pair of hydrogen bonds (O21—H33…O4) is formed between Flag1 and Flag2, and two pairs of hydrogen bonds (O41—H53…O64 and O64—H75…O42) are formed between Flag3 and Flag4. Dispersion forces contribute significantly to the total binding energy in the HVA system. In 5-MeOSA, a pair of hydrogen bonds (O15—H16…O80 and O55—H56…O40) are formed between Flag1 and Flag4 and between Flag2 and Flag3, with similar contributions of -24.44 kJ/mol and -24.54 kJ/mol to the electrostatic attraction between the fragments. The dispersion effect in 5-MeOSA mainly arises from the methoxy, carboxyl, and hydroxyl functional groups, as well as carbon atoms on the benzene ring.ConclusionsIn response to the difficulty of distinguishing isomers in the food industry, we apply terahertz time-domain spectroscopy to study the spectral information of HVA and 5-MeOSA in the THz region. The THz spectra of these two isomers in the range of 0.5?3.5 THz are obtained, revealing significant differences in their THz absorption peaks. Theoretical simulations based on density functional theory are conducted, and the theoretical and experimental spectra are found to match well, allowing us to summarize the origins of the measured THz absorption peaks. It is found that the THz peaks of HVA primarily originate from dihedral angle and bond angle bending, while the THz absorption peaks of 5-MeOSA mainly come from dihedral angle torsion and out-of-plane angle bending. In addition, the weak interactions in the molecular systems of HVA and 5-MeOSA are analyzed using EDA-FF, which shows that the weak interactions in both molecules are mainly dominated by dispersion forces, followed by electrostatic interactions. Three pairs of hydrogen bonds form in the molecular system of HVA, stacking in a spatial structure, while two pairs of hydrogen bonds are present in 5-MeOSA’s molecular system, with the structure being close to planar. Our research demonstrates that combining THz-TDS with DFT, VMARD, and EDA-FF methods is an effective approach for identifying isometric organic molecules. We also provide valuable reference data for the identification and characterization of HVA and 5-MeOSA, as well as for investigating their physicochemical properties.
Apr. 27, 2025Vol. 45 Issue 7 0730001 (2025)
Jiarong Li, Bo Fang, Weimin Duan, Heng Zhang, Yang Chen, Nuo Chen, Weixiong Zhao, and Weijun Zhang
ObjectiveFormaldehyde (HCHO) is an important air pollutant in both indoor and outdoor environments. Its emission sources include the direct releases from industrial emissions, construction materials, and polymeric resin-based furnishings. HCHO can also be generated through the photochemical oxidation of volatile organic compounds (VOCs) in atmospheric environments. Accurate measurement of formaldehyde concentration is crucial for health effect studies, atmospheric chemistry research, and pollution prevention. Tunable diode laser absorption spectroscopy (TDLAS) is one of the important methods for detecting formaldehyde, which offers advantages such as high sensitivity, high time resolution, and in-situ measurement. However, temperature variation in the operating environment can affect the key parameters of a TDLAS system, thereby impacting system stability and measurement sensitivity. To address this issue, two primary temperature control methods are usually employed. One involves directly controlling the temperature of the multi-pass gas cell (MPC) to maintain optical path length stability. The other entails temperature control of the entire optical path of the TDLAS system, including the multi-pass cell, laser, photodetector, mirrors, and lenses. Temperature control has been demonstrated to be an effective means to improve the performance of TDLAS systems. However, precise temperature control specifically tailored for formaldehyde measurement systems has not been reported before.MethodsA TDLAS system with optical path temperature control is developed for formaldehyde measurement. The instrument uses a mid-infrared interband cascade laser emitting at 3.5 μm as the probe source. The absorption line of formaldehyde is selected at 2831.64 cm-1 with a line strength of S=5.651×10⁻²⁰ cm-1/(molecule·cm-2). A compact dense spot pattern spherical mirror cell is developed with an optical base length of 17.7 cm, which allows the incident laser beam to reflect 312 times in the multi-pass cell, thereby increasing the effective absorption path length to 55.2 m, with a volume of only 350 mL. The Gaussian beam formula is used to fit the beam radius at different distances to obtain the beam waist position. A focusing lens (f=500 mm) is employed to adjust the beam waist position. The laser beam waist is matched to the center of the multi-pass cell, which is located 479 mm away from the laser. To enhance measurement precision, wavelength-modulated spectroscopy (WMS) and rapid background subtraction techniques are used to minimize the noise in the spectral signal. A semiconductor cooling temperature control box is developed to maintain the operating temperature of the optical system at 32 ℃.Results and DiscussionsThe temperature inside the temperature control box could be stabilized at 32 ℃ with a high precision of 6 m℃ (Fig. 6) when the temperature control is turned on. Rapid background subtraction is performed using a three-way solenoid valve, which enables swift switching between the background gas and sample gas. The total time consumed to complete a background subtraction measurement is 16 s. The sample gas signal is difficult to distinguish accurately due to interference from background structures. However, by subtracting the background gas spectrum, the 2f signal can be extracted, which significantly improves the detection sensitivity of the system (Fig. 7). During calibration, the absolute concentrations of diluted HCHO gas in the cell are calculated using direct absorption spectroscopy. The peak-to-peak value of the formaldehyde 2f signal exhibits a linear relationship with volume fraction, which yields a correlation coefficient of 0.9994 (Fig. 8). The performance of the TDLAS instrument is evaluated by measuring a time series of formaldehyde concentrations at a fixed volume fraction. With temperature control enabled, the system achieves a detection precision of 0.25×10⁻⁹ (1σ, 60 s), which is 4.7 times higher than that when temperature control is disabled (Fig. 10).ConclusionsThe system utilizes a compact, dense spot pattern spherical mirror optical multi-pass cell with a path length of 55.2 m and a volume of only 350 mL to enhance the effective absorption path. The beam profile of the used interband cascade laser emitting at 3.5 μm is measured, and the laser beam waist is matched to the cell. A semiconductor-based thermoelectric temperature control box is designed to precisely regulate the entire optical path, including the interband cascade laser, multi-pass cell, and detector, which achieves a temperature control precision of 6 m℃ at the set point of 32 ℃. By combining wavelength modulation spectroscopy and rapid background subtraction techniques, the system achieves a measurement precision of 0.25×10⁻⁹ (1σ, 60 s) under temperature-controlled conditions, which is 4.7 times higher than that under non-temperature-controlled conditions.
Apr. 27, 2025Vol. 45 Issue 7 0730002 (2025)
Juan Li, Peng Liu, Tao Liu, Ruifang Dong, and Shougang Zhang
ObjectiveThe development of ultrafast femtosecond laser sources in different spectral regions has aroused great interest, which can be applied to fields such as spectroscopy and material processing. However, due to the limitations of solid-state and fiber gain media fluorescence bandwidth, the wavelength coverage range of mode-locked ultrafast lasers is usually restricted to a limited area in the near-infrared and mid-infrared regions. Second harmonic generation (SHG) provides a very effective method for circumventing this limitation and is commonly adopted to generate shorter wavelength light fields. In particular, single-pass SHG provides the simplest device that can be easily implemented in the most compact and cost-effective system. However, the spatial walk-off effect caused by the birefringence of crystals is often an important factor limiting the conversion efficiency. Additionally, when pulsed light is utilized for SHG, the group velocity mismatch will give rise to temporal walk-off effect in the time domain, which will also limit the conversion efficiency improvement. Therefore, it is necessary to study how to achieve optimal conversion efficiency in the presence of spatio-temporal walk-off effects. Generally, conversion efficiency can be enhanced by increasing the crystal length, improving the peak power of the fundamental pulse, and adjusting the focusing parameter. Our study mainly concentrates on optimizing the focusing parameter. The focusing parameter is a crucial factor that is relatively easy to manipulate in experiments. It directly influences the intensity distribution of the beam and the interaction within the crystal, thus playing a significant role in improving the conversion efficiency. We investigate the influence of the spatio-temporal walk-off effect on the generation of 405 nm pulsed light during the type-I single pass SHG, in which an 810 nm femtosecond pulse pumps a BIBO crystal. By conducting theoretical analysis, the optimal focusing conditions for efficient conversion efficiency under different spatio-temporal walk-off effects are provided. We offer important theoretical guidance for optimizing the preparation of second harmonic light fields under different spatio-temporal walk-off effects.MethodsTo investigate the influence of spatio-temporal walk-off effects on conversion efficiency, we define the temporal walk-off parameter A and the spatial walk-off parameter B [Eqs. (1) and (2)]. We assume that the fundamental field is Gaussian both spatially and temporally, and ignore the effects of crystal absorption and group velocity dispersion. The larger values of A and B lead to more severe walk-off effects. Subsequently, we utilize the built theoretical model hmA,B,ξ [Eq. (3)] to characterize the conversion efficiency. From this function, it is intuitively evident that the spatio-temporal walk-off parameters A and B, as well as the focusing parameter, influence the conversion efficiency. Therefore, for different spatio-temporal walk-off parameters, we can determine how the focusing parameter affects the conversion efficiency. In the experiment, to study the conversion efficiency under different focusing parameters, we employ four lenses with different focal lengths (250, 100, 50, and 30 mm) to change the waist radius of the fundamental light. In each case, the conversion efficiency under different fundamental light power is measured and analyzed.Results and DiscussionsAs depicted in Fig. 3, the variation of hmA,B,ξ with ξ shows distinct trends for different A and B values. However, there is a peak in general, which indicates that the conversion efficiency will reach its optimal under a certain focusing parameter ξm. Under the fixed value of A, as the value of B increases, the curve moves downward as a whole. The efficiency decreases and then ξm decreases, which implies that a weak focus is required to enhance the efficiency. When B is fixed, as the value of A increases, the curve also moves downward overall. At this time the efficiency decreases, but ξm increases, which means that strong focus is needed to improve the efficiency. Therefore, for the existence of spatio-temporal walk-off effects, the optimal focusing parameter can be obtained by theoretical calculation. In the experiments, we analyze the results under different focusing parameters (Fig. 5). Under the focusing parameter of 1.21, the maximum conversion efficiency of approximately 51% is obtained, and the experimental data is consistent with the theoretical simulation results, which validates the correctness of the theory. Additionally, we analyze the influence of spatial walk-off effect on the spatial profile of second harmonic light (Table 2). In weak focusing conditions, the ellipticity of second harmonic light is 94.9%, indicating that it is less affected by the spatial walk-off. In strong focusing conditions, the ellipticity decreases to 80.7% under the influence of spatial walk-off.ConclusionsIn the process of critical phase matching frequency doubling pumped by pulsed light, there exists a spatial walk-off effect caused by birefringence and a temporal walk-off effect caused by the group velocity mismatch. We conduct a study on how to improve the conversion efficiency by optimizing the focusing parameter in the presence of spatio-temporal walk-off effects both theoretically and experimentally. The results demonstrate that the optimal focusing parameter gradually increases with the growing temporal walk-off. As the spatial walk-off rises, the optimal focusing parameter gradually decreases. In the experiment, 405 nm pulsed light is generated by a single pass SHG of pulsed light with a duration of 140 fs and a central wavelength of 810 nm. By optimizing the focusing parameter, the conversion efficiency of 51% is achieved. Although the conversion efficiency in our study is not the highest among relevant studies, mainly due to the differences in the types and lengths of the employed crystals, our systematic analysis of the optimal focusing parameter under different spatio-temporal walk-off effects provides valuable guidance for similar studies.
Apr. 27, 2025Vol. 45 Issue 7 0732001 (2025)
Xinyue Zhang, Xinyu Du, Xiaoyang Hu, Yujie Cui, Dongyu Liu, Dong Xiang, and Yongji Liu
ObjectiveThe optical characteristics of the peripheral field of view are closely related to the onset and progression of myopia. Accurate measurement of peripheral field aberrations is thus crucial for myopia prevention and control. When using the Shack-Hartmann (SH) wavefront sensor to measure peripheral aberrations in the human eye, two key challenges must be addressed to ensure data accuracy: elliptic pupil processing and phase unwrapping. Currently, three elliptic pupil processing algorithms are available: large circle pupil (LC), small circle pupil (SC), and stretched ellipse pupil (SE) methods. However, their ability to produce Zernike coefficients that align with the true wavefront remains unstudied—this is a significant clinical concern. Therefore, one objective of this paper is to identify the algorithm most consistent with actual wavefront aberrations. In addition, to overcome the limitations of edge point loss in the sequential phase unwrapping algorithm, we propose an edge point screening method that automates sequential unwrapping, replacing the manual removal techniques commonly used in prior studies.MethodsTo minimize errors caused by experimental measurements, a wide-field aberration measurement system for the human eye, based on the SH sensor, is constructed using Zemax’s non-sequential mode (Fig. 1). Spot images generated by the SH wavefront sensor under horizontal fields of view of 0°, 10°, 20°, and 30° are collected. A wide-field wavefront reconstruction data processing program is developed in MATLAB, using these spot images as input. Zernike coefficients are then calculated using three elliptic pupil processing methods: LC, SC, and SE. The wavefront aberration at the exit pupil of the eye model, representing the true wavefront aberration of the human eye model, is extracted in serial mode. By calculating the root mean square error (RMSE), spherical equivalence M, horizontal astigmatism J0, and point spread function (PSF) of the reconstructed wavefronts, the differences between the three elliptic pupil processing methods, and the true wavefront aberration are quantitatively compared. For unwrapping, an edge screening method is proposed to pair point fields with the sequence one by one. The program is written in MATLAB.Results and DiscussionsThe differences between defocus (Z4), astigmatism (Z5), and spherical aberration (Z12) coefficients and the real wavefront aberration under a 0° field of view are 0.132, 0.003, and 0.008 μm, respectively (Table 1), demonstrating the reliability of the system modeling and wavefront reconstruction algorithm. The validity of the edge-screening method, based on ranking methods for the unwrapping algorithm, is confirmed by obtaining consistent results with previous studies. The differences between Zernike coefficients reconstructed by the three methods and the real wavefront are compared under 10° and 30° fields of view. No significant differences are observed in the small field of view, while discrepancies begin to emerge in larger fields of view (Fig. 7). Quantitative analysis of the RMSE, M, and J0 (Table 3) further support these findings. At the 10° field of view, the residual error of the SC method is as low as 1.958%, indicating the most accurate reconstruction. At a 30° field of view, the residual error of the SC method is 4.717%, making it the closest to the real wavefront. Clinically, similar trends are observed: no significant differences in M and J0 among the three methods at 10° field of view; however, at the 30° field of view, the LC and SC methods show significant differences in M, while the J0 values remain consistent, with the SE method yielding the smallest deviation from the real wavefront. To further characterize the visual influence of wavefront aberrations, PSF images are generated using Zernike coefficients from the three methods and are compared with PSF images derived from the true wavefront. Under a small field of view, the PSF images closely match the real PSF, with minor edge deformation observed in the SE method. At larger fields of view, the PSF images from the SE and LC methods exhibit no significant differences from the PSF obtained from the true wavefront aberrations, while the SC method shows noticeable data loss.ConclusionsIn a small field of view, all three methods—LC, SC, and SE—produce wavefront aberrations consistent with the true aberrations. However, the SE method introduces an additional, irreversible stretching effect on the PSF. Therefore, the SC method is the preferred choice for constructing wavefront aberrations in this context, given its simplicity and ease of implementation. For larger fields of view, the SE method is the optimal choice due to its superior accuracy in providing reliable wavefront estimations. The improvement brought by the edge screening method in the sequential spot location method is considerable.
Apr. 27, 2025Vol. 45 Issue 7 0733001 (2025)
Lina Shi, Geng Niu, Junbiao Liu, and Li Han
ObjectiveComputed laminography (CL) technology can conduct high-precision non-destructive testing of large-size plate components. The extremely high precision requirements of the sample stage result in expensive equipment, being limited by the brightness of X-rays, and small scanning speed, which are not conducive to the promotion of the application. Based on the above limitations, a high-speed scanning micro-focus X-ray source for ring targets is proposed, which generates a micro-focus X-ray source with circular trajectory motion through rapid scanning of a ring target by an electron beam and can substantially improve the sample inspection efficiency. But the electron beam will produce deflection aberration during scanning leading to aberrations, and it is necessary to utilize an aberration correction system while constraining the deflection angle to maintain the beam spot size and shape of the electron beam.MethodsIn this paper, based on the theory of electron optics, the effects of aberration, working distance, and scanning range on the beam spot size and shape during the scanning process of the electron beam are theoretically analyzed, and then the physical model of the ring target high-speed scanning micro-focus X-ray source is established based on the electron optical calculation software of Munro’s Electron Beam Software (MEBS). Then, the physical model of the ring target high-speed scanning micro-focus X-ray source is established based on MEBS, and the minimum beam spot size corresponding to the absence of the scanning field at different working distances, as well as the beam spot sizes at the farthest edge of the scanning field at different working distances, scanning ranges and aberration correction systems is calculated. Finally, based on the analysis of the calculation results, the maximum deflection range that can guarantee the spot size and shape of the electron beams at different working distances, and the effects of different aberration correction systems on the spot size and properties at the farthest edge of the deflection field are given.Results and DiscussionsUnder the same working distance, as the scanning range increases, the degree of beam spot ellipticity becomes larger (Fig. 7); under the same scanning range, as the working distance increases, the degree of beam spot ellipticity becomes smaller (Fig. 8). For different scanning ranges, there exists a critical working distance, and within this scanning range, the beam spot size and shape of the electron beam do not change much. When a scanning range and a working distance are converted into a scanning angle, there exists a relatively optimal critical scanning angle of about 2.87° (0.05 rad), less than which the deflected beam spot aberration is small. After using the aberration correction system, the quality of the beam spot at different deflection ranges and working distances is significantly improved, and the corresponding scanning angle is increased to some extent (Table 3).ConclusionsThis paper presents theoretical analysis and simulation work on the electron optics of a micro-focus X-ray source for high-speed scanning of ring targets. The relationship among the beam spot size and shape, the working distance, and scanning range is revealed, and the relatively optimal critical scanning angle is about 2.87° (0.05 rad), in which the spot size and shape of the electron beam can be guaranteed to be basically unchanged. After the aberration correction, this scanning range is increased to some extent. This work provides a theoretical reference for the designs of the electron beam control system and target material in the ring target high-speed scanning microfocus X-ray source and confirms the feasibility and great potential of the static high-speed CL scanning system based on the ring target. In future work, the design will be further optimized by combining the existing calculation model, the existing micro-focus X-ray source prototype will be modified, and experiments will be designed for validation, which will bring its real application in nondestructive testing scenarios of plate components.
Apr. 27, 2025Vol. 45 Issue 7 0734001 (2025)
Wanjia Yin, Zengyan Zhang, and Xiaohao Dong
ObjectiveCompound refractive lens (CRL) is an indispensable component for focusing high-energy X-rays in the new generation of light source scientific apparatus. CRL achieves focusing by stacking multiple unit lenses, which can easily lead to the accumulation of error defects. Various problems often arise during their fabrication, such as surface deviations, relative transverse offsets, and mutual tilt angles of the front and back surfaces, which can affect the intensity and focal position of the focused beam. It is very important to measure these parameters without damaging the sample to adjust process parameters and optimize lens application. For two-dimensional focusing lenses, microscopy can only detect the single-sided surface profile, and wavefront metrology methods such as X-ray speckle can only qualitatively judge the alignment by restoring figure errors. X-ray computed tomography (CT) can meet the need for overall characterization of the three-dimensional structure of the lens, but there is a problem of missing subsequent data processing. To solve the issue of three-dimensional profile characterization of hyperbolic refractive lenses, we propose a measurement method based on point cloud processing. By fitting and calculating the surface point cloud model obtained from X-ray CT, typical double-sided processing quality parameters, including relative transverse offset, mutual tilt angle, and single-sided curvature radius, can be accurately measured, which provide accurate and detailed data support for fabrication optimization.MethodsThis method is mainly divided into three steps: first, X-ray CT scanning is used for three-dimensional reconstruction; then, the surface boundary point cloud data is extracted through threshold segmentation; finally, the point cloud model is segmented, fitted, and calculated. In the first step, the sample is scanned using synchrotron radiation X-ray CT to obtain several projection images, which are reconstructed into a three-dimensional slice image with varying grayscale values. Due to the presence of noise in the image, the air and diamond matrix cannot be completely separated using a single threshold segmentation method. Therefore, based on the global threshold, watershed segmentation is applied to re-mark and define overlapping pixels to complete the clear surface boundary segmentation. The surface mesh is then generated to extract its point cloud data. The point clouds on both sides are divided at equal distances, and the centroid points of each layer are found. Straight lines are fitted based on the coordinates of the centroid points. The angle between the two straight lines represents the mutual inclination angle of the two sides. The relative transverse offset is calculated by finding the distance between the overall centroid points of the point clouds on both sides. For the curvature radius of a single-sided surface, after cutting off the point cloud data from the top flat part of the surface, a polynomial equation is fitted to achieve its numerical calculation.Results and DiscussionsTaking six samples of double parabolic refractive lenses made of diamond material through femtosecond laser processing as examples, we carry out the verification experiment at the beamline BL13HB at the Shanghai Synchrotron Radiation Facility (SSRF). Samples are placed on a rotating table, as shown in Fig. 3(c), and 1080 projection images are taken, as shown in Fig. 4(a). The ideal segmentation boundary, obtained by combining global threshold segmentation and watershed segmentation through Avizo software, is shown in right of Fig. 4(b). Fig. 4(c) shows the three-dimensional visualization of the lens sample. In the equidistant segmentation of the point cloud model, the number of layers is key to the numerical calculation. The relationship between the calculated value of the mutual tilt angle and the number of layers is analyzed. Among the extracted centroid coordinates, some centroid points are far away from the center position. When the number of layers is too small, these deviation points will affect the straight-line fitting results. Figure 8 shows the angle calculation values θ of the six lens samples as the number of layers changes. The calculation results tend to stabilize after 200 layers, so 250 layers are an appropriate choice. Table 2 gives the calculated values of the relative transverse offsets and mutual tilt angles for the six samples. The calculation of the single-surface curvature radius is compared with the measurement results of the confocal laser scanning microscope. As shown in Table 3, the two results are in good agreement, with the maximum error being 1.58% and the minimum error being as low as 0.09%.ConclusionsTo address the contour characterization problem of hyperbolic refractive lenses, we propose a point cloud processing method. With the aid of synchrotron X-ray CT technique, a method combining global threshold segmentation and watershed segmentation is used to extract surface boundaries and point cloud models. No filtering or denoising is required. The million-coordinate data contained in the model can fully restore the contour morphology of the lens sample and can accurately characterize cases of excessive inner wall inclination. The accuracy of this method is further verified through comparison tests with laser scanning confocal microscopy. The proposed method can enable the quantitative calculation of relative transverse offset and mutual inclination angle in three-dimensional space and has significant application value in improving and optimizing fabrication technology.
Apr. 10, 2025Vol. 45 Issue 7 0734002 (2025)
© Copyright 2018-2021 | Chinese Laser Press.
All Rights Reserved 沪ICP备15018463号-20