


Please enter the answer below before you can view the full text.


2025
Volume: 45 Issue 4
26 Article(s)

Jun Qiu, Yuejing Qi, Jiani Su, Zhiyu Shi, Miao Jiang, and Jiangliu Shi
ObjectiveWith the continuous reduction of process nodes in integrated circuit manufacturing, the accuracy requirements for overlay measurements have become increasingly stringent. As optical overlay measurement technology advances, evaluating the robustness of overlay marks and selecting appropriate measurement conditions are essential. When the overlay mark’s pitch is smaller than the incident wavelength, an off-axis aperture and lens must be used during the measurement process to achieve tilted light incidence and obtain diffraction information. The rigorous coupled-wave analysis (RCWA) method analyzes diffraction signals under a single incidence condition. In this paper, we propose a method for calculating the diffraction efficiency of gratings under converging light based on the principle of angle-resolved scattering measurement. This method combines pupil sampling and the RCWA, allowing for the calculation of diffraction signals from resonant domain gratings whose periods are close to the incident wavelength. A model for optical characteristics in overlay measurement is established using this method. Key parameters of overlay marks with different structures, such as diffraction efficiency (DE), measuring sensitivity (K), and stack sensitivity (SS), are calculated for various incident light wavelengths and polarization states. In addition, the relationship between these parameters and overlay measurement errors is investigated, offering valuable insights for the design and optimization of overlay marks.MethodsIn this paper, we propose a method for calculating the diffraction efficiency of gratings under convergent light, combining pupil sampling with RCWA to obtain the ±1st-order diffraction efficiency of overlay marks (Fig. 2). The pupil is sampled in polar coordinates, and the incident angle, conical angle, and polarization angle at each sampling point are calculated. The diffraction signals of the grating, illuminated by incident light at specific positions, are computed using RCWA. Finally, the overall diffraction efficiency of the overlay mark under all incident light conditions is obtained by weighted averaging. A model for the optical characteristics of overlay measurement is established based on this method. Key parameters for a sample overlay mark (Fig. 7) are calculated for different incident light wavelengths and polarization states (Table 2). Based on the simulation results, appropriate measurement conditions are selected to achieve higher accuracy in overlay measurements. The relationship between the overlay performance parameters and overlay measurement errors is also further investigated.Results and DiscussionsThe simulation results for DE, K, and SS under different measurement conditions (Fig. 8) reveal that overlay performance parameters depend on the mark structure, incident wavelength, polarization state, and other factors. For the example overlay mark (Fig. 7), considering the relative importance of key performance parameters, the optimal measurement conditions are, an LOL structure, incident light wavelengths ranging from 660 to 710 nm, and TE polarization. Comparing the performance parameters (K and SS) and overlay measurement error (δOVL) under different conditions (Fig. 10), it is evident that δOVL shows several peaks when the incident light wavelengths are 480 nm and 600 nm, corresponding to values of K and SS approaching 0. Variation curves of the ±1st-order diffraction intensity difference with overlay, ranging from -40 nm to 40 nm, are simulated for incident light wavelengths of 480 nm and 600 nm. The Pearson correlation coefficient is used to evaluate the linearity of the simulation curves. The results indicate that when the Pearson correlation coefficient between the ±1st-order diffraction intensity difference and overlay error is relatively low, and the DBO linear measurement conditions are not met, leading to significant measurement errors. To ensure high-precision measurements, wavelengths that cause large errors should be avoided by referencing the overlay simulation curve during actual measurements.ConclusionsBased on the principle of angle-resolved scattering measurement, we propose a method to calculate the diffraction efficiency of gratings using joint pupil sampling and RCWA under converging light irradiation, addressing the simulation requirements for overlay marks with a pitch close to the wavelength of incident light. An optical characteristic model for overlay measurement, which calculates key parameters for overlay marks, is established using this method. We offer principles for selecting optimal configuration conditions to achieve high-precision overlay measurement. A simulation case illustrates the application of these principles. We conclude that to avoid significant overlay measurement errors, measurement conditions should be chosen where K and SS do not approach 0, as the variation curves of the ±1st-order diffraction intensity difference with overlay exhibit apparent nonlinearity under such conditions. The method and simulation analysis presented in this paper offer theoretical support and practical references for the design and optimization of overlay marks.
Feb. 20, 2025Vol. 45 Issue 4 0405001 (2025)
Zilong Liu, and Yuan Hu
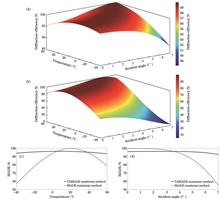
ObjectiveWe aim to address the inadequacies in traditional double-layer diffractive optical element (DLDOE) designs, which ignore the influence of environmental temperatures and incident angles on diffraction efficiency. To this end, we propose the temperature-angle-bandwidth integrated average diffraction efficiency (TABIADE) maximization method for DLDOE design that involves DLDOE optimization and analysis under wide temperature ranges and wide field of view (FOV) to determine the optimal design wavelength pairs and corresponding parameters. Our results demonstrate that the TABIADE maximization method significantly improves the diffraction efficiency of DLDOE over a wide temperature range and large FOV, thereby enhancing the imaging quality of refraction-diffraction hybrid systems. This approach enhances the theoretical foundation for DLDOE design and provides crucial guidance for the practical engineering applications.MethodsWe employ a mathematical model to analyze the effects of environmental temperatures and incident angles on the diffraction efficiency of DLDOE and propose the TABIADE maximization method for optimization. First, we derive the mathematical model of DLDOE diffraction efficiency, with the influence of temperature and incident angle variations considered. Subsequently, based on this mathematical model, we develop the TABIADE maximization method, which comprehensively considers the influences of temperatures, angles, and wavelengths to enhance the diffraction efficiency of DLDOE. Next, we conduct a case study by adopting DLDOE in the mid-wave infrared band and optimize the design wavelength pairs to achieve high diffraction efficiency over a wide temperature range. Finally, we apply the optimized DLDOE to design a mid-wave infrared refraction-diffraction hybrid system and conduct experimental validation, thereby demonstrating the superior performance of the optimized diffractive elements.Results and DiscussionsDLDOE designed by employing the TABIADE maximization method demonstrates significant advantages in response to variations in environmental temperatures and incident angles. Figures. 1(a) and (b) illustrate the effects of design wavelength pairs on diffraction characteristics under different environmental temperatures and incident angles. Table 1 compares the performance parameters of DLDOE designed based on the TABIADE maximization method and the traditional bandwidth integrated average diffraction efficiency (BIADE) maximization method. DLDOE designed via the TABIADE maximization method exhibits smaller diffraction orders and microstructure heights, with significantly improved diffraction efficiency under various environmental temperatures and incident angles. Figures. 1(c) and (d) further compare the diffraction efficiency difference between these two design methods. The comparison demonstrates that DLDOE designed by adopting the TABIADE maximization method has higher diffraction efficiency and TABIADE values over a wide temperature range and large FOV, which confirms the superiority of this method. Finally, the optimized DLDOE is applied to mid-wave infrared refraction-diffraction hybrid systems, yielding excellent imaging performance under different environmental temperatures.ConclusionsTraditional methods for designing DLDOE often ignore the influence of environmental temperatures and incident angles on diffraction efficiency, resulting in suboptimal designs. We propose the TABIADE maximization method for optimizing DLDOE under wide temperature ranges and large FOV. By comparing DLDOE designed by utilizing the TABIADE maximization method with those designed via the traditional BIADE maximization method, we find that the former significantly improves diffraction efficiency and enhances the imaging quality of refraction-diffraction hybrid systems. Application of the optimized DLDOE to mid-wave infrared refraction-diffraction hybrid systems yields excellent imaging performance under various environmental temperatures. Therefore, our study provides novel insights and methods for the design and engineering application of DLDOE.
Feb. 20, 2025Vol. 45 Issue 4 0405002 (2025)
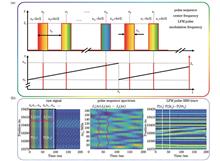
Ming Liu, Zhe Ma, Jianzhong Zhang, Xin Li, Rui Li, Zhihao Meng, and Mingjiang Zhang
ObjectiveDistributed fiber acoustic sensing (DAS) technology is an advanced sensing technology that utilizes backward Rayleigh scattering in optical fibers to locate and recover changes in environmental physical quantities at any position on an optical fiber link. It is widely applied in health monitoring of large infrastructure such as oil and gas pipelines, bridges and tunnels, and transportation tracks. However, traditional DAS systems possess defects like interference fading and conflicts between sensing distance and spatial resolution. To address these issues, frequency scanning schemes and linear frequency modulation pulse schemes have been successively proposed. For the frequency scanning scheme, to achieve high-resolution strain measurement, the frequency scanning step must be reduced, which leads to a longer measurement cycle and a narrowed frequency response range of dynamic strain. Increasing the frequency scanning step, on the other hand, further restricts the strain resolution. For the linear frequency modulation pulse scheme, the maximum value of a single strain measurement of the system is limited by the modulation bandwidth of the linear frequency modulation pulse. For example, measuring 1000 με requires a modulation bandwidth of over 150 GHz, imposing excessively high demands on device indicators. We aim to develop a solution that can combine the high strain resolution of linear frequency modulation with a wide range of strain measurement.MethodsWe propose and experimentally validate a dynamic strain sensing method based on linear frequency modulation pulse sequence. This method combines linear frequency modulation pulse technology and frequency scanning technology. The detection light pulse is modulated into a linear frequency modulation pulse sequence with center frequency scanning through phase modulation. The dynamic strain causes frequency shift and time shift phenomena on the pulse sequence frequency scanning spectrum and the linear frequency modulation pulse RBS space-time distribution diagram respectively. The frequency shift result enables a larger strain measurement range, and the time shift result leads to a high strain resolution. The pulse reorganization demodulation algorithm is employed for demodulation, and the linear frequency modulation pulse measurement distortion value can be identified and the large strain measurement result of the frequency scanning pulse sequence can be used for numerical prediction. Meanwhile, the measurement range of the system is extended by the cyclic calibration correlation method, and the actual strain value is finally calculated.Results and DiscussionsThe pulse sequence frequency scanning gauge factor and linear frequency modulation pulse time shift gauge factor of the system are calibrated by applying different strain values to the PZT. The measured pulse sequence frequency scanning gauge factor is -150.8 MHz/με, the maximum value of strain that can be measured by the pulse sequence is approximately 1260 nε, and the linear frequency modulation pulse time shift gauge factor is -251.6 ns/με (Fig. 5). When an amplitude modulated signal is applied to PZT, the strain is demodulated by a pulse recombination demodulation algorithm. Both small and large amplitude strains are well restored, and the strain sensitivity reaches 30 pε/Hz1/2 (Fig. 7). Since the pulse reorganization demodulation algorithm uses a cyclic calibration operation, the curve cross-correlation calculation results can be expanded through continuous iteration of the calibration value, and finally a disturbance with an amplitude of 600 με is demodulated (Fig. 9).ConclusionsThis study proposes and experimentally verifies a dynamic strain sensing method based on a linear frequency modulation pulse sequence. The detection light pulse is modulated into a linear frequency modulation pulse sequence with a center frequency scan through phase modulation. According to the injection order of the pulse sequence, the original data is reorganized into a pulse sequence frequency scan result with a frequency shift characteristic and a linear frequency modulation pulse result with a time shift characteristic. The demodulation is carried out using a pulse reorganization demodulation algorithm. The experimental results demonstrate that when this method measures low-frequency dynamic strain (<10 Hz) at a distance of 10.45 km, the maximum value of the single strain measurement of the traditional single pulse detection scheme is expanded by over 6 times to 1260 nε. Simultaneously, the measurement range of the system is increased to 600 με through the cyclic calibration correlation method, the strain resolution is 4 nε, and the strain sensitivity reaches 30 pε/Hz1/2. The proposed method has significant advantages and application potential in the field of large strain measurement range and high strain sensitivity measurement.
Feb. 19, 2025Vol. 45 Issue 4 0406001 (2025)
Minghong Wu, Gengxin Zheng, Shaoming Qu, Yuanyuan Gan, Yongkang Xiong, and Yishi Han
ObjectiveFree space optical (FSO) networks, with their large bandwidth, unlicensed spectrum, and high data rates, have become a promising technology for future broadband wireless networks. These networks provide an appealing alternative to traditional radio frequency (RF) and optical fiber networks, especially in environments where conventional communication technologies encounter difficulties, such as in remote or disaster areas. However, the data transmission of FSO networks is prone to atmospheric conditions like rain, fog, and snow, which can lead to link attenuation or even communication interruption. In addition, the problem of dead nodes in the network, where nodes lose communication capability due to equipment failure or energy depletion, also challenges the connectivity and reliability of the FSO network. Traditional routing protocols and heuristic routing algorithms have achieved some success in optical fiber networks and wireless radio frequency networks. However, they do not effectively adapt to the rapid changes in link communication quality and node instability in the dynamic FSO network environment and have certain limitations. Due to the characteristics of FSO networks and the drawbacks of existing routing algorithms, a new routing algorithm needs to be proposed to handle the dynamic and complex network environment. This new routing algorithm should have stronger adaptability and can dynamically adjust the routing strategy according to the real-time link quality and node state.MethodsWe present the deep Q network with mask (DQNM) algorithm, a reliable routing solution based on deep reinforcement learning (DRL) specifically designed for FSO networks. The proposed algorithm utilizes the capabilities of DRL to learn the complex relationships between environmental states (such as weather conditions and node health) and corresponding routing actions. This enables the algorithm to optimize the routing decisions and ensure the most reliable transmission path in dynamic and uncertain network conditions. The algorithm’s reward function is designed to be related to the link margin, a critical parameter in FSO communication systems that reflects the quality of the communication link. Through experiments, we verify the effectiveness of link margin as a reliable metric for assessing the transmission performance of FSO links. One of the remarkable features of the DQNM algorithm is the incorporation of the action mask mechanism. This mechanism allows the algorithm to avoid selecting links that are either too unstable due to adverse weather conditions or those connected to dead nodes. By masking out invalid or ineffective actions during the training process, the algorithm avoids wasting resources on redundant actions, thereby improving training efficiency. This action masking process enhances the robustness of the learning process as it reduces the influence of poor-quality links and dead nodes on the overall performance of the algorithm. Eventually, this approach leads to a more reliable and efficient routing solution for FSO networks, especially under challenging environmental and operational conditions.Results and DiscussionsSimulation results show that in the dynamic and uncertain FSO network environment, the deep Q network (DQN) algorithm requires about 12000 training iterations to gradually converge. In contrast, the proposed DQNM algorithm converges in around 5000 iterations, achieving an approximately 58.3% improvement in convergence speed. When the two algorithms converge, the data fluctuation amplitude of the DQNM algorithm is smaller than that of DQN algorithm, and it has higher routing cumulative reward performance. This improvement is due to the presence of many ineffective actions during the training of the DQN algorithm, which degrades its overall performance. In comparison, the DQNM algorithm mitigates the impact of adverse link conditions and dead nodes through the incorporation of an action masking mechanism, thereby reducing redundant training and enhancing both learning efficiency and robustness. This, in turn, leads to a significant increase in the reliability of FSO network transmission. Furthermore, the DQNM algorithm attains packet delivery rates of 96.9%, 91.3%, and 84.5% under rain, snow, and fog conditions, respectively, showing improvements of 2.9, 5.3, 6.9 percentage points over the DQN algorithm. Under the same conditions, the DQNM algorithm also exhibits reductions in average energy consumption and average transmission delay by 10.5%, 17.4%, and 16.6%, as well as 9.2%, 15.0%, and 15.0%, respectively, when compared to the DQN algorithm. Additionally, when dead nodes are present in the network, the packet delivery rate of the DQNM algorithm reaches 88.2%, which is 3.8 percentage points and 9.2 percentage points higher than those achieved by the DQN and ant colony algorithms, respectively.ConclusionsIn the context of the complex FSO network environment, we propose a reliable routing algorithm based on DRL. The algorithm takes advantage of the capabilities of DRL to learn the functional mapping between environmental states and actions, thereby facilitating reliable routing in FSO networks. While traditional DRL algorithms can adapt to changes in the state space, they often involve a large number of ineffective actions during training, which can undermine the overall training performance. To solve this problem, the DQNM algorithm is introduced. By incorporating an action mask mechanism to reduce the impact of harsh link environments and dead nodes, the algorithm decreases training redundancy, enhances learning efficiency, and improves robustness. As a result, the proposed DQNM algorithm considerably enhances the reliability of data transmission in FSO networks.
Feb. 20, 2025Vol. 45 Issue 4 0406002 (2025)
Changjiang Ye, Jun Li, Chang Su, Tianqi He, Chengkang Yao, and Xinyuan Qi
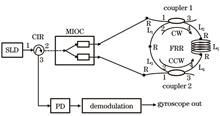
ObjectiveWe compare the resonant fiber-optic gyroscope (RFOG) with the interferometric fiber-optic gyroscope (IFOG). The fiber ring length of the RFOG is only tens of meters or even several meters, which not only reduces the volume and weight but also decreases the noise resulting from the uneven distribution of temperature and stress in the fiber ring. However, due to the high coherence of narrow linewidth light sources, there are some additional noises like backscattered noise that are difficult to eradicate in the system. The new generation RFOG using a broad spectrum light source can reduce the coherence term in backscattered noise, further enhancing the performance of the wide spectrum RFOG. However, the direct current (DC) term of backscattered noise in the system cannot be removed, restricting the accuracy of the gyroscope. Therefore, it is of great significance for us to improve the detection accuracy of the system by reducing the DC term of backscattered noise in the broad spectrum RFOG. Our research aims to reduce the backscattered noise by optimizing the relevant parameters of the system, thus improving the gyroscope performance.MethodsWe analyze the interference of clockwise and counterclockwise light in the resonator. Theoretically, we obtain the relationship between the DC term and the wavelength in the backscattered noise. We simulate the variation trend of backscattered noise with wavelength and refractive index. We construct a broad spectrum RFOG system and measure the variation of backscattering light intensity with wavelength through experiments to verify the correctness of the theory.Results and DiscussionsThe RFOG driven by a broadband source can reduce the coherence term of backscattered noise in the gyroscope system, but the DC term still limits the improvement of gyroscope performance. According to the simulation results, the backscattered intensity decreases with the increase of wavelength and increases with the increase of the refractive index. Therefore, in practical applications, it is advisable to select a light source with a large working wavelength and devices with a small refractive index of pigtail to reduce backscattered noise. The results of the backscattered noise test show a decrease in backscattered noise with increased wavelength, which is consistent with the simulation result. The angular random walk (ARW), which measures the rate of change of the gyroscope’s output with respect to time, of the RFOG driven by a broadband source decreases with the increase of wavelength, indicating the practical benefits of our research in improving gyroscope performance.ConclusionsOur study has obtained significant results by optimizing the wavelength of a broadband source and its correlation with backscatter theory. We conclude that the longer the wavelength, the smaller the backscattering of the gyroscope system and its components, and the smaller the angular random walk (ARW) of the gyroscope. Compared with the 1540 nm wavelength, the ARW and backscattering intensity (BI) of the gyroscope at 1554 nm are reduced by 15% and 25% respectively. This provides crucial insights for the selection of the working wavelength of the source and the improvement of the angular random walk of the RFOG driven by a broadband source. At room temperature, the tuning range of the super luminescent diode (SLD) light source at the 1550 nm band is only about ±10 nm, so this method has limited space for improving the ARW of the gyroscope. At present, there are SLDs with a central wavelength of 1650 nm on the market, and further experiments are needed to verify the improvement of gyroscope performance after increasing the wavelength. Since other factors also affect the intensity of backscattered light in the experiment, the backscattering magnitude caused by specific devices in the system can be determined by isolation experiments in the future, so as to reduce the backscattering of the gyroscope system by reducing the backscattering of devices.
Feb. 10, 2025Vol. 45 Issue 4 0406003 (2025)
Chunxue Liu, Junyi Zhang, and Qianqian Long
ObjectiveWith the rapid proliferation of the Internet of Things (IoT) and smart devices, the demand for high-precision indoor positioning technologies is increasing. However, traditional positioning methods still face significant limitations in terms of accuracy, cost, and privacy protection. Visible light positioning (VLP) technology, which combines both illumination and positioning capabilities, has become a key research direction in the field of indoor positioning. Nevertheless, in practical applications, the presence or movement of obstacles introduces shadowing effects that severely degrade system accuracy and may cause communication interruptions. These challenges limit the performance improvements and widespread adoption of VLP technology. To address this issue, investigating the influence of obstacles on system performance and developing positioning methods with high adaptability and robustness are critical for both theoretical and practical purposes. In this paper, we propose an innovative indoor visible light positioning method that integrates the war strategy optimization (WSO) algorithm with the generalized regression neural network (GRNN). By optimizing the predictive capabilities of the model, this method significantly enhances positioning accuracy while improving the system’s adaptability and robustness in dynamic environments. The proposed method effectively mitigates the adverse effects of shadowing, offering a practical solution to meet the requirements for high-precision positioning in complex and rapidly changing scenarios.MethodsIn this paper, the influence of obstacle position and height on optical power distribution, as well as the effects of shadowing on communication performance and positioning accuracy, are thoroughly analyzed by constructing an indoor visible light channel model. Based on these insights, a WSO-GRNN-based indoor visible light positioning method is proposed. The received signal strength indicator (RSSI) is used as the input feature, and the GRNN smoothness factor is optimized to significantly enhance the performance of the positioning algorithm. A 5 m×5 m×3 m indoor simulation environment is designed, where RSSI data are dynamically collected to build training and test datasets under varying obstacle positions and heights. The positioning performance of the WSO-GRNN method is compared with the least square (LS) method and GRNN through simulation experiments. Key performance metrics, including mean positioning error, root mean square error (RMSE), and the cumulative distribution function (CDF) of errors, are used to evaluate the effectiveness of the algorithms. The experimental results confirm the high adaptability and robustness of the WSO-GRNN algorithm in dynamic environments.Results and DiscussionsThe results of this paper demonstrate that the position and height of obstacles have a pronounced influence on the distribution of received optical power and positioning accuracy. Notably, when obstacles are located in central areas (Fig. 6) or at greater heights (Fig. 9), shadowing effects cause a significant reduction in received optical power, leading to a substantial increase in positioning error (Figs. 7 and 10). Using the proposed WSO-GRNN method, the average positioning error in an obstacle-free environment is less than 7 cm [Figs. 4(g)?(i)], representing a marked improvement compared to LS and GRNN methods. Even in the presence of obstacles, regardless of their position or height, the WSO-GRNN method maintains an average positioning error between 4.1 cm and 7.1 cm, with RMSE ranging from 7.1 cm to 11.2 cm, significantly outperforming GRNN and LS methods (Tables 2 and 3). In addition, WSO-GRNN shows outstanding stability in its CDF results. Even under significant shadowing effects, the error distribution remains within a low range [Figs. 7(c) and 10(c)]. Compared to traditional methods, WSO-GRNN effectively mitigates the adverse effects of shadowing on positioning accuracy, demonstrating high adaptability and robustness in dynamic and complex environments. This method provides an innovative and effective solution to enhance the performance of indoor visible light positioning systems.ConclusionsBuilding on the analysis of how obstacles influence indoor visible light positioning systems, we propose the WSO-GRNN positioning method and verify its effectiveness through simulation experiments. The results indicate that the position and height of obstacles significantly influence the distribution of received optical power and positioning accuracy, with shadowing effects being the primary factor contributing to the degradation of communication performance. The proposed WSO-GRNN method achieves a positioning error of only 7 cm in environments without obstacles and maintains high accuracy even in environments with obstacles, with an average error controlled within 8.6 cm, markedly outperforming traditional methods. This method demonstrates strong adaptability and robustness to dynamic environmental changes and effectively mitigates the adverse effects of shadowing on positioning accuracy. However, the current model has limitations in the real-time updating of training data. Future studies could introduce dynamic memory modules or online learning algorithms to enhance the system’s ability to adapt to more complex and rapidly changing real-world environments. This research provides an innovative and effective solution to enhance the accuracy and stability of indoor visible light positioning technology, laying a solid foundation for its application in intelligent buildings, industrial automation, and other fields.
Feb. 21, 2025Vol. 45 Issue 4 0406004 (2025)
Tailong Guo, Huaiyu Cai, Yi Wang, and Xiaodong Chen
ObjectiveIn recent years, with the rapid advancement of microsurgical techniques, ophthalmic surgical microscopes have played a crucial role in enhancing the quality of ophthalmic surgeries. However, prolonged exposure to the light source of the operating microscope during surgery can cause phototoxic damage, such as retinopathy and mild pigment disturbance in patients. Studies have shown that reducing lighting intensity can significantly lower the risk of phototoxic damage to eye tissues and reduce photophobia in patients. Therefore, performing ophthalmic surgeries under low illumination holds significant application value. With the evolution of ophthalmic surgical microscopes, ophthalmologists are no longer confined to observing surgeries through traditional microscope eyepieces. Instead, they can observe the surgical site and perform procedures via a camera and display screen, providing an opportunity to reduce lighting intensity. Under low illumination, normal images can be obtained by extending the exposure time or increasing the camera gain. However, increasing exposure time reduces the frame rate of image acquisition, while raising camera gain introduces significant electronic noise. Hence, there is a pressing need to develop an algorithm to enhance low-illumination images captured by the microscope, improving the quality of surgical images while ensuring real-time performance.MethodsTo improve the quality of low-illuminance ophthalmic images while ensuring real-time performance, we propose a low-illuminance image enhancement network based on the ophthalmic surgical microscope. The illuminance adjustment module is designed using DCE-Net as its foundation, with improvements to the high-order adjustment curve to reduce the number of parameters and operation time. The final high-order adjustment curve is directly learned by the illuminance adjustment module, replacing the iterative process in DCE-Net. A denoising module with residual connections is introduced for image pre-processing, preserving texture information while removing noise. In addition, a hue recovery module and corresponding loss function are designed to extract the hue recovery matrix and global correction values to restore the image’s hue after illumination adjustment. A series of pig-eye images are collected under low illumination conditions using the ophthalmic operating microscope. Experimental results confirm that the proposed algorithm enhances low-light ophthalmic surgical images while meeting the real-time requirements of surgical operations and mitigating issues of noise and color distortion.Results and DiscussionsFirst, we compare the proposed algorithm with seven other algorithms using a low-light synthetic image dataset and a low-light pig-eye image dataset. Our algorithm preserves the original hue of the image while ensuring real-time performance and noise reduction. It achieves superior enhancement results, with the enhanced images closely resembling the ground truth (Figs. 5 and 6). Compared to other algorithms, our method performs well in peak signal-to-noise ratio (PSNR) and structural similarity (SSIM), achieving the best results. The proposed algorithm processes a 4K image in about 7 ms, meeting the real-time requirements for surgical scenarios (Table 1 and Table 2). To further validate the algorithm’s effectiveness under various illumination conditions, we enhance low-light pig-eye images captured under different lighting conditions. Our method can reduce the illumination intensity required by the ophthalmic operating microscope by about 80% (Fig. 7). Ablation experiments are conducted for each module and loss function. Removing the RD-Module and CR-Module results in decreased SSIM and PSNR, poorer image quality, and a noticeable decline in the overall visual effect (Fig. 8 and Table 3). Without any loss function constraints, the enhanced image quality deteriorates, with reductions in both SSIM and PSNR (Fig. 9 and Table 4).ConclusionsIn this paper, we present a low-light ophthalmic surgery image dataset and propose a low-light image enhancement network designed for an ophthalmic surgical microscope, accompanied by relevant loss functions to guide network training. The algorithm divides the low-light image enhancement task into three sub-tasks, each with clear objectives. In this network, the RD-Module removes noise from the input image, yielding a denoising low-light image. The IA-Module then adjusts the image’s illumination pixel by pixel, producing an illumination-adjusted image. Finally, the CR-Module restores the global hue of the illumination-adjusted image to generate the final enhanced image. Experimental results show that, compared to conventional ophthalmic surgeries, our algorithm reduces the illumination intensity required by the ophthalmic surgical microscope by about 80%. In both the low-light synthetic image and pig-eye image datasets, our algorithm outperforms existing methods in terms of image quality and visual effect while meeting the real-time demands of surgical operations. The algorithm processes a 4K surgical image in just 7 ms, demonstrating its advantages and practicality. However, the algorithm’s performance diminishes when dealing with uneven illumination, and its ability to recover image detail and texture remains limited. Future work will focus on further optimizing the network’s model to enhance its robustness. In addition, adaptive enhancement of low-light surgical images will be explored to meet the specific illumination needs of surgeons in different surgical scenarios.
Feb. 21, 2025Vol. 45 Issue 4 0410001 (2025)
Dongrui Li, Jintao Liu, and Songhua Wu
ObjectiveSpectral imaging captures data in three dimensions, including two spatial dimensions and one spectral dimension. Common two-dimensional detectors cannot access all data content simultaneously. Traditional scanning spectral imaging methods employ a time-dependent multiplexing detector to acquire partial dimensional information in one exposure and stitch multiple exposures to form a complete three-dimensional spectral image. Our study adopts a snapshot spectral imaging method based on microlens arrays, which captures three-dimensional spectral image information in a single exposure. By sacrificing some spatial and spectral resolution, temporal resolution is improved. This approach meets the need for high sensitivity and fast time resolution in observations.MethodsOur study encompasses the theoretical analysis and practical implementation of a spectral imaging system based on microlens arrays. The system architecture is described, including the imaging lens, beam splitter, microlens array, collimator lens, wedge prism, focusing lens, and detector. The integral imaging principle of microlens arrays is derived analytically, with light tracing simulations performed to evaluate the integral spot size under varying incident light cone angles. The theoretical spectral resolution is examined by adopting both dispersive ray tracing simulations on the detector surface, and collimating and focusing lenses with different focal lengths, thus yielding the theoretical spectral resolution of the system. The system parameters are defined by integrating theoretical and simulation results, and bandpass filters are employed to calibrate the spot positions of each wavelength. Spatial resolution and three-dimensional spectral imaging tests are conducted by utilizing uniform stripes with varying spacing and 24-color checkers, validating the system’s three-dimensional spectroscopic observation capabilities.Results and DiscussionsThe integration formula derivation for the microlens array indicates that the sub-pupil diameter is a single-valued function of the incident angle, increasing monotonically with the angle [Eq. (5)]. Optimal integration requires minimal light divergence post-imaging lenses (Fig. 3). Ray tracing simulations with collimating and focusing lens focal lengths of 30 mm/30 mm, 30 mm/50 mm, 40 mm/40 mm, and 50 mm/50 mm demonstrate that increasing the focusing lens focal length alone does not significantly enhance spectral resolving power (Fig. 6). In contrast, increasing the collimating lens focal length yields notable improvements in spectral resolving power (Fig. 7). The system’s theoretical optimal spectral resolution is 25 nm with 40 mm focal lengths for both lenses. Calibration of spot positions by employing bandpass filters with central wavelengths of 450, 500, 532, 589, 628, and 685 nm reveals that the spot interval for 450 and 685 nm is 16.2 pixel, corresponding to an actual distance of 38.9 μm on the detector, which is consistent with ray tracing results (Fig. 10). Spatial resolution tests employing uniform stripes with varying spacing indicate three-dimensional spectral image resolution of at least 1.2 m and two-dimensional spatial image resolution of at least 0.5 m at a target distance of 30 m (Fig. 12). Three-dimensional spectral imaging with a 24-color checker confirms the system’s ability to distinguish different color regions across six bands (Fig. 13), thus validating its three-dimensional spectral detection proficiency.ConclusionsOur study presents the development of a snapshot spectral imaging system by utilizing microlens arrays for three-dimensional spectral imaging within the visible wavelength range. Theoretical analysis and light tracing simulations are conducted to elucidate and validate the factors influencing the integral spot size of microlens arrays and the effects of collimation and focusing lens focal lengths on the system’s spectral resolving power. The system employs microlens arrays as the integrating element, achieving spectral imaging across six bands within the 450?685 nm range. The spatial resolution for the three-dimensional spectral image reaches 1.2 mm, while that for the two-dimensional spatial image reaches 0.5 mm at a target distance of 30 m. Validation by adopting a 24-color checker produces spectral images across different wavelength bands, confirming the system’s proficiency in three-dimensional spectral imaging.
Feb. 21, 2025Vol. 45 Issue 4 0411001 (2025)
Yiyang Hu, Shunkun Liang, Banglei Guan, Yang Shang, and Qifeng Yu
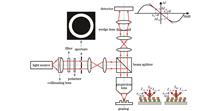
ObjectiveLarge engineering structures such as tracks, dams, and tunnels are subjected to loads and environmental effects during their service life, leading to varying degrees of deformation. Even minor deformations in these structures can have severe consequences, including safety hazards and significant economic losses. Therefore, precise and continuous deformation measurement methods are essential to support safety monitoring, mechanical analysis, and risk assessment. Recent advances in experimental mechanics, computer science, and photogrammetry have led to the widespread use of vision-based non-contact measurement techniques, valued for their cost-effectiveness, versatility, and adaptability. Over decades of development, these methods have evolved into robust tools for deformation measurement in large structures. Current methods include contact-based measurement, laser ranging, digital image correlation (DIC), and structured light techniques. However, each has limitations: contact-based methods require physical interaction with the structure, resulting in low efficiency and high costs. Laser ranging instruments offer millimeter-level accuracy, but they struggle to meet the precision requirements of small-scale deformation measurements and cannot measure angular deformations effectively. DIC methods necessitate speckling or marking the surface, which alters the structure’s appearance. Structured light methods are restricted by their short working range. To address these limitations, a high-precision, easy-to-install, and cost-effective measurement system is urgently needed for measuring small deformations in large-scale structures.MethodsTo address the challenges of existing methods, we propose a novel approach that integrates the principles of optical lever and videometrics. First, the system structure and optical path diagram of this method are presented. Based on the application scenario, the measurement method and process are designed. Specifically, the optical path consists of a laser light source, a bidirectional mirror, and an imaging screen. During the structural deformation process, the camera continuously captures images of the laser spot projected on the imaging screen. The center coordinates of the spot are then extracted using a dedicated algorithm. By applying the geometric constraints of optical path propagation, the changes in the spot position are used to establish a relationship between the structure’s deformations (both distance and angular changes) and the spot’s actual movement. Structural deformations are ultimately calculated through a nonlinear iterative solution algorithm. The approach combines the broad adaptability of camera-based measurement techniques with the high precision of the optical lever method, enabling continuous and real-time monitoring of small deformations in large structures. The proposed method achieves high-precision measurements of millimeter-level displacements and small-angle deformations in large-scale structures.Results and DiscussionsThe feasibility and accuracy of the proposed method are verified through both simulations and practical experiments. In the simulation phase, random errors such as Gaussian-distributed reference measurement errors and laser beam angle deviations are introduced to simulate actual measurement conditions (Table 1). In addition, the influence of errors in spot center extraction on deformation measurement accuracy is analyzed. Through these simulations, the relationship among spacing errors, angular measurement errors, and spot center extraction errors is determined. The influence of system parameter setting errors on measurement accuracy is also investigated (Fig. 4). Subsequently, a practical measurement system is established to validate the accuracy of the proposed method. Experimental results show that the average displacement error is 0.0536 mm, and the average angular error is 0.000638° (Tables 2, 3, and 4). Overall, the results demonstrate that the proposed deformation measurement method achieves high-precision displacement and angular measurements, effectively meeting the requirements for small deformation measurement in large structures, such as tracks.ConclusionsTo address the limitations of traditional videometric techniques in measuring small deformations in large structures, we propose a novel method that combines optical lever principles with videometrics. This method transforms small deformations, which are difficult to measure directly, into pixel changes that are easier to quantify. By employing a subpixel-based spot extraction algorithm and a nonlinear iterative solution algorithm, the method achieves higher measurement precision. Simulation experiments and practical measurements verify that the proposed method not only enhances measurement accuracy but also demonstrates excellent adaptability and stability. The experimental results show that the method enables continuous, real-time monitoring of small deformations in large structures. Furthermore, the measurement accuracy for both displacement and angular deformations meets the requirements for engineering applications. Future work will focus on further optimization of the system design, expanding its application in diverse real-world environments, and exploring its potential integration into automated and intelligent monitoring systems.
Feb. 21, 2025Vol. 45 Issue 4 0412001 (2025)
Yonghong Wang, Qianshan Liu, Jiangxun Zhou, Wanlin Pan, and Biao Wang
ObjectiveIn critical sectors such as aerospace, automotive manufacturing, and defense, material performance at high temperatures significantly influences stability and reliability. With advancing technology, there is an increasing need to measure the mechanical properties of materials under high-temperature conditions. Traditional high-temperature contact measurement techniques, such as strain gauges and laser extensometers, provide only localized deformation data, which is insufficient for applications requiring full-field deformation information. Consequently, digital image correlation (DIC) technology, known for its non-contact, full-field measurement capability, has gained prominence in high-temperature measurements. However, thermal radiation and disturbance inherent in high-temperature environments pose significant challenges, causing image overexposure, quality degradation, and calculation errors. Moreover, temperature gradients in non-vacuum environments can induce pixel drift and jitter, further reducing measurement accuracy. In this paper, we propose a high-temperature DIC measurement method combining the automatic color equalization (ACE) algorithm and image inverse filtering to address these issues. This approach significantly improves the accuracy of high-temperature DIC environments, offering practical value for material performance evaluation in extreme environments.MethodsThe research methodology consists of two main steps. First, the ACE algorithm is employed to address thermal radiation and haze-like phenomena in high-temperature environments. Based on Retinex theory, the algorithm adjusts pixel values by calculating the relative brightness and darkness of target pixels and their surrounding pixels, thus enhancing image contrast. The ACE algorithm operates in two stages. The first stage, color space adjustment, achieves color constancy and contrast enhancement through regional adaptive filtering and chromatic aberration correction. In the second stage, output range configuration, linear scaling is applied to stretch the pixel values of the intermediate results to the dynamic range of [0, 255], ensuring accurate tone mapping and luminance constancy. Next, image inverse filtering technology is utilized to mitigate the effects of thermal disturbance. This approach improves image quality and measurement accuracy by performing inverse filtering in the frequency domain to correct images degraded by thermal disturbances. The principle involves counteracting refractive index variations caused by inhomogeneous thermal flow field, which result from temperature gradients in high-temperature environments and distort the light propagation path. In this paper, a frequency-limiting filtering method is employed to enhance the process. By reducing the filter radius and minimizing zero-value occurrences, the method effectively improves image quality and the precision of DIC measurements. Finally, the proposed method’s effectiveness is validated through experiments on image dehazing and thermal disturbance elimination conducted at 1000 ℃.Results and DiscussionsExperimental results demonstrate that the proposed high-temperature DIC measurement method, based on the ACE algorithm and image inverse filtering technology, can effectively produce high-contrast, clear speckle patterns under extreme conditions of 1000 ℃. In the image dehazing experiments, the ACE algorithm significantly suppresses background light and thermal haze, improving image contrast and making speckle features more distinct (Fig. 8). In both static and dynamic thermal disturbance experiments, images processed with inverse filtering show a smoother displacement gradient and notably reduced displacement values, effectively mitigating errors caused by thermal disturbance (Fig. 10). Particularly in dynamic experiments, the displacement results after inverse filtering closely align with theoretical true values, demonstrating higher accuracy. In contrast, displacement curves without inverse filtering fluctuate around the true value, indicating substantial measurement errors. These findings confirm that the proposed method can not only deliver high-quality measured images but also achieve high-precision measurements, with full-field displacement measurement errors controlled to within 5% (Fig. 12).ConclusionsThe high-temperature DIC measurement method, combining the ACE algorithm and image inverse filtering technology, offers an innovative solution for specimen imaging and thermal disturbance elimination in high-temperature environments. This software-based method effectively mitigates the effects of thermal radiation and disturbances, significantly enhancing the accuracy of high-temperature DIC measurements. Compared to traditional methods, this technique eliminates reliance on costly optical hardware or vacuum environments, making it both practical and economical. Experimental validation at 1000 ℃ confirms its capability to produce clear images and perform high-precision displacement field calculations. This advancement provides robust technical support for studying high-temperature material properties. In conclusion, this research not only improves the accuracy of high-temperature DIC measurement technology but also broadens its application scope in high-temperature measurements, offering substantial value for advancing industrial and scientific research fields.
Feb. 19, 2025Vol. 45 Issue 4 0412002 (2025)
Yu Gao, Xiuqing Hu, Yuqing He, and Hanlie Xu
ObjectiveLow-light remote sensing compensates for the limitations of optical remote sensing in low-light environments, such as during nighttime or early morning. To utilize low-light band Earth observation data for quantitative remote sensing, accurate on-orbit radiometric calibration is essential. However, the medium resolution spectral imaging-low light imaging spectrometer (MERSI-LL) onboard China’s first early morning orbit satellite, FengYun-3E satellite (FY-3E), faces challenges due to solar stray light interference and the lack of onboard calibration. By analyzing FY-3E/MERSI-LL observation data, it is found that the Antarctic umbra region (polar night, devoid of solar radiation) in winter provides an opportunity for calibration, as the influence of stray light is minimized. Cross-calibrating FY-3E’s low-light band using data from the umbra region and comparing it with other low-light remote sensing instruments can help avoid stray light interference during the calibration process.MethodsIn this paper, we focus on Dome C, a stable ice-covered area in the Antarctic umbra region, as the calibration target. National Oceanic and Atmospheric Administration NOAA-20’s visible infrared imaging radiometer suite (VIIRS) and day/night band (DNB) channel is used as the reference for cross-calibration of FY-3E’s low-light band. Cross-observation data from VIIRS and MERSI-LL are analyzed. The varying levels of moonlight during different polar night days provide a broad dynamic range for the low-light band’s brightness. A lunar irradiance model is used to calculate the lunar radiation under different moon phases over multiple days. Spectral corrections based on the spectral response function and angular corrections based on the lunar model are applied to the VIIRS data to derive the reference radiance for the MERSI-LL low-light band. Calibration coefficients are then obtained by performing linear regression between the reference radiance and the digital number (DN) values of MERSI-LL.Results and DiscussionsThe cross-calibration method proves effective for on-orbit radiometric calibration of the FY-3E low-light band, with a linear correlation coefficient exceeding 0.98 (Fig. 6). By using observations from different lunar phases, the dynamic range of the observed radiance for a single target is extended (Fig. 7). An error analysis is conducted for both the operational calibration results and the cross-calibration results. Using the 2021 cross-calibration coefficients as the calibration coefficients for the subsequent five lunar cycles, and comparing the differences between the cross-calibration results and the operational calibration results with respect to the VIIRS reference, the cross-calibration results demonstrate a smaller root mean square error (RMSE), closer to the 1∶1 line, with an average deviation of less than 10%, compared to the regression results of the operational calibration (Fig. 9). The relative deviations of the operationally calibrated irradiance and cross-calibrated irradiance relative to VIIRS for different lunar cycles are calculated separately according to Eq. (11), the average relative deviations of the cross-calibration results are smaller than those of the operational calibration results for each month (Table 5). From a time-series perspective, in July 2021, when the cross-calibration was performed, assuming no initial decay of MERSI-LL, by May 2022, the instrument had experienced a 3.64% decay, and by July 2023, the instrument had undergone a 9.96% decay, necessitating regular updates of the calibration coefficients.ConclusionsIn this paper, we propose a method for in-orbit cross-calibration of the FY-3E low-light band using observations from the multi-lunar-phase Antarctic umbra region. By leveraging the high calibration accuracy of NOAA-20 VIIRS/DNB as a reference, this method cross-calibrates the FY-3E MERSI-LL low-light band and monitors on-orbit calibration deviations. Through careful selection of cross-matched data, angular corrections based on the lunar model, and spectral corrections based on the spectral response function, the method achieves absolute radiometric calibration of MERSI-LL in orbit. The obtained calibration coefficients are comparable to the official operational calibration results. Compared to the official operational calibration, the cross-calibration method aligns more closely with VIIRS results, with an average relative deviation of less than 10%. The method can be applied to calibrate the FY-3E MERSI-LL low-light band, which is affected by stray light, assess calibration accuracy, and track the long-term stability of the instrument’s radiometric response.
Dec. 25, 2024Vol. 45 Issue 4 0412003 (2025)
Shiming Chen, Hao Wang, Junbo Liu, Xinxin Zhao, Le Wang, Shengchun Wang, Ning Yu, Linhan Jin, and Wei Wang
ObjectiveWith the expansion of railway operation scale and the increase in service time, the demand for the efficiency of track condition inspection and maintenance has risen remarkably. The traditional manual track inspection or hand-pushed equipment can hardly meet the requirements of modern railways for inspection efficiency and accuracy. Non-contact methods based on on-board dynamic inspection, such as the combination of optical and inertial sensors, can efficiently complete the measurement of track geometric parameters, profiles, and other key indicators. However, the measurement of single sensors (for example, line-structured optical sensors) under dynamic conditions has problems like trajectory distortion, especially the limited accuracy in the direction of rail extension, which becomes a key factor restricting the accuracy of track 3D point cloud construction. Compensating the platform vibration in a high dynamic environment with the position and attitude changes measured by inertia and constructing a real 3D point cloud can enhance the dimension of detection information and have a wide application prospect. Currently, there are no related mature methods and applications for high-precision line structured light 3D point cloud construction. In our study, an inertial trajectory measurement method with the fusion of odometry and IMU is proposed, which has a high short-term accuracy retention ability and improves the accuracy of the 3D point cloud. The point cloud data is applied to the field of track geometric parameter measurement. Based on the point cloud data, the vertical and horizontal 10 m chord measurements, and the level are calculated to realize the application value of the data.MethodsTo address the above issues, we propose a real-time construction method of track 3D point clouds based on multi-sensor fusion. The multi-sensor fusion point cloud calculation method is shown in Fig. 3. Firstly, we improve the short-term holding accuracy of inertial navigation by optimizing the initial alignment algorithm of the inertial measurement system and the inertial attitude solving algorithm within the framework of extended Kalman filtering. Then, we design the coordinate conversion method of point cloud construction, which converts the point cloud data measured by the line-structured optical sensors to the geographic coordinate system. Finally, the geometric parameters of the track are projected according to the 3D point cloud to achieve the application of the point cloud data. The train cannot start and stop randomly in the actual detection task, so it is necessary to achieve the dynamic and rapid alignment of the attitude. We construct and solve the Wahba equation and optimize the alignment algorithm based on the inertial system. In terms of inertial trajectory solution, the measurement equation is derived based on the specific force equation, which directly observes the misalignment angle and the zero deviation of the plus meter. The measurement equation is derived based on the trajectory recursive equation, which directly observes the misalignment angle, the position error, and the scale coefficient of the odometer. Based on the extended Kalman filter framework, the fusion filtering of the odometer and IMU data is realized. In the point cloud coordinate conversion algorithm, the trajectory and attitude are interpolated, and the coordinates are converted according to the joint calibration parameters. In terms of 3D point cloud data application, a typical application scheme of the track point cloud is introduced, which is the non-contact rapid measurement of track geometric parameters.Results and DiscussionsThe feasibility and accuracy advantages of the method are verified through the special train experiments of the Beijing Circular Railway Test. 1) The heading angle error varies greatly in the initial 500 s, and then gradually stabilizes within 1°. The horizontal attitude angle error is rapidly reduced to below 0.1° within 20 s. The alignment angle error is close to the theoretical one, and the alignment accuracy is close to the theoretical value and can be applied to the actual working conditions of train detection. 2) As shown in Fig. 7, based on the method proposed in our study, the measurement error of the roll angle is within -0.025°?0.010°, and the measurement error of pitch angle is within ±0.01°, which shows high accuracy. As shown in Fig. 8, after accurate calibration, the mounting declination in the pitch direction is -0.05°. After considering the installation deviation angle, the accuracy of elevation measurement is obviously improved, and the elevation drift is only 3.92 m when the train travels for 50 km. The elevation error increases the fastest in the section from 439860 to 439944 s in the figure, the cumulative mileage is about 1.6 km, and the elevation error has increased by 1.3 m, which shows that the elevation error is within 0.81‰ of the cumulative mileage. As shown in Fig. 9, the train travels about 91.7 km cumulatively, the maximum deviation of plane is 290.84 m, and the plane deviation is about 3.17‰ of the mileage. Based on the comprehensive above data, the accuracy maintenance ability of the inertial measurement method proposed in our study can be illustrated. 3) The measurement repeatability of the vertical 10 m chord measurements is used as an evaluation index, and the repeatability of the method in our study is 0.71 mm. The measured and reference values for vertical and horizontal 10 m chord and level are compared in Fig. 12, and the trend of the waveforms of the two detections is more consistent. The peak values of the measured values and reference values at 11 preset working conditions are shown in Table 1. The maximum error value of the horizontal 10 m chord and level is 0.41 mm, and the maximum error value of the vertical 10 m chord is 1.07 mm. The rail direction and horizontal value better represent the measurement accuracy of the system, and the measurement deviation in the actual unevenness parameter accounts for a maximum of 4.8%, which can satisfy the accuracy requirement of practical application.ConclusionsThe method proposed in our study does not require static initial alignment and can dynamically complete the attitude initialization and detection tasks with the start and stop of the train, which solves the influence of train scheduling constraints on the detection accuracy. The multi-sensor fusion significantly improves the short-time accuracy retention ability and ensures the stability of local accuracy by reducing the correction frequency. This method has a wide application prospect in the field of railway condition monitoring, which can provide strong technical support for track disease identification and real-time maintenance and provide a guarantee for improving the safety and efficiency of railway operation.
Feb. 20, 2025Vol. 45 Issue 4 0412004 (2025)
Guojun Li, Fengfeng Shi, Jinfeng Xu, Run Zhao, Guitao Fu, Yuting Yang, Zhaonan Li, Wenlong Sun, Mengfei Cheng, and Yongxin Lin
ObjectiveIn recent years, remarkable breakthroughs have been achieved in the research and application of optical clocks. Various optical clocks have been developed by countries around the world. The systematic frequency uncertainty and stability of optical clocks are 2?3 orders lower than those of microwave fountain clocks, reaching levels of 10-18?10-19. The Bureau International des Poids et Measurements (BIPM) has adopted optical clocks as secondary frequency standards and is committed to redefining the second with optical clocks. Employing an optical clock to steer the local time scale is an effective method to improve autonomous timekeeping performance.MethodsFirst, we introduce the main components of the time-keeping system. 1) The optical clock system, which is composed of a 40Ca+ optical clock, an optical frequency comb, and a photogenic microwave system. It is responsible for probing, locking, and outputting an ultra-stable optical signal. The optical comb locks the signal and outputs the laser repetition frequency, the carrier-envelope phase offset frequency, and the beat frequency. The photogenic microwave system generates a 10 MHz signal through digital frequency synthesis based on the output frequency of the optical frequency comb. 2) The frequency steering platform consists of a hydrogen maser clock, two microphase steppers, and a phase comparator. Two local time scales, TS(H) and TS(Ca), are generated by steering the output frequency of the hydrogen maser clock with reference to UTC or the optical clock respectively. 3) The time system TS(BSNC) is responsible for establishing a time-transfer link to UTC to evaluate the performance of the local time scale. Second, the noise model of the hydrogen maser clock is developed based on the frequency deviation between the optical clock and the hydrogen maser clock. The noise components include white frequency noise, flicker frequency noise, random walk frequency noise, and frequency drift. Subsequently, we design two steering methods based on UTC and the optical clock to generate a local time scale. Finally, we analyze the timekeeping performance of TS(Ca) and TS(H) through the time-transfer link of TS (BSNC).Results and DiscussionsThe run rate of an optical clock refers to the ratio of the duration of the clock’s normal time to the total duration of a specified period. From April 24 to September 30 in 2024, the run rate of the optical clock reaches 93.1% over 160 days. We evaluate the 11 common error sources associated with the optical clock, resulting in a systematic frequency uncertainty of 2.15×10⁻¹⁷. The self-comparison frequency stability of the optical clock is assessed using the self-comparison frequency deviation of the three peak center frequencies. As shown in Fig. 5, the self-comparison frequency stability of the optical clock reaches a value of 8.28×10⁻¹⁵/τ@(1-2)×106 s. Over the 160 days, the final timekeeping deviations of TS(Ca), TS(H), and UTC(PTB) are 0.6 ns, -4.6 ns, and -1.0 ns respectively, with peak-to-peak time deviations of 1.5 ns, 4.9 ns, and 1.6 ns respectively. As shown in Fig. 14, when the averaging time ranges from 5 to 10 days, the frequency stabilities of UTC(PTB) and TS(Ca) are mainly influenced by time-transfer link white phase noise. When the averaging time exceeds 15 days, the influence of time-transfer link noise gradually decreases, with TS(Ca) exhibiting the best frequency stability, followed by UTC(PTB), and TS(H) showing the least stability. At an averaging time of 30 days, the frequency stabilities are 1.15×10⁻¹⁶, 1.83×10⁻¹⁶, and 4.42×10⁻¹⁶ respectively.ConclusionsIn this study, we introduce a timekeeping system based on a 40Ca+ optical clock at Beijing Satellite Navigation Center. The noise model of the hydrogen clock is accurately constructed using the frequency differences between the hydrogen clock and the optical clock. Two local time scales, TS(H) and TS(Ca), are generated and continuously operated for 160 days by steering the hydrogen clock with reference to UTC or the optical clock respectively. During the running period, the run rates of the optical clock and the whole optical system reach 93.1% and 88.4% respectively. The systematic frequency uncertainty of the optical clock is approximately 2.15×10⁻¹⁷, and its frequency stability achieves 8.28×10⁻¹⁵/τ@(1-2)×106 s. The final and peak-to-peak time differences between TS(Ca) and UTC are better than 0.6 ns and 1.5 ns respectively. The frequency stability of TS(Ca) relative to UTC is 1.15×10⁻¹⁶@30 d.
Feb. 19, 2025Vol. 45 Issue 4 0412005 (2025)
Dongdong Han, Xiyang Wei, Ying Li, Tiantian Li, Kaili Ren, Yipeng Zheng, Lipeng Zhu, and Zhanqiang Hui
ObjectiveWith the rapid development of ultrashort pulsed laser technology, the applications are expanding in scientific and technological fields. Passively mode-locked lasers based on nonlinear polarization rotation (NPR) technology are favored due to their simple structure, high damage threshold, and ability to generate ultrashort pulses. However, passively mode-locked fiber lasers based on NPR technology are highly sensitive to polarization states, which limits their application. The development of artificial intelligence technology provides a new way to solve this problem. Usually, researchers use pulse signals to judge the mode-locked state of the laser, but this may ignore spectral information, which is critical to the laser. In this study, a convolutional neural network (CNN) image classification model and an adaptive genetic algorithm (AGA) are combined to achieve automatic mode-locking of fiber lasers. The mode-locking state of the laser is judged by the CNN model by learning the various spectral images of different laser states. Then the electric polarization controller (EPC) is adjusted automatically by the AGA to optimize the polarization state until mode-locking is achieved. This approach provides a new way to realize automatic mode locking.MethodsBy combining CNN and AGA, we propose a new method to achieve automatic mode-locking based on laser spectral image features. In the experiment, spectral image data of the laser is collected automatically by a computer-controlled commercial spectrometer, which is then used to create a data set of a binary classification CNN model. Spectral image features of the laser are extracted and analyzed to classify the mode-locking state through the training CNN model. The classification results are used as the fitness value in AGA. The adaptive mechanism of AGA can significantly accelerate the convergence process, thereby enhancing the efficiency of achieving mode-locking. AGA evaluates the fitness of individuals in each generation and selects the fittest individual for retention. Highly adaptive individuals are selected using the ‘roulette-wheel’ method, after which they are subject to adaptive crossover and mutation to generate new individuals. These new individuals, together with the selected fittest individual, form the next generation of the population. The new generation needs to be re-evaluated for fitness. The process is iterated until the mode-locked state is established.Results and DiscussionsA passively mode-locked fiber laser based on the NPR technique is built, which contains a laser diode pump, a wavelength-division multiplexer, an erbium-doped fiber, an EPC, a polarization sensitive isolator, a manual polarization controller, and an optical coupler (Fig. 1). The spectral images output from the laser are collected by a commercial spectrometer. A binary CNN classification model is built based on these data [Fig. 3(a)]. The accuracy of the CNN model is 98.0%. The typical spectral images of mode-locking and non-mode-locking output from the laser are shown (Fig. 4). The fitness values of spectral images of mode-locking states are close to one, while the values are close to zero for the non-mode-locking state. The mode-locking state is achieved when the pump power is set to 300 mW. The typical optical spectrum, oscilloscope trace, and autocorrelation trace are shown (Fig. 5). The output of the laser is a typical stretched pulse with the central wavelength, pulse duration, and round trip time of 1560 nm, 7.329 ps, and 113.6 ns. To verify the effectiveness of the proposed method, 40 independent tests are conducted with the pump power and manual polarization controller fixed (Fig. 6). The average number of generations required to adjust from random states of the laser to mode locking is 5.4. To verify the ability of the laser to recover after loss of locking, 10 tests are made by randomly changing the polarization of the MPC three times, respectively (Fig. 7).ConclusionsWe propose an automatic mode-locking method based on the CNN image classification model and AGA. The method enables the passive mode-locked fiber laser to automatically judge, establish and recover the mode-locked state of the laser. By analyzing the spectral image data output from the laser, we can judge and classify mode-locked states and non-mode-locked states by the CNN model with high accuracy. Mode-locked states can be reliably achieved from the random state of the laser, using the AGA to adjust the polarization of EPC. In the experiment, 40 tests are conducted. The average number of generations required to adjust from random states of the laser to mode locking is 5.4. Moreover, the applicability of the method is also verified by randomly changing the manual polarization controller. This work provides a new scheme to realize the automatic mode-locking technique.
Feb. 20, 2025Vol. 45 Issue 4 0414001 (2025)
Jiayi Zhang, Bo Ren, Can Li, Hongxiang Chang, Zhenqiang Tang, Tao Wang, Kun Guo, Gehui Xie, Jinyong Leng, Lei Si, Wenxue Li, and Pu Zhou
ObjectiveHigh-power ultrafast lasers are critical in frontier science, industrial manufacturing, and medical applications. Coherent beam combination (CBC) is a leading approach to overcoming the limitations of single-channel amplifiers, such as nonlinear and thermal effects, enabling further power and energy scaling. Among CBC methods, coherent polarization beam combination offers flexibility in handling varying input beam power ratios by utilizing polarization beam splitters. Unlike the conventional H?nsch?Couillaud (HC) detector-based phase control approach, the stochastic parallel gradient descent (SPGD) algorithm simplifies the system design by requiring only a single detector, providing enhanced scalability and stability.MethodsThe seed signal, centered at a wavelength of 1040 nm, is temporally stretched using a chirped fiber Bragg grating (CFBG) and reduces the repetition rate of 2 MHz with an acousto-optic modulator. After power amplification by a single-mode fiber pre-amplifier, the signal is split into 16 channels. Each channel undergoes two-stage amplification using polarization-maintaining fiber amplifiers. Precise optical path compensation is achieved by introducing a spatial delay line before the main amplifier of each channel. The 16 polarized beams are combined in a binary tree configuration using polarization beam splitters and half-wave plates, sequentially merging s- and p-polarized beams into a single beam. The combined beam is subsequently de-chirped using a folded Treacy grating compressor. A portion of the signal is detected by a photodetector, and feedback is provided to fiber stretchers for phase synchronization across all channels using the SPGD algorithm (Fig. 1).Results and DiscussionsThe combined system achieves an average output power of 15 W, with a high combination efficiency of 94%. In open-loop mode, the combined beam intensity fluctuates with power changes [Figs. 2(b)?(d)], while in closed-loop mode, it stabilizes into a Gaussian profile [Fig. 2(a)]. The phase control system demonstrates long-term stability, as evidenced by the normalized temporal intensity profile in close-loop operation [Fig. 2(e)], with the calculated phase residual error being λ/21. The combined beam has a central wavelength of 1036 nm with a 3 dB bandwidth of 8.9 nm [Fig. 3 (a)]. After compression, the pulse duration is reduced to 633 fs [Fig. 3(b)].ConclusionsIn this paper, we achieve an efficient coherent polarization beam combining of 16-channel femtosecond fiber lasers. The results confirm the feasibility of a multi-channel filled-aperture coherent polarization beam combination for ultrafast lasers based on the SPGD algorithm. It is anticipated that by further optimizing the pointing error of each channel, higher power output and improved efficiency can be realized.
Feb. 19, 2025Vol. 45 Issue 4 0436001 (2025)
Yuqing Ling, Gang Li, Yu Long, Yi Zhou, and Kangwen Yang
ObjectiveUltrashort lasers at wavelengths of approximately 980 nm not only can serve as pump sources for ytterbium- or erbium-doped lasers and amplifiers but also can generate blue light at 490 nm through frequency doubling. Blue light has broad applications in biological imaging, medical diagnostics, and underwater communications. Whereas extensive research and discussions have been conducted domestically and internationally regarding the theory, experiments, and technology of 980-nm fiber lasers, studies focusing on their startup dynamics are few. Therefore, our investigation on the startup dynamics of 980-nm narrow-spectral-band fiber lasers will contribute significantly to the design and optimization of 980-nm fiber lasers.MethodsA narrow-spectral-band fiber laser with a linear cavity structure was mode locked using a semiconductor saturable absorber mirror (SESAM). By adjusting the pump power, we achieved single-, double-, and triple-pulse mode-locking states. A high-speed oscilloscope was used to measure the temporal evolution of the self-starting pulse, and a detailed analysis was conducted.Results and DiscussionsA narrow-spectral-band fiber mode-locked laser with a center wavelength of 977 nm and a bandwidth of 0.08 nm [Fig. 2(a)] was successfully constructed, with a repetition frequency of 30.62 MHz [Fig. 2(b)]. By adjusting the pump power, we achieved single-, double-, and triple-pulse mode-locking states. The multipulse state of this narrow-spectral-band laser exhibits a progressive startup process that differs from the simultaneous generation and synchronous evolution of multiple pulses reported for broad-spectral-band lasers. During the double-pulse startup of the narrow-spectral-band laser, the leading pulse first undergoes beating and transient single-pulse stages [Fig. 4(b)]. When the leading pulse enters the transient-bound-state stage, a new pulse is generated and gradually strengthens until its intensity matches that of the leading pulse, thus ultimately forming a stable double-pulse mode-locking state [Figs. 4(c) and (d)]. In the triple-pulse startup, the leading pulse similarly undergoes beating and transient single-pulse stages, with a new pulse generated during the beating process. The two pulses gradually reach equal intensities and enter the transient-bound-state stage, during which a third pulse is progressively formed and strengthened. When all three pulses reach the same intensity level, stable triple-pulse mode locking is established [Fig. 5(d)]. This is likely due to the delayed pulse splitting caused by the weakening of nonlinear effects arising from the limited spectral width. Broad-spectral-band pulses have a narrow pulse width in the Fourier transform limit and a high peak power. After the main pulse is formed upon initiation, under nonsteady-state conditions, they are disturbed and rapidly segmented into subpulses, thus exhibiting a synchronized formation process during multipulse mode locking. By contrast, narrow-spectral-band pulses have a wider pulse width in the Fourier transform limit and a lower peak power. Upon initiation, the main pulse is formed first, and as nonlinear effects accumulate, the main pulse transfers energy, thus resulting in the formation of new pulses and a progressive self-starting process.ConclusionsIn this study, a fiber mode-locked laser with a central wavelength of 977 nm and a width of 0.08 nm was realized using an SESAM, which achieved a maximum output power of 7.51 mW. Adjusting the pump power enabled single-, double-, and triple-pulse mode locking to be realized. The temporal evolution of the self-starting pulse was measured using a high-speed oscilloscope. Unlike a previously reported startup process for broad-spectral-band lasers, a progressive multipulse startup process, instead of a synchronous one, was observed in this study. This is likely due to the delayed pulse splitting caused by the weakening of nonlinear effects arising from the limited spectral width. Our study facilitates the design and optimization of optical fiber lasers in the 980 nm band.
Feb. 21, 2025Vol. 45 Issue 4 0436002 (2025)
Junwei Zhu, Yuanlong Deng, Xuan Zhou, Shaolong Chen, Xiaopin Zhong, and Xingzheng Wang
ObjectiveThe primary aim of this study is to address the challenges of imaging difficulties and low contrast in detecting extremely fine transparent appearance defects in polarizing films. Polarizing films are common optical elements widely used in applications such as liquid crystal display panels, which include two layers of polarizers with orthogonal polarization directions. A polarizing film typically consists of six micrometer-thick transparent polymer films and aesthetic defects can occur in any of these layers. Defects such as bumps, foreign objects, bubbles, and scratches can directly reduce the quality grade of display panels, even leading to the scrapping of the entire panel. Therefore, research on detection technologies for aesthetic defects in polarizers holds significant practical importance. While most current studies focus on algorithm improvements, less attention has been given to imaging methods. In this paper, we propose a new defect detection method based on polarimetry basis parameters (PBPs) imaging. The proposed method enhances the accuracy of defect detection and classification by acquiring the Mueller matrix of defective samples, performing matrix decomposition and transformation to derive a series of PBPs with clear physical meanings, and utilizing the PBPs image with the best defect imaging contrast. More importantly, the PBPs of defects can provide rich and comprehensive information, which is expected to help polarizer manufacturers analyze the causes of defects and adjust production line processes promptly.MethodsThe Mueller matrix of the sample is captured using the fundamental measurement method for Mueller matrices. A set of PBPs, which describe the polarization characteristics of the sample, is derived through Lu-Chipman polar decomposition and several matrix transformations. After analyzing the distribution curves of the defect PBP values, comparing the PBP values between defective and non-defective areas, and considering the computational speed, we select the linear diattenuation characteristic as the outcome of the polarimetry basis parameter imaging (PBPI) method. This characteristic is utilized to differentiate common aesthetic defects from non-defective regions. We then compare the PBPI method with the traditional polarizer-sample-analyzer (PSA) imaging method, demonstrating that the PBPI method can significantly enhance the imaging contrast of minor defects. To address the scarcity of defect samples, we employ a stable diffusion model with the low-rank adaptation (LoRA) method for parameter-efficient fine-tuning to augment the data. Finally, a lightweight network, MobileNetV3~~small, is used for the detection of polarizing films. The model’s performance is evaluated using precision, recall, and F1-score metrics.Results and DiscussionsThe experimental results indicate that the PBPs of defects generally conform to a normal distribution (Fig. 2), allowing the use of average values from multiple samples of the same category to characterize this category. Among the 11 PBPs that are independent of rotation angle, the diattenuation and linear diattenuation characteristics show the greatest distinction between defective and non-defective areas (Fig. 4) and perform well in terms of NIQE and BRISQUE metrics (Fig. 5). However, the calculation formula for linear diattenuation involves one less parameter compared to the diattenuation characteristic (Equations 3 and 4), making it more suitable for defect detection in polarizers. By combining four special incident lights, the calculation formula for linear diattenuation can be further derived (Equation 8). Using this method to obtain the linear diattenuation characteristics of the sample reduces the average measurement time from 134.25 to 32.22 s, achieving a more than fourfold increase in speed, making it significantly more efficient than the original method. In addition, compared to the traditional PSA imaging method, the PBPI method significantly enhances contrast, especially for transparent defects such as bubbles and indentations, where the contrast improves by 2?7 times (Table 2). In the detection results using lightweight networks, the PBPI method’s detection rates for scratches, bubbles, indentations, and non-defective samples are all higher than those of the PSA method (Table 3). Furthermore, in terms of evaluation metrics such as precision, recall, and F1-score, the PBPI method outperforms the PSA method (Table 4), demonstrating its effectiveness.ConclusionsIn this paper, we introduce a novel method, PBPI, for detecting aesthetic defects in polarizers using PBPs. The method capitalizes on the linear diattenuation characteristic of defects to enhance their visibility and facilitate detection, benefiting quality control of polarizing films. Compared to the PSA method, PBPI method significantly improves the ability to distinguish between defective and non-defective areas. We have refined the calculation formula for linear diattenuation, reducing computational load and increasing measurement speed by four times. To address the challenge of limited defect samples, we employ a stable diffusion model and LoRA fine-tuning method for data augmentation, effectively expanding the dataset and enabling robust training even when defect samples are scarce. Finally, we utilize a lightweight network, MobileNetV3~~small, for detection, achieving an average detection rate of 99.3%. In summary, the PBPI method is an effective imaging technique, particularly for detecting subtle defects in polarizing films. Future work will focus on further optimizing the method for real-time applications and exploring its potential in other areas of industrial inspection.
Feb. 20, 2025Vol. 45 Issue 4 0415001 (2025)
Liang Mao, Haifeng Weng, and Xiaoyan Cai
ObjectiveRecognized for its high energy density and environmentally friendly characteristics, hydrogen energy is considered one of the most promising alternative energy sources to fossil fuels. Photocatalytic water splitting has emerged as a key technology for hydrogen production, especially under the utilization of semiconductor photocatalysts. Despite significant advancements in the development of various photocatalysts, the rapid recombination of photo-generated electron-hole pairs remains a primary challenge, limiting their hydrogen production efficiency. In this context, developing low-cost, highly efficient photocatalysts that can overcome this challenge is critical. Noble metals such as platinum (Pt) are often employed to enhance photocatalytic hydrogen evolution reaction (HER) performance, but their high cost and limited availability restrict large-scale applications. Consequently, the search for non-noble metal alternatives that can provide comparable or superior photocatalytic activity has become a major research field. Our study focuses on the synthesis of a MoS2/La2Ti2O7 (MoS2/LTO) composite photocatalyst as a low-cost and efficient alternative to photocatalytic water splitting. We aim to develop a composite material that improves charge separation and electron transfer efficiency, thereby addressing the limitations of current photocatalysts and contributing to the development of sustainable hydrogen production technologies.MethodsThe MoS2/LTO composite photocatalyst is synthesized via a two-step process. As a perovskite-type material with a three-dimensional step structure, La2Ti2O7 (LTO) is chosen as the base material due to its high stability and suitable conduction band potential for hydrogen evolution. LTO nanosteps are prepared by adopting a molten salt method, which leads to LTO particles with exposed (012) and (010) crystalline planes. These step structures are known to enhance charge separation, which is essential for photocatalytic efficiency. Meanwhile, MoS2 nanosheets are exfoliated from bulk MoS2 through lithium intercalation, thereby bringing about the formation of monolayer or few-layer MoS2. These MoS2 nanosheets containing both the 1T and 2H phases are then assembled onto the surface of the LTO nanosteps to form the Mix-MoS2/LTO composite. We anneal the Mix-MoS2/LTO at 150 ℃ to convert the less stable 1T phase into the more thermodynamically stable 2H phase and thus improve the stability and efficiency of the MoS2 component. This phase transformation enhances the electronic properties of MoS2 and improves the interaction between MoS2 and LTO, promoting efficient charge transfer. The photocatalytic performance of the MoS2/LTO composite is evaluated under simulated solar light by employing lactic acid as a sacrificial agent. The HER rate is measured, and various characterization techniques including X-ray photoelectron spectroscopy (XPS), ultraviolet-visible diffuse reflectance spectroscopy (UV-Vis DRS), and electrochemical impedance spectroscopy (EIS) are employed to investigate the material’s electronic properties and charge transfer mechanisms. Density functional theory (DFT) calculations are also performed to better understand the charge migration processes at the MoS2/LTO interface.Results and DiscussionsXPS analysis reveals that the MoS2 in the MoS2/LTO composite is predominantly in the 2H phase after annealing, thus confirming the phase transformation from the 1T to the 2H structure. This phase transformation is critical for improving the stability and catalytic activity of MoS2. The interaction between MoS2 and LTO is significantly improved after annealing, as indicated by the shifts in binding energy observed in the Mo 3d and S 2p XPS spectra (Fig. 2). The UV-Vis DRS and Mott?Schottky tests further confirm the formation of a Type-I heterojunction between MoS2 and LTO, which facilitates the transfer of photo-generated electrons from the conduction band of LTO to MoS2 (Fig. 3). This electron transfer is essential for improving the separation of electron-hole pairs and enhancing the overall photocatalytic efficiency. The MoS2/LTO composite exhibits significantly enhanced photocatalytic hydrogen production compared to pure LTO and Pt/LTO in identical experimental conditions. The hydrogen production rate of the MoS2/LTO composite is found to be 64 times higher than that of pure LTO and 1.9 times higher than that of Pt/LTO (Fig. 4). This significant photocatalytic performance improvement is primarily attributed to the combination of the excellent charge separation ability of LTO and the abundant edge active sites provided by MoS2. The optimal MoS2 mass fraction is determined to be 6%, which leads to the highest hydrogen production rate of 4.36 mmol·h-1·g-1. At this loading, the MoS2 nanosheets effectively cover the surface of LTO nanosteps, maximizing the active sites for the HER process. Further increases in MoS2 loading result in decreased photocatalytic performance, which is possibly due to the over-accumulation of MoS2 and can block light absorption and hinder charge transfer. In terms of stability, the MoS2/LTO composite exhibits excellent long-term stability during photocatalytic hydrogen evolution. After 12 h of continuous illumination, there is no significant decrease in hydrogen production, which demonstrates that the composite is highly stable and suitable for long-term utilization in photocatalytic applications. The photocurrent response tests show that the MoS2/LTO composite exhibits higher photocurrent density than pure LTO, indicating that the composite facilitates more efficient charge separation and transfer during the photocatalytic process. Electrochemical impedance spectroscopy (EIS) is performed to investigate the charge transfer resistance of the MoS2/LTO composite. The results indicate that the composite has lower charge transfer resistance than pure LTO, further confirming that the MoS2/LTO heterojunction facilitates charge separation and reduces charge recombination. DFT calculations provide additional insights into the charge migration process. The results demonstrate that photo-generated electrons from LTO can easily migrate to the conduction band of MoS2 via the built-in electric field at the MoS2/LTO interface, where they are utilized in the HER at the edge active sites of MoS2 (Fig. 5). This mechanism significantly enhances the photocatalytic hydrogen production performance of the MoS2/LTO composite.ConclusionsThe developed MoS2/LTO composite photocatalyst demonstrates excellent photocatalytic hydrogen production performance due to its unique core-shell structure and enhanced charge separation efficiency. The MoS2 nanosheets with abundant edge active sites and the LTO nanosteps with effective charge separation properties synergistically enhance the overall photocatalytic activity. The conversion of MoS2 from the 1T to the 2H phase via annealing plays a crucial role in improving the stability and efficiency of the composite. Our study provides a new approach to designing non-noble metal photocatalysts for efficient hydrogen production via water splitting. By optimizing the structure of the photocatalysts and improving interfacial charge transfer, further improvements in photocatalytic performance can be yielded to facilitate the commercialization of hydrogen energy as a clean and sustainable energy source.
Feb. 21, 2025Vol. 45 Issue 4 0416001 (2025)
Shasha Chang, Rui Qin, Qing Li, Tao Ma, Menglin Li, Shuai Wen, Yuxuan Du, Lier Deng, and Huan Liu
ObjectiveLead sulfide quantum dots (QDs) have become one of the most promising new materials for photodetector fabrication due to their low fabrication cost, solution processability, and tunable spectral range. Small-sized PbS QDs have yielded excellent performance in optoelectronic devices by the mixed lead halide ligand exchange method. However, as the diameter of the PbS colloidal QDs (CQDs) increases, the proportion of the originally employed small-sized mixed lead halide ligands cannot fully passivate the (100) crystal plane of the large-sized QDs, which introduces deep defects and degrades the device performance. We propose a ligand exchange method with higher PbBr2 concentration to fully passivate large-sized PbS CQDs with absorption peaks at 1550 nm. As the PbBr2 concentration (0.01?0.06 mol/L) increases, the defects are effectively passivated, with the decreased dark current. At PbBr2 concentration of 0.04 mol/L, the prepared device shows the best performance, with the responsivity and specific detectivity at 1550 nm of 324.259 mA/W and 2.03×10¹¹ Jones respectively, the external quantum efficiency of 25.77%, increase time of 240 μs, and decrease time of 180 μs for the device. This ligand exchange method provides an opportunity to obtain high-performance solutions for infrared photodetectors.MethodsWe focus on the synthesis of PbS QDs, liquid-phase ligand exchange, and photodetector preparation. In the synthesis, lead sulfide QDs are synthesized by the thermal injection method, in which 0.45 g of PbO, 16.2 g of oleic acid, and 10 g of 1-octadecene are added to a triplex flask to obtain the lead source precursor. Then the triplex is evacuated at room temperature for 60 min, and then the flask is heated to 110 ℃ with an overnight stir. Next, 210 μL of bis (trimethylsilyl) sulfide and 10 mL of 1-octadecene solution are rapidly injected into the three-necked flask at 120 ℃, and then acetone is injected into the three-necked flask after lowering temperature to room temperature to purify the QDs. Then, the QD solution is washed three times and then filtered, with hexane added next to configure the n-hexane solution of PbS QDs. In the liquid-phase ligand exchange process, we dissolve 0.23 g of lead iodide, 0.01835 g (0.01 mol/L), 0.0367 g (0.02 mol/L), 0.05505 g (0.03 mol/L), 0.0734 g (0.04 mol/L), 0.09175 g (0.05 mol/L), and 0.1101 g (0.06 mol/L) of lead bromide and 0.009 g of sodium acetate (NaAc) in 5 mL of N,N-dimethylformamide (DMF), and add 35 mg of PbS QDs to the above solution. Then we add 10 mL of n-hexane, and after the ligand exchange, n-hexane is adopted to conduct washing for three times. Meanwhile, toluene is added to make the QDs precipitate by centrifugation and then fabricated into a 300 mg/mL QD ink standby. During the photodetector preparation, the device structure is ITO/ZnO/PbS QDs/PbS-EDT/Au, ITO is selected as the bottom electrode, and a ZnO film with a 30 nm thickness is prepared on ITO, after which liquid-phase ligand-exchanged QDs with a 300 nm thickness are spin-coated. Then a PbS-EDT layer with a thickness of about 70 nm is adopted for the preparation, and finally, a layer with an 80 nm thickness is deposited by thermal evaporation, with a gold electrode of an 80 nm thickness deposited by thermal evaporation.Results and DiscussionsThe roughness statistics of the QD films after liquid-phase ligand exchange are shown in Fig. 3(g), which reveals that the roughness of the films shows a tendency to decrease and then increase with the rising concentration of PbBr2, with the lowest roughness of the 0.04 mol/L PbBr2 film being 0.851 nm. The results of the tests on XPS are shown in Fig. 4, and the detected iodide ions and bromide ions indicate that the short-chain ligand successfully replaces the long-chain ligand with the successful ligand exchange. Meanwhile, the higher Br- concentration of the lower carbon content of the QD film implies that the replacement of the original long-chain ligand is more appropriate, with more successful ligand exchange. We further fabricate photodiode devices and investigate the effect of light absorbing layers passivated by different concentrations of PbBr2 on the device performance. By counting the dark current at -0.5 V, as shown in Fig. 5(c), it can be seen that the dark current of the devices can be effectively reduced by modulating PbBr2, and the devices reach external quantum efficiency of 25.77% at a PbBr2 concentration of 0.04 mol/L. Specifically, the response degree R reaches 324.259 mA/W and the specific detectivity D* is 2.03×10¹¹ Jones, as shown in Figs. 5(e)?(g).ConclusionsThe incomplete passivation of the first exciton absorption peak in the liquid-phase ligand exchange of large-sized PbS QDs at 1550 nm is solved by increasing the PbBr2 concentration in the liquid-phase ligand exchange and adjusting the lead bromide concentration. Additionally, the device is prepared with a detectivity as high as 2.03×10¹¹ Jones, an external quantum efficiency as high as 25.77%, and the response degree of 324.259 mA/W. This shows excellent optoelectronic performance and provides a feasible solution for obtaining high-performance PbS QD photodetectors.
Feb. 21, 2025Vol. 45 Issue 4 0416002 (2025)
Yuxiang Lin, Xiaojun Han, Xiufeng Li, Jinxin Tan, Taofeng Wu, Chengbo Liu, and Zhiqiang Xu
ObjectivePhotoacoustic imaging is an emerging medical imaging technique, with photoacoustic microscopy (PAM) being based on the photoacoustic effect to observe optically absorbing structures. It achieves high lateral resolution through fine optical focusing and has shown significant potential in the study of the microstructure and function of biological tissues. However, PAM faces the challenge of slow imaging speeds when acquiring large-scale, high-resolution images. To address this, we develop a PAM system utilizing hybrid optical-mechanical scanning technology, enabling the automated acquisition of multiple image blocks at different positions to achieve large-scale image acquisition. Building on this, we further develop a stitching method specifically tailored for photoacoustic microvascular images, capable of overcoming challenges posed by vascular complexity and uneven signal detection. OR-PAM not only captures vascular signals but also various other signals, such as pigment signals, which often exhibit a mottled and complex structure with high similarity. This structural complexity increases the risk of mismatches during image stitching. Therefore, the development of a stable, efficient, and high-performance image stitching algorithm designed specifically for photoacoustic microscopy is crucial for achieving high-resolution, large-scale vascular imaging. Such an algorithm is a core technical advancement necessary to drive the development and application of photoacoustic microscopy technology.MethodsIn this paper, we develop a high-resolution, high-speed PAM system based on hybrid optical-mechanical scanning and propose a stitching method tailored for vascular images in photoacoustic microscopy. Using this system, we acquire several sub-image blocks of carbon fiber phantoms and in vivo samples. By applying our proposed stitching method, we process these sub-image blocks, demonstrating the feasibility of our approach even under conditions where the overlap rate is as low as 3% for the carbon fiber phantoms.Results and DiscussionsWe present imaging results of a carbon fiber phantom with a diameter of approximately 6 μm. A total of 54 sub-image blocks are acquired, and after stitching, the resulting image has a size of approximately 3.5 mm×2.3 mm, with an overlap rate of only 3% between adjacent sub-image blocks [Figs. 4(a) and (b)]. The total acquisition time, including data collection, transfer, and platform movement, is approximately 72 s. The stitching is precise, with no noticeable stripe artifacts. The brain imaging results involve the acquisition of 81 sub-image blocks [Fig. 5(a)]. The fused image has a size of approximately 3.2 mm×3.2 mm, with an overlap rate of 10% between adjacent blocks. The stitched image exhibits no noticeable stripe artifacts, with continuous vasculature and visible capillaries [Fig. 5(b)]. Finally, the original sub-image block, the sub-image block processed by median filtering and the NLM algorithm based on spatial denoising, and the final processed sub-image block are shown (Fig. 6). The signal-to-noise ratio (SNR) of the image improves from 9 dB to 29.3 dB, with a final SNR of 35.9 dB. The noise is greatly suppressed, significantly enhancing the visual quality of the image.ConclusionsIn summary, we present a fast PAM system based on hybrid optical-mechanical scanning and a stitching method suitable for photoacoustic images. The system’s imaging and image stitching capabilities are validated through phantom and in vivo experiments. This system is significant for improving imaging speed and enlarging the field of view. Notably, it employs a miniature transducer to receive ultrasound signals, offering the advantages of compactness, high sensitivity, and rapid response. The system can be extended to an array of transducers to further increase the field of view. In addition, the 2D galvanometer can be placed in air, avoiding the need for the scanning components to be submerged in water as required in existing high-speed PAM systems. This feature reduces the influence of water disturbances and offers improved stability. In terms of image processing, the spatial denoising NLM has shown great potential in PAM image denoising, effectively removing spatial noise. BaSiC, one of the most advanced shadow correction algorithms, performs exceptionally well on PAM images. The phase correlation-based stitching algorithm can avoid the issues of sparse feature points and mismatches typically encountered in feature-based stitching algorithms when the overlap rate is extremely low. Since the motorized stage moves the same distance along a set direction each time and the field of view is fixed, no additional image registration is required. In the field of PAM, we present a practical method to expand the field of view and increase imaging speed.
Feb. 21, 2025Vol. 45 Issue 4 0417001 (2025)
Run Lü, and Zhouping Su
ObjectiveLiDARs are crucial sensors widely applied in terrain exploration, species detection, autonomous driving, and numerous other fields. Its core technology mainly consists of three aspects: ranging, steering, and imaging. At present, the all-solid-state LiDAR without any mechanical moving parts is a hot research area with significant application value. However, the two main types of all-solid-state LiDAR, namely the optical switch-based LiDAR and the optical phased array (OPA) LiDAR, face the problem of limited scanning angles. Therefore, the design of a LiDAR beam steering system incorporating a new optical system holds broad application prospects. The large field-of-view scanning achieved with conventional optical systems still faces the problem that the beam is dispersed in one direction, and it is difficult to maintain collimation simultaneously in the horizontal and vertical directions. To solve this problem, we propose an optical switch-based LiDAR beam steering system that includes both a metalens and a cone lens. The results show that the system can achieve the designed horizontal field of view of 360° and a vertical field of view of 8° while maintaining a beam divergence angle of approximately 0.018° in both the horizontal and vertical directions.MethodsOur designed beam steering system of an optical switch-based LiDAR consists of three main components: the photonics integrated circuits, the metalens, and the cone lens. In the design of the photonic integrated circuits, we simulate and analyze a single grating coupler using the finite difference time domain (FDTD) method. The divergence angles of the emitted beam in the X and Y directions for a single coupler are 11.1° and 10.9°, respectively. For the metalens, we first conduct simulations of each cell and construct the overall model of the metalens through calculations. We then analyze it by comparing the desired target phase distribution with the phase distribution achieved by the constructed metalens. The cone lens has conical upper and lower surfaces, which is scaled to meet the requirement for total internal reflection on the s2 surface in our design. It serves as a macroscopic optical element that can be fabricated through single-point diamond machining or molding techniques, highlighting the high feasibility of our design. In this design, the key factor we consider is to expand the vertical field of view while maintaining the horizontal field of view of 360°. In some conventional systems, it is difficult to ensure collimation and narrow beam divergence in both horizontal and vertical directions, and some even use mechanical moving parts to achieve this. According to the characteristics of the optical switch-based LiDAR, we perform beam steering separately for each vertical field of view. Due to the different effects of the metalens, the beams are in total reflection at different positions on the inner surface of the cone lens and are collimated after emission. We well design the overall model in the article to solve this problem. On this basis, we analyze the optical system and obtain results such as the system design schematic and spot diagram, and view the irradiance distribution and luminous intensity distribution curves. We demonstrate the patterns of beam steering by switching between different sections of the grating couplers at four different positions.Results and DiscussionsWe design an optical switch-based LiDAR beam steering system that contains photonic integrated circuits, a metalens, and a cone lens. The photonic integrated circuits consist of an array of optical switches and grating couplers, which are arranged in the form of eight ring arrays, and beam steering is achieved by switching between the grating couplers at different positions. In the study, we design each module separately and combine them for overall analysis, thus confirming the results of our design and demonstrating the possibilities of real applications. By applying our designed system, the horizontal field of view can be expanded to 360° while maintaining an 8° field of view in the vertical direction. The resolution of the system is 0.7° in the horizontal direction and 8° in the vertical direction. The results show that the system has a narrow beam divergence angle of 0.018°×0.018°.ConclusionsWe propose and design a beam steering system for optical switch-based LiDAR. Its core advantage is the ability to achieve a 360° horizontal range and an 8° vertical field of view compared to conventional LiDAR optical scanning systems. The system demonstrates strong application potential by utilizing the smallest possible components and a compact structure to achieve high resolution and narrow beam divergence in both the horizontal and vertical directions. In the future, we will further focus on the design of the photonic chips, and expanding the array scale will contribute to widening the field of view in the vertical direction.
Feb. 10, 2025Vol. 45 Issue 4 0422001 (2025)
Changjun Gou, Jiachen Zhang, and Yinghao Ye
ObjectiveOptoelectronic integrated circuits (OEICs) have experienced rapid development in both integration scale and functional complexity, thanks to advances in silicon-on-insulator (SOI)-based photonic integrated circuits (PICs) and manufacturing processes. As a result, OEIC design increasingly depends on electro-photonic design automation (EPDA) tools, with link-level simulation and verification playing crucial roles. Currently, there are two primary methods for OEIC link-level simulations. 1) Co-simulation using PDA and EDA tools (e.g., Lumerical Interconnect and Cadence Virtuoso). This method requires the simultaneous use of multiple commercial software platforms and is prone to convergence issues, particularly in scenarios involving optoelectronic feedback loops. 2) Simulation using traditional EDA tools (e.g., SPICE and Verilog-A). This approach benefits from a unified model description language and allows users to simulate custom-developed models. However, it requires representing optical port signals, with electrical equivalents, which leads to complex models and interconnections due to the fundamental differences in the physical principles governing optical (signal flow graph theory) and electrical signals (Kirchhoff’s Voltage and Current Laws). To overcome these challenges, we explore the feasibility of conducting OEIC simulations on a single open platform and propose an effective link-level modeling and simulation method.MethodsTo address these challenges of requiring multiple platforms for optoelectronic co-simulation or representing optical signals with equivalent electrical signals in traditional electronic circuit simulation platforms, we propose a unified open-platform method for link-level modeling and simulation of OEICs. The approach begins by defining bidirectional transmission signals for optical port connections, which, when combined with existing signal representations for electrical ports, form a unified and generalized model framework based on differential-algebraic equations to describe the time-domain input-output characteristics of optoelectronic devices. The proposed optoelectronic co-simulation engine enables the direct interconnection of photonic, electronic, and optoelectronic device models through optical or electrical ports, generating a netlist and deriving system-level equations. These equations, rooted in the physical properties of optical and electrical ports (as opposed to traditional methods that use KVL and KCL in SPICE for equivalent optical ports), accurately describe the entire optoelectronic circuit. By solving these system-level equations, the method efficiently conducts transient simulations, providing precise optical and electrical signal values at each port and internal node of the circuit.Results and DiscussionsThe proposed optoelectronic link-level modeling and simulation method is applied to two examples and compared with Verilog-A in Cadence. For the all-pass microring resonator, the average relative error between the two methods is less than 1.435% (Fig. 6). For the optoelectronic transceiver, the average relative errors for optical and electrical signals are less than 0.0494% and 0.1949%, respectively (Figs. 11 and 12), demonstrating excellent agreement. These results confirm that the proposed method can simultaneously solve the complex electric field signal values (E) at optical nodes, as well as the node voltage (V) and branch current (I) at electrical nodes within a unified open platform. Compared to commercial simulation software, differences exist in transient simulation algorithms, numerical solving errors, and potential improvements in simulation efficiency. However, the proposed optoelectronic circuit simulation method exhibits significant advantages in terms of reduced modeling complexity, standardized model definitions, enhanced model expandability, improved simulation compatibility and integration across EICs, PICs, and OEICs, and its ability to support multi-physics simulations of optoelectronic systems (Table 1).ConclusionsIn this paper, we propose a link-level modeling and simulation method for OEICs using the MATLAB platform. The method first defines specifications for bidirectional transmission optical port signals using complex electric fields and constructs a unified and generalized model framework for photonic, electronic, and optoelectronic devices. Then, we develop an optoelectronic co-simulation engine, which generates system-level equations from the optoelectronic circuit netlist formed by connecting device models. Finally, by solving these system-level equations, transient simulations are efficiently conducted to determine the optical and electrical signals at each port and internal node of the circuit. Two simulation examples demonstrate the method’s accuracy in calculating the variations in optical fields of an all-pass microring resonator and the time-domain output characteristics of an optoelectronic transceiver. Compared to simulation results from the Verilog-A EDA platform, the average relative error in optical field intensity variations for the microring resonator is less than 1.435%, while the average relative errors in the optical signal and electrical signal for the optoelectronic transceiver are less than 0.0494% and 0.1949%, respectively. This paper confirms the feasibility of modeling and simulating OEICs on a single open platform and provides an open, standardized, and efficient approach for OEIC modeling and simulation.
Feb. 21, 2025Vol. 45 Issue 4 0425001 (2025)
Yixin Zhang, Huakun Wu, Qiong Wu, Wen Liu, and Jie Shao
ObjectiveNon-invasive testing is a key area of research in medicine, and in recent years, the detection of gases expelled from the body for disease diagnosis has gained considerable attention. Carbon dioxide (CO2) in the skin, a major product of metabolism, reflects the body’s metabolic rate and the integrity and barrier function of the skin’s keratin layer. It can also serve as a non-invasive method to quickly and conveniently assess the health status of the body.MethodsIn this paper, skin CO2 is used as the detection target, with quartz-enhanced photoacoustic spectroscopy (QEPAS) combined with first harmonic frequency locking. Initially, the R18 spectral line of CO2, located at 4991.26 cm-1, is selected by simulating the absorption spectral lines of CO2 and interfering gases in the detection environment. A QEPAS system for skin CO2 detection is then built based on a 2004 nm distributed feedback (DFB) laser, and the laser’s output frequency is locked at 4991.26 cm-1 using the first harmonic signal. After frequency locking, the detection speed of the QEPAS system increases to 2.5 Hz, with the system’s linearity reaching 0.998 and a detection limit of 2.04×10⁻⁶. The real-time detection of CO2 metabolism in different parts of human skin is realized using this system.Results and DiscussionsBy combining QEPAS with the first harmonic frequency locking, the first harmonic signal from the sample absorption cell is used as the input for the proportional-integral-derivative (PID) control system, locking the DFB laser’s output wavelength at 2004 nm to the CO2 absorption line at 4991.26 cm-1. This improves the system’s detection speed from 200 mHz to 2.5 Hz, enabling real-time monitoring of CO2 volume fraction changes. Analysis of the system’s linearity and Allan variance shows a linearity of 0.998 and a detection limit of 2.04×10⁻⁶. Compared to conventional QEPAS systems using non-frequency-locked wavelength scanning, the system’s detection sensitivity is unaffected while its detection speed is increased to 12.5 times that of traditional systems. Based on this system, real-time monitoring of skin CO2 is conducted on four different parts of the human body: the left palm, left arm, left armpit, and left cheek. It is found that the CO2 discharge rate from the left cheek is significantly higher than that of the other three parts. This demonstrates the feasibility of using the first harmonic frequency-locking technique to enhance the detection speed of QEPAS for trace gas detection.ConclusionsThe skin CO2 gas sensor proposed in this paper offers advantages such as low cost, compact size, and high detection sensitivity, enabling convenient and rapid non-invasive detection of CO2 released from human skin. This provides a simpler and more efficient alternative for the increasingly burdensome task of medical diagnostics. The sensor can be used for screening hypercapnia and hypocapnia, as well as for monitoring activity in transplanted skin. In this paper, the QEPAS technique is combined with the first harmonic frequency locking. The first harmonic signal from the absorption cell is used as the PID input signal to lock the output wavelength of the DFB laser at 2004 nm to the CO2 absorption line at 4991.26 cm-1, resulting in an improved system detection speed from 200 mHz to 2.5 Hz, and enabling real-time detection of CO2 volume fraction changes. The system linearity is analyzed through Allan variance, yielding a linearity of 0.998 and a detection limit of 2.04×10⁻⁶. Comparing the performance of this system with conventional QEPAS systems using non-frequency-locked wavelength scanning shows that although the detection speed is increased by 12.5 times, the detection sensitivity is still not affected. Using this system, real-time monitoring of skin CO2 levels is conducted on four different parts of the human body: the left palm, left upper arm, left armpit, and left cheek. Notably, the CO2 discharge rate from the left cheek is significantly higher than that of the other three parts, demonstrating the effectiveness of the first harmonic frequency-locking technique in improving the detection speed of the QEPAS trace gas detection system. The skin CO2 gas sensor combines high detection sensitivity with low cost and compact size, facilitating quick and non-invasive CO2 detection on the skin. This method offers an alternative for simplifying medical diagnostic tasks, with applications in hypercapnia and hypocapnia screening, as well as monitoring the activity of transplanted skin.
Feb. 19, 2025Vol. 45 Issue 4 0430001 (2025)
Xi Xiao, Chenwen Ye, Tao Wu, Ming Zhu, and Xingdao He
ObjectiveWater vapor (H2O) is the main greenhouse gas in the atmosphere, which causes a global greenhouse effect and has severely affected human life and health. Thus, accurate monitoring of water vapor concentration is crucial for both environmental monitoring and human health. The heterodyne phase-sensitive dispersion spectroscopy (HPSDS) technique is a dispersion spectroscopy detection technique. It is widely utilized in atmospheric monitoring, medical diagnostics, combustion diagnostics, and other research fields due to its advantages such as high linear dynamic range, zero baseline, effective common-mode noise suppression, and independence from the fluctuation of laser power. In our research, we directly modulate the injection current of a distributed feedback laser with a high modulation frequency to construct a near-infrared HPSDS sensing system for atmospheric H2O monitoring.MethodsIn our study, the gas sensing response of HPSDS is investigated by modulating the injection current of a semiconductor laser. Experiments are conducted using different frequencies to modulate the injection current of distributed feedback lasers. We study the influence on the near-infrared water vapor HPSDS system and select the optimal modulation frequency for the system.Results and DiscussionsAs shown in Fig. 3(a), there is a linear relationship between the peak-to-peak values of the signals and the gas concentration of the NIR HPSDS system at the three modulation frequencies of 1.0, 1.1, 1.2 GHz, and the linear R2 values of the three groups reach 0.99, indicating the good linear response of the HPSDS system. Fig. 4 shows the HPSDS system at three different frequencies for a 2 h measurement of H2O. In terms of long-term stability, the standard deviation is 165.39×10⁻⁶ at a modulation frequency of 1.0 GHz with a relative uncertainty of 0.9%, the standard deviation is 177.71×10⁻⁶ at a modulation frequency of 1.1 GHz with a relative uncertainty of 1.0%, and the standard deviation at a modulation frequency of 1.2 GHz is 126.85×10⁻⁶ with a relative uncertainty of 0.7%. Fig. 5 compares Allen’s variance of the three frequencies and the detection limit when the integration time is all at 156 s. The detection limit is 43.63×10⁻⁶ for 1.0 GHz, 30.87×10⁻⁶ for 1.1 GHz, and 12.77×10⁻⁶ for 1.2 GHz. By comparing the long-term stability and the detection limit, the experiments select 1.2 GHz as the optimal frequency of the system. As shown in Fig. 6, the WMS signal has a good linear response only in the concentration range of 0.74%?1.96% and is clearly nonlinear in 1.96%?2.59%, whereas the HPSDS signal has a good linear response in all concentration ranges of 0.74%?2.59%. As illustrated in Fig. 7, the detection limit can be up to 4.19×10⁻⁶ at an average time of 79 s for the WMS system and 8.82×10⁻⁶ at an average time of 61 s for the HPSDS system. As depicted in Fig. 8, the water vapor concentration obtained from the inversion of the HPSDS sensing system is compared with the water vapor concentration calculated from the temperature and humidity logger, which fits the water vapor profile of the temperature and humidity logger very well.ConclusionsIn our study, the performance of NIR HPSDS sensors at high modulation frequencies is demonstrated by using a low-frequency modulation of the injection current of distributed feedback lasers based on the modulation frequency up to the GHz level, and the performance of NIR HPSDS sensors used for water vapor concentration monitoring is presented, with the optimal modulation frequency of 1.2 GHz and the detection limit of 8.82×10⁻⁶. Experiments comparing the HPSDS system and the WMS system show that the dynamic range of the HPSDS system is better than that of the WMS system, and the precision of the lowest detection limit of the HPSDS system is slightly lower than that of the WMS system. It is verified that injecting a high modulation frequency compared to a low modulation frequency in the direct current modulation distributed feedback laser mode leads to a significant improvement in sensor performance, with an order of magnitude improvement in the minimum detection limit (MDL). Using the NIR HPSDS sensor to monitor water vapor in the atmosphere, by comparing the measurement data from the temperature and humidity loggers, it is obtained that the NIR HPSDS sensor can invert the concentration of water vapor in the atmosphere in real time, which provides a feasible basis for the HPSDS technology in an open-circuit sensor.
Feb. 20, 2025Vol. 45 Issue 4 0430002 (2025)
Peng Shan, Menghao Zhi, Teng Liang, Di He, Zhigang Li, and Zhonghai He
ObjectiveAttenuated total reflection Fourier transform infrared spectroscopy (ATR-FTIR) is widely used for analyzing complex mixed solutions, like glutamic acid fermentation broth and whole blood samples. However, baseline drift problems considerably impede its accuracy in quantitative analysis. These drifts may stem from molecular absorption overlaps, particle scattering, or instrumental errors, posing significant challenges in isolating true spectral signals. Existing baseline correction algorithms, such as asymmetric least squares (AsLS) and its enhanced version, fractional differential asymmetric least squares (FdAsLS), adopt uniform parameters throughout the entire spectrum. Although effective in simpler contexts, this “one-size-fits-all” approach fails to consider the diverse local characteristics of different spectral regions. Consequently, these methods often perform inadequately in dealing with complex spectra where baseline drift varies across bands. To surmount these limitations, we propose a piecewise fractional differential asymmetric least squares (PFdAsLS) algorithm, which incorporates a segmentation strategy. By partitioning the spectrum into segments based on local features and customizing correction parameters for each area, the algorithm improves the flexibility and accuracy of baseline correction. This segmentation strategy, in conjunction with fractional differentiation, empowers PFdAsLS to overcome the deficiencies of traditional methods and adapt to the intricacies of real-world spectral data, furnishing a more reliable and precise solution for spectral analysis.MethodsThe PFdAsLS algorithm introduces a segmentation-based baseline correction framework, permitting spectral signals to be divided into multiple sub-regions according to their local characteristics. Each region is then assigned specific fractional differential orders and regularization parameters to suit its unique features. The segmentation strategy applies small regularization parameters and lower fractional orders to regions with sharp signal variations, strengthening the algorithm’s capacity to capture local features. Conversely, for smooth background regions, larger regularization parameters and higher fractional orders are used to maintain baseline smoothness. This adaptability ensures that baseline correction is neither underfitted nor overfitted, even in highly heterogeneous spectra. Fractional differentiation plays a complementary role by providing a flexible means to control smoothness levels across the spectrum. When combined with the segmentation strategy, it boosts the ability of PFdAsLS to fit baselines. To evaluate the algorithm, experiments are conducted on both simulated and real datasets. In the simulated dataset, the spectral baseline is constructed using a three-segment function combined with peak signals and random noise to simulate real-world complexity. The root mean square error (RMSE) is employed as the primary metric to assess baseline correction performance. For real spectral data, ATR-FTIR is employed to collect data for two datasets: γ-PGA fermentation broth, aiming at glucose and sodium glutamate concentrations, and whole blood samples, targeting blood glucose concentration. Model prediction error (RMSEP) is utilized to evaluate the performance of baseline correction and its effect on quantitative analysis. The effectiveness of PFdAsLS is then compared with traditional AsLS and FdAsLS methods, enabling a comprehensive evaluation of its advantages.Results and DiscussionsIn the simulated experiments, the baseline correction results demonstrate the evident advantages of PFdAsLS over traditional methods. The RMSE of FdAsLS is 3.739, while PFdAsLS reduces it to 1.381 via the segmentation strategy, achieving a 63.07% improvement. This significant reduction reflects the influence of the segmentation strategy, which enables the algorithm to adaptively handle local baseline variations. The segmented parameter configuration is especially effective in regions with sharp signal changes, substantially enhancing overall baseline fitting accuracy. For the γ-PGA fermentation broth dataset, the baseline correction results reveal that FdAsLS achieves RMSEP values of 2.356 for glucose and 0.873 for sodium glutamate. When PFdAsLS is applied, these values are further decreased to 2.086 and 0.792, corresponding to improvements of 12.94% and 9.28%, respectively. The segmentation strategy successfully tailors the baseline correction to each spectral region, significantly enhancing model accuracy. Additionally, PFdAsLS effectively eliminates negative absorption peaks, such as water-related peaks, which are retained in spectra corrected by FdAsLS. This reduction in interference further contributes to improved model prediction performance, as shown in the spectral and baseline fitting results. For the whole blood dataset, FdAsLS attains an RMSEP of 1.418 for blood glucose concentration. PFdAsLS further reduces the RMSEP to 1.175, signifying an improvement of 17.14%. The segmentation-based approach allows PFdAsLS to account for varying baseline characteristics across spectral regions, leading to more precise corrections. Furthermore, PFdAsLS effectively removes water-related interference peaks, which are a major source of error in blood spectra, thereby enhancing spectral quality and improving quantitative model accuracy. Overall, these results emphasize the superiority of PFdAsLS in handling complex spectral data. Its segmentation strategy, combined with fractional differentiation, enables precise baseline correction across diverse regions of the spectrum, resulting in enhanced signal quality and improved quantitative analysis performance.ConclusionsCompared with traditional methods, PFdAsLS overcomes the limitations of applying uniform global parameters by employing a segmentation strategy. This enables it to adapt flexibly to the characteristics of different spectral regions. Combined with the flexibility of fractional differentiation, the algorithm significantly improves the precision and robustness of baseline correction, effectively resolving the baseline drift issues in spectra of complex mixed solutions obtained by ATR-FTIR.
Feb. 19, 2025Vol. 45 Issue 4 0430003 (2025)
Jun Shi, Yue Jiang, Miao Li, Feng Wang, Guohong Yang, Minxi Wei, Ao Sun, Ruize Wang, and Jixin Yang
ObjectiveEnergy shortage is a global challenge, and inertial confinement fusion (ICF) may offer a potential solution. The development of high-temperature, high-density plasma physics is critical for advancing thermonuclear fusion research and plays a significant role in addressing energy problems. In high-temperature, high-density plasma diagnostic experiments, X-ray spectroscopy plays a crucial role. By analyzing the X-ray emission and absorption spectra, detailed information about plasma temperature, density, and other key parameters can be obtained. Crystal diffraction of X-rays is the primary method for spectral detection. The accuracy of the diagnostic results depends on the spectral resolution, diffraction intensity, and photon throughput of the crystal spectrometer. Therefore, an ideal spectrometer must have high photo throughput and high energy resolution across a wide spectral range. Cylindrical and conical crystal spectrometers may achieve high photon throughput across a wide spectral range. However, the difference in optical path lengths can adversely affect diagnostic results, and these spectrometers cannot mitigate the influence of source broadening on spectral resolution. Spherical and toroidal crystal spectrometers can meet these requirements but are limited by a narrow measurable spectral range. Based on the theory of Rowland circle bent crystal diffraction focusing, we propose a multi-Rowland-circle bent surface structure, enabling spectrum diagnosis with high photon throughput and high spectral resolution across a wide spectral range.MethodsThe Rowland circle structure significantly reduces the influence of source broadening on spectral resolution. To further improve this, a multi-Rowland-circle structure is used instead of a single Rowland circle. By designing the diffraction positions for multiple energy points on the curved crystal, several ideal imaging points are achieved. High spectral resolution is possible for all energy points across a wide spectral range. In addition, the rotational symmetry of the diffraction circle provides excellent photon collection efficiency. The combination of multiple diffraction circles corresponding to different energy points forms the curved surface of the crystal. The multi-Rowland-circle structure eliminates Johann error, minimizes the influence of source broadening, and enables high-efficiency focusing across a wide spectral range.Results and DiscussionsThe detection system designed in this paper covers Bragg angles from 32.1° to 36.5°, corresponding to a spectral energy range of 7.6 keV to 8.5 keV (Fig. 2). The crystal model dimensions are 61.3 mm×42.0 mm×20.9 mm, and the material is α-quartz (2023). In the theoretical design, the distance from the light source to the crystal center is 280 mm, and the distance from the crystal center to the detector is 838.8 mm, providing ideal distances for system focusing and imaging. Spectral focusing experiments of the multi-Rowland-circle bent crystal structure target the Kα1 and Kα2 spectral lines of Cu. The theoretical spectral resolving power of the system is calculated to be 7300, with the detector resolution set at 100 μm. X-ray diffraction simulations are conducted using X-ray crystal diffraction (XCD) software for the multi-Rowland-circle structure. These simulations focus on the Kα1 and Kα2 X-ray lines of Cu (Fig. 3). The simulation results show excellent focusing performance when the detector is placed at the ideal position. The source includes seven energy points in the range of 7.6 keV to 8.5 keV, and the focused images of these points are obtained when the detector is in the optimal position (Fig. 4). This confirms that the multi-Rowland-circle crystal can achieve diffraction focusing across the designed energy range, demonstrating the spectrometer’s capability for wide-spectrum detection. Further tests on varying the size show that spectral resolving power remains stable, effectively suppressing the influence of source broadening (Fig. 5). In the simulation experiments when the detector resolution is set to 100 μm, the system’s spectral resolving power is calculated to be around 5000 (Fig. 6). The hygroscopic nature and anisotropy of certain crystal materials makes fabrication challenging. The manufacturing process of the multi-Rowland-circle bent crystal involves two steps: first, the crystal substrate is fabricated, and then the crystal is bonded to the substrate using intermolecular forces and adhesive. This method makes the spectrometer less susceptible to environmental factors such as temperature, humidity, and vibration. Spectral tests are conducted on a test platform using a Cu target X-ray tube. The multi-Rowland-circle bent crystal serves as the diffraction device, and a CMOS detector is used for X-ray detector. The experimental results are consistent with the simulation results, and focused images of the Cu Kα1 and Kα2 lines are obtained (Fig. 9). When the detector is positioned ideally, well-focused X-ray images are achieved. The actual spectral resolving power of the crystal spectrometer is calculated at 3010 (Fig. 10). Despite using a low-power X-ray source (24 kV and 0.1 mA) and a short exposure time (1 s), high-brightness focused images are obtained, demonstrating excellent photon throughput. However, due to limitations in the crystal surface accuracy, the actual spectral resolving power deviates slightly from the theoretical value. Therefore, future research will focus on refining crystal surface fabrication techniques to further improve the system’s spectral resolving power and photon throughput.ConclusionsBased on the Rowland circle structure, we introduce a multi-Rowland-circle structure to extend the spectral detection range. This design enables our detection system to achieve both high photon throughput and high spectral resolving power across a wide spectral range. To validate the theory, we conduct X-ray simulation experiments, followed by the development and testing of the multi-Rowland-circle crystal. Both simulation and experimental results demonstrate that our detection system exhibits excellent focusing performance and high photon throughput within a certain spectral range, effectively focusing rays into bright points. Moreover, it significantly suppresses the influence of source broadening on spectral resolving power. The actual spectral resolving power reaches over 3000, indicating our system’s high spectral resolving power.
Feb. 20, 2025Vol. 45 Issue 4 0434001 (2025)
© Copyright 2018-2021 | Chinese Laser Press.
All Rights Reserved 沪ICP备15018463号-20