


Please enter the answer below before you can view the full text.


2025
Volume: 45 Issue 3
29 Article(s)

Jingjing Xia, Feng Guo, Yanyan Liu, Xiaotong Lu, and Hong Chang
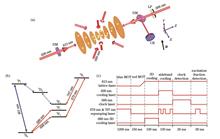
ObjectiveWe aim to reduce the temperature of cold atoms in a one-dimensional optical lattice, as this can remarkably enhance atomic coherence time and thereby improve the performance of applications like quantum simulation, optical lattice clocks, and quantum computing. In a one-dimensional optical lattice clock, atoms that have undergone two-stage Doppler cooling are confined within the lattice. The lattice has strong confinement only in the polarization direction and weaker confinement in the other two directions, which leads to radial heating effects. Moreover, since cold atoms occupy different motional states within the lattice and follow a Boltzmann thermal distribution, using a clock laser to probe the atoms confined in the optical lattice can result in inhomogenous excitation due to the dependence of motional states on Rabi frequency. This inhomogeneity reduces the indistinguishability of fermions, introduces additional collision frequency shifts, and weakens the coherence between the laser and the atoms, ultimately decreasing the detection time. Consequently, it becomes impossible to obtain narrow linewidth clock transition spectra with high signal-to-noise ratios, further affecting the stability of the optical lattice clock and the level of quantum control. Even at μK temperatures, the Doppler broadening can still reach tens of kHz. Cooling the atom ensemble using the damping force generated by standing wave fields can effectively reduce the temperature. To further lower the temperature of the atoms, various sub-Doppler cooling techniques are employed to cool the trapped atoms to their vibrational ground state, such as evaporative cooling and Raman sideband cooling. However, evaporative cooling requires long evaporation times and significant atomic loss, making it unsuitable for many applications. In contrast, the effectiveness of Raman sideband cooling can rival that of ion traps, making this cooling method widely applicable in optical clocks and optical tweezers. In this work, we apply optical molasses cooling and longitudinal Raman sideband cooling in a one-dimensional optical lattice to effectively lower the temperature of the cold atom ensemble and enhance coherence.MethodsBased on the 87Sr optical lattice clock, the atomic temperature is cooled to the μK level after two-stage laser cooling and is confined in a one-dimensional optical lattice with a trap depth of U=182Er. Using three pairs of orthogonal 689 nm lasers, a standing wave field is formed. By adjusting the frequency and power, the optical molasses cooling further lowers the temperature under the influence of three-dimensional damping forces. For the prepared quantum reference system, an appropriate bias magnetic field is applied, making the energy level shift of 1S0 indistinguishable, while the energy level shift of 3P1 is highly resolvable. At this point, a 698 nm cooling laser is applied along the polarization direction of the lattice light (+Z direction), with its frequency set to the red-detuned resonance frequency of the clock transition. This excites the atoms from the |1S0,|n〉 state to the |3P0,|n-1〉 state. Due to the long lifetime of the excited state 3P0 [151.4(48) s], atoms cannot spontaneously return to the ground state quickly enough for effective cooling. Therefore, a 679 nm repumping laser is used to pump the atoms from the 3P0 state to the 3S1 state, allowing spontaneous relaxation to 3P2, 3P1, and 3P0 states. Only the 3P1 state can spontaneously relax back to |1S0,|n-1〉. Thus, a 707 nm repumping laser is applied to pump the atoms from the 3P2 state to the 3S1 state, ensuring that all populations return to the ground state |1S0,|n-1〉 via the 3P1 state. The entire cooling process lasts about 30 ms, with the sideband cooling light circulating 5 times to improve cooling efficiency. Finally, two 698 nm clock lasers probe the atoms, achieving the axial and radial clock laser resonant transitions between (5s2) 1S0(F=9/2)-(5s5p) 3P0(F=9/2), with the radial clock laser acting for 5 ms.Results and DiscussionsThrough the optimization of the frequency and power of the 689 nm laser, optical lattice cooling successfully reduce the radial temperature of the atoms from 14.6 μK to 8 μK (Fig. 2). Longitudinal sideband cooling further lowers the axial temperature of the atoms from 5.6 μK to 1.2 μK (Fig. 2), decreasing the average external vibrational quantum number from 0.82 to 0.02. By observing Rabi oscillations (Fig. 3), the combination of optical molasses cooling and sideband cooling improves the maximum excitation fraction from 0.85 to 0.95, reduces inhomogeneous excitation, and increases the coherence time of the laser and atoms. Additionally, by measuring the atom fractions under different trap depths (Fig. 4), we demonstrate that our method increases low-temperature atom number in the lattice. This effect contributes to achieving higher stability for optical lattice clocks under lower quantum projection noise (QPN), particularly for shallow lattice clocks.ConclusionsOptical molasses cooling and longitudinal sideband cooling effectively reduce the axial temperature of 87Sr atoms to 1/5 of the temperature without cooling while also lowering the radial temperature. After cooling, the average vibrational state of the atoms is 0.02, with over 98.4% of the atoms in the vibrational ground state. The maximum excitation fraction increases from 0.85 to 0.95, indicating that this cooling method enhances coherence. Moreover, remaining atom fraction under different trap depths also show that cooling increases the atomic population. This research helps improve coherence time and the atom number in shallow optical lattices, thus enhancing the performance of quantum applications such as optical lattice atomic clocks. This cooling method can also be extended to other atoms, including 171Yb, 199Hg, and 111Cd. In future work, high-power lasers and three-dimensional sideband cooling can be utilized to cool atomic temperatures to the tens of nK, enhancing atomic coherence and increasing the atom number in shallow lattices, thereby improving the level of quantum control.
Feb. 21, 2025Vol. 45 Issue 3 0302001 (2025)
Haodong Shi, Peng Han, Chenjie Gong, Qi Wang, Hongyu Sun, Yufang Wu, Chao Wang, Jiayu Wang, and Yingchao Li
ObjectiveWith the rapid advancement of infrared focal plane device technology, broadband infrared imaging detection devices have been developed to meet the increasing demand for higher sensitivity and enhanced adaptability in adverse environments, such as nighttime or inclement weather conditions. Compared to traditional single-wave infrared imaging, broadband infrared polarization imaging enriches detection dimensions and improves the contrast between targets and their surroundings. As the demand for dynamic target infrared polarization imaging grows, the development of focal plane polarization imaging technology and devices has become a prominent research area. In this paper, we process wire grid microstructures on each pixel of an infrared focal plane array detector, achieving simultaneous detection of information in various polarization directions and states with high real-time performance and resolution. Despite advancements, the design of broadband infrared micro-polarization arrays remains underexplored both domestically and internationally. Therefore, researching and designing focal plane micro-nano polarization wire grids suited for broadband infrared is of great significance for advancing infrared imaging technology.MethodsIn this paper, we address the demand for broadband infrared real-time polarization imaging by modeling and optimizing the structure of a double-layer slit metal wire grid micro-polarization array. A time-domain finite difference (FDTD) method is employed to simulate and analyze the performance of these arrays. Based on equivalent medium theory, we analyze the wire grid using Maxwell’s equations to establish a theoretical foundation for selecting suitable materials. The periodic structure of the wire grid ridges is modeled as an anisotropic uniform thin film, enabling the creation of a uniform medium model. A novel double-layer slit metal wire grid is proposed. Structural optimization of the metal wire grids is conducted, including analyzing the influence of different incident angles on polarization performance. A cross-shaped aluminum isolation strip is designed to effectively suppress polarization crosstalk between pixels. This approach demonstrates the broad potential applications of the proposed micro-polarization array in broadband infrared polarization imaging devices.Results and DiscussionsThe double-layer slit metal wire grid (Fig. 2) incorporates a similar double-layer metal structure within the gaps between the wire grid ridges. The top and bottom metal wire grid layers are arranged in a periodic pattern, forming a structure akin to a Fabry-Pérot (F-P) resonant cavity. The transmittance and extinction ratio of the metal wire grid collectively determine its polarization performance. However, these parameters are often inversely proportional, making it essential to prioritize maximizing the extinction ratio while minimizing the reduction in transmittance. 1) Common metals such as gold, silver, and aluminum, with high concentrations of free electrons, are ideal for wire grid structures in the infrared range. Aluminum, used as the grid material, has a larger imaginary dielectric constant, which significantly attenuates TE transmittance waves (Fig. 4), resulting in a higher extinction ratio. 2) Transparent, non-metallic materials with low refractive indices are selected for the base and dielectric layers. Aluminum oxide serves as the base material, while silicon nitride is the dielectric. These materials enhance polarization performance by increasing transmittance. 3) Subwavelength metal wire grids operate in zero-order diffraction, with grid periods smaller than the critical value of 1.755 μm. As the duty cycle increases, TM transmittance decreases, while TE transmittance attenuates more strongly, thus improving the extinction ratio. 4) The metal wire grid consists of three layers: metal, non-metal, and metal. Analyses (Figs. 12 and 13) reveal that the height of the metal layer is directly proportional to both transmittance and extinction ratio, whereas the height of the non-metal layer inversely affects transmittance. 5) For oblique incidence in an uncooled broadband infrared detection system, performance improves at larger angles (Fig. 15), but the enhancement is not substantial.ConclusionsIn this paper, we propose a novel double-layer slit metal wire grid polarization array capable of achieving high transmittance and extinction ratio. The integration of optimized materials resolves the valley phenomenon at 9 μm, increasing TM transmittance by 47%. In the broadband infrared range of 3 μm to 12 μm, the transmittance achieved is between 75% and 95%, with a maximum extinction ratio of 88 dB, an improvement of 43% compared to traditional designs. We introduce a cross-shaped metal isolation band with widths of 260 nm and 40 nm, effectively suppressing pixel crosstalk within the micro-polarized array. The inclusion of the isolation band increases the electric field strength of the wire grid by 0.26 V/m, further enhancing the extinction ratio of the double-layer slit metal wire grid. The designed micro-polarization array is optimized for a broadband uncooled infrared focal plane array detector, featuring a resolution of 640×512 and a pixel size of 17 μm. The design offers significant reference value and provides a theoretical foundation for the development of next-generation infrared imaging devices.
Feb. 20, 2025Vol. 45 Issue 3 0305001 (2025)
Shengnan Zheng, Dongying Chen, Qiang Zhao, and Jing Wang
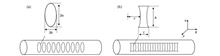
ObjectiveFiber Bragg grating (FBG) is an important passive device widely used in various fields. Compared to holographic interference and phase mask methods, the point-by-point (PBP) technique using femtosecond (fs) laser offers a simple optical path and is not limited by masks, providing significant flexibility. This makes it a hot topic in both domestic and international research. However, fiber Bragg gratings with short grating regions still suffer from low reflectivity. To address this, several methods have been proposed, including adjusting laser pulse energy, altering the grating period, and modifying the refractive index modulation region. In this paper, we propose a biconcave-shaped FBG structure that demonstrates high reflectivity and a short grating region under the same femtosecond laser writing conditions. This structure can be flexibly adjusted according to the desired reflective characteristics, which is of great significance for the development of high-power fiber laser systems, fiber amplifiers, and other FBG-based applications.MethodsInitially, the biconcave-shaped curvature is optimized to achieve optimal FBG reflective characteristics. The effects of modulation region length, period, grating modulation depth, and order on reflective performance are investigated, with a comparison to traditional FBGs. Preliminary experimental verification and simulation analysis of the sensing characteristics are also conducted.Results and DiscussionsAs the curvature of the biconcave-shaped FBG decreases, its reflectivity initially increases and then decreases. The optimal reflectivity is achieved when the curvature value is 0.062π rad (Fig. 2). The simulation results indicate that as the grating length increases, the peak reflectivities of both types of gratings improve, accompanied by a narrowing of the 3 dB bandwidth (Fig. 3). An increase in grating period leads to a significant shift in the central wavelength of the reflected light from both gratings, showing a linear relationship (Fig. 4). As grating modulation depth increases, both types of FBGs exhibit noticeable shifts in Bragg wavelengths, and the 3 dB bandwidth increases significantly, along with an increase in peak reflectivity (Fig. 5). When both the grating period and order are doubled, the Bragg wavelength remains unchanged (Fig. 6). In all cases, the reflectivity of the biconcave-shaped FBG is twice that of the traditional FBG, while the 3 dB bandwidth remains nearly constant. The experimentally fabricated biconcave FBG has a reflectivity of 78.65%, double that of the traditional FBG. The 3 dB bandwidth is 1.43 nm, comparable to that of traditional FBGs (Fig. 7). This grating demonstrates temperature and strain sensing characteristics that closely match theoretical values.ConclusionsTo address the issue of low reflectivity in short grating area FBGs created using the PBP method with fs laser, a high-reflectivity FBG based on a biconcave-shaped structure is designed, and preliminary experimental validation and simulation analysis of its sensing characteristics are performed. Preliminary results show that when the curvature of the biconcave arc is 0.062π rad, the grating length is 400 μm, the period is 1.6 μm, the modulation depth is 0.0083, and the order is third, the reflectivity of the femtosecond laser-written FBG reaches 81.7%, nearly double that of the traditional FBG, with the 3 dB bandwidth remaining almost unchanged. The experimental results for the traditional biconcave FBGs, fabricated under the same conditions, are consistent with the theoretical simulations. The biconcave FBG proposed in this paper has the advantages of high reflectivity and flexible tunability, offering a theoretical basis for optimizing the performance of new micro-nano optical devices.
Feb. 20, 2025Vol. 45 Issue 3 0305002 (2025)
Han Li, Wenchao Ding, Wei Xiao, Ming Li, Mingsheng Wang, Xiaoyang Zeng, Shiming Wang, Yongliang Peng, and Di Zheng
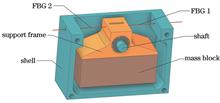
ObjectiveBased on different mechanical structures, existing FBG-based inclinometers can be categorized into cantilever beam structures and pendulum structures. The sensitivity of cantilever beam structure inclinometers is lower than that of pendulum structure inclinometers with the same mass block. This is because the cantilever beam structure cannot fully convert changes in gravity into axial strain changes in the FBG. The cantilever beam also shares part of the force. In addition, precise control of the adhesive thickness used to fix the FBG on the surface of the cantilever beam is difficult. Uneven adhesive thickness can reduce the consistency of the inclinometer’s tilt measurements. To improve the sensitivity and consistency of inclinometers, researchers have proposed inclinometers based on a pendulum structure. This design directly converts the pendulum swing caused by gravity into axial strain on the FBG. This not only significantly improves the strain transfer efficiency and increases the sensitivity of the inclinometer, but also enhances the consistency of the measurement results. However, existing FBG inclinometers based on pendulum structures have drawbacks such as a limited tilt measurement range and a larger size. Additionally, to increase sensitivity, these sensors typically use heavier masses and longer pendulum rods, which can lead to deformation of the pendulum rod in cases of large tilt measurements. To address the issues with the aforementioned FBG-type inclinometer, we design a novel FBG inclinometer based on a simple pendulum structure. The aim is to achieve a reduction in sensor size while enabling a wide range of high-precision, repeatable tilt measurements and overcoming the temperature sensitivity issues of FBG.MethodsWe employ a method that combines simulation design and experimental validation to design the proposed FBG inclinometer. To reduce the size of the sensor and minimize the deformation of the pendulum rod during large tilt angle measurements, the pendulum structure is designed with an integrated pendulum rod and pendulum mass (Fig. 1). This successfully enables wide-range, high-precision, and high-sensitivity measurements of tilt angles. At the same time, the sensor, through the configuration of dual FBGs, can measure both the tilt direction and angle simultaneously, and effectively addresses the issue of temperature sensitivity. The main components of the sensor are manufactured using 3D printing technology, which not only reduces the weight and cost of the sensor but also enhances its magnetic resistance. In addition, to ensure uniform and consistent prestress applied to the two FBGs, we have designed a new prestrain application device for optical fibers (Fig. 7). The device allows for the free adjustment of the magnitude and direction of the applied prestress through a combination of weights and pulleys and ensures that the direction of the applied prestress is along the fiber axis.Results and DiscussionsThe designed FBG inclinometer is tested for sensitivity and hysteresis using the demodulation system shown in Fig. 8. Figure 10(a) presents the experimental measurement results of the FBG wavelength difference versus the tilt angle of the designed inclinometer. For easy comparison and analysis, the simulation results are also shown in Fig. 10(a). It can be observed that the designed inclinometer exhibits good linearity within the ±15°, consistent with the simulation results. The theoretical and experimental tilt sensitivities obtained are 106.90 pm/(°) and 103.10 pm/(°), respectively, with a sensitivity difference of less than 6.54%, indicating the rationality of the inclinometer’s structural design and the effectiveness of the fabrication process. Figure 10(b) shows the results of the hysteresis test on the proposed inclinometer. According to formula (12), the hysteresis of the proposed inclinometer is calculated to be 0.65%. This result indicates that the inclinometer has low hysteresis, demonstrating high consistency in measurements between forward and reverse strokes. To verify the temperature compensation characteristics of the sensor, a temperature experiment is conducted. The obtained measurement results are shown in Fig. 11. From the results, it can be observed that the change in the center wavelength difference of the two FBGs during the heating and cooling processes is essentially consistent. In the temperature variation range, the maximum change in the wavelength difference is 21.39 pm, corresponding to an angle of approximately 0.21°. In addition, our research conducts a creep resistance test on the designed inclinometer. First, the inclinometer is fixed on an angular displacement platform, then the platform is rotated to the sensor’s maximum range of 15°, and this inclination is maintained for 24 h. The experimental results are shown in Fig. 12. The fluctuation range of the variation in the center wavelength difference between FBG1 and FBG2 is -3 to 4 pm, corresponding to a fluctuation range of 0.068° in tilt measurement.ConclusionsIn this work, we design a compact FBG inclinometer based on a pendulum structure, which features temperature-insensitive characteristics. The specially designed pendulum rod structure compresses the sensor’s height and length to 45 and 67 mm, respectively. The sensor exhibits a good linear response within a measurement range of -15° to 15°, with a sensitivity of 103.10 pm/(°). It also demonstrates excellent stability and creep resistance, with a fluctuation range of 0.068° for long-term tilt measurements. By adjusting the vertical distance between the FBG and the pendulum rob and the mass block, the sensitivity of the sensor can be further increased. By measuring the variation in the difference between the center wavelengths of the two FBGs, the influence of temperature changes on the inclinometer measurements can be eliminated.
Feb. 20, 2025Vol. 45 Issue 3 0305003 (2025)
Fengying Lai, Minming Geng, Yuan Mo, Rui Cen, Qiang Liu, and Zhenrong Zhang
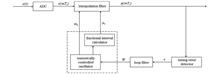
ObjectiveThe bandwidth requirement of the optical fiber communication network is increasing rapidly. To further enhance the transmission capacity of the optical fiber communication systems, we should adopt higher-order modulation formats or a higher single-wavelength transmission rate. However, higher-order modulation formats are more sensitive to channel impairment, which complicates the design of the receiver. The faster-than-Nyquist (FTN) system, one of the research hotspots of the next generation optical fiber communication systems, can transmit more bits than the Nyquist system within the same time period by introducing inter-symbol interference (ISI). The ISI and the transmission impairments of the FTN systems can be equalized and compensated by powerful digital signal processing (DSP) algorithms. In coherent digital optical communication systems, clock synchronization is a prerequisite for normal information transmission, so the clock recovery algorithm is crucial for the receiver. The clock recovery algorithm based on signal power, which is used to compensate for the sampling error induced by the ADC, is applicable to the FTN systems. The adaptive equalization algorithm is used to compensate for channel impairments, such as polarization mode dispersion (PMD). The ISI introduced by FTN systems and PMD introduced by the fiber will degrade the performance of the clock recovery module. Meanwhile, the adaptive equalization module and the clock recovery module, which are two key modules in the receiver DSP system, may mutually constrain each other. Thus, resolving the issue between the clock recovery and adaptive equalization modules is the key to ensuring the performance of the optical fiber communication systems. In this study, we intensively study the joint algorithm of adaptive equalization and power-based clock recovery (AE-PCR). Simulation results show that the AE-PCR algorithm can effectively achieve clock synchronization, equalization, and polarization demultiplexing in the FTN system with a smaller compression factor, and improve the convergence speed of the clock recovery algorithm.MethodsIn the proposed AE-PCR scheme, we embed the adaptive equalization module in the clock recovery module, which can effectively solve the mutual constraint between the adaptive equalization module and the clock recovery module. The data sampled by the ADC are fed forward to the interpolation filter in the loop of the clock recovery module. After interpolation, the data are fed forward to the butterfly filter of the adaptive equalization module to compensate for the PMD and part of the ISI. Then, the error function is calculated by the RDE algorithm based on the compensated data to update the tap coefficients of the butterfly filter. Meanwhile, the timing error is calculated based on signal power in the timing error detector to obtain more accurate timing information and improve the tracking accuracy of the clock synchronization loop, which can promote the performance of the clock recovery module. During the simulation, we successively analyze the performances of the conventional method (adaptive equalization and clock recovery non-joint algorithm) and the proposed AE-PCR method. The results show that the AE-PCR algorithm can effectively achieve clock synchronization, equalization, and polarization demultiplexing in the FTN system with a smaller compression factor and improve the convergence speed of the clock recovery algorithm. The AE-PCR algorithm can provide additional OSNR gain relative to the conventional scheme at the BER threshold of 2×10⁻².Results and DiscussionsIn the PDM-FTN-16QAM system, the convergence cost increases with the increase in sampling error in back-to-back transmission (Table 2), which makes it more difficult to track the clock recovery module. The ISI becomes more serious with the decrease in the compression factor, which increases the convergence cost of the power-based clock recovery module in back-to-back (BTB) transmission (Fig. 4). The convergence cost of the clock recovery module further increases under the influence of the large PMD introduced by fiber transmission (Fig. 5). The convergence cost of the AE-PCR algorithm increases with the increase in sampling error and the decrease in the compression factor, which is the same as that of the power-based clock recovery algorithm. The proposed AE-PCR scheme can increase the convergence speed and reduce the convergence cost in both BTB and transmission scenarios, and achieve polarization demultiplexing function simultaneously (Figs. 7 and 8). Finally, we simulate and compare the BER performances of the conventional and proposed methods. The required OSNR at the BER threshold of 2×10⁻² of the AE-PCR is 0.9 dB and 1.5 dB lower than that of the conventional method in the BTB and transmission scenarios, respectively (Fig. 9).ConclusionsIn this study, we conduct an in-depth study of the non-data-aided AE-PCR algorithm, which embeds the adaptive equalization module into the clock recovery loop. The proposed method can simultaneously compensate for channel impairments and timing errors, effectively resolving the issue of mutual restraint between the adaptive equalization and clock recovery modules. Simulation results show that the AE-PCR scheme can compensate for the timing error, equalize the ISI, and realize polarization demultiplexing in the FTN system with a compression factor of 0.85, which can increase the convergence speed by at least 51% and effectively reduce the convergence cost of the clock recovery module. With the same simulation parameters, the required OSNR at the BER threshold of 2×10⁻² of the AE-PCR is lower than that of the conventional method in both BTB and transmission scenarios.
Feb. 20, 2025Vol. 45 Issue 3 0306001 (2025)
Qiaoyun Wang, Chongyue Yan, Ziheng Zhu, Tianyu Li, Yinji Chen, and Qiang Liu
ObjectiveAcoustic sensors are widely applied in industrial production, photoacoustic spectroscopy, nuclear power plant pipeline leakage, seismic monitoring, and many other fields. Traditional piezoelectric and capacitive acoustic sensors utilize the extracted electrical signal to achieve sound detection. However, due to the limitation of the principle based on the piezoelectric effect, traditional electroacoustic sensors are difficult to use in harsh and complex environments such as high temperature and high pressure, strong corrosion, and strong radiation. It is hard to avoid the influence of electromagnetic interference. Compared with traditional electroacoustic sensors, fiber optic sensors possess the advantages of miniaturization, high sensitivity, and higher signal-to-noise ratio. Meanwhile, they can avoid electromagnetic interference and can be applied to complex and harsh environments like flammable and explosive, high temperature, and high pressure. The objective of our research is to enhance the detection sensitivity of fiber optic Fabry-Perot (F-P) acoustic sensors for low-frequency acoustic signals by optimizing the design, processing, and fabrication of the sensing diaphragm of the sensors, conducting acoustic experimental tests and studying its application in the field of photoacoustic spectroscopy. This will provide a certain theoretical and technological accumulation in the field of photoacoustic spectroscopy gas detection and promote research and technological development in relevant fields.MethodsTo improve the detection sensitivity of fiber optic F-P sensors for low-frequency acoustic signals, we propose a π-shaped cantilever structure composed of two narrow beams connected to a center sensing diaphragm. First, we employ COMSOL to conduct finite element analysis on the acoustic characteristics of the structure, and the effects of the angle, length, width, and thickness of the L-shaped cantilever on the resonance frequency and frequency response of the diaphragm are explored to complete the optimization of the π-shaped cantilever structure. Then, the dimensions of each part are determined in combination with the experimental effect. The diaphragm is printed on 304 stainless steel by a laser and assembled into a fiber-optic acoustic sensor with the capillary, optical fiber, quartz tube, and other parts. Also, the length of its static F-P interferometric cavity is adjusted so that the sensor operates in orthogonality to ensure that the signals are not distorted. After that, we conduct frequency response experiments on the sensor and compared it with a rectangular cantilever structure of the same size (4 mm×2 mm). Finally, we use the sensor for the detection of photoacoustic spectral signals of acetylene.Results and DiscussionsThe designed π-shaped cantilever is utilized to fabricate an optical fiber acoustic sensor (Fig. 6), and an acoustic test system is constructed to test the performance of the sensor at low-frequency acoustic signals (Fig. 7). The sensor has a homogeneous time-domain response under the acoustic pressure at different frequencies and has a high signal-to-noise ratio without other octave signals (Fig. 8). The sensitivity of the sensor is 178.76 nm/Pa at the first-order resonance frequency of 660 Hz (Fig. 9), and its sensitivity at 500 Hz is 5.21 nm/Pa, which is 1.8 times higher than that of the rectangular cantilever structure (Fig. 10). In the photoacoustic spectroscopy gas detection experiments for different volume fractions of acetylene, the response to the acetylene volume fraction can reach 1.97 pm/10-6, and the linearity is up to 0.9901 (Fig. 11).ConclusionsWe propose a fiber sound wave sensor based on π-shaped cantilever structure. The sensor film is made of 304 stainless steel and is carved by laser processing technology. The processing process is simple and the cost is low. To optimize the structure of the sensor, through the finite element analysis software, we simulate the inherent frequency and frequency response characteristics of the diaphragm. Considering theoretical analysis and experimental effects, the size of each part of the π-shaped cantilever is determined: the outer diameter of the diaphragm is 10 mm; the diameter of the vibration structure is 6 mm; the width of the L-shaped cantilever is 0.5 mm; the length of the central square diaphragm is 2 mm; the thickness of the diaphragm is 15 μm. In the sound wave testing experiment, compared with the rectangular cantilever structure of the same structure size (4 mm×2 mm), the experimental structure shows that the resonance frequency of the sensor is 660 Hz, and the sensitivity at the resonance frequency is 178.76 nm/Pa, which is twice higher than that of the rectangular cantilever structure, and the sensitivity at 500 Hz is 5.21 nm/Pa, which is 1.8 times higher than the rectangular cantilever structure. Finally, the sensor is used for photoacoustic spectroscopic gas detection experiments, and the result shows that the response of the structure to acetylene is 1.97 pm/10-6. In summary, the designed sensor has better application advantages in the field of low-frequency acoustic signal detection and photoacoustic spectroscopy. However, its detection capability for high-frequency acoustic signals is relatively weak. Future work will focus on further improving the sensor structure and exploring novel composite materials or micro/nanostructures. Additionally, the experimental scope will be expanded to include acoustic waves of varying frequency ranges and a wide range of gas concentrations, in order to comprehensively assess the sensor’s dynamic response and performance limits.
Feb. 20, 2025Vol. 45 Issue 3 0306002 (2025)
Kai Yan, Wei Xu, Qingyun Chen, Chen Zhu, and Wei Li
ObjectiveTraditional prism-based surface plasmon resonance (SPR) sensors face challenges in large-scale applications due to their bulky size, high costs, and complex structures. Photonic crystal fibers (PCFs) offer advantages such as compactness, ease of operation, and strong anti-interference capabilities, making them promising replacements for prism substrates. To broaden sensor applications, various sensing media have been used to measure parameters like temperature, magnetic fields, and gases. This necessitates SPR sensors to adapt to various environments. Gold (Au), with its stable chemical properties, is widely utilized as a sensing layer, but reports often overlook the issue of poor adhesion of Au films. Using metals as adhesive layers significantly affects sensor performance due to the imaginary part of their refractive index (RI) of metals. Titanium dioxide (TiO2), with a purely real RI, minimizes light absorption, but theoretical analyses reveal it can still reduce sensitivity in traditional sensors. While adding enhancement layers can mitigate this issue, it also increases complexity and cost. In this paper, we address sensitivity loss in SPR sensors caused by adhesive layers by proposing a D-shaped SPR-PCF dual-open-circular structure. The design reduces the distance between the sensing layer and the core, thus enhancing sensor performance.MethodsThe system, comprising the fiber core, TiO2, Au, and analyte, is modeled as an equivalent thin-film structure to evaluate the influence of film thicknesses on sensor performance. The PCF features three layers of air holes arranged in a triangular lattice. The outer two layers contain large air holes, while the innermost layer consists of two smaller air holes with varying diameters. A dual-open-circular channel is located at the center of the D-shaped PCF surface, coated with a TiO2-Au bilayer. This external sensing structure simplifies coating processes, reduces film area, and lowers costs. In addition, the open-circular channel shortens the distance between the sensing layer and the core, improving performance of the sensor with the adhesive layer. SPR occurs when the frequency of the evanescent wave matches that of the surface plasmon wave (SPW), causing strong absorption of incident light by the surface plasmon polariton (SPP) mode. By detecting resonance wavelength shifts, the analyte’s RI can be determined.Results and DiscussionsFor an equivalent film system with TiO2 as the adhesive layer and Au as the sensing layer, numerical analysis is conducted using the Fresnel optical formula under the simplified condition of a single reflection (Fig. 2). The results show that thinner Au films are more affected by variations in TiO2 thickness. Without an adhesive layer, the optimal thickness range for a single Au film is 43?59 nm. When a 10-nm-thick TiO2 adhesive layer is added, this range shifts to 40?56 nm, resulting in a sensitivity reduction of 2.33% and 0.54% for 43 nm and 59 nm Au films, respectively (Table 1). Considering both sensitivity and minimum reflectivity, the optimal configuration is achieved when the Au film thickness is between 45?55 nm and the TiO2 film thickness is below 15 nm. To address the sensitivity reduction caused by adhesive layers, a D-shaped PCF-SPR sensor with an enhanced open-circular structure is designed. At an analyte RI of 1.25, analysis of the core-SPP mode interaction reveals an anti-crossing effect, with the y-polarization mode proving more effective for sensing than the x-polarization (Figs. 4 and 5). Finite element method (FEM) simulations are used to evaluate the effects of internal and external structural parameters on sensor performance, leading to the determination of optimal parameters (Figs. 6 and 7). Compared to standard D-shaped structure, this enhanced design increases sensitivity by 217%. In addition, when compared with semi-circular and U-shaped designs, the proposed structure demonstrates the most significant enhancement among the compared designs (Figs. 8?10). In the RI range of 1.22?1.32, the sensor achieves a maximum wavelength sensitivity of 26700 nm/RIU, an optimal resolution of 3.75×10⁻⁶ RIU, and a quality factor of 125 RIU-1 (Fig. 11). For precise measurement, the sensing range is divided into two subranges: 1.22?1.27 and 1.28?1.32. Linear fitting yields a high correlation coefficient of 0.97835 for the lower range, while second-order polynomial fitting achieves a correlation coefficient of 0.99256 for the higher range (Fig. 12). These results enable accurate RI measurements across different subranges, tailored to specific application requirements.ConclusionsIn this paper, we explore the influence of TiO2 adhesive layers on the performance of traditional SPR sensors and identify the optimal thickness range. To address sensitivity reductions caused by adhesive layers, a D-shaped PCF-SPR sensor with a dual-open-circular structure is introduced. The TiO2-Au bilayer improves adhesion strength without requiring additional enhancement layers. FEM analysis validates the open-circular design’s superior performance, achieving a sensitivity increase of 217% compared to traditional D-shaped designs. The sensor demonstrates excellent performance within the low RI range of 1.22?1.32, with a maximum wavelength sensitivity of 26700 nm/RIU, an optimal resolution of 3.75×10⁻⁶ RIU, and a quality factor of 125 RIU-1. Compared to previously reported low RI sensors, this design offers superior stability, sensitivity, and resolution, offering promising potential for applications in chemical detection, biometric recognition, and low RI measurement.
Feb. 20, 2025Vol. 45 Issue 3 0306003 (2025)
Dan Chen, Haoya Chen, Mingjun Wang, and Feier Ai
ObjectiveIn practical free-space optical (FSO) communication systems, the channel state information of the receiver is not precise, and this channel estimation error can result in a mismatch during the signal demodulation. Therefore, the system channel state information should be considered non-ideal to more closely match the complexity and uncertainty of the real operating environment for designing an FSO system that meets the practical application scenarios.MethodsThe system channel state information needs to be considered as non-ideal to more closely match the complexity and uncertainty of the real operating environment and then an FSO system is designed to meet the practical application scenarios. Meanwhile, geometric shaping-quadrature amplitude modulation (GS-QAM) is obtained by optimizing a number of metrics, such as mutual information (MI) and generalized mutual information (GMI), which will relocate the constellation points in the geometric space. We optimize a practical FSO 16QAM communication scheme with adaptive geometric shaping (GS) based on the closed form probability density function (PDF) of the non-ideal channel gain and introduce a trust domain algorithm with a nonlinear conjugate gradient algorithm, which is employed to optimize the position of each constellation point on the constellation map to adapt to the channel conditions. As a result, this can solve the problem of traversing the optimal position of the constellation points with GMI as the objective function. Finally, in the range of the signal-to-noise ratio (SNR), designing the optimal constellation shape can maximize the reachable information rate in optical communication while maintaining a certain bit error rate (BER). Additionally, the trust domain method is to set a limited range in the neighborhood of the current solution to search within that range. The trust domain model represents the objective function better. It will search for the minimum value of the model within that region as a step size. If a step size is not appropriate, the region is reduced and the minimum point is searched again. As an optimization algorithm that requires only the first order derivatives of the function without reliance on additional parameter inputs, the conjugate gradient method has excellent convergence and stability properties and is adopted to solve unconstrained optimization problems. We combine the trust domain optimization algorithm with the nonlinear conjugate gradient method to improve the amount of GMI as an optimization criterion to optimize the shape of geometric constellations for optical communication systems.Results and DiscussionsWe explore the optimal position traversal problem of constellation points under Gamma-Gamma turbulence channels and non-ideal Gamma-Gamma turbulence channels by employing the trust domain algorithm and the nonlinear conjugate gradient algorithm with GMI as an objective function. Simulation results show that it is possible to achieve adaptive selection of the optimal GS distribution at the transmitter to transmit 16QAM signals in different SNR conditions. In the ideal channel, the GMI performance is significantly improved with the adaptive GS 16QAM scheme. Figure 5 shows that the GMI values of GS are all higher than those of the uniform distribution under fixed turbulence intensity, indicating that the proposed adaptive GS scheme improves the system performance and optimizes the rate loss caused by the uniform distribution. In Fig. 6, under the fixed correlation coefficient, the GMI values of GS are also higher than those of the uniform distribution, indicating that the adaptive 16QAM GS technique has a sound effect of compensating the estimation error of the non-ideal channel. Under ideal channels, the adaptive constellation GS technique introduced in Fig. 8 provides stable NGMI performance for the system, while under non-ideal channels, Fig. 9 shows that the GS technique ensures system reliability. In summary, by combining the conjugate gradient method, the trust domain algorithm, and the constellation GS technique, it is possible to achieve the dynamic optimization of the constellation in a wide range of SNRs and atmospheric turbulence conditions, thus ensuring the stability and high efficiency of the communication link.ConclusionsWe propose an adaptive GS coded modulation optimization scheme for FSO communication to solve the optimal position traversal problem of constellation points with GS as the objective function by transforming the problem into an unconstrained optimization problem using the GMI gradient. The performance of GMI and NGMI with GS and uniform distribution is analyzed and compared for different turbulence intensities, received SNRs, and non-ideal channel correlation coefficients under ideal and non-ideal channels. When the SNR is kept constant, the turbulence intensity increase introduces random jitter and distortion of the transmitted optical signals, which causes the deviation of the signal constellation points from the original ideal position and makes the constellation points more dispersed. As a result, this affects the judgment accuracy of the signals at the receiving end and ultimately increases the BER. The smaller turbulence intensity or larger SNR leads to more compact constellation point layouts after GS. The NGMI value increases with the rising non-ideal channel correlation coefficient, and the larger correlation coefficient makes it closer to the ideal channel conditions. Additionally, the difference between the NGMI values of different correlation coefficients decreases with the increasing SNR. This is due to the fact that the distribution of constellation points is optimized by GS, which enhances the signal’s immunity to noise, adapts and optimizes the signal judgment region, and enables the system to maintain a high communication quality in non-ideal atmospheric conditions. Therefore, the system NGMI values are above the NGMI threshold after adopting adaptive constellation GS, which means that the introduction of adaptive constellation GS technique plays a vital role in providing stable NGMI performance.
Feb. 20, 2025Vol. 45 Issue 3 0306004 (2025)
Jianing Guo, Chao Wang, and Jian Zhang
ObjectiveVisible light communication (VLC), as a novel wireless communication type, seamlessly combines illumination and data transmission. It has drawn significant attention as a promising solution for indoor wireless communication because of its advantages such as license-free deployment, high data-rate capabilities, and lack of electromagnetic interference. VLC usually uses light-emitting diodes (LEDs) as transmitters and photodiodes (PDs) as receivers. In recent years, with the rapid development and wide application of LEDs, VLC has attracted extensive attention from many scholars. Phosphor-converted LEDs (pc-LEDs) and multi-color LEDs (mc-LEDs) are two typical types of LEDs used in VLC. The pc-LEDs have a competitive price and a large market share. However, their inherent modulation bandwidth is limited to the MHz range. Compared with pc-LEDs, mc-LEDs generate white light by mixing light from different LED chips and can provide higher modulation bandwidth and multiple sub-channels. Recently, multi-color VLC has been applied in various important fields like integrated sensing and communication and indoor localization. Therefore, it is essential to study transmission techniques for multi-color VLC. Existing transmission techniques for multi-color VLC systems use PDs with monochromatic filters to separate optical signals from LED chips of different colors. However, due to the limited adaptability of PDs with monochromatic filters to different light colors, it is usually necessary to use multiple PDs to receive optical signals of different colors. Moreover, the cost of PDs with monochromatic filters is also higher. Therefore, it is necessary to study the application of a regular PD without filters in multi-color VLC.MethodsTo simplify the communication process, VLC usually adopts intensity modulation and direct detection (IM/DD) for communication, with transmitted signals modulated on the optical intensity. Therefore, in VLC systems, the optical intensity signal should be nonnegative and its power is directly proportional to the optical intensity, which is different from conventional radio frequency (RF) communication. Based on the above practical requirements in multi-color VLC systems and the results on multi-input single-output (MISO) optical intensity channels with per-antenna power constraints, we propose an optimal constellation design based on the equivalent transmitted signal for indoor multi-color VLC. The receiver in the system uses a regular PD without monochromatic filters. First, we determine the normalized average power of each chip in the mc-LED by minimizing the total optical power while considering constraints on chromaticity, brightness, and optical intensity signals. Then, we model the system as a MISO VLC system with per-antenna power constraints. By maximizing the minimum Euclidean distance (MED) of the equiprobable equally-spaced amplitude shift keying (ASK) equivalent transmitted signal constellation and using partition-based decomposition (PBD) to decompose the equivalent transmitted signal into the transmitted signals of each LED chip, we finally obtain the optimal constellation design.Results and DiscussionsIn this study, we simulate an indoor VLC system composed of a mc-LED and a regular PD without monochromatic filters. The transmitter used in the simulation is the Cree Xlamp MC-E RGB LED, and the receiver used is the HAMAMATSU S2386 silicon PD. The normalized channel gain of each chip is calculated using the Lambertian model [Eq. (2)]. We provide the parameters of different LED chips (Table 2) and the configuration parameters of the Lambertian model (Table 3). Also, we provide the center chromaticity coordinates and the corner coordinates of quadrangles corresponding to different correlated color temperature (CCT) values (Table 4). First, we show the optical power of the mc-LED and each chip within it under different CCT values and total luminous fluxes (Fig. 5). As shown in Fig. 5, the total optical power remains relatively constant across different CCT values under the same luminous flux. Moreover, an increase in CCT values leads to an increase in the green and blue light components, while a decrease is observed in the red light component. Then, we provide the bit error rate (BER) curves for both the proposed ASK-PBD scheme and the optimal precoding-based transmission schemes under different CCT values and total luminous fluxes (Fig. 6). As shown in Fig. 6, the proposed ASK-PBD scheme has better error performance than the optimal precoding scheme under the same conditions.ConclusionsIn this study, we propose an optimal constellation design based on the equiprobable equally-spaced ASK equivalent transmitted signal for the indoor multi-color VLC system. The system configuration consists of an mc-LED as the transmitter and a regular PD without monochromatic filters as the receiver. We determine the normalized average power by minimizing the total optical power while considering constraints on chromaticity, brightness, and optical intensity signal. Then, we model the system as an indoor MISO VLC system with per-antenna power constraints. Using the normalized average power and channel gain of each LED chip, we determine the optimal interval for the ASK equivalent transmitted signal. Furthermore, we decompose the equivalent transmitted signal into the transmitted signals using partition-based decomposition to obtain the optimal constellation. Simulation results of an indoor multi-color VLC system show that our proposed scheme has better error performance than the benchmark scheme under the same conditions. In conclusion, the proposed optimal constellation design is a promising alternative for multi-color VLC systems due to its cost-effectiveness and adaptability to different light wavelengths.
Feb. 10, 2025Vol. 45 Issue 3 0306005 (2025)
Weichen Zhao, Jing Li, Cheng Tian, Li Pei, and Tigang Ning
ObjectiveThe use of microwave photonic arbitrary function waveform generation (OAFG) technology can overcome the speed limitations encountered in electronic systems, enabling the generation of high-quality function waveform signals with broader applications. Various OAFG schemes have been proposed by research institutions worldwide, including direct spectral shaping, frequency-to-time mapping (FTTM), time-domain synthesis, and external modulation. Direct spectral shaping has gained considerable attention due to its flexibility. This technique utilizes Fourier transform principles to manipulate the amplitude and phase of the spectrum, altering the characteristics of optical pulses in the time domain. However, practical spectral manipulation can be affected by phase disturbances and precision issues, influencing signal quality and requiring further refinement. FTTM technology allows for spectral analysis of microwave signals, removing noise and unwanted frequency components to improve waveform quality and reliability. However, its implementation is complex and it may introduce nonlinear distortions, reducing the accuracy of the signals. Time-domain synthesis involves processing the optical intensity envelope to match the target waveform’s envelope, which is then detected to obtain the desired waveform. However, this method can introduce noise and nonlinear distortions during the synthesis process, affecting waveform quality. External modulation technology leverages the nonlinear characteristics of electro-optic modulators to adjust the modulation of optical signals by controlling parameters such as modulation coefficient and bias voltage, allowing the modulated photocurrent to approximate the Fourier series of the target waveform.MethodsIn this paper, we introduce a novel optical function waveform generation scheme based on image-frequency rejection mixer technology. By adjusting key parameters of the Mach-Zehnder modulator (MZM), including modulation coefficient, bias voltage, and phase difference between the upper and lower arm signals, this scheme enables control of harmonic components within the photocurrent expression. Moreover, by leveraging the image-frequency rejection mixer’s properties, interference to the target signal is effectively suppressed, allowing the generated waveform to closely match the Fourier series of the target waveform, resulting in high-quality functional waveforms. Simulation results confirm the scheme’s ability to generate diverse signals with excellent tunability, offering new avenues for function waveform research.Results and DiscussionsThe proposed functional waveform generation scheme is shown in Fig. 1. For various target waveforms, system variables such as modulation coefficient, bias voltage, and phase difference are calculated and set to generate the desired functional waveform. The root mean square error (RMSE) is used to assess the waveform quality, and the effects of drift in modulation coefficient, phase difference, and bias voltage are analyzed with corresponding tolerance ranges.ConclusionsA function waveform generation scheme based on an image-frequency rejection mixer is proposed. By controlling three variables of the MZM, i.e., modulation coefficient β, bias voltage Vbias, and phase difference θ between the upper and lower arms, each harmonic component can be adjusted to approximate the Fourier series of the target waveform, thus generating the desired signal. The scheme’s tunability, as well as the tolerance ranges for each MZM variable, is analyzed and discussed. This approach can generate triangular waves with adjustable symmetry, square waves with adjustable duty cycles, and triangular waves with adjustable duty cycles. When the RMSE is limited to ≤5%, high-quality adjustable symmetric triangular waves (with symmetry factor 30%≤σ≤70%) can be produced.
Feb. 21, 2025Vol. 45 Issue 3 0307001 (2025)
Fuyin Wang, Lingling Zhang, Ruize Lou, Ji Xia, Zheng Liu, Qiong Yao, Hu Zhang, Qi Wang, Lei Feng, and Hu Chen
ObjectiveMedium-fineness fiber optic Fabry?Perot (F-P) sensors possess greater reflected light intensity compared with low-fineness ones, which effectively improves the utilization of optical energy. In contrast to high-fineness fiber optic F-P sensors, their fabrication process reduces the requirement for optical path alignment, facilitating large-scale production. White light interferometry technology is highly prone to noise during the signal recovery process, making it difficult to maintain stable demodulation accuracy in complex environments, thus restricting its application in the field of medium-fineness fiber optic F-P sensors. In recent years, to enhance the accuracy and reliability of white light interferometric signal demodulation, many scholars have been dedicated to exploring effective signal extraction and noise suppression techniques. However, research on additive noise caused by quantization processing and other factors in fast Fourier transform (FFT) signal demodulation methods based on white light interferometry is still insufficient, posing a greater challenge to the signal detection performance and noise stability of medium-fineness fiber optic F-P sensors.MethodsTo address the issue of significant demodulation noise resulting from non-integer period sampling in the FFT signal demodulation method based on white light interferometry technology, we analyze the principles of the FFT demodulation method for medium-fineness fiber optic F-P sensors. We build a phase change model induced by additive noise, focusing on the variations of two key parameters, the light intensity coefficient ratio (fineness) and the initial phase. We study the mechanisms affecting the stability of demodulation noise in medium-fineness fiber optic F-P sensors. We propose an improved FFT signal demodulation method based on white light interferometry technology. By integrating the phase changes of multiple eigen-peaks and optimizing the weighted average, different weights are selected to achieve the best suppression effect on additive noise. The weighted average operation does not influence the demodulation phase caused by additive noise, while simultaneously suppressing noise signals. To verify the noise suppression effect of this method, we analyze the demodulation phases of the two eigen-peaks and assess the suppression effect on additive noise through power spectral density.Results and DiscussionsWe conduct simulations and experiments to verify the performance of the weighted average demodulation method. The simulation results show that as the fineness of the sensor increases, the influence of additive noise on the demodulation phase error decreases. With the variation of the initial phase, the radio values of the eigen-peaks exhibit a periodic cosine change pattern. The higher the order of the eigen-peak, the more remarkable the phase change caused by additive noise, and the poorer the recovery effect of the demodulated signal (Figs. 2 and 3). Lower-order eigen-peaks contain more phase information and are more sensitive to fluctuations due to variations of initial phase. In contrast, additive noise has a greater effect on higher order eigen-peaks, although their fluctuation amplitude changes less with the initial phase. In this research, we propose an improved FFT signal demodulation method based on white light interferometry technology. By integrating the phase changes of multiple eigen-peaks and optimizing the weighted average, different weights are selected to achieve the best suppression effect on additive noise. The weighted average operation does not influence the demodulation phase caused by additive noise, while simultaneously suppressing noise signals. To validate the noise suppression effect of this method, we analyze the demodulation phases of two eigen-peaks and assess the suppression effect on additive noise through power spectral density (Fig. 8). The optimal phase noise level of the weighted average optimization method can reach -102.1 dB, enhancing its noise suppression capability by 3.8 dB (Fig. 8). The experimental results confirm the effectiveness of the weighted average optimization method.ConclusionsWe build a noise model for medium-fineness fiber optic F-P sensors, analyze and deduce the influence of additive noise on the demodulation results, and propose a method of weighted averaging based on multiple eigen-peaks. Compared with the demodulation method that only uses the first-order eigen-peak, our method can effectively reduce the influence of additive noise on the demodulation phase and enhance the anti-interference performance of the demodulated signal. The simulation and experimental results are in line with the theoretical analysis of the model. As the requirements for noise performance of medium-fineness fiber optic F-P sensors in signal detection and multiplexing applications continue to grow, the noise model and the weighted average based noise suppression method proposed in our study possess research and practical significance.
Feb. 21, 2025Vol. 45 Issue 3 0307002 (2025)
Hong Lu, Chao Wang, Jianan Liu, Qi Wang, Zhuang Liu, Haodong Shi, and Hongyu Sun
ObjectiveImages have become a primary medium for information dissemination and presentation, with high-resolution images offering superior clarity and the ability to convey richer details. With advancements in electro-optical imaging technology, modern optoelectronic systems are expected to achieve miniaturization and lightweight designs while maintaining high-resolution imaging capabilities. In this paper, we propose a simplified design framework for a super-resolution imaging system based on optical-digital joint optimization. The approach integrates optical design, image restoration, and super-resolution reconstruction algorithms. Using the gradient backpropagation mechanism of deep learning, both optical parameters and network parameters are co-optimized to achieve an optimal match between the imaging system and the reconstruction algorithm. To enable the neural network to address both optical aberration correction and super-resolution reconstruction simultaneously, an improved two-branch generative adversarial network is proposed. This network effectively extracts features related to optical blurring and super-resolution reconstruction in a targeted manner. Using this method, we demonstrate an end-to-end joint optimization of a card-type telescope imaging system and a recovery reconstruction network, significantly simplifying the telescope system’s structure while maintaining imaging quality. High-detail super-resolution images are obtained, and the algorithm’s performance and effectiveness are validated through comparisons of PSNR and SSIM metrics between reconstructed and reference images, along with other related algorithms.MethodsIn this paper, we propose an end-to-end simplified design framework for super-resolution imaging systems. By employing optical-digital joint optimization and leveraging the gradient backpropagation mechanism of deep learning, both lens parameters and recovery network parameters are co-optimized. The optical system’s imaging degradation is modeled and analyzed, and images synthesized from this degradation model are used to train the super-resolution reconstruction network, ensuring that the training results align closely with real-world scenarios. In addition, to address the dual challenges of optical aberration recovery and super-resolution reconstruction, an improved two-branch generative adversarial network is proposed. This network is designed to target and extract blurred optical features while simultaneously focusing on super-resolution reconstruction. Our method enables the design of simplified optical systems capable of high-resolution imaging, with significant potential application in fields such as security monitoring and aerospace.Results and DiscussionsUsing the proposed method, the optical system’s complexity is successfully reduced from four mirrors to two without compromising imaging quality (Fig. 9). Objective metrics confirm that the imaging quality is comparable to that of the original optical system (Table 1). The reconstructed super-resolution images exhibit detailed texture information, and comparisons with advanced super-resolution networks demonstrate superior performance in terms of objective metrics (Table 2). To further validate the superiority of the joint optimization method proposed in this paper, a detailed simulation analysis of the entire imaging and reconstruction process is conducted. The results show that when the photoelectric receiver is constrained by its inherent physical limitations (e.g., low resolution) or when information is lost during image transmission, the resulting image suffers from degraded resolution. In such cases, conventional image restoration techniques cannot recover high-resolution images with rich details (Fig. 15). This underscores the necessity of incorporating super-resolution reconstruction.ConclusionsIn this paper, we propose a simplified design framework for super-resolution imaging systems using optical-digital joint optimization to meet the demand for lightweight optoelectronic imaging systems. Deep learning is utilized to co-optimize the optical system and recovery reconstruction network, simplifying the system structure while enhancing imaging resolution. For the dual challenges of correcting aberrations and reconstructing super-resolution images, an improved two-branch parallel generative adversarial network is proposed, specifically targeting blur correction and feature reconstruction. This framework is applied to a card-type telescope system, successfully reducing the lens count in the back group from four to two while improving the original imaging quality. Compared to previous joint optimization methods, we provide a more comprehensive consideration of image acquisition and detector physical constraints, modeling and analyzing all aspects of the image formation process. As a result, the proposed approach delivers more detailed, high-resolution images.
Feb. 21, 2025Vol. 45 Issue 3 0311001 (2025)
Yuan Zhou, Ying Chen, Liping Sun, Zixin Zou, Yingchang Zou, Xiqiao Chen, Shixun Fan, and Dapeng Fan
ObjectiveRisley prisms encounter a control singularity in the center region of the field of regard (FOR) during target tracking. When the emerging beam or the line of sight (LOS) of the system tracks a target near the system rotation axis, the prisms need to rotate at an extremely high speed and even make an instantaneous 180° flip. Due to the limited maximum speeds of driving motors, the control singularity problem challenges the drive and control of the prisms when tracking a continuous and smooth path close to or passing through the system rotation axis, restricting the system,s real-time target tracking capability. Although three-element Risley prisms can eliminate these singularities, adding a third prism not only enlarges the size and increases the cost but also demands complex control algorithms. To maintain simplicity, two prisms seem a reasonable choice. However, to relieve control difficulties, it is beneficial to discuss the characteristics and sources of the control singularity problem, which can assist in guiding the control system design and exploring solutions to the singularity problem. In our current study, based on our previous research on the nonlinearity problem in Risley-prism-based target tracking, we aim to analyze the inverse solutions of prism orientations for targets in the center region of the FOR. Then, the characteristics and root causes of the control singularity problem are disclosed in continuous and discrete time domains. Moreover, the internal mechanism and implementation effect of the optimal-solution method for resolving the singularity problem are further investigated.MethodsFocusing on the center of the FOR, the inverse solutions of prism orientations are obtained using the two-step method, and their singularities are then analyzed. For the targets passing through the center or moving near the center [Fig. 2(a)], the ratios of the rotational speed of the prisms to the slewing rate of the beams, denoted as the M values, are calculated in continuous time domains. By analyzing the M value, the origin of the singularity is uncovered, and the performance characteristics of the singularity are discussed. For target tracking in the discrete time domain (Fig. 3), the required rotation angles of the prisms for tracking the target from one point to other points in the center zone are calculated (Fig. 4) and the average M values are derived (Fig. 5). Based on these results, the characteristics and root causes of the singularity in discrete time domains are studied (Figs. 6 and 7). The principle basis is revealed to explain why the optimal-solution method can mitigate the control singularity problem. The requirements of target tracking for driving and controlling prism rotation and the angular region of tracking blind zone in the center region are estimated (Figs. 6 and 8).Results and DiscussionsFor the center of the FOR, the singularity of the inverse solutions of prism orientations results from the uncertainty of the azimuth angle. For the targets moving near the center [Fig. 2(a)], the tangential movement leads to large variation in azimuth, yielding the maximum M value, denoted as Mm [Fig. 2(b)]. As the altitude angle approaches zero, Mm increases sharply and becomes infinite [Fig. 2(c)]. For the targets passing through the center, the optimal-solution method can solve the singularity problem. In the discrete time domain (Fig. 3), if the same set of solutions is used to track a target when the target moves from one side of the center to the other side, the average M value increases significantly (Fig. 5). This singularity problem can be alleviated by switching the solutions, that is, adopting the optimal-solution method (Fig. 6). However, a strong control ability to drive prism rotation is still necessary for tracking the target within a certain angle range near the center. For a given rotational double prism system and tracking application, a tracking blind zone with a certain angle range exists in the center region of the FOR (Fig. 8).ConclusionsBased on the inverse solutions of prism orientations obtained using the two-step method, the ratios of the rotational speed of the prisms to the slewing rate for the beams are calculated. The characteristics and root causes of the control singularity problem are analyzed when the system tracks a target in the center region of the FOR in continuous-time and discrete-time domains respectively. It is discovered that for target tracking in the center region, the control singularity problem stems from the large variation in target azimuth, caused by the tangential movement of the target. The closer the target is to the center of the FOR, the more prominent the control singularity problem is. The optimal-solution method can relieve the control difficulties of prism rotation resulting from the azimuth jump of the target crossing the center. There is still a tracking blind zone in the center region of the FOR, and its angle range is determined by the driving and control ability of the system to prism rotation and the target tracking requirements. The proposed analysis methods and results can provide a foundation for the design of the prism drive control scheme and the evaluation of the system tracking performance.
Feb. 10, 2025Vol. 45 Issue 3 0312001 (2025)
Shiqi Gan, Weichao Wang, Guangfu Yuan, Xiao Zhang, Xin Ma, and Hetao Qin
ObjectiveThe study of target infrared radiation characteristics is a key research direction in the field of infrared detection technology and holds significant application value in acquisition and tracking, detection, and recognition. External field measurements of infrared radiation characteristics are essential for obtaining the target’s surface temperature distribution and radiation characteristics in real-world environments. Typically, imaging measurement methods are used to capture target images in various states and calculate target radiation brightness, intensity, or temperature distribution. However, practical applications face several challenges: 1) system calibration is often conducted before or after measurements, with significant changes in ambient temperature during both the measurement and calibration phases, resulting in temperature drift in the system and large errors in target characteristic calculation; 2) the slow rate of temperature rise and stabilization in the blackbody leads to a lengthy calibration cycle (typically over 30 min), with calibration coefficients becoming inaccurate due to changes in ambient temperature; 3) the dynamic target characteristics measurement process is lengthy, with continuous ambient temperature fluctuations. Therefore, traditional measurement methods still have inherent errors that need to be addressed.MethodsIn this paper, we propose an external field measurement method for target infrared radiance based on ambient temperature correction. During the calibration phase, a blackbody image is obtained using the close-range extended source method, and the ambient temperature is recorded simultaneously. The calibration equation is solved using the least squares method, establishing a relationship between the pixel gray response, target radiance, and ambient temperature of the infrared system. In the measurement phase, the blackbody image of a surface source with a known temperature is recorded, and the deviation between the retrieved and measured ambient temperature is calculated. By recording the target infrared image, ambient temperature, and atmospheric parameters, the measured value of the ambient temperature is corrected during the measurement process, improving the accuracy of target radiance measurements. The measurement method and process are shown in Figs. 2 and 3.Results and DiscussionsTo verify the feasibility and accuracy of the proposed method, external field calibration and verification experiments are conducted using a refrigerated infrared system. In the calibration experiment, both the traditional calibration method and the method incorporating ambient temperature correction are used. The infrared system has a response wavelength of 4040?4120 nm, 640 pixel×512 pixel, and an integration time of 1000 μs. The blackbody size is 700 mm×700 mm, with an emissivity of 0.98. Five temperature points are set at 75, 100, 125, 150, and 175 ℃, respectively. The ambient temperature is measured using a meteorological station with an accuracy of ±0.2 ℃. The original data are shown in Table 1. Four temperature points (75, 125, 150, and 175 ℃) are used for calibration fitting (Table 2), and the average relative error of the fitting results is calculated and compared (Fig. 4). In the validation experiment, the blackbody is imaged at a horizontal distance of 280 m from the infrared system (Fig. 5). The blackbody emissivity is 0.98, and temperatures of 70 ℃ and 90 ℃ are set alternately. The solar radiometer and ground weather station are placed next to the infrared system, and the blackbody temperature, blackbody image, ambient temperature, and atmospheric parameters (transmittance and path radiation) are recorded in real time (Fig. 6 and Table 3). One of the 70 ℃ and 90 ℃ blackbodies is used as the target for measurement, and the other served as the reference blackbody for ambient temperature correction. The radiance value and relative error of the 30 pixel×30 pixel region of the blackbody image are calculated pixel by pixel using the method proposed in this paper and compared with the direct calculation results based on the calibration equation (Table 4).ConclusionsIn the calibration experiment, the ambient temperature varies from 3.8 ℃ to 5.5 ℃, while in the validation experiment, the ambient temperature varies from 17.1 ℃ to 17.5 ℃. The average gray level of the blackbody image at 70 ℃ in the validation experiment is 3894.42, which is higher than that of the blackbody image at 75 ℃ in the calibration experiment (3317.8), indicating that the infrared system experiences temperature drift and the response relationship has changed. The results show that the relative error in the traditional direct calculation method is generally large, possibly due to significant changes in ambient temperature, changes in the infrared system state, and inaccurate coefficients in the original calibration equation. Compared with the traditional method, the direct calculation method that considers ambient temperature has an average relative error of 13.52%, improving accuracy. The method proposed in this paper, which includes ambient temperature correction, achieves an average relative error of 7.91%, a 5.61% improvement over the direct calculation method, and yields results closer to the actual target values. The method can provide a useful reference for conducting external field measurements and theoretical research on target infrared radiation characteristics.
Feb. 21, 2025Vol. 45 Issue 3 0312002 (2025)
Qimeng Li, Huige Di, Ning Chen, Xiao Cheng, Jiaying Yang, Shuicheng Bai, Jianhu Dou, Qing Yan, Shichun Li, Wenhui Xin, Yufeng Wang, and Dengxin Hua
ObjectiveMeteorological factors have a significant effect on the vertical distribution of aerosols, and the formation, accumulation, and dissipation of heavy pollution processes in winter are usually controlled by meteorological conditions. There is a high correlation between meteorological factors and the vertical structure of aerosols. Obtaining detailed evolution characteristics of meteorological factors is of great research value for studying the process of haze generation and dissipation. Among various meteorological factors, the vertical distribution of temperature plays a crucial role in the aggregation of aerosols in the boundary layer. Currently, ground meteorological stations, meteorological satellites, radiosondes, and microwave radiometers are the main means of detecting vertical temperature profiles, but none of them can achieve high spatiotemporal resolution detection of temperature profiles within the boundary layer. Rotational Raman lidar, as an effective technique for atmospheric temperature measurement, offers high temporal and spatial resolution, which is advantageous for studying atmospheric physical processes within the boundary layer during haze conditions. However, the system’s detection performance within the boundary layer is significantly affected by the inconsistency of the bottom detection blind zone and signal attenuation caused by aerosols within the boundary layer, as well as interference from elastic scattering. To enable atmospheric temperature measurements in the bottom layer of haze conditions, we propose a temperature correction technique based on the backscatter ratio. We hope to effectively obtain the vertical structure of atmospheric temperature within the boundary layer of haze weather through this technique, thereby providing data support for the refined study of atmospheric physical processes under haze conditions.MethodsThe core of this technique involves constructing a linear functional relationship between the backscatter ratio and the elastic scattering crosstalk ratio and using the backscatter ratio to correct the rotational Raman ratio. The consistency of the geometric overlap factor of the rotational Raman channels significantly affects the bottom detection performance of the lidar. Therefore, accurately obtaining the ratio of high and low quantum number rotational Raman channels is a prerequisite for implementing rotational Raman temperature measurements. First, we use experimental data under clear sky conditions without haze to calibrate the geometric overlap factor ratio of the rotational Raman channel signals. Then, we calibrate the inversion function using a radiosonde under simultaneous spatial conditions and obtain the theoretical Raman ratio within the haze layer based on the temperature data from the radiosonde. Based on this theoretical ratio and the rotational Raman ratio that includes elastic scattering crosstalk, we calculate the elastic scattering crosstalk ratio. We perform a linear regression analysis on both the backscatter ratio and the elastic scattering crosstalk ratio to derive the corresponding system calibration constant. Finally, using this calibration constant and the measured backscatter ratio, we complete the correction of the rotational Raman ratio, allowing for the retrieval of the true atmospheric temperature data in the elastic scattering region.Results and DiscussionsNumerical simulation results indicate that inconsistencies in the geometric overlap factor and the elastic scattering crosstalk can lead to retrieval biases in atmospheric temperature measurements within the boundary layer during haze events. After applying dual corrections for the geometric overlap factor and the rotational Raman ratio, the temperature retrieval bias is reduced to less than 0.2 K (Fig. 4). Experimental results show that the corrected temperature profile from the morning of of December 26, 2023 exhibits a high degree of consistency with the radiosonde data obtained under simultaneous spatial conditions, with a maximum temperature bias of less than 1.4 K, while the uncorrected temperature bias is up to 7 K (Fig. 8). On the evening of of December 24, 2023, the maximum temperature bias is less than 0.6 K, while the uncorrected temperature bias is approximately 4 K (Fig. 9). Additionally, continuous observation results clearly illustrate the vertical distribution of the temperature field. A comparison of the backscatter ratios of aerosols reveals a close correlation between the inversion temperature features and the vertical distribution of aerosols (Fig. 10).ConclusionsIn our study, we propose a temperature correction technique based on the backscatter ratio to achieve atmospheric temperature measurements within the bottom layer of haze conditions. Simulation and experimental results indicate that this technique can effectively achieve precise measurements of atmospheric temperature within the boundary layer during haze events, clearly illustrating the vertical structure of atmospheric temperature and the characteristics of inversion. Since the fundamental basis for temperature correction relies on the correlation between the elastic scattering crosstalk ratio and the backscatter ratio, it is crucial to accurately obtain the backscatter ratio and the rotational Raman ratio within the haze layer. Therefore, highly consistent preprocessing of the lidar echo signals is necessary. Additionally, the stability of parameters such as laser energy, the geometric overlap relationship of the light transmission and reception system, the elastic scattering suppression ratio of the rotational Raman channel, and the photoelectric conversion efficiency also influence the implementation of this technique. Variations in these parameters can directly affect system stability, thereby affecting the temperature correction results. Therefore, a lidar system with high stability is an essential prerequisite for conducting atmospheric temperature corrections. Any minor adjustments to system parameters necessitate a reevaluation of the system calibration. In summary, the introduction of this correction technique provides scientific data and technical means for studying atmospheric physical processes within the boundary layer during haze events, facilitating a detailed investigation and analysis of the formation and evolution characteristics of haze.
Feb. 21, 2025Vol. 45 Issue 3 0312003 (2025)
Xiaoqing Gao, Xing Yuan, Xingxing Zhang, Yu Ma, Dandan Ju, Shujing Liu, Tong Wei, and Yingdong Han
ObjectiveWith the increasing demands of industry and the requirement for precise temperature monitoring in harsh environments, the development of advanced temperature sensing technologies becomes extremely crucial. Traditional contact-based and slow-response thermometric methods cannot meet the real-time and non-invasive monitoring needs of modern applications. This growing need promotes the exploration of innovative materials for accurate, real-time, and non-invasive temperature sensing. Our research focuses on the synthesis and characterization of YSZ∶Yb/Tm nanophosphors, a new type of material with unique up-conversion luminescence properties. These nanophosphors, synthesized by a molten salt method, aim to provide a new solution for temperature sensing with high sensitivity and a wide dynamic range. The study explores the structural and luminescent properties of these nanophosphors to establish them as a reliable and effective tool for temperature measurement. The potential of these materials to revolutionize temperature sensing in various sectors is remarkable, providing a promising direction for further research and practical application development.MethodsThe synthesis of YSZ∶Yb/Tm nanophosphors starts with dissolving accurate amounts of zirconium, yttrium, ytterbium, and thulium salts in deionized water, followed by adding sodium chloride (NaCl) as a molten salt medium. The mixture is dried at 80 ℃ to remove water and form a solid precursor and then calcined at 900 ℃ for 3 h within a furnace. After calcination, the product is thoroughly washed to remove residual NaCl and then dried to obtain YSZ∶Yb/Tm nanophosphides. After synthesis, the nanophosphors are characterized to evaluate their structural and luminescent properties. X-ray diffraction (XRD) is used to determine the crystalline phase and structure while scanning electron microscopy (SEM) and energy-dispersive X-ray (EDX) spectroscopy are employed to examine the morphology and elemental distribution of the particles. The up-conversion luminescence properties are investigated using a fluorescence spectrometer under 980 nm laser excitation, and the temperature-dependent luminescence is measured in the temperature range of 303?573 K to assess the potential of these nanophosphors for temperature sensing applications.Results and DiscussionsThe synthesized YSZ∶Yb/Tm nanophosphors show a uniform cubic phase structure with good crystallinity, which is verified by XRD analysis. The diffraction patterns match well with the standard cubic phase YSZ (JCPDS No. 30-1468), indicating the successful doping of Yb3+ and Tm3+ ions into the YSZ lattice without additional phases [Figs. 1(a), (b)]. The SEM image shows the microscopic morphology of the phosphor, and the particles tend to aggregate into larger clusters due to the large surface energy of the nanoparticles [Fig. 1(d)]. EDX analysis confirms the uniform distribution of doped elements in the matrix, ensuring efficient energy transfer processes within the nanophosphors [Fig. 1(e)]. Under 980 nm laser excitation, the up-conversion luminescence spectra show emissions at 489 nm (blue) and 690 nm (red), corresponding to the 1G4→3H6 and 3F2,3→3H6 transitions of Tm3+, respectively [Fig. 3(a)]. These emissions result from the energy transfer from Yb3+ ions (sensitizers) to Tm3+ ions. The up-conversion mechanism involves a multiphonon-assisted energy transfer process, where Yb3+ ions absorb photons from the 980 nm laser and transfer energy to Tm3+ ions through a series of multiphonon processes [Fig. 3(b)]. The temperature-dependent luminescence tests display a fluorescence quenching effect for the blue emission band, while a thermally enhanced effect is observed for the red emission band [Fig. 5(a)]. This phenomenon is due to the temperature-dependent energy transfer efficiency between Yb3+ and Tm3+ ions, which is affected by the thermal population of energy levels and multiphonon relaxation processes. The integral intensity ratio of the red to blue emission peaks shows significant temperature sensitivity, with the maximum relative sensitivity of 1.10 %/K and absolute sensitivity of 31.55 %/K achieved at 423 K and 573 K, respectively (Fig. 6). These results demonstrate the potential of YSZ∶Yb/Tm nanophosphors for high-sensitivity temperature sensing. The temperature sensing performance is further analyzed by plotting the fluorescence intensity ratio (FIR) of the red and blue emission peaks against temperature. A nonlinear relationship is observed and fitted to a polynomial curve, revealing the material’s ability to sense temperature changes over a wide range [Fig. 6(a)]. The calculated absolute and relative sensitivities quantitatively measure the material’s performance as a temperature sensor, with the highest sensitivities obtained at the extreme temperatures tested [Fig. 6(b)]. These findings are important for the development of temperature sensors that can work in harsh environments where traditional contact-based sensors may fail or give inaccurate readings.ConclusionsOur study has successfully synthesized YSZ∶Yb/Tm nanophosphors with excellent up-conversion luminescence properties, indicating their potential as highly sensitive temperature sensors for a wide range of applications, especially in extreme environments. The nanophosphors, synthesized by an efficient molten salt method, possess a uniform cubic phase structure with good crystallinity, which is essential for their superior luminescent properties. The up-conversion luminescence characteristics of these nanophosphors have been carefully studied, showing a unique temperature-dependent behavior where the blue emission undergoes fluorescence quenching and the red emission exhibits an unusual thermal enhancement. This phenomenon is caused by the complex interaction between Yb3+ and Tm3+ ions, affected by multiphonon relaxation processes and thermal population dynamics. The temperature sensing capabilities of the YSZ∶Yb/Tm nanophosphors are outstanding, with the maximum relative and absolute sensitivities of 1.10 %/K and 31.55 %/K respectively. These results emphasize the potential of these materials for high-precision, non-contact temperature monitoring in various industries such as aerospace, medical diagnostics, and industrial process control, where accurate temperature measurement is crucial. The results of this study contribute to the progress of luminescence-based temperature sensing technologies and open new paths for future exploration and innovation in this field.
Feb. 21, 2025Vol. 45 Issue 3 0316001 (2025)
Minhao Li, Zhuojun Xie, Yang Tang, and Jiaying Xiao
ObjectivePhotoacoustic/ultrasonic dual-modal endoscopic imaging enables high-penetration depth molecular imaging in biological cavities, such as the digestive tract, showing promising clinical applications. However, the compact structure of the miniature endoscopic probe makes it susceptible to electromagnetic interference (EMI), significantly affecting its imaging sensitivity and resolution. Currently, the most effective solution is to reduce EMI through averaging, but this approach incurs significant time overhead and sacrifices the system’s temporal resolution, limiting the functional imaging capabilities of photoacoustic imaging technology. Therefore, we propose two neural network-based denoising models, Aline-CNN and Aline-UNet, designed for photoacoustic waveform data, which can effectively remove electromagnetic interference from the acoustic waveform signals collected by photoacoustic/ultrasonic endoscopy (PAE/USE). Test results based on simulated photoacoustic images show that the structural similarity index (SSIM) between the denoised photoacoustic images processed by Aline-CNN and Aline-UNet and the original simulated images (ground truth) is 0.9515 and 0.9569, respectively. Furthermore, these models perform excellently on in vivo rabbit rectum imaging data. Compared to reference images, the SSIM values are 0.8239 and 0.8589, respectively. This novel denoising method can significantly reduce the number of acquisitions required and shorten the data acquisition time, thus advancing the clinical development and application of photoacoustic/ultrasonic endoscopic technology.MethodsWe propose deep learning-based denoising models, Aline-CNN and Aline-UNet, which utilize PAE/USE acoustic waveform data as input. Compared to denoising networks that use B-mode images as input, the proposed model strategy extracts more effective features from a smaller dataset, thus improving the performance of the final trained model. In addition, Aline-CNN, as a lightweight version of Aline-UNet, maintains high denoising performance while offering the potential for quick integration into the front-end of an acquisition system, improving data acquisition speeds. In this paper, we compare the proposed models with traditional denoising methods, such as wavelet filtering and singular value decomposition, as well as conventional two-dimensional networks like UNet-2D and Wave-UNet. The models’ performances are evaluated using metrics such as structural similarity (SSIM) and peak signal-to-noise ratio (PSNR). Moreover, we also train and test the models on in vivo PAE/USE data from rabbit rectums.Results and DiscussionsUsing pure simulated lead-core photoacoustic data as the ground truth, we perform denoising using wavelet transform, singular value decomposition, Unet-2D, Wave-UNet, Aline-UNet, and Aline-CNN after adding the system’s pure noise signal. Among these methods, wavelet filtering effectively suppresses background noise but requires manual adjustment of filtering thresholds. In addition, it struggles to effectively suppress signals in the noise that are similar in amplitude and frequency to the effective signal, which may result in loss of useful information during the filtering process. Singular value decomposition significantly suppresses background noise while preserving signal details. However, selecting the singular value threshold still requires manual intervention, and the data volume for denoising is large, with high memory overhead. Furthermore, some noise that overlaps with the effective signal is difficult to suppress. In contrast to traditional denoising algorithms, the four deep learning models tested in this paper can effectively suppress or even eliminate background noise that does not overlap with the signal of interest. Nearly all background noise that does not overlap with the signal of interest is removed, demonstrating the considerable potential of deep learning in medical image denoising. Among the four models, UNet-2D, as a two-dimensional denoising network, appears more natural in two-dimensional visualization and preserves better structural information than the one-dimensional models, but it loses more amplitude information. Wave-UNet, Aline-UNet, and Aline-CNN perform similarly, with better preservation of amplitude information compared to the reference image. However, compared to Wave-UNet and Aline-UNet, Aline-CNN shows slightly rougher edge details of the lead core, and all three models lose details in areas where high-amplitude noise overlaps with the signal. Notably, under the same configuration conditions, the one-dimensional models (Aline-UNet and Aline-CNN) achieve better suppression of noise signals than the two-dimensional model, UNet-2D, with significantly lower memory and time costs. Specifically, Aline-UNet’s memory overhead is only 0.5% of Wave-UNet’s, while its training time is reduced from 136 s to 49 s, maintaining denoising performance. Aline-CNN, with a more lightweight structure, has lower memory and time overheads, sacrificing only slight reductions in denoising performance, making it suitable for real-time deployment in frontend systems. In in vivo PAE/USE experiments on rabbit rectums, using an average of 60 images as the ground truth, Aline-CNN and Aline-UNet demonstrate significant advantages in preserving image details in PAE, clearly restoring the distribution of rectal wall blood vessels and displaying the continuous structure of bones and tendons surrounding rectal tissues in USE.ConclusionsIn this paper, we introduce improved Aline-CNN and Aline-UNet model-based denoising algorithms designed to remove electromagnetic interference during PAE/USE system acquisition. While CNN and UNet networks have been used for denoising photoacoustic B-mode images, this work is the first to suppress electromagnetic noise in the Aline time-domain waveform data from the PAE/USE system. Both simulation and in vivo experimental data demonstrate the denoising capabilities of the two models. In addition, we compare the electromagnetic noise interference removal capabilities of Aline-CNN and Aline-UNet. The results indicate that, after training the network with photoacoustic and ultrasound data collected by the experimental system and using SSIM as the evaluation metric, Aline-UNet slightly outperforms Aline-CNN in denoising, but Aline-CNN offers a more lightweight structure and faster processing speed. Furthermore, the proposed models effectively suppress electromagnetic interference in photoacoustic and ultrasound data with lower training costs. They eliminate the need for multiple averaging to suppress EMI, thus reducing PAE/USE acquisition time and enhancing the clinical value and development prospects of PAE/USE endoscopy in life science research and clinical diagnosis. These models also provide insights for removing electromagnetic interference in other photoacoustic systems. However, although deep learning methods have demonstrated effectiveness in removing electromagnetic interference in the PAE/USE system, some limitations remain. The proposed models have only been validated in a limited number of experiments, and their generalization ability across different imaging algorithms and systems has not been fully explored. Future work will involve acquiring more datasets to further enhance the models’ generalization capabilities.
Feb. 19, 2025Vol. 45 Issue 3 0317001 (2025)
Xinru Bai, Shilei Jiang, Xiaolin Dang, Xuelian Liu, Da Xie, Bo Wang, Xiaowei Chen, and Xuhang Gong
ObjectiveTo improve the effect of augmented reality (AR), the head-up display system (HUD) needs a larger field of view (FOV) and a longer projection distance, requiring the image source to have a larger display size, and the resolution must be kept clear and visible under the expanded FOV. The current mainstream technology is still flat-panel display technology, but its development is constrained by the contradictory relationship between brightness and power consumption, the lighting area and module volume. For liquid crystal display (LCD) backlight modules, studies support independent research and development of large-size LCD image source technology and reduce the volume of image source modules, which is of great significance to future AR projection technology. Therefore, based on the fact that improving the interactive effect of AR-HUD requires a larger projection image source, we study and design relevant methods on how to improve the brightness and uniformity of the backlight module and achieve the development of low-cost and large-size image source backlight modules.MethodsSince the illumination distribution of light emitting diode (LED) point light sources is approximately Gaussian, the illumination distribution of a certain point on the illuminated surface after the superposition of multiple point light sources can be solved by referring to the Gaussian mixture model. We employ a nonlinear constraint algorithm to quickly solve the optimal uniform light distance of the array light source on a certain target surface, which greatly saves time for spacing optimization. According to the principle of total reflection, we propose a turning light stick based on the traditional conical light stick structure. As the reflection number of the light beam in the front conical stick increases, the angle with the optical axis becomes increasingly smaller, which can reduce the numerical aperture of the light beam. To further reduce the volume of the backlight module, we propose an asymmetric turning light stick structure, and the Monte Carlo grid division method is adopted to optimize the energy distribution of the turning light stick on the target surface. During the optimization, a Fresnel lens with a cylindrical front surface and a spherical rear surface microstructure is designed to make the power reach the peak within a given angular aperture and maximize the light intensity.Results and DiscussionsWe utilize the maximum uniform light interval solution method of the array light source to quickly solve the 2×12 rectangular LED array arrangement (Fig. 2). After the design is completed, the backlight intensity toe distribution is first evaluated. The simulation results show that the backlight spatial illumination presents sharp and clear rectangular distribution, with the spatial light efficiency of 0.811 (Fig. 11). Meanwhile, the average brightness of the simulated backlight reaches 1.06×10⁶ cd/m2, the brightness of the backlight light-emitting surface is evenly distributed, and there is no brightness or illumination mutation, with the luminous area reaching 123 mm×42 mm (Fig. 12). The backlight module is spliced with the HUD, the simulated virtual image brightness is greater than 1×10⁴ cd/m2 (Fig. 13), and the simulated average color temperature of the virtual image is 6504.3 K (Fig. 14), which meets the design requirements. Additionally, a system feasibility verification analysis is conducted, the average brightness of the backlight emitting surface is measured to be greater than 1×10⁶ cd/m2, and the overall uniformity is greater than 86% (Fig. 15), with the simulated virtual image brightness and the power values of the two types of light and heat radiation incident on the LCD screen given. As the backlight driving power changes between 1 W and 25 W (Fig. 17), the backlight can be employed normally within this power range, and the backlight brightness can be adjusted later according to usage requirements and with reference to this curve.ConclusionsWe propose a method for quickly calculating the optimal uniform light distance of an array light source on a certain target surface. This method can be utilized to build the uniform light model of most rectangular array LED, which has high universality. To improve the design flexibility, we adopt the turning light stick structure, and the size of the light outlet can be changed according to the usage requirements to adapt to the design and development of liquid crystal image sources of different sizes. Then, the non-microstructure surface of the ordinary Fresnel mirror is designed as a cylindrical surface, which improves the collimation of the light under the extended light source. The light outlet surface of the backlight system reaches 5.1 inch (12.95 cm), the average backlight brightness is 1.06×10⁶ cd/m2, and the uniformity reaches 88.7%. The difference between the measured data and the simulation results of the final backlight brightness is within 0.4%. Finally, the backlight and HUD system are spliced to simulate the virtual image brightness. The simulation results show that the virtual image brightness is greater than 1×10⁴ cd/m2, the target surface brightness uniformity reaches 85.1%, and the virtual image color temperature simulation average value is 6504.3 K. The research and development of a low-cost large-size image source backlight module has been realized. The design method has certain inspiration for the design of backlight sources of other sizes and has great practical application significance.
Feb. 20, 2025Vol. 45 Issue 3 0322001 (2025)
Leling Jin, Jian Wang, Dazhou Zeng, Yajun Zhang, Wei Pu, Mao Luo, Yinxu Bian, Cuifang Kuang, and Xu Liu
ObjectiveModern industries increasingly demand large-aperture, high numerical aperture (NA) optical systems, such as high-throughput lithography objectives, astronomical imaging systems, and inertial confinement fusion setups. Large-aperture optical components are widely used in these applications. For high-precision optical surface testing, point diffraction interferometers use microscale structures to produce near-ideal diffracted spherical waves, making them more suitable than Fizeau or Twyman-Green interferometers. Two common methods, dual-fiber point diffraction and reflective pinhole point diffraction, are used to increase NA. However, the dual-fiber method is limited by the NA of the fiber, while the reflective pinhole method achieves higher NA but requires separation of the test and reference beams, which restricts the aperture and NA of the test mirror. In addition, reflective pinhole interferometers place both the imaging path and the test mirror outside the main interferometer body, necessitating the alignment of both components, which increases the complexity and time required for setup. For large-aperture component testing, longer interferometric cavities are more susceptible to environmental disturbances such as air turbulence, affecting the reliability of conventional temporal phase-shifting methods (e.g., piezoelectric or wavelength shifting). In this paper, we propose a point diffraction transient interferometer for large-aperture optical surface testing, designed to increase the interferometer’s NA, enable precise large-aperture measurements, and mitigate environmental disturbances associated with long interferometric cavities. This approach aims to support the development of new large-aperture point diffraction interferometers.MethodsIn this paper, we integrate dual-fiber and pinhole point diffraction techniques, utilizing a 45° pinhole plate to generate reference and test beams with an NA of 0.5 from different directions of the same pinhole. Synchronous phase-shifting using spatial polarization is employed, where a polarization camera array captures four phase-shifted interference images in a single acquisition, enabling direct surface measurement. The telecentric imaging path design allows the interferometer to gather mid-to-low frequency surface information effectively. To address convex surface testing, the Hindle sphere method is used to convert convex surface measurement into concave surface measurement, simplifying the testing of large-aperture convex surfaces. A beam-splitting prism is also incorporated for alignment, ensuring precise positioning of the test mirror.Results and DiscussionsUsing the same pinhole to generate independent reference and test beams, the design achieves a wavefront error root mean square (RMS) below 0.01λ within 500 μm of the pinhole at NA=0.5. Comparisons between circular and elliptical pinholes show that the wavefront error for elliptical pinholes is 2?3 times higher. Further analysis indicates the optimal minor axis length for elliptical pinholes is 0.6 μm, with minimal sensitivity to deformation and angle-of-incidence deviations, supporting the feasibility of the elliptical pinhole approach (Fig. 3). The polarization camera array, comprising four polarizers oriented at 0°, 45°, 90°, and 135°, enables single-shot four-step phase-shifting, reducing environmental effects such as air turbulence and vibrations. The telecentric imaging path, with a F-number of 0.0625 and a magnification of 1.75, achieves wavefront error RMS values of 0.0003λ at the center and 0.0012λ at the periphery of the field of view. This design, with its large depth of field and low distortion, achieves a resolution frequency of 16 mm-1 for mid-frequency measurements and a negligible distortion rate of 0.0045% (Fig. 5). The Hindle sphere is used to measure a convex spherical surface with a diameter of 200 mm and a radius of curvature of 600 mm. The high-order aspheric, with an aperture of 409.8 mm, demonstrates a wave aberration RMS below 0.001λ, validating the potential of the proposed interferometer for large-aperture convex surface testing (Fig. 6). Furthermore, the alignment path, featuring switchable low- and high-magnification objectives, provides both coarse and fine adjustment capabilities. A field of view of 1.82 mm and an alignment accuracy better than 0.7 μm are achieved, ensuring practical and precise adjustment of the test mirror.ConclusionsTo address the requirements of large-aperture surface testing, we combine dual-fiber and pinhole point diffraction methods, generating NA=0.5 reference and test beams from a single pinhole positioned at a 45° angle. Using the spatial polarization synchronous phase-shifting method, the system captures four phase-shifted interference images in a single acquisition, enabling accurate surface measurements while mitigating environmental disturbances. The telecentric imaging path enhances mid-to-low frequency measurement capabilities, achieving a resolution of 16 mm-1 and a distortion rate of 0.0045%, ensuring precise measurements. The Hindle sphere method transforms convex surface measurement into concave surface measurement, allowing point diffraction interferometers to effectively measure convex surfaces. In addition, an alignment path with a field of view of 1.82 mm and an accuracy of 0.7 μm enhances the precision of test mirror alignment. Consequently, the proposed point diffraction interferometer design fulfills diverse large-aperture surface measurement requirements, delivers accurate mid-to-low frequency data, and streamlines operation.
Feb. 19, 2025Vol. 45 Issue 3 0322002 (2025)
Yonglin Yin, Zhuang Wang, Li Liang, Zi Wang, Qibin Feng, and Guoqiang Lü
ObjectiveAn acousto-optic deflector is an important optical component that works based on the acousto-optic effect, and plays a great role in laser scanning systems due to its excellent performance. The bandwidth is an important performance indicator for acousto-optic deflectors and determines the operating frequency range of these devices. Conventional acousto-optic deflectors of single transducer are simple and easy to fabricate. However, these devices have a limitation in operating bandwidths. The main acoustic beams in the acousto-optic deflectors of single transducer are fixed under changed driving frequency, resulting in a narrow bandwidth. By increasing the number of transducers, the direction of the main acoustic beam can be changed with the frequency to improve the operating bandwidth of the acousto-optic deflector. Meanwhile, other methods should be investigated to further improve the bandwidth of acousto-optic deflectors and maintain high diffraction efficiency.MethodsWe propose a method to both increase the bandwidth of the acousto-optic deflector and maintain high diffraction efficiency. In the aspect of the Bragg bandwidth, the acousto-optic deflector of two transducers with delay lines has a phase difference with frequency, and the main acoustic beam can track the Bragg angle to improve the bandwidth. First, the relationship between the incident angle, center distance and tracking frequency in the acousto-optic deflector of two transducers with delay lines can be obtained based on the principle of acoustic beam steering. Then, the Bragg bandwidth model in the acousto-optic deflector of two transducers with delay lines is built based on the theory of Bragg loss. Finally, the acoustic energy utilization in the Bragg bandwidth model of the acousto-optic deflector of two transducers with delay lines is enhanced by adjusting the tracking frequency position, with a reasonable balance between the diffraction efficiency and the bandwidth realized. In the aspect of the transducer bandwidth, the sandwich matching layer model is proposed to increase the transducer bandwidth. First, the matching layer material is selected according to the theory of acoustic impedance matching and the conditions of actual sputtering. Then, based on the theory of transmission lines and Mason’s equivalent circuits, the matching layer can be considered as the transmission matrix to calculate the transducer bandwidth. Finally, considering the adhesive strength of the bonding layers and the thinning work of the piezoelectric layers, the matching layer thickness is controlled within a certain range in our study, and the effect of the variation in the matching layer thickness on the transducer bandwidth is studied. Meanwhile, the bandwidth of the acousto-optic deflector of the single transducer based on the traditional single matching layer, and the bandwidth of acousto-optic deflectors of the single transducer, two transducers, and two transducers with delay lines based on the sandwich matching layers are experimentally tested in our study to further verify the effect of the bandwidth.Results and DiscussionsDue to the fixed main acoustic beam, when the frequency changes, the acoustic energy in the acousto-optic deflector of the single transducer decreases rapidly under changed frequency [Fig. 7(b)], leading to a narrower 3 dB bandwidth (Fig. 14). The acousto-optic deflector of two transducers yields two energy-symmetric acoustic beams in the acousto-optic crystal due to a fixed phase difference of π [Fig. 2(b)]. Since Bragg diffraction employs only one of the acoustic beams, the acoustic energy utilization in the acousto-optic deflector of two transducers is lower [Fig. 7(c)]. The acoustic energy in the acousto-optic deflector of two transducers with delay lines is not symmetrically distributed. Most of the acoustic energy is concentrated in the +1 order acoustic beams [Figs. 6(d)?(f)], which improves the acoustic energy utilization over the acousto-optic deflector of two transducers [Fig. 7(c)]. In the aspect of the Bragg bandwidth, the traditional Bragg bandwidth is designed for a large 3 dB Bragg bandwidth, but it causes lower acoustic energy utilization [Fig. 7(a)]. In contrast, we improve the acoustic energy utilization in the Bragg bandwidth model of the acousto-optic deflector of two transducers with delay lines [Fig. 7(a)], which allows the acousto-optic deflector of two transducers with delay lines to increase the 3 dB Bragg bandwidth and ensure the acoustic energy utilization [Fig. 7(b)]. In the aspect of the transducer bandwidth, the sandwich matching layers provide a larger 3 dB transducer bandwidth, and it is less affected by the variation in the matching layer thickness [Fig. 9(b)]. Experiments on acousto-optic deflectors have shown that the sandwich matching layers improve the 3 dB bandwidth by 14% over the traditional single matching layers (Fig. 14). While keeping the peak diffraction efficiency, the acousto-optic deflector of two transducers with delay lines improves the 3 dB bandwidth by 25% over the acousto-optic deflectors of single transducer and by 7% over the acousto-optic deflector of two transducers (Fig. 14). As a result, with the peak diffraction efficiency maintained, the acousto-optic deflector of two transducers with delay lines based on the sandwich matching layers improves the 3 dB bandwidth by 43% over that of the single transducer based on the traditional single matching layer (Fig. 14). To increase the bandwidth of the acousto-optic deflector even further, we should design a larger transducer bandwidth to provide a wider frequency range of electro-acoustic energy conversion, with the specific device and the actual process conditions taken into account. Additionally, the effect on the bandwidth of the acousto-optic deflectors should be verified via experiments.ConclusionsThe 3 dB bandwidth of the acousto-optic deflector is improved in the aspects of the Bragg bandwidth and transducer bandwidth. In the aspect of the Bragg bandwidth, we analyze the acoustic beam steering in the acousto-optic deflector of two transducers with delay lines, propose a method that takes the diffraction efficiency and the bandwidth into account, and build a Bragg bandwidth model in the acousto-optic deflector of two transducers with delay lines. In the aspect of the transducer bandwidth, our study designs the sandwich matching layers according to the acoustic impedance matching theory and actual sputtering conditions to improve the transducer bandwidth. Simulations and experiments show that the developed acousto-optic deflector of two transducers with delay lines broadens the operating bandwidth while ensuring peak diffraction efficiency. Compared with the traditional single matching layers, the proposed sandwich matching layers improve the operating bandwidth of the acousto-optic deflector. Finally, the acousto-optic deflector of two transducers with delay lines based on the sandwich matching layers helps yield a significant improvement in the operating bandwidth.
Feb. 21, 2025Vol. 45 Issue 3 0323001 (2025)
Fanghao Li, Piaopiao Deng, Lijun Jiang, Shijie Liu, Wanjiao Zhang, Quanchao Lü, Chuanjie Zhang, and Liang Chen
ObjectiveAs society advances towards greater intelligence, functionality, and miniaturization, civilian-grade room-temperature high-precision miniature infrared detectors are increasingly gaining attention. These detectors are expected to feature in electronic devices such as smartphones, smart bracelets, and smart glasses, enabling significant applications in human health monitoring and environmental detection of toxic and harmful gases. Micro-electro-mechanical system (MEMS) infrared thermal detectors are favored for small size, low power consumption, broadband response, and ability to operate at room temperature without requiring cryogenic cooling. However, current room-temperature infrared detectors typically achieve a detectivity of around 1010 Jones, with noise equivalent temperature difference (NETD) values rarely below 20 mK. Improving the photo-thermal coupling efficiency is essential for enhancing detector sensitivity. Leveraging optical metasurfaces and metamaterials, researchers have developed localized optical-mechanical field control technologies that regulate the spectral, phase, and polarization characteristics of electromagnetic waves. These approaches effectively enhance the photo-thermal coupling efficiency. However, further research is needed to refine the underlying mechanisms of photo-thermal-mechanical conversion and improve performance.MethodsIn this paper, we investigate the mechanism of weakly coupled optical-mechanical regulation and mode localization for room-temperature high-sensitivity infrared thermal detection. By combining optical and mechanical localized field regulation, a novel optical-thermal-mechanical-electrical conversion is proposed. Enhanced optical absorption due to localized field effects is amplified through mechanical nodal localization, enabling high-sensitivity infrared spectral detection. This approach addresses the low sensitivity of conventional thermal detectors and achieves high-sensitivity, low-noise infrared detection under room-temperature conditions. Efficient coupling between electromagnetic and mechanical resonances is achieved, and weak coupling of localized resonant modes enables the conversion of optical perturbation signals into highly sensitive responses through modal amplitude shifts.Results and DiscussionsThe proposed detector demonstrates three district electromagnetic resonance absorption peaks within the wavelength range of 5 to 16 μm, with absorption rates of 82.4% (6.0 μm), 97.3% (9.3 μm), and 86.5% (11.7 μm), respectively (Fig. 2). The results also indicate that for both TE and TM electromagnetic waves, high absorption rates are maintained across varying incident angles, demonstrating excellent angular insensitivity (Fig. 4). When external thermal stress disturbances increase, the resonator’s stiffness decreases, leading to changes in modal amplitude. For the first resonator, the first-order modal amplitude decreases while the second-order amplitude increases, signaling a shift in vibrational energy indicative of modal localization. In the second resonator, modal amplitudes remain largely unchanged but gradually diminish as external disturbances increase, confining vibrational energy to specific modes. This modal distribution, characteristic of localization (Fig. 5), effectively transforms optical perturbation signals into highly sensitive responses through modal amplitude shifts. The sensing sensitivity exceeds -4.4736 mW-1 (Fig. 6), representing a nearly three-order-of-magnitude improvement over the traditional frequency shift method (-0.0073 mW-1) under similar conditions. This innovative detector design is expected to drive the development of ultra-sensitive uncooled infrared detectors for applications in wearable devices such as smartphones, smart bracelets, and smart glasses.ConclusionsIn this paper, we propose a highly sensitive MEMS infrared thermal detector based on the mode localization optical-mechanical weak coupling mechanism. The detector utilizes a metasurface infrared absorber composed of a patterned metal-dielectric-metal nanostructured titanium array, amorphous silicon dielectric, and titanium metal layers, achieving enhanced localized field absorption over a broad wavelength range (5 to 16 μm). A two-degree-of-freedom weakly coupled micro-mechanical cantilever resonator is designed, leveraging the modal localization mechanism to include significant modal amplitude shifts in response to infrared radiation. Theoretical analysis reveals that the modal localization effect confines mechanical energy within specific resonant modes, and stiffness disturbances caused by infrared radiation trigger substantial amplitude shifts, thus achieving ultra-high detection sensitivity. At the second-order resonant mode, the detection sensitivity reaches approximately -4.4736 mW-1, a 613-fold improvement over the traditional frequency shift method (-0.0073 mW-1). The method provides a new approach for enhancing MEMS infrared thermal detector sensitivity. Our approach is expected to facilitate highly sensitive infrared spectral detection at room temperature, with broad applications in wearable electronics and smart sensor systems.
Feb. 20, 2025Vol. 45 Issue 3 0323002 (2025)
Qiongchan Gu, and Ruizhe Zhang
ObjectiveMetasurfaces are highly valuable for their unique electromagnetic properties. Since the introduction of the generalized Snell’s law, metasurfaces have seen significant applications across various fields. However, the inverse design of metasurfaces has remained a major challenge. Solving the coupling problem between parameters and finding the unit structure that most closely matches the target light field are key steps in metasurface applications. With the development of deep learning, neural network algorithms have demonstrated strong computational capabilities. Although many neural network architectures have been applied to metasurface inverse design due to their convenience, there is still significant room for improvement in terms of design accuracy, computational speed, and handling of parameter coupling. In this paper, we present an innovative improvement to the traditional residual network (ResNet) and analyze its application in metasurface inverse design by comparing different architectures. We design a unit structure that can effectively control both the amplitude and phase of the light field at a frequency of 1 THz. The fabrication of this structure can be compatible with semiconductor manufacturing technologies. We apply the improved ResNet architecture to the metasurface design process to address the parameter coupling problem inherent in metasurface inverse design. This approach demonstrates a strong practical effect, with fast speed and high precision. In addition, we compare the differences caused by various residual blocks in detail and verify the proposed method through the design of a focusing metasurface.MethodsThe metasurface unit structure consists of three parts (Fig. 1): an open-ring cylinder made of silicon material, a silicon cylinder, and a square silicon dioxide substrate. This unit structure has a total of eight parameters: q1 and q2 regulate the opening angle of the open-ring cylinder; W is the thickness of the open-ring cylinder; R1 is the maximum diameter of the open-ring cylinder; R is the radius of the cylinder; h1 is the height of both the cylinder and open-ring cylinder; h2 is the side length of the square substrate; h is the thickness of the square substrate. Among these parameters, h2 and R1 are set to fixed values based on the overall proportions of the unit structure during the sweeping process. Through testing, we determine that h2 is 100 μm and R1 is 79.89 μm. Since the thickness W of the ring has minimal influence on the light field control, it is fixed. The height h1 of the nanopillar is set uniformly to 100 μm, and the thickness h of the square substrate is fixed at 10 μm. We primarily focus on the three parameters: R, q1, and q2. The core ResNet architecture consists of a fully connected layer and an activation function layer. Each residual block contains four hidden layers. The fully connected layer, linked to the output vector of the residual block, has an activation function, with a rectified linear unit (ReLU) function applied in the two fully connected layers. The final fully connected layer serves as the output layer, and the output data is two-dimensional. Unlike previous ResNet architecture, this design does not include a convolutional layer, and the database used for ResNet training is based on the parameter sweeps of the unit structure designed in this paper. After 12000 sweeps, the resulting data fully meet the requirements for light field amplitude and phase coverage. We retain 6500 sets of data for neural network training, with an 80∶20 split for the training and test sets.Results and DiscussionsThe metasurface unit structure we designed demonstrates excellent control over right-handed circularly polarized (RCP) light. By adjusting just two parameters of the unit structure, the required amplitude and phase coverage for the inverse design of the metasurface can be achieved (Figs. 3 and 4). The dataset is generated based on the unit structure’s sweeping results. By improving the ResNet architecture (Fig. 5), we analyze the training performance of the neural network with different numbers of residual blocks. It is found that the design proposed in this paper achieves the best parameter decoupling effect when using three residual blocks (Table 1). Compared to the actual values of the unit structure parameters, the predicted values from the trained ResNet are within a small margin of error (Table 2). To further verify the effectiveness of the method, we design a metalens based on the output data from the trained ResNet. The designed metalens exhibit the expected focusing effect (Fig. 10).ConclusionsWe propose a unit structure capable of covering and controlling the amplitude and phase of the RCP light field in the 1 THz range. To address the parameter coupling issue in the inverse design, we improve the residual architecture and apply it to this problem. The results show that the shallow ResNet model effectively handles data coupling. By using the optimal neural network architecture, we inversely design the metasurface, verifying the accuracy and feasibility of the method. The results demonstrate that the method is highly effective for metasurface inverse design, with the designed metasurface showing the expected focusing effect and high focusing efficiency. This work provides a valuable reference for the inverse design of optical metasurfaces and has potential applications in light field wavefront manipulation.
Feb. 10, 2025Vol. 45 Issue 3 0324001 (2025)
Tao Ma, Liping Liu, and Xuehong Sun
ObjectiveIn this paper, we propose the design of a novel encoded metasurface for terahertz wavefront regulation. By employing an optimization algorithm to determine the optimal arrangement of elements, the proposed approach achieves significant broadband radar cross-section (RCS) reduction and high-quality holographic image reconstruction. This paper provides a practical and efficient means for THz wavefront control while highlighting the potential of coded metasurface technology in electromagnetic wave regulation. In applications such as radar stealth and wireless communication, reducing RCS and achieving high-resolution imaging are of critical importance. Consequently, this research holds significant scientific and practical value in advancing related technologies. In addition, by comparing with existing literature, this paper demonstrates the advantages of the designed coded metasurface in terms of design simplicity, broadband performance, RCS reduction, and holographic image reconstruction. These findings not only serve as a valuable reference for the academic community but also offer practical solutions for industrial applications, emphasizing their dual scientific and technological importance.MethodsThe research methodology involves the design and optimization of a coded metasurface for terahertz wavefront control using intelligent algorithms. A 2-bit coded metasurface for the terahertz band is proposed, leveraging the geometric phase principle and diffuse reflection theory to design a 2-bit coded superunit. The optimal arrangement of these elements is determined through an optimization algorithm to achieve broadband RCS reduction. For holographic imaging, based on the PB geometric phase principle, interference theory, and diffraction theory, four basic 2-bit coding elements are used to create the optimal phase layout through an optimization algorithm. This approach achieves a reduction of the RCS by more than 10 dB, up to 30.5 dB, across the 0.8?1.8 THz range, maintaining stable performance across incident angles from 0° to 40°, and enables high-quality holographic image reconstruction. To achieve these objectives, the genetic algorithm (GA) is employed to optimize the array layout, mimicking the natural selection to reduce RCS. For phase layout optimization, the Gerchberg-Saxton (GS) algorithm is used, combining iterative Fourier transforms and error calculation to restore high-quality holograms. MATLAB calculations and CST simulation tools are employed to ensure consistency and accuracy between theoretical and simulated results. This combination of methods demonstrates an efficient terahertz wavefront modulation technique, complementing existing solutions for radar stealth and holographic imaging technologies.Results and DiscussionsIn this paper, we propose a novel coded metasurface for the terahertz band, achieving significant innovations. First, a double-cup-shaped coded metasurface element is introduced, characterized by simplicity, efficiency, and flexibility (Figs. 1 and 2). The phase and amplitude-frequency characteristics under different rotation angles are analyzed (Fig. 3). Four 2-bit coded superunits are designed (Fig. 4), and their optimal arrangement is determined through an optimization algorithm, resulting in notable broadband RCS reduction (Fig. 6). In the 0.8?1.8 THz range, RCS is reduced by more than 10 dB, with a maximum reduction of 30.5 dB (Figs. 7 and 8), and stable performance is maintained across incident angles from 0° to 40° (Figs. 9 and 10). Moreover, the GS algorithm optimizes phase layouts, enabling high-quality holographic imaging with accurate reconstruction (Figs. 12 and 13). These results highlight the effectiveness of coded metasurfaces for terahertz wavefront modulation. Using intelligent optimization algorithms, including GA and GS, we identify the most effective arrangements for RCS reduction and holographic imaging, achieving enhanced performance and efficiency. Preliminary MATLAB calculations, followed by CST simulations, confirm the consistency and accuracy of the results. This paper not only introduces a novel coded metasurface in theory but also demonstrates its practical potential in the terahertz band through simulation, revealing broad application prospects.ConclusionsThe coded metasurface designed in this paper achieves effective wavefront control in the terahertz band, offering significant application potential. By designing metasurface units capable of producing a phase difference of nearly 180° across a wide frequency band and maintaining an amplitude of 0.8 or higher, the metasurface demonstrates robust performance. Using phase gradient-based superunits, the array layout is optimized through intelligent algorithms, confirming effectiveness under varying polarizations and incidence angles. This leads to successful RCS reduction, with a maximum reduction of 30.5 dB across 0.8?1.8 THz and stable performance within incident angles of 0° to 40°. In addition, GS-based phase layout optimization achieves high-quality holographic imaging. Overall, this paper enhances the simplicity and broadband performance of existing technologies while offering new solutions for radar stealth and holographic imaging, demonstrating the significance of coded metasurfaces in electromagnetic wave regulation.
Feb. 21, 2025Vol. 45 Issue 3 0324002 (2025)
Zhihong Xu, Schoenhardt Steffen, Xi Chen, Min Gu, and Goi Elena
ObjectiveIn the past few decades, artificial intelligence (AI) algorithms have been applied in various fields. Among them, neural network algorithms have become the common paradigm of modern AI and have achieved remarkable achievements in image recognition, natural language processing, speech recognition, and recommendation systems. However, the training process of these digital neural networks demands a large amount of time and energy. Therefore, optical computing solutions, with their multidimensional, high-speed, and low-energy advantages, have become a popular research area in AI applications. Extreme learning machine (ELM) is a machine learning paradigm where most connections in the model are established through randomly initialized nonlinear hidden nodes, and only a small part of the weights are adjusted during training after down-sampling. The advantage of this model is that it significantly reduces the training time as it replaces the time-consuming backpropagation with simple ridge regression. Nevertheless, in digital ELMs, the model performance heavily depends on the number of nodes in the hidden layer, which may lead to large memory consumption. To address this problem, we propose an optical extreme learning machine (optical ELM) by implementing random projections in the free-space propagation and investigating the effect of defocus on optical ELM. The optical aberrations, errors, and defects existing in the experimental process act as random components in the optical ELM, corresponding to the random transmission matrix in the digital ELM. This approach enables the passive realization of a large-scale hidden layer. We aim to design an easily deployable optical ELM that does not require complex processing of input and output data but achieves random projection through passive propagation in the optical domain. This method intends to simplify the system architecture while taking advantage of optical technology to achieve efficient parallel computing.MethodsFig. 1a shows the architecture of the digital ELM, defining the random projection process in the digital ELM as a randomly generated transmission matrix W, which describes the random linear mapping process between the input images and the output images. The matrix H is defined as the result of the input image matrix X multiplied by the transmission matrix W, with the ReLU function added as a nonlinear activation function. The calculation formula for H is given by H=ReLUXW. Subsequently, the parameters are trained using the ridge regression algorithm with β=(HTH+cI)-1HTT. Figs. 1(b) and 2 show the architecture and experimental setup of the optical ELM. A 532 nm wavelength laser is used, and its power is regulated by a Glan-Thompson polarizer and a half-wave plate. The input image is provided through a spatial light modulator (SLM) and propagates through free space. Optical aberrations, errors, and defects in the experimental process are defined as random transmission matrix W for the optical ELM. The matrix H is defined as the result of the input image matrix X multiplied by the transmission matrix W, using the nonlinear response function G of the camera as the nonlinear activation function. The calculation formula for H is given by H=GXW, and the parameters are trained using the ridge regression algorithm with β=(HTH+cI)-1HTT.Results and DiscussionsFigs. 3 and 4 show the simulation results for the digital ELM. First, under random projection, increasing both the input size and the number of hidden nodes remarkably improves ELM performance. Second, for high-resolution images, down-sampling in the optical domain is a more effective way to reduce computational burden. Figs. 5 and 6 illustrate the experimental results of the optical ELM. It shows that the utilization of the inherent random aberrations and errors of optical experiments and the nonlinear response of the camera in the framework is effective and can provide the necessary random mapping for optical ELM. Increasing the number of hidden nodes is related to the improvement of model performance. However, the propagation distance (PD) has a minimal impact on the model’s performance.ConclusionsWe present a framework for optical ELM and provide a detailed analysis and experimentation. The experimental results show that the optical ELM can achieve a certain classification accuracy under specific parameter settings. By using the inherent random aberrations and defects during free-space propagation and the nonlinear response of the camera, this approach replaces the time-consuming and energy-intensive random mapping process used in digital ELM, thus enhancing hardware efficiency. This study validates the effectiveness of optical transmission in passively processing large-scale image data. Compared with other complex systems, this design only requires a simple deployment of optical pathways while achieving the initial research goal: to design an easily deployable optical ELM that does not require complex processing of input data. However, there is still room for improvement in this experiment. Thus, Fig. 7 shows a potential improvement scheme by introducing a nonlinear scattering medium during free-space propagation, which can provide the model with more randomness and nonlinear effects, thereby enhancing model performance.
Feb. 20, 2025Vol. 45 Issue 3 0320001 (2025)
Qi Fang, Yuntuan Fang, and Gaige Zheng
ObjectiveResonant structures are the source of rich physical phenomena. Having a high quality factor Q and the ability for dynamic modulation are two crucial aspects in designing functional photonic devices based on resonance effects. Fano resonance and bound states in continuous spectra are currently two typical resonance phenomena that draw extensive attention from researchers. Fano resonance stems from the special interference effect between local (discrete) and continuous states in quantum or classical systems. Owing to its sharp asymmetric profile (linear shape), high spectral resolution, and extreme sensitivity to changes in structure and surrounding dielectric environment, Fano resonance can be applied to high-sensitivity sensing. Asymmetric linear Fano resonance can also be utilized in the design of optical switches. The bound state in the continuum (BIC) is a special resonant state, and its physical mechanism offers a superior solution for controlling and increasing the mode Q factor. A BIC with an infinitely large Q factor is an ideal model. Physically, optical quasi-BICs (QBICs) with extremely large Q factors can be used in various practical applications, such as lasers, sensors, light absorption, and harmonic generation enhancement. Up to now, diverse structures and mechanisms for realizing BIC have been proposed, among which the symmetry of the structure has become an important factor. Recently, researchers have proposed a grating waveguide structure based on guided mode resonance (GMR). The QBIC based on GMR is manifested through the Fano resonance peak. For any formation mechanism of BIC, there are strict requirements for structural parameters. Processing errors or defects in the structure can lead to a sudden reduction in the Q value. In addition, the adjustability of the mode, especially the dynamic continuous tuning, is essential in practical applications. However, most mode modulation relies on the tuning of structural parameters and cannot be achieved dynamically. Therefore, it is highly significant in optical research to discover a BIC structure model that is easy to implement and dynamically tunable. To fulfill the above objective, in our research, we design a composite structure model consisting of a grating and a waveguide, which generates a pair of BIC and resonance state. Through simple translation mismatching between two gratings, the BIC and Fano resonance states can be achieved and tuned dynamically, and some new photonic states have been discovered.MethodsTo overcome the difficulty in achieving dynamical tuning of BIC, a three-layer compound structure model composed of gratings and waveguide is designed. The structure has three independent tuning degrees of freedom: the width and height of the air groove, and the relative translation between the two compound grating layers. Based on the Comsol eigenfrequency solver, we construct a unit cell with Floquet periodicity boundary condition in the x direction. To ensure that the far-field polarization field is accurate enough, two thick enough air layers with two perfectly matched layers (PMLs) on each top are placed on the slab. For the TM modes (with field components Ez, Hx, and Hy), the frequency bands are obtained by scanning the wave number kx in the Brillouin zone (BZ). Through the calculation of bands and mode analysis, as well as the calculation of transmission spectra, the mode characteristics and transmission properties of the structures are acquired.Results and DiscussionsThe designed structure simultaneously generates a pair of BIC and Fano resonance at point Γ, the center of BZ. Their relative frequency position can be tuned through three independent degrees of freedom: the width and height of the air groove, and the relative translation between the two grating layers. The relative translation of the two grating layers enables continuous and dynamic tuning of the frequency positions and spectral line shapes of the BIC and Fano resonance. The Fano resonance has a peak in the transport spectrum, but the BIC cannot be detected from the transport spectrum due to its infinite Q value. With the symmetry broken by the translation mismatching between the two grating layers, BIC becomes QBIC. QBIC has a narrow peak in the transport spectrum. Through tuning of the relative translation, the QBIC resonance peaks and Fano resonance peaks experience an interesting merging. The merging of QBIC resonance peaks and Fano resonance peaks generates a special two-fold photonic state.ConclusionsIn this study, we have designed a composite structure of double-layer grating and waveguide, which simultaneously generates QBIC resonance and Fano resonance. The frequency positions and spectral shapes of QBIC resonance and Fano resonance are independently adjusted by the width and height of the air groove, and the relative translation distance of the two gratings. Compared with similar methods in adjusting modes by changing structural parameters, the method proposed in this study for controlling BIC resonance and Fano resonance is simpler, more accurate, and more feasible. The theoretical results and tuning method from this study have important application value in the design of optical switches and optical sensing.
Feb. 19, 2025Vol. 45 Issue 3 0326001 (2025)
Siyang Chen, Zexiao Huang, Yue Wang, Qingtao Meng, and Zhiqiang Zhang
ObjectiveSodium dithionite (Na2S2O4) is a common reducing agent widely used in the food, textile, biological science, and other fields. Excessive intake of Na2S2O4 can cause stomach cramps, upper respiratory tract infections, and other types of cell-damaging diseases, such as laryngospasm and bronchospasm. Therefore, a rapid, real-time, and in situ detection method for Na2S2O4 is extremely crucial to establish in biological technology, food security supervision, and the environment. Magnetic resonance/fluorescence dual-mode imaging can not only provide high-resolution structural and histological information but also achieve high-sensitivity functional imaging. In this study, a fluorescence/magnetic resonance dual-modality sodium dithionite molecular probe H2 based on cobalt complexes is designed and developed, using Co3+ as the magnetic resonance unit and 7-diethylaminocoumarin-3-carboxylic acid as the fluorescence unit. The probe combines optical imaging with high sensitivity and selectivity and magnetic resonance imaging with strong tissue penetration ability and high spatial resolution, compensating for the deficiencies of single-modal imaging.MethodsProbe H2 is synthesized and characterized by nuclear magnetic resonance (NMR) and mass spectrometry. The identification performance of H2 towards Na2S2O4 in an aqueous solution is studied using a UV?vis spectrophotometer and a fluorescence spectrophotometer. All NMR relaxivity measurements and NMR imaging in vivo are performed on a MesoMR23-060H-I Analyst Analyzing & Imaging system (0.5 T, Shanghai Niumag Corp.). Fluorescence imaging data are collected and processed using Amiview Living Image 2.0 software (PerkinElmer, USA).Results and DiscussionsThe capability of probe H2 ensemble for the detection of Na2S2O4 is studied by UV?vis, fluorescence emission spectrum, and magnetic resonance in Tris buffer solution [V(DMSO)∶V(Tris)=9∶1, pH=7.4]. To evaluate the selectivity of H2 towards Na2S2O4 against other analytes [Figs. 2(b) and 4(a)], no or little effect on the UV?vis and fluorescence spectrum detection of Na2S2O4 is found in the presence of various competitive analytes. The results demonstrate that H2 can be used as a specific probe for Na2S2O4 sensing in aqueous solution. The detection limit is calculated to be 23 μmol/L based on a 3σ/k under the experimental conditions [Fig. 5(a)]. The relaxivity of H2 is gradually enhanced with the increase in the concentrations of Na2S2O4 (0?280 μmol/L), which indicates the conversion of diamagnetic Co3+ into paramagnetic Co2+ through the redox reaction of Na2S2O4. Additionally, the corresponding T2-weighted images of H2 show a continuous decrease in spot brightness as the concentration of Na2S2O4 increased [Fig. 7(a)]. The addition of competitive analytes does not noticeably interfere with the responses of the transverse relaxivity (r2) [Fig. 7(b)]. The magnetic resonance/fluorescence dual-mode imaging results (Figs.10 and 11) demonstrate that H2 enables the successful detection of Na2S2O4in vivo and may potentially be used in biomedical diagnosis fields in the future.ConclusionsIn this study, we design and synthesize a magnetic resonance/fluorescence dual-mode molecular probe H2 for Co(Ⅲ) complexes using 7-diethylaminocoumarin-3-carboxylic acid (L2) as a ligand. Its structure is characterized by hydrogen nuclear magnetic resonance and high-resolution mass spectrometry. Probe H2 can specifically identify Na2S2O4. After recognition, the fluorescence signal of the H2 solution is quenched, the transverse relaxation signal is enhanced, and the T2-weighted image becomes darker. The recognition mechanism is verified by high resolution mass spectrometry and cyclic voltammetry. Probe H2 exhibits good light stability, specific selectivity, a suitable pH under physiological conditions and low cytotoxicity. Using 6?8 weeks of nude mice as a model, probe H2 is successfully applied to the visual detection of exogenous Na2S2O4 by magnetic resonance/fluorescence dual-mode imaging in vivo, which has certain application potential in the biomedical field.
Feb. 21, 2025Vol. 45 Issue 3 0330001 (2025)
Jiayang Xiao, Xinyue Zhu, Yi Xu, Hongyang Sun, Lifan Huang, Chao Li, Yan Gao, Yun Gao, and Sheng Zhong
ObjectiveOur study aims to develop a coumarin-based fluorescence-enhanced Fe3+ (AFY) probe for the selective and sensitive detection of Fe3+. As an essential trace element in biological systems, abnormal levels of Fe3+ have been associated with various diseases, making it critical to developing efficient detection methods. Compared to traditional analysis methods, fluorescence sensors offer advantages such as high selectivity, sensitivity, and ease of use. However, most existing probes for detecting Fe3+ ions are quenched probes, which have suboptimal performance. Therefore, designing and developing a new “OFF-ON” Fe3+ fluorescent probe based on coumarin is of great significance.MethodsWe employ high-resolution mass spectrometry (HR-MS), hydrogen nuclear magnetic resonance (1H NMR), and carbon nuclear magnetic resonance (13C NMR) to characterize the structure of the AFY probe. We evaluate the performance of the probe in identifying Fe3+ using UV and fluorescence spectroscopy. We determine the complexation constant and detection limit of the probe and investigate the response mechanism of AFY to Fe3+. Fe3+ levels in real water samples are measured using mobile phone-based intelligent recognition, fluorescence spectrometry, and atomic absorption spectrometry, demonstrating the practical application potential of AFY.Results and DiscussionsThe AFY probe enables “naked eye” detection of Fe3+ through a color change in the solution from purple to pink, accompanied by the emission of strong red fluorescence in the presence of Fe3+. This fluorescence enhancement is attributed to the fluorescence chelation enhancement (CHEF) effect. The detection limit for Fe3+ with AFY is found to be 0.35 μmol/L, indicating good sensitivity. Both solution colorimetric methods and AFY-based test paper are employed for semi-quantitative Fe3+ detection in actual water samples. In addition, a smartphone-based color recognition App is used to digitally process the color of the AFY test paper. A good linear correlation is observed between the color value (R+G)/B and the Fe3+ concentration, enabling the quantitative detection of Fe3+ in water samples. The content of Fe3+ in water samples is further determined by fluorescent calibration curves, atomic absorption spectrometry, and smartphone-based colorimetry. The results show that the AFY probe is capable of rapid and accurate quantitative detection of Fe3+ in real water samples.ConclusionsIn this paper, we develop a coumarin-based red fluorescence-enhanced Fe3+ probe, AFY, which allows for the “naked eye” detection of Fe3+. Due to its good water solubility and rapid response, the probe is formulated into a test paper for semi-quantitative detection of Fe3+ in both pure water and tap water. The Fe3+ content in these water samples is determined using smartphone-based colorimetry, fluorescence spectrometry, and atomic absorption spectrometry. The rapid and accurate detection of Fe3+ in real water samples using the AFY probe presents a promising application for environmental monitoring and water quality assessment.
Feb. 20, 2025Vol. 45 Issue 3 0330002 (2025)
Haobin Zheng, Yan Tang, Xinglong Zhou, Xiufeng Tang, Jiong Zhang, and Shuangshuang Yuan
ObjectiveTraditional Li+ electrolytes often fail to meet the requirements for fast response due to their slower response speed. In this paper, we prepare five Li+/Al3+ composite electrolytes with varying Li+/Al3+ ratios to investigate their effects on the electrochromic properties of WO3 thin films fabricated via magnetron sputtering. The results demonstrate that the coloring response time and memory effect of WO3 films in Li+/Al3+ composite and pure Al3+ electrolytes significantly outperform those in pure Li+ electrolytes. Specifically, when the Li+/Al3+ ratio is 1∶3, the coloring response time is minimized at 1.05 s, and after 28 h under open-circuit conditions, the transmittance at 550 nm increases by only 7.1 percentage points. Moreover, the cycle stability of WO3 films in composite electrolytes is markedly superior to that in pure electrolytes. Particularly at a Li+/Al3+ ratio of 1∶3, the WO3 film exhibits optimal cyclic performance, with a charge retention rate of 90.38% after 1000 cycles of voltammetric cycling (CV) testing.MethodsWO3 films are deposited on indium tin oxide (ITO) substrates via DC reactive magnetron sputtering. Film thickness is measured using a BrukerDektakXT step profiler, and scanning electron microscopy (SEM) imaging is conducted with a Zeiss Sigma 500 at 15 kV. X-ray diffraction (XRD) analysis is performed using Philips X’Pert diffractometer with Cu Kα radiation to determine the crystalline structure of the films. Electrochemical properties are measured in a standard three-electrode setup using an Ag/AgCl reference electrode in various lithium perchlorate/aluminum perchlorate LiClO4/Al(ClO4)3 electrolytes dissolved in propylene carbonate (PC). Chronoamperometry and cyclic voltammetry tests using a CHI760E electrochemical workstation are employed to evaluate response times and cyclic performance. Ultraviolet-visible (UV-Vis) spectrophotometry (Shimadzu UV-3600 plus) is used to characterize modulation rates.Results and DiscussionsFive groups of Li+/Al3+ composite electrolytes with different ratios are prepared, and their effects on the electrochromic performance of WO3 film are studied. Key findings include: 1) The light modulation rate of WO3 films in Li+/Al3+ composite electrolyte is higher than in pure Li+ electrolyte (Fig. 2). 2) Adding Al3+ to Li+ electrolytes significantly reduces the coloring response time, though the fading time gradually increases with higher Al3+ content (Fig. 3). 3) After 28 h under open-circuit conditions, the transmittance increase of WO3 films in composite electrolytes (4 percentage points-9 percentage points) is similar to that in pure Al3+ electrolyte (8.4 percentage points) but significantly smaller than in pure Li+ electrolyte (Fig. 4). 4) With increasing Al3+ content, the Qex/Qin ratio increases, achieving the highest stripping efficiency at a Li+/Al3+ ratio of 1∶3 (Fig. 5).ConclusionsIn this paper, we prepare WO3 thin film via DC reactive magnetron sputtering, and the effects of different Li+/Al3+ ratios on their electrochromic properties are thoroughly investigated. XRD and SEM analysis reveal that WO3 thin films are amorphous with a uniform, porous, and loose structure. Notably, incorporating Al3+ into Li+ composite electrolytes significantly reduces the coloring response time of WO3 thin films, compared to pure Li+ electrolytes. Among the tested ratios, a Li+/Al3+ ratio of 3∶1 yields the best memory effect with the transmittance of the WO3 thin film increasing by only 4.8 percentage points after 28 h under open-circuit conditions. Moreover, the WO3 thin film demonstrates the shortest coloring response time (1.05 s) and superior cycle stability when the Li+/Al3+ ratio is 3∶1. At this ratio, the charge density reaches 21.08 mC/cm2, and the charge retention rate remains as high as 90.38%. These findings confirm that introducing Al3+ into Li+ electrolytes enhances the electrochromic properties of WO3 thin film. By optimizing the Li+/Al3+ ratio in the electrolyte solution, the electrochromic performance of WO3 films can be effectively controlled, offering a promising approach for achieving a film with better functionality.
Feb. 20, 2025Vol. 45 Issue 3 0331001 (2025)
Hongbo Gao, Qi Yuan, Rui Huang, Mengke Wang, and Weiguo Zhao
ObjectiveAs a widely employed instrument for measuring the color of oils and fats worldwide, the Lovibond tintometer is also a measuring instrument for the color of oils and fats in GB 1536—2004 and GB/T 22460—2008. The accuracy of these measurements is crucial for export trade and food safety. However, with the breakthroughs in technical barriers and the calibration needs of new instruments in the new era, many aspects of the original verification regulations can no longer meet the requirements of current actual work. Despite modifications proposed by many experts, the studies have been delayed due to the problem that the Lovibond color scale cannot be traced back to the national chroma standard and other prominent problems in calibrating the Lovibond tintometer. We summarize the problems encountered in daily calibration work and conduct some studies on the Lovibond color system based on the experience of predecessors. It is proposed that the Lovibond glasses can be calibrated by adopting the absorbance at characteristic wavelengths, which traces the Lovibond color scale to the national spectral transmittance standard, thereby solving the lack of traceability of the Lovibond color scale and providing a basis for future protocol modifications.MethodsThe spectrophotometry is utilized and the Lovibond glasses are researched. First, the entire set of Lovibond glasses is scanned with a spectrophotometer, including the red glasses, yellow glasses, blue glasses, and nature glasses, for spectral data of 84 Lovibond glasses in the wavelength range of 380?780 nm to obtain 3440 spectral data. The relationship between spectral transmittance and the wavelength is plotted. Then, the characteristic Lovibond number is determined according to the color grading method of edible oil in relevant national standards. After that, the characteristic wavelength points are selected by single variable selection (SVS) based on partial least squares (PLS), and the linear equation between absorbance and the Lovibond number at the characteristic wavelength points is established. Then, another set of Lovibond glasses is measured with the same method, and the validity and rationality of the linear equation are verified by the absorbance at the characteristic points at the characteristic wavelengths.Results and DiscussionsAt present, the Lovibond color scale cannot be traced back to the national chroma standard. By studying the relationship between Lovibond units and spectral transmittance via spectrophotometry, it is found that there is an obvious relationship between the spectral density of Lovibond glasses and the Lovibond number at a single wavelength. Since there are 84 Lovibond glasses, it is impractical to calibrate each one in actual practice. By convention, characteristic points are usually employed for calibration. By further finding the characteristic wavelength points and characteristic Lovibond numbers, a linear equation between the Lovibond number and absorbance at the characteristic wavelength is established. The verification graphs (Figs. 4 and 5) show that the Lovibond glasses can be calibrated by the absorbance at the characteristic points at the characteristic wavelength.ConclusionsBy taking Lovibond glasses as the research object, spectrophotometry is adopted to study the Lovibond color system. The original research results show that there is both an obvious relationship between the spectral density and the Lovibond number at a single wavelength and an obvious relationship between the integrated spectral density and the Lovibond number of the Lovibond glasses in the wavelength range of 380?780 nm. Based on these results, a new method for calibrating the Lovibond glasses by utilizing the absorbance of the characteristic Lovibond number at the wavelength is further proposed. The experimental data analysis shows that there is an obvious linear relationship between the absorbance and the Lovibond number of the Lovibond at the characteristic wavelength. The Lovibond filter can be calibrated by leveraging the absorbance at the characteristic point at the characteristic wavelength, which solves the lack of traceability of the Lovibond color scale and provides a basis for future protocol modifications.
Feb. 20, 2025Vol. 45 Issue 3 0333002 (2025)
© Copyright 2018-2021 | Chinese Laser Press.
All Rights Reserved 沪ICP备15018463号-20