


Please enter the answer below before you can view the full text.


2025
Volume: 45 Issue 2
29 Article(s)

Xinyi Ke, Jianhua Chang, Yang Min, Xinxin Wu, and Ziyi Hu
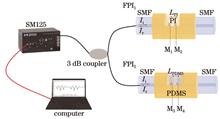
ObjectiveTemperature and humidity measurement is crucial for the growth and storage of crops, as well as for industrial monitoring and control. Compared to electronic sensors, fiber optic sensors offer advantages such as strong anti-interference capability, good stability, excellent electrical insulation, and high sensitivity, making them widely used in various fields. Among them, fiber optic Fabry-Perot interferometric sensors can detect even the smallest changes in physical quantities with high sensitivity, compact size, and light weight. In recent years, with the increasing demand for environmental monitoring, the simultaneous measurement of temperature and humidity has gained increasing attention. However, most fiber optic temperature and humidity sensors either have low sensitivity or cannot measure the both parameters simultaneously. Therefore, developing high-sensitivity fiber optic sensors for both temperature and humidity is of significant practical importance. The parallel fiber Fabry-Perot structure enables multiple sensors to operate simultaneously, allowing the monitoring of different physical quantities. The Vernier effect, through the overlap of signals from two interferometers, amplifies the wavelength shift, which significantly improves the sensitivity of fiber optic sensors.MethodsThe sensor consists of a PDMS cavity and a PI cavity formed between two single-mode optical fibers, operating in parallel. By utilizing the similar free spectral range (FSR) of the PDMS and PI cavities, a Vernier effect occurs when the cavities are combined in parallel. This effect, generated through the superposition and interference of the interferometer signals, amplifies even minute changes in wavelength. For monitoring relative humidity and temperature, the PDMS and PI cavities serve as the reference and sensing cavities, respectively, allowing for high-sensitivity measurements of the both parameters. A single Fabry-Perot interferometer measures relative humidity (or temperature) by tracking the shift in its characteristic wavelength in the reflection spectrum as it responds to changes in relative humidity (or temperature). The parallel sensor structure generates a Vernier effect, enabling the monitoring of temperature and humidity by observing the drift of the envelope line in the superimposed reflection spectrum. By leveraging the different sensitivity characteristics of PI and PDMS to temperature and humidity, and using a sensitivity coefficient matrix, the responses of the PI and PDMS cavities can be mathematically processed to achieve simultaneous measurement of both temperature and humidity.Results and DiscussionsUnder experimental conditions at a temperature of 20 ℃, the relative humidity is gradually increased from 30% to 60%, recording data at 10% increments. As relative humidity increases, the characteristic wavelength of the FPI1 reflection spectrum shifts towards shorter wavelengths, with FPI1 showing a sensitivity to relative humidity of (-0.409±0.120) nm/%. When FPI1 is paired with FPI2 in parallel, and the relative humidity is similarly increased from 30% to 60%, the experimentally determined sensitivity to relative humidity is 1.614 nm/%, approximately four times the sensitivity of a single FP for measuring humidity. With the relative humidity set at 20%, the temperature is incrementally increased from 30 to 34 ℃, and the experimentally determined temperature sensitivity of FPI2 is (3.194±0.140) nm/℃. After FPI1 is paired with FPI2 in parallel, as the temperature increases from 30 to 33 ℃, the temperature sensitivity is (15.611±0.376) nm/℃, about five times the sensitivity of a single FPI2. By using a sensitivity coefficient matrix to demodulate the accurate measurements of temperature and relative humidity, simultaneous measurement of both temperature and relative is achieved.ConclusionsIn this paper, we present a novel parallel Fabry-Perot fiber optic temperature and humidity sensor based on the Vernier effect. The sensor consists of two air cavities formed by the endfaces of single-mode fibers, filled with PI and PDMS, respectively. These create PI and PDMS cavities, which, when connected in parallel, utilize the Vernier effect to detect and amplify the sensitivity to temperature and humidity. Experimental results show that within a relative humidity range of 30% to 60%, the sensor’s sensitivity to relative humidity is 1.614 nm/%, about four times the sensitivity of a single FPI. Within a temperature range of 30 to 33 ℃, the temperature sensitivity is (15.611±0.376) nm/℃, about five times the sensitivity of a single FPI. By using a sensitivity matrix, the sensor achieves simultaneous measurement of both temperature and humidity. While the operational temperature range of this sensor is relatively limited, it can be flexibly adjusted to meet the application-specific temperature range requirements. This makes the sensor ideal for monitoring temperature and humidity across diverse environments.
Jan. 23, 2025Vol. 45 Issue 2 0206001 (2025)
Li Zhao, Lin Fan, and Junlin Chen
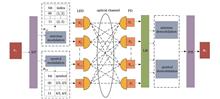
ObjectiveOptical spatial modulation is a novel multiple input multiple output (MIMO) technology that activates a single transmitting antenna at each moment to avoid co-channel interference between channels. However, it has low spectrum utilization and significant limitations. Optical generalized spatial modulation (OGSM) extends this approach by enabling multiple antennas to transmit data simultaneously, improving antenna utilization and overall data transmission rate. In OGSM systems, bit error performance can be enhanced by refining detection algorithms. However, these improvements have often been limited. Therefore, researchers have turned to antenna selection and power allocation algorithms to optimize bit error performance more effectively.MethodsIn this paper, we propose a norm joint similarity coefficient-based antenna selection algorithm and a particle swarm optimization-based power allocation algorithm. To maximize channel capacity, we derive a mathematical model that reflects the influence of channel norm and similarity coefficient on capacity. The norm joint similarity coefficient is used to create an antenna selection strategy that optimally combines antennas for improved performance. A channel capacity-based fitness function is designed using the particle swarm optimization algorithm to allocate optimal power to selected antennas, thus enhancing system transmission quality.Results and DiscussionsIn the simulated environment, we apply BPSK modulation with two active antennas. The following key results emerge from the analysis: 1) at low signal-to-noise ratios (SNRs), theoretical BER of the OGSM-MIMO system is initially higher than simulated bit error rate (BER); however, as SNR increases, this gap narrows, aligning closely at higher SNRs. 2) As the number of receiving antennas increases, bit error performance improves notably. For instance, when BER reaches 10-3, the four-antenna setup outperforms the three-antenna setup by 4.1 dB (Fig. 2). The proposed norm joint similarity coefficient antenna selection algorithm significantly enhances bit error performance compared to random, RSS, and norm-based selection algorithms. When BER reaches 10-4 with four transmitting antennas, bit error performance improves by 7.9 dB, 5.2 dB, and 2.2 dB, respectively. With six antennas, improvements are 7.4 dB, 5.8 dB, and 3.2 dB, respectively (Fig. 3). In addition, particle swarm optimization-based power allocation algorithm considerably enhances bit error performance over traditional equal-power and water-filling methods, improving by 7.5 dB and 4.2 dB, respectively, at BER of 10-3 (Fig. 4). In the antenna selection algorithm system utilizing the norm joint similarity coefficient, when BER reaches 10-4, the bit error performance of the OGSM6×4-4 system is enhanced by 4.5 dB following particle swarm optimization-based power allocation, while the OGSM4×4-2 system achieves a 2.6 dB improvement under the same optimization. Compared to the OGSM4×4-2 system, the OGSM6×4-4 system exhibits a 3 bit/s increase in each control unit, though its bit error performance slightly declines (Fig. 5).ConclusionsIn this paper, we examine the norm joint similarity coefficient antenna selection and particle swarm optimization power allocation algorithms for the visible OGSM-MIMO system, providing a simulation-based analysis of system bit error performance. The findings indicate that the norm joint similarity coefficient algorithm plays a critical role in the system’s operation, enabling intelligent antenna activation that mitigates co-channel interference and improves system capacity and stability. The simulation results confirm that, across different SNR conditions, BER is significantly enhanced with this algorithm over traditional methods. In addition, the particle swarm optimization-based power allocation strategy optimizes transmission power, allowing the system to adapt to varying communication environments and channel conditions, thus improving transmission efficiency and performance. Overall, the system employing the particle swarm optimization algorithm achieves a lower BER across diverse channel conditions compared to conventional methods.
Jan. 22, 2025Vol. 45 Issue 2 0206002 (2025)
Xiangyan Meng, Tian Xi, Li Zhao, and Feng Zhang
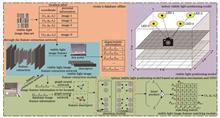
ObjectiveVisible light indoor positioning provides novel theoretical and practical support for high-speed, environmentally-friendly, safe, and economical indoor localization. Traditional non-imaging-based positioning methods face operational challenges, and current algorithms using image sensors primarily capture local appearance information, often overlooking geometric structure, thus affecting positioning accuracy. In this study, we propose a model integrating attention mechanisms and graph neural networks (GNNs), enhancing the accuracy and robustness of indoor visible light positioning.MethodsIn this study, a novel approach combines attention mechanism with GNNs. Visible light images are represented as graphs, where GNNs aggregate both intra- and inter-graph information, embedding the spatial position of feature points into descriptors, which enriches them with geometric data. The attention module further enhances descriptor quality, improves matching accuracy and realizes precise indoor positioning.Results and DiscussionsTo validate the model, a 4 m×4 m×3 m visible light experimental platform is constructed. Four 10 W LED light sources are positioned at the top of the model, and the visible light area is divided into a grid of equidistant 5 cm×5 cm cells. Visible light images are captured at each grid vertex, creating a fingerprint database with 3510 images. For testing, 80% of the database images are used for feature extraction and matching, while the remaining 20% are reserved for model testing. Simulation and practical experiments are conducted with the platform at heights of 0, 0.75, and 1.50 m. The results show centimeter-level accuracy, with average errors of 5.93, 7.21, and 9.15 cm, at each height. The robustness tests are also conducted, including rotation and tilt transformations of the mobile terminal. Compared to the SuperPoint algorithm, which extracts image features for deep learning, the experimental results show notable improvements in matching rates. When the visible light image is rotated by 5°, the matching rate increases by 9%; at 30°, it increases by 17% with a maximum improvement of 20% observed in the rotation experiments. For tilt angles, a 5° tilt results in a 12% increase in matching rate, while a 30° tilt yields a 13% increase. These results indicate that the algorithm proposed in this study surpasses the SuperPoint algorithm in matching accuracy, demonstrating its superior performance.ConclusionsIndoor visible light environments are often complex, with frequent light and background interferences that challenge traditional algorithms. This model, combining attention mechanisms and GNNs, optimizes indoor visible light positioning by enhancing robustness and stability. Using deformable convolutional networks (DCNs) during sampling improves key information in visible light images. GNNs effectively aggregate both intra- and inter-image information, while the attention mechanism dynamically adjusts feature weights to emphasize features with greater discrimination and reliability. This reduces the influence of illumination and occlusion, enhancing matching accuracy. In this study, a 4 m×4 m×3 m visible light indoor positioning model is constructed for simulation testing. The experimental results show an average positioning error of 7.43 cm, highlighting this approach as a viable new algorithm for indoor visible light positioning.
Jan. 22, 2025Vol. 45 Issue 2 0206003 (2025)
Yueheng Wang, Changchao Wang, Lijun Miao, Yilan Zhou, Dengwei Zhang, and Tengchao Huang
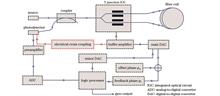
ObjectiveIn digital closed-loop interferometric fiber optic gyroscopes (IFOGs), electrical cross-coupling errors significantly affect measurement accuracy, especially at low angular velocities. This limitation restricts application of IFOGs in high-precision environments. Addressing these errors is crucial for enhancing the gyroscope’s performance and reliability. This study aims to explore the mechanisms of electrical cross-coupling errors and develop effective techniques to suppress these errors, thereby improving the overall accuracy and reliability of IFOGs.MethodsWe begin with a comprehensive analysis of the generation mechanisms of electrical cross-coupling errors in IFOGs. Classical four-state modulation is used as a case study to examine the influence of these errors during different phases of modulation. The four-state modulation method obtains angular velocity information by demodulating four discrete states. However, the reset operations during various modulation phases affect the output differently, leading to dead zone effects at low angular velocities. We propose two methods to address this issue. 1) Analog adding feedback method. This method minimizes reset operations by resetting only the feedback phase during modulation. This reduction in reset operations maintains the modulation consistently in the same phase, thus suppressing the dead zone. Nonetheless, due to the inherent influence of electrical cross-coupling, this method introduces an additional bias that must be accounted for in the overall system accuracy. 2) Ratio four-state demodulation method. By adjusting the demodulation ratio of the feedback signal, this method mitigates correlation between modulation and demodulation sequences, enhancing measurement accuracy. This technique, combined with the analog adding feedback method, not only addresses the dead zone issue but also helps in reducing the additional biases introduced by electrical cross-coupling. We conduct detailed experiments in a digital closed-loop IFOG system specifically designed to monitor electrical cross-coupling errors under controlled conditions, analyzing the system’s response to low angular velocities and quantifying the dead zone effects caused by these errors.Results and DiscussionsThe results present a detailed analysis of the influence of electrical cross-coupling errors on IFOG performance. These errors cause significant deviations in the gyroscope’s output, particularly at low angular velocities, leading to the dead zone effect where the output remains zero despite of changes in input angular velocity (Fig. 7). The anglar velocity of experimentally tested dead zone is 0.2 (°)/h, demonstrating the critical need for effective error suppression methods. The analog adding feedback method significantly reduces the number of reset operations, resulting in a substantial decrease in the dead zone. Experimental data (Fig. 8) show that this method reduces the dead zone to below the measurement threshold of 0.022 (°)/h, thereby improving the gyroscope’s performance. Nonetheless, due to electrical cross-coupling, this method inevitably introduces an additional bias of approximately -0.06 (°)/h, which must be carefully managed to ensure accurate measurements. Further analysis (Fig. 9) reveals that the combined method of analog adding feedback and ratio four-state demodulation provides a significant improvement in measurement accuracy. By minimizing the correlation between modulation and demodulation sequences, this approach ensures that the gyroscope can operate accurately even at low angular velocities. Experimental results (Table 2) indicate that this method effectively suppresses electrical cross-coupling errors, resulting in more reliable and precise measurements.ConclusionsOur study demonstrates the feasibility and effectiveness of the proposed methods in suppressing electrical cross-coupling errors in digital closed-loop IFOGs. The combination of the analog adding feedback method with the ratio four-state demodulation method shows significant improvements in measurement accuracy, particularly at low angular velocities. These techniques mitigate the dead zone effects and guarantee the overall stability and reliability of the gyroscope’s performance. The findings have significant implications for the design and operation of high-precision IFOGs. By addressing the critical issue of electrical cross-coupling errors, the proposed methods pave the way for developing more accurate and reliable gyroscopes, essential for various high-precision applications. Future research will focus on further refining these techniques.
Jan. 22, 2025Vol. 45 Issue 2 0206004 (2025)
Yue Chen, Binbin Luo, Yao Huang, Yan Liu, Shenghui Shi, Mingfu Zhao, Peiling Yuan, and Shengxi Wu
ObjectiveOptical fiber surface plasmon resonance (SPR) sensors combine the advantages of optical fiber technology and SPR effect, offering small size, high sensitivity, fast response, and anti-electromagnetic interference capabilities. These features make them widely studied in biological sensing, chemical sensing, and environmental monitoring. However, when applied to biomolecular detection, further enhancement in refractive index sensitivity is still required. With advances in materials science, various two-dimensional (2D) nanomaterials, such as graphene and black phosphorus, have been increasingly used to improve the performance of biosensors. MXene, a relatively new member of the 2D nanomaterials family, is expressed as Mn+1XnTx(n=1-4), where “M” is a transition metal, “X” is C or N, and “T” represents surface terminations such as —O, —F, or —OH groups. Due to its excellent optical response, tunable band gap, and electronic properties, MXene holds promise for enhancing the performance of coreless optical fiber SPR sensors. In this paper, we focus on leveraging Ti3C2-MXene to improve refractive index sensitivity, making the sensors more suitable for applications requiring high sensitivity, such as biological sensing.MethodsThe proposed sensor adopts a multimode-coreless-multimode (MCM) fiber structure. Using COMSOL software, simulations are conducted to optimize the gold film thickness, coreless fiber length, and Ti3C2-MXene layer thickness. The simulation results reveal the optimal parameters: a 10 mm coreless fiber length, a 50 nm thick gold film sputtered on the fiber surface, and three layers of Ti3C2-MXene coating. The fabrication process involves attaching a negligible-thickness Ti3C2-MXene layer to the coreless fiber to fix the gold film, sputtering a thin gold layer to excite the SPR effect, and subsequently applying the Ti3C2-MXene coating to further enhance the SPR effect. The refractive index sensitivity is assessed by immersing the sensor in NaCl solutions with varying refractive indexes and recording the corresponding resonance wavelength.Results and DiscussionsThe surface morphology of the gold film and Ti3C2-MXene coatings is characterized using field emission scanning electron microscopy (FESEM, ZEISS SIGMA HD) (Fig. 5). Energy spectrum analysis confirms the effective fixation of Ti3C2-MXene on the sensor surface (Fig. 6). The experimental results demonstrate that introducing Ti3C2-MXene significantly enhances the sensor’s refractive index sensitivity. Without the MXene layer, the refractive index sensitivity is 2326.42 nm/RIU within the refractive index range of 1.3330 to 1.3660. After applying three layers of Ti3C2-MXene, the sensitivity increases to 4361.04 nm/RIU, representing an 87.5% improvement. A comparison of experimental results with theoretical predictions shows high consistency, validating the sensor’s performance. However, the study also highlights that while the MXene layer improves sensitivity, it broadens spectral bandwidth, reducing the sensor’s quality factor. Table 1 compares the performance of the proposed MCM fiber SPR sensor with other fiber-based SPR sensors, showing that the Ti3C2-MXene and MMF-CLF-MMF combination achieves superior sensitivity (4361.04 nm/RIU) and an enhancement (87.5%) exceeding other designs. In addition, the MCM fiber structure avoids mechanical strength reduction associated with grinding sensors into D-shapes or etching their cladding.ConclusionsIn this paper, we propose an MCM fiber SPR sensor utilizing the sensitization effects of Ti3C2-MXene. The principle of refractive index sensing and the influence of structural parameters are analyzed through simulations and experiments. The optimal sensor parameters are determined as a 50 nm gold film, 10 mm CLF fiber length, and three layers of Ti3C2-MXene. The experimental results indicate that within the refractive index range of 1.3330?1.3660, the refractive index sensitivity of the sensor increases from 2326.42 to 4361.04 nm/RIU, an 87.5% improvement compared to that of the MCM fiber SPR sensor without Ti3C2-MXene. The proposed MCM fiber SPR sensor offers a simple structure, low fabrication difficulty, reduced cost, and high sensitivity, making it promising for biological detection applications.
Jan. 22, 2025Vol. 45 Issue 2 0206005 (2025)
Yongjian Chen, Yang Lu, Liang Cheng, Chen Yao, Yunxin Lü, Yanrong Zhai, and Meihua Bi
ObjectiveNowadays, passive optical networks (PONs) are the ultimate solution for optical access networks and have been deployed worldwide. To meet the rapidly increasing bandwidth demand, high-speed next-generation PONs are expected. PONs are cost-sensitive, and the main cost of a PON comes from constructing the optical distribution network (ODN), which can be up to 80%. Therefore, a smooth PON upgrade is highly desirable as it reuses the deployed ODN instead of rebuilding a new one. Since the new PON link shares the ODN with the legacy PON link, the coexistence of the two PON links with low crosstalk must be ensured. In the upstream direction, the new PON optical network units (ONUs) use an upstream wavelength different from that of the legacy PON ONUs, and the new PON upstream signal and the legacy PON upstream signal can be separated by a wavelength division multiplexer/demultiplexer (WDM) in the optical line terminator (OLT). The cost of adding one WDM in the OLT is acceptable. In the downstream direction, the separation (or filtering) should be in ONUs. The new ONUs have optical filters to filter out the legacy PON signal. However, the legacy ONUs have no optical filters to protect them from the new PON signal because they are designed with the coexistence in mind when they were installed. The retrofitting cost of adding one WDM to each legacy ONU is too high due to the large number and wide distribution of legacy ONUs. Thus, the crosstalk from the new PON downstream signal to the legacy PON downstream signal should be eliminated or reduced.MethodsWe utilize several wavelengths to construct a novel mark ratio modulation (MRM) based on wavelength coding for single-wavelength coexistence. The pulse position modulation (PPM) is transferred from the time domain to the wavelength domain, meaning that the pulse position is the “wavelength position” instead of the “time position”. The new PON signal is mapped to four sequences through the 4PPM coding method. Then, the legacy PON signal modulates the mark ratio of the four sequences by inverting them. When the legacy PON signal is 1, there will be three marks among the four corresponding bits, and when it is 0, there will be one mark. The four sequences are loaded to four transmitters of different wavelengths. The four optical signals are combined by a wavelength division multiplexer/demultiplexer (WDM) and then fed into a feeder fiber. In the remote node, the four signals are split into ONUs. Each legacy ONU receives all optical signals because there is no optical filter or WDM. The total amplitude depends on the sum of the four signals, and the mark ratio among the four bits is modulated by the legacy PON signal, so the total amplitude corresponds to the legacy PON signal. Each new ONU separates the four optical signals by a WDM and then receives them separately. The received signals are then decoded to recover the origin new PON signal.Results and DiscussionsThe tested eye diagrams are shown in Fig. 4. The 10 Gbit/s legacy PON signal shows worse performance than the 10 Gbit/s individual signal. This is because the extinction ratio (ER) of the legacy PON signal is limited, and the delay difference and amplitude difference of the four optical signals cannot be completely compensated. To further demonstrate the signals’ performance, bit error rates (BERs) are measured and shown in Fig. 5. The legacy PON signal shows worse performance compared with S1. The 2.5 Gbit/s legacy PON signal shows BER performance close to that of the 10 Gbit/s S1. To reach the same BER level, the 10 Gbit/s legacy PON signal requires 3 dB?5 dB higher received power than S1. The receiving sensitivities of the 1.25, 2.5, and 10 Gbit/s legacy PON signals are -30.5 dBm, -28.8 dBm, and -25.5 dBm, respectively. The legacy PON signal is a combination of four optical signals. Assuming the output power of each transmitter in the OLT is 3 dBm, the total power of the transmitted four optical signals reaches 9 dBm in the OLT. So the power budgets are 39.5 dB, 37.8 dB, and 34.5 dB, respectively. To test mismatch induced signal degradation, the BERs of the legacy PON signals are measured again, as shown in Fig. 6. For the 1.25 Gbit/s signal when the mismatch distance does not exceed 1 km, there is minimal variation in BER with almost no power loss; at 2.5 km, the power loss is approximately 0.5 dB. For the 2.5 Gbit/s signal, the BER difference widens, especially reaching the error limit at a 2.5 km mismatch; at 1 km, there is still no significant power loss. The 10 Gbit/s signal displays more pronounced attenuation, with the 2.5 km mismatch resulting in BER measurement failure, and only a small power loss of about 0.5 dB at 0.5 km. The mismatch compensation does not affect the separately received signal S1. A smooth PON upgrade is achieved by the proposed wavelength coding based MRM. The new PON link is added without changing the legacy ONUs and the deployed ODN. The new PON signal and the legacy PON signal use the same wavelengths. The upgrade is “traceless” because all wavelengths can be switched to carry independent signals individually after the upgrade without hardware retrofitting.ConclusionsIn our present study, a novel wavelength coding based MRM is proposed for PON upgrade. The proposed method uses several wavelengths to carry both the new PON signal and the legacy PON signal. The new PON signal applies PPM over wavelengths. The signal is modulated by selecting one specific wavelength. The legacy PON signal is modulated by inversing the coded new PON signal, which changes the mark ratio of the coded signals. At the receiving end, the legacy PON signal can be received by a traditional amplitude-shift-keying (ASK) receiver directly and the new PON signal is recovered from the separately received optical signals. After the upgrade, the coding can be switched off, and each wavelength can carry an independent signal, so the upgrade is “traceless”. In the upgrade based on the proposed method, orthogonal modulation is not used, and the bit rate of the new PON signal is not reduced. The proposed upgrade is demonstrated by simulation. In the simulation, four wavelengths are used, and the new PON signal applies 4PPM. 1.25, 2.5, and 10 Gbit/s legacy PON signals are tested when the transmitting rate of each wavelength is set as 10 Gbit/s. The transmission length is 25 km. The time misalignment and the power difference among the optical signals are pre-compensated in the OLT. In the simulation, the legacy PON signal and the new PON signal show good performance. The power budget is sufficient, satisfying most current PONs’ specifications. For the 1.25 Gbit/s legacy PON signal and 2.5 Gbit/s legacy PON signal, the power penalty from the degradation induced by the compensation mismatch is negligible when the compensation mismatch is not beyond 1 km. The measured results verify the feasibility of the proposed wavelength coding MRM.
Jan. 23, 2025Vol. 45 Issue 2 0206006 (2025)
Yuxin Wang, Shuang Liu, Junyi Hu, Binjie Li, and Huilian Ma
ObjectiveLow-cost, high-precision gyroscopes have significant potential applications across various fields, including miniaturized unmanned aerial vehicles (UAVs), micro satellites, and autonomous driving. Traditional interferometric fiber-optic gyroscopes (IFOGs) have reached a relatively mature stage of development and are widely used. However, the accuracy of these system is directly proportional to the length of the fiber-optic ring. Consequently, higher accuracy requires increased gyroscope volume and cost, making the system more susceptible to environmental factors. As an alternative, resonant fiber-optic gyroscopes (RFOGs) driven by broadband sources offer the potential to achieve the same accuracy as IFOGs with shorter fiber lengths. This enables miniaturization while maintaining low cost and high precision. However, current implementations of broadband source-driven RFOGs typically reply on high-power light sources (tens of milliwatts), LiNbO3 phase modulators, and polarization-maintaining fiber-optic ring resonators (PM-FRRs), which drive up costs. In this paper, we propose a novel RFOG design that significantly reduces costs by employing a low-power (several mW) broadband light source, a piezoelectric transducer (PZT) phase modulator, and a single-mode fiber-optic ring resonator (SM-FRR) as the core optical path components. We hope that the strategies and findings presented here will contribute to the next generation of RFOG development.MethodsIn this paper, we undertake a comprehensive analysis and experimental investigation of broadband source-driven RFOGs, focusing on balancing cost-effectiveness and accuracy. A mathematical model of sinusoidal modulation and demodulation is developed based on the characteristics of the PZT phase modulator and the SM-FRR to validate the feasibility of the proposed design. A theoretical model is then constructed using SM-FRR parameters to analyze the shot noise-limited theoretical sensitivity and optimize key modulation parameters, including the modulation frequency and index, to maximize the demodulation slope. In addition, a self-heterodyne system is built to investigate the relationship between the half-wave voltage of the PZT phase modulator and the modulation frequency, ensuring optimal modulation parameters. Finally, a broadband source-driven RFOG system is constructed and tested in a static environment at room temperature. An Allan deviation analysis is conducted to evaluate the gyroscope’s precision and bias stability.Results and DiscussionsAn RFOG system is constructed, featuring a 39-m-long SM-FRR with a definition of 58.5 as the core sensitive element. The optimal modulation parameters are determined to be a modulation index of 1.3 and a modulation frequency of 69 kHz, yielding a theoretical sensitivity of 0.0025 (°)/h1/2, limited by the photodetector’s shot noise. The developed RFOG, incorporating a low-power broadband light source, a PZT phase modulator, and an FPGA for data processing, demonstrates outstanding performance in experimental testing. The measured angular random walk (ARW) is 0.0219 (°)/h1/2, and the bias instability (BI) is 0.031 (°)/h (Fig. 10). These results confirm that the proposed broadband source-driven RFOG design significantly reduces system costs while maintaining high performance.ConclusionsWe demonstrate a novel RFOG driven by a broadband light source. The system’s optical path features a low-power broadband light source, a PZT phase modulator, and an SM-FRR. Through optimized modulation parameters, the gyroscope operates at the maximum demodulation slope, achieving optimal performance. This innovative approach provides a promising path toward integrated, cost-effective medium- and high-precision fiber-optic gyroscope technology.
Jan. 23, 2025Vol. 45 Issue 2 0206007 (2025)
Wucheng Ding, Heming Wei, Yan Wei, Mengshi Zhu, Liang Zhang, and Fufei Pang
ObjectiveAs one of the earliest natural phenomena to be studied, sound waves carry abundant information and energy. Acoustic sensors play a key role in fields such as fire safety, structural health monitoring, extreme environment communication, smart grid security detection, and medical imaging. With the rapid development of information technology, the demand for high-sensitivity and wide-bandwidth acoustic signal detection has increased. Recently, the research focus in acoustic sensing has shifted from electroacoustic to photoacoustic technology. Compared to electroacoustic sensors, fiber-optic acoustic sensors offer advantages such as high sensitivity, wide dynamic range, fast response, and excellent anti-electromagnetic interference performance. As these sensors are made from non-metallic, insulating materials, they are suitable for environments where electroacoustic sensors may fail, including those with strong electromagnetic interference, flammable or explosive conditions, and high temperatures or pressures.MethodsThe fiber-optic Fabry?Perot (FP) interferometer integrates optical elements into the fiber, retaining the high sensitivity and precision of traditional FP interferometers, while overcoming the challenges of size and environmental sensitivity. The fiber-optic acoustic sensor uses a double-reflector setup to create the FP cavity, leveraging the diaphragm’s simple structure, ease of fabrication, and high sensitivity. When an external sound pressure signal affects the diaphragm, it induces slight deformation, altering the length of the FP cavity, which in turn causes fluctuations in the interference spectrum and changes in the intensity and phase of the reflected light. Detailed information about the external acoustic signal can be derived by detecting these changes. The material and structure of the diaphragm are crucial to the performance of the FP cavity. Silicon nitride membranes, known for their high mechanical stiffness and superior elasticity, offer highly sensitive responses to vibrations caused by small sound waves and can effectively detect acoustic signals over a wide frequency range. MEMS processing, with its high precision, miniaturization, high yield, and ease of mass production, has gained considerable attention. It uses silicon as base material, with most diaphragm-sensitive structures being made from silicon, silicon nitride, or silicon oxide. In MEMS processing, silicon nitride films are commonly deposited using chemical vapor deposition (CVD) and are widely employed as sensitive membrane materials.Results and DiscussionsThe results show that both sensor structures respond well to sound waves, with the 50 nm thick, 2 mm×2 mm exhibiting a higher response. The output voltage signals from both sensors increase linearly with sound pressure, indicating good linearity in response. The minimum detectable pressure (MDP) of the 50 nm (2 mm×2 mm) sensor is 2.57 μPa/Hz1/2 @ 16.5 kHz, while that of the 30 nm (1 mm×1 mm) sensor is 3.71 μPa/Hz1/2 @ 14.5 kHz, demonstrating their potential for acoustic wave sensing applications.ConclusionsUsing MEMS technology, two types of silicon nitride membranes are fabricated, leading to the development of fiber-optic FP acoustic wave sensors with reflection spectral extinction ratios of 26.5 and 25.0 dB, respectively. Both sensors show excellent frequency response within the human voice frequency range in audio experiments. The resonant frequency of the 50 nm thick, 2 mm×2 mm sensor is about 16.5 kHz, with a sound pressure sensitivity of 60.175 mV/Pa and MDP of 2.57 μPa/Hz1/2. These MEMS-based fiber-optic acoustic sensors offer high sensitivity, reliability, and strong linearity, presenting great potential for future applications in acoustic sensing.
Jan. 22, 2025Vol. 45 Issue 2 0206008 (2025)
Jianlei Zhang, Youwei Zhang, Danqi Hua, Yu’ang Dou, and Pengtao Dang
ObjectiveTo mitigate the scintillation effect caused by oceanic turbulence on received light intensity and reduce its influence on the performance of underwater wireless optical communication (UWOC) systems, we propose an adaptive combining algorithm based on traditional anti-scintillation methods to enhance the system’s stability and save energy.MethodsBased on a single-input-multiple-output (SIMO) system, our proposed adaptive dynamic combining algorithm uses multiple branches to receive signals, and the activation state and combining strategy of each branch are adaptively controlled according to the signal-to-noise ratio (SNR). We conduct simulations to evaluate bit error rate (BER), outage probability, and energy consumption performance of two-branch and three-branch systems under channel conditions with a scintillation index of 0.32 and Gaussian white noise variance of 0.49. Additionally, under the condition of two-branch reception, we simulate the influence of turbulence intensity on UWOC system performance by placing 1, 2, and 3 heating rods in a water tank to verify the performance of the adaptive algorithm under two-branch reception. The results confirm the effectiveness of our proposed adaptive combining algorithm.Results and DiscussionsTo demonstrate the performance of our proposed algorithm, we first conduct a simulation analysis under channel conditions with a scintillation index of 0.32 and noise variance of 0.49, focusing on the performance of both two-branch and three-branch configurations. The analysis covered BER, outage probability, and energy consumption. The results indicate that the anti-scintillation performance of the three-branch combination is superior to that of the two-branch combination, with lower BER and outage probabilities in the three-branch setup (Figs. 7 and 9); however, the energy consumption is higher for the three-branch reception. Additionally, a comparison between the performance of our adaptive algorithm and traditional algorithms reveals that our proposed adaptive algorithm exhibits BER and outage performance only slightly lower than that of the maximum ratio combining (MRC) algorithm while outperforming the equal gain combining (EGC) and selection combining (SC) algorithms (Figs. 6?9). From the perspective of energy consumption, our adaptive algorithm demonstrates superior performance, effectively reducing energy usage. Furthermore, we conduct experiments to validate the performance of our proposed adaptive algorithm under two-branch reception across different scintillation index conditions (Table 1), confirming the effectiveness of the adaptive algorithm presented in this study.ConclusionsThe results show that our proposed adaptive combining algorithm exhibits excellent anti-scintillation performance and outperforms traditional combining algorithms in terms of energy efficiency. Simulation results for two- and three-branch anti-scintillation performance demonstrate that the system’s anti-scintillation capability improves with the number of branches, but merely increasing the number of branches offers limited enhancement. It cannot infinitely improve the system’s BER, SNR, and outage performance, and system energy consumption also rises with more branches. Additionally, by using two-branch reception, we simulate turbulence intensity by adding one, two, and three heating rods in a 1 m water tank to assess the influence on the UWOC system. This experiment validates the advantages of our proposed adaptive algorithm in terms of BER, outage performance, and energy consumption. Our adaptive combining algorithm achieves BER and outage performance slightly lower than MRC but superior to EGC and SC algorithms, while showing better energy efficiency than traditional methods.
Jan. 25, 2025Vol. 45 Issue 2 0206009 (2025)
Xin Cao, Bo Dong, and Yulei Bai
ObjectivePhase-contrast optical coherence tomography (PC-OCT) integrates phase-contrast techniques with optical coherence tomography. It is applicable to the mechanical characterization and testing of various biological tissues and non-biological materials. It has the potential for early disease diagnosis or early detection of damage and becomes an important direction for future functional imaging development. However, according to the Nyquist sampling theorem, the measurement range of system strain is limited by the sampling frequency of the interference signal. Reducing the sampling rate will inevitably lead to aliasing artifacts in the acquired phase images, making strain calculation difficult. Therefore, without changing the existing structure of the PC-OCT system, designing a phase reconstruction method for spectral undersampling in PC-OCT can extend the measurement system’s depth range. This significantly reduces the sampling rate requirements of the measurement system, thus enabling rapid imaging of the deep internal regions of materials. This is crucial for the early diagnosis of diseases and the detection of damage.MethodsWe present a data-driven convolutional neural network (CNN) method for phase reconstruction in spectral undersampling of PC-OCT to extend the strain depth range of PC-OCT. First, we use the self-built PC-OCT system to collect the original interference signals of various types of composite materials under different loading conditions. After pre-processing such as interpolation, we obtain simulated undersampling and oversampling interference signals. The real and imaginary parts of the undersampling signals are the inputs, while the real and imaginary parts of both undersampling and oversampling signals are the inputs and labels for training the CNN. Then, after the network training is completed, we design two new sets of experiments. We collect interference signals sorted by time frames using the self-built PC-OCT. We randomly select interference signals from two consecutive time frames for undersampling processing. These unseen data by the network are then predicted. We obtain the phase strain calculation results before and after the network prediction through the vector method. Finally, we conduct a qualitative comparison of the prediction results and a quantitative analysis using the mean square error (MSE) as the evaluation metric to validate the effectiveness of the proposed method in this study.Results and DiscussionsWe construct a PC-OCT measurement system (Fig. 4) and design two sets of loading experiments under different conditions (Fig. 5) to collect the original interference signals in an oversampling state. Subsequently, we process interference signals from two randomly selected consecutive time frames through linear interpolation and other undersampling techniques to simulate the real and imaginary parts of signals under different undersampling conditions. Then we feed them into a CNN for prediction. We obtain the phase signals predicted under different undersampling conditions through phase contrast techniques. Finally, we calculate the strain results corresponding to the undersampling phases and the oversampling phases predicted using the vector method (Figs. 6 and 8). The results show that when the undersampling rate is low, that is, the phase is near aliasing, the strain results calculated by both the vector method and the CNN+vector method are quite accurate. However, as the undersampling rate increases, that is, the degree of phase aliasing intensifies, the direct use of the vector method can still calculate the strain for the non-aliased phase parts, but the aliased phase parts exhibit severe distortion. The data-driven method proposed in this study can accurately and stably reconstruct the corresponding oversampling phase for different undersampling aliased phases and can calculate the oversampling corresponding strain field well using the vector method, effectively extending the measurement range of the system by three times. Mechanical loading experiments demonstrate the method’s ability to accurately reconstruct the phase in layered samples subjected to deformation, and thermal loading experiments further confirm the robustness of the method in handling complex phase patterns caused by internal defects and uneven thermal deformation. Finally, the mean square error (MSE) consistently shows high performance at different under-sampling rates (Figs. 7 and 9), indicating the reliability and accuracy of the method.ConclusionsWe propose a data-driven CNN method that can reconstruct aliased phases from undersampling to oversampling phases, thereby extending the measurement range of the phase-contrast OCT system. This method does not require modifications to the optical structure or parameters of the OCT system, making it an economical and efficient solution for enhancing imaging capabilities. The data-driven approach also reduces the sampling rate requirements, enabling rapid tomographic imaging of deep tissue areas without sacrificing image resolution. Although this method requires a large amount of training data and computational resources, the proposed method offers a promising direction for the development of lightweight, unsupervised undersampling phase reconstruction models.
Jan. 22, 2025Vol. 45 Issue 2 0211001 (2025)
Jiuduo Rui, Zhixun Wu, Jiaxin Deng, Jiabo Zhang, Zhigang Han, Qing Wang, and Rihong Zhu
ObjectiveThe wafer polishing pad is a critical component in achieving global planarization of the wafer surface during the integrated circuit manufacturing process. Its surface shape has a significant effect on wafer yield. To optimize the shape of the wafer polishing pad, strict quality control measures are necessary. Precision measurement technology plays a vital role in ensuring quality. Currently, the integrated circuit industry is moving towards larger wafer sizes and smaller feature dimensions, presenting new challenges for measuring the shape of wafer polishing pads. Interferometry is one of the most effective and intuitive methods for surface measurement due to its non-contact nature, high accuracy, and rapid operation. However, traditional large-aperture Fizeau interferometers face significant manufacturing difficulties and high costs. Moreover, they often struggle to accurately measure the surface shapes of large-diameter wafer polishing pads due to limitations such as restricted dynamic range, light scattering, and diminished stripe contrast. Grazing-incidence interferometry provides an effective solution to these limitations, addressing issues related to aperture size, dynamic range, and contrast. Nevertheless, when measuring large-diameter wafer polishing pads with long interferometric cavity lengths, new challenges such as airflow disturbances and vibrations emerge. To address these issues, we propose to measure the surface shape of large-aperture wafer polishing pads using a grazing incidence splicing technique within a beam-expanding dynamic interferometer.MethodsThe challenges related to aperture size, dynamic range, and contrast in the interferometric measurement of large-aperture wafer polishing pad surfaces are effectively addressed through grazing incidence interferometry and sub-aperture stitching techniques. A high-precision and high-stability beam expansion system effectively compensates for the limitations of the dynamic interferometer regarding measurement aperture. At the same time, the inherent anti-interference capabilities of the dynamic interferometer can address the issue of environmental disturbances affecting the grazing incidence light path of large-aperture optical components. Based on a self-calibrating sub-aperture stitching algorithm, the influence of system defocus on grazing incidence measurements is decomposed into unequal astigmatic circles in the x and y directions, which are then deducted. This approach enables the measurement of the surface shape of large-diameter rough optical elements by correcting the defocus-induced errors of the beam-expanding dynamic interferometer.Results and DiscussionsWe develop a 150 mm beam-expanding dynamic interferometer to conduct wavefront calibration experiments. We perform outgoing wavefront stability monitoring experiments with different clamping configurations for the beam expansion collimators. The results indicate that the distributed fastening screw clamping scheme has better stability than the hard-contact clamping scheme using polytetrafluoroethylene (PTFE) pads. It maintains a wavefront peak valley (PV) value stable at approximately 0.1λ over a period of 9 h, with a maximum deviation not exceeding 0.108λ. Using the 150 mm beam-expanding dynamic interferometer, we collect sub-aperture data from a Ф576 mm polishing pad sample produced by KYOCERA Corporation in Japan. The data are stitched together using both a standard stitching algorithm and a self-calibrating astigmatic circle algorithm. The results reveal that the standard stitching algorithm is significantly affected by defocus-induced system errors, resulting in jump errors at the sub-aperture junctions. In contrast, the self-calibrating sub-aperture stitching algorithm effectively mitigates the influence of system errors, yielding a smooth transition. Ultimately, the stitched wavefront yields a PV value of 4.784λ and a root-mean-square value of 1.151λ. A comparison is made between the central cross-sections of the composite surface shape at angles of 0°, 45°, 90°, and 135° and the measurements from a coordinate measuring machine provided in the sample’s factory report. The average measurement error for the cross-section heights is 0.1375 μm, while the flatness error is 0.17 μm, both within acceptable limits.ConclusionsWe develop a grazing incidence splicing surface error measurement method based on beam expanding dynamic interferometer, which can solve the problem of surface error detection of large diameter wafer polishing pad in workshop environment. We investigate the issue of defocus variation in the system’s outgoing wavefront and employ a self-calibrating astigmatic circle sub-aperture stitching algorithm to decompose the influence of system defocus on grazing incidence measurements into unequal astigmatic circles in the x and y directions, which are then corrected. Simulation results demonstrate that this algorithm can effectively eliminate the interference caused by system defocus during sub-aperture stitching, providing a robust algorithmic foundation for high-precision sub-aperture measurements. Experimental comparisons are conducted to assess the degradation of the system’s outgoing wavefront under different clamping configurations over the same period. The results indicate that the distributed fastening screw clamping scheme significantly enhances system stability. A sub-aperture stitching detection device based on a grazing incidence beam-expanding dynamic interferometer is established to measure a Ф576 mm wafer polishing pad sample. Comparing the measurement results with those from the factory’s coordinate measuring machine reveals that the average measurement error for cross-section heights is 0.1375 μm, while the flatness error is 0.17 μm. Experimental results demonstrate that this method can inspect the surface error of wafer polishing pads, thereby expanding the application scope of dynamic interferometers.
Jan. 25, 2025Vol. 45 Issue 2 0212001 (2025)
Yingping Ma, Zhigang Feng, Jian Wang, Zhenfei Song, and Jifeng Qu
ObjectiveAs the reform of the International System of Units (SI) progresses, many quantum metrology standards based on the superior characteristics of the atomic system have been successfully developed to replace physical standards, such as atomic clocks, atomic magnetometers, and atomic gravimeters. Recently, a new method of microwave electric field measurement with a wide frequency band and high sensitivity has been developed based on the quantum coherent spectroscopy of Rydberg atoms. Compared with conventional techniques, the Rydberg-atom-based microwave electric field measurement technique can transform the microwave field strength measurement into a higher-accuracy Rabi frequency measurement through atomic constants and directly link the microwave electric field strength to the SI. However, the discrete distribution of Rydberg energy levels leads to the limitations of discrete frequencies and narrow bandwidths in microwave electric field measurement. Although various methods for continuously tuning the frequency of the microwave field have been developed, such as resonant microwave tuning, far-detuned microwave AC Stark tuning, and DC Stark tuning, these methods often involve complex experimental setups and rely on discrete energy levels. Therefore, we use an off-resonant strong microwave field to measure the continuous tuning frequency range of the measured microwave electric fields through the AC Stark shift characteristics of Rydberg energy levels.MethodsWe conduct continuously tunable frequency measurements of the microwave electric field based on the near-off-resonant AC Stark effect in a rubidium atomic vapor cell. A ladder-type electromagnetically induced transparency (EIT) three-level configuration is formed by a ground state, 5S1/2, an excited state, 5P3/2 (F'=3), and a Rydberg state, 73S1/2. The probe laser and the coupling laser with the same linear polarization are overlapped and counter-propagated through the vapor cell. The weak probe laser with a wavelength of 780 nm is locked to the transition of 5S1/2(F=2)→5P3/2(F'=3). The strong coupling laser with a wavelength of about 480 nm is frequency scanned across the transition of 5P3/2(F'=3)→73S1/2. The near-off-resonant strong microwave tuning field and the measured microwave electric field are simultaneously applied to the atomic vapor cell through a single microwave horn antenna. When a weak resonant microwave electric field is applied, which is read out by an all-optical Rydberg electromagnetically induced transparency and exhibits Autler?Townes (AT) splitting spectrum as the measured field, the strong near-off-resonant microwave as tuning fields is then used to tune the Rydberg level by the AC Stark effect. By varying the frequency and power of the tuning field, we measure the resonance frequency of the AT splitting spectrum for 73S1/2 to adjacent nPj Rydberg states under different AC Stark shifts and obtain the continuous tuning frequency range of the measured microwave electric field.Results and DiscussionsWe measure the coupling resonance frequency ranges from 73S1/2 to 72P1/2, 72P3/2, 73P1/2, and 73P3/2 Rydberg states by the AC Stark shift characteristics induced by the near-off-resonant strong microwave field. We investigate in detail the influence of the frequency and power of the tuning field on the resonance frequency of the measured microwave field. Under the influence of the tuning field, the resonance frequency of the measured microwave electric field changes with the frequency shift of Rydberg energy levels, with the corresponding EIT-AT splitting peak resonance frequency shift (Fig. 2). The maximum unidirectional resonance frequency tuning range of the measured microwave field is about 151 MHz. Considering the bidirectional frequency shift characteristics, the maximum continuous tunable range of the resonance frequency reaches over 200 MHz. The maximum continuous frequency tuning range reaches 400 MHz by combining the bidirectional tuning characteristics and different coupling state combinations (Fig. 3). Additionally, we investigate the variation of Autler?Townes splitting frequency intervals with microwave power under different resonance conditions. For the same resonance frequency shift, small detuning and low-power tuning fields have a smaller effect on the strength measurement of the test field compared with large detuning and high-power tuning fields and have a larger linear dynamic range (Fig. 4).ConclusionsWe introduce a novel method for continuous tunable microwave electric field measurement based on the near-off-resonant AC Stark effect in a Rydberg atomic vapor cell. We measure the continuous resonance frequency tuning range of microwave coupling between rubidium Rydberg atom 73S1/2 and adjacent nPj states. The maximum unidirectional tunable range for measurement is 151 MHz, and the maximum continuous frequency tuning range reaches 400 MHz by combining the bidirectional tuning characteristics and different coupling state combinations. Different from the resonant tuning method that depends on extra Rydberg levels, this method based on the AC Stark shift can achieve continuously tunable frequency measurement with a single Rydberg state and single microwave horn antenna. This approach not only overcomes the limitations of discrete frequency and narrow band of the existing Rydberg atomic microwave electric field measurement but also simplifies the system structure and enhances the practicability of the system. Our study lays the foundation for quantum metrology and the traceable measurement of microwave electric fields based on Rydberg atoms.
Jan. 22, 2025Vol. 45 Issue 2 0212002 (2025)
Jiahao Wang, Jun Ma, and Wanqing Ding
ObjectiveIn the process of aircraft approach and landing, stable and reliable long-range high-precision spatial angle measurement is one of the most critical technical challenges. The key issue lies in achieving accurate spatial angle measurement under various interference factors, including terrain complexity, meteorological conditions, and potential electronic interference. There has been significant research on long-range high-precision spatial angle measurement technologies for aircraft landing systems, such as instrument landing system (ILS) and microwave landing system (MLS), which perform well in open airspace without electromagnetic interference. However, in modern military applications, radio silence and radio frequency (RF) denial techniques have become common forms of electronic warfare. In such environments, the effectiveness of these systems is significantly reduced, or they may fail. To address these challenges, some scholars have explored vision-based spatial angle measurement technologies. However, vision-based systems are limited in their ability to provide large-scale, high-precision spatial angle measurements, and are also susceptible to interference from strong light and adverse weather conditions (such as haze and cloud cover), thus degrading their performance. In this paper, we propose a spatial angle measurement technique based on a laser time-grating field, offering a feasible solution for achieving remote and high-precision dynamic spatial angle measurement in radio silence and RF denial environments.MethodsThe spatial angle measurement technology based on the laser time-grating field is implemented through the collaboration of a reference station and a positioning unit. The reference station uses high-power lasers to emit two pulsed modulated laser beams containing time-grating encoded information. These laser beams are scanned uniformly in both the azimuth and elevation directions by two high-precision optical scanners. After being shaped by a precision optical system, the beams form two laser strips with specific geometric configurations. The laser strip scanned in the azimuth direction is referred to as the X-strip, and the one scanned in the elevation direction is referred to as the Y-strip. The scanning and encoding of these X and Y strips generate a two-dimensional laser time-grating field, forming the measurement space. Within the space, the positioning unit can determine its precise azimuth and elevation angles relative to the reference station by analyzing the time-grating encoded information, while considering the motion characteristics of the scanners. This enables high-precision two-dimensional spatial angle measurement.Results and DiscussionsIn this paper, we propose a spatial angle measurement technology based on the laser time-grating field, where the reference station and the positioning unit collaborate to perform two-dimensional spatial angle measurements. A prototype system based on this technology is built, and static and dynamic angle measurement experiments are conducted in the field. The experimental results show that the static angle measurement error for the azimuth and elevation angles is -0.003359° and -0.001044°, respectively, while the root mean square errors for dynamic angle measurements are 0.001741° and 0.001739°, respectively. The positioning unit operates normally within a range of 6500 m from the reference station. With a scanning range of ±10° in both azimuth and elevation directions, the measurement space forms a conical region centered at the reference station. This demonstrates long-range, high-precision dynamic spatial angle measurement, fully validating the feasibility of this technology. While the operating range of this system is not as extensive as ILS and MLS, its accuracy in spatial angle measurement is far superior, particularly in radio silence and RF denial environments, which makes it an effective complement to current aircraft landing systems.ConclusionsIn this paper, we propose a spatial angle measurement technique based on the laser time-grating field. By establishing a precise relationship between the spatial scanning angle and the time reference, the high accuracy of time-based measurements is maximized. The spatial angle measurement accuracy achieved by this system surpasses that of ILS and MLS in environments with radio silence and RF denial. A prototype of the system has been constructed, demonstrating a working distance of at least 6 km and the angle measurement accuracy is 1?2 orders of magnitude greater than ILS and MLS. This provides a viable solution for achieving long-range, high-precision dynamic spatial angle measurement in radio silence and RF denial environments.
Jan. 22, 2025Vol. 45 Issue 2 0212003 (2025)
Jianzhou Zhuang, Make Zhao, Zhe Liu, Wenjie Peng, Haofan Sun, Xiang Chen, Yuxin Leng, and Jianhui Bin
ObjectiveRecently, plasma optics have gained significant attention due to their high damage threshold, making them ideal for ultrafast, ultraintense lasers. Novel concepts for plasma-based photonic devices have been proposed, including plasma mirrors, plasma lenses, plasma gratings, plasma wave plates, and plasma polarizers. For example, plasma-based polarizers have been demonstrated at Lawrence Livermore National Laboratory using low-density gas targets. However, polarization optics based on solid, dense plasmas have not been widely explored. In this paper, we propose a new design for plasma polarization optics based on overdense, nanometer-thin foils. We investigate this concept using particle-in-cell (PIC) simulations. By carefully adjusting plasma parameters, the nanometer-thin foil behaves like a linear polarizer or a quarter-wave plate. This behavior is driven by the inhomogeneity of the plasma density distribution resulting from the interaction, as confirmed by three-dimensional PIC simulations.MethodsWe investigate plasma polarization optics using the epoch code, conducting both two-dimensional (2D) and three-dimensional (3D) simulations. A nanometer-thin foil composed of protons and electrons is placed in the simulated region, with dimensions of 50λ×20λ for the 2D simulation and 20λ×10λ×10λ for the 3D simulation. These regions are divided into 50000×500 and 4000×500×500 grids, respectively. A circularly polarized laser with 800 nm wavelength and a 2.5 μm spot size is focused onto the target and propagates along the x-axis, with peak intensities of 1×10²⁰, 5×10²⁰, 9×10²⁰ W/cm2. The electron density of the targets is set to 50nc, 100nc, and 150nc, with target thickness varying from 0.01λ to 0.40λ. The polarization of the transmitted laser is calculated by integrating the laser energy along the Ey and Ez components, and the phase is estimated from the mean phase difference between the local maxima of the electric field. The 2D electron density distribution from the 3D simulations is extracted by lineout along the center of the y- and z-axes and the 1D electron density distribution along the x-axis is extracted from the center of the 2D electron density distribution.Results and Discussions2D simulations show that when a circularly polarized laser passes through a 0.1λ thick, 150nc target, the electric field along the z-axis is significantly suppressed, resulting in an extinction ratio of about 0.84. The transmitted laser then becomes nearly linearly polarized along the y-axis. Further parameter scans with varying thickness and electron density show that the phase difference and polarization undergo dramatic changes in the relativistically induced transparency (RIT) region where laser transmission drops to about 1%. At RIT, the phase difference between Ey and Ez reaches its maximum, and the polarization increases sharply from a relatively small value before saturating when the target thickness or electron density reaches a specific value. In addition, the incident angle plays a crucial role in determining the phase difference. By carefully adjusting the target’s thickness, electron density, and twist angle, we can achieve significant phase delay between the electric fields along the y- and z-axes. A phase delay of π2 is achieved when the circularly polarized laser passes through plasma with a thickness of 0.045λ and an electron density of 150nc. The polarization transitions from circular to linear, with an angle of 45° to the y-axis.ConclusionsIn this paper, we propose a new design for plasma polarization optics based on overdense nanometer-thin foils, and the polarization behavior of these foils is explored using both 2D and 3D PIC simulations. A linear polarizer or quarter-wave plate is demonstrated under specific parameters. We believe these results will be of great interest to the community and could influence the state-of-the-art in the field of high-field laser science.
Jan. 22, 2025Vol. 45 Issue 2 0214001 (2025)
Chaoliang He, Ting Yan, Tianyu Ma, and Xiaojiao Duan
ObjectiveHigh-voltage cables are crucial for constructing a safe and reliable urban power grid amid rapid urbanization. Damage to these cables can severely influence power transmission, potentially causing safety issues and economic losses. Maintaining high-voltage cables is challenging and costly, highlighting the need for efficient, non-destructive defect detection methods. Traditional methods, such as partial discharge detection, high-order harmonic analysis, and broadband impedance testing, struggle to accurately detect buffer layer ablation defects and locate specific defect positions. In contrast, computed tomography (CT) imaging provides a more intuitive visualization of defects and can quantify buffer layer ablation sizes from certain angles. However, conventional circular CT (RCT) techniques are unsuitable for detecting in-service high-voltage cables in confined spaces. In this study, we address the challenges of in-service cable detection by utilizing L-STCT technology combined with a deep learning-based method, using an improved Cascade R-CNN (region-convolutional neural network) to enhance the recall rate. The proposed method offers an effective solution for the non-destructive detection of internal cable defects.MethodsWe utilize L-STCT scanning to detect cable defects, with the SIRT algorithm used for image reconstruction. The resulting images are preprocessed to create an L-STCT dataset. To extract deeper features from the images, the ResNeXt101 with 64 filters is integrated into the Cascade R-CNN as the backbone for feature extraction, mitigating issues such as gradient vanishing and overfitting caused by excessive network depth. An attention mechanism is incorporated to help the network focus on defect-related information, improving its resistance to noise and artifacts. In addition, the EFPN module is introduced to enhance the detection of small targets while preserving other valuable information, enabling multi-scale feature extraction. The original position regression function is replaced with the Focal-EIoU loss function for more accurate localization, forming an optimized Cascade R-CNN. Although RCT cannot be directly applied to in-service cable detection, the similarity between RCT and L-STCT datasets allows for transfer learning; the network is pre-trained on the RCT dataset and then fine-tuned on the L-STCT dataset to further improve the recall rate of the network.Results and DiscussionsAblation experiments confirm that the improved Cascade R-CNN network exhibits enhanced noise and artifact resistance with the introduction of the attention mechanism, while the EFPN module effectively identifies small defect structures. Compared to the original network, the optimized version shows significant improvements in accuracy and recall, demonstrating the algorithm’s suitability for cable defect detection (Table 3). The performance of the enhanced algorithm surpasses that of many mainstream target detection networks under the same dataset conditions (Table 4). The approach also offers advantages such as lower dataset and hardware requirements, making it highly practical. Transfer learning results indicate that pre-training the network on the RCT dataset improves its performance on the L-STCT dataset. Following transfer learning, the network achieves higher accuracy and recall rate comparable to those obtained with the original network (Table 5), confirming the effectiveness and applicability of the improved network.ConclusionsIn this study, we propose an enhanced cable defect detection algorithm based on the Cascade R-CNN, tailored to address challenges such as background noise and the detection of small targets. The algorithm performs well on the L-STCT dataset, achieving an accuracy of 0.884 and a recall rate of 0.927. With the RCT dataset pre-training, accuracy improves to 0.901, and recall reaches 0.959. The results demonstrate that while RCT cannot be directly applied for in-service cable defect detection, the similarities between the RCT and L-STCT datasets facilitate transfer learning, guiding the network to more effectively detect defects. The proposed algorithm offers a high defect recognition accuracy and a low miss rate, making it valuable for detecting defects in in-service cable buffer layers.
Jan. 23, 2025Vol. 45 Issue 2 0215001 (2025)
Youzhao Lan
ObjectiveFor two-dimensional layered hexagonal boron nitride (2D-hBN) materials, various defects are inevitably generated during experimental synthesis. Defects directly affect the electronic structure of the material and thus influence the optical properties of the material. The defect-related electronic states cause the red-shift of the linear absorption spectrum from the deep ultraviolet region of pristine 2D-hBN to the ultraviolet?visible region of defective 2D-hBN. Meanwhile, defects also have a significant effect on the nonlinear optical properties of the material. Recent experiments have shown that defects increase the nonlinear second-harmonic generation (SHG) coefficient of 2D-hBN by an order of magnitude. These findings suggest that defects can be used to tune the nonlinear optical properties of materials. To use defects to tail the optical properties of materials, it is of great significance to reveal their influence on optical properties from a microscopic view. In this study, we attempt to study the influence of point defects on the SHG coefficient of monolayer 2D-hBN (ML-BN). The sum-over-states method is used to study the microscopic mechanism of the enhancement of SHG coefficients and to reveal the relationship between the enhanced SHG coefficients and defect states.MethodsWe create three vacancy-related defective structures in the 5×5 supercell of ML-BN (Fig. 1). The PBE functional of generalized gradient approximation (PBE-GGA) combined with the norm-conserving pseudopotential plane-wave method is used to optimize all defective structures. We use a 3×3×1 k grid, a force threshold of 0.01 eV/?, and a pressure threshold of 0.02 GPa for optimization. The relaxation of the unit cell is included during the optimization process and a vacuum spacing greater than 15 ? is used to ensure negligible interlayer interactions. The PBE-GGA combined with the norm-conserving pseudopotential plane-wave method is used to calculate the energy band structure of three defective structures. A k-grid of 24×24×1 and a kinetic energy cutoff of 60 Ry are used in the calculations. The linear and nonlinear optical properties are calculated within the independent particle approximation (IPA). The linear one-photon absorption (OPA) ?2(ω) and the SHG coefficient χzyx(-2ω;ω,ω) are calculated by the sum-over-states expressions Eqs. (1)?(3). A 24×24×1 k grid and 200 IPA empty states (300 states in total) are used to obtain the converged SHG spectra within 4 eV. Hybrid GGA-HSE06 calculations are performed to correct the energy band structure used in optical calculations.Results and DiscussionsThe OPA of VN almost overlaps with that of ML-BN in the input photon energy range from 6 eV to 8 eV and shows a characteristic absorption peak at about 3.3 eV (Fig. 4). The reason for the overlap is that the absorption peaks after 6 eV are mainly transitions between intrinsic states. The defects result in a characteristic absorption peak at about 3.3 eV. This characteristic absorption peak mainly originates from the electronic transition from the defect band 98 to the intrinsic conduction band (101, 102, and 103). The B-atom vacancy defect leads to three OPA characteristic absorption peaks (Fig. 5). These three characteristic absorption peaks are mainly formed by the transition of electrons from the valence band to three defect states. VBN has two characteristic absorption peaks at the same position in two directions. The transition of electrons from the intrinsic valence band and the defect state at the valence band edge to the defect state 97 produces these two characteristic absorption peaks (Fig. 6). For both the real part Re[χxxx(2)(ω)] and the imaginary part Im[χxxx(2)(ω)] of VN, pure interband transitions and intraband transitions have similar contributions with opposite signs, which leads to relatively small SHG coefficients in the entire 4.0 eV range except for the near-resonance peak (Fig. 7). The SHG enhancement peaks within 4 eV are caused by single-photon or two-photon resonance, or both. The two-photon resonance process related to the defect bands plays a major role in the enhancement of the SHG coefficient. For VB and VBN, contributions of defect bands to the enhancement of the SHG coefficient are also observed and the defect bands are located by tracing the sum-over-states process (Figs. 8 and 9). In the range of 1.0 to 4.0 eV, the defective structure has a significant enhancement in SHG coefficient relative to native ML-BN (Fig. 10). Although it is difficult to directly compare the theoretical and experimental results quantitatively, the enhancement in the SHG coefficient caused by the defect state is consistent qualitatively between the theory and the experiment.ConclusionsThe defect unit leads to the defect states in the energy band gap of native ML-BN, which causes a red shift of the OPA spectrum from the deep ultraviolet region to the ultraviolet?visible region. Tracing the sum-over-states process confirms the main contribution of defect states to the absorption peak in the UV-visible region. In the visible light region, the enhancement of the SHG coefficient is caused by single-photon or two-photon resonance, or both. Compared with the SHG of native ML-BN, the SHG of the defective structure has an obvious enhancement trend, in good agreement with recent experimental results. Our results are applicable to other defective structures such as doping and surface defects not discussed here because these defects have similar effects on the OPA and ultimately on the SHG.
Jan. 23, 2025Vol. 45 Issue 2 0216001 (2025)
Kun Mo, Xi Hou, Hu Deng, Mengcong Ma, Shuai Zhang, and Mingze Li
ObjectiveOptical surface defect detection is essential for ensuring the reliability and efficiency of optical systems. Traditional visual inspection methods, however, have become inadequate for modern production demands due to limitations in efficiency and precision. Therefore, automated detection equipment, with machine vision technology at its core, has developed rapidly. Among its components, the illumination source is critical, as an optimized lighting structure and method are key to improving image quality in defect detection. Currently, most defect detection systems use light emitting diode (LED) arrays in an annular configuration. While these light sources can be arranged for multi-angle illumination, their fixed angles limit adaptability to diverse optical element characteristics. In addition, the LED’s large dispersion angle can lead to reflected light interference, particularly problematic in curved surface detection. Therefore, we propose a multi-angle uniform illumination annular light source optimized for detecting defects on curved optical surfaces.MethodsIn designing an illumination source for detecting defects on curved optical surfaces, achieving uniformity in illumination and controlling the light’s divergence angle are primary considerations. After defining the desired illumination characteristics, an energy mapping relationship between the LED light source and the target surface is established. A plano-convex dimming lens is placed in front of the LED to achieve a narrow divergence angle and uniform illumination. The emitted light undergoes an initial adjustment upon passing through the inner surface of the lens and is further modulated by the outer surface of the lens to precisely focus on the target surface. Based on Snell’s law and energy conservation principles, a point-by-point algorithm for the lens profile bus is developed enabling the construction of a 3D model by fitting and rotating discrete profile points. To meet the requirements for defect detection on optical surfaces, unit light sources with aspheric dimming lenses are arranged in an annular pattern at equal azimuthal intervals, allowing superimposed illumination in centrally symmetric areas. A displacement mechanism enables Z-axis adjustments of the light source, while each unit light source’s incident angle is precisely controlled. This approach achieves multi-angle uniform illumination adaptable to various curved surfaces, effectively reducing reflected light interference and supporting effective dark-field illumination.Results and DiscussionsAfter importing the aspherical lens configuration into optical simulation software LightTools, we establish light source parameters and simulation conditions. Simulations verified the illumination effectiveness and the symmetric area superposition approach, confirming that design goals are met (Fig. 7). Effective illumination efficiency within the designated area is recorded at 79.96%. In addition, tests at various working distances reveal stable illumination without abrupt changes, with an average uniformity of 92.59% (Table 1). The divergence angle is controlled within ±7° (Fig. 8). Further analysis of the annular array light source’s performance across planar, concave, and convex surfaces demonstrates uniformity exceeding 90% in all cases (Fig. 9 and Fig. 11). A comparative analysis with a standard annular light source lacking a dimming lens (Fig. 12) shows that the new design significantly reduces reflected light interference. Finally, surface machining and assembly tolerances are analyzed (Fig. 13 and Fig. 14) by applying periodic error functions to the profile sampling points and adjusting the LED position. The results indicate that illumination distribution remains consistent despite machining and fitting errors.ConclusionsBy integrating optical dimming lenses with translational and angular adjustment mechanisms, this system achieves multi-angle uniform illumination, offering greater flexibility for inspecting optical elements with varying curvatures. The dimming lens is designed based on the camera’s field of view, narrowing the LED divergence angle to provide uniform illumination over the effective area. The annular light source ensures high uniformity across flat, concave, and convex surfaces through complementary center-symmetric illumination. Adjusting the incident angle within the beam’s effective range enables multi-angle illumination, effectively mitigating the reflective interference common to classical annular sources used on curved optical surfaces. Tolerance analysis shows that with a processing accuracy of 3 µm and mounting tolerance of 0.1 mm, the illumination distribution curve remains stable, confirming the design’s ease of processing and assembly.
Jan. 22, 2025Vol. 45 Issue 2 0222001 (2025)
Qiang Zheng, Yuquan Zheng, Chao Lin, and Jialun Zhang
ObjectiveIn imaging spectrometers for greenhouse gas detection, a large field of view (FOV) enables comprehensive monitoring across wide geographical or atmospheric volumes, supporting detailed spatiotemporal analysis of greenhouse gas concentrations and emission patterns. This broad coverage helps accurately identify greenhouse gas sources, providing essential data to locate and address emission points. A larger FOV enhances coverage, reduces revisit cycles, and improves the temporal resolution of the instrument. However, as the FOV increases, smile distortion and chromatic distortion become more prominent, which negatively affects spectral resolution, introduces misalignment in images, and complicates data processing tasks such as spectral radiometric calibration. Current methods for spectral line curvature correction focus primarily on two areas: calibration and optical design. While electronic calibration has shown effectiveness in mitigating smile distortion, it cannot resolve the underlying issues of spectral line curvature that influence detector efficiency and complicate pixel alignment, adding complexity to image processing. Optical design correction methods, although effective, often encounter difficulties in assembling and manufacturing optical components, especially when required to support a large FOV or instantaneous FOV systems. In this paper, we propose a novel design approach that leverages an algorithm to automatically generate prism-grating-prism (PGP) dispersion module parameters that meet performance requirements, achieving a large-field, high-resolution system with minimized smile distortion.MethodsTo develop a large-field, high-resolution spectrometer system with minimized smile distortion, we propose using a P+G+P dispersion model that combines prisms and grating. Based on the specific characteristics of smile distortion and the dispersion properties of this model, a theoretical derivation is conducted to build the P+G+P dispersion model. A parameter-solving method for correcting smile distortion within the P+G+P dispersion model is also developed. Finally, the proposed algorithm is applied to design a large-field, high-resolution spectrometer system utilizing the P+G+P dispersion model for smile distortion correction.Results and DiscussionsBased on the proposed solution for correcting smile distortion in large-field, high-resolution spectrometer systems using the PGP dispersion model, a PGP dispersion model is derived by analyzing the characteristics of smile distortion and dispersion. This includes a process to determine parameters specifically for correcting smile distortion. To validate the effectiveness of the approach, a large-field, high-resolution P+G+P spectrometer system is designed with a spectral range of 747?777 nm, a spectral resolution of 0.04 nm, and a slit length of 60 mm, making it suitable for detecting the O2-A band in greenhouse gas monitoring (Table 1). For this system, the collimator group uses an off-axis three-mirror anastigmatic structure with aspheric mirrors, while the imaging group combines spherical and aspherical lenses in a transmission structure. The design results show that the system achieves a dispersed spectrum width of 15 mm across a 30 nm spectral range, with an average spectral resolution of 0.0386 nm, exceeding the design requirement of 0.04 nm (Fig.12). At a Nyquist frequency of 25 lp/mm, the modulation transfer function (MTF) across the full spectral range is greater than 0.6 (Fig. 10), while the root mean square (RMS) spot size remains below 12 μm (Fig. 11). The corrected smile distortion at the maximum FOV is less than 1 pixel (20 μm) (Fig. 13), and the keystone distortion is approximately 0.5 pixel (20 μm) (Fig. 14).ConclusionsThe design proposed in this study offers several advantages, including easier realization of a large FOV, reduced spectral line curvature, and streamlined fabrication processes. The proposed design approach for large-field, high-resolution systems with smile distortion correction is universally applicable to P+G+P dispersion model spectrometers. In this paper, we establish a complete design process and methodology for large-field, high-resolution P+G+P spectrometers with spectral line curvature correction, enabling faster identification of optimal system parameters across various specifications. This significantly shortens the design cycle and improves design efficiency. The large-field, high-resolution P+G+P spectrometer designed here effectively corrects the severe spectral line curvature typically associated with large-field systems, without adding complexity. Compared to traditional large-field P+G+P spectrometers, the FOV is increased by 250%. The final design achieves a dispersed spectrum width of 15 mm over a 30 nm spectral range, with an average spectral resolution of 0.0386 nm. At the maximum FOV, smile distortion is maintained below 1 pixel, ensuring excellent imaging quality.
Jan. 20, 2025Vol. 45 Issue 2 0222002 (2025)
Bingcheng Wang, Huazhong Xiang, Lefei Ma, Hui Cheng, Jianting Liu, Chunxian Tao, and Dawei Zhang
ObjectiveProgressive addition lenses (PALs) are a specialized type of free-form ophthalmic lens that provide continuously clear vision from distance to near, significantly enhancing the visual experience. Thus, they have become increasingly popular among the elderly. PALs have undergone continuous design improvements and optimization, resulting in a wide variety of lens types. Given the relatively stable focal power changes in the addition zone of PALs and the higher focal power in the near vision area compared to the distance vision area, it is particularly important to accurately and appropriately evaluate the imaging quality of these lenses. We aim to evaluate the optical performance of PALs at various rotational angles using the point spread function (PSF) method in conjunction with an eye model. Due to the unique design of PALs, wearers need to rotate their eyes to adapt to changes in the visual field when viewing distant and near objects, requiring a more comprehensive simulation of visual performance. Additionally, our study will innovatively investigate which type of optical aberration most significantly affects visual blur when observing distant objects through the astigmatic zone of PALs. Our research will provide novel insights into optimizing lens design and evaluating the performance of PALs.MethodsTo comprehensively evaluate the optical performance of PALs, we propose a method based on PSF. First, we design an optical system combining the human eye and lenses in Zemax and perform ray tracing for the design of two different lenses, taking into account realistic eye rotation. The rotation angles of the eye are set within a range of ±25° in both the X and Y directions, sampled at 5° interval, generating a total of 121 rotational sampling points. This setup simulates viewing objects at far, intermediate, and near distances, allowing us to extract PSF images across all angles and distances. Next, the extracted PSF images are convolved with an aberration-free image to obtain an initial simulated retinal image. Finally, the weighting coefficients of the PSF components corresponding to each aberration term are calculated to analyze their effect on image quality. The results indicate that accurate evaluation of the optical performance of PALs requires considering the actual rotation of the eye, as the PSF images extracted after rotation provide a more precise assessment. Moreover, by solving the PSF weighting coefficients, we quantify the extent of PSF image dispersion caused by aberrations, revealing the influence of lens-related aberrations on image quality.Results and DiscussionsThe evaluation method for the optical performance of PALs based on the PSF is feasible. In Fig. 5(a), when observing a distant object through Lens 1, the top of the image shows a clear PSF, indicating sharper imaging and better lens performance. However, at the bottom of the image, the PSF blur enlarges, resulting in diminished image clarity. Similarly, in Fig. 5(b), when an object at an intermediate distance is viewed with a rotation angle of (0°, -10°), and in Fig. 5(c), when observing a close object from the bottom of the lens, the lens performance remains optimal. Figure 6 shows the variations in the clarity of the letter “E” after convolution. The PSF image results for Lens 2 are shown in Fig. 7, and the results after convolution of the acquired PSF are presented in Fig. 8. By comparing the simulation results of Lens 1 and Lens 2, it can be observed that the distance vision zone of Lens 2 is significantly more stretched compared to Lens 1. Specifically, Lens 1 reaches its minimum clarity for distance vision at (0°, -5°), while Lens 2 reaches its minimum at (0°, 0°). Moreover, in both intermediate and near vision, the clarity points of Lens 2 are shifted upwards compared to those of Lens 1. Figure 9 illustrates the PSF obtained from Zemax software on the left and the PSF reconstructed using the fitting coefficient Q on the right, with the corresponding coefficient listed in Table 5. Notably, the ±45° astigmatism (j=3, n=2, m=-2) is dominant. As the rotation angle increases, the absolute values of the coefficients for ±45° astigmatism and (0° or 90°) astigmatism (j=5, n=2, m=2) increase, leading to greater PSF dispersion. By combining Fig. 9 with Tables 5 and 7, the accuracy of the calculated aberration coefficient and its applicability in practical applications are confirmed.ConclusionsIn our study, the introduction of ocular rotation significantly enhances the realism and precision of the evaluation process. The PSF images obtained through the proposed method, when convolved with the optical system, offer a comprehensive and intuitive representation of the optical performance advantages of PALs. This method enables detailed comparisons of imaging quality across various lens designs. By comparing the values of the aberration weight coefficients at symmetrical angles, the accuracy and reliability of the evaluation method are further confirmed, allowing for a quantitative assessment of the effect of aberrations on PSF image dispersion. Our study successfully demonstrates how these aberrations affect overall image quality. For future research, reducing the sampling angle intervals can further enhance the precision of visual simulations. However, such reductions will increase the number of samples required, emphasizing the need to explore optimization strategies for calculating weight coefficients efficiently. This improvement will streamline the optical evaluation process, making it more effective for assessing and refining the performance of PALs.
Jan. 23, 2025Vol. 45 Issue 2 0222003 (2025)
Shuyuan Lü, Fei Hu, Wenfeng Luo, Tingting Zhang, and Duoduo Duan
ObjectiveThis research aims to design and investigate a high-performance chiral metasurface based on bound states in the continuum (BICs), achieving both an ultra-high quality factor (Q) and near-unity circular dichroism (CD=0.99). The study focuses on precise control of chiral responses by breaking the in-plane C2 rotational symmetry or adjusting the angle of light incidence, while maintaining out-of-plane structural symmetry. In addition, we aim to expand the application of such chiral metasurfaces to optical sensing, specifically refractive index sensing, leveraging BIC properties to enhance sensitivity and figure of merit (FOM=233 nm/RIU).MethodsTo achieve these objectives, we design a periodic array of dielectric metasurfaces consisting of square nanodisks with double notches. As shown in Fig. 1(b), the unit cell structure features a period P=850 nm, side length W0=520 nm, notch width W1=185 nm, and length L=234 nm. The nanodisks are made of high-refractive-index silicon (n=3.48) with a thickness of 350 nm, and the substrate is SiO2 (n=1.46). Circularly polarized light propagates along the -z direction, perpendicular to the metasurface. Numerical simulations are conducted using COMSOL MULTIPHYSICS, with periodic boundary conditions in the x and y directions and perfectly matched layers (PMLs) in the z direction to ensure accuracy and reliability. We initially analyze the eigenmodes and Q factors of the metasurface in momentum space, as shown in Fig. 1(c) and (d). The BICs are identified at the Γ point, where the Q factor theoretically tends to infinity, and far-field polarization states are characterized, as shown in Fig. 1(e). To study the chiral response, we introduce an in-plane asymmetry parameter δ and investigate the CD spectra and transmittance components, as illustrated in Fig. 2. We also explore the effects of oblique incidence on the chiral response (Fig. 3) and analyze how the azimuthal angle φ affects CD (Fig. 4). For the refractive index sensing application, we systematically analyze the influence of environmental refractive index changes on transmission components and CD response. Specifically, we examine shifts in cross-polarized transmission components TRL and TLR and the CD spectrum as the refractive index of the surrounding medium varies from 1.00 to 1.18, with a step size of 0.03 [Figs. 5(a) and (b)]. The linear redshift in the CD spectrum and the correlation between the CD peak shift and refractive index are also studied [Figs. 5(c) and (d)].Results and Discussions Key findings of our study include1) High-Q factor and near-unity CD. By introducing an in-plane asymmetry parameter δ, we achieve a near-unity CD (CD=0.99) alongside an ultra-high Q factor. While the Q factor decreases with increasing δ, CD remains close to unity, confirming that fine-tuning δ optimizes chiral q-BIC performance (Fig. 2). 2) Tunable chirality via oblique incidence. We find that chiral response can be precisely modulated by adjusting the incident angle θ and azimuthal angle φ. At θ=6° and φ=90°, the CD reaches a maximum value of 0.98, and the Q factor follows an inverse quadratic relationship with sin θ (Fig. 3). The magnetic dipole (MD) plays a dominant role in the chiral q-BIC mode, as evidenced by the electromagnetic field distribution [Fig. 3(e)]. 3) Refractive index sensing performance. The chiral metasurface demonstrates high sensitivity (233 nm/RIU) and excellent FOM in refractive index sensing. As the refractive index increases, resonance wavelengths of cross-polarized transmission components TRL and TLR shift linearly to longer wavelengths, and the CD spectrum exhibits a corresponding linear redshift [Fig. 5(c)]. The linear relationship between CD peak shift and refractive index change [Fig. 5(d)] confirms the sensor’s high sensitivity and reliability. 4) Physical mechanisms of CD flipping. We observe that the CD sign flips with changes in azimuthal angle φ (Fig. 4). At specific angles, CD exhibits a sign reversal, corresponding with the helicity flip in momentum space [Fig. 1(f)]. This behavior provides insights into the underlying physical mechanisms and offers new possibilities for designing chiral metasurfaces with custom CD properties.ConclusionsIn this study, we successfully design a high-performance chiral metasurface based on BICs, achieving both ultra-high Q factors and near-unity CD. We demonstrate precise control over the chiral response by breaking in-plane C2 rotational symmetry or adjusting light incidence angles. Furthermore, we extend the application of this chiral metasurface to refractive index sensing, achieving a sensitivity of 233 nm/RIU and a high FOM. Our results enhance the design principles and application scenarios for chiral metasurfaces, offering new directions for the development of optical sensors and photonic devices. The simultaneous achievement of strong CD, high Q factor, and tunable response opens up new possibilities for advanced optical and sensing applications.
Jan. 22, 2025Vol. 45 Issue 2 0224001 (2025)
Jingjing Zhang, Guicai Zhang, Xiaoxian Song, Haiting Zhang, Ying Liang, Zijie Dai, and Jianquan Yao
ObjectiveTerahertz (THz) absorbers are essential devices for suppressing electromagnetic interference or pollution in related THz system and play an increasingly important role in THz applications such as wireless communications, imaging, and sensing. Metamaterials, composed of artificially designed periodic subwavelength structure arrays, have the desired electromagnetic response beyond traditional materials. Since Landy et al. proposed the classical metamaterial-insulator-metal (MIM) absorber configuration, various THz absorbers integrating metamaterial and functional materials have been developed in both fundamental and applied research. Among them, graphene-based hybrid metamaterial THz absorbers have attracted wide attention due to their tunable transmission and flexible design. However, the natural optical properties of the ultrathin 2D graphene, like low absorption of incident waves and weak electromagnetic response, limit its applications in high-performance THz absorbers. The emerging 3D Dirac semimetal (DSM) exhibits high carrier mobility and tunable Fermi level comparable to graphene and overcomes the above-mentioned inherent disadvantages of graphene. In this study, a tunable four-band THz metamaterial absorber based on Dirac semimetal is designed. Using the finite integration method, the absorption characteristics in THz regime are systematically simulated in response to the structural parameters and Fermi levels of DSM.MethodsWe introduce a dynamically tunable four-band THz metamaterial perfect absorber based on a three-dimensional DSM. The designed MIM structure consists of DSM metamaterial layer, a dielectric layer, and a metal substrate layer from top to bottom (Fig. 1). First, we calculate the Fermi level-dependent complex permittivity of 3D DSM in the frequency range of 3.0 THz to 5.2 THz based on the Kubo formula and the two-band model (Fig. 2). Then, we perform finite-integration-method-based simulations to reveal electromagnetic field distribution and absorption spectra, and we simulate the absorption spectra of the two substructures of the rectangular ring and the circle separately. In addition, we discuss the effects of structural parameters and Fermi levels on spectral evolution and absorption properties.Results and DiscussionsFrom the electromagnetic field distribution, we can see that the strong magnetic resonance is mainly generated in the PI medium layer, while the electric resonance is dominantly excited on the surface of the DSM layer (Fig. 4). Together, they give rise to the four-band near-perfect absorption of THz waves, and this can also be interpreted by the three equivalent sub-structure resonators (Fig. 5). The absorption intensity and frequency remain stable when changing the structural parameters of R, W1, L1, and h2 within a small range (Fig. 6). As the Fermi level of DSM increases from 50 meV to 75 meV, the frequencies of the resonant peaks M1‒M4 show a blue-shift trend, and the corresponding frequency shifts are 110.5, 99.6, 45.0, and 85.5 GHz, respectively (Fig. 7). Meanwhile, the absorption intensities are relatively high with a value above 95%. By tuning the surrounding refractive index (RI) from 1.00 to 1.16, a maximum sensitivity up to 721.8 GHz‧RIU-1 can be obtained (Fig. 8).ConclusionsWe demonstrate a tunable THz metamaterial absorber based on 3D DSM through numerical simulations. The simulated electromagnetic field distributions and the impedance-matching analysis at the resonant frequency suggest that the perfect multi-band absorption is induced by the electric resonance excited on the DSM layer and the strong magnetic resonance formed in the PI layer. The resonant frequency and absorptivity show good tunability as the Fermi level of DSM changes from 50 meV to 75 meV. There is a linear relation between the resonant frequency and the surrounding refractive index, leading to a large sensitivity of 721.8 GHz‧RIU-1 in the RI sensing range of 1.00 to 1.16. Furthermore, the absorption properties are proved to be insensitive to the polarization angle of incident THz wave. These findings not only provide an important reference for the development of 3D DSM based absorbers but also pave the way for the potential applications of tunable and broadband THz devices.
Jan. 22, 2025Vol. 45 Issue 2 0224002 (2025)
Mincheng Zhao, Rongrong Xu, Lingling Deng, Huayin Bu, Yuchen Song, and Jiajin Zheng
ObjectiveIn modern photonics and optics, the development of high-performance optical devices, such as sensors, lasers, and filters with ultra-high quality factor (Q-factor), is crucial. Bound states in the continuum (BICs) are considered an effective approach for achieving this goal, as they can theoretically reach an infinite Q-factor under ideal conditions, showing great potential for various applications. BICs are generally classified into two types based on their decoupling from far-field radiation: symmetry-protected BICs (S-P BICs) and resonance-coupled BICs, also known as parameter-tuned BICs. While S-P BICs are appealing due to their straightforward predictability, their practical realization often encounters significant obstacles, including intricate structural designs, limited integration capabilities, and complex design challenges. Resonance-coupled BICs, with their simpler structure and ease of fabrication, have become the focus of research. However, the Q-factor and structural integration of resonance-coupled BICs reported in the literature still require improvement. To address this challenge, we propose a novel multilayer grating hybrid structure composed of alternating silica and titanium dioxide films. By precisely controlling the bandgap center wavelength, grating period, and material parameters of the multilayer structure, the localization of the optical field is further enhanced, resulting in a significant increase in the Q-factor. This enhancement aims to achieve breakthroughs in optical device performance and open up new possibilities for advanced photonic applications.MethodsBased on temporal coupled mode theory, a new structure for forming resonance-coupled BICs has been proposed. Using the reflection principle of the distributed Bragg reflector (DBR) method, a multilayer film structure is designed to precisely control the propagation and reflection characteristics of light waves within the multilayers. Utilizing equivalent medium theory in the design of grating structures can effectively regulate the propagation path of light waves, achieving precise control over their propagation characteristics. Finally, by employing the control variable method, we adjust system parameters such as the incident light angle, grating period, and grating material in a five-layer film grating structure to investigate the principles governing the realization of BIC in the hybrid multilayer film grating structure.Results and DiscussionsA novel multilayer grating hybrid structure composed of alternating silica and titanium dioxide films is designed by combining multilayer and grating structures (Fig. 1). First, a thorough analysis of the potential modes in the structure is conducted. By comparing a simple TiO2 grating with the proposed multilayer grating structure, guided-mode resonance (like-GMR) and Bloch surface wave (like-BSW) modes are identified. The introduction of a defect layer allows the two modes to satisfy phase-matching conditions, leading to destructive interference between the modes and forming a resonance-coupled BIC, significantly enhancing field localization. By carefully designing the period and central wavelength of the multilayer structure, further refinements are made to precisely control the spatial distribution and coupling strength between the modes. This optimization achieves a high Q-factor of ~105. In addition, the effects of incident light angle, grating period (P), and the refractive index of the grating material on the position and Q-factor of the resonant BIC are systematically studied, establishing a regular tuning strategy for achieving the resonant BIC. The results show that the incident angle has little influence on the BIC. As the grating period is incrementally enlarged, the wavelength at the BIC is observed to increase linearly, exhibiting a direct proportionality of about 1.5 times the period length. Although the material’s refractive index has a subtle effect on the BIC’s position, an increase in the refractive index is found to enhance field localization and achieve a high Q-factor (Fig. 5).ConclusionsIn this paper, we propose a multilayer grating hybrid structure that effectively forms a resonance-coupled BIC. The results show that two optical modes, like-GMR and like-BSW, coexist in the hybrid structure. By adjusting the layer thickness, the resonant frequencies of the modes can be altered, leading to strong coupling between the two modes, reducing the resonant wavelength, and enhancing light localization. Introducing a defect layer of specific thickness on the surface of the multilayer system or altering the center wavelength of the multilayer bandgap structure can achieve phase matching between the two optical modes, forming a resonance-coupled BIC with a Q-factor up to 105. In the multilayer grating structure, the wavelength of the resonance-coupled BIC increases linearly with the grating period while maintaining a high Q-factor. Furthermore, enhancing the refractive index of the multilayer materials can improve the Q-factor of the resonance-coupled BIC, further intensifying the localization of field energy. This approach provides effective theoretical guidance for designing high-Q resonances across different wavelength bands.
Jan. 22, 2025Vol. 45 Issue 2 0224003 (2025)
Lingfei Ji, Sen Zhang, Zhenyuan Lin, Jinshuai Fan, Wenlong Zhang, Tianran Yao, and Jianye Yang
SignificanceHard and brittle materials possess excellent mechanical, optical, and chemical properties. However, the demand for efficient and high-precision processing drives continuous innovation in modern processing technologies. Laser processing plays an increasingly important role in high-precision cutting and shaping of these materials due to its high flexibility, precision, and non-contact nature. In this study, we overview the current research and progress on the key technologies of laser high-precision cutting and shaping of hard and brittle materials, particularly focusing on applications involving large thickness/large length ratio, multi-dimensional components, and composite cutting and forming. In addition, we discuss the challenges and prospects of this technology, aiming to provide theoretical guidance and a technical foundation for the advancement of related industries.ProgressWe first discuss the fundamental interaction between lasers and brittle materials. We elaborate on the laser processing of large thickness brittle materials, high-precision cutting of multi-dimensional components, and composite cutting and forming technologies. Besides, we analyze the technical principles, advantages, and application examples of these technologies, which lays a solid foundation for innovations in laser cutting of hard and brittle materials. For the laser cutting of materials with large thickness or a high length-to-diameter ratio, methods such as non-destructive close piercing, multi-focal distribution spherical aberration correction, Bessel beam modulation, and laser filamentation have been successfully applied to address issues like heat accumulation, beam aberration, and energy loss. These methods enable high-precision cutting of thick, hard, and brittle materials, including the machining of complex structures that are challenging for traditional methods. In multi-dimensional structure cutting, the application of computer numerical control (CNC) technology enables precise multi-dimensional laser cutting and structuring. The closed-loop feedback system, with high-precision positioning and trajectory control, plays a crucial role in achieving accurate multi-dimensional cutting and forming. Laser composite cutting and forming technologies significantly improve cutting accuracy and quality by integrating laser techniques with other processing methods. Coupling laser processing with mechanical methods, liquid assistance, chemical etching, and optical far-field-induced near-field breakdown (O-FIB) effectively reduces thermal damage, microcracks, and recast layers. These composite methods not only increase processing efficiency but also expand the range of applications for hard and brittle materials, enabling more intricate multi-dimensional structures. The progress of laser high-precision cutting methods enhances the machining accuracy and efficiency of hard and brittle materials, broadening their application prospects in fields such as precision instruments, artificial intelligence, and bioengineering. With continuous advancements, laser cutting and shaping technologies will play a more significant role in future micro/nano-manufacturing.Conclusions and ProspectsLaser cutting technology is widely used in industrial manufacturing due to its ability to enhance machining accuracy and efficiency while minimizing thermal effects. We systematically review recent advances in laser high-precision cutting and shaping of hard and brittle materials. By integrating cutting-edge techniques such as chemical etching, multiphoton absorption, and liquid-assisted methods, laser cutting effectively mitigates issues like thermal stress and microcracking. Particularly for complex structures and large-thickness materials, innovative approaches such as Bessel beams, multi-focus technology, and far-field-induced near-field enhancement further improve cutting performance and precision. As new materials, including composites and functional materials, emerge, laser cutting technology continues to expand in its applications. Further exploration of the interaction between lasers and various materials, as well as optimization of processes tailored to new material requirements, is necessary. The deep integration of laser technology with intelligent manufacturing and automation will provide a powerful momentum for the future development of high-end equipment.
Jan. 25, 2025Vol. 45 Issue 2 0200001 (2025)
Lei Dong, Wenfei Han, Hongpeng Wu, Weiguang Ma, Lei Zhang, Wangbao Yin, and Suotang Jia
SignificanceThe development of ultrasensitive and rapid trace gas sensing techniques is of significance in diverse scientific and technological fields. Accurately detecting and monitoring trace gases at low concentrations are crucial for a wide range of applications, including environmental monitoring, non-invasive breath analysis, and industrial process control. Trace gas sensors play a vital role in assessing air quality, monitoring greenhouse gas emissions, and studying atmospheric chemistry. Real-time on-site detection of pollutants is essential for effective environmental protection and understanding the influence of human activities on climate change. Non-invasive breath analysis using trace gas sensors provides a promising approach for diagnosing and monitoring various diseases. Non-invasive respiratory diagnosis can be applied to the detection of CO2 excreted by the skin and the analysis of NH3 exhaled by the human body, which has medical significance and application prospect. In various industrial processes, monitoring trace gas concentrations is crucial for ensuring product quality, optimizing efficiency, and detecting leaks. Applications include monitoring gas purity in semiconductor manufacturing, detecting leaks in pipelines, and controlling emissions from industrial facilities. High-voltage equipment such as gas-insulated switchgear (GIS) relies on insulating gases like sulfur hexafluoride (SF6). However, these gases can decompose over time, forming byproducts that compromise equipment performance and pose safety risks. Early detection of these decomposition products by adopting trace gas sensors is critical for maintaining the reliability and safety of power grids.ProgressLaser-based absorption spectroscopy techniques, especially those exploiting the photoacoustic effect, have emerged as powerful tools for trace gas detection, featuring high sensitivity, selectivity, and rapid response time. Among these, quartz-enhanced photoacoustic spectroscopy (QEPAS) has caught significant attention for its compact size, low cost, and robustness against environmental noise. Recent research focuses on three key areas to achieve ultrasensitive and rapid QEPAS sensing, including enhancing sensitivity via acoustic resonators, calibration-free and rapid gas detection with beat frequency QEPAS (BF-QEPAS), and customizing quartz tuning forks for performance enhancement. One major limitation of traditional QEPAS systems is the relatively low sensitivity due to the inherent properties of quartz tuning forks. To this end, researchers focus on integrating acoustic resonators with tuning forks to amplify the generated photoacoustic signals, which leads to significant enhancement in sensitivity and enables the detection of trace gases at even lower concentrations. Early attempts to enhance QEPAS sensitivity involve employing simplified models of acoustic resonators. However, subsequent research highlights the crucial role of acoustic coupling between resonator segments and quartz tuning forks. This understanding leads to the development of optimized segmented resonators, with specific lengths and gaps carefully chosen to maximize acoustic coupling and signal amplification (Fig. 3). To enable dual-channel detection, researchers have developed QEPAS systems incorporating double acoustic micro-resonators (AmRs). These systems utilize two sets of segmented resonators strategically placed on either side of the quartz tuning forks (Fig. 5). While having rapid response time, the dual-channel design often comes with a trade-off in sensitivity compared to systems with single resonator configurations. Further advancements in resonator design have brought about the development of on-beam single-tube micro-resonators. This configuration focuses on maximizing the acoustic coupling between a single resonator and a custom-designed quartz tuning fork with large prong spacing (Fig. 6). By strategically placing the resonator with symmetrical openings around the tuning fork, researchers have realized significant enhancement in sensitivity, surpassing those achieved with bare tuning fork systems by orders of magnitude. In addition to sensitivity enhancement, another crucial aspect is rapid and calibration-free detection. Traditional QEPAS systems often require time-consuming calibration procedures and suffer from slow response time, limiting their applicability in real-time monitoring scenarios. To overcome these limitations, researchers have developed BF-QEPAS, a groundbreaking technique that leverages the transient response of quartz tuning forks to pulsed photoacoustic signals. In BF-QEPAS, rapidly scanned laser wavelengths generate pulsed photoacoustic signals, exciting the quartz tuning fork. By analyzing the transient response of the tuning fork using beat frequency detection, BF-QEPAS enables simultaneous measurement of gas concentration, resonant frequency, and quality factors. Finally, this eliminates the need for pre-calibration steps and significantly reduces response time, making BF-QEPAS ideal for real-time gas monitoring applications. Recognizing the limitations of commercially available quartz tuning forks, we focus on developing customized forks with specific properties tailored for QEPAS performance enhancement. By carefully adjusting the geometry and parameters of the tuning forks, significant improvements in sensitivity, selectivity, and detection limits are yielded. Customizing quartz tuning forks with wider prong spacing allow for the utilization of light sources with lower beam quality. This is particularly advantageous in the case of integrating QEPAS systems with high-power lasers, such as fiber amplifiers, as it enables efficient light transmission via the wider gap between the tuning fork prongs. Combining these customized forks with high-power lasers and optimized micro-resonators leads to highly sensitive detection of specific gases, such as hydrogen sulfide (H2S). Additionally, we develop techniques for exploiting the overtone vibration modes of quartz tuning forks to enable simultaneous detection of multiple gases. By optimizing the geometry of the tuning fork, distinct fundamental and overtone vibration modes with well-separated resonant frequencies are achieved. Strategically aligning independent laser beams with the respective antinodes of these vibration modes allows for frequency division multiplexing, effectively creating separate detection channels for different target gases (Fig. 8). This approach eliminates the need for multiple tuning forks or complex optical setups, simplifying the sensor design and reducing overall system size.Conclusions and ProspectsDriven by the need for higher performance and versatility, recent advancements in QEPAS technology, including optimized acoustic resonators, BF-QEPAS, and custom quartz tuning forks, have significantly advanced trace gas sensing. In the future, integrating novel excitation sources and miniaturization techniques will further enhance QEPAS capabilities, paving the way for wider adoption in environmental monitoring, medical diagnostics, industrial process control, and beyond.
Jan. 25, 2025Vol. 45 Issue 2 0200002 (2025)
Kaixuan Yang, Jian Wang, Jian Wang, and Fujun Zhang
SignificancePhotodetectors are core components that convert optical signals into electrical signals and play an important role in the propagation of optical signals. The demand for high-performance photodetectors is increasingly significant in the high-tech industry. Photomultiplication-type organic photodetectors (PM-OPDs) are highly favored due to their unique advantages, such as external quantum efficiency (EQE)>100%, low dark current, low driving bias, light weight, and ease of integration. These devices have been under development for three decades. Traditional methods, such as collision excitation or collision ionization, have struggled to achieve the photomultiplication phenomenon due to the disorder of organic semiconductor materials and the high exciton binding energy, which has long been a technological bottleneck limiting the development of organic photodetectors.ProgressPM-OPDs can be achieved by preparing the active layers with a donor-to-acceptor weight ratio of about 100∶1. This configuration creates electron traps, where acceptors are surrounded by donors. Photogenerated electrons are captured by the traps, inducing hole tunneling injection from the external circuit into the active layers to achieve the photomultiplication phenomenon. PM-OPDs exhibit single charge carrier transport, which helps suppress dark current. The spectral response range determines the wavelength range of detectable optical signals, defining the applicable scenarios and fields for photodetectors (Fig. 1). Based on their spectral response range, PM-OPDs can be divided into broad response or narrow response types. Broad response PM-OPDs typically cover the ultraviolet, visible, and near-infrared regions, capturing light signals at multiple wavelengths and providing rich electrical information (Fig. 3). These are expected to be applied in broad spectral applications, such as broad spectral communication, multispectral imaging, and environmental monitoring (Fig. 4). Narrow response PM-OPDs selectively detect light within a specific wavelength range, requiring a narrow and sharp spectral response range to extract useful signals from complex light environments. Over the past decade, we have explored effective methods for preparing both broad response and narrow response PM-OPDs. The spectral response range of the PM-OPDs can be controlled by adjusting the trapped charge distribution near the interface between the electrode and the active layers. The spectral response range of broad response PM-OPDs needs to be further expanded. For narrow response PM-OPDs, our research focuses on further narrowing their full width at half maximum (FWHM) and improving spectral rejection ratio (SRR). Currently, the broad response PM-OPDs with a spectral response range covering 300‒1100 nm have been obtained (Fig. 5). Narrow response PM-OPDs, with selective spectral response range in the ultraviolet, visible, and near-infrared regions, have been achieved (Fig. 8, Fig. 9). Notably, the FWHM of narrow response PM-OPDs can be suppressed at 27 nm. In general, the detection of optical signals requires the collaborative use of multiple photodetectors with different spectral response ranges. As a result, PM-OPDs with adjustable spectral response ranges have emerged (Fig. 11). These PM-OPDs offer two or more working modes, which can be flexibly switched according to specific application scenarios and requirements. The tunable spectral response range of PM-OPDs supports their application in high-sensitivity detection scenarios, with promising development prospects in the field of optoelectronic integration. We aim to provide an experimental basis and reference for further research on PM-OPDs with tunable spectral response ranges by introducing the working mechanism and analyzing the methods for adjusting the spectral response range.Conclusions and ProspectsWe first elaborate on the working mechanism of PM-OPDs and analyze the fundamental factors that affect their spectral response range. Then, we introduce the preparation methods for broad response and narrow response PM-OPDs. For broad response PM-OPDs, we introduce three methods: narrow bandgap organic semiconductor material selection, the ternary strategy, and the double-layered scheme to extend the spectral response range. For narrow response PM-OPDs, we focus on the charge injection narrowing concept, analyzing methods from the perspectives of material selection and device structure. Finally, we summarize the research progress on PM-OPDs with adjustable spectral response ranges and explore potential ways to improve their performance. Research on adjusting the spectral response range of PM-OPDs not only optimizes the performance of organic photodetectors but also promotes advancements in organic optoelectronic semiconductor materials, preparation processes, and device structures.Continued research on tunable spectral response PM-OPDs will drive progress in related industries, including the development of organic optoelectronic semiconductor materials, optoelectronic devices, and optoelectronic systems. The tunable spectral response range of PM-OPDs enhances their reliability and stability in various light detection scenarios, promoting the development of optoelectronic detection technology and creating new opportunities for related industries in integrated optoelectronics.
Jan. 25, 2025Vol. 45 Issue 2 0200003 (2025)
Jinguang Lü, Jingqiu Liang, Baixuan Zhao, Yupeng Chen, Weibiao Wang, Yuxin Qin, Yingze Zhao, and Kaifeng Zheng
SignificanceSpectral imaging technology seamlessly integrates imaging and spectroscopy, two pivotal optical measurement techniques, enabling the capture of scene and target information across a broad spectral range. By leveraging the spectral dimension, it provides insights into the material structure and chemical composition of observed targets. Imaging spectroscopy generates a three-dimensional dataset, combining two-dimensional spatial data with one-dimensional spectral data. This approach not only captures the spatial characteristics of targets but also performs continuous spectral analysis for each resolvable spatial pixel. The integration of imaging and spectroscopy facilitates a higher-dimensional representation of target features, offering a robust and scientifically comprehensive foundation for precise detection, accurate identification, and reliable verification of targets. Consequently, it holds significant application potential in domains such as space exploration, aerial remote sensing, astronomical observation, environmental monitoring, and resource surveying. Advanced spectral techniques form the foundation of imaging spectroscopy, with Fourier transform spectroscopy (FTS) standing out due to its inherent advantages, including multi-channel detection (Fellgett advantage), high throughput (Jacquinot advantage), and high wavenumber precision (Connes advantage). In addition, FTS excels in performance characteristics such as minimal stray light interference, broad free spectral range, high spectral resolution, and high signal-to-noise ratio. Since its inception, FTS has attracted substantial research interest and has become a critical tool for structural analysis and molecular characterization in fields like physics, chemistry, biology, medicine, environmental science, and materials science.ProgressWe begin by detailing the optical path configurations and modulation principles of Michelson, Mach-Zehnder, and Sagnac interference structures, highlighting their application in various modulation techniques. The interference imaging principles and data structures of temporal, spatial, and spatiotemporal modulated Fourier transform spectral imaging (FTSI) are then elucidated in alignment with their data acquisition modalities (Fig. 10). A comprehensive review of FTSI’s historical development and current research status is provided, highlighting representative studies that discuss the interference structures employed as well as the resulting spectral and imaging performance. Spatiotemporal modulated FTSI, noted for its static structure and high throughput, represents a primary focus for technological advancement. For example, the Changchun Institute of Optics, Fine Mechanics, and Physics, Chinese Academy of Sciences has conducted extensive research in this field. Using a step mirror Michelson interferometer, the institute has developed prototypes such as the image-field modulated Fourier transform hyperspectral imager (Fig. 40) and the panoramic bispectral infrared imaging interferometric spectral measurement and inversion instrument (Fig. 41). These innovations are designed to meet the critical demands for real-time, online monitoring and analysis of industrial pollution emissions and emergency safety incidents. Finally, the prospective trajectories of FTSI technology are explored, providing strategic guidance for the selection and design of FTSI instruments tailored to practical applications.Conclusions and ProspectsFourier transform spectral imaging technology, leveraging diverse interference modulation structures and imaging modalities, manifests in multiple implementation forms. Each form offers unique strengths and limitations, necessitating careful selection based on specific tasks, operational conditions, and performance expectations. Ultra-precision optics, large-format detectors, high-speed readout circuits, and advanced data processing methods continue to evolve. FTSI instruments are anticipated to adopt architectures that are solid-state, integrated, lightweight, miniaturized, and even micro-miniaturized. Future detection paradigms will likely emphasize static, high-throughput, high-stability, high-reliability, real-time detection, online analysis, and intelligent processing. Expected system enhancements include wider fields of view, broader spectral ranges, higher spatial and spectral resolutions, improved wavenumber accuracy, elevated signal-to-noise ratios, greater sensitivity, and expanded dynamic ranges. These advancements are set to drive transformative influences across a spectrum of military, defense, and civilian applications, solidifying FTSI as a cornerstone technology for the future.
Jan. 23, 2025Vol. 45 Issue 2 0200004 (2025)
Hanyu Li, Xunbo Yu, Xin Gao, Xinzhu Sang, and Binbin Yan
SignificanceThree-dimensional light field display technology marks a major leap forward in display technology and is of great significance. As technology advances, traditional 2D displays have reached their limits in conveying visual information and fall short of providing the depth and spatial perception that people desire. As a result, three-dimensional light field display technology has emerged to simulate the distribution of light rays in real 3D scenes, delivering a seamless and lifelike stereoscopic visual experience. Three-dimensional light field display technology can reproduce perspectives and details similar to those in the real world, which overcomes the limitations of 2D displays that cannot convey depth information and greatly enhances user immersion. This technology not only improves the realism of images but also enables free-viewpoint stereoscopic displays, allowing users to experience a more intuitive and immersive environment. Additionally, it has broad application potential in fields such as medicine, education, and industrial design. For example, it can assist doctors with more precise preoperative planning and intraoperative navigation, and help engineers with virtual prototype testing during design and modeling processes, thus enhancing work efficiency and outcomes. Despite facing challenges such as high cost and technical complexity, three-dimensional light field display technology is expected to achieve greater precision and broader applications in the future with ongoing advancements. This will push display technology to new dimensions and offer users a more realistic and immersive visual experience.ProgressThere are many forms of high-quality three-dimensional light field displays, including those based on cylindrical lens arrays, microlens arrays, diffraction gratings, and optical waveguide elements. In 2018, Liu et al. at Zhejiang University proposed a large-scale, multi-projector 360° light field 3D display system, using 360 projectors to achieve a display area of 1.8 m×2.78 m with a rendering rate of 30 frame/s or higher. In the same year, Wang’s team at the Beijing Institute of Technology introduced an optical scheme employing discrete lens arrays to create an optical perspective near-eye light field display, as shown in Fig. 11(a). Experimental results indicate that this method can achieve corrected depth perception of virtual information in augmented reality applications. In 2019, Liu et al. from the Beijing University of Posts and Telecommunications demonstrated a time-multiplexed light field display with a 120° wide viewing angle, using three sets of directional backlighting and fast-switching liquid crystal display panels. This system achieved a 120° viewing angle, 192 viewpoints, and a 30 cm display depth. In 2021, Xing et al. from Sichuan University presented a desktop integrated imaging 3D display system based on ring-shaped point light sources. This system can display 3D images to multiple viewers from an inclined angle within a standard ring-shaped viewing area. In the same year, Liu et al. from Beijing University of Posts and Telecommunications proposed an optical scheme based on directional diffusion films and trapezoidal composite grating lens units. This technology strengthens viewpoint utilization while expanding the viewing angle, presenting natural 3D images with accurate depth perception and occlusion relationships within a 65° viewing range and 30 cm display depth. In 2024, Yu et al. from Beijing University of Posts and Telecommunications introduced the concept of beam divergence angle to analyze the display depth of three-dimensional light field display systems. In the same year, Deng et al. from Sichuan University proposed a dual-mode optical perspective integrated imaging display system that can simultaneously reconstruct 3D images in both real and virtual display modes, which greatly extends the depth of field for 3D images, as shown in Fig. 15(a).Conclusions and ProspectsAs carriers of visual information, display devices play an indispensable role in our daily lives. As the most promising new generation of naked-eye 3D display technology, 3D light field display technology has become an ideal choice due to its features, such as accurate depth cues, the ability to allow multiple people to view simultaneously, and high-quality display effects. Therefore, achieving high-fidelity 3D light field display is a key challenge for making significant progress in the market. In summary, the key technologies of high-fidelity 3D light field display need to be explored in greater detail to promote the application and development of light field display technology.
Jan. 23, 2025Vol. 45 Issue 2 0200005 (2025)
Juncheng Lu, Huakun Wu, Yixin Zhang, Surui Liu, Jiasheng Zhao, Qiong Wu, and Wen Liu
ObjectiveOxygen sensors play a key role in various applications, including industrial process control, medical devices, and biomanufacturing. In these contexts, high sensitivity detection of low concentration oxygen is essential for tasks such as monitoring residual oxygen in syringe vials, controlling combustion processes, tracking metabolic processes, and ensuring air quality in food packaging. Current trace oxygen sensors primarily utilize electrochemical, zirconia, and paramagnetic technologies. Electrochemical sensors are the most widely used due to their low cost and high precision, but they suffer from long response time and limited lifetime. While zirconia and paramagnetic sensors offer longer operating lives, their high operating temperatures and costs restrict their broader application. Therefore, developing trace oxygen sensors that provide long lifetimes, low costs, fast responses, and high detection limits at room temperature is of significant practical importance.MethodsWe develop a compact, high-sensitivity oxygen (O2) detection system using the quartz-enhanced photoacoustic spectroscopy (QEPAS) technique and an on-beam resonator tube configuration. A high-power tunable diode laser with a center wavelength of 763 nm is used in combination with wavelength modulation spectroscopy to detect O2, and we investigate the influence of water vapor (H2O) on O2 molecular relaxation. We also explore the linearity, stability, and minimum detection limit of the system.Results and DiscussionsTo optimize the second harmonic photoacoustic signal, we adjust the wavelength modulation depth of the QEPAS system. Figure 4(a) shows the relationship between photoacoustic signal intensity and the modulation amplitude. From Fig. 4(b), the oxygen photoacoustic amplitude reaches a maximum of 2.24 V at a modulation amplitude of 55 mV. We determine this modulation depth as optimal and conduct subsequent experiments under these conditions. Oxygen has a low relaxation rate, while water vapor exhibits a high relaxation rate, making H2O an effective catalyst for enhancing relaxation. The blue curve in Fig. 5 illustrates the measured O2 photoacoustic signal amplitude as a function of volume fraction of water vapor, while the red curve represents the fit of experimental results using Eq. (2), yielding a fitting coefficient of 0.97. We observe a significant positive influence of H2O on the O2 photoacoustic signal, particularly at 0 to 0.8% volume fraction of water vapor. Beyond this range, the O2 signal stabilizes (mean value: 1.75 V, standard deviation: 0.01 V). Figure 5 also indicates that the photoacoustic signal of O2 at 8% volume fraction of water vapor is enhanced by a factor of 7 compared to that at dry conditions. In the QEPAS technique, a good linear relationship exists between photoacoustic signal amplitude and gas volume fraction. Figure 6(b) depicts the relationship between the QEPAS signal for O2 and volume fraction of O2, with a linear fitting coefficient of R2=0.999, confirming theoretical expectations. To evaluate the minimum detection sensitivity of this QEPAS system, we set the integration time of the lock-in amplifier to 100 ms and the fading frequency to 24 dB. We measure the photoacoustic signal of O2 with a volume fraction of 0.21, as shown in Fig. 7, resulting in a peak-to-peak value of 2.27 V, a noise level of 0.01 V, and a signal-to-noise ratio of 227, which corresponds to a minimum detection limit of 9.25×10⁻⁴. The normalized noise equivalent absorption coefficient of the system is 4.70×10⁻⁹ W·cm-1·Hz-1/2. Employing lasers with higher output power and stronger absorption line strength can further improve the minimum detection limit. To assess the long-term stability of this sensing system and determine its detection limit, we analyze the oxygen photoacoustic signal amplitude over an 8 h period, as shown in Fig. 8(a). A systematic Allan variance analysis reveals that the optimal integration time is 925 s, resulting in a detection limit for the oxygen QEPAS system of 5.5×10-⁴.ConclusionsWe develop an O2 sensor based on the quartz-enhanced photoacoustic spectroscopy (QEPAS) technique and an on-beam resonator tube configuration, utilizing a TO-packaged DM 763 nm light source. The absorption spectrum of O2 at 13114.10 cm-1 (762.54 nm) with a line intensity of 3.884×10⁻²⁴ molecule-1·cm is selected. We optimize the modulation depth of the sensor, identifying 55 mV as optimal. The influence of H2O molecules on the O2 relaxation rate is investigated, and we establish the relationship between O2 photoacoustic signals and H2O volume fraction. At a water vapor volume fraction of 8%, the O2 photoacoustic signals are enhanced by a factor of 7 compared to dry conditions. We calibrate the detection system with varying O2 volume fraction, obtaining a linear fitting coefficient of 0.999. The system achieves a detection limit of 9.25×10⁻⁴ at an integration time of 12.5 s, with a normalized noise equivalent absorption coefficient of 4.70×10⁻⁹ W·cm-1·Hz-1/2; at an optimal integration time of 925 s, the detection limit is 5.5×10⁻⁴. The QEPAS oxygen sensor developed in this study features a compact structure and high sensitivity, meeting the demands for O2 gas detection in applications such as combustion process control, metabolic process monitoring, and food atmosphere packaging.
Jan. 25, 2025Vol. 45 Issue 2 0230001 (2025)
Faqian Liu, Dongwei Li, Zhongzheng Zhang, Lanzhi Zhang, and Zuoqiang Hao
ObjectiveThe uncertainty in the number and position of laser filaments, caused by random noise and competition between filamentation and surrounding energy, severely limits their practical applications. Generating filaments with a regular distribution and a controllable number is therefore crucial for both fundamental research and technological advancements. Recent studies on femtosecond vortex beams have focused primarily on filamentation using conventional focusing lenses. However, tilting the lens can significantly influence filamentation behavior. Previous research has shown that adjusting the lens’s tilt angle allows precise control over the number, distribution, and spatial stability of femtosecond Gaussian laser filaments, effectively managing and suppressing multiple filaments. Moreover, tilted lenses are commonly used to determine a vortex beam’s topological charge, as the beam evolves into a stripe-shaped pattern characterized by alternating bright and dark fringes, with the topological charge calculated as the number of bright spots minus one. In this paper, we explore the filamentation and control of femtosecond vortex beams in fused silica using a tilted lens.MethodsInitially, vortex beams with varying topological charges are focused on fused silica using a stationary lens to generate filaments. An imaging lens is used to capture the filament distribution at different propagation distances in fused silica, recorded by a digital camera. The vortex waveplate is replaced to incrementally increase the topological charge of the incident laser beam from 4 to 6 and 8, with corresponding increases in laser power due to higher self-focusing critical power. Linear propagation in air is then studied by removing the fused silica and varying the tilt angles of the focusing lens to examine the intensity distributions at different propagation distances. Subsequently, filamentation is analyzed for vortex beams in fused silica under tilted lens conditions. Finally, vortex beams with different topological charges are focused into fused silica through a tilted lens at a fixed tilt angle of 20° to evaluate the effect of topological charge on filamentation.Results and DiscussionsWithout tilting the lens, vortex beams with varying topological charges form regular ring-shaped filament arrays in fused silica. As the topological charge increases, the filament count and ring radius also increase. Along the propagation direction, re-focusing occurs, with multiple millimeter-scale filaments forming periodically within a centimeter-scale envelope. By incrementally increasing the tilt angle of the lens from 0° in steps of 3°, and selecting typical angles of 17°, 20°, and 23°, the laser beam distribution evolves significantly. At 17°, the filaments exhibit an elliptical ring-shaped pattern with uneven intensity. As propagation continues, the distribution transitions to an elliptical form, with enhanced intensity at the long-axis ends, resulting in stripe-like patterns. At larger tilt angles, these evolve into rectangular filament distributions. Under filamentation conditions, regular filament arrays form at the positions corresponding to intensity fringes observed during linear propagation. This method resembles interference fringe generation to create filament arrays, offering a novel approach for filamentation control. Moreover, the filament fringe count increases with the beam’s topological charge, indicating that filament formation depends not only on incident energy but also on the number of bright intensity fringes in the focused beam.ConclusionsIn this paper, we explore the filamentation distribution and evolution of femtosecond vortex beams in fused silica using a tilted focusing lens. A stable and controllable filament array is achieved, with its distribution tailored by adjusting the tilt angle of the lens. By modifying the lens’s tilt angle, the filament distribution transforms from a circular pattern to an array structure. Moreover, the filament distribution and number can be precisely controlled by altering the vortex beam’s topological charge and the incident laser energy. The proposed method not only introduces a novel approach for controlling laser filaments but also holds significant potential for applications in research and technical fields such as laser micro- and nano-processing.
Jan. 22, 2025Vol. 45 Issue 2 0232001 (2025)
© Copyright 2018-2021 | Chinese Laser Press.
All Rights Reserved 沪ICP备15018463号-20