


Please enter the answer below before you can view the full text.


2025
Volume: 45 Issue 1
33 Article(s)

Minghua Cao, Genxue Zhou, Qing Yang, Yue Zhang, Xia Zhang, and Huiqin Wang
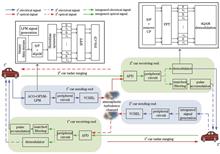
ObjectiveTraditional integrated communication and sensing systems encounter substantial challenges regarding spectrum requirements and hardware implementation costs, especially when integrating optical communication and LiDAR technologies. Existing methods usually introduce additional noise while attempting to reduce the peak-to-average power ratio (PAPR), which can deteriorate system performance. Our research aims to design an integrated LiDAR communication and sensing system that combines asymmetric clipping optical orthogonal frequency division multiplexing (ACO-OFDM) and linear frequency modulation (LFM) techniques to realize the convergence of optical communication and LiDAR ranging. A new clipping technique is proposed to reduce PAPR without adding noise, thus improving the overall system performance. The research focuses on assessing the system’s performance in terms of transmission rate, bit error rate (BER), and target detection and ranging capabilities under different turbulent channel conditions.MethodsWe present a framework for an integrated LiDAR communication and sensing system that combines ACO-OFDM and LFM technologies. The system utilizes ACO-OFDM to achieve efficient optical communication and integrates LFM signals for accurate LiDAR ranging. To solve the problem of noise introduction in traditional clipping techniques when reducing PAPR, we propose an iterative scheme of clipping and filtering. This method gradually decreases PAPR through multiple iterations and effectively reduces noise introduction. The simulation employs a Gamma-Gamma weak and medium turbulence channel model to analyze the system’s transmission rate and BER performance under various channel conditions. Additionally, the simulation evaluates the ranging capability of the integrated system by comparing its BER performance improvement and the enhanced ranging accuracy with a system using a single LFM signal.Results and DiscussionsBy implementing the iterative clipping and filtering scheme, we effectively reduce the PAPR of the system by 3.6 dB (Fig. 5), thereby resolving the noise issue related to traditional clipping techniques. Simulation results show that the system not only maintains a stable transmission rate and reliable BER performance under Gamma-Gamma weak and medium turbulence channel conditions but also successfully detects four targets at distances of 80, 100, 1000, and 1300 m (Fig. 11). Compared with a system using a single LFM signal, the integrated system has an improved BER performance by 4.2 dB (Fig. 6) and enhanced ranging accuracy by 40.7% (Fig. 12). Moreover, the main lobe of the system’s ambiguity function is more concentrated, with lower side lobe levels, having a “peg” shape [Fig. 9(b)], indicating significant advantages in distance resolution and Doppler tolerance.ConclusionsWe propose a laser radar communication sensing integrated system that combines ACO-OFDM and LFM technologies. The system effectively reduces PAPR through an innovative iterative clipping and filtering scheme while maintaining low noise levels. Simulation results confirm the stability and reliability of the system under different channel conditions, demonstrating its excellent performance in integrating optical communication and LiDAR ranging. Notably, the remarkable improvements in BER and ranging accuracy highlight the system’s potential for practical applications. Future research can further optimize the system design to enhance its adaptability and performance in more complex environments.
Jan. 10, 2025Vol. 45 Issue 1 0106001 (2025)
Jingli Wang, Chufan Li, Hongdan Wan, and Heming Chen
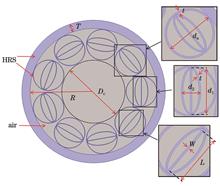
ObjectiveIn practice, the environment and atmospheric conditions of free space influence the transmission of terahertz waves, leading to issues such as dispersion and large transmission loss (TL). Hollow core fibers emerge as promising for terahertz wave transmission because of their broad application potential. However, current hollow core photonic bandgap fibers (HC-PBGFs) for terahertz wave transmission have issues including poor mode purity, elevated surface scattering loss, and complex manufacturing processes. In contrast, hollow core anti-resonant fibers (HC-ARFs) have a simpler structure and are easier to fabricate, making them a research focus. Nevertheless, reported HC-ARFs still have room for improvement in TL and some fiber properties. To overcome these limitations, we have designed a novel terahertz HC- ARF structure. By carefully designing the geometric configuration of the nested structure in the cladding, increasing the number of nested layers, and using high-resistivity silicon with minimal absorption loss as the fiber material, we further reduce TL and dispersion and thus enhance the overall fiber performance. This fiber provides a valuable reference for the development of high-performance, low-loss terahertz wave transmission waveguides.MethodsThe anti-resonant reflection waveguide model combined with the suppression coupling theory comprehensively explains the guiding mechanism in HC-ARFs. These fibers mainly use the anti-resonant effect to confine energy within the fiber cores. First, we design the nested structure that constitutes the cladding of HC-ARF. Unlike typical fiber structures using circular nested tubes (fiber structure A), elliptical nested tubes (fiber structure B), and double-layer elliptical nested tubes (fiber structure C), the innovative nested configuration integrating ellipses, circles, and straight rods has superior performance in constructing the fiber cladding. In addition, the nine nested structures in the cladding are arranged without nodes, which avoids the resonance of nodes between nested structures affecting the fiber loss. High-resistivity silicon is selected as the fiber material, which helps reduce the effective material loss. Second, the control variable method is used to optimize the fiber structure parameters, including diameter Dc, elliptical major axis d1, ellipticity η, and tube thickness t. Within the frequency range of 0.5?1.6 THz, the TL of the fiber is optimized. Finally, based on the optimal structural parameters of the fiber, the properties of the fiber such as mode field distribution, dispersion, bending resistance, and effective mode field area are analyzed.Results and DiscussionsFirst, we propose a combination of increasing the number of nested layers and changing the geometric shape of the nested structure. A terahertz HC-ARF with nine uniformly distributed multilayer nested structures is designed (Fig. 1). On the one hand, the anti-resonant reflecting effect is used to guide light, reducing the confinement loss. On the other hand, the use of high-resistivity silicon in the cladding structure helps reduce the effective material loss. Next, the structural parameters of the fiber are optimized. The results show that the best TL is achieved with a diameter Dc=6 mm, an elliptical major axis d1=2.4 mm, an ellipticity η=1.104, and a tube thickness t=0.030 mm. That is, the proposed HC-ARF achieves a TL of less than 10-1 dB/m within the transmission window of 0.84?1.56 THz. Moreover, in the frequency range of 0.98?1.44 THz, TL is as low as 10-4 dB/m, and the lowest TL of 2.80×10⁻⁴ dB/m is achieved at f=1.10 THz (Fig. 7). Finally, other performance parameters of the fiber are simulated. The results show that within 0.84?1.56 THz, near-zero and flat dispersion is achieved, with a dispersion variation of (0.02139±0.08824) ps·THz-1·cm-1 (Fig. 9). A large effective mode field area is obtained, with values reaching the order of 107 μm2 (Fig. 11). Excellent bending resistance is demonstrated, with bending losses less than 10-2 dB/m at smaller Rb (35 and 45 cm) (Fig. 10), which is beneficial for more stable and effective transmission of terahertz waves. This makes the fiber have broad application value in the fields of terahertz wave sensing, detection, and terahertz communication systems.ConclusionsWe design a terahertz HC-ARF with low TL and wide bandwidth, using high-resistivity silicon (HRS) as the fiber material. Its nested structure, consisting of a combination of ellipses, circles, and straight rods, is advantageous for forming the cladding of the fiber. The results indicate that the HC-ARF achieves a low TL bandwidth of 0.72 THz within the transmission window. The lowest TL of 2.80×10⁻⁴ dB/m is obtained at 1.10 THz. The dispersion variation is (0.02139±0.08824) ps·THz-1·cm-1. The effective mode field area remains above 107 μm2. The bending loss is less than 10-2 dB/m at the smaller Rb (35 and 45 cm). We achieve more stable and high-performance terahertz wave transmission. The fiber has potential application value in the fields of terahertz wave sensing, detection, and terahertz communication systems.
Jan. 16, 2025Vol. 45 Issue 1 0106002 (2025)
Jianjian Wang, and Rui Tang
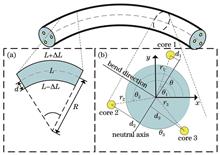
ObjectiveOptical fiber shape sensing technology has gained widespread attention in the field of spatial shape perception due to its unique advantages. Strain sensing measurement, bending information computing, and shape reconstruction algorithms are key components of optical fiber shape sensing technology. The conventional numerical computation method for shape sensing is based on the geometric relationship of sensing fibers, which is cumbersome, and the accuracy of shape sensing may be influenced by various factors during the computation process. To avoid complex numerical calculations and potential errors, methods based on neural networks for shape sensing have become a research focus. However, current neural network methods have not established a direct mapping relationship between strain measurement results and fiber shape spatial coordinates, nor do they address the situation of distributed strain measurement. In this study, we propose a multi-core fiber shape coordinate prediction network model that integrates convolutional neural network-long short-term memory (CNN-LSTM) and an attention mechanism. This model effectively avoids complex numerical calculations and directly obtains shape coordinates from the distributed strains of the three cores in the multi-core fiber. A distributed strain measurement system based on optical frequency domain reflectometry (OFDR) technology is used to collect data and construct a dataset for network testing. The coordinate prediction and curve shape reconstruction results of the method proposed are compared and analyzed with numerical calculation methods, the LSTM network, and the CNN-LSTM network.MethodsThe input data of the proposed network model are the distributed strains of the three cores in a three-core optical fiber, and the output data are the spatial coordinates of the optical fiber. The input data are three-dimensional, and the output data are two-dimensional. The proposed network model includes a CNN module, an LSTM module, a Dropout layer, an attention mechanism layer, and two independent fully connected layers. The CNN module extracts features from the input data, with a batch normalization layer to normalize the data, a convolution layer to increase the feature dimension, and a pooling layer for max pooling. The LSTM module mines temporal features, with a dropout layer introduced to prevent overfitting. The temporal features are further processed by the attention mechanism to reduce the effect of secondary features. Two independent fully connected layers process the two-dimension outputs, with the output of each fully connected layer taking the value of the last time step in the sequence as the predicted value. The network training dataset is derived from the core strain and shape coordinate values obtained from a finite element model of multi-core optical fibers, while the testing dataset is constructed from actual measurement data from a distributed strain measurement system based on OFDR technology. We compare the distribution of the true and predicted horizontal and vertical coordinates corresponding to curves with two different curvature radii. Additionally, we conduct a comparative analysis of five scenarios: the original shape, numerical computation, prediction by the LSTM network, prediction by CNN-LSTM, and prediction by the proposed network model.Results and DiscussionsThe comparison of curve coordinates shows that the true and predicted values of the curve coordinate with two different curvature radii have consistent distribution intervals (Fig. 6 and Fig. 7). The comparison of shape reconstruction results indicates that the curve shape predicted by numerical computation methods has a larger error compared to neural network-based predictions. The curve shape predicted by the proposed network model is closest to the original curve, maintaining good consistency even at the far end of the sensing fiber. The error reduction when using only the LSTM network, CNN-LSTM network, and the proposed network demonstrates that the designed model more accurately predicts curve shape coordinates. The CNN module, LSTM module, and attention mechanism all contribute significantly to improving the accuracy of coordinate prediction. For a curve with a curvature radius of 700 mm, the root mean square error (RMSE) is only 1.5739 mm, and the mean absolute error (MAE) is 0.6919 mm, which are 0.928 mm and 0.2224 mm higher than those of the numerical computation method, representing improvements of 58.96% and 32.14%, respectively. The error may stem from both the network model’s limitations and placement inaccuracies between the multi-core fibers and shape models during the experiment.ConclusionsWe propose a multi-core fiber shape coordinate prediction model based on CNN and LSTM networks, combined with an attention mechanism, to address the complex numerical computation challenges in optical fiber shape sensing. The model directly obtains shape coordinates from distributed strain data, thus achieving shape sensing. CNN and LSTM modules extract temporal features from strain data, while the attention mechanism suppresses secondary temporal features to improve the final shape coordinate predictions. Experimental results demonstrate that for curves with different curvature radii, the proposed method avoids complex numerical computation and achieves optical fiber shape sensing. The RMSE and MAE are both superior to those obtained using numerical computation based on the Frenet-Serret equation. For a curve with a curvature radius of 700 mm, the RMSE is only 1.5739 mm and the MAE is only 0.6919 mm, showing improvements of 58.96% and 32.14%, respectively, compared to numerical computation results. The proposed method has promising potential for application in optical fiber distributed strain measurement for shape sensing.
Jan. 16, 2025Vol. 45 Issue 1 0106003 (2025)
Xuan Chen, Minghua Cao, Yue Zhang, Huiqin Wang, and Shengchun Han
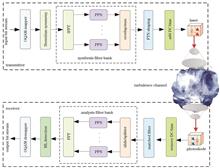
ObjectiveOptical orthogonal frequency division multiplexing (OOFDM) technology, widely employed in free-space optical (FSO) communication, faces challenges such as slow out-of-band attenuation and limited spectral efficiency. These issues are especially pronounced in environments affected by atmospheric turbulence, which further reduces the effectiveness of OOFDM. To address these challenges, we propose a novel transmission scheme that combines faster than Nyquist (FTN) signaling with optical filter bank multicarrier (OFBMC) technology, creating the OFBMC-FTN system aimed at enhancing spectral efficiency without sacrificing performance. Additionally, we introduce FBMCFormer, a Transformer-based detection algorithm that leverages the multi-head self-attention mechanism of the Transformer to improve detection performance, particularly in turbulent environments commonly encountered in FSO systems. This approach responds to the growing demand for higher data transmission rates and more reliable communication systems, especially under challenging atmospheric channels.MethodsOur study employs a dual approach, combining theoretical derivations and Monte Carlo simulations, to evaluate the proposed OFBMC-FTN system. We derive the theoretical bit error rate (BER) expression for the system using the maximum likelihood criterion and the Gamma-Gamma turbulence channel model, suitable for simulating atmospheric turbulence effects on optical signals in FSO systems. We assess system performance under varying turbulence intensities—weak, moderate, and strong—to ensure a comprehensive analysis across different conditions. A key innovation of this research is the FBMCFormer detection algorithm designed specifically for the OFBMC-FTN system. Utilizing Transformer networks, FBMCFormer captures both temporal and spatial dependencies in signal sequences. The multi-head self-attention mechanism within FBMCFormer prioritizes the most relevant signal components, thereby enhancing detection accuracy. FBMCFormer’s architecture consists of an input layer, a Transformer encoder, a one-dimensional convolutional layer, and a hard decision module (Fig. 4). While the convolutional layer extracts critical features from filtered signals, the Transformer captures long-term dependencies in turbulent environments. To validate the performance under different signal-to-noise ratios (SNRs) and turbulence intensities, Monte Carlo simulations were conducted. These simulations assess the BER performance of the OFBMC-FTN system and compare it with traditional modulation techniques such as direct current-biased optical filter bank multicarrier (DCO-FBMC), asymmetrically clipped optical filter bank multicarrier (ACO-FBMC), and OOFDM.Results and DiscussionsThe OFBMC-FTN system achieves notable improvements in spectral efficiency compared to conventional optical multicarrier systems. With a packing factor of 0.9, the system improves spectral efficiency by 11.1% over DCO-FBMC, 94% over ACO-FBMC, and 120% over OOFDM systems (Fig. 3). These gains are achieved without increasing modulation order, as the FTN approach compresses symbol transmission intervals, enabling more efficient bandwidth utilization. For BER performance, our study shows favorable results across various turbulence intensities. As SNR increases, the simulation and theoretical BER curves converge, validating the theoretical model’s accuracy (Fig. 2). Under moderate turbulence, the system experiences a 2 dB loss in SNR compared to weak turbulence at the same BER level. FBMCFormer effectively addresses turbulence-related challenges. Compared to the maximum likelihood (ML) detection algorithm, FBMCFormer achieves near-optimal BER performance with significantly reduced computational overhead. Traditional deep neural network (DNN) detection algorithms struggle under varying turbulences due to rapid phase and amplitude fluctuations. In contrast, FBMCFormer adapts well to turbulent signal characteristics due to its multi-head self-attention mechanism, which captures both short- and long-term dependencies in the signal sequence, thus sustaining robust performance (Fig. 6). FFBMCFormer consistently outperforms DNNs while maintaining near-optimal BER performance compared to ML detection across various compression factors (Fig. 7). In terms of computational efficiency, FBMCFormer scales more effectively than ML detection (Fig. 8). While ML detection’s computational complexity increases exponentially with transmission frame numbers, FBMCFormer maintains relatively low complexity, making it a practical solution for processing large-scale signal sequences without compromising accuracy.ConclusionsOur study demonstrates that integrating FTN signaling with OFBMC technology, along with Transformer-based detection algorithms, significantly enhances both spectral efficiency and signal detection accuracy in optical wireless communication systems. The proposed OFBMC-FTN system effectively addresses OOFDM limitations by reducing out-of-band leakage and improving spectral efficiency without additional bandwidth or higher modulation orders. Building on these enhancements, FBMCFormer reduces complexity compared to ML detection while maintaining near-optimal BER performance, particularly in turbulence-affected environments. Monte Carlo simulations validate the theoretical BER analysis, showing that the proposed system achieves superior spectral efficiency compared to existing technologies like DCO-FBMC, ACO-FBMC, and OOFDM. This study provides a promising direction for high-speed optical wireless communications with further potential for real-world applications. Future work will focus on refining system parameters and conducting real-world tests to further validate and optimize performance.
Jan. 10, 2025Vol. 45 Issue 1 0106004 (2025)
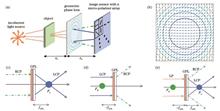
Yating Wang, Kongsong Xue, Mengyao Mao, and Canhua Xu
ObjectiveOur research aims to optimize the self-interference digital holography (SIDH) system by using the Collins formula. We focus on simplifying the calculation of the reconstruction distance and improving the phase accuracy in holographic image reconstruction. SIDH systems, unlike conventional holography systems that rely on coherent light sources, can use incoherent light sources such as natural light, LED lamps, and flashlights. This flexibility eliminates problems related to speckle noise, which often occur in laser-based holography, and thus improves the quality of holographic imaging. However, traditional diffraction-based models in SIDH systems cause great computational complexity, especially when dealing with complex optical configurations. This complexity not only reduces the imaging performance but also restricts the system’s adaptability to various practical applications. In this study, we address these challenges by integrating optical transformation matrices with the Collins formula to optimize the SIDH system. A key aspect of the research is to derive a simplified reconstruction distance formula based on the system’s optical parameters. This formula depends only on four optical transfer matrix elements—B1, B2, D1, and D2. Additionally, we introduce the parameter k to measure the phase variations on the reconstruction plane. These variations are affected by the system’s geometric parameters, interference region limitations, and diffraction distance. By optimizing this parameter, we improve the system’s image resolution and its adaptability to different experimental setups.MethodsOur methodology focuses on combining the Collins diffraction formula with optical transformation matrices to model and optimize the light propagation in the SIDH system. The Collins formula provides a mathematical framework for calculating the diffraction patterns generated when light passes through optical elements. This enables accurate prediction of the light’s phase and amplitude variations. In the SIDH system, geometric phase lens (GPL) is employed to split incident light into right-handed circularly polarized (RCP) and left-handed circularly polarized (LCP) components. The RCP component acts as if it has passed through a converging lens, while the LCP component acts as if it has passed through a diverging lens. This facilitates self-interference and enables hologram capture. The system’s key geometric parameters include the distance between the object and the GPL (z0?) and the distance between the GPL and the imaging sensor (zh?) (Fig. 1). We describe the propagation of RCP and LCP light fields using optical transfer matrices M1 and M2?, respectively. These matrices account for the system’s geometric effects on the light waves. We simplify the computation of the reconstruction distance zrec? by applying the Collins formula together with the optical transfer matrices. This approach allows us to derive the simplified formula for the reconstruction distance, which greatly reduces the computational complexity compared to traditional diffraction models. Additionally, the parameter k is introduced to represent the phase variation due to geometric asymmetries and diffraction effects in the system. By optimizing this parameter, we can improve the system’s phase accuracy and image resolution. This allows us to fine-tune the SIDH system’s configuration to obtain high-quality holographic images.Results and DiscussionsThe simplified reconstruction distance formula derived in our study reduces the computational burden of diffraction calculations in SIDH systems. To verify the proposed method, we conduct three sets of experiments using a compact SIDH system equipped with a GPL of focal length 40 mm and a monochromatic polarized imaging sensor. We use a USAF1951 resolution target to evaluate the system’s performance. The experimental setup captures holograms of the target, and then we process them to reconstruct amplitude and phase information (Fig. 6). In experiment 1, with z0=14 mm and zh=30 mm, we obtain a reconstructed image resolution of 25.398 lp/mm at an optimal reconstruction distance of 189.3 mm (Fig. 7). This value closely matches the theoretical reconstruction distance of 186.3 mm, demonstrating the accuracy of the simplified formula. In experiment 2, with z0=14 mm and zh=80 mm, the reconstruction distance is calculated to be 821.6 mm. At a slightly adjusted distance of 826.0 mm, the system achieves a resolution of 40.318 lp/mm (Fig. 9). Experiment 3 tests at z0=15 mm and zh=48 mm, resulting in a calculated reconstruction distance of 324.0 mm. The experimental results show the highest resolution of 50.797 lp/mm at a reconstruction distance of 328.0 mm, further validating the simplified formula (Fig. 9). These experimental results confirm that the derived reconstruction distance formula provides accurate predictions, with discrepancies between theoretical and experimental values of less than 2%. Furthermore, optimizing the parameter k improves the phase accuracy. Smaller values of this parameter correspond to reduced geometric asymmetry, enhancing the image resolution.ConclusionsIn this study, we successfully apply the Collins formula and optical transformation matrices to optimize the SIDH system. By deriving a simplified reconstruction distance formula that depends only on four optical transfer matrix elements, we significantly reduce the computational complexity of holographic image reconstruction. The introduction of the parameter k enables effective optimization of the phase accuracy, ensuring high-quality image reconstruction under different experimental conditions. The experimental results, with resolutions of up to 50.797 lp/mm, demonstrate the robustness and accuracy of the proposed approach. This research provides a practical method for enhancing the performance of SIDH systems, bringing significant improvements in computational efficiency and image quality for future applications in incoherent digital holography.
Jan. 23, 2025Vol. 45 Issue 1 0109001 (2025)
Mingjie Tang, Jie Xu, Zhenxi Chen, Rui Xiong, Liyun Zhong, Xiaoxu Lü, and Jindong Tian
ObjectiveHolographic imaging, widely used for detecting sol particles such as microalgae, pollen, and biological cells, allows us to reconstruct various images, such as amplitude, phase, and morphology, from recorded holograms. However, these reconstructions often suffer from interference caused by background fringes of static particles. In practical applications, static particles can adhere to the optical surfaces within the imaging pathway, leading to noisy images and reduced accuracy in detecting dynamic particles. Therefore, the accurate segmentation of dynamic and static particles is crucial to enable effective downstream tasks such as two-dimensional (2D) shape and phase imaging, or three-dimensional (3D) reconstructions of the particles. To address this challenge, we propose Hformer, a biologically inspired neural network based on the Transformer architecture, designed specifically for the dynamic-static particle segmentation problem in holographic imaging. The key innovation of Hformer is its ability to process both grayscale images and event data—mimicking the dual sensitivity of biological vision to light intensity and changes in light intensity over time. By integrating these two modalities and employing self-supervised learning, Hformer achieves high-quality segmentation of holograms containing overlapping dynamic and static targets, ensuring the preservation of high-frequency fringes necessary for subsequent reconstructions.MethodsHformer incorporates several key components, including grayscale and event inputs, spiking neural network (SNN), transformer-based architecture, dual decoders, and a self-supervised learning strategy. The input to the Hformer network consists of three consecutive grayscale images, which are combined into a three-channel image. Simultaneously, these grayscale images are processed by an event generator to produce event data, capturing the dynamic changes within the scene. Hformer uses an SNN to process the event data, mimicking the biological processing of visual information through discrete spikes. The SNN efficiently extracts features from the event data, which are then fused with the grayscale image features. The Transformer-based architecture captures long-range dependencies in the images, effectively integrating spatial and temporal information. The key modules of the Transformer architecture, such as the local-enhanced window (LeWin) module, multi-head self-attention (MSA), and layer normalization, enable efficient feature extraction and integration from both grayscale and event inputs. Hformer uses two independent decoders for the dynamic and static particle segmentation. These decoders work in parallel, ensuring that the dynamic and static particle holograms are separated and reconstructed independently, preserving the distinct characteristics of each. Hformer adopts a self-supervised learning approach, generating pseudo-labels from the data itself, making it more practical for real-world applications where labeled training data is scarce. We evaluate the performance of Hformer through extensive experiments using both simulated and real holographic data. The real data includes holograms of pollen particles, while the simulated data is generated using a template-based method to mimic real-world holographic scenarios.Results and DiscussionsThrough a series of ablation studies, we systematically remove various components of Hformer to analyze their influence on segmentation performance. The ablation experiments involve testing three Hformer variants: removing the SNN module, using only grayscale input (Yformer), and a simpler version with single input and output branches (Uformer). The results show that removing the SNN results in a significant drop in segmentation accuracy, as measured by the structural similarity index measure (SSIM) values of the reconstructed holograms. This confirms the necessity of using event data for accurate dynamic-static segmentation. Additionally, using a single input (Yformer) or a single output (Uformer) leads to poorer performance, highlighting the importance of dual-modal input and dual-output decoders. Further, we demonstrate that directly reconstructing 2D shapes from original holograms without segmentation often leads to significant distortions, particularly when dynamic and static particle holograms overlap. Regarding self-supervised learning performance, the network is trained on one dataset and tested on other three datasets with different simulation parameters. Results show that the self-supervised model consistently outperforms traditional supervised learning approaches in terms of SSIM values. The superior generalization ability of the self-supervised model can be attributed to its ability to learn the inherent structure of holographic data, preserving important details like high-frequency fringes in the holograms. This demonstrates the potential of self-supervised learning in applications where labeled data is limited or unavailable. In addition to simulated data, we also test Hformer on real holographic images of pollen particles. Results show that Hformer effectively segments dynamic particles from static backgrounds in a lensless holographic imaging system. This confirms that Hformer can handle real-world challenges, such as noise and overlapping particles, making it a promising solution for particle holography.ConclusionsFor the dynamic-static segmentation task of sol particle holograms, inspired by the dual sensitivity of biological vision to light intensity and its variations, we propose Hformer, a neural network that incorporates event data processing. The network is based on the Transformer architecture, featuring dual input branches (grayscale and event data) and dual output branches for dynamic and static holograms, employing a self-supervised learning paradigm. Our results show that the biomimetic designs in Hformer, such as event data input, the SNN module, and independent dynamic-static decoders, all contribute to the accurate segmentation of overlapping dynamic and static particle holograms while preserving high-frequency fringes. Furthermore, the self-supervised learning approach adopted by Hformer not only simplifies the data preparation process compared to traditional supervised methods but also offers better transferability and generalization. Experimental results with aerosol pollen demonstrate that Hformer accurately and completely obtains dynamic sol particle holograms, making it a promising front-end algorithm for a wide range of tasks in shape, phase, and 3D morphology reconstruction and detection of flow field particles.
Jan. 20, 2025Vol. 45 Issue 1 0109002 (2025)
Zhihao Liu, Jianguo Yang, Weiqi Jin, and Li Li
ObjectiveRadiation thermometry is a widely utilized method offering several advantages, such as noncontact measurement, rapid response, large dynamic range, and passive operation. It is extensively applied across various fields, including industry and biomedicine. To meet the high-temperature measurement requirements of sectors like glass manufacturing, metallurgy, rocket engines, and gas turbines, visible and near-infrared spectral bands are typically employed to mitigate emissivity deviations. These bands are suitable for measuring temperatures ranging from several hundred to a few thousand degrees Celsius. To accurately determine the target temperature and emissivity, a narrow spectral band is required. Building upon the gray body assumption, dual-band colorimetric thermometry reduces the influence of emissivity and environmental factors. Both single-band thermometry and colorimetric thermometry typically use narrowband imaging, and narrower bands improve thermometry precision without compromising detector sensitivity. However, limitations in infrared detector sensitivity present challenges for narrowband or multiband thermometry. Traditionally, dual-band infrared colorimetric thermometry has relied on cooled IRFPAs. Recent advancements in uncooled infrared detector materials and manufacturing processes have brought uncooled MWIR and LWIR IRFPAs to a practical level of functionality. Moreover, colorimetric thermometry based on uncooled IRFPAs shows promising prospects in terms of size, longevity, and reliability. This research investigates MWIR and LWIR colorimetric thermometry using a wideband uncooled IRFPA, focusing on the applicability of the gray body assumption and addressing detector response drift to enhance the accuracy of radiation thermometry for room-temperature targets.MethodsThis study focuses on applying wideband MWIR and LWIR colorimetric imaging thermometry and introduces improvements to existing methods. First, through theoretical derivation and applying the gray body assumption to segmented MWIR and LWIR bands, it is demonstrated that the ratio of the radiative emissivities between the two bands is the key determinant of thermometry accuracy. Other influencing factors can be eliminated through design or calibration. The spectral radiative emissivities of common materials are analyzed to illustrate the applicability of the gray-body assumption in MWIR and LWIR bands (Fig. 1). Spectral emissivity data for natural and man-made materials were sourced from the MODIS UCSB emissivity library, established by the University of California, Santa Barbara, covering a range of materials including water, soil, vegetation, and man-made materials. These materials cover the spectral emissivity ranges for both MWIR and LWIR (3?15 μm). In addition, we conducted our measurements on 11 materials (Figs. 2 and 3). The spectral emissivities of all these materials were analyzed to determine the ratio of LWIR to MWIR emissivities. Due to response drift in uncooled infrared detectors—caused by random core temperature fluctuations related to operational duration—which can result in discrepancies between the detector’s operational state and its calibration, a correction for this drift in uncooled IRFPA thermometry was implemented. A revised model for MWIR and LWIR infrared colorimetric imaging thermometry was developed (Fig. 5). The accuracy of this colorimetric imaging thermometry was experimentally compared with that of single-band radiometric thermometry. Bias drift was mitigated using electrical tape and water. The measured samples included white ceramic tiles, cement, glass, and ginkgo leaves (Fig. 9).Results and DiscussionsThe colorimetric thermometry method, based on the gray body assumption, leads to a colorimetric imaging thermometry process (Equation 4). This process involves calibrating the dual-band output signal ratio relative to temperature using a temperature-adjustable blackbody, establishing the functional relationship Q1(T). By combining the emissivity ratio kε and the detector’s response ratio Q(T) to the scene, the scene temperature T can be determined. The potential for further simplification of colorimetric thermometry based on the gray body assumption depends on the emissivity ratio kε between LWIR and MWIR for different materials. Analysis reveals that for water and vegetation, kε is relatively stable around 1, while for other materials, kε shows significant fluctuations. Therefore, for water and vegetation, the thermometry model can be simplified by assuming kε=1. For materials like soil and artificial materials, the specific emissivity ratio kε must be considered to achieve higher thermometry precision (Fig. 4). Calibration using an approximate gray body with a known temperature T and emissivity ratio kε helps calibrate the temperature and effectively eliminate additional bias drift caused by the detector’s baffle correction and temperature drift, thereby enhancing thermometry accuracy. Comparative experimental results with single-band radiometric thermometry indicate that the relative error in dual-band colorimetric thermometry remains stable within 5%, with an average reduction of 3?4 percentage points compared to single-band thermometry (Fig. 10 and Table 1). This demonstrates the higher precision of the dual-band colorimetric method.ConclusionsThis study investigates the MWIR and LWIR colorimetric imaging thermometry method using a wideband uncooled IRFPA. After analyzing the spectral emissivities of common materials, we confirm the applicability of the gray body assumption for MWIR and LWIR. Subsequently, the response drift of the uncooled IRFPA used in thermometry is corrected, and a revised model for MWIR and LWIR colorimetric imaging thermometry is introduced. Finally, real-world thermometry experiments are conducted to compare the accuracy of dual-band colorimetric thermometry with that of single-band radiometric thermometry. The results demonstrate that the wideband dual-band colorimetric imaging thermometry method for MWIR and LWIR achieves greater precision, with an average reduction in relative error of 3?4 percentage points compared to single-band thermometry. By combining a wideband IRFPA with appropriate filters, this method allows for the miniaturization of imaging thermometry equipment, improving the precision of radiometric thermometry, and shows great potential for widespread application.
Jan. 22, 2025Vol. 45 Issue 1 0111001 (2025)
Jingjing Li, Donghui Zheng, Yuqing Liu, Lei Chen, Chen Xu, and Xinyi Yu
ObjectiveIon-beam polishing is a high-precision surface shape-modification technique that requires multiple iterations to ensure surface accuracy. Currently, it is widely used for the surface processing of precision optical flats. However, for transmission flats supported by an adhesive, the temperature generated during polishing may exceed the tolerance temperature of the silicone rubber, which may cause the detachment of the silicone. This changes the uniform support state of the transmission flat, which consequently introduces additional deformation to the surface morphology of the flat.MethodsThe detachment of adhesive spots occurs primarily in two forms: internal bubbles and flow tendencies. Adhesive spots with bubbles are primarily characterized by a decrease in the contact area with the transmission flat, whereas adhesive spots with flow tendencies primarily exhibit a displacement of the mass center position. We constructed a physical model of a non-uniform support by analyzing the change in force on the transmission flat after debonding. Based on the distance between the adhesive spots and the operating surface of the transmission flat, we classified the adhesive spots into three groups and selected one for analysis. The surface error caused by changes in the adhesive spots was simulated via COMSOL Multiphysics using the finite-element method. The direct result of the finite-element simulation is the global topography of the operating surface of the transmission flat, and the error surface was obtained by subtracting the surface topography under a uniform distribution of the adhesive spots. The results show that the adhesive spots nearest to the operating surface of the flat exert the most significant effect on their surface topography (Figs. 4 and 7). Additionally, we investigated the variation in the low-frequency morphology under different degrees of adhesive-spot detachment. The results indicate that adhesive-spot detachment exerts the most significant effect on astigmatism (Fig. 16).Results and DiscussionsThe liquid-reference method was employed to monitor the iterative ion-beam polishing process of the transmission flat on a Φ300 mm vertical Fizeau interferometer. The initial peak valley (PV) value of the flat surface before polishing is 122.4 nm. After three rounds of iterative polishing, some adhesive spots around the transmission flat are degummed. An appropriate digital image-processing algorithm was applied to the captured onsite images to calculate the reduction in the area and the displacement of the mass center of the detached adhesive spots. The global surface error was estimated based on the condition of the adhesive spots, and the corrected surface was obtained by subtracting the 300-mm-aperture error surface from the absolute test result via the liquid reference. Further ion-beam polishing was performed based on the corrected surface. Finally, the accuracy of the transmission flat reaches 20.45 nm, which is better than λ/30, thus validating the effectiveness of the error correction (Fig. 14). The results show that the proposed debonding error-correction method can ensure the convergence of ion-beam polishing (Fig. 15).ConclusionsThe Φ300 mm vertical Fizeau interferometer adopted in this study was equipped with a precise temperature control system and an air-floating structure, thus ensuring a constant temperature and vibration isolation in the test environment. Using this device, the repeatability of the liquid surface interference test can reach 0.005 nm (Fig. 17). After assembling the polished transmission flat and considering other error sources, such as detection and light sources, the comprehensive uncertainty of the vertical interferometer is 0.99 nm.
Jan. 20, 2025Vol. 45 Issue 1 0112001 (2025)
Meihui Liang, Wenbo Jing, Zeyu Xiong, Xuan Feng, Jiahe Meng, Kai Yao, Dongjie Zhao, and Haili Zhao
ObjectiveThe vertical target imaging test is an important part of the dynamic performance assessment of armored vehicles, and the accuracy of its center positioning is crucial to the testing and finalization of weapons and equipment. In the standing target imaging test of armored vehicles, range testers often face a series of complex and thorny problems: 1) Environmental factors such as lighting conditions and weather conditions have a significant influence on the cross symmetry of the target; 2) The target image has low contrast. 3) The target cross feature is affected by the built-in markings, occlusions, and target damage of the imaging system, resulting in the loss of key feature information. The difficulty of fully controlling these factors reduces the accuracy of target center positioning in weapon effectiveness evaluation. This problem has long troubled range testers. Although the military target detection method based on deep learning can highlight the characteristics of military targets to some extent, the contradiction between high-precision fitting and generalization makes it not the optimal solution to solve the precise positioning problem. Most of the existing traditional methods only focus on the detection of the general area where the target is located, and there are no reports on the precise positioning of the center of degraded targets with asymmetric cross features, low contrast, and missing feature information. To solve this pain point, there is an urgent need to study a central positioning method for degradation targets.MethodsWe propose a high-precision detection method for degraded target centers based on self-attention envelope tracking. The method consists of two stages. In the coarse positioning stage, the target area is detected through the YOLO series network. In the fine positioning stage, first, the image enhancement algorithm SINE based on the sine function is designed to widen the grayscale spacing of the image and enhance the outline of the target center area information. Second, using the orthogonal symmetry of the target cross feature, we propose a multi-directional attention fusion algorithm. It can better capture and utilize the rich semantic information of the target area by performing self-attention matching on the target image and its own transposed matrix. It also integrates multi-directional semantic information to enhance the target cross features while highlighting the center area to complete the reconstruction of the attention area. Then the Hilbert transform is used to construct the analytical signal and obtain the envelope of the image, highlighting important features with clear directionality such as edges and textures. Envelope tracking is achieved by eliminating the conjugate antisymmetric part in the frequency domain, so that the symmetrical structure of pixels around the target center is more noticeable. Finally, the obtained attention weight matrix is mapped to the enhanced target image to generate a target feature image, and the center of mass is calculated through the first-order moment to complete the target center positioning. The method achieves real-time performance while ensuring accuracy.Results and DiscussionsThe effectiveness of the proposed method in locating the center of the degraded target is verified through simulation experiments and field experiments. Given the imaging characteristics of degraded target images and considering the vertical target imaging test environment, the simulation data produced in cross-feature asymmetry, dark light environment, and occlusion are compared with the accuracy of positioning the cross center using the traditional centroid method. The simulation results show that in the case of asymmetric cross center, the root mean square error (RMSE) of the centroid method is larger and fluctuates significantly throughout the sequence; the RMSE of our method is smaller and more stable under different contrast conditions [Fig. 5(a)]. In a dark light environment, when the target contrast of our method is 0.75, the center-positioning RMSE accuracy is 0.04 pixel [Fig. 6(a)]. The centroid method is affected by low contrast, resulting in a decrease in positioning accuracy, but the RMSE of our method remains small, showing higher accuracy and robustness [Fig. 6(b)]. When the occlusion degree is 24.87%, the accuracy of our method is 0.15 pixel [Fig. 7(a)], which can effectively deal with the problem of missing target feature information caused by target occlusion, the RMSE in the entire sequence is smaller, and the accuracy is more stable. Field tests show that compared with the measurement method combining template matching and the centroid method, our proposed method can more accurately locate the target center under full-spectrum conditions, fully demonstrating the detection capability of the method under degraded conditions (Figs. 8 and 9). In the actual application of the shooting range identification field, the pixels are converted into angle-measurement accuracy by bringing into the system angular-measurement resolution, which is used to inspect the performance parameters of the shooting range equipment.ConclusionsAiming at the problem that the cross feature of the target image in the vertical target imaging test scenario is asymmetric, low contrast, and missing feature information, which causes image degradation and affects the accuracy of center positioning, we propose a high-precision detection method for the center of the degraded target based on self-attention envelope tracking. Through a large number of experimental analyses, the following conclusions are obtained: 1) The multi-directional attention fusion algorithm we designed makes full use of the orthogonal symmetry of the cross feature of the target and effectively solves the problem of less target feature information under degraded conditions. 2) Envelope tracking is introduced to construct analytical signals through the Hilbert transform, analyze the amplitude of grayscale changes and local intensity changes in the image, and enhance the accurate characterization of the target center feature, which not only makes the center positioning result more accurate and reliable but also improves the anti-interference ability of the method. 3) The method has high detection accuracy and speed. When the cross feature is asymmetric, the center positioning RMSE accuracy is 0.06 pixel; when the contrast is 3.17, the accuracy is 0.01 pixel; when the occlusion degree is 24.87%, the accuracy is 0.15 pixel; the detection speed reaches 270 frame/s, which can provide strong support for the neutral target imaging test of equipment dynamic performance assessment.
Jan. 16, 2025Vol. 45 Issue 1 0112002 (2025)
Zhengqiong Dong, Jingyi Wang, Yijun Xie, Zedi Li, Renlong Zhu, Lei Nie, and Jinlong Zhu
ObjectiveCurrent digital holographic microscopy systems that can perform both transmission and reflection measurements are limited in availability. Typically, traditional digital holographic microscopes utilize Michelson interferometry for reflection measurements and Mach-Zehnder interferometry for transmission measurements, each confined to a single mode. To overcome these limitations, recent studies have aimed at improving traditional interferometric structures to support dual measurement modes. However, these systems often require complex adjustments to switching modes, such as installing cube beam splitters and repositioning complementary metal oxide semiconductor (CMOS), which adds to operational complexity and reduces efficiency. In addition, some systems using common-path off-axis interferometry reply on diffraction gratings for beam splitting, necessitating the replacement of gratings with different constants when changing objective lens magnification, along with adjustments to the filtering aperture. To address these challenges, we propose a low-cost dual-mode quantitative phase microscopic imaging method, using conventional optical components. The proposed method employs a Mach-Zehnder point diffraction interferometric structure, directly filtering the object light to produce a reference beam for interference with the object light. This design enhances flexibility in illumination for the microscopic imaging component and integrates transmission and reflection modes, broadening the range of measurable scenarios without requiring equipment changes or complex adjustments.MethodsThe dual-mode quantitative phase microscopic imaging method utilizes Mach-Zehnder point diffraction interferometry, with the imaging component functioning independently from the interferometric component. During transmission or reflection illumination, the object beam passes through the microscopic system into the Mach-Zehnder point diffraction optical path, where a beam splitter with a 9∶1 ratio divides it. One beam, accounting for 90% of the total intensity, is filtered through a pinhole to serve as the reference beam, ensuring similar intensity to the remaining 10% of the object beam to form interference. The phase retrieval algorithm based on the Fourier transform is then applied to reconstruct the phase from the interference pattern, revealing the true morphological details of the sample.Results and DiscussionsThe constructed dual-mode quantitative phase imaging system is first tested on a transparent sample in transmission mode. Fig. 4 illustrates the interference pattern between the object wave containing the sample’s structural information and the reference wave. The true morphology is obtained via phase recovery from this pattern (Fig. 6). Repeated measurements across 30 data sets reveal an average depth of the etched letter “I” to be (101.0±1.6) nm, with a relative error of 0.50% compared to the nominal manufacturing value of (100.5±4.0) nm. This confirms the system’s accuracy and feasibility in transmission mode. To validate the system’s performance in reflection mode, the etching depth of deep grooves on a silicon substrate is measured. The three-dimensional morphology of the sample is shown in Fig. 8(a), with Fig. 8(b) displaying the statistical distribution of surface height values. Across 30 repeated measurements, the depth of the recessed structure is calculated as (210.7±1.5) nm. Due to an approximate deviation of 12.0 nm from the design value, a commercial white light interferometer (ER230, ATOMETRICS) is used for comparative analysis, yielding an average depth of 212.4 nm. The relative error of 0.80% between the two methods further validates the system's effectiveness in reflection mode.ConclusionsIn this paper, we propose a dual-mode quantitative phase microscopic imaging method based on the Mach-Zehnder point diffraction principle. Compared to existing methods, the proposed system enables rapid switching between transmission and reflection modes by simply inserting a reflective mirror, eliminating the need for complex optical path adjustments. In contrast to traditional common-path off-axis interferometric optical paths, which require the use of diffraction gratings for beam splitting and the replacement of gratings with different grating constants when changing the magnification of the objective lens, as well as adjustments to the position of the filtering aperture, this method reduces the dependence on specific optical components. Experiments conducted with the constructed dual-mode quantitative phase microscopic measurement system demonstrate that the etching depth of the quartz substrate sample surface measured in transmission mode is (101.0±1.6) nm, with a relative error of 0.50%, and the etching depth of the deep grooves on the silicon substrate surface measured in reflection mode is (210.7±1.5) nm, with a relative error of 0.80%. These results validate the effectiveness and reliability of the dual-mode quantitative phase microscopic measurement system proposed in this paper.
Jan. 20, 2025Vol. 45 Issue 1 0112003 (2025)
Zhiwei Zuo, Xuezhu Lin, Xihong Fu, Lili Guo, Fan Yang, Yetao Yang, Yu Lei, and Zhiguo Li
ObjectiveLarge-scale complex optical?mechanical systems are widely applied in high-tech fields like aerospace, space remote sensing, and lithography. As the apertures of ground-based astronomical telescopes and space-based complex optical systems keep increasing, optical systems show characteristics such as large-scale non-coplanar spatial structures, multi-load integrated optical layouts, multi-band shared apertures, and higher precision requirements. Meanwhile, the extensive application of novel design structures and special optical elements has exponentially increased the difficulty and complexity of aligning and assembling optomechanical systems, posing new challenges to the assembly process. The assembly precision of large optomechanical systems is one of the key factors affecting imaging quality and performance metrics, and it is also a critical aspect in determining whether a theoretical design can be successfully transformed into a high-performance optical device. The design and alignment of optical systems usually center around the optical axis. However, due to the invisibility of the optical axis, specific alignment techniques are needed for the initial alignment of complex optomechanical systems. Currently, initial alignments often rely heavily on the experience of assembly personnel, which brings in significant human errors, resulting in unstable measurement results and poor image quality. This also increases labor costs and assembly time. Moreover, measurement devices are relatively independent, lacking interconnection, and their data cannot be unified. Therefore, it has become more and more urgent to research digital and data-traceable assembly processes for complex optomechanical systems.MethodsTo address the issues of complex spatial layout, difficult alignment and adjustment, and the hard characterization of optical axes in off-axis and eccentric multi-reflection optical systems, we propose a quantitative characterization method for optical axes based on multi-system collaborative measurements. First, we establish a digital multi-system collaborative measurement field model to unify different measurement coordinate systems and ensure coordination and consistency among systems. Second, we realize the quantitative characterization of the optical axis and the transmission of the mechanical?optical reference in the measurement field by using a point-source microscope. Based on this transferred optical reference, we adjust the position and orientation of the mirror group to ensure the precision and reliability of system assembly. Furthermore, through in-depth accuracy analysis, we assess and optimize the errors in the optical axis quantification, resulting in a validated and mature alignment and adjustment process. This method not only significantly improves assembly efficiency but also reduces human errors, ensuring the overall imaging quality and system performance. Additionally, the method creates a data-traceable digital assembly by tracking the attitude information of optical components during the assembly process, ensuring the consistency of measurement and analysis among different subsystems. The accuracy of the optical axis calibration is further validated, with a position error of less than 25 μm and a decentering accuracy better than 10″, meeting the current optical system calibration requirements.Results and DiscussionsWe construct a digital collaborative measurement field for large-scale complex optical-mechanical systems. In this field, the measurement coordinate systems of different subsystems are transformed into a global coordinate system through common points. This enables us to track the attitude information of optical components during assembly, ensuring that the systems are no longer independent. By using the digital measurement field to trace the measurement data of each optical component, we can reverse-engineer, review, and track the process of adjustments and equipment calibration in real-time, allowing for quick identification and troubleshooting of issues during assembly. We use devices such as point-source microscopes, theodolites, and laser trackers to digitally represent the virtual optical axis of the optomechanical system. We propose a method to transfer the mechanical reference to the optical reference using SMR target balls and point-source microscopes, replacing the traditional mechanical reference used in assembly. Then, the transferred optical reference is used for the alignment of the optomechanical system. Based on the small displacement screw theory, we develop a mathematical model for optical axis characterization error. By combining the error from the laser tracker during positioning, we analyze the accuracy of the optical axis quantification. The results show that the optical axis calibration position error is less than 25 μm, and the decentering accuracy is better than 10″, meeting the current optical axis calibration requirements.ConclusionsWe propose a multi-system collaborative measurement method to digitally represent the virtual optical axis. Based on this, the SMR target ball is used to transfer the mechanical?optical reference. We derive the theoretical model of optical axis characterization, providing an effective method for the digital representation of the optical axis. We evaluate the optical axis positioning accuracy using the small displacement screw theory, comprehensively assessing the errors of each instrument in the optical axis representation. It is determined that the optical axis calibration position error is less than 25 μm, and the decentering accuracy is better than 10″, meeting the current requirements for optical systems.
Jan. 22, 2025Vol. 45 Issue 1 0112004 (2025)
Yiqiang Sun, Tanxiao Zhu, Qinglin Niu, Zhihong He, and Shikui Dong
ObjectiveThe processes involved in the transmission of radiation in rocket engine exhaust plumes—such as thermo-chemical reactions, propellant combustion, turbulent flow, and gas molecule vibrational transitions—are extremely complex. These processes are characterized by high dimensionality, strong nonlinear behaviors, and intricate propagation mechanisms. The infrared radiation characteristics of the rocket engine plume are influenced by various parameters, including engine parameters (propellant type, propellant formulation, nozzle geometry, engine thrust), flight parameters (flight altitude, flight velocity), and detection parameters (detection angle, detection wavelength). It is crucial to perform a sensitivity analysis of these parameters to the infrared radiation signals emitted by rocket engines. Such an analysis will help classify and identify radiation signal layers from the plume and reverse-engineer of the engine formulation.MethodsThe sensitivity analysis is performed using a combination of polynomial chaos expansions (PCE) and Sobol' indices. The process begins by defining the input variables’ probability space, including their distribution types and sampling range. The sparse grid method is then employed to sample the input variables, with the resulting samples fed into the numerical simulation or experiment to generate the response values. These values, along with the input parameters, are used to solve for the PCE coefficients for variance decomposition. Finally, the main and total Sobol' indices are calculated using the total variance and local variance. The infrared radiation model for the rocket plume consists of three parts: 1) A CEA code calculates the engine nozzle exit parameters such as pressure, temperature, velocity, and gas components. 2) A k-ε two-equation turbulence model is used to compute the engine plume’s flow field, while a finite-rate chemical kinetic model with 10 reactions and 9 components describes the chemical nonequilibrium effects. 3) A single-line group (SLG) model with the Curtis-Godson approximation combined with the line-of-sight (LOS) method is applied to solve the radiative transfer equations.Results and DiscussionsThe oxygen-fuel ratio primarily affects the nozzle exit temperature and gas components, while the combustion chamber pressure and nozzle expansion ratio significantly influence the nozzle exit pressure, velocity, density, and specific impulse (Fig. 6). The nozzle diameter solely affects the thrust. The combustion chamber pressure dominates the spectral radiation intensity in the 2?20 μm range at altitudes below 31 km (Fig. 8). In contrast, the oxygen-fuel ratio significantly influences spectral radiation intensity in the 1?2 μm shortwave and 8?15 μm ranges. As altitude increases, the main Sobol' indices Si for the oxygen-fuel ratio progressively grow. The relationship between integrated radiation intensity and flight altitude (Fig. 9) is examined across four different bands: 2.7?3.0 μm, 4.2?4.5 μm, 3.7?4.8 μm, and 7.7?9.5 μm. At altitudes up to 35 km, the effects of the oxygen-fuel ratio and flight velocity on radiation are minimal, with combustion chamber pressure being the dominant factor. However, at altitudes above 55 km, the influence of the oxygen-fuel ratio and flight velocity increases significantly, surpassing the influence of the combustion chamber pressure. At low and medium altitudes, the mutual coupling between flight velocity, oxygen-fuel ratio, and combustion chamber pressure has a more significant effect on plume radiation intensity (Fig. 11). As altitude increases, the coupling strength of these input parameters approaches a value slightly above 1. At higher altitudes, the total and main Sobol' indices for the three parameters converge, indicating that individual parameter variations dominate the effect on plume radiation intensity.ConclusionsWe use the RD-180 liquid-oxygen/kerosene rocket engine exhaust plume as a reference to conduct a sensitivity analysis of the nozzle flow parameters and the plume’s infrared radiation signal. The analysis employs the polynomial chaos expansion method combined with Sobol' indices, using a sparse grid algorithm to minimize the number of samples required. Key conclusions are as follows: 1) The oxygen-fuel ratio primarily affects gas temperature and composition at the nozzle exit, while combustion chamber pressure influences the exit pressure and density. The nozzle expansion ratio affects the exit velocity and specific impulse, and the nozzle diameter only influences thrust. 2) A quantitative analysis of how operational parameters like oxygen-fuel ratio, combustion chamber pressure, and flight velocity affect spectral radiation intensity in the 1?20 μm wavelength range was conducted across altitudes of 11?61 km. Below 31 km, combustion chamber pressure is the dominant factor for radiation intensity in the 2?20 μm range. The oxygen-fuel ratio affects the spectral radiation intensity at a shorter wavelength range of 1?2 μm and affects the intensity more significantly as altitude increases, particularly in the 8?15 μm range. 3) The integral radiation intensity analysis across bands (2.7?3.0 μm, 4.2?4.5 μm, 3.7?4.8 μm, and 7.7?9.5 μm) shows that the effects of oxygen-fuel ratio and flight velocity are minimal below 35 km, where combustion chamber pressure dominates. Above 55 km, the influence of the oxygen-fuel ratio and flight velocity surpasses that of the combustion chamber pressure. Coupling effects between input parameters diminish with altitude, with individual variations becoming the dominant factor affecting plume radiation intensity.
Jan. 20, 2025Vol. 45 Issue 1 0112005 (2025)
Tianyu Li, Feipeng Zhu, Pengxiang Bai, Dong Lei, and Xin Kang
ObjectiveThe dual-field-of-view optical extensometer based on telecentric lens imaging enables a long gauge length that far exceeds the camera’s resolution and offers low image distortion, allowing for high-accuracy strain measurement. However, its strain measurement range is limited by the displacement of the gauge points, making it difficult to apply in large strain measurements. To address this, we propose a large-strain optical extensometer based on segmented strain superposition, referencing the existing concept of segmented measurement. The image sequence is divided into segments based on the displacement of the gauge points, with strain calculations performed for each segment. A strain superposition algorithm is then employed to avoid displacement matching errors caused by excessive deformation between images, enabling high-accuracy strain measurement in large strain scenarios.MethodsEpoxy resin and glass fiber materials are used in this study. Two axial strain gauges are attached to one face of each specimen, while the other face is coated with a matte white primer and black speckle pattern. Uniaxial tensile tests are conducted on each specimen using a universal testing machine, and the strain data are collected through strain gauges connected to a strain meter. The strain values measured by the strain gauges are corrected using a correction formula. A camera equipped with a field-of-view (FOV) splitting device and a telecentric lens is used to capture test images, and the strain superposition algorithm is applied to calculate large strains. The strain results obtained through the optical extensometer and electrical measurement methods are analyzed.Results and DiscussionsThe uniaxial tensile test results for three groups of epoxy resin specimens, obtained using both the large-strain optical extensometer and the electrical measurement method (Fig. 10), show high consistency. For loads below 5000 N, the error between the two methods is less than 20 με, indicating excellent measurement stability. As the load increases, the strain of the specimens increases, causing greater fluctuations in the measurement error. However, the absolute error remains below 61 με until specimen failure. A comparison of the elastic modulus and relative error from the three tests (Table 3) reveal that the error between the two methods is within 0.4%. Similarly, the uniaxial tensile test of the glass fiber specimen (Fig. 11) shows an elastic modulus measurement error of 0.09%, further confirming the high accuracy of the proposed method.ConclusionsOptical extensometers have been widely used in many fields due to their non-contact testing capabilities and ability to measure large strains. However, achieving high accuracy in large strain measurements is challenging due to the camera’s resolution limitations. This study presents a large-strain, high-accuracy optical extensometer based on the FOV-splitting technique for large strain measurement. By adopting the concept of segmented displacement superposition from digital image correlation (DIC), we propose a method for grouping image sequences and superimposing large strains to improve measurement accuracy. Additionally, to address strain errors in electrical measurement during large strain testing, we introduce a strain correction method. Based on these methods, uniaxial tensile tests are performed on three groups of epoxy resin specimens and one group of glass fiber specimens. Load-strain curves and strain errors are obtained using both the large-strain optical extensometer and the corrected electrical measurement method, and the specimens' elastic modulus is calculated. The results demonstrate that the strain results obtained using the proposed large-strain method are highly consistent with those from the electrical measurement method, with a root-mean-square error (RMSE) of approximately 20 με. This validates the high measurement accuracy of the large-strain optical extensometer based on segmented strain superposition and the FOV-splitting technique, highlighting its potential for large deformation measurement in materials.
Jan. 16, 2025Vol. 45 Issue 1 0112006 (2025)
Qi Wu, Xiaoyu Zhu, and Chuanlong Xu
ObjectiveCombining light field imaging with particle image velocimetry (PIV), single-camera light field tomographic PIV technology allows for three-dimensional flow field measurements from a single viewpoint, particularly useful in narrow-channel applications where observation windows are limited. However, significant axial stretching of flow tracer particles and the averaging effects inherent in cross-correlation algorithms reduce spatial resolution, limiting the ability of this technology to resolve finer flow structures. While existing methods, including traditional algorithms, data assimilation techniques, and neural networks, attempt to address these challenges, none fully succeed. In this paper, we propose a high-resolution light field tomographic PIV technique based on physics-informed neural networks (PINNs), aimed at enhancing spatial resolution and accurately predicting dense flow field information.MethodsTo meet the practical demands of light field PIV, we first analyze the integration of the Navier-Stokes (N-S) equations as prior physical information with a neural network model, constructing a PINN-PIV model for high-resolution three-dimensional flow field prediction. The model is trained using experimental data. Prior to training, three-dimensional velocity fields are segmented into two-dimensional slices, which are then fed into the model for refined predictions. The model’s performance is evaluated through numerical simulation and the reconstruction of Gaussian vortex displacement fields. We compare the results of PINN-PIV with those obtained using traditional cross-correlation methods to validate the effectiveness of the PINN-PIV approach. Finally, we conduct experiments on cylindrical flow using light field tomographic PIV to assess the model’s predictive accuracy on real experimental data.Results and DiscussionsThe numerical reconstruction shows that the global root mean square errors of the predicted u, v, and w displacement components of the Gaussian vortex using the PINN-PIV model are 0.2433, 0.2105, and 0.2423 voxel, respectively. This represents a reduction of 52.36%, 58.95%, and 75.84% compared to traditional cross-correlation methods. Notably, the model significantly improves the prediction accuracy of the w component, which is typically prone to high errors due to stretching effects, thus enhancing depth-direction resolution (Fig. 7). In cylindrical flow field tests, the PINN-PIV model increases the measurement resolution of light field PIV by eightfold. This improvement allows for precise identification and enhancement of vortex structures, which correspond to the alternating vortex shedding in cylindrical wake flows, leading to a detailed characterization of small-scale vortex structures (Fig. 10).ConclusionsTo address the issue of low spatial resolution in single-camera light field tomographic PIV measurements, we propose a high-resolution technique utilizing PINN. By integrating the N-S equations as prior physical information into sparse flow field observational data, we establish a mapping between spatial coordinates and velocity components, enabling high-resolution predictions of dense three-dimensional flow fields. The accuracy of the proposed PINN-PIV fusion model is first assessed using simulated Gaussian vortex data, followed by validation through cylindrical flow field experiments. The results indicate that the PINN-PIV model improves the spatial resolution of flow measurements by eightfold when compared to traditional cross-correlation velocity field computations. It reduces the global root mean square errors of the predicted u, v, and w displacement components by 52.36%, 58.95%, and 75.84%, respectively. Specifically, for the depth-direction w component—typically more affected by reconstruction stretching effects and prone to higher errors—the PINN-PIV model significantly decreases errors, bringing them in line with those of the u and v components. In the cylindrical flow experiment, the model also demonstrates its ability to perform data refinement and smoothing, accurately predicting vortex locations and resolving vortex structures based on limited data. These results confirm that the PINN-PIV fusion model can achieve high-resolution flow field predictions and provide detailed characterizations of flow structures from relatively sparse light field PIV measurement data.
Jan. 21, 2025Vol. 45 Issue 1 0112007 (2025)
Guangxin Gao, Haisha Niu, Sijin Wu, Cuifang Kuang, and Zhaizi Xie
ObjectiveWave plates are polarizing devices with specific birefringence and play a vital role in optical systems. The optical axis azimuth angle and phase retardation are two key parameters of the wave plate, directly determining the performance of the optical system. Therefore, it is of great significance to rapidly and precisely measure the optical axis azimuth angle and phase retardation. Researchers worldwide have proposed numerous single-point measurement methods for wave plates, but full-field measurement of wave plates has not been achieved. In this study, we develop a full-field measurement method and system for wave plates based on polarization-sensitive digital speckle pattern interferometry (PS-DSPI). We obtain the speckle interferogram by beam-expanding illumination of the wave plate to be measured. We position the optical axis azimuth angle by analyzing the speckle interferogram of polarization states. We measure the phase retardation through spatial carrier phase extraction and image processing techniques. We analyze the error of full-field phase retardation. Laser beam expansion causes the light to enter the wave plate at an oblique incidence, which is an important error source. The method proposed in this study is significant for the full-field and rapid measurement of wave plate performance and extends the application range of digital speckle pattern interferometry (DSPI) in polarization.MethodsThe measured setup of PS-DSPI system is shown in Fig. 1. The emitted light first is divided into object light and reference light by the beam splitter (BS). The object light passes through a half-wave plate (HWP), which is used as a polarization direction rotator. The polarization-adjustable light passes through the beam expander and illuminates the quarter-wave plate (QWP) to be measured. A polarization-maintaining metal plate is placed behind the QWP, and its scattered light is imaged on the target surface of the charge coupled device (CCD) through the imaging lens and the aperture. The reference light is coupled to a polarization-maintaining fiber (PMF) through a fiber coupler for transmission into the optical path and interferes with the object light to form a speckle interferogram in the form of an intensity recorded by a CCD camera, which is transmitted to a computer (PC) for calculation. A stepper motor is used to drive the HWP rotation to rotate the polarization direction of the incident light with a single step of 1.0° and a rotation scanning angle range of 0°?180°. We obtain the speckle interferogram by beam-expanding illumination of the wave plate to be measured. The processes of applying the PS-DSPI system to position the optical axis azimuth angle of the wave plate and solve the birefringent phase retardation are shown in Fig. 2. We control the polarization scanning angle to rotate from 0° to 180° by the HWP. We collect 180 speckle interferograms. We use the speckle interferograms acquired by the PS-DSPI system to position the optical axis azimuth angle of the wave plate. Interferograms with different polarization angles have diverse light intensities. We define the polarization angle at the maximum light intensity value as the fast axis (o light), and the minimum as the slow axis (e light). We apply the spatial carrier phase extraction technique to calculate the birefringence phase retardation of the wave plate along the optical axis (fast axis) and its orthogonal direction (slow axis). Finally, we obtain the full-field phase retardation of the wave plate by phase filtering and phase unwrapping.Results and DiscussionsThe wave plate to be measured in the experiment is a standard nine-order QWP. In Fig. 4, the maximum light intensity value is at 150°, so the polarization scanning angle at 150° is determined as the fast axis azimuth angle of the wave plate. Since the interferograms recorded by the CCD camera are the imaging information of the scattered light, the light passes through the wave plate to be measured twice (incident and reflected). We select two interferograms with a 45° difference in the polarization angles as the fast and slow axes. The minimum light intensity value at 105° is the slow axis azimuth angle. We can calculate the phase retardation of the wave plate by subtracting the slow axis azimuth angle (105°) from the fast axis azimuth angle (150°). The results are shown in Figs. 9 and 10. The phase retardation tends to decrease from the center of the expanded beam to the edge, with a maximum value of 1.495 rad and a minimum value of 1.384 rad. Laser beam expansion leads to an oblique incidence of light into the wave plate to be measured. The incident angle is not a particular value but within a certain range. We establish a theoretical model of the phase retardation and birefringence caused by the oblique incident beam on the wave plate. We apply the oblique incidence error model to correct the measurement results of the wave plate. The actual incident angle range is 24.5°?29.1°. Based on the phase measurement results of 1.495 rad to 1.384 rad, we fit the phase measurement results using the least-squares method, as shown in Fig. 15. The corrected curve is indicated by the green dashed line in Fig.15. The maximum phase value is 1.605 rad. According to the size of the wave plate and the beam expansion distance, the corrected oblique incidence angle range is ±0.96°. Therefore, after error correction, the full field phase retardation range of the wave plate is 1.588?1.605 rad. The comparison before and after correction is shown in Fig. 16.ConclusionsIn this study, based on the current demand for accurate full-field measurement of wave plates, we propose a full-field birefringence measurement method for wave plates based on PS-DSPI. We theoretically analyze and experimentally verify the phase retardation characteristics of the birefringent element in the PS-DSPI system. We analyze the oblique incidence of light due to laser beam expansion in the system. We test the method through a standard QWP. We measure two important optical parameters, the optical axis azimuth angle of the wave plate and the full-field birefringence phase retardation. We analyze the error of the phase retardation caused by the oblique incidence of light. The experimental results demonstrate that, using this method, the accuracy of determining the azimuth angle of the wave plate’s full-field optical axis is 1.0°, and the theoretical resolution of phase retardation measurement reaches 0.012 rad. After compensation for the oblique incidence model, the full-field measurement results for the tested QWP (marked 1.571 rad) range from 1.588 to 1.605 rad. The basis of the work in this article meets the requirements of fast, high-precision, and full-field measurement.
Jan. 23, 2025Vol. 45 Issue 1 0112008 (2025)
Xinwei Lian, Shiyao Fu, Qing Wang, and Chunqing Gao
ObjectiveSolid-state lasers pumped by laser diodes have advantages including high conversion efficiency, excellent beam quality, and stable laser output. As the demand for laser power in various applications keeps increasing, the thermal effects inside the laser cavity have become a crucial factor affecting laser mode, efficiency, and beam quality. For end-pumped solid-state lasers, a good match between the pump light and laser mode is beneficial for better control of the laser beam quality. In contrast, side-pumping allows for higher pump powers but has poorer pump uniformity, which can easily lead to simultaneous oscillations of multiple transverse modes. Therefore, besides homogenizing the pump distribution as much as possible, it is necessary to study the effect of uneven pump distributions and the resulting thermal effects on the resonator modes. Since side-pumping and its thermal effects may have complex and asymmetric spatial distributions, and potentially excite higher-order transverse modes, in this study, we adopt a diffraction-based method for solving the resonator modes for analysis. This method has developed rapidly since the beginning of this century, and it can simultaneously calculate a large number of eigenmodes inside the resonator and handle resonators affected by complex physical fields, thus providing abundant physical information.MethodsIn this study, we first introduce the transmission matrix eigenvalue method for solving the resonant cavity mode, including its mathematical form and corresponding physical meaning. Using this method, we analyze the influence of thermal effects on the modes of a laser resonant cavity that utilizes a double-end side-pumped Nd∶YAG cylindrical crystal as the gain medium. In this process, a mathematical model for the double-end side-pumped power distribution is established, and the temperature and strain distributions within the gain crystal are obtained through finite element analysis (FEA). Then, the spatial phase modulation of the laser caused by the gain crystal, which results from end-surface deformation and refractive index variation under different pump powers, is derived. Finally, by integrating the FEA results with the transmission matrix method, the distributions and loss variations of both the transverse and longitudinal modes within the resonant cavity are traced, respectively.Results and DiscussionsWe study the influence of thermal effects on both the transverse and longitudinal modes of the laser resonator at different pump power levels. Our results show that, in the presence of thermal effects, the losses of each transverse mode are higher than those of a resonator without such effects. As the pump power increases, there is a consistent trend in the loss variation of transverse modes, but there is a significant reordering of loss magnitudes among modes. Specifically, higher-order transverse modes can have lower losses than lower-order ones, making them more likely to oscillate (Figs. 12 and 13). In contrast, for longitudinal modes, thermal effects have a minimal effect on the mode spacing but cause a noticeable shift in the resonator’s characteristic frequencies (Figs. 14 and 15). In this study, we first use finite element analysis and ray tracing methods to analyze the intracavity phase modulation caused by thermal effects in doubly side-pumped solid-state lasers. To address thermal effects, we adopt the eigenvalue approach of the diffraction transfer matrix method, replacing the conventional thermal effect simulation based only on the thermal lens focal length. This effectively utilizes the rich spatial information obtained from finite element analysis, enabling the modeling and simulation of complex thermal phase modulations that are difficult to accurately describe only with the thermal lens focal length. This approach facilitates the simultaneous calculation of all eigenmodes and their respective losses within the resonator under the influence of thermal effects.ConclusionsTo study the effect of non-uniform and asymmetric thermal effects on resonator modes, we build a mathematical model for the power distribution of the pump light in an LD side-pumped solid-state laser. Using the eigenvalue method of the diffraction transmission matrix, we quantitatively study the influence of thermal effects within the laser medium on the transverse and longitudinal modes of the resonator in the case of this solid-state laser. Our research reveals that as the thermal effects increase with the increase in pump power, the overall loss of each transverse mode increases, causing the loss of some higher-order transverse modes to be lower than that of lower-order modes, thus making them more likely to oscillate. The amplitude and phase distributions of the solved transverse modes also indicate that distortions occur at the edges of different transverse modes, suggesting a degradation in beam quality. At the same time, while the longitudinal mode spacing of the resonator remains unchanged, the positions of the longitudinal modes shift.
Jan. 22, 2025Vol. 45 Issue 1 0114001 (2025)
Wanlin He, and Yanjun Qin
ObjectiveThe fabrication of subwavelength nanostructures induced by femtosecond laser irradiation is critical to modern nanophotonics and has extensive applications across various fields. This study investigates the subwavelength periodic structural characteristics and formation mechanism of 4H-SiC material surfaces induced by delayed triple femtosecond laser pulses. By controlling the polarization direction and delay time of the three incident laser beams, subwavelength nanostructures of varying scales and dimensions are produced on the sample surface. Experimental results indicate that by adjusting the number of laser pulses and the delay time, the spatial period of the induced nanostructures can shift from high spatial frequency to low spatial frequency. In addition, by modulating the polarization direction between the three laser beams, two-dimensional low-spatial-frequency nano-square and nano-rhombic structures are generated on the sample surface. To explain the physical mechanism behind the formation of these subwavelength nanostructures, a transient temperature grating model is proposed. This model suggests that transient temperature gratings (or transient refractive index gratings) play a pivotal role in the laser irradiation process. The evolution of these gratings and subsequent energy relaxation ultimately result in permanent nanostructures. The surface roughness caused by laser irradiation further enhances the excitation of transient temperature gratings, promoting the formation of these permanent nanostructures. This research provides valuable insights into the controllable fabrication and underlying mechanisms of laser-induced periodic surface structures (LIPSSs).MethodsIn this study, we use a Ti: sapphire femtosecond laser amplifier (Spectra-Physics HP-Spitfire) as the irradiation source, delivering horizontally polarized pulse trains at a 1 kHz repetition rate, with a central wavelength of 800 nm and a pulse duration of 50 fs. The maximum pulse energy delivered by the system is 2 mJ. The laser output is split into three beams (P1, P2, P3) using a beam splitter (BS). To fine-tune the laser processing parameters, laser power meters (PMs), half-wave plates (HWPs), and delay lines are introduced into the optical paths of P1 and P3. After passing through the delay lines, the three laser beams are aligned for collinear propagation and focused onto the sample using a 4× objective lens at normal incidence. A bulk 4H-SiC plate (20 mm×20 mm×1 mm) is mounted on a three-dimensional precision translation stage. The sample is positioned approximately 300 μm before the focal point, resulting in a Gaussian laser spot with a diameter of approximately 60 μm on the surface. During line scanning, a scanning speed of 0.1 mm/s is used, leading to a pulse overlap of 600 per scan. The sample surface is ultrasonically cleaned in acetone before and after the experiments. Surface morphology is analyzed using scanning electron microscopy (SEM) after the laser processing.Results and DiscussionsThe laser-induced surface periodic structures are modified by controlling the laser processing parameters. When two laser beams with a fixed delay irradiate the sample, the quasi-periodic and periodic nano-grating structures exhibit low spatial frequency (LSF) characteristics (Fig. 3), in contrast to the single-beam and zero-delay double-beam laser results. Experimental findings suggest that the delay time between the beams significantly influences the formation of LSF nano-gratings. Using delayed triple femtosecond laser pulses, one-dimensional nano-grating ripples with LSF properties are fabricated, and a branching phenomenon is observed, where one LSF stripe splits into three high-spatial-frequency (HSF) stripes at the ripple edges (Fig. 4). The stripe bifurcation is associated not only with transient gratings but also with the energy deposition from femtosecond laser pulses. When the three laser beams have perpendicular polarization directions, a two-dimensional square-like structure forms on the surface [Fig. 5(b)], while a two-dimensional rhombus micro bump structure emerges when the polarization directions are set at θ1=θ2=60° [Fig. 5(c)]. These observations suggest that the polarization direction of the incident laser determines the orientation of the transient temperature gratings, thus shaping the final nanostructures.ConclusionsIn this paper, we explore the characteristics and formation mechanisms of one-dimensional nano-grating and two-dimensional nanostructures on the surface of 4H-SiC using triple time-delayed femtosecond laser pulses. Initially, linearly polarized femtosecond lasers induce HSF grating-like structures on the surface. Then, one-dimensional nano-grating structures with LSF characteristics are created through delayed double-beam laser pulses, with experimental results showing that as the delay time increases, the spatial period of the grating transitions from HSF to LSF. Lastly, by modulating the polarization direction and delay time of the three lasers, LSF nano-grating structures and two-dimensional square and rhombus patterns are fabricated. We demonstrate that two-dimensional periodic surface structures can be fabricated on the surface of 4H-SiC using three temporally delayed pulsed laser beams. Regarding the transition mechanism of the nano-grating period from HSF to LSF, preliminary analysis suggests that the incidence of two or three delayed laser beams increases the electron density in the irradiated area, reducing the dielectric constant in the localized air layer containing free electrons on the sample surface. This process ultimately induces the formation of LSF nano-grating ripple structures. A physical model based on surface plasmon polaritons (SPPs) and transient temperature grating is proposed to explain the structure formation process. The combined effect of the three laser beams induces transient temperature gratings, whose evolution and energy relaxation promote the formation of two-dimensional nanostructures and increase surface roughness. These findings provide essential insights into the fabrication of LIPSSs and their potential applications in direct laser fabrication of nano-devices.
Jan. 20, 2025Vol. 45 Issue 1 0114002 (2025)
Xiaoxue Xia, Dahao Wang, Yuanzhe Cao, Guo Yuan, Yingyuan Hu, and Xin Zhao
ObjectiveTo develop novel long-wavelength red TADF materials, two compounds, diTPA-DPPDC and diTPA-DPPDQ, are synthesized using dipyrido[3,2-a:2',3'-c]phenazine (DPPZ) as the base receptor, modified with cyanide and cyanobenzene groups. Both materials exhibit characteristic delayed fluorescence properties, including small single-triplet energy differences (ΔEST) and relatively high oscillator strengths (0.0682 and 0.0794, respectively) compared to conventional donor-acceptor TADF molecules. This balance between small ΔEST and high photoluminescence quantum yield (PLQY) is achieved using triphenylamine (TPA) as a sterically hindered donor to suppress aggregation-induced fluorescence quenching (ACQ). Cyanide modification in diTPA-DPPDC enhances molecular conjugation, resulting in deep red emission at 686 nm, though its lower oscillator strength (0.0682) limits its PLQY. Conversely, the cyanobenzene-modified diTPA-DPPDQ emits red light at 605 nm, with a higher oscillator strength (0.0794), achieving a PLQY of 62.8%, indicative of superior luminescence performance.MethodsIn this paper, we synthesize the diTPA-DPPDC and diTPA-DPPDQ materials via Buchwald?Hartwig and Suzuki coupling reactions. Their photophysical, delayed fluorescence, and thermal properties are investigated. Comparative analysis of their luminescent properties is conducted to evaluate their performance.Results and DiscussionsThe structures of diTPA-DPPDC and diTPA-DPPDQ are confirmed by 1H NMR, 13C NMR, and high-resolution mass spectrometry (HRMS). Density functional theory (DFT) calculations reveal twisted molecular structures due to TPA incorporation, which effectively suppresses ACQ and minimizes ΔEST (Fig. 3). diTPA-DPPDC exhibits deep red emission at 686 nm, while diTPA-DPPDQ emits red light at 605 nm due to the breaking of conjugation by the benzene ring [Fig. 4(a)]. Both compounds exhibit typical delayed fluorescence behavior (Fig. 5). Fluorescence peaks of both materials red-shift with increasing solvent polarity, demonstrating intramolecular charge transfer (ICT) characteristics [Figs. 4(c) and 4(d)]. When doped into CBP thin films at 15% (mass fraction), diTPA-DPPDC shows a PLQY of 38.2%, while diTPA-DPPDQ achieves 62.8%, consistent with its higher oscillator strength. Cyclic voltammetry reveals HOMO and LUMO energy levels of -5.19/5.25 eV and -3.13/-3.00 eV for diTPA-DPPDC and diTPA-DPPDQ, respectively, aligning with theoretical predictions (Fig. 6). Both materials exhibit high thermal stability, making them suitable for OLED device fabrication through vacuum evaporation.ConclusionsBased on the DPPZ receptor, two novel receptor systems with enhanced electron-withdrawing abilities are developed by incorporating two different functional groups: cyano and cyanobenzene. Using TPA as a donor, two TADF materials, diTPA-DPPDC and diTPA-DPPDQ, are designed and synthesized. Key findings are as follows: 1) Both molecules feature twisted molecular structures due to the introduction of sterically hindered donor TPA, which effectively suppresses the inherent ACQ often observed in red-light-emitting molecules. Their HOMO and LUMO orbitals are primarily localized on their respective donor and acceptor units, ensuring a small ΔEST of 0.07 eV for diTPA-DPPDC and 0.11 eV for diTPA-DPPDQ; 2) A slight orbital overlap at the donor-acceptor junction in both molecules contributes to increased PLQY by achieving a balance between small ΔEST and large oscillator strength; 3) The cyanide group in diTPA-DPPDC not only enhances the receptor’s electron-withdrawing capability but also extends the molecular conjugation, leading to a significant red-shift in the fluorescence emission peak. It emits deep red light at 686 nm, though its molecular PLQY remains moderate at 38.2%. In contrast, the cyanobenzene group in diTPA-DPPDQ disrupts the conjugation to a lesser extent, resulting in red-light emission at 605 nm, but the increased oscillator strength improves its PLQY to 62.8%, demonstrating superior luminescence performance. Both materials exhibit characteristic delayed fluorescence behavior. We diversify the range of receptor designs in the relatively underexplored field of red-light TADF materials, achieving significant redshifts in emission wavelength. These findings provide valuable insights for the development of long-wavelength red-light TADF materials.
Jan. 16, 2025Vol. 45 Issue 1 0116001 (2025)
Chengdong Yang, Xinwei Li, Linlin Su, Jiaying Tong, and Tianyi Liu
ObjectiveCompute-in-sensor neuromorphic devices allow in situ weight iteration and computation within hardware, significantly reducing power consumption and latency caused by data transmission. These devices are essential building blocks for developing adaptive perception and interaction systems in the next generation of robotics. Pain, as the first line of defense against potential harm, serves as an alarm triggered by external noxious stimuli, initiating nociceptive responses to prevent further damage. However, there remain considerable challenges in stimulating nociceptor-mediated synaptic behavior. For instance, current nociceptor devices primarily simulate pain generation but cannot accurately classify pain levels, which hampers the development of adaptive pain alarm systems. Through the rational design of device structures, we have developed a multilevel nociceptor with several advantages, including ease of fabrication, reconfigurability, and clear threshold behavior. The device utilizes two tunneling-mode jumps in a 100 nm Si3N4 layer to modulate two synaptic mode transitions, akin to a two-level pain alarm system. These threshold-managed transitions are triggered by high-intensity and repetitive stimuli. In this paper, we characterize subthreshold normal synaptic perception behaviors and suprathreshold two-level nociceptor-mediated synaptic operations in response to varying stimulus intensities and continuous stimulation.MethodsOur device is based on a back-to-back Schottky junction synaptic structure with an inserted 100 nm Si3N4 tunneling layer. The preparation process involves the deposition of a C8-BTBT film on a Si3N4/SiO2/Si substrate, followed by the transfer of two Au electrodes (each 50 μm×40 μm onto its surface. The “stamping” method is used to position the Au stripes, with channel widths and lengths of approximately 40 and 20 μm, respectively. Both Au electrodes must attach to the same crystal domain to avoid defects from step lines. The device operates through the management of three distinct tunneling modes, which control the synaptic behaviors representing normal and two-level nociceptor-mediated synaptic responses. By adjusting the stimulation patterns, we enable adaptive, threshold-managed mode transitions.Results and DiscussionsThe multilevel nociceptor demonstrates distinct threshold-managed features, with subthreshold normal and suprathreshold two-level nociceptor-mediated synaptic behaviors. At lower stimulus intensities (6.2 μW/cm2), the device exhibits subthreshold synaptic behaviors, such as excitatory post-synaptic currents (EPSC) and paired-pulse facilitation (PPF). Key short-term plasticity behaviors, including interval-dependent PPF, are successfully mimicked, with characteristic times of 41 and 571 ms. As the stimulus intensity increases between 35 and 173 μW/cm2, the device enters the level-I pain mode. At higher intensities, ranging from 285 to 577 μW/cm2, the device transitions to the level-II pain mode. In addition, the device demonstrates reconfigurability and stability, which we attribute to the tunneling properties of the 100 nm Si3N4 layer. We build a capacitor based on this tunneling layer and study its properties by measuring conduction current under a scanning field. The results show three distinct tunneling modes at low fields, with two mode jumps, consistent with the observed two-level pain modes. Moreover, the device exhibits low energy consumption of approximately 22.5 fJ/μm2 per single spike.ConclusionsWe propose an optical nociceptor capable of stimulating a two-level pain perception mechanism. First, the Schottky barrier is modulated by light, enabling efficient resistance switching. Second, the Si3N4 tunneling layer controls electron trapping events at the SiO2 interface, where memristive modes are modulated by tunneling behaviors. Experimentally, our nociceptor has been shown to replicate a range of normal synaptic functions under low-intensity stimulation, including EPSC, PPF, interval-dependent dynamic PPF, and simulated synaptic consolidation. More importantly, under increased stimulus intensity and duration, the device demonstrates clear two-level adaptive mode jumps, closely resembling a two-level pain alarm. This mode jumping is reversible, providing a physical foundation for a reconfigurable two-level pain alarm system. The tunneling modulation approach used in this device offers a promising and efficient method for constructing adaptive multilevel pain alarm systems.
Jan. 17, 2025Vol. 45 Issue 1 0117001 (2025)
Biaopei Cao, Huaxin He, Chenhui Wang, Yuanyuan Chen, and Yongping Zhang
ObjectiveThe new phenomena arising from Anderson localization in nonlinear optical systems attract significant research interest. Previous experiments have achieved the localization of light waves within disordered media, and extensive theoretical studies show the presence of optical solitons in nonlinear Schr?dinger equations show disordered potentials. However, the presence, stability, and dynamics of certain disordered solitons in cubic-quintic nonlinear dielectric waveguides with disordered potentials remain unexplored. Additionally, the phenomenon and mechanism of competitive cubic-quintic nonlinearity interactions in disordered waveguide arrays are not fully understood. This study provides a new approach for exploring the physical properties of disordered solitons in high-order nonlinear media.MethodsWe primarily use the Newton iteration method to solve the nonlinear Schr?dinger equation and obtain soliton solutions. Once the steady-state solutions are determined, verifying their stability is crucial. We employ two methods to assess soliton stability: direct dynamic simulations and linear stability analysis. In linear stability analysis, perturbations are introduced to the steady-state solution, and eigenvalues are calculated by diagonalizing the Hamiltonian matrix. If any eigenvalue has a positive real part, the perturbation grows exponentially, indicating instability. Conversely, if all eigenvalues have non-positive real parts, the solution is considered stable. Soliton propagation is simulated using the stepwise Fourier method, which separates the Hamiltonian into linear and nonlinear components, each treated with different approaches. Finally, we compare transmission simulation results with those from the linear stability analysis.Results and DiscussionsWe first investigate the system’s band structure and the Anderson modes in the band under linear conditions, as illustrated in Fig. 1. Anderson modes can randomly appear at any lattice position, and as the eigenvalue b increases, these modes become less localized. Under nonlinear conditions, we examine disordered solitons originating from Anderson modes and their P-b curves in a semi-infinite energy gap, as shown in Fig. 2. Figs. 2(a) and 2(c) depict the P-b curves corresponding to the first and fourth Anderson modes. Subgraphs in Fig. 2(c) demonstrate that resonant interactions between Anderson modes and disordered solitons cause deviations in the power curve. We then analyze disordered solitons originating from localized modes and their power curves in Fig. 3 and Fig. 5. Under cubic-quintic nonlinearity, the soliton family forms different branches as the power P increases, and the profile of the disordered solitons does not always widen with increasing power. Fig. 4 and Fig. 6 further examine the stability and dynamics of these soliton families through linear stability analysis and numerical transmission simulations, identifying the intervals where stable and unstable disordered solitons exist. Finally, Fig. 8(a) presents the disordered soliton family originating from the Anderson mode in the first bandgap, while Fig. 8(b) shows soliton profile variations with increasing power P.ConclusionsWe begin with Anderson modes and numerically investigate disordered solitons and multistability effects in cubic-quintic nonlinear media. Based on the band structure of disordered waveguide arrays, we find that localized Anderson modes bifurcate into soliton families that can be excited without a threshold and resonate with other Anderson modes when spatially overlapping, leading to soliton envelope broadening. In the semi-infinite gap, we analyze a high-order soliton family originating from localized modes, verifying its stability through linear stability analysis and numerical transmission simulations. Finally, we explore disordered solitons in the first bandgap under self-defocusing conditions, finding that as the beam power P increases, solitons are more likely to occur in both the first band and the first gap.
Jan. 22, 2025Vol. 45 Issue 1 0119001 (2025)
Haodong Shi, Ruihan Fan, Jiayu Wang, Qi Wang, Sheng Jiang, Yufang Wu, Yingchao Li, and Qiang Fu
ObjectiveSnapshot hyperspectral polarization imaging technology combines spectral imaging and polarization imaging, allowing for the simultaneous acquisition of hyperspectral, polarization, and spatial information. This forms a four-dimensional data cube of the target, expanding the dimensions of target information perception. The system finds wide applications in marine environment monitoring, earth remote sensing, forest resource exploration, military reconnaissance, and search and rescue operations. However, current hyperspectral polarization imaging systems, developed by various research institutions, typically use a fixed-focus system, which struggles to integrate high polarization imaging resolution with high spectral resolution. Improving spectral resolution often limits polarization imaging resolution, resulting in unclear target imaging. In this paper, we propose an integrated imaging solution based on spatial dimension coding. The design maintains constant spectral resolution while improving polarization imaging resolution when switching between short and long focal lengths. The system enables wide-field scanning in the short-focus state and high-resolution imaging in the long-focus state, broadening the application scope of hyperspectral polarization imaging technology.MethodsFirst, the initial structural parameters of the front zoom objective are determined by establishing a focal distribution model for the reverse telephoto zoom objective. An ultra-long rear intercept zoom objective with a reverse telephoto coefficient of 2.5 is designed to address the issue of optical path occlusion. Next, the coupling relationship between stop position and uniformity of image surface illuminance is analyzed, and the optimal stop position is determined to improve the accuracy of polarization information acquisition at the edges of the system’s field of view. In addition, a digital micromirror device (DMD), relay mirror, imaging mirror, micro polarizer array (MPA), and spectral resolution are proposed to improve both the system’s spectral resolution and pixel matching accuracy. Based on this analysis, a snapshot hyperspectral polarization two-speed zoom imaging optical system is designed, and its imaging quality is evaluated. Finally, a verification experiment is conducted to demonstrate the feasibility of the proposed scheme.Results and DiscussionsAfter completing the overall optical design, at a Nyquist frequency of 144 lp/mm, the modulation transfer function (MTF) of the system across the full focal range, field of view, and wavelength band, along both the meridional and sagittal planes, exceeds 0.205 (Fig. 7), indicating excellent imaging quality. When switching between short and long focal lengths, the spectral resolution remains stable (Fig. 8). Moreover, in the 400?650 nm band, the spectral resolution is better than 1.06 nm, providing high spectral fidelity. The degree of linear polarization (DOLP) error test reveals that the DOLP error is less than 4.8%, confirming strong polarization retention (Table 5). The resolution plate imaging experiment (Fig. 11) demonstrates improved polarization imaging resolution after switching focal lengths, with the short-focus state achieving 4.36 mrad and the long-focus state achieving 1.39 mrad. Spectral reconstruction accuracy was further verified through imaging experiments with color pens (Fig. 12). The system’s measured reflectance was compared with that of a commercial spectrometer, showing that the reflectance characteristic peaks closely matched, confirming high spectral reconstruction accuracy and the system’s strong spectral resolution. Finally, field tests were conducted, where the system successfully imaged a moving car. From the DOLP images, we can clearly distinguish the front and rear of the vehicles (Fig. 13), verifying the system’s ability to capture spectral polarization information and effectively image dynamic targets under natural lighting conditions.ConclusionsIn this paper, we propose an integrated spectral polarization imaging scheme based on spatial dimension coding. Utilizing a two-speed zoom mechanism, the system achieves a triple zoom effect while maintaining strong imaging performance. When switching from the short-focus to the long-focus state, the spectral resolution remains unchanged, while the polarization imaging resolution is improved. Within the working spectrum of 400?650 nm, the spectral resolution exceeds 1.06 nm. The feasibility of the proposed scheme is validated through the setup of an experimental verification system and field experiments. The designed snapshot hyperspectral polarization two-speed zoom imaging optical system balances both high polarization imaging resolution and high spectral resolution. It is capable of adapting to fast-moving targets, quickly detecting, locking onto, and tracking them in real time. This enables the acquisition of a data cube encompassing the target’s spatial, spectral, and polarization information, supporting target detection and recognition. The system has significant theoretical and practical implications for the future development and modeling of airborne snapshot spectral polarization imaging system.
Jan. 21, 2025Vol. 45 Issue 1 0122001 (2025)
Huazhong Xiang, Hui Cheng, Qihui Ding, Zexi Zheng, Jiabi Chen, Cheng Wang, Dawei Zhang, and Songlin Zhuang
ObjectiveThe design of freeform progressive addition lenses is to provide wearers with a seamless transition between distance and near vision. As human lifespan increases and digital lifestyles become more prevalent, progressive lenses have become an essential visual aid. Although research on progressive lenses in China has advanced and design techniques have become more sophisticated, existing design methods still have certain limitations. For example, the computation of sagittal height is resource-intensive, with high time costs and limited precision. These limitations can cause the addition power to fail to meet expected standards, reduce the effective visual area, and make wearers feel uncomfortable when switching between distance and near vision. This, in turn, increases the visual adaptation time and may prevent the initial lens design from fully achieving its intended purpose. The goal of our study is to explore a more efficient and precise solution by proposing a method based on physics-informed neural network (PINN) for solving nonlinear partial differential equations and applying it to optimize the design of progressive addition lenses. Traditional numerical methods for solving nonlinear partial differential equations often face challenges such as high computational complexity and slow convergence rates. This innovative computational model optimizes the sagittal height distribution by minimizing the error between the neural network output and the governing equations, breaks the limitations of dimensionality, avoids truncation errors and numerical integration errors of variational forms, and overcomes the constraints of traditional design methods. This enables precise simulation of the sagittal height of progressive addition lenses, thereby improving lens optical performance and enhancing user visual experience.MethodsWe describe the theoretical foundation of the partial differential equations (PDEs) guiding the design of progressive addition lenses and propose a method for solving the PDEs of progressive addition lenses using a PINN. This method combines a neural network with the physical optical model of the lenses. First, we build a fully convolutional network model. We apply automatic differentiation to the sagittal height matrix output by the network in different directions to construct a loss function that quantifies the residuals of the nonlinear PDEs for progressive addition lenses. Additionally, we impose constraints by calculating the residuals after applying boundary conditions. Finally, during the iterative process, we minimize the loss functions under multiple constraints to update the neural network parameters (weights and biases). When the network converges, this method outputs an optimized sagittal height distribution, enabling precise simulation of the sagittal height of progressive addition lenses. Compared to traditional data-driven deep learning methods, this approach reduces the reliance on large amounts of training data and provides a better understanding of the physical processes, enhancing the interpretability of the neural network. In contrast to conventional numerical methods for solving PDEs, this method improves the optical performance of the lenses. Under the same lens design parameters, we design three lenses with different diopters using both numerical methods and the PINN approach, resulting in six sets of lens surface profiles. Then we manufacture and test them. We analyze the effect of this optimization method on the optical performance of progressive multifocal lenses, including optical power and astigmatism.Results and DiscussionsIn our study, we design six sets of progressive addition lenses with different diopters using both numerical methods and the PINN approach. We develop a simulation program based on the differential geometry evaluation formulas for progressive multifocal lenses and, in combination with FFV simulation software, calculate the simulated optical power and astigmatism distribution data for the six sets of lenses. These results are used to evaluate the simulation outcomes and the optical performance of the lenses. Subsequently, we manufacture the designed lenses into physical lenses. We conduct detailed measurements of the actual lenses using a surface profilometer to obtain the actual optical power and astigmatism distribution data. Based on this, we use CAD software to measure and mark the angles and corridor widths of the distance and near vision zones of the lenses, aiming to assess the practical optimization effectiveness of the proposed algorithm and analyze the actual optical performance of the lenses. The difference between the sagittal height distributions predicted by the PINN and those obtained using the explicit finite difference method is approximately 1 μm. This result not only validates the predictive accuracy of the PINN model but also demonstrates the strong approximation capability and excellent learning ability of the proposed PINN model (Fig. 4). By comparing the six sets of lenses designed using both numerical methods and the PINN approach, it is evident that lenses 4 to 6 exhibit varying degrees of optimization compared to lenses 1 to 3. The optical power error in the distance vision area of lenses 4 to 6, relative to the preset theoretical values, is controlled within 0.05 D, with a significant reduction in astigmatism in the distance vision area. Additionally, the addition power (ADD) value more closely aligns with the preset theoretical value of 2.00 D (Tables 3?5). While optimizing optical performance, the effective visual area of both the distance and near vision zones remains largely consistent, with lens 5 outperforming lens 3 (Figs. 5?7). The manufacturing results closely match the simulation results, indicating that the PINN method effectively enhances the optical performance of progressive multifocal freeform lenses (Table 6).ConclusionsCompared to traditional data-driven deep learning methods, the proposed approach reduces reliance on large amounts of training data and provides a better understanding of physical processes, enhancing the interpretability of the neural network. In contrast to traditional numerical methods for solving partial differential equations, it improves the optical performance of the lenses. In this study, we design six sets of progressive addition lenses with different diopters using both numerical methods and the PINN approach. Comparative analysis shows that the PINN-based method for solving partial differential equations effectively optimizes the design of progressive addition lenses and improves their optical performance to some extent.
Jan. 17, 2025Vol. 45 Issue 1 0122002 (2025)
Yong Mei, Haozhi Wang, and Shenyun Wang
ObjectiveOne-dimensional photonic crystals (1DPCs) are periodic arrays of dielectric materials that prevent electromagnetic (EM) waves with frequencies within the photonic bandgap (PBG) from propagating. With careful design, certain 1DPCs can exhibit an omnidirectional bandgap that blocks EM waves from all incident angles, for both transverse electric (TE) and transverse magnetic (TM) polarized waves. These types of 1DPCs are known as omnidirectional reflectors (ORs). To increase the bandgap width of OR, a cascaded 1DPC structure can be used. However, such structures become bulky when many 1DPC layers are combined. In this paper, we propose an optical transformed cascaded 1DPC structure that achieves a wide omnidirectional bandgap while minimizing the overall thickness.MethodsFirst, three single-layer ORs based on individual 1DPC structures, illuminated by TM wave, are simulated, and their omnidirectional reflection bands are calculated using the transfer matrix method. The results show reflection bands of 433?453, 466?488, and 499?524 nm, respectively. Next, these three 1DPC structures are cascaded to form a wider-band OR. Finally, the thickness of the cascaded structure is reduced using transformation optics principles. The permittivity and permeability of the compressed structure are recalculated, and the magnetic permeability is adjusted to be non-magnetic for ease of fabrication. The omnidirectional reflectance of the transformed cascaded structure is computed using the full-wave simulator HFSS.Results and DiscussionsThe omnidirectional reflection bandwidth of the cascaded 1DPC structure ranges from 446 to 494 nm, with a total bandwidth of 48 nm. The reflection bandwidths at different incident angles for the TM wave are calculated using the transfer matrix method, as shown in Fig. 3. The original cascaded 1DPC structure is then compressed to different sizes using transformation coefficients of 0.8, 0.5, and 0.1. The dielectric materials required for this transformation are calculated based on the principle of transformation optics. Subsequently, the dielectric materials are adjusted to be non-magnetic for easier fabrication in the optical regime. Using HFSS, the omnidirectional bandgaps are calculated for the optical transformed cascaded 1DPC structure with the ideal permittivity and permeability derived from transformation optics. The omnidirectional reflection bandwidths for transformation coefficients of 0.8, 0.5, and 0.1 are found to remain within the 446?494 nm range, as shown in Figs. 5(b)?(d). It is observed that the omnidirectional reflection bandwidths remain unchanged compared to the original cascaded 1DPC structure. Furthermore, for the optical transformed cascaded 1DPC structure with non-magnetic dielectric materials, the omnidirectional reflection bandwidth is also consistent with that of the original cascaded structure, ranging from 446 to 494 nm, as shown in Figs. 5(b)?(d). Deviations outside the reflection bandwidth are attributed to the approximation of refractive indices in non-magnetic materials, which do not affect practical applications.ConclusionsThis proposed dielectric omnidirectional reflector, based on an optical transformed cascaded 1DPC structure, features a wide omnidirectional reflection band while maintaining minimal thickness. The thickness and dielectric properties are determined by the transformation coefficient used in the spatial transformation. In addition, the structure can be made non-magnetic for simpler fabrication, without compromising its omnidirectional reflection properties. This reflector has promising applications in integrated optical circuits where broad omnidirectional reflection bandgaps are essential.
Jan. 16, 2025Vol. 45 Issue 1 0123001 (2025)
Shiqi Li, Hui Li, Chuan Qiao, Ting Zhu, and Yuntao Wu
ObjectiveLiquid crystal microlens arrays (LC-MLAs) are widely used in spectral reconstruction, optical field imaging, and 3D reconstruction. However, current LC-MLA optimization approaches predominantly focus on improving the structural design and material properties to enhance optical performance. These methods typically follow a sequential paradigm when selecting the structural parameters of LC-MLAs, making it difficult to reach optimal solutions due to the discrepancies between designed and actual values. In addition, the lengthy iterative process and inefficiencies often result in low transmittance and insufficient beam-focusing abilities, compromising the quality of spectral reconstruction. To address these limitations, we propose a deep learning-based liquid crystal device inverse design network (LCDE-IDN) to optimize LC-MLA for hyperspectral reconstruction systems. Experimental results indicate that the LCDE-IDN method significantly enhances the transmittance and beam-focusing ability of LC-MLAs, thus improving the accuracy of spectral reconstruction. This provides an efficient and effective way to select optimal parameters for LC-MLA design.MethodsIn this paper, we propose the LCDE-IDN method, which integrates deep learning techniques with the physical characteristics of LC-MLAs to optimize structural parameters for hyperspectral reconstruction. The LCDE-IDN framework leverages a fully connected neural network and incorporates a pairwise learning strategy that combines a forward design network with an inverse design network. This approach enables a more effective capture of global features and nonlinear relationships between device structural parameters and the resulting spectral curves. Unlike traditional methods, the inverse design network does not directly learn from the original dataset; instead, it derives its network parameters from the pre-trained forward design network. This reduces the risk of overfitting and enhances accuracy, while also avoiding issues related to the non-uniqueness of spectral curve mappings to device parameters. Ultimately, the LCDE-IDN method delivers more precise structural parameters for LC-MLA and higher-quality spectral reconstruction compared to empirical methods.Results and DiscussionsTo evaluate the performance of the LCDE-IDN method, we benchmark it against a conventional LC-MLA optimized design using the same materials, such as circular-hole electrodes, nematic-phase liquid crystal molecules, and polyimide alignment layers. Experimental results show that, compared to the LC-MLA designed by empirical methods, the LCDE-IDN-designed LC-MLA exhibits a reduction in light intensity uniformity error to approximately 4.5%, while average transmittance improves by 3.1%. These findings demonstrate that the LC-MLA optimized through LCDE-IDN possesses higher transmittance and enhanced beam-focusing abilities, outperforming empirically designed LC-MLAs in terms of optical field imaging performance (Fig. 5). In hyperspectral reconstruction, the LCDE-IDN-optimized LC-MLA improves the peak signal-to-noise ratio (PSNR) of reconstructed spectral images by an average of 5.7% (Fig. 6). We also analyze the effect of LC-MLA fabrication errors on spectral reconstruction results (Table 1). The results indicate that the structural parameters designed by the LCDE-IDN method provide a buffer against fabrication inaccuracies, enabling a quantitatively optimized LC-MLA design.ConclusionsWe propose a deep learning-based optimization method for LC-MLA design in hyperspectral reconstruction systems. Through optoelectronic performance testing, hyperspectral reconstruction experiments, and discussions on fabrication errors, it is shown that the LCDE-IDN method can accurately achieve optimal LC-MLA structural designs. The optimized LC-MLA demonstrates superior spectral image reconstruction compared to empirical methods. As a result, the LCDE-IDN method overcomes the limitations of traditional LC-MLA design approaches, significantly improving both the optoelectronic performance and spectral reconstruction capabilities of LC-MLAs. This advanced LC-MLA technology shows promising applications in agriculture, medicine, and chemical industry.
Jan. 22, 2025Vol. 45 Issue 1 0123002 (2025)
An Lu, Xue Chen, Bin Yin, and Xinlin Xia
ObjectiveThe formation of liquid films on solid wall surfaces is a common phenomenon in engineering applications, directly affecting spectral radiation characteristics. When liquid adheres to a surface, a film or a cluster of droplets forms due to factors like surface tension and gravity, resulting in complex morphologies that are not accurately represented by simplified shapes such as circular arcs. The presence of these films significantly influences infrared target detection, optical windows, stealth coatings, solar photovoltaic panels, and porous structures used in solar interface evaporation by altering spectral radiation transmission and properties, thus affecting infrared signal transmission and energy conversion processes. Current studies focus primarily on the effects of liquid droplets, with analyses often limited to factors like droplet size, distribution, and surface properties. These studies typically employ large-scale parameters and geometric optics approximations. However, for thin liquid films at micro- and nanoscale thicknesses, there is limited in-depth research on their spectral radiation transmission and properties. In this paper, we aim to establish accurate models of surfaces covered with liquid films and investigate the spectral reflection characteristics of such surfaces at micro- and nanoscale levels.MethodsWe employ a theoretical liquid film profile derived from the Young-Laplace equation to construct microgroove structures with liquid films of varying thicknesses. The finite-difference time-domain (FDTD) method is used to simulate radiation transmission and assess the effects of liquid film thickness, groove width, angle of incidence, and wetting angle on the spectral reflection properties. The analysis covers the reflectance and electric field distribution across different wavelengths, providing insights into the spectral reflection patterns of surfaces with liquid films.Results and DiscussionsSimulations indicate that theoretical profiles of liquid films differ significantly from circular approximations, with reflectance differences reaching up to 7% in certain wavelength ranges. Compared to surfaces without liquid films, the presence of a liquid film on groove walls notably reduces the overall reflectance, with prominent local absorption peaks. At a wavelength of 3 μm, the reflectance difference reaches a maximum of 0.85 (Fig. 6). The influences of liquid film thickness, groove width, and wetting angle are especially pronounced for wavelengths greater than 4 μm, where reflectance curves exhibit multiple peaks and valleys. As the liquid film thickness, groove width, or wetting angle increases, these peaks shift toward longer wavelengths (Fig. 9). For instance, when the liquid film thickness increases from 1.5 μm to 2.0 μm (with a wetting angle of 60°), the average reflectance decreases from 0.895 to 0.815, representing an 8.94% decrease. In addition, reflectance generally decreases as the wetting angle increases, with no significant change observed beyond a wetting angle of 90° (Fig. 15). Increasing the angle of incidence further amplifies the variations in reflectance across different wavelengths (Fig. 11). Electromagnetic field intensity distributions at a wavelength of 3 μm demonstrate a distinct boundary at the liquid film curve, with lower intensity within the film and a notable enhancement near the sharp edges of the metal groove walls, suggesting potential plasmon resonance effects. Under inclined incidence, the electromagnetic field distribution becomes asymmetrical, though similar patterns are observed (Fig. 8 and Fig.13). The directional reflectance distribution indicates that, under normal incidence, reflected energy is mainly concentrated within a range of -40° to 40°. The width of this region and the peak reflectance within it are influenced by factors such as groove width. For example, at a wavelength of 2 μm, increasing the groove width by 2 μm results in a 0.002 increase in peak reflectance. Under inclined incidence, this central region shifts (Fig. 7 and Fig. 12).ConclusionsUsing the Young-Laplace equation to determine liquid film morphology, we establish a spectral radiation transmission model for copper microgrooves containing water films. The FDTD method is applied to simulate the effects of various parameters such as liquid film thickness, groove width, angle of incidence, and wetting angle on the spectral reflection properties of microgrooves covered with liquid films. The results show that liquid films significantly reduce the reflectance of microgroove structures, with a major absorption peak observed at a wavelength of 3 μm. For accurate spectral reflection analysis, the shape of the liquid film should not be simplified to an ideal circular arc. Compared to groove width and angle of incidence, liquid film thickness and wetting angle cause more pronounced variations in spectral reflectance. Reflectance generally decreases as the wetting angle increases. Under normal incidence, reflected energy consistently concentrates within the -40° to 40° range.
Jan. 16, 2025Vol. 45 Issue 1 0124001 (2025)
Lingying Chen, Yingjue Cao, Xiangjun Li, Le Zhang, Jining Li, and Dexian Yan
ObjectiveWe design a switchable terahertz metamaterial device based on an array of cross-shaped unit cell structures. By introducing vanadium dioxide (VO2), we achieve cross-polarization conversion, linear-to-circular polarization conversion, and broadband absorption across different terahertz frequency bands, demonstrating multifunctionality.MethodsWe conduct electromagnetic simulations using CST MICROWAVE STUDIO software to analyze the device’s performance. The VO2-based metamaterial consists of six layers: a VO2 cross-shaped patch array, a polyimide (PI, εPI=3.5) layer, an elliptical metal strip, a VO2 thin film, another PI layer, and a bottom metal layer. Geometrical dimensions are optimized through numerical calculations, resulting in a unit structure period P=70 μm, surface cross patch dimensions a=15 μm, b=4 μm, and dielectric layer thickness h=13 μm. The major and minor axes of the elliptical metal patch are m=44.8 μm and n=12 μm. The VO2 thin film, elliptical metal strip, and bottom metal (σAu=4.56×10⁷ S/m) have a thickness of t=0.1 μm. The phase transition of VO2 between its insulating and metallic states is triggered by external stimuli, such as temperature, electromagnetic fields, and optical fields. We assume conductivities of 2×10⁵ S/m and 20 S/m to represent the metallic and insulating states of VO2, respectively. By changing the conductivity, the device can switch between absorption and polarization conversion functionalities.Results and DiscussionsWe design a multifunctional terahertz metamaterial structure based on the phase transition characteristics of VO2, which achieves broadband absorption, cross-polarization conversion, and linear-to-circular polarization conversion simultaneously. The structure has the following features: First, it adopts a symmetric design, making the metasurface absorber polarization-insensitive. Second, in terms of performance, when VO2 is in its insulating state, the structure enables linear-to-circular polarization conversion and linear-to-linear cross-polarization conversion across multiple frequency bands. Specifically, linear-to-circular polarization conversion can be achieved at 0.68, 0.810?1.175, 2.225, 2.425?2.520, 3.13, 3.31, 3.570?3.670, 4.04, 4.152?4.395, and 4.495?4.625 THz frequency ranges or points. Cross-polarization conversion occurs within the 1.365?2.150, 2.579?3.065, and 3.770?3.981 THz frequency bands, with polarization conversion rates exceeding 90%. When VO2 is in the metallic state, the absorption rate exceeds 90% within the 1.610?4.010 THz frequency range, demonstrating wide bandwidth and high efficiency. This is particularly important for applications requiring multi-wavelength signal processing, as high-efficiency terahertz wave absorption reduces loss and enhances overall system performance.ConclusionsThis study presents the design of a switchable terahertz metamaterial device based on a cross-shaped unit structure array. By incorporating VO2, the device achieves multifunctionality, including cross-polarization conversion, linear-to-circular polarization conversion, and broadband absorption across different terahertz frequency bands. When VO2 is in its insulating state, the structure enables linear-to-circular polarization conversion and cross-polarization conversion over multiple frequency bands. As VO2 transitions from the insulating to the metallic state, the absorption rate exceeds 90% within the 1.610?4.010 THz range, offering broad bandwidth and high efficiency. Additionally, we study the influence of the incident angle and polarization angle of terahertz waves on the device’s polarization conversion and absorption characteristics, demonstrating its polarization-insensitive and wide-angle absorption capabilities. The results indicate that the proposed device’s unique multilayer stacked structure not only provides excellent absorption performance but also enables rapid switching between various polarization states, highlighting its great potential for terahertz imaging, communication, and security screening applications.
Jan. 16, 2025Vol. 45 Issue 1 0124002 (2025)
Xingshe Wang, Haichuan Shen, Guanjia Zhao, Jianfei Wang, Jianguo Yin, and Suxia Ma
ObjectiveAt the microscale, the increased surface area-to-volume ratio greatly enhances the effect of surface forces, making them essential for fluid control. In mixed systems, the composition of the interfacial layer often differs substantially from that of the bulk phase. While this difference has minimal influence on surface tension measurement at the macroscopic scale, where the interfacial layer’s thickness is comparable to the amplitude of surface waves, it becomes critical at the microscopic scale. Surface tension, a macroscopic thermophysical property, depends not only on the free energy at the interface but also on the adsorption of solute molecules in the adjacent interfacial layer. Thus, microscale variations play a crucial role in surface adsorption, necessitating the study of methods to measure liquid surface tension in microchannels under in situ conditions.MethodsIn this paper, we propose a novel experimental system designed for light scattering on reflective surfaces, with adjustable micrometer-scale channel widths. In addition, a microscale liquid level control platform is developed, incorporating three-dimensional motion and a rotary stage that rotates along the z-axis to control dimensions in the x, y, z, and φ directions. Precise movement in the x-direction is achieved using a one-dimensional digital displacement stage, which offers a stroke of 25.4 mm and a step accuracy of 1 μm. This system enables the creation of microchannels ranging from 10 to 100 μm in width, with the capability to continuously vary channel dimensions by several micrometers. The power spectrum equation for surface waves in microscale channels is derived based on strict boundary conditions. Surface tension is determined by applying this equation to the channel data, following time-domain data processing techniques such as zero-channel-point acquisition, data folding, and discrete fast Fourier transform.Results and DiscussionsThe power spectra of surface waves confined within microchannels of different widths at 298.15 K and atmospheric pressure are obtained using isooctane. As the channel width increases, the power spectrum shifts to lower frequencies, while the peak value gradually rises. According to Eq. (6), as the channel width increases, the extracted wavelength also increases, leading to a decrease in scattering angle and intensity, thus raising the power spectrum’s peak (Fig. 5). Minor deviations between measurements of the three standard substances and the reference data, as well as slight variations in repeated single-point measurements, demonstrate that the new system offers enhanced precision, consistency, and reliability across a wide range of channel widths or wave numbers. Furthermore, the first-order approximate solutions for iso-octane, n-decane, and hexadecane increasingly deviate due to the neglect of body-phase dissipation near the critical oscillatory region. The primary approximation applies only to extremely large Y values (e.g., Y>100), indicating extremely low viscosities (Fig. 6). In most practical cases, fluids do not meet this condition, resulting in significant systematic deviations when determining surface tension using this approach.ConclusionsWe propose an experimental system for measuring light scattering on microscale reflective surfaces and assess its accuracy and reliability using iso-octane, n-decane, and n-hexadecane under ambient temperature and pressure. The key findings are as follows. First, the surface wave power spectrum equation for microscale channels is derived by considering the surface wave dispersion equation and boundary conditions. Second, by integrating a precisely adjustable microchannel (30 to 90 μm) with a reflective light scattering system, we successfully measure fluid surface tension with minimal sample volumes (about 2 μL). Third, we validate the new system and measurement method using reference materials, and the discrepancies between the experimental and theoretical surface tension values for the three alkanes are within 3%, with single-point measurements taking only a few seconds. This meets the requirements for high-precision surface tension measurement and sensing. Lastly, a comparison of the surface wave power spectrum equation and the first-order approximation equation shows that the former accurately calculates surface tension in microscale channels, while the latter introduces significant systematic deviations.
Jan. 21, 2025Vol. 45 Issue 1 0124004 (2025)
Zijie Xu, Baowu Zhang, Ling Zhu, Zhenyuan Fang, Xianhuan Luo, Yi Sun, and Bin Zhang
ObjectiveIn this paper, we investigate and validate the elliptical deformation phenomenon observed in interference rings generated by transmission Tolansky interference measurements, which significantly influences the accuracy of precision measurements. Transmission Tolansky interference is a critical technique for measuring small angles, surface parallelism, refractive indices, and other parameters in applications such as gravitational wave detection, high-power lasers, wafer lithography, and precision computer numerical control machining. However, elliptical interference rings hinder measurement precision. Thus, we elucidate the mechanisms underlying this deformation and propose strategies to mitigate it, enhancing the reliability of transmission Tolansky interference measurements.MethodsThe elliptical deformation of interference rings is analyzed using the imaging characteristics of parallel plates. We examine three primary factors influencing eccentricity: parallel plate thickness (d1), light incidence angle (I), and distance between CCD camera and point light source ( f ). Theoretical modeling establishes the relationship between these factors and eccentricity (e) using geometric optics and interference principles. MATLAB is employed to visualize this relationship, demonstrating trends in eccentricity variation with changes in the three parameters. Zemax simulations corroborate the theoretical predictions, revealing a positive correlation of eccentricity with light incidence angle and parallel plate thickness, and a negative correlation with CCD-to-point light source distance. To validate these findings, we conduct physical experiments using a 632.8 nm helium-neon laser, a rotatable parallel plate, a beamsplitter, and a CCD camera. By systematically varying the parameters, we observe morphological changes in the interference rings and quantify their eccentricity.Results and DiscussionsTheoretical analysis and MATLAB visualizations demonstrate that eccentricity increases with parallel plate thickness (d1) and light incidence angle (I) while decreasing with CCD-to-point light source distance ( f ) (Figs. 6‒8). These findings are confirmed through Zemax simulations and experimental validation, which show consistent trends. For instance, increasing the parallel plate thickness from 50 to 200 mm raises eccentricity from 0.2138 to 0.4375 (Table 8), while varying the incidence angle from 15° to 75° also increases eccentricity (Table 9). Conversely, increasing the CCD-to-point light source distance reduces eccentricity (Table 10). The comprehensive analysis reveals that elliptical deformation arises from differential refraction effects in the sagittal and meridional planes, with actionable guidance provided for mitigating this issue in practical applications.ConclusionsIn this paper, we advance precision optical measurements by providing a detailed understanding of the elliptical deformation phenomenon in transmission Tolansky interference rings. By integrating theoretical, simulated, and experimental approaches, we demonstrate that adjusting parallel plate thickness, light incidence angle, and CCD positioning can effectively control eccentricity. These findings offer practical strategies to enhance measurement accuracy across fields such as microelectronics manufacturing and fundamental physics research.
Jan. 16, 2025Vol. 45 Issue 1 0126001 (2025)
Xiaoling Li, Shuqin Zhai, and Kui Liu
ObjectiveQuantum communication, as a key technology to ensure future communication security, attracts wide attention and continues to develop rapidly. However, secure and efficient quantum communication requires quantum nonlocal correlations. Quantum steering, a unique form of quantum correlation distinct from entanglement and Bell nonlocality, enables directional information transmission. If Alice and Bob share a quantum state, Alice may steer Bob, but Bob may not steer Alice in return. This property facilitates the construction of quantum networks and the design of communication channels with specific functions. The four-wave mixing (FWM) process uses a nonlinear medium to generate spatially separated, correlated light beams through nonlinear interactions between input optical beams and atoms, providing a foundation for exploring quantum entanglement and nonclassical correlations in photons. Recent studies by Jing's team have generated multipartite entangled quantum states by cascading multiple FWM processes, producing tripartite, quadripartite, hexapartite, and twelve-partite entanglement. Additionally, combining the FWM process with a linear beam splitter generates quadripartite, octapartite, and twelve-partite entanglement. He's group achieves manipulation of tripartite quantum steering through different combinations of the FWM process, the linear beam splitter, and the nonlinear beam splitter (FWM process). Using cascaded FWM processes in symmetric and asymmetric structures, they study the monogamy relation of steering. The diversity and significance of FWM processes in quantum optics offer abundant possibilities for advancing quantum information science. Quantum secret sharing leverages the principles of quantum mechanics to distribute secret information among multiple independent individuals. This approach allows secrets to be retrieved only through cooperation, making it possible to detect eavesdroppers or dishonest participants. Quantum steering can allocate steering among players based on task requirements, providing a secure foundation for quantum secret sharing. Thus, quantum steering plays a critical role in quantum secret sharing.MethodsIn this research, we study quadripartite quantum steering based on two independent FWM processes combined with one linear beam splitter (BS 1). First, with a fixed transmissivity T1=0.5, we analyze how quadripartite quantum steering varies with the amplitude gain of the FWM. Next, we introduce an additional linear beam splitter, so that two linear beam splitters are combined with the two FWM processes. With the gain of the FWM process fixed, we then examine how quadripartite quantum steering changes with the transmissivity of the second linear beam splitter (BS 2).Results and DiscussionsIn Scheme I, the symmetry between output modes results in the absence of (1+1)-mode steering, while (1+n)-mode and (n+1)-mode steering are abundant. However, when mode C^ is transmitted through a noisy channel, the excess noise and losses imposed on it cause quantum state decoherence, leading to a reduction or even disappearance of quantum steering. This also prevents mode C^ from acting alone as either the steering or the steered party. In Scheme II, adjusting the transmissivity of BS 2 allows for flexible manipulation of pairwise steering, enabling both one-way and bidirectional asymmetry. Additionally, the configuration of joint steering is more robust, supporting richer correlations.ConclusionsAnalyzing quadripartite quantum steering generated by two FWM processes with one or two linear beam splitters reveals extensive multipartite EPR steering in both schemes. In Scheme I, (1+1)-mode steering is absent, but the bipartite (1+n)- and (n+1)-mode steering configurations are abundant, enabling three-party and four-party quantum secret sharing. In Scheme II, by adjusting the transmissivity of BS 2, the pairwise steering is not only present but also can be flexibly manipulated, allowing for both one-way and bidirectional asymmetry. This configuration also enhances the abundance of joint steering, which strengthens the ability to establish correlations and manage information across multiple users. Additionally, the number of possible user combinations for secret sharing increases, providing greater flexibility and security in quantum secret sharing. These findings have important applications and implications for building more adaptable, reliable, and secure quantum communication networks.
Jan. 20, 2025Vol. 45 Issue 1 0127001 (2025)
Hua Tang, and Jun Yue
SignificanceSpace, atmospheric, ocean, and environmental optics are pivotal domains that integrate scientific inquiry with practical applications, driving progress in fundamental science and technology. These fields address critical national and global challenges, including climate change, environmental monitoring, carbon neutrality, and national defense. By merging optics with disciplines such as information science, physics, chemistry, and earth sciences, they generate innovative tools for exploring scientific principles and solving real-world problems. These technologies play an indispensable role in fostering sustainable development, enhancing disaster prevention, and bolstering national resilience amid environmental and geopolitical challenges. The strategic importance of these fields is reflected in the National Natural Science Foundation of China’s (NSFC) prioritization of research under its F0510 funding category. This initiative has supported numerous projects advancing large-aperture optical telescopes, gas optical sensing, underwater optical detection, and more, significantly strengthening China’s capability to address national priorities, including environmental governance, advanced defense systems, and scientific innovation. The multidisciplinary nature of this research underscores its potential as a cornerstone of China’s commitment to technological independence and global leadership. The integration of cutting-edge optical systems with air-space-ground-sea frameworks has revolutionized monitoring capabilities. These systems not only enhance detection precision for environmental and atmospheric phenomena but also adapt to the increasing complexity of real-world applications. Their alignment with China’s broader goals of technological modernization and sustainability ensures its position at the forefront of scientific and technological progress.ProgressResearch funded by NSFC from 2019 to 2023 in the fields of space, atmospheric, ocean, and environmental optics has delivered transformative advancements. In space optics, significant progress has been made in large-aperture optical telescopes, enabling high-resolution imaging and three-dimensional detection. Applications include earth observation, astrophysical research, and space exploration. Innovations such as lightweight modular designs and on-orbit assembly techniques have overcome challenges with space deployment. In addition, laser communication and networking systems have demonstrated their ability to establish high-capacity, interference-resistant information networks, laying the foundation for robust space communication architectures. Atmospheric optics research has advanced understanding of light interactions with aerosols, gases, and turbulent atmospheric phenomena. Mid-infrared gas sensors and terahertz spectroscopy have enabled the precise detection of atmospheric components, vital for environmental monitoring, adaptive optics in astronomy, and national defense. Ocean optics has also seen progress with the development of underwater optical communication systems and hyperspectral imaging, which improves ecological monitoring, marine carbon cycle analysis, and underwater detection precision. In environmental optics, innovative technologies like laser radar, optical spectroscopy, and hyperspectral imaging have enhanced pollutant monitoring and environmental change detection. By integrating these technologies with artificial intelligence and big data analytics, researchers have improved efficiency and expanded application scopes.Conclusions and ProspectsSpace, atmospheric, ocean, and environmental optics are indispensable in tackling global challenges such as climate change and sustainable development. These fields advance scientific understanding while offering practical solutions for environmental protection, disaster response, and national security. Future research should prioritize three key directions. First, continuous innovation in optical technologies is essential, focusing on artificial intelligence, adaptive optics, and integrated chip-based systems to improve performance, scalability, and cost efficiency. These advancements will drive the next generation of high-precision optical instruments. Second, developing highly integrated air-space-ground-sea monitoring systems will be crucial. Such systems should provide real-time, high-resolution data to address challenges like climate change and disaster response and achieve goals like carbon neutrality. Finally, fostering cross-disciplinary collaboration with fields like advanced materials science, quantum computing, and machine learning will unlock novel applications and solutions. By pursuing these strategies, China is well-positioned to maintain its leadership in optical science and technology. Investments in these areas will not only address pressing national and global challenges but also significantly contribute to scientific advancement and sustainability. The continued evolution of these fields will ensure their central role in shaping the future of technology and human progress.
Jan. 06, 2025Vol. 45 Issue 1 0100001 (2025)
Hongxu Li, Wei Chen, Chenyang Zhang, and Tao Ren
ObjectiveMid-infrared hyperspectral emission measurements provide wide-band, highly detailed spectral information, enabling spatial distribution retrieval of multiple scalar values in combustion flames. However, inferring temperature and species concentrations from these spectra poses significant challenges due to the nonlinear, ill-posed, and potentially high-dimensional nature of the related inverse problems. The ill-posedness can result in slow convergence and high sensitivity to initial parameter guesses and experimental noise. It is often necessary to introduce appropriate prior information and apply regularization constraints to yield physically reasonable and stable retrieval results. However, in the reconstruction of multiple fields, it is challenging to accurately define prior conditions and effectively incorporate them into the model. Additionally, the choice of regularization methods and the tuning of parameters significantly influence the retrieval results. As a result, traditional methods struggle to achieve accurate and simultaneous reconstruction of temperature and multi-species concentrations in combustion fields. Artificial neural networks provide a promising solution by learning complex, implicit relationships between input and output data without explicit modeling of the underlying physical and chemical laws required. This capability makes them particularly well-suited for nonlinear inverse problems. However, while data-driven approaches have shown potential in solving various inverse problems, they often rely on extensive datasets from experiments or simulations to build a supervised training database. Consequently, neural networks are frequently treated as “black boxes”, with their predictive capability heavily dependent on the training data. While these models may generalize well within data-rich regions, they often struggle with accurate predictions for data outside the training distribution. Meanwhile, transferring a neural network trained on simulation datasets to predict experimental data faces challenges such as insufficient generalization ability and a lack of physical interpretability. To this end, it is essential to develop a robust framework that combines the strengths of artificial neural networks with the fundamental physical constraints of the problem.MethodsWe present a physics-based neural network model for inverse radiation, which is designed to retrieve temperature and multi-species mole fractions within a flame by combining mid-infrared emission spectroscopy measurements. The model integrates the physical information of the measurement system into the neural network’s training process, ensuring that the optimization objectives not only match the measurement data but also comply with the physical equations. This approach eliminates the need for training datasets or complex retrieval algorithms. Firstly, the model is adopted to retrieve the temperature, CO2, CO, and H2O mole fractions, as well as soot volume fraction distributions in a simulated ethylene laminar diffusion flame. To validate the model’s accuracy and robustness, we add 10% Gaussian random noise to the simulated emission spectra. Furthermore, to experimentally validate the retrieval model, we conduct an ethylene laminar diffusion flame combustion experiment and measure the mid-infrared emission spectra of the experimental flame by utilizing a Fourier transform infrared spectrometer (FTIR). The emission spectra are calibrated by employing a blackbody furnace. Based on the proposed physics-based neural network model, the multiple scalar field distributions of the experimental flame are reconstructed.Results and DiscussionsThe reconstruction results of the simulated flame show that by employing six radial projections, the physics-based neural network achieves sound agreement with the reference solution even with 10% random noise (Figs. 7 and 8). This demonstrates that spectral measurements provide valuable information for resolving the spatial distribution of scalar fields and the proposed model exhibits good robustness in handling noisy spectral data. The retrieval accuracy for temperature is higher than that for gases and soot, as the radiative properties of all three gases are nonlinearly related to temperature. Additionally, temperature governs blackbody radiation, amplifying its effect on the spectral signal. The model can also retrieve soot distribution with limited spatial projections. As soot and gas radiations are coupled in gas spectral regions, the distinct spectral features of gases lead to significant changes in the mixture’s radiations with the varying soot volume fraction, enabling retrieval of all components. The experimental results show that the reconstructed 2-D scalar fields of temperature [Fig. 9(a)], CO2 mole fraction [Fig. 9(b)], and soot volume fraction [Fig. 11(c)] in our study are qualitatively consistent with those reported in the literature. A quantitative comparison is conducted for the radial and axial distributions of flame temperature [Fig. 10(a)] and CO2 mole fraction [Fig. 10(b)]. Although there are deviations between the retrieval results obtained by different methods in the literature and our study, they share a consistent distribution trend. Due to the lack of experimental data, the retrieval results for CO [Fig. 11(a)] and H2O [Fig. 11(b)] mole fractions are analyzed qualitatively, showing expected trends for the target flame. Additionally, a detailed analysis of the error sources in the reconstruction results is also conducted. Generally, the results confirm the feasibility of adopting the physics-based neural network with hyperspectral measurements to simultaneously reconstruct temperature, multiple gas mole fractions, and soot volume fractions.ConclusionsWe propose a nonlinear tomography reconstruction model based on physics-informed neural networks by combining hyperspectral emission measurements to achieve the simultaneous reconstruction of multiple flame scalar fields. Validation by employing simulated flames shows that the model accurately reconstructs high-resolution scalar fields from mid-infrared spectral data with limited radial projections while maintaining robustness to noise. By adopting experimental data from an ethylene laminar diffusion flame obtained by FTIR, the model successfully retrieves flame temperature, CO2, H2O, CO mole fractions, and soot volume fraction. By integrating physical equations directly into the training process, the model eliminates the need for extensive datasets and complex retrieval algorithms. Neural networks exhibit good nonlinear fitting capabilities and the ability to handle high-dimensional data, while also possessing implicit regularization. This allows the neural network to deliver stable and physically reasonable retrieval results. Additionally, as the number of retrieval parameters and the complexity of the problem increase, the problem of difficult retrieval does not significantly intensify, highlighting this model’s potential as a powerful tool for solving complex nonlinear inverse problems.
Jan. 10, 2025Vol. 45 Issue 1 0130001 (2025)
Canxu Zhai, Ye Tian, Wangquan Ye, Yuan Lu, and Ronger Zheng
ObjectiveLaser-induced breakdown spectroscopy (LIBS) technology has enormous potential for deep-sea in-situ detection due to its real-time, non-contact advantages. However, the high density and incompressibility of water result in underwater laser-induced plasma with high particle number density and low temperature, causing lower intensity and poor stability compared to gas environments. To improve the underwater detection capabilities of LIBS, using long-duration lasers can significantly enhance the emission line intensity, as proven by many studies. This improvement also positively influences the signal-to-noise ratio (SNR) and signal-to-background ratio (SBR) of LIBS signals. In this study, we analyze the LIBS signal quality generated on a submerged aluminum target, including line intensity, SNR, SBR, and relative standard deviation (RSD), under different laser durations (6?25 ns) and energies (8?25 mJ). This provides an experimental basis for optimizing laser parameters in underwater LIBS.MethodsA Q-switched Nd∶YAG laser with a wavelength of 1064 nm is used as the ablation source. The laser operates at pulse durations of 6 ns to 25 ns by varying the laser flash-pump voltage, with a repetition rate of 0.2 Hz. The laser passes through a half-wave plate and a Glan prism to adjust the laser pulse energy from 8 mJ to 25 mJ, monitored by a photodiode connected to an oscilloscope. A dichroic mirror transmits the laser beam and reflects the plasma emission light. Then the laser beam is focused into a quartz cuvette filled with deionized water by a pair of quartz plano-convex lenses L1 (f =38.1 mm). The cuvette (80 mm×80 mm×80 mm) has a wall thickness of 2 mm. The target is mounted on an X-Y-Z stage and submerged in water, with the laser focal position set at 0.75 mm below the target surface. The diameter of the laser spot on the target surface is about 250 μm, based on the measured crater size. Pure metals of aluminum (99.9%) are used, polished, and cleaned with alcohol before experiments. A water pump refreshes the water in the cuvette to reduce the interference from metal nanoparticles sputtered during continuous laser ablations. Plasma emission is reflected by the dichroic mirror and collected backward by a plano-convex lens L2 (f =50.8 mm). The emission spectra are then recorded by a fiber spectrometer with a wavelength range from 300 nm to 800 nm and a spectral resolution of 0.3 nm. Timings between the laser and spectrometer are controlled by a digital delay generator.Results and DiscussionsThe laser focal position is set as 0.75 mm below the target surface by analyzing the LIBS under different laser energies and durations (Fig. 2). The LIBS spectra are affected by the shielding effect of the plasma in water at high irradiance, and the target is hardly ionized to generate plasma at low irradiance. SNR is analyzed by calculating the ratio between the Al I line intensity and noise filtered from the LIBS signal (385?415 nm). According to the contour maps of SNR versus laser energy and duration [Fig. 3(a)], SNR increases with laser energy when the laser duration exceeds 12 ns. However, when the laser duration is less than 9 ns, high laser energy can lead to a decrease in SNR. Using the minimum filter and adaptive iteratively reweighted penalized least squares (airPLS), we accurately estimate the baseline of the LIBS signal, enabling the correct calculation of SBR. By analyzing the contour maps of SBR versus laser energy and duration [Fig. 3(b)], we find that laser duration is the main factor affecting SBR. An increase in laser duration significantly improves the SBR due to the reduced recombination radiation. After spectral preprocessing, the RSD of 40 LIBS spectra decreases, and the stability of LIBS spectra improves [Fig. 4(a)]. However, RSD remains high when the laser duration is less than 9 ns and laser energy exceeds 18 mJ, due to the randomness of multiple independent breakdown [Fig. 4(b)]. After spectral preprocessing, the quality of the LIBS signal improves. The best LIBS spectral quality is observed at an irradiance of around 3.18×10⁹ W/cm2 and a laser pulse width greater than 14 ns. High irradiance near or above the breakdown threshold of the solution leads to multiple independent breakdowns, as evidenced by the shadowgraphs of cavitation bubbles and shock waves, which decrease the quality of the LIBS spectra (Fig. 5). Additionally, the ablation crater created by a 6 ns laser is deeper than that created by a 17 ns laser, indicating that longer duration lasers distribute more energy into plasma radiation (Fig. 6).ConclusionsIn this study, we analyze the effects of different laser durations (6?25 ns) and energies (8?25 mJ) on underwater LIBS spectra generated on submerged solid targets. The results show that both excessively high and low irradiances decrease the quality of LIBS spectra under different laser focus positions, fixed at 0.75 mm in our experiment. SNR increases by about 1.7 times with the increase of laser energy when the duration is over 12 ns. SBR mainly depends on laser duration and increases significantly with longer durations. The RSD of LIBS spectra decreases, and stability improves with longer durations. However, multiple independent breakdowns seriously degrade LIBS signal quality with durations less than 9 ns and energies over 18 mJ. Optimal LIBS signal quality is achieved at irradiance around 3.18×10⁹ W/cm2 and pulse widths larger than 14 ns. High irradiance leads to multiple independent breakdowns, decreasing LIBS spectral intensity and stability. The 6 ns laser ablation crater is deeper, indicating less laser energy converts into spectral radiation. Therefore, for underwater LIBS detection, selecting a laser with a long duration and high energy improves detection capabilities and laser energy conversion efficiency.
Jan. 15, 2025Vol. 45 Issue 1 0130002 (2025)
Xiaoyu Shang, Min Huang, Xuping Gong, Dan Wang, Xiu Li, and Yu Liu
ObjectiveColor difference is a crucial index used by the industry to evaluate the accuracy of color reproduction, especially in fields like display, textiles, and printing. However, in practical application, there are instances where the color difference measured by instruments exceeds tolerance limits but is visually acceptable, or where the measured color difference is within tolerance but is still visually unacceptable. This inconsistency may arise from the various components of total color difference, including lightness, hue, and chroma differences, which evoke varying color perceptions in the human eye. The challenge is to align the calculated color difference with the visual color difference perceived by humans, which remains a key technical issue.MethodsTo improve the accuracy of color quality evaluation for printed samples, two experimental groups are conducted simultaneously: one at the Beijing Institute of Graphic Communication (Exp. I) and another at Suining Kuanzhai Printing Company (Exp. II). In each experiment, 450 pairs of printed samples, representing the nine CIE-recommended color centers, are prepared, with CIELAB color differences ranging from 0.27 to 3.88 (mean is 1.91 in Exp. I) and from 0.21 to 3.92 (mean is 2.04 in Exp. II). Lightness difference (ΔL*), hue difference (ΔHab*), and chroma difference (ΔCab*) contribute differently to the total color difference. A total of 43 observers (17 inexperienced observers in Exp. I and 26 experienced observers in Exp. II) participate in the color difference experiments. These experiments are conducted indoors with natural light from a north window, during fixed time intervals (9:00—11:00, 14:00—16:00) on a sunny day to ensure stable viewing conditions. In total, 22950 observations are collected in each experiment. The probabilities (P) for an “unacceptable color difference” are then converted into a standard normal distribution Z-score to obtain the visual color difference (ΔV). The standardized residual sum of squares (STRESS) index, recommended by CIE, is used to assess the performances of the calculated CIELAB and CIEDE2000 color differences compared to the visual color differences.Results and DiscussionsThe wrong decision (WD) results show that experienced observers outperform the inexperienced group, exhibiting higher sensitivity to color differences. Moreover, optimization of the kL∶kC∶kH factors for lightness difference, chroma difference, and hue difference is applied to the original CIELAB and CIEDE2000 color difference formulas. In addition, a power function approach is used to minimize the STRESSvalue in both formulas. The results indicate that observers are more sensitive to hue differences, and therefore, it is essential to increase the weight of hue differences in the existing color difference formulas. To provide a practical method for enterprises to efficiently evaluate the color quality of printed samples, the consistency between the calculated results (e.g., ΔE and ΔH values), and visual color differences is examined. It is found that ΔE values optimized by kH factors in CIELAB, and ΔE values optimized by kL factors in CIEDE2000, along with ΔH thresholds, can improve consistency compared to other optimization methods.ConclusionsColor quality control and evaluation are critical in the process of reproducing printed samples. In the CIEL*a*b* color space, hue difference is more closely aligned with visual color difference than lightness and chroma differences. Based on this, we propose corresponding color difference and hue difference thresholds to improve the accuracy of product color quality evaluation for observers with different professional backgrounds. Specifically, the recommended ΔET values in CIELAB and CIEDE2000 are 1.47 and 1.20, while the recommended ΔHab,T* and ΔH00,T values are 0.65 and 0.45 for inexperienced observers. For experienced observers, the recommended ΔET values in CIELAB and CIEDE2000 are 1.02 and 0.86, and the recommended ΔHab,T* and ΔH00,T values are 0.53 and 0.34, respectively, for quality inspection processes. The methods and results presented in this study can also be extended to other fields such as lighting, display, textiles, and printing. They offer valuable guidance for color quality evaluation.
Jan. 10, 2025Vol. 45 Issue 1 0133001 (2025)
© Copyright 2018-2021 | Chinese Laser Press.
All Rights Reserved 沪ICP备15018463号-20