


Please enter the answer below before you can view the full text.


2024
Volume: 44 Issue 12
41 Article(s)

Dan Chen, Rui Wang, Feier Ai, and Linhai Tang
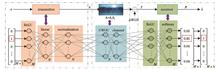
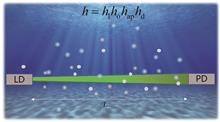
ObjectiveUnderwater wireless optical communication (UWOC) has a longer transmission distance and a higher data rate compared with underwater radio frequency communication and underwater acoustic communication. However, the absorption, scattering, and turbulence effects in the marine environment seriously affect the transmission quality of the optical signals, resulting in a limited transmission rate and an increased bit error rate (BER) of the UWOC system. Autoencoders can achieve end-to-end UWOC performance by using deep neural networks to jointly optimize the transmitter and receiver. However, as one of the most important data representation methods in autoencoders, the one-hot vector has a low data transmission rate. In order to solve these issues, in this paper, we propose an adaptive transmission scheme for underwater autoencoders based on deep neural networks on a joint channel that considers Gamma-Gamma turbulence and transmission path loss. This scheme can effectively suppress the impacts of underwater turbulence, absorption, and scattering on the performance of UWOC systems, improve the data rate of underwater autoencoders, and reduce the BER of the system.MethodsIn this paper, an adaptive transmission scheme for underwater autoencoders with mean square error (MSE) performance constraints was proposed by using the deep neural network. The UWOC channel model was established by using the path loss of the Beer-Lambert law and the probability density function of the Gamma-Gamma underwater turbulence distribution. By simulating the performance of the autoencoder’s non-adaptive one-hot vector and comparing it with that of the adaptive transmission scheme under different UWOC channel conditions, the effects of different turbulence intensities, received signal-to-noise ratios (SNRs), and training parameter ensembles on the non-adaptive and adaptive transmission performance of the underwater autoencoder were discussed, respectively.Results and DiscussionsIn this paper, an adaptive transmission scheme for underwater autoencoders is proposed to solve the problem of limited data rate caused by the one-hot vector of underwater autoencoders. The autoencoder is trained and tested under different ocean channels, as well as under different network training conditions, and the optimal transmission vectors are adaptively selected according to the set MSE performance constraints. Compared with non-adaptive transmission, the adaptive transmission scheme of the underwater autoencoder maximizes data transmission rate, reduces the BER, and improves communication performance (Fig. 5 and Fig. 7). At the same time, for different types of water bodies, instead of using a single training condition parameter, using a training parameter set for underwater autoencoders can obtain a more robust neural network model, making the autoencoder have a certain degree of generalization ability (Fig. 8).ConclusionsThe adaptive transmission scheme for underwater deep autoencoders proposed in this paper can adaptively select the optimal vector for transmission according to the MSE constraints under different UWOC channel conditions, so as to maximize the data transmission rate. Under the joint influence of Gamma-Gamma turbulence and transmission path loss, the BER and data rate of the autoencoder using non-adaptive one-hot vector and adaptive transmission schemes are simulated and analyzed, respectively. The results show that the underwater autoencoder not only simplifies the system model but also has better BER performance compared with conventional communication systems. The autoencoder has different network loss performances under different training conditions, and the autoencoder trained by utilizing training parameter sets can obtain a more robust performance than that trained by utilizing a single training parameter. In addition, under the same training conditions, the BER and data rate of the adaptive transmission scheme adopted by autoencoders are better than those of the non-adaptive scheme. The proposed adaptive transmission scheme for underwater autoencoders provides a new approach to improving the performance of the UWOC system, and its feasibility has been verified through simulation.
Jun. 25, 2024Vol. 44 Issue 12 1201001 (2024)
Ming Dong, Gaofang Yin, Nanjing Zhao, Xiang Wang, Xiaoling Zhang, Mingjun Ma, Tianhong Liang, Renqing Jia, Min Xu, Xiang Hu, and Peng Huang
ObjectiveAfter illumination, the electron transport chain of dark-adapted phytoplankton is inhibited to bring about the gradual closure of the reaction center. Light energy absorbed by the light-harvesting pigment is released solely by fluorescence or thermal dissipation to elevate fluorescence yield. This increase initiates the chlorophyll fluorescence induction process. In the early stage of chlorophyll fluorescence induction, the photochemical reaction has not yet commenced, and the photosynthetic reaction center remains fully accessible. This stage is termed the initial fluorescence phase, and it is measured by light sources with varying wavelengths within the visible light spectrum. These measurements provide vital photosynthetic insights, including pigment content, reaction center concentration, energy absorption, and excitation energy transfer. They precisely depict the structure and composition of light-harvesting pigments in phytoplankton, along with energy absorption efficiency. Consequently, this technique critically contributes to analyzing the photosynthetic status and primary productivity of live phytoplankton. Following the revelation of chlorophyll fluorescence induction, multiple techniques for measuring initial fluorescence have emerged. For example, Schreiber et al. introduced the technique of pulse amplitude modulation (PAM) for measuring photoinduced fluorescence kinetics, Kolber et al. suggested the fast repetition rate fluorescence (FRRF) measurement technique, and Strasser et al. developed the OJIP technique for rapidly measuring chlorophyll fluorescence-induced kinetic curves by continuous excitation luminescence. Currently, research on the technical approaches predominantly centers on characteristic absorption bands. Nevertheless, the sensitivity of non-characteristic absorption bands remains limited, hindering the accurate portrayal of the structural composition of light-harvesting pigments and energy absorption efficiency. Therefore, the development of a profoundly sensitive method for initial fluorescence measurement is pivotal in advancing the investigations of phytoplankton primary productivity.MethodsWe employ the photosynthetic electron transport model and the OJIP fluorescence kinetics measurement technology to regulate the redox state of electron receptors proximate to the O phase, thereby attaining optimal excitation conditions. Under weak light excitation, LHCII absorbs energy at a low level, and the excitation energy is transferred to the reaction center. The electron acceptor can receive and promptly re-oxidize electrons to establish a rapid dynamic equilibrium, which leads to a consistent initial fluorescence signal. Due to the weak nature of the initial fluorescence signal, integrating and amplifying signals across various bands within the microsecond range enable the attainment of highly sensitive detection (50-150 μs) of initial fluorescence. Thus, precise acquisition technology for initial fluorescence is indispensable for investigating the primary productivity of phytoplankton by fluorescence dynamics. Validation of the initial fluorescence measurement results involves comparing the PSII absorption coefficient and initial fluorescence similarity.Results and DiscussionsThe findings from the initial fluorescence measurements indicate strong correspondence between the measurements of photosynthetic pigment absorption in phytoplankton and actual absorption patterns. For example, Microcystis aeruginosa exhibits a PE absorption peak at 569 nm and a PC absorption peak at 620 nm, and freshwater green algae show an absorption peak of Chl a at 439 nm and a Car absorption peak at 474 nm (Fig. 3). Moreover, compared to the reference sample, the verification results indicate the proficient representation of PSII absorption by the initial fluorescence, thereby confirming a substantial degree of measurement accuracy. The PSII fluorescence yield closely mirrors the initial fluorescence profile, exhibiting similarity values of 0.996 for Microcystis aeruginosa, 0.999 for Scenedesmus dimorphus, 0.999 for Scenedesmus obliquus, 0.999 for Chlorella ellipsoidea, 0.998 for Oocystis lacustris, and surpassing 0.998 for all four species of freshwater green algae (Fig. 4).ConclusionsWe address the constraints of existing initial fluorescence measurement methodologies, which predominantly concentrate on characteristic absorption bands to reduce sensitivity for absorption bands lacking distinct characteristics. As a result, these techniques inadequately represent the energy absorption efficiency of photosynthetic organs in algae. To this end, we propose a precise technology for acquiring initial fluorescence and facilitating primary productivity measurement in phytoplankton by fluorescence dynamics. This approach integrates the photosynthetic electron transfer model with the measurement principles of OJIP fluorescence dynamics technology. The results of the initial fluorescence measurements demonstrate significant correspondence between the measurements of photosynthetic pigment absorption in phytoplankton and actual absorption patterns. For example, Microcystis aeruginosa exhibits a PE absorption peak at 569 nm and a PC absorption peak at 620 nm, and freshwater green algae show an absorption peak of Chla at 439 nm and a Car absorption peak at 474 nm. Furthermore, the comparative verification results indicate a close similarity between the shapes of the PSII fluorescence yield and the initial fluorescence, affirming the capacity of the initial fluorescence to precisely mirror PSII absorption. The similarity values are noteworthy, with 0.996 for Microcystis aeruginosa, 0.999 for Scenedesmus dimorphus, 0.999 for Scenedesmus obliquus, 0.999 for Chlorella ellipsoidea, 0.998 for Oocystis lacustris. Additionally, all the four species of freshwater green algae surpass 0.998. We introduce a remarkably sensitive measurement technology for initial phytoplankton fluorescence to facilitate precise and accurate measurements. Consequently, noteworthy technical advancements are provided for investigating primary productivity in phytoplankton.
Jun. 25, 2024Vol. 44 Issue 12 1201002 (2024)
Jiaqi Zhao, Shuai Hu, Ruijun Dang, Lei Liu, Xichuan Liu, and Yao Xiao
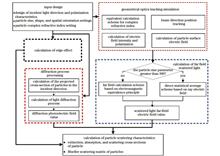
ObjectiveCirrus clouds and some top clouds typically contain a large number of ice crystal particles, which have a strong scattering and absorption effect for visible and infrared radiation and play an important role in the balance of the atmospheric energy budget. Understanding the radiation characteristics of cirrus clouds must start with understanding the single scattering characteristics of non-spherical ice crystals. However, due to the irregular shape of ice crystal particles such as hexagonal columns and bullet flowers, the calculation of their scattering characteristics has significant uncertainty, making them one of the most uncertain factors in radiation transfer simulation. Therefore, accurately simulating the light scattering process of ice crystals is a current research focus. At present, for ice crystal particles with small and medium-sized parameters, scattering calculation models for non-spherical particles are gradually developing, such as discrete dipole approximation (DDA), invariant imbedding T-matrix (IIMT matrix), and finite-difference time-domain (FDTD) method. The DDA and FDTD models are mainly employed for particles with size parameters less than 40, and the IIMT matrix model is mainly for particles with size parameters less than 100. For large-size parameter particles, most of the traditional geometric optical approximation models are adopted in China to calculate their scattering parameters. However, this method is based on the fact that the particle size is much larger than the incident light wavelength, and the effect becomes worse during calculating particles with size parameters less than 300. Therefore, it is extremely important to independently develop the geometrical optics approximation model and expand its applicable size parameter range. In this regard, we develop an improved geometric-optical approximation model by combining the electromagnetic equivalence principle with ray tracing techniques and considering the effects of diffraction and particle absorption.MethodsFirstly, a ray tracing algorithm considering polarization is constructed using Monte Carlo technology to simulate the beam reflection and refraction processes and to track the propagation direction and electric field vector of the beam. Secondly, based on ray tracing, a calculation scheme for far-field scattering electric field is studied. For particles with size parameters greater than 300, a direct ray statistics scheme is adopted, and for small particles, a far-field electric field calculation scheme based on the electromagnetic equivalence principle is designed. Furthermore, the study of diffraction calculation techniques for irregular cross-sections involves projecting particles in the direction of incident light and numerically solving the diffraction equation to obtain the diffraction electric field. Finally, based on the ray tracing electric field, the far field electric field of scattered light, and the diffraction electric field, the calculation scheme of particle scattering characteristics is designed to realize the calculation of particle extinction, absorption cross section, S-matrix, and other scattering parameters. The calculation model of the edge diffraction effect is built to realize the compensation and correction of extinction and absorption cross section.Results and DiscussionsWe compare the calculation results of IGOA with the physical geometrical optics approximation model (PGOM) developed by Yang et al. and the independently developed IIMT model, with the phase matrix elements computed by IGOA and PGOM compared. The particle is a hexagonal column with an aspect ratio of 1.0, and the size parameter is 100 and 300. The refractive index is 1.308+i1.43×10-9, and the incident light wavelength is 0.65 µm. The results of the IGOA model and the PGOM model are basically consistent, and their scattering phase function (P11) varying with scattering angle is basically in sound agreement, especially in the forward scattering angle (0°-90°), which is more significant. Generally, P12, P22, P33, P34, and P44 have a high degree of agreement. A hexagonal prism particle with a size parameter of 300 is calculated, with a bottom length of 572.95779 µm, a height of 286.47889 µm, an incident light wavelength of 12 µm, and a particle complex refractive index of 1.2762+i0.4133. The calculated results are compared with those of PGOM, as shown in Fig. 7. For strongly absorbing particles, the calculation results of IGOA and PGOM maintain high consistency at various scattering angles, especially for polarization characteristics, where the calculation curves of the two models basically coincide. This means that the IGOA model can also achieve a high level of computational accuracy for strongly absorbing particles. To analyze the calculation results of smaller parameter particles with different shapes, we calculate the scattering phase matrices of hexagonal and dodecagonal prism particles by IGOA and IIMT models, with sound consistency between the two models.ConclusionsThe geometrical optics approximation model is an important tool for calculating the light scattering characteristics of large size parameter particles, but it is based on the fact that the incident light wavelength is longer than the particle size. For particles with size parameters of 100-300, the simulation accuracy is relatively poor because they are just in the transition scale range from physical optics to geometrical optics. To solve this problem, we combine the ray tracing technology with the electromagnetic equivalence principle, consider the strong absorption and diffraction of particles and other factors, and independently compile the improved IGOA model. The calculation results are compared with those of the IIMT and PGOM models, and the following conclusions are drawn:1) For particles with size parameters ranging from 80 to 300, the calculation results of the IGOA model are highly consistent with those of the PGOM and IIMT models, which indicates that the calculation results of the model have high accuracy. Generally, the calculation accuracy of the model is maintained at a high level for particles with different size parameters and complex refractive indexes.2) For scattering characteristic calculation of strongly absorbing particles, the IGOA model shows sound simulation performance, and its calculation results basically coincide with the calculation curve of PGOM.
Jun. 25, 2024Vol. 44 Issue 12 1201003 (2024)
Lingyun Min, Xiaowei Chen, Ningquan Weng, Wenyue Zhu, Xianmei Qian, Pengfei Wu, Congming Dai, Xuebin Li, Shengcheng Cui, and Xun Cui
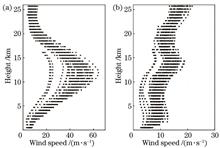
ObjectiveWind speed and direction exert an important influence on atmospheric optical properties, and their vertical distribution and variation laws are of significance in astronomical observation, adaptive optics, and laser atmospheric propagation. Meanwhile, strong wind shear can trigger turbulence, and the transverse wind is closely related to thermal blooming. Since the natural environment is complex and changeable, wind speed and direction vary in different regions. Therefore, local wind speed and direction models should be established in practical applications. Due to the low accuracy of existing wind speed profile models and the lack of wind direction profile models, we analyze the variations of wind speed and direction in typical coastal areas of China, and propose novel wind speed and direction model functions respectively. We hope that the proposed wind speed and direction profile models are helpful to the design of adaptive optical systems, laser atmospheric propagation engineering, and free space optical communication.MethodsFirst, by analyzing the daily data of 50 years of radiosonde data in typical coastal areas of China, the monthly average wind speed and direction profiles are obtained to study the monthly variation characteristics. Then, according to the monthly variation characteristics, the months in each season are adjusted, and the seasonal average profiles are acquired by statistically calculating daily data, with standard deviation at the corresponding height given. According to the seasonal average profiles, the coefficients of the model functions are obtained by genetic algorithm. Further, taking the average profile as the standard, the proposed models are compared with the existing models to verify that the accuracy of the proposed model is improved. Next, the standard deviation is adopted as uncertainty to analyze the variation characteristics of uncertainty with height.Results and Discussions1) According to the variation characteristics of monthly average profiles of typical coastal areas in China, the wind speed profiles are divided into two types (Fig. 1), and the wind direction profiles are divided into three types (Fig. 2). 2) The seasonal average profiles of wind speed show that the tropopause wind speed is generally high in winter and low in summer in the middle latitudes. The wind speed near 20 km at Dalian and Qingdao decreases to the minimum in summer, but the same phenomenon appears in winter at Xiamen and Xisha Islands. 3) Employing the genetic algorithm, we obtain the fitting coefficients of the wind speed and wind direction model functions in different seasons (Tables 5 and 6). 4) The established wind speed models are closely consistent with the average profiles, and the accuracy is significantly improved compared with existing wind speed models (Figs. 4-8). The average relative deviations of established wind speed models of four seasons in Dalian are 1.35%, 1.54%, 1.12%, and 0.79%, respectively. While those are 2.92%, 2.50%, 3.29%, and 3.21% in Qingdao, 2.28%, 1.18%, 1.06%, and 1.96% in Shanghai, 1.82%, 1.17%, 2.56%, and 1.66% in Xiamen, 2.80%, 0.90%, 0.98%, and 3.16% in Xisha Islands, respectively. 5) The established wind direction profile models are closely consistent with the average profiles (Figs. 9-13). The average relative deviations of established wind direction models of four seasons in Dalian are 0.53%, 1.56%, 0.67%, and 0.44% respectively. While those are 0.82%, 1.30%, 0.56%, and 0.59% in Qingdao, 0.48%, 0.78%, 1.25%, and 1.07% in Shanghai, 0.95%, 1.06%, 1.71%, and 1.81% in Xiamen, 0.87%, 1.04%, 0.69%, and 2.70% in Xisha Islands, respectively. 6) The variation trend of wind speed uncertainty is different from that of wind direction. The uncertainty of wind speed is generally the largest at the tropopause, while the uncertainty of wind direction is the smallest near the tropopause in Dalian and Qingdao, and the uncertainty of wind direction is more varied in other areas. However, the uncertainties of wind speed and wind direction have seasonal and regional varying characteristics.Conclusions1) In typical coastal areas of China, the wind speed profiles are divided into two types, and the wind direction profiles are divided into three types. 2) In our study, wind speed and direction vary with regions, months, and seasons. For optical engineering applications such as laser atmospheric propagation, the adoption of wind speed and direction models in local regions and corresponding seasons is more accurate. 3) The proposed wind speed and direction model functions are universal in the typical coastal areas of China. The wind speed and direction profile models established in this paper have higher accuracy than the existing models. The mean relative deviation of wind speed is less than 3.29%, and that of wind direction is less than 2.70%. 4) The statistical uncertainties of wind speed and direction have seasonal and regional characteristics.
Jun. 25, 2024Vol. 44 Issue 12 1201004 (2024)
Yi Yang, Zhanwang Min, Xinyu Yao, Yuang Dou, Xiaofen Qiu, Jianlei Zhang, and Fengtao He
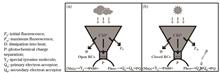
ObjectiveDue to the increasing ocean exploration by a large number of scientific activities and military operations, researchers are investigating high-speed, stable, and long-range underwater wireless communication technologies. Compared with traditional acoustic and radio frequency communications, underwater wireless optical communication (UWOC) systems are attracting a great deal of interest from researchers due to their advantages of big bandwidth, high information transmission rate, and sound confidentiality. However, UWOC systems are not only affected by water absorption but also suffer from the loss caused by misalignment between receiving and transmitting systems or the loss caused by pointing error, which cannot be neglected. Additionally, ocean turbulence also causes flickering of received light intensity, affecting the system performance. However, the inconsistency of salinity diffusion and heat diffusion mechanisms in real marine environments causes unstable seawater stratification, which results in the scintillation effect of the Gaussian beam in the ocean turbulence channel deviating significantly from the actual marine environment. Therefore, a pointing-jitter error model in UWOC is developed by the unstable Yue ocean power spectrum with ocean water stratification. The model takes into account water body attenuation, pointing-jitter error loss, and link attenuation caused by seawater turbulence, and finally investigates the effect of aperture averaging technique on system performance.MethodsTo more accurately model underwater wireless communication systems, we discuss the effect of pointing-jitter error on the performance of laser communication systems based on a turbulent seawater fading channel. Firstly, for the pointing error, we introduce the relative position parameter of the laser transmitter and the deflection angle parameter to determine the state of the transmitter. Meanwhile, the jitter error is employed to characterize the effect of seawater turbulence on the receiver body. For the effect of seawater turbulence, we adopt the Yue spectrum that considers the stratification instability of the ocean water body and give an analytical equation for the scintillation index of a Gaussian beam based on the Yue spectrum after aperture averaging. Additionally, we build a composite channel model including water body attenuation, pointing-jitter error loss, and seawater turbulence, and introduce a signal-to-noise ratio correction factor to simulate the positional attenuation of the Gaussian beam in the attenuation channel. At the same time, we give the bit error rate (BER) expressions of the system based on the on-off key (OOK) modulation with and without the jitter error to measure the system performance respectively.Results and DiscussionsTo obtain the scintillation index of Gaussian beam transmission under the parameter of variable temperature salt vortex diffusion ratio in the water column, we numerically simulate the scintillation index of Gaussian beams in ocean turbulence with the transmission distance and different aperture sizes. The results show that the aperture averaging technique has the effect of suppressing the scintillation index caused by both stable and unstable seawater stratification, but the suppression effect is nonlinearly related to both aperture sizes (Fig. 6). The system decreases the turbulence suppression effect with the increasing aperture size. The effects of pointing error and jitter error in the composite channel on the UWOC system are further investigated. In the jitter error-free channel, a change of 0.04 m in the transmitter position sending can greatly affect the system performance, and the BER performance of the system decreases by 17.15 dB in strong turbulence, and 20.55 dB in weak turbulence (Figs. 7 and 8). In the composite channel that includes water body attenuation, pointing-jitter error loss, and seawater turbulence, we find that in the weak turbulence channel of the UWOC system, the effect of pointing error on the system performance is greater than that of jitter error on the system performance, while the effect of weak turbulence on the system performance is less (Fig. 11).ConclusionsThe results show that the aperture averaging technique has an inhibiting effect on the scintillation index caused by both stabilization and instability of seawater stratification, but the inhibiting effect is nonlinearly related to both aperture sizes. As the aperture size increases, the turbulence suppression effect gradually decreases. In the jitter error-free channel, a change of 0.04 m in the transmitter position sending can greatly affect the system performance, and the BER performance of the system decreases by 17.15 dB in strong turbulence and 20.55 dB in weak turbulence. In the composite channel containing water fading, pointing-jitter error loss, and seawater turbulence, we find that in the UWOC system of the weak turbulence channel, the pointing error has a greater effect on the system performance than the jitter error has on the system performance, while the weak turbulence has a smaller effect on the system performance. Additionally, the aperture averaging technique can significantly improve both turbulent channel attenuation and pointing-jitter error, while the suppression of seawater turbulence is the most obvious. Our study is of guiding significance for an in-depth understanding of the transmission characteristics of Gaussian beams in real ocean channels and provides an effective theoretical basis for the application of aperture averaging technique to suppress turbulence in complex ocean environments. Meanwhile, references are offered for related research on underwater laser localization.
Jun. 25, 2024Vol. 44 Issue 12 1201005 (2024)
Hedong Liu, Yilin Han, Xiaobo Li, Zhenzhou Cheng, Tiegen Liu, Jingsheng Zhai, and Haofeng Hu
ObjectiveUnderwater imaging is an important method for exploring oceans, lakes, and other underwater environments, and it is of significance for many fields such as coastal defense, ocean exploration, underwater rescue, and aquaculture. However, there are many suspended particles in the actual water environment, which will scatter and absorb the signal light of the target. Therefore, images obtained by underwater imaging often feature image quality degradation, such as serious contrast reduction and serious detail loss. Due to the differences in polarization characteristics between the signal light and the backscattered light, polarization imaging technology is introduced to underwater imaging and polarization information is employed to suppress scattered light and enhance signal light, which can make up for the shortcomings of detection effects restricted by the environment. Although existing polarization-based descattering methods for underwater imaging can enhance image contrast and improve image quality, these methods only focus on intensity information and ignore polarization information restoration, resulting in a loss of polarization information. In fact, the degree of linear polarization (DoLP) and polarization angle (AoP) among other polarization information can reflect the polarization characteristics of the target. Meanwhile, they are adopted to distinguish targets based on different polarization states and have important applications in underwater detection and recognition. Therefore, we propose a neural network based on the channel attention mechanism to extend the function of underwater polarization imaging by restoring polarization information.MethodsThe proposed method mainly utilizes a convolutional neural network to restore the polarization information. The network is mainly composed of three parts, including shallow feature extraction module (SFE), a series of residual dense modules (RDBs), and channel attention-based global feature fusion module (CAGFF). Specifically, SFE employs U-Net and two convolutional layers as feature extraction module to extract shallow features containing polarization features of input images. Subsequently, the shallow features with rich polarization information extracted by SFE are input into a series of RDBs, which are mainly composed of dense connections and residual connections of convolutional layers. A series of RDBs outputs are then fed into the CAGFF which consists of a channel attention module and a convolutional layer. Finally, the polarization informed content and style loss (CSL) is designed to train the network, which employs intensity images to calculate the content loss and adopts polarization information to calculate style loss.Results and DiscussionsThe results of polarization imaging experiments of different objects in underwater environments show that our method can restore polarization information and improve underwater imaging quality. In ablation experiments, the four contributions of the network are removed step by step to verify the effectiveness of each contribution. By visual comparison, the network with all improvements accurately recovers both intensity image and polarization information (Fig. 5). Removing any component will degrade the restored results and blur details. Quantitatively, our network yields the highest peak signal to noise ratio (PSNR) value among different network structures (Table 2). Compared with other representative methods of underwater image enhancement, the proposed method has the best performance in intensity, DoLP, and AoP images (Fig. 6). The PSNRs of two different scenes illustrate that the proposed method has advantages in the reconstruction of DoLP and AoP images. Additionally, several groups of experiments on different parameters are conducted to verify the influence of these parameters. First. the number of channel attention modules is determined by comparing the network performance with different values (Fig. 7). Then by the comparative experiment of RDB parameters, we find that the values of RDB parameters are positively correlated with the network performance (Fig. 8). Finally, the weight of the loss function is fully discussed (Fig. 9).ConclusionsAiming to remove the scattered light and restore the polarization information, we propose a neural network based on the channel attention mechanism. Based on the residual dense network, our network mainly has four contributions, which are polarization input, SFE with U-Net, CAGFF, and polarization informed CSL function. By performing the above contributions, the network can efficiently extract and utilize the polarization features of different levels to restore the polarization information. Meanwhile, we build a dataset for underwater polarimetric images, in which the input images and ground truth images are respectively obtained in turbid water and clear water. Based on this dataset, we carry out a series of experiments on different objects in underwater environments. Ablation experimental results show that our contributions to the network are effective, and removing anyone will degrade the results. Compared with other underwater polarization imaging methods, the results show that our method can suppress the influence of scattered light on polarization imaging and significantly improve the image contrast and clarity. Specifically, our method can successfully restore the DoLP and AoP to expand the function of underwater polarization imaging.
Jun. 25, 2024Vol. 44 Issue 12 1201006 (2024)
Lü Botao, Ning An, Xingwei Han, Cheng Cheng, Xiaohua Feng, Yuanda Zhang, Jian Gao, Qingli Song, and Chengzhi Liu
ObjectiveLaser return number is an important parameter to perform the detection ability of a satellite laser ranging (SLR) system, which is proven to be closely related to the atmospheric transmission characteristics of laser. Accurate evaluation of the laser return number in the SLR system not only provides a theoretical basis for system design and optimization but also is a key issue and primary link in the future development of SLR automation systems. In SLR system operation, the atmospheric scattering effect, atmospheric absorption effect, and atmospheric turbulence effect continuously reduce the laser energy during atmospheric channel transmission, directly affecting the size of the average laser return number in the SLR system. The influence of the atmospheric environment on photon detection becomes increasingly evident as the detection distance further increases. To effectively evaluate the average laser return number in the SLR system and explore the relationship between laser atmospheric transmission characteristics and the detection performance of the SLR system, we should analyze the atmospheric transmission characteristics of lasers.MethodsLidar atmospheric correction (LAC) model based on Mie scattering theory and actual meteorological conditions is built in our study. First, based on the tilted propagation theory of laser, the entire atmosphere transmittance at different wavelengths (450, 500, 550 nm) is calculated. Then, the average laser return number per unit time of the SLR system in different meteorological conditions is calculated, and the model is validated by the actual observation results of the 60 cm SLR system at Changchun Observatory. Finally, the effects of visibility and relative humidity on the average laser return number are analyzed.Results and DiscussionsCompared with the empirical formula adopted in conventional lidar equations, the mean average relative error of atmospheric transmittance calculated using the laser slanting revise theory decreases from 14.201% to 5.992%, which is about an order of magnitude smaller (Fig. 2 and Table 1). The calculated average laser return number per unit time of SLR system based on the LAC model exhibits good consistency with the measured data, with an average relative error of less than 15% (Fig. 4 and Table 2). The average laser return number received by the SLR system is proportional to visibility and inversely proportional to relative humidity (Figs. 5 and 6). When the elevation angle of the telescope is less than 15°, the influence of visibility and relative humidity on the average laser return number is not significantly different. When the elevation angle of the telescope is greater than 15°, the influence of visibility is slightly greater than that of relative humidity, and reaches its peak around 60° (Fig. 7). Additionally, we also find that due to the temperate continental climate of Changchun Observatory, there are significant seasonal variations in the average laser return number per unit time received by the SLR system (Fig. 8).ConclusionsAverage laser return number in SLR system is an important parameter characterizing the detection ability of the system, which is closely related to the atmospheric transmission characteristics of lasers. Based on Mie scattering theory and the actual distribution of aerosol particles, the LAC model is proposed and employed to calculate the average laser return number in the SLR system. By taking the 60 cm SLR system at Changchun Observatory as an example, the effect of climate conditions on the average laser return number in the SLR system is analyzed. The results indicate that the average laser return number in SLR system increases with the rising visibility near the surface and decreases with the increasing relative humidity. When the elevation angle of the telescope is greater than 15°, the influence of visibility is greater than that of relative humidity, and their influence reaches its peak around 60°. Our study not only elucidates the inherent mechanism by which climate conditions affect the detection performance of SLR system but also provides new theoretical solutions and technical support for SLR system site selection and performance evaluation.
Jun. 25, 2024Vol. 44 Issue 12 1201007 (2024)
Chao Li, Xianhua Wang, Hanhan Ye, Shichao Wu, Hailiang Shi, Dacheng Li, Erchang Sun, and Yuan An
ObjectiveWith the escalating concerns about global climate change and the intensification of the greenhouse effect, the increase in atmospheric CO2 concentration is considered one of the primary driving factors. To effectively manage and mitigate these emissions, the accurate and real-time monitoring of atmospheric CO2 concentrations becomes particularly crucial. Monitoring atmospheric CO2 not only provides scientists with valuable information on current emission levels and changing trends but also offers policymakers a basis for decision-making to formulate or revise relevant environmental and climate policies. Moreover, by continually and accurately monitoring atmospheric CO2, we can gain a better understanding of its interactions with other climate parameters, thus supplying more accurate input data for global climate models. In recent years, satellite remote sensing technology has become a vital tool for monitoring atmospheric CO2, especially in vast or inaccessible regions. However, point source emissions, such as those from factories and power plants, tend to be highly concentrated spatially. For these small yet concentrated emission sources, traditional satellite remote sensing technologies may encounter challenges related to insufficient resolution. To address this challenge, this paper delves into a profound theoretical analysis of the spatial resolution capabilities of the next generation of imaging satellite remote sensing in monitoring atmospheric point source CO2 emissions. It quantifies the resolution capabilities and applicable scenarios of imaging satellites, laying a theoretical foundation for the resolution capability analysis and information interpretation methods of future imaging detection data for CO2 emissions, drawing from specialized backgrounds.MethodsTo explore the enhancement of point source CO2 emission monitoring capabilities by the spatial detection capabilities of satellite imaging remote sensing, this study is based on the CALPUFF Lagrangian particle dispersion model to investigate the dispersion state after carbon source emissions. Furthermore, based on the capabilities of satellite observation, we conduct an analysis of the spatial resolution capabilities of atmospheric CO2 satellite imaging remote sensing. The satellite imaging remote sensing’s resolution capability for atmospheric CO2 primarily reflects the accuracy in the spectral, radiative, and spatial resolutions. Additionally, the CO2 concentration retrieval based on remote sensing data also involves the merits of the method and the accuracy of environmental parameters, making the analysis of satellite imaging remote sensing’s CO2 monitoring capabilities a highly complex issue. Since Japan’s GOSAT and the U.S.’s OCO-2 have already demonstrated retrieval capabilities of 4×10⁻⁶ and 1×10⁻⁶ respectively from spectral, radiative, and retrieval perspectives, this paper is built upon this foundation, that is, based on the existing remote sensing technology capabilities, to conduct simulations and analyses on spatial resolution capabilities. Simultaneously, to further quantify the detection capabilities of atmospheric CO2 under imaging satellite conditions, we introduce quantitative evaluation methods, namely, the pixel count statistical method and the emission flux algorithm. Under different satellite spatial resolution conditions, we quantitatively evaluate the spatial resolution capabilities of imaging satellites in detecting point source CO2 emissions.Results and DiscussionsWe conduct an in-depth simulation analysis of the spatial plume distribution characteristics of point source CO2, focusing on the impact of different meteorological conditions and emission source intensities on its dispersion. Initially, the results show that under calm conditions, the spread of the CO2 plume takes on a concentric circular pattern. Under conditions with an emission source as high as 3000 t/h, its spatial dispersion can reach a radius of 1 km. This distribution characteristic suggests that under stable atmospheric conditions, the diffusion of pollutants is primarily driven by the motion of CO2 particles themselves, making their detection from a satellite perspective more prominent. In windy conditions, the presence of wind dominates the direction and scope of the CO2 plume’s dispersion. As wind speed increases, the spatial range of CO2 dispersion expands, but its concentration gradient difference gradually narrows, especially evident when wind speeds reach 10 m/s. However, as the emission intensity of CO2 increases, the difference in its spatial concentration distribution grows exponentially. This effectively indicates that a higher emission source intensity can counteract some of the atmospheric CO2 dispersion dilution effects caused by increased wind speeds. Further analysis reveals that spatial resolution is crucial for the success of satellite detection. Within a spatial resolution range of 0.05-10 km, high-resolution detection pixels demonstrate significant advantages under various environmental conditions. Specifically, as the spatial resolution increases, the number of CO2 plume pixels identifiable from a satellite perspective notably grows. For emission sources of 3000 t/h compared with 500 t/h, the number of detectable pixels increases by nearly 15% on average. This further validates the pivotal role of spatial resolution and emission source intensity in satellite detection of CO2 plumes. Additionally, we also closely examine the impact of different satellite CO2 retrieval accuracies on detection capability. Data indicates that under the retrieval accuracy of 1×10⁻⁶ compared with 4×10⁻⁶, satellites can detect a greater number of pixels, with the difference reaching up to two times. Furthermore, when the emission intensity reaches the research-set maximum of 3000 t/h, compared with medium and low emission sources, the required spatial resolution is 2-4 km, further reducing the demands on satellite technology.ConclusionsConsidering the spatial plume distribution of atmospheric CO2, we comprehensively consider the effects of meteorological conditions and emission source intensity. In calm wind conditions, CO2 diffuses in concentric circles, with a diffusion radius of up to 1 km. Moreover, its spatial gradient is more substantial, making it more amenable to satellite detection. Both wind speed and CO2 source emission intensity have significant impacts on dispersion and detection. Notably, high wind speeds result in an expanded dispersion range but reduce gradient differences, while high emission sources enhance the feasibility of satellite detection. Meanwhile, high spatial resolution and XCO2 retrieval accuracy can improve detection results. A higher resolution can enhance the identification of CO2 plume patterns and reduce estimation errors of its emission intensity. Meanwhile, the retrieval accuracy of 1×10⁻⁶, compared with 4×10⁻⁶ , better highlights XCO2 gradient changes, improving estimation accuracy by 15%. Under various conditions, sources with high emission intensities are more easily and accurately identified, especially when the wind speed is 10 m/s, and the emission intensity is 1000 t/h, requiring a spatial resolution of up to 1 km. With the advancement of imaging satellite technology, the spectral and spatial resolutions of remote sensing will further improve. The application areas and demands for remote sensing will also expand, thus making more significant contributions to global carbon emission monitoring.
Jun. 25, 2024Vol. 44 Issue 12 1201008 (2024)
Qing Zhang, Xingwang Sun, Zheqiang Zhong, and Bin Zhang
ObjectiveAs underwater military activities and scientific research are increasingly frequent, the demand for high-speed, high-quality, and high-bandwidth underwater communication has become urgent. However, laser communication effectiveness in seawater is hampered by the scattering, absorption, and turbulence effects, which causes degraded beam quality and increased communication error rates. Consequently, it is of application significance to study the beam quality degradation characteristics of blue-green lasers in seawater. However, laser propagation calculation in seawater turbulence is quite complex and time-consuming. Therefore, it is of significance to establish a beam expansion calibration formula, especially for blue-green laser propagation in seawater turbulence. This scaling law will enable the rapid prediction and evaluation of beam expansion influence and patterns.MethodsFirst, we build a rigorous physical model to comprehend the propagation of blue-green lasers in seawater turbulence. By adopting the power spectrum inversion method, phase screens of seawater turbulence are generated to enable the numerical calculation of beam expansion variation, with both seawater parameters and laser parameters considered. Second, the β factor is employed to evaluate the energy concentration of laser beams on the target plane and thus revealing the beam expansion of lasers by seawater turbulence. Finally, a beam expansion calibration formula for blue-green lasers propagating in seawater turbulence is proposed via the processing method of the mean square sum.Results and DiscussionsThe estimation results of the scaling law obtained by fitting are compared with those of numerical calculation. The results show that the scaling law matches well with the numerical calculation under certain laser and seawater turbulence parameters. This is under the scenario that the laser parameters fall within the ranges of 0.001-0.100 m for the beam waist radius, 1.0-4.0 for the initial beam quality factor, 470-550 nm for the wavelength, and -5.0--0.5 for the value range of temperature-induced seawater turbulence to salinity-induced seawater turbulence. Additionally, the seawater turbulence parameters are kinetic energy dissipation rate of 10-10-10-1 m2/s3, and 10-10-10-4 K2/s for the dissipation rate of temperature difference. After imposing this limitation, for the total beam expansion, the maximum error between the beam expansion estimated by the scaling law and the numerical calculation results is 10.90%, with a maximum average error of 4.70%. Consequently, the scaling law can accurately predict the beam expansion laws of Gaussian beams propagating in seawater turbulence.ConclusionsTo rapidly and accurately predict the beam expansion law of Gaussian beams propagating in seawater turbulence, we first analyze the variation of beam expansion with laser and seawater parameters. Subsequently, the scaling law for beam expansion of blue-green lasers in seawater turbulence is proposed. On this basis, the coefficients in the scaling law are determined by employing the least squares method. The scaling law is then utilized to estimate the errors between the beam expansion estimated by the scaling law and the numerical calculation results under different parameters. The results show that within the specified parameter range, the error between the estimated beam expansion law by the scaling law and the numerical calculation results is within 5%.
Jun. 25, 2024Vol. 44 Issue 12 1201009 (2024)
Yun Yuan, Huige Di, Yuxing Gao, Mei Cao, and Dengxin Hua
ObjectivePhase state recognition of cloud particles is an important content in cloud physics research and also significant for inverting other cloud microphysical parameters. With the development of remote sensing detection technology, researchers have developed various recognition methods of cloud phase particles, such as decision tree recognition, classic statistical decision recognition, neural networks, clustering algorithms, and fuzzy logic algorithms. However, due to the complex characteristics of cloud particles, the radar information corresponding to different particles does not have absolute features, and there may be some overlap degree. Thus, recognition algorithms based on rigid threshold conditions are not well suitable for phase recognition and classification of cloud particles. Fortunately, the fuzzy logic recognition algorithm can improve this rigid threshold defect, but the accuracy of the T-function coefficients in fuzzy logic will directly determine the accuracy of the recognition results. To accurately and finely identify cloud phase states, we propose an optimization algorithm based on fuzzy logic to recognize the phase states of cloud particles. The optimized fuzzy logic algorithm can also recognize supercooled water and warm cloud droplets compared to the original fuzzy logic algorithm which can only recognize ice crystals, snow, mixed phases, liquid cloud droplets, drizzle, and raindrops.MethodsBased on the induction and summary of a large number of aircraft and remote sensing instruments simultaneously observed data and comprehensive characteristic consideration of different cloud types, we adjust and optimize the T-function coefficients of fuzzy logic. A table of T-function coefficient parameters for different cloud phase particles is constructed as shown in Table 2. The corrected reflectivity factor, radial velocity, and spectral width detected by millimeter wave cloud radars with high spatiotemporal resolution, as well as the temperature detected by microwave radiometer, are adopted as input parameters for the optimized fuzzy logic algorithm. According to the phase recognition process of cloud particles shown in Fig. 1, snow, ice, mixed phase, supercooled water, warm cloud droplets, drizzle, and rain in cloud particles can be identified.Results and DiscussionsThe cloud particle phase of a snowfall observed on 6 February 2022 in Xi'an is inverted to verify the effectiveness and accuracy of the optimized algorithm. Additionally, we input the parameters (corrected reflectivity factor, radial velocity, spectral width, and temperature) that can characterize the features of cloud particles in Fig. 3 into the optimized fuzzy logic algorithm, and obtain the phase recognition results of cloud particles shown in Fig. 5. The cloud phase distribution in Fig. 5 (near the ground area, at a height of about 200 m) is highly consistent with the particle phase changes recorded by the ground precipitation phenomenon meter. Meanwhile, we also compare the recognition results of the optimized fuzzy logic algorithm (Fig. 5) with the original fuzzy logic algorithm (Fig. 4) and find that the optimized algorithm can identify supercooled water that cannot be recognized by the original algorithm, which is beneficial for explaining the particle phase transformation process and precipitation mechanism research in clouds.ConclusionsWe propose an optimized fuzzy logic algorithm by optimizing the asymmetric T-function coefficients and considering the effects of reflectivity factor attenuation and temperature on the accuracy of recognition results. The corrected reflectivity factor, radial velocity, spectral width, and spatiotemporal continuous temperature detected by the microwave radiometer are leveraged as input parameters for the optimized fuzzy logic algorithm. The optimized algorithm can accurately identify snow, ice, mixed phase, supercooled water, warm cloud droplets, drizzle, and rain particles in clouds, which would help study and invert cloud microscopic parameters.
Jun. 25, 2024Vol. 44 Issue 12 1201010 (2024)
Qingwei Zeng, Lei Liu, Shuai Hu, Shulei Li, and Shijun Zhao
ObjectiveFilament refers to a plasma channel with high laser intensity and high plasma density formed by the propagation of intense femtosecond laser pulses in a transparent medium. Several literatures have shown that the cross-section image of an optical filament at a specific z usually contains abundant structural information such as filament diameter, length, and energy distribution, which is of great significance for the visualization study of the dynamic process of filament formation. Moreover, accurate acquisition of the spatial structure and energy deposition distribution of femtosecond optical filaments are also of great significance for the development of filamentation-based atmospheric applications. Nevertheless, it is also the inherent parameter most difficult to measure directly. To solve the problem, we introduce a new medical imaging method named photoacoustic tomography (PAT) for optical filament cross-section imaging. The feasibility of reconstructing monofilament and multifilament images by photoacoustic tomography is verified theoretically. Moreover, we also study the influence of the performance parameters of the ultrasonic transducers on the optical filament image reconstruction.MethodsWe adopt a forward simulation model based on the photoacoustic wave equation to simulate the acquisition process of ultrasonic signals induced by optical filaments in air. A circular-scanning-based PAT system is considered to obtain the cross-section image of the laser filament. To simplify the problem, we assume that the initial heat source distribution of the optical filament satisfies the Gaussian distribution form, which can represent both the small high-energy core of the optical filament and its weak background energy region with a larger range. Based on experimental measurements, the initial maximum energy deposition density is assumed to be in the order of 10 mJ/cm3, and the diameter of the heat source is assumed to be in the order of 100 μm. The simulated time series of the acoustic signal is then applied to reconstruct the transverse distribution of femtosecond laser filaments with delay and sum (DAS) algorithm. Moreover, we also analyze the influence of performance parameters of ultrasonic transducers such as center frequency, bandwidth, surface size, and detection surface sensitivity on the reconstruction of filament cross-sectional images. The back-projection amplitude distribution profile along the y-axis is leveraged to compare the effect of image reconstruction.Results and DiscussionsAccording to the time series of ultrasound signals generated by monofilaments and multifilaments recorded at different detection distances, the frequency of monofilament and multifilament induced by femtosecond laser with multi-millijoule pulse energy is mainly concentrated within 4 MHz (Fig. 2). The signal spectrum of monofilament is single-peak structure, while the acoustic signal spectrum of multifilament is multi-peak structure (Fig. 2). The amplitude value of sound pressure signal decreases rapidly due to the attenuation of air. As the center of the optical filament deviates further from the scanning center, the cross-section image of the optical filament reconstructed by the back-projection (BP) algorithm and the DAS algorithm appears an obvious "elongated" phenomenon in the tangential direction (y-axis), which is the so-called "finite aperture effect" (Fig. 3). For monofilaments, the maximum energy amplitude decreases significantly with the increase in the center frequency of the transducer, which may be related to the filtering out of more low-frequency signals (Fig. 4). The same method is adopted to reconstruct the image of multifilament. It is found that the reconstructed multifilament image appears serious deformation with the multifilament center position deviating from the scanning center (Fig. 5). When x0=1.0 mm, the two monofilaments near the scanning origin side can still be distinguished, whereas the two monofilaments near the transducer side are fused and cannot be distinguished. Therefore, the secondary filaments around the multiple filaments are more susceptible to the "aperture effect" and the fuzzy deformation occurs. The fuzzy deformation effect will be more obvious when the distance becomes larger from the scanning center or the distance becomes smaller from the surface of the transducer. Therefore, compared with monofilament reconstruction, multi-filament image reconstruction is more affected by the "aperture effect". Especially, the blur deformation of the surrounding sub-filaments is more likely. In summary, the characteristics of the transducer have an obvious influence on the reconstruction of monofilament and multifilament cross-sectional images. A larger bandwidth of the transducer will cause a smaller surface diameter, a larger surface sensitivity parameter, and a better reconstruction quality of monofilament and multifilament images. The influence of the center frequency of the transducer on the optical fiber image reconstruction is very complicated. Therefore, it is necessary to select the transducer with the appropriate center frequency combined with the spectrum analysis of the acoustic signal in the actual measurement.ConclusionsWe utilize a novel medical imaging method named PAT to reconstruct cross-section images of femtosecond laser filament formed in an air medium. The results show that the acoustic signal induced by a single filament has a single-peak structure, while that induced by a multifilament has a multi-peak structure. The performance parameters of the transducer have an obvious influence on the reconstruction results. A larger bandwidth of the transducer will lead to a smaller surface diameter, a larger surface sensitivity coefficient, and a better reconstruction effect of energy deposition distribution of optical filament. Compared with monofilament, the reconstruction of the multifilament image is more susceptible to the "finite aperture effect". Our study can provide some theoretical support for the experimental measurement of the spatial deposited energy distribution of femtosecond laser filament transmission under real atmospheric conditions.
Jun. 25, 2024Vol. 44 Issue 12 1201011 (2024)
Qin Wang, Chen Cheng, Hailiang Shi, Xianhua Wang, Hanhan Ye, Xiongwei Sun, Feng Zhu, Shichao Wu, and Wei Xiong
ObjectiveAtmospheric aerosol particles refer to various solid, liquid, and solid-liquid mixed particles suspended in the atmosphere, with particle sizes generally ranging from 0.001 μm to 100 μm. These particles possess distinct physical and chemical properties that differ from other gas molecules in the atmosphere. As the concentration of aerosol particles in the atmosphere reaches certain thresholds, they exert a pronounced influence on radiation transmission. Moreover, the composition of aerosols undergoes conspicuous temporal and spatial variations, influenced by many factors such as aerosol source distribution, underlying surface composition, season, and meteorological conditions. To facilitate calculation and research, several typical aerosol models are usually given through systematic observation experiments, considering the two premises of aerosol composition and sampling area. These models provide very convenient data for radiative transfer calculations. However, different aerosol models have significant effects on radiative transfer and cannot be ignored. Therefore, accurately selecting an appropriate aerosol radiative transfer model under different circumstances is crucial.MethodsOur study is based on the AOD-AROD classification model and integrates it with atmospheric radiative transfer calculations. Using the above model based on MODIS aerosol data in typical areas from 2018 to 2022, the inter-annual patterns of aerosol model changes are calculated by month. We deeply explore the connections between meteorological elements, aerosol source locations, and aerosol models through the random forest method. A multi-temporal aerosol model judgment method is developed, considering the temporal changes of meteorological elements, thus improving the applicability and accuracy of the method. Backward trajectory analysis and atmospheric probability distribution fields are utilized for verification and optimization, enhancing the correlation between meteorological elements and aerosol models. Finally, the aerosol model judgment results are validated using TROPOMI’s surface radiance data to enhance the accuracy of atmospheric radiation transfer calculations.Results and DiscussionsBased on the AOD-AROD classification method and MODIS satellite data, the aerosol optical thickness data of the two bands are inputted into the AOD-AROD model. Using the aerosol optical thickness of 470 nm and the ratio of the aerosol optical thickness of the 470 nm and 660 nm bands, aerosols are divided into five types: dust, continent,subcontinent, biomass combustion,and urban industry. The aerosol model classification map of the Xianghe area from 2018 to 2022 is obtained, and statistical results for 2018 are shown in Fig. 7. In the random forest model, based on the specific meaning of various parameters and the characteristics of the training dataset in the Xianghe area, the corresponding parameters are adjusted in a targeted manner to achieve the highest accuracy of the data. Finally, 25% of the dataset is used to verify the judgment results of the random forest, and the predicted aerosol types are compared with the actual aerosol types. The comparison process is shown in Fig. 9. The accuracy of the final judgment model reached 69.11%.ConclusionsThrough a comprehensive analysis based on MODIS satellite data and the AOD-AROD aerosol model classification model, we summarize the interannual variation patterns of aerosol models in the study area. Random forest is effectively used to establish an aerosol-type judgment model, considering meteorological elements and aerosol source locations. By analyzing possible causes of model errors through backward trajectories, we compare random forest models in different phases to build a model that is most suitable for the study area. Simultaneously, we combine the analysis of backward trajectories and atmospheric transport probability distribution fields to further improve the accuracy of the model. The research results show that the accuracy of using this model to evaluate the aerosol model in the Xianghe area is 71.04%, and the average error rate of radiance simulation is reduced by 38.25%.
Jun. 25, 2024Vol. 44 Issue 12 1201012 (2024)
Hanhui Cao, Hongyao Chen, Liming Zhang, and Jiawei Li
ObjectiveThe atmospheric extinction coefficient can be measured to obtain essential information, such as particle spectrum distribution and chemical composition of aerosols. It has an important application value in atmospheric environment monitoring, visibility measurement, and outdoor testing of optoelectronic equipment. Solar radiometer is a high-precision atmospheric extinction coefficient measurement device. However, due to its passive measurement, solar radiometer finds it difficult to measure the extinction coefficient in low visibility and during nighttime. Lidar uses an active light source to measure the extinction coefficient, with a long detection distance and an ability to obtain the distribution of atmospheric extinction coefficient profiles. However, based on the principle of backscatter measurement, the extinction-to-backscatter ratio needs to be assumed, and the optimization effect of optical parameters affects its inversion results. Therefore, it is necessary to study the transmission extinction coefficient measurement method based on active light sources.MethodsThe visibility transmissometer is usually the most typically employed instrument when using active light sources for extinction coefficient measurement. It can be categorized into four types, namely, single end, double end, triple end, and variable baseline. The double-ended transmissometer places the transmitting and receiving devices at both ends of the baseline. However, this requires light source with a high stability and is easily affected by window pollution. The triple-ended transmissometer uses two receiving systems to measure the same radiation source on different atmospheric attenuation paths. Two receiving systems are assumed to have the same pollution and parameters. Therefore, the stability and high-precision measurement of the long-term system cannot be guaranteed. It is often used to expand the measurement range of the instrument. The single-ended transmissometer sets the transmitting and receiving devices at the same end of the baseline, while the other end uses an optical reflector to bend back the beam, making it easy to achieve synchronous measurement. It can eliminate the correlation of light source jitter and reduce the sensitivity of the system to window pollution, but it cannot avoid the influence of backward scattering. The variable-baseline transmissometer measures the same radiation source on multiple different atmospheric attenuation paths using the same receiving device. This reduces the influence of lens pollution, environmental changes, and other factors, consequently improving the measurement accuracy of the instrument. Therefore, this paper analyzes the advantages and disadvantages of various methods to conduct research on a multiband extinction coefficient measurement using halogen lamps as radiation sources based on the variable-baseline measurement method. Quantitative analysis was conducted on the signal resolution, noise characteristics, dynamic range, random noise, response temperature sensitivity, and background radiation of the photoelectric detection circuit. Basic parameters, such as detection photocurrent, movement distance, measurement duration, and sampling rate, were established. Quantitative analysis was then conducted on the performance characteristics of three typical signal processing methods (least squares method, spectrum peak search method, and sampling integration method) in synchronous and quasi-synchronous measurements. The results confirmed the advantages of the spectrum peak search method and the sampling integration method in quasi-synchronous measurement. The spectrum peak search method can reduce the measurement errors caused by spectral differences at both ends compared with the commonly used phase-locked amplification technology. Moreover, it does not require reference signals from the transmitting unit and has strong independence and a wider application range. The results provide a theoretical basis for achieving high-precision extinction coefficient measurement through a variable-baseline method.Results and DiscussionsThis paper analyzes the impact of photoelectric measurement from four aspects. In the analysis of the system detection circuit, starting from the extinction coefficient resolution and measurement range, the photocurrent demand and the range of researchable movement distance were established, and the reliability of the circuit was ensured through noise characteristic analysis. In the analysis of digital signal processing methods, the application of three typical signal processing methods (least squares method, spectrum peak search method, and sampling integration method) in transmissometers was studied. It was found that the least squares method is more suitable for synchronous measurement, while the spectrum peak search method and the sampling integration method are more suitable for quasi-synchronous measurement. Based on this, the measurement time and sampling rate of each point were established, and a preliminary evaluation of the accuracy of extinction coefficient measurement affected by random noise was completed. In the analysis of background radiation impact, the system can suppress the changes in background radiation. Furthermore, in the analysis of the influence of environmental temperature and humidity, the advantages of multi-baseline measurement in resisting environmental temperature and humidity changes were confirmed, but the temperature impact cannot be ignored yet.ConclusionsThis paper studies a multi-baseline and multiband atmospheric extinction coefficient measurement method. The development of the system detection circuit is completed based on the requirements of extinction coefficient resolution and measurement range. By analyzing the influence of random noise on transmittance measurement, the least squares method is shown to be more suitable for synchronous measurement, while the spectrum peak search method and the sampling integration method are both suitable for quasi-synchronous measurement. By studying the influence of environmental temperature and humidity on transmittance measurement, the advantages of multi-baseline measurement in resisting environmental interference were confirmed in practice. At the same time, the detection circuit system cannot completely avoid the influence of environmental temperature and background radiation. The research results indicate that the detection photoelectric current should not be less than 1.27×10⁻⁷ A, the distance of each movement should not be less than 1 m, the duration of each measurement point should not be less than 40 s, and the sampling rate should not be less than 10 kHz. During the current research baseline distance of 5-20 m, the spectrum peak search method or the sampling integration method used for quasi-synchronous measurement can achieve an extinction coefficient measurement accuracy <0.8% as affected by random noise.
Jun. 25, 2024Vol. 44 Issue 12 1201013 (2024)
Yanqing Xie, Deshuai Yuan, Cheng Fan, Liguo Zhang, Tianye Wang, Wei Liang, Qianxun Xiao, Miaomiao Zhang, Yuan Wen, Yunduan Li, and Zhengqiang Li
ObjectiveThe FengYun (FY)-3G satellite is China’s first meteorological satellite in a low-inclination orbit, and the medium resolution spectral imager-rainfall mission (MERSI-RM) is one of its primary payloads. Due to the unique overpass times of FY-3G compared to most polar-orbiting meteorological satellites, such as FY-3D and Terra, the precipitable water vapor (PWV) data derived from FY-3G/MERSI-RM is critical for studies on weather systems and climate change. However, there is currently a lack of accessible MERSI-RM PWV data. To address this issue, we develop a semi-empirical PWV retrieval algorithm for the near-infrared (NIR) channels at 0.865 and 0.940 μm from FY-3G/MERSI-RM.MethodsThe relationship between the natural logarithm of the water vapor absorption transmittance (WVAT) in the NIR water vapor absorption (WVA) channel and the slant column water vapor content along the sun-earth-satellite path is closely correlated and can be expressed by a quadratic equation. The NIR PWV retrieval model for MERSI-RM is established based on this correlation. Initially, average ground-based PWV data from the Aerosol Robotic Network (AERONET) obtained within a 30-min window of satellite transit are matched with the average MERSI-RM data within a 10 km×10 km area centered on the ground stations. Subsequently, the three coefficients of the quadratic equation are solved based on these matching results, completing the construction of the MERSI-RM PWV retrieval model. To ensure that AERONET PWV data can be used both for establishing the PWV retrieval model and for the quality assessment of the retrieval results, the matching data are divided into two independent sets based on the locations of the ground stations: data from the eastern hemisphere are used to construct the MERSI-RM PWV retrieval model, while data from the western hemisphere are used to validate the MERSI-RM PWV retrieval results.Results and DiscussionsValidation results using ground-based data show that the root mean square error (RMSE) and relative error (RE) of MERSI-RM PWV data, developed using the semi-empirical algorithm, are 0.20 cm and 0.10, respectively. In contrast, the RMSE and RE of MERSI-RM PWV data, developed using the traditional retrieval algorithm based on a radiative transfer model, are 0.35 cm and 0.15, respectively. Meanwhile, the RMSE and RE of MODIS PWV data are 0.57 cm and 0.39, respectively. Compared to MODIS PWV data, MERSI-RM PWV data, developed based on the semi-empirical algorithm, exhibit a 65% reduction in absolute error and a 74% reduction in relative error. Given that MODIS PWV data are widely acknowledged for their high accuracy, it can be concluded that the MERSI-RM PWV data developed using the semi-empirical algorithm also exhibit high accuracy. In comparison to MERSI-RM PWV data developed using the retrieval algorithm based on a radiative transfer model, the absolute error of the MERSI-RM PWV data derived using the semi-empirical algorithm is reduced by 43%, while the relative error is reduced by 33%. The lower accuracy observed in MERSI-RM PWV data and MODIS PWV data developed based on the radiative transfer model is primarily attributed to noticeable systematic errors. In contrast, the MERSI-RM PWV data obtained using the semi-empirical algorithm do not exhibit this issue. The success of the semi-empirical algorithm is attributed to its PWV retrieval model, which is constructed based on matching results between satellite observations and ground-based data. In other words, the errors in satellite observations are considered in the retrieval model. To provide a more comprehensive evaluation of the semi-empirical algorithm and offer additional choices for model construction methods, we also assess the PWV retrieval model constructed based on randomly allocated data. Validation results based on ground-based data show that the retrieval accuracy of the model constructed using randomly allocated data is equivalent to that of the retrieval model constructed using data obtained from the eastern hemisphere.ConclusionsWe introduce a semi-empirical PWV retrieval algorithm tailored specifically for FY-3G/MERSI-RM. This algorithm effectively tackles the current challenge of unavailable PWV data from FY-3G satellite observations. It does not rely on complex radiative transfer models but instead utilizes a quadratic equation, resulting in remarkably efficient PWV retrieval. Compared to traditional methods based on radiative transfer models, this semi-empirical approach achieves notably higher retrieval accuracy. The errors in MERSI-RM PWV data, obtained using the algorithm, are reduced by at least 33% compared to those derived from models based on radiative transfer. Moreover, when contrasted with the widely utilized MODIS official PWV data (MOD05), this semi-empirical algorithm diminishes errors in MERSI-RM PWV data by a minimum of 65%. These results underscore the high accuracy and efficiency of the semi-empirical PWV retrieval algorithm for MERSI-RM, making it suitable for large-scale PWV data development.
Jun. 25, 2024Vol. 44 Issue 12 1201014 (2024)
Yichao Hou, Xianlong Meng, Pu Zhang, Aozhou Zheng, and Cunliang Liu
ObjectiveThe primary obstacle currently impeding the widespread adoption of laser wireless power transmission (LWPT) lies in the challenge associated with long-distance power transport and efficient conversion. As laser beams propagate through the atmosphere, they produce a series of linear and nonlinear effects. The energy carried by the laser is absorbed or scatted by atmospheric gas molecules and aerosol particles. Atmospheric turbulence induces light intensity fluctuation, beam jitter, beam spreading, and variation of arrival angle. The light field at the receiving end is directly influenced. The receiving end is generally composed of multiple photovoltaic cells in series and parallel, and its output characteristics are directly affected by the light field. At the same time, a portion of the laser energy is converted into electrical energy, while the rest is converted into heat energy, influencing the temperature distribution at the receiving end. The light field, electric field, and heat transfer characteristics of the LWPT receiving end interact and constrain each other. Therefore, studying the multi-field coupling characteristics of photovoltaic cells at the receiving end is meaningful. Our study provides a reference for the design and optimization of LWPT systems.MethodsWe utilize an LWPT experimental platform to obtain the output characteristics of photovoltaic cells. The data is processed through multiple nonlinear regression to obtain the undetermined coefficients C1, C2, and C3, series resistance Rs, and ideality factor n in the I-V equation. The fitting results closely align with the experimental data. Beer’s law is used to compute the transmission efficiency of three different laser wavelengths through the atmosphere. The power spectrum inversion method is used to simulate the light field distribution in front of the receiving end under different turbulence structure constants, and the light field distribution is used as the source to solve the partial differential equation using finite element analysis software to obtain the multi-field coupling characteristics of photovoltaic cells.Results and DiscussionsWe establish an LWPT experimental platform to measure the output characteristics of photovoltaic cells within a specific irradiance range. Multivariate parameter regression is performed using I-V data to obtain equation coefficients, series resistance, and ideality factors. The fitting results closely align with the experimental data, with a fitting variance of 0.996 (Fig. 8). The transmission efficiency of three commonly used laser wavelengths, namely 532 nm, 808 nm, and 1060 nm in the atmosphere, is calculated. It is observed that the transmission efficiency exponentially decays with the increase in transmission distance. Furthermore, under equivalent transmission distances, shorter laser wavelengths exhibit greater attenuation degrees (Fig. 9). The power spectrum inversion method is used to simulate the light field distribution in front of the receiving end under different turbulence structure constants, and the light field distribution is used as a source term to calculate the multi-field coupling characteristics at the receiving end. Atmospheric turbulence causes distortions of light spots at the receiving end, with stronger turbulence resulting in more disorderly light spots, and even fragmentation is observed (Fig. 13). The potential, current density, and temperature at the receiving end are positively correlated with the surface irradiation intensity, but the surface potential distribution trend is not affected, showing an overall trend of weak on both sides and strong at the center (Fig. 14). The I-V and P-V characteristic curves, open circuit voltage, short-circuit current, and photoelectric conversion efficiency of photovoltaic cells under three different turbulence intensities are calculated. The strength of turbulence directly affects the output characteristics of photovoltaic cells. As turbulence intensifies, the maximum power is 0.075 W, 0.031 W, and 0.021 W, respectively. The photoelectric conversion efficiency decreases slightly but overall remains around 15%, specifically 15.85%, 14.82%, and 14.34%, respectively (Table 7).ConclusionsWe investigate the impact of the atmospheric environment on the multi-field coupling characteristics of photovoltaic cells in actual conditions by establishing an LWPT experimental platform, constructing both an atmospheric turbulence transmission model and a multi-physical field model at the LWPT receiving end. The results show that during the atmospheric transmission of laser, the efficiency of atmospheric transmission of laser beams experiences exponential decay with increasing transmission distance, eventually converging to zero. Key determinants of atmospheric attenuation include laser wavelength, altitude, climate type, visibility, and other pertinent factors. At the same time, atmospheric turbulence can cause phase distortion of the laser beam, leading to uneven, disordered, and even fragmented light fields at the receiving end. The irradiation intensity is closely related to the surface current density and temperature distribution of photovoltaic cells, which in turn changes the output characteristics of photovoltaic cells. When the turbulence intensity increases, the photovoltaic conversion efficiency, and the photovoltaic cells output performance are impaired.
Jun. 25, 2024Vol. 44 Issue 12 1201015 (2024)
Zixuan Xing, Lin Lu, Peng Xiang, Weiheng Dai, Jilin Zheng, and Rong Xu
ObjectiveCompared with traditional global satellite navigation systems and fiber-optic time transfer techniques, satellite time transfer based on free-space laser links has higher accuracy and better flexibility, making them widely applicable. However, they are not capable of meeting the timing needs of a large number of users with uncertain positions and lacking precise bi-directional alignment abilities in real life. In this article, we propose a unidirectional Beidou time transfer scheme based on laser links which adopts the terminal user unidirectional timing scheme in the Beidou/GPS navigation system. The proposed scheme combines the flexibility of a unidirectional timing mechanism and the high-precision of laser link based satellite timing systems. However, one of the factors that restrict the performance of this laser link based Beidou unidirectional time transfer is the timing deviation introduced by atmospheric refraction experienced by the laser transmission. Our study focuses on the influence of atmospheric refraction on the laser link, which causes unidirectional timing deviation. The results can pave the way for our future research in correcting the timing deviation and improving the time transfer accuracy and, in turn, promote the development of satellite-to-earth laser link based unidirectional time transfer.MethodsIn our study, several typical climate representative cities are chosen and the atmospheric refractive index models are established using the monthly average and daily basic observation meteorological data provided by the China Meteorological Data Service Centre (CMDC). Then, with the help of the precise ephemeris data from the International GNSS Service (IGS) data center of Wuhan University, the Beidou satellites are screened, and then the timing deviation caused by atmospheric refraction is computed using the laser signal transmission model and pseudo-range measurement equations. Using this method, the influence of satellite orbit parameters on the unidirectional timing deviation caused by the atmospheric refraction is simulated and studied. Then, the comprehensive impact of satellite orbit parameters and atmospheric conditions on the unidirectional timing deviation is analyzed. Finally, by comparing the differences between the above two results, the magnitude of the impact of atmospheric condition changes on the unidirectional timing deviation is analyzed.Results and DiscussionsWhen the monthly average atmospheric refractive index layered model is used, the overall impact of atmospheric refraction on the unidirectional timing deviation fluctuates in the order of tens of nanoseconds (Fig. 4, Table 1), with a timing deviation of about 15.97-42.46 ns. For a specific ground station, the fluctuation of timing deviation is greatly affected by the orbit parameters of the Beidou satellites, and the timing deviation increases with the increase of the ground station’s zenith angle to the satellites. For different ground stations, we find that the fluctuation of timing deviation is influenced by the position of the ground stations as well as the orbit parameters of the Beidou satellites. For example, the relatively high ground station position of Lhasa station results in smaller timing deviations and fluctuations. When using the measured daily atmospheric refractive index layered model, the overall impact of atmospheric refraction on the unidirectional timing deviation still fluctuates in the order of tens of nanoseconds (Fig. 5, Table 2) and the timing deviation range is about 15.88-42.34 ns. Comparing the difference between the two timing deviation results acquired based on the monthly average and the measured daily atmospheric refractive index layered models (Fig. 6), we can see that the maximum difference in timing deviation calculated based on the two models does not exceed 0.5 ns. Besides, the impact of daily meteorological conditions on the unidirectional laser Beidou timing deviation caused by atmospheric refraction is on the order of 100 ps, which is much smaller compared with the influence of Beidou satellite orbit parameters.ConclusionsWe study the timing deviation caused by atmospheric refraction in the laser link based Beidou unidirectional time transfer and propose a method to compute the timing deviation caused by the atmospheric refraction. Then the timing deviation caused by atmospheric refraction is computed and analyzed based on the proposed method and the IGS data in several reprehensive cities in China. The results show that the unidirectional timing deviation caused by atmospheric refraction in the laser link based Beidou time transfer is on the order of 10 ns. The timing deviation calculated using the monthly average atmospheric refractive index model fluctuates between 15.97 ns and 42.46 ns, while the timing deviation calculated using the measured daily atmospheric refractive index model fluctuates between 15.88 ns and 42.34 ns, which is much smaller than the time deviation caused by the ionosphere on the microwave link based Beidou time transfer. The comparison between the timing deviations acquired based on the two atmospheric refractive index layering models shows that the difference between the timing deviation caused by atmospheric refraction computed based on these two models is on the order of 100 ps. Additionally, compared with the impact of Beidou satellite orbit parameters on the timing deviation, the impact of meteorological condition induced atmospheric refraction is much smaller. Based on our study, it is expected that the unidirectional timing deviation caused by the atmospheric refraction in the laser link based Beidou time transfer can be predicted and corrected based on the comprehensive use of precise satellite orbit parameters and atmospheric refraction data modeling. Also, it is predicted that the timing deviation can be possibly reduced to be on the order of picoseconds.
Jun. 25, 2024Vol. 44 Issue 12 1201016 (2024)
Xie Wang, Gaofang Yin, Nanjing Zhao, Xiang Hu, Peng Huang, Mingjun Ma, Min Xu, Tingting Gan, Ruifang Yang, Li Fang, Xiaoling Zhang, Xiang Wang, and Zhao Cheng
ObjectiveIn planktonic community within the range of 10-50 μm, the predominant biological population is typically composed of phytoplankton, which are the primary producer in aquatic ecosystems. Phytoplankton plays a crucial role in aquatic ecological monitoring and serve as key indicators of algal bloom outbreaks in eutrophic water bodies. Simultaneously, it is a significant parameter to mitigate the invasion of alien species. The International Convention for the Control and Management of Ships’ Ballast Water and Sediments specifies that the discharge standard for ship ballast water is a phytoplankton live cell density of <10 cells·mL-1. Therefore, rapid detection of phytoplankton live cell density is vital for early warning of algal blooms in eutrophic waters and compliance testing for ballast water. Traditional chlorophyll variable fluorescence methods do not require complex preprocessing, enabling rapid estimation of live algal cell numbers. However, cell density does not solely determine the fluorescence intensity of live algal cells, which is intricately linked to the type, size, and growth cycle of individual algal cells. Consequently, it is not feasible to rely solely on variable fluorescence intensities to precisely predict live algal cell numbers. The most recent research introduces a variable fluorescence statistical analysis method that calculates the central frequency B of the Fv value of live algal cells to estimate their density. This method overcomes the impact of individual differences in live algal cell characteristics and provides accurate measurements of live algal cell densities below 200 cells·mL-1. Nevertheless, the increase in live algal cell density leads to noticeable changes in the Gaussian distribution of the Fv dataset, the larger the density of live algal cell is, the steeper the Gaussian distribution curve is. The changes in central frequency B have not received sufficient attention; however, the variable fluorescence statistical analysis method exhibits significant deviations in the measurement results for live algal cell density above 200 cells·mL-1. Considering these challenges, this paper proposes a method of dynamically adjusting the interval gain coefficients based on the variable fluorescence statistical analysis method.MethodsThis study first conducts experiments with different algal species to explore the relationship between the central frequency B and interval gain coefficient a. Subsequently, the experimental results are validated through a self-constructed experimental system, and comparisons are performed with the original variable fluorescence statistical analysis method and the microscopic analysis method. This study aimed to verify whether the proposed method enhances the detection upper limit while ensuring the trace detection of live algal cells. Four algal species, Chlorella pyrenoidosa, Selenastrum capricornutum, Scenedesmus obliquus, and Dunaliella salina, were selected as experimental subjects. The system comprises sample processing, fluorescence excitation and collection, and signal acquisition and processing modules (Fig. 2). The linkage between the sample pool and stirring device enables random and uniform sampling, while the coordinated operation of the three-way solenoid valve and peristaltic pump ensures precise injection and drainage of the samples. A monochromatic high-brightness laser diode (LD), combined with a vertical orthogonal optical path, efficiently and stably excites and collects the fluorescence of algal cells. Finally, the use of photomultiplier tubes and a high-speed AD(Analog to digital) acquisition circuit allows for high signal-to-noise ratio acquisition of weak algal cell fluorescence signals.Results and DiscussionsThis study introduces a variable fluorescence statistical distribution detection method with dynamically adjusted interval gain coefficients based on the variable fluorescence statistical analysis method. Random sampling measurements and statistical analysis of the variance σ2 of variable fluorescence values were conducted to analyze the relationship between the variance σ2of variable fluorescence values for samples with different cell densities and the interval gain coefficient a (Fig. 4). Subsequently, this study establishes a dynamic adjustment method for interval gain coefficients that enables accurate counting of live algal cell density over a wide range of cell densities. The experimental results demonstrate that this method achieved a detection upper limit of 4640 cells·mL-1 for Selenastrum capricornutum, an increase of nearly 200 times that of the original method (Fig. 5). The detection results for Chlorella pyrenoidosa, Selenastrum capricornutum, Scenedesmus obliquus, and Dunaliella salina show high consistency with microscopic examination results, with correlation coefficients R2 exceeding 0.999 and absolute values of relative errors below 20.00% (Fig. 6). In conclusion, accuracy assessments of mixed algal densities were conducted for two algal species, Peridinium umbonatum and Selenastrum capricornutum, which exhibited substantial differences in single cell variable fluorescence(SCVF) across three distinct densities. The detection results show a high degree of consistency with microscopic examination results, with absolute relative errors consistently below 20.00% (Fig.7).ConclusionsExisting live algal cell density detection methods currently face challenges in achieving precise counting for both high and low densities. Variable fluorescence statistical analysis can achieve accurate counting of low-density live algal cells; however, its detection range is limited, making it challenging to accurately detect live algal cell density in natural water bodies or during algal blooms. This study proposed a variable fluorescence statistical distribution detection method with dynamically adjusted interval gain coefficients based on this limitation. This method characterizes the relationship between the sample variance σ2 of the Fv mean value and interval gain coefficient a to accurately count the live algal cell density over a wide range of cell densities. Results from tests on four algal species, Chlorella pyrenoidosa, Selenastrum capricornutum, Scenedesmus obliquus, and Dunaliella salina, show that the original variable fluorescence statistical analysis method maintains basic consistency with microscopic examination results only in the low-density domain, with significant deviations in high-density measurements, reaching a maximum absolute relative error of 81.59%. In contrast, the proposed variable fluorescence statistical distribution detection method demonstrated high consistency with microscopic examination results at high and low densities within 5×10³ cells·mL-1. The correlation coefficients R2 were all above 0.999, and the absolute values of relative errors were below 20.00%. The upper measurement limit of this method meets the requirements for algal density detection in natural water bodies and algal bloom warnings (2×10³ cells·mL-1). Simultaneously, for samples with low cell densities, the proposed method ensures the measurement accuracy inherent in the original variable fluorescence statistical analysis. Relative errors in the measurement of algae with low cell densities consistently remained below 20.00%. The experimental results from mixed algae indicate that within the experimental system, the proposed method allows us to disregard the variable fluorescence masking phenomenon of high SCVF algae on low SCVF algae. Moreover, the proposed method enables direct measurement of live algal cell density in mixed cultures, and the density calculated using the proposed method maintains a high level of consistency with microscopic examination density, with relative errors consistently below 20.00%. The proposed method reduces the detection speed of the system and increases the algorithm complexity. It not only preserves the accuracy of traditional methods for low-density detection but also enhances the detection upper limit. Moreover, it can be applied for the direct measurement of mixed algal species, significantly improving the robustness and expanding the application potential of the system.
Jun. 25, 2024Vol. 44 Issue 12 1201017 (2024)
Kaijie Lai, Lingbing Bu, Qin Wang, Zhihua Mao, Khalid Muhammad Burhan, Chuncan Fan, Jiqiao Liu, Weibiao Chen, and Shaohua Zhao
ObjectiveCarbon dioxide (CO2), a prevalent greenhouse gas, affects the radiation and energy budget of the earth-atmospheric system. The continuous increase in CO2 concentration has intensified the greenhouse effect globally. Accurate monitoring of CO2 concentration is crucial for studying the carbon cycle and greenhouse effect. Traditional ground-based atmospheric CO2 detection approaches, although highly accurate and reliable, lack consistent monitoring approach and the capacity to detect on a large-scale, worldwide, or regional basis. Remote sensing retrieval methods based on satellite platforms can provide long-term CO2 observation data globally. Nevertheless, passive remote sensing satellites were used for greenhouse gas space-based observation platforms in the past. Because of solar light source limitations, passive satellites can not be used to detect during night time as well as in polar regions. On 16 April, 2022, the spaceborne Integrated Path Differential Absorption (IPDA) lidar was successfully launched with the Atmospheric Environment Monitoring Satellite (DQ-1). A year ago, the IPDA lidar has been operating to achieve full day carbon dioxide column concentration (XCO2) observations globally with high precision and accuracy. As clouds and aerosols cause potential errors using satellite detection of near surface CO2, it is essential to verify the accuracy of XCO2 data products acquired by the satellites. We conduct the verification and application of data based on IPDA lidar observations. The analysis results demonstrate crucial data support for researchers to track carbon sources and sinks by fully describing that IPDA lidar can track variations in anthropogenic CO2 emissions over time and space and meets the 1×10⁻⁶ precision design criterion.MethodsIn combination with the European Center for Medium-Range Weather Forecasts (ECMWFs) atmospheric reanalysis dataset (ERA5) and the latest version (2020 version) of HITRAN data, XCO2 was obtained through inversion of IPDA lidar observation data. We validate the inversion results using data products from the Total Carbon Column Observing Network (TCCON), the Orbiting Carbon Observatory-2 (OCO-2) satellite, and the CarbonTracker. Additionally, we demonstrate the detection accuracy of IPDA lidar at different resolutions.Results and DiscussionsThe comparison between XCO2 and TCCON data, obtained through the inversion of IPDA lidar observation data, shows a high level of fitness described in terms of an R2 value of 0.952, and the root mean square error (RMSE) value of 0.584×10⁻⁶ (Fig. 3). When compared to OCO-2 satellite and CarbonTracker mode, the data of IPDA lidar and TCCON exhibit a higher degree of consistency (Figs. 4 and 7), indicating that IPDA lidar provides more precise and accurate global XCO2 observations. Furthermore, analysis of detection accuracy at a spatial resolution of 50 km over land and 100 km over the ocean reveals that IPDA lidar meets the 1×10⁻⁶ (Fig. 9) accuracy requirement. Thus, IPDA lidar can support research on carbon sources and sinks with high accuracy.ConclusionsTo verify the observation performance of the spaceborne IPDA lidar, we use data products from TCCON sites passed by the IPDA lidar to validate its inversion results. The results show that the inversion data align well with TCCON data, exhibiting an average deviation of 0.3×10⁻⁶, a strong correlation with an R2 value of 0.952, and a root mean square error (RMSE) of 0.584×10⁻⁶. To comprehensively assess accuracy of IPDA lidar data, the XCO2 inversion results were compared with data products from the Orbiting Carbon Observatory-2 (OCO-2) satellite and CarbonTracker. The results indicate that the findings of IPDA lidar correspond more closely with the TCCON data products than those from OCO-2 and CarbonTracker, demonstrating the ability of the IPDA lidar to deliver more accurate global XCO2 data. Additionally, we analyze global XCO2 observations from June to September 2022 at different spatial resolutions. The data indicate a clear seasonal and latitudinal variation, with global XCO2 values gradually decreasing from June to August, reaching a minimum in August, and then increasing in September. This trend is closely related to changes in global vegetation cover, population density distribution, and other factors. There are also significant differences between land and ocean areas and in regions of intense emissions. In the analysis of detection accuracy of IPDA lidar, a single-pass averaging method was employed, with spatial resolutions of 50 km over land and 100 km over the ocean. The detection accuracy for land ranged from 0.80×10⁻⁶ to 0.82×10⁻⁶, and for the ocean, it ranged from 0.76×10⁻⁶ to 0.78×10⁻⁶, both meeting the required 1×10⁻⁶ detection accuracy. The spaceborne IPDA lidar possesses unique advantages of high spatial and temporal resolution with high detection accuracy, enabling precise monitoring of ground carbon sources. In conclusion, the spaceborne IPDA lidar provides significant data support for the study of carbon sources and sinks.
Jun. 25, 2024Vol. 44 Issue 12 1201018 (2024)
Minghua Cao, Qinxue Sun, Ruifang Yao, Yue Zhang, Xia Zhang, Kejun Jia, and Huiqin Wang
ObjectiveThe commercialization of the fifth-generation (5G) mobile communication industry has escalated the demand for efficient and cost-effective application technologies. The faster-than-Nyquist (FTN) transmission technology in coherent optical wireless communication systems has caught significant attention due to its high signal transmission rate and channel capacity enhancement capabilities. However, the receiving terminal of the coherent optical system exhibits a high level of complexity, with performance significantly influenced by turbulence-induced phase noise and inter-symbol interference (ISI) introduced by FTN. Therefore, it is imperative to conduct studies on low-complexity optimization algorithms to address these challenges. In this regard, a blind equalization scheme for FTN quadrature phase shift keying (QPSK) coherent optical wireless communication signals under exponential Weibull channels has been devised. This scheme optimizes the signal processing algorithm at the receiving end to minimize complexity costs. A novel algorithm named TS-DFE-CMA has been proposed to integrate decision-feedback equalization (DFE) into a constant modulus algorithm (CMA), thereby enhancing system resilience against various disturbances. Additionally, employing a two-step (TS) approach enhances step coefficient selection and transformation methods to control computational complexity, with improved system performance. Simulation results demonstrate that the proposed algorithm mitigates signal distortion caused by FTN ISI and turbulence effects.MethodsThe transmitted signal undergoes QPSK mapping, FTN shaping filtering, and digital-to-analogue conversion at the transmitter. It is then split into two orthogonal signals of I and Q, which are transmitted by an optical antenna into a turbulent channel following an exponential Weibull distribution model. The received optical signal is subjected to zero-phase coherent detection using a 90° mixer, followed by analogue-to-digital conversion. Subsequently, signal processing techniques such as equalization and phase recovery are applied to obtain the demodulated decision output signal. In the signal processing module, the CMA algorithm is employed to recover the amplitude information of the signal. To address the phase insensitivity drawback of the CMA algorithm, we utilize a cascaded Viterbi-Viterbi phase estimation (VVPE) device for compensating phase noise. Improvements have been made to this algorithm, including adopting TS step-size optimization and selecting an initial step-size coefficient corresponding to minimum error vector magnitude (EVM) for achieving rapid convergence. Once the EVM curve stabilizes, a smaller step-size coefficient is adopted to enhance convergence accuracy towards reaching the optimal solution of function and reduce steady-state value during convergence. Furthermore, to further compensate for strong nonlinear interference and signal distortion caused by turbulent channels, we introduce the decision feedback equalizer structure into the objective function update process of the constant modulus equalization algorithm replacing a single filter with two filters, with one for feedforward and another for feedback. The output from the feedback filter predicts and eliminates interference introduced by preceding symbols.Results and DiscussionsThe proposed algorithm is evaluated by simulation and compared with three algorithms of DFE-CMA, TS-CMA-VVPE, and CMA-VVPE. The results indicate that the proposed algorithm outperforms the other three algorithms in terms of bit error rate (BER) performance in weak and moderate turbulence conditions (Fig. 8). According to the EVM curves for the four different algorithms, EVM values are better at weak turbulence than those at medium turbulence. Furthermore, the proposed TS-DFE-CMA algorithm yields optimal EVM performance in both weak and medium turbulence conditions (Fig. 9). In comparison to the TS-CMA-VVPE algorithm, the proposed algorithm improves BER performance by 18.37% and EVM performance by 4.74% under weak turbulence (Table 2). Additionally, it is demonstrated that the proposed algorithm performs better than the TS-CMA-VVPE algorithm in mitigating FTN ISI effects. However, after reducing the FTN acceleration parameter to 0.7, it is found that BER fails to meet the threshold requirement for forward error correction (Fig. 10). Meanwhile, at FTN acceleration factors of 1.0, 0.9, and 0.8 respectively (Table 3), compared to the TS-CMA-VVPE algorithm, the proposed algorithm improves BER performance by 15.62%, 16.071%, and 9.07%, and EVM performance by 4.72%, 6.49%, and 3.81%. Additionally, the TS-DFE-CMA algorithm exhibits a more favorable convergence of signal constellation diagram (Fig. 11). Simulation results confirm that algorithms incorporating decision feedback processes perform well in mitigating turbulent effects and FTN ISI. Furthermore, the proposed algorithm demonstrates the fastest convergence speed with optimal equalizer performance (Fig. 12). Furthermore, the complexity of the TS-optimized algorithm is effectively controlled (Table 4).ConclusionsThe proposed algorithm TS-DFE-CMA enhances the convergence speed and error performance of the equalizer by employing a TS step optimization method. This is crucial for handling the demand in FTN-QPSK coherent optical wireless communication systems for signal phase noise recovery and ISI cancellation in exponential Weibull channels.
Jun. 25, 2024Vol. 44 Issue 12 1206001 (2024)
Bing Lu, Kang Chen, Weigang Hou, Yifan Bai, Jiaxin Zhang, and Lei Guo
ObjectiveMicrowave photonic technology has an important potential in future high-speed microwave/millimeter-wave communication systems due to its large bandwidth, low loss, and immunity to electromagnetic interference. However, due to the inherent cosine response of the electro-optic modulators, the output signals of the broadband multi-carrier microwave photonic link (MPL) will suffer from nonlinear distortions, mainly including harmonic distortions (HD), cross-modulation distortion (XMD), and third-order intermodulation distortion (IMD3). Since HD can be filtered out by a suitable filter, the XMD and IMD3 are the main factors limiting the system performance. We build a nonlinear distortion model for in-band third-order IMD3 and out-of-band XMD compensation of a broadband MPL. Despite various optical and electrical methods are proposed to compensate for the IMD3, few methods can quickly compensate for both XMD and IMD3 of a broadband MPL spontaneously. Thus, a nonlinear distortion model is presented for compensating the in-band IMD3 and out-of-band XMD in the wideband MPL. This method does not require priori parameters of the system and signals, and a complicated training and iterative optimization process, which is more practical.MethodsWe provide a nonlinear distortion model for a broadband multi-carrier MPL. Firstly, due to large frequency differences between the HD signal and the fundamental frequency signal, the HD signal can be easily filtered by a digital filter. Then, the XMD and IMD3 signals are extracted, which are the opposite sign to the fundamental frequency signal. Thus, it is easy to obtain that the cubic power of the XMD and IMD3 signals is also the opposite sign of the fundamental frequency signal. Based on the characteristic, a cost function with a closed-form solution can be constructed, where an optimal linearization coefficient is obtained quickly and adaptively. Finally, this optimal linearization coefficient is introduced to compensate the XMD and IMD3 simultaneously in the digital domain.Results and DiscussionsSimulation experiments are built to verify the performance of XMD and IMD3 suppression. Figure 2 shows the signal spectra before and after linearization as two-tone signals are received. The XMD and IMD3 are suppressed by more than 35 dB and 29 dB respectively. The power of the fundamental frequency signal is found to remain unchanged, but the power of the XMD term increases linearly with the slope change of 2 (Fig. 3). Additionally, after compensation by the proposed algorithm, all the XMDs are suppressed below the noise and the compensation effect does not decrease with the increasing input fundamental signal power. As the power of the input fundamental signal increases, the powers of the fundamental signal and the IMD3 signal of the pre-compensation in-band signal rise linearly with slopes of 1 and 3 respectively. Meanwhile, the power of the XMD term after linearization increases linearly at a slope of 5. The spurious-free dynamic range of the compensated system is improved by more than 21.5 dB (Fig. 4). According to the simulation experiment, after algorithmic compensation, the error vector magnitudes (EVMs) of single-carrier orthogonal frequency division multiplexed signal (OFDM) and multi-carrier OFDM signals are optimized by 6.1% and 5.9% respectively (Figs. 6 and 7). As multi-carrier OFDM signals with different Vpp are input (Fig. 8), the best compensation effect is at 1 V, and the EVM is optimized by 7.2%.ConclusionsA nonlinear distortion model is presented for the XMD and IMD3 generated in a broadband multi-carrier MPL. Then based on the characteristic that the XMD and IMD3 signals have the opposite sign to that of the fundamental frequency signals, the out-of-band XMD and the in-band IMD3 can be suppressed. Compared with the traditional XMD and IMD3 compensation methods, this method does not require priori parameters of the system and signals, and a complicated training and iterative optimization process. Simulation results show that the XMD and IMD3 are suppressed by more than 35 dB and 29 dB respectively, and the spurious-free dynamic range is improved by about 22 dB as the multi-tone signal is transmitted. When a multi-carrier OFDM signal is transmitted, the EVM of the signal is optimized from 8.1% to 2.2%.
Jun. 25, 2024Vol. 44 Issue 12 1207001 (2024)
Delong Liu, Wenbo Yang, Ming Liu, and Jiannan Sun
ObjectiveThe observation of space objects under the sky survey mode requires a wide field of view, which benefits the acquisition of the objects of interest and also provides us with long observable arcs for their precise orbit determination. Meanwhile, with the continuously improving scientific complementary metal oxide semiconductor (sCOMS) processing and integration, data processing of massive high-resolution images including astronomical positioning of space objects has become notably challenging for the timely objects’ detection and following observation deployment. Star map matching, especially for a large amount of stars in wide-field-of-view images, is the most time-consuming procedure in astronomical positioning. Obvious edge effects in wide-field-of-view image processing can lower the calculation accuracy. Thus, we adopt the method of gradually increasing the center localization of the images for programming acceleration and then employ three-order plate constants fitting to reduce the positioning error of the objects observed in the edge localization in wide-field-of-view observations.MethodsAfter selection and reduction of the star catalog, the stars in the sky area are compiled into the navigation stars’ list. By employing the standard coordinate system, the navigation stars are projected to the focal plate to be recognized (Fig. 1). Meanwhile, we adopt a dimension reduction method to compare every two star pairs with the same partner rather than triangle matching conducted within three stars. In the actual algorithm implementation, a dynamic data structure based on red and black tree (RB-Tree) is utilized to adapt to the increasing center. RB-Tree balances the computational complexity of the data insertion (Fig. 2) and then the angle distances between either observation or navigation stars can be efficiently organized in every-cycle center increase. Additionally, we extend the original in-order traversal for all data in the range visited (Fig. 3). Finally, the suitable initialization and enlargements in the center increase can be fixed (0.5° and 0.1° respectively in our study), but not set based on the center quality judged by the operators. To more precisely position the objects outside the center, we afterward employ the GeoHash encoding technology to match the stars in the catalog with the stars observed (Fig. 4). We encode the celestial coordinates of navigation stars with five-digit precision (for detailed precision of GeoHash encoding in Table 1) and then the observation stars by the previously calculated plate constants of the center localization. Therefore, the matching can be made by comparing the GeoHash of the navigation stars (and eight neighbors of each) with their counterparts (Fig. 5). In the massive data application, GeoHash encoding and relevant operations instead of the two-dimension data matching by traversal in the whole sky area can provide matching acceleration and potential of parallel computing in data searching.Results and DiscussionsAll employed data are from recent real observations (using the instrument shown in Fig. 6, from which an observation image and its initial center localization are shown in Fig. 7) to test our method. Firstly, by testing the increasing ordered fitting constants and their coverage of the matched area in the whole frame, the model of 20 plate constants is determined in the matching (Figs. 8 and 9). Then the experiments for its performance are carried out. By comparing the results of eight objects’ positioning with those of the system built-in software, the errors are both in 5″, which sufficiently shows the correction when the image taking with about 6″ per pixel is considered (Fig. 10). Additionally, we organize multi-sky-area observations to test its speed, in which the calculation time of triangle matching can be reduced by 70.68% compared to the previously proposed algorithm which is referred to as searching sorted array method (Fig. 11 and Table 2). According to the experiments of the orbit correlation of 12 satellites tracked by laser ranging (SLR), the differences (O-C) are all in 20″. Furthermore, multi-pass positioning indicates sound wide-field-of-view uniformity by the similar value of the center and the edge fields (Fig. 12). The long-period experiment of the proposed method in one month indicates that the data post-processing can be completed within two hours after the observation. The method successfully matches about 650,000 frames of images total with a recognition accuracy of over 90%, and 580 objects on average can be recognized per observation night. The root mean square (RMS) value of the SLR positioned among the objects is comparable to that obtained by the system built-in software (Fig. 13).ConclusionsThe sub-image isomorphism characteristics can be expressed in different scales, but too small area may lose identifiability and too large area reduces the recognition efficiency. As a result, a gradually increasing center matching could be an ideal method to process wide-field-of-view star maps, in which the dynamic data structure of RB-Tree is employed to save the frequent re-sorting time in the performance. Meanwhile, to precisely position the objects at the edges of observation images, we adopt high-order plate constants as a feasible practice to explain some edge effects, such as optical distortion and atmospheric refraction discrepancy. To this end, whole image matching is necessary, in which the GeoHash encoding method is adopted to deal with the large data load. The experiments of the real observations show that the accuracy of our method can be proved both in multi-object positioning and SLR orbit determination. By utilizing the proposed method, the time consumed per frame can be controlled in about 1 s to save some hours for one-night data processing.
Jun. 25, 2024Vol. 44 Issue 12 1210001 (2024)
Dandan Li, Chao Ma, Mengyang Chai, and Dexin Sun
ObjectiveIn remote sensing devices, image rotation has become a crucial factor affecting imaging results, but if not corrected, it will lead to off-axis distortion of detected target information, preventing the acquisition of accurate azimuth information. Current image rotation correction methods mainly include optical de-rotation, mechanical de-rotation, and digital de-rotation. However, both optical and mechanical de-rotation methods require the addition of new devices to the original imaging system, imposing high demands on device weight and motion accuracy. Therefore, we propose a digital de-rotation algorithm. Meanwhile, the large field-of-view infrared images are advantageous for obtaining abundant terrain information. Thus, it is necessary to stitch the corrected rotated images after correction. However, there is currently no well-established solution for the challenging task of stitching rotated and corrected images. Existing image stitching methods demand high image quality and a significant number of matching points between images. The overlapped areas between the rotated images acquired by the detector are typically small to expand the field of view. Thus, it is essential to develop a stitching algorithm specifically designed for rotated and corrected images.MethodsWe propose a two-dimensional pointing mirror rotation correction and stitching method. Firstly, the image rotation correction algorithm is based on the optical imaging principles of the detector. It builds the imaging model of the two-dimensional pointing mirror, as shown in Eq. (5). Subsequently, the image rotation correction method is derived by reverse deduction of this model, as shown in Eq. (10). Then, the stitching algorithm for the image rotation-corrected images is shown. This method relies on a simulated field-of-view model based on information such as the elevation angle, azimuth angle, and detector specifications of the two-dimensional pointing mirror (Fig. 4). By employing the model to determine the pixel relationships between models, the positional information between images is obtained. Subsequently, based on the orientation information and pixel relationships among images, the image stitching results are achieved.Results and DiscussionsTo validate the effectiveness of the proposed image rotation correction and stitching algorithm, we collect a set of real image rotation data using the detector from our research group. The experimental results indicate that our image rotation correction method can eliminate image rotation errors, and it exhibits an 8% improvement in time efficiency compared to the correction methods in previous studies. The stitching results demonstrate that the proposed image rotation correction algorithm is not constrained by the size of the overlapping area between images or the image quality. Additionally, it achieves seamless and natural large-field-of-view stitching results. In comparison to more advanced stitching algorithms currently, this method is simple and fast and produces tightly-knit and natural stitching results. The contrasted algorithms under small overlapping areas fail to yield correct stitching results. Meanwhile, if the pitch and azimuth angles of the detector are fixed, the calculated pixel relationships between the stitched images can be directly applied to the stitching task, enabling real-time stitching in space.ConclusionsWe propose a method for image rotation correction and stitching in response to the image rotation distortion caused by two-dimensional pointing mirrors and the blank space in the field of image rotation image stitching. Additionally, field experiments are conducted using our research group’s detector to validate the effectiveness of the proposed image rotation correction algorithm and image stitching algorithm. Meanwhile, a set of nine-grid image rotation data is collected. Experimental results demonstrate that the proposed image rotation correction algorithm successfully corrects distorted images caused by image rotation and improves correction efficiency. It is not influenced by the overlap area size between images and image quality, and can accurately complete the image stitching task, leading to naturally seamless images with almost imperceptible seams. The proposed algorithm performs well under small pointing mirror installation error, and the detector’s optical distortion is minimal. However, for situations with significant installation errors or substantial optical distortion in the detector, the modeling process should consider the installation error matrix and optical distortion. Therefore, adjustments to the proposed correction method should be made based on the characteristics of the employed specific detector in the further research.
Jun. 25, 2024Vol. 44 Issue 12 1211001 (2024)
Shiqi Gan, Weichao Wang, Guangfu Yuan, Peijian Wu, and Tongbang Wu
ObjectiveThe infrared radiation characteristics of the aerial target usually refer to the infrared radiation characteristics of aircraft in the flight state. It is an important combat technique indicator for evaluating the stealth performance of aviation weapons and equipment. Before conducting infrared radiation characteristics testing of aerial targets, infrared calibration is required. The traditional calibration method takes the average response value of the entire infrared detector focal plane array for calibration, without considering the calibration non-uniformity in the image spatial domain, which reduces the calculation accuracy. To improve the calculation accuracy of infrared radiation characteristics, we propose a computation model for calculating the infrared radiance of extended aerial targets, which is based on each pixel calibration of the focal plane array in refrigeration infrared systems. The model obtains the gain coefficient matrix and bias matrix of all focal plane arrays by each pixel independent calibration, which can correct the errors caused by calibration non-uniformity. The computation model can provide references for the measurement and theoretical research on the infrared radiation characteristics of aerial targets.MethodsFirstly, each pixel calibration method for refrigeration infrared systems is proposed and the linear relationship between each pixel response value of the infrared focal plane array and the radiation amount of blackbody is established. The calculation formulas of gain coefficient matrix and bias matrix are also derived. Then, we put forward a computation model for calculating the infrared radiance of extended aerial targets based on each pixel calibration of the focal plane array in infrared measurement systems. The model obtains the calculation formula for the infrared radiance of the target by subtracting the sky background gray value from the target gray value and acquires the environmental parameters by adopting atmospheric parameter measurement equipment and MODTRAN software. Finally, large-caliber blackbody calibration experiments and field verification experiments are conducted to verify the model correctness and accuracy.Results and DiscussionsFirstly, the calibration gain coefficient and bias of the refrigeration infrared system at different temperatures are compared (Fig. 3). The calibration bias of the refrigeration infrared system increases linearly with the temperature, but the gain coefficient does not change much with temperature and remains basically unchanged. Secondly, the large-caliber blackbody calibration experiment is conducted based on the near-extended-source method. The traditional calibration method and the proposed method are employed to calibrate the refrigeration infrared system, with a wavelength range of 3.7 μm to 4.8 μm and an integration time of 2000 μs. The blackbody temperature is set at five temperature points including 40 ℃, 50 ℃, 60 ℃, 80 ℃, and 100 ℃ (Fig. 4). The area with a size of 30 pixel×30 pixel in the blackbody image at T1 temperature, center at random pixel x,y is considered as the measurement target. The annular region in the blackbody image at T2 temperature, which is beyond the area with a size of 30 pixel×30 pixel and within the area with a size of 34 pixel×34 pixel, is considered as background (Fig. 5). The theoretical value of blackbody at T2 temperature can be considered as the infrared radiance of background and the theoretical value of blackbody at T1 temperature can be the theoretical value of the measurement target. The atmospheric path radiation Lpath is 0 and the transmittance τatm is 100%. Comparisons show that our method is correct and has a certain improvement in calculation accuracy (Table 1). Thirdly, the field verification experiment is conducted to verify the model accuracy, which considers atmospheric path radiation and transmittance measurement errors. The blackbody is moved to a distance of 420 m from the measurement system (Figs. 7 and 8), and set at five temperature points of 90 ℃, 110 ℃, 130 ℃, 150 ℃, and 200 ℃. The atmospheric path radiation Lpath is 0.2917 W?m-2?sr-1 and the transmittance τatm is 0.738, which are calculated by atmospheric parameter measurement equipment and MODTRAN software. By employing the same method as above (Fig. 5), the infrared radiance values of the measurement target are calculated by the traditional method and our method (Table 2). The calculation results are closer to the true value of the target.ConclusionsThe results show that the computation model can reduce the infrared-radiance average error of an even expand target by 8.58% and the average degree of calculation error deviation by 0.60 without considering atmospheric measurement errors, which is compared with traditional methods. Considering the measurement error of atmospheric path radiation and transmittance, the infrared-radiance average error of even expand target is reduced by 7.23%, and the average degree of calculation error is reduced by 2.25. The calculation results are closer to the true values of the target, but the overall calculation accuracy of the model is limited by the measurement accuracy of atmosphere parameters. In subsequent research, it is necessary to further evaluate the overall accuracy of the model based on the measured data of aerial targets and verify the universality of the calculation model. Our paper provides references for studying infrared radiation characteristics of aerial targets and promoting the development of target characteristic measurement technology.
Jun. 25, 2024Vol. 44 Issue 12 1212001 (2024)
Changyu Zeng, Jinpeng Li, and Xinrui Wang
ObjectiveHigh-precision large optical flats are indispensable in astronomical optics and space optics. For example, large optical flats can be used as standard inspection mirrors for large-aperture optical systems to achieve system calibration or as standard sub-aperture mirrors to splice and test larger-diameter flat mirrors. Therefore, it is of great significance to detect the surface shape of large optical flats accurately. Ritchey-Common test is a special oblique incidence interferometry. The Ritchey-Common test optical path only needs to be built with a well-polished concave spherical mirror, so it is easy to implement in the optical detection workshop. The beam emitted by the interferometer is obliquely incident on the test flat, and the angle between the main optical axis and the normal of the test flat is called the Ritchey angle and is denoted as θ. The Ritchey angle is a critical parameter in the Ritchey-Common test. At present, there are two main methods for measuring the Ritchey angle: 1) measuring the distance between the focal points of the system, the intersection point of the optical axis and the test flat, and the intersection point of the optical axis and the stand spherical mirror, and then calculating the Ritchey angle by the cosine formula; 2) using the edge detection method to analyze the ratio of the long and short axes of the wave aberration image to obtain the Ritchey angle. However, in practice, it is quite difficult to accurately measure the distance between three points with the traditional ranging method, and the measurement process is easily disturbed by human subjective factors. In addition, the edge detection algorithm has low sharpness of the edge area of the interferogram, which brings difficulties to accurate identification. Therefore, it is also difficult to obtain an accurate Ritchey angle. An inaccurate Ritchey angle leads to inaccurate detection of the flat. The measurement of the Ritchey angle is essentially a geometric angle calculation. Meanwhile, the laser tracker has a very outstanding advantage in the field of large-scale spatial geometric parameter measurement, and its distance measurement can reach micron accuracy. Therefore, to reduce the measurement error of the Ritchey angle in the Ritchey-Common method and improve the detection accuracy of the large optical flats, an in-situ detection method for the Ritchey angle based on a laser tracker is proposed in this paper.MethodsIn the in-situ detection method for the Ritchey angle based on a laser tracker, there are two technologies that need to be focused on: one is the accurate establishment of the space model of the test flat based on the laser tracker; the other is the precise positioning of the focus of the interferometer. For the first technology, the least squares fit method is applied to establish an accurate model. The coordinates of feature points on the test flat are obtained by laser tracker. Then, the complete spatial geometry model of the test flat will be obtained by fitting the feature points sampled on the surface and outer contour of the test flat. In the simulation section, the influence of the algorithm fitting errors, ranging errors, and angle measurement errors on the measurement of the Ritchey angle is analyzed by the analog measurement function based on the laser tracker. Moreover, to position the focus of the interferometer precisely, the functional relationship between the coefficient of Zernike power term and geometric defocus has been derived. In the next step, the Ritchey-Common test experiment is performed on the Φ430 mm optical flat to verify the reliability of this method for surface shape detection. Meanwhile, the experiment of positioning the focus point of the interferometer is conducted to prove the correctness of the functional relationship between the coefficient of Zernike power term and geometric defocus. Finally, the effectiveness of this method is evaluated by comparing it with other methods for measuring the Ritchey angle.Results and DiscussionsThrough numerical simulation, it is analyzed that the relative error of using this method to detect the Ritchey angle is not more than 0.017%. Compared with the traditional method using the image compression ratio of the pupil surface of the system to calculate the Ritchey angle, the error of the Ritchey angle is reduced from about 0.2° to below 0.005°. In the Ritchey-Common detection experiment of the Φ430 mm plane mirror, two angles are selected for measurement, and the Ritchey angles are obtained as 39.18° and 21.12°. We will evaluate the surface shape of the test flats from both the RMS of the surface shape and the Zernike power coefficient of the test flat. After the surface shape of the test flat is detected, the detection error of the Zernike power coefficient of the plane mirror is reduced from 6.31% to 0.028% (Fig. 11). Additionally, the residual RMS between the detected surface shape of the flat using the method described in this paper and the true surface shape of the flat is 0.0206λ; the residual RMS between the surface shape detected by using the compression ratio measurement method and the real surface shape is 0.0236λ. Besides, we design an experiment to position the focus of the interferometer. As shown in the result, the variation trend of the Zernike power term coefficient with the spatial position of the SMR is highly consistent with the conclusion we have derived (Fig. 13). The experimental results indicate that the accuracy of the detection of the Ritchey-Common test and the accuracy of the measurement of the Ritchey angle have been improved significantly by using the in-situ detection method for the Ritchey angle based on a laser tracker.ConclusionsIn this paper, we propose an in-situdetection method for the Ritchey angle based on a laser tracker and derive the functional relationship between the Zernike power term coefficient and geometric defocus, achieving accurate positioning of the interferometer focus point. In the simulation part, we analyze the effect of the software error, the ranging error, and the angle measurement error of the laser tracker on the measurement accuracy of the Ritchey angle. During the experiment, we detected Φ430 mm flat with the Ritchey-Common test. Compared with the compression ratio method for measuring the Ritchey angle, the method we proposed can more accurately measure the Ritchey angle in the Ritchey-Common test, thereby improving the surface shape detection accuracy of the flat, especially the Zernike power term coefficient of the test flat.
Jun. 25, 2024Vol. 44 Issue 12 1212002 (2024)
Yang Bai, Lingli Wang, Hongyu Wu, Chao Cheng, Song Yang, Shuai Huang, Jie Zhang, Xing Zhong, and Zhongfu Ye
ObjectiveDue to the influence of the external environment and system aging, the radiation characteristics of the camera will change after launch. It is of great importance to carry out on-orbit radiometric calibration, which converts the image grayscale value of the sensor response into spectral radiance or top of atmosphere reflectance, for remote sensing data quantitative application. Common methods of on-orbit radiometric calibration can be divided into four categories: on-board calibration, site calibration, cross calibration, and scene calibration. As a long-term stable natural celestial body in the universe, the moon has very high surface reflectivity stability. It can be used as a calibration source to avoid interference from complex atmospheres and as a supplement to the on-board calibration. At present, the internationally representative lunar radiation models are the Robotic Lunar Observatory (ROLO) model and the Miller-Turner 2009 (MT2009) model. The spectral coverage of the ROLO model used in this study is 300-2550 nm, and the model uncertainty is 5%-10%. Although the ROLO model has larger uncertainty than the site calibration or on-board calibration, its relative stability can reach 1%-2%, which can be used as a normalized reference to monitor the attenuation of sensors. Many scholars use the lunar irradiance model as the basis to carry out radiometric calibration or monitor the stability of the satellite sensor by comparing the data of different months and different moon phases. However, these studies only focus on multi-temporal tracking of the on-orbit radiation performance of sensors and do not consider the consistency correction of radiation performance between different sensors and different spectral bands. In the present study, we propose a radiation consistency correction method based on lunar calibration. We hope that method can help the inconsistent radiation response of dual cameras installed on the Jilin-1 GP satellite.MethodsWe propose a radiation consistency correction method for dual cameras equipped with Jilin-1 GP satellite by lunar calibration based on the stable radiation response characteristics of the moon. Firstly, the lunar imaging data of the two cameras are obtained successively by adjusting the satellite attitude. Then, the lunar spectral irradiances of different spectral channels of the two sensors are calculated based on the image data. The calculation results are compared with the ROLO lunar irradiance model and the spectral band with small irradiance change and close irradiance response of the two cameras is selected as the reference band. At last, the ratio irradiance of each band to the reference band is calculated to correct the attenuation of each band, to achieve dual-camera radiometric consistency correction of Jilin-1 GP satellite.Results and DiscussionsThe correction value of the absolute radiometric calibration coefficient of each spectral band indicates that after the satellite has been on orbit for a period of time, certain fluctuations have occurred in each band, and some spectral bands even have an attenuation of more than 30% (Table 3). Four sets of data from different imaging scene types are selected for testing, of which the red, green, and blue spectral bands are combined into true color images. Visually, the corrected dual-camera images have better color consistency (Figs.7 and 8). Relative average spectral error (RASE) and relative global dimensional synthesis error(ERGAS) are adopted to evaluate the spectral consistency of the entire image and lap region imaged by both cameras before and after correction. Compared with the calculation results of the indicators before and after the correction, the calculation results of RASE and ERGAS between the two cameras after the correction are better than those before the correction, whether it is the entire area or the overlapping area (Table 5). Experimental results show that our dual-camera radiometric consistency correction method significantly improves the radiometric consistency, especially in the overlapping area.ConclusionsIn the present study, based on the imaging data of the simultaneous observation of the moon by two cameras of the Jilin-1 GP02 satellite, we propose a dual-camera radiation consistency correction method based on lunar calibration. Firstly, based on acquired observation data of the moon, the consistency of the single spectral band radiation reference of the two cameras is determined by selecting the spectral band with the closest lunar irradiance results of the two cameras as the benchmark for the correction between the respective bands. Furthermore, the relative relationship between each spectral band in the ROLO model is used as a reference, and all bands of the two cameras are corrected relatively to realize the consistency of the remaining spectral bands of the dual cameras to the consistency of the reference band. The test results show that some spectral bands of the Jilin-1 GP02 satellite have obvious attenuation. After compensating for the attenuation, the visual effect of the true color images taken by the two cameras of the Jilin-1 GP02 satellite is more consistent, and the relative average spectral error and the relative adimensional global error in synthesis of the overlapping area of the dual camera are also significantly smaller.
Jun. 25, 2024Vol. 44 Issue 12 1212003 (2024)
Haodong Yan, Shuai Zhi, Xurui Chen, Zhaoxiong Li, Guopeng Ding, Yangyang Zhang, Yonghe Zhang, and Zhencai Zhu
ObjectiveLens distortion is a common problem in the optical system of star sensors. Vibrations during launch, changes in the space thermal environment, and other factors may cause changes in the optical system and lead to lens distortion. The changes in the optical system include the refractive index changes of optical materials, the thickness, curvature radius, and surface shapes of optical lenses, and the distance changes between optical elements. These distortions can change the focal length and principal point and can cause various nonlinear distortions of the optical system, leading to errors in the angle information obtained in the star sensor, thereby affecting the accuracy of navigation and attitude control. These errors may accumulate in long-duration missions and lead to poor system performance. Therefore, eliminating lens distortion and improving the measurement accuracy of star sensors become necessary for maintaining the attitude output accuracy of star sensors.MethodsIn response to the accumulation of lens distortion in star sensors due to mechanical vibrations, temperature changes, radiation, and solar radiation pressure during launch, as well as poor attitude accuracy caused by the optical distortion of uncalibrated low-cost cameras, we creatively introduce the non-parameterized B-spline algorithm into the widely used model-based correction algorithm. This approach decouples lens distortion into parameterized coarse calibration and non-parameterized fine calibration. The main advantage of B-spline curves is their flexibility and local controllability. Compared to the traditional interpolation methods, the shape of B-spline curves can be controlled locally by adjusting the positions of control points without affecting the entire curve. In the coarse calibration stage, the Levenberg-Marquardt algorithm is introduced to optimize the principal point and focal length, and the results are used as parameters for data preprocessing. Additionally, the right ascension, declination, and rotation angle of each frame image are also used as inputs. After the data preprocessing, the pixel coordinates of each star point on the image plane are produced. Lastly, a multi-layered structure of bicubic B-spline grids is constructed, achieving sound correction of global distortion and addressing local nonlinear distortions. This approach reduces the requirements for lens manufacturing and improves the attitude accuracy of on-orbit star sensors.Results and DiscussionsWe conduct a simulation to simulate various distortion situations that may occur (Table 2), determine the optimal number of layers for the B-spline grid (Fig. 5), and verify the compensation ability of the non-parameterized B-spline algorithm for distortion (Fig. 6). In terms of distortion correction and time consumption, comparisons are made with the BP network algorithm optimized by genetic algorithm and neural network algorithm. Simulation experiments show that B-splines can effectively handle various distortions of star sensor lenses with theoretically high accuracy (Table 3). Compared with the neural network algorithm and genetic algorithm, our algorithm achieves attitude output accuracy at the sub-arcsecond level after correction, which is an order of magnitude better than the arcsecond level accuracy of the neural network algorithm and genetic algorithm (Table 4). To verify the on-orbit feasibility of the algorithm, 850 images transmitted from a star sensor of a remote-sensing satellite in the sun-synchronous orbit are selected for calibration testing. After the calibration with this algorithm, the position deviation of star points is reduced from 0.55766 to 0.23706 pixel (Table 6), and the measurement accuracy is improved from 5.857″ to 2.775″, demonstrating high feasibility. Compared with common ground calibration algorithms, this algorithm shows higher calibration accuracy and requires only a few hundred milliseconds to train all data.ConclusionsThis paper proposes a rapid spline-based on-orbit self-calibration method, which decouples distortion into parameterized coarse calibration and non-parameterized fine calibration. Through the design of the B-spline grid and the self-calibration algorithm, fast and accurate correction of star-sensor distortion is achieved. Through simulation and on-orbit experiments, the effectiveness and robustness of the method are proved. This research provides an effective method to improve attitude accuracy in on-orbit self-calibration of star sensors. It also provides theoretical and experimental foundations for the development of cost-effective star sensors.
Jun. 25, 2024Vol. 44 Issue 12 1212004 (2024)
Linglin Zhuang, Zijiang Yang, Qiao Pan, Kuaisheng Zou, and Weimin Shen
ObjectiveAffected by the difference of albedo in different regions of the surface and non-uniformity of atmospheric radiation, the physical slits in the satellite-borne imaging spectrometer are illuminated non-uniformly to result in linear distortion of the spectral response function of the instrument. This is manifested as the superposition of random errors in the acquired spectral signals, affecting the inversion accuracy of the imaging spectrometer. Meanwhile, a single greenhouse gas imaging spectrometer with a very wide spatial field of view and extremely high spectral resolution emerges to improve the temporal resolution and accuracy of atmospheric greenhouse gas concentration detection, with the influence of radiation non-uniformity being more obvious than that of ordinary imaging spectrometers. We design a two-dimensional spatial homogenizer for greenhouse gas monitoring imaging spectrometers to homogenize scene radiation in two dimensions of across-track and along-track. The two-dimensional spatial homogenizer consists of a rectangular fiber array, the width of a single fiber along the track is determined by the integration time, and the size of a single fiber across the track indicates the spatial sampling width of the instrument. The unique advantages of the two-dimensional spatial homogenizer can ensure not only the stability of the spectral response function of the spectrometer in the inhomogeneous scene of sharp contrast but also the spatial coregistration between different spectral channels.MethodsTo ensure the stability of the spectral response function of the spectrometer in non-uniform scenarios, we should consider the homogenization performance of the rectangular fiber in the design stage. Additionally, due to the influence of the internal microstructure and macroscopic bending of the optical fiber, the optical fiber inevitably has a focal ratio degradation effect, which will influence the quality of the outgoing beam and the design of the subsequent optical system. Therefore, we study the stability of the rectangular optical fiber composed of the two-dimensional spatial homogenizer by simulation, compare the uniformity of the optical fiber exit spot under different fiber lengths, different lighting scenarios, and different roughness conditions, and research the focal ratio degradation characteristics of the rectangular fiber by simulation.Results and DiscussionsThe uniformity of the outgoing spot increases with the rising fiber length, although the energy loss increases correspondingly (Fig. 4). The uniformity of the optical fiber outgoing spot in the non-uniform illumination scene is the same as that in the uniform illumination scene (Table 1). This indicates that the rectangular optical fiber has sound homogenization properties and that the two-dimensional spatial homogenizer can reduce the sensitivity of the spectrometer to inhomogeneous radiation of the earth scene. Meanwhile, the focal ratio degradation characteristics of rectangular optical fiber are also studied, and the results show that the optical efficiency can reach more than 95% when the input F number is 4 and the optical system of F/3.5 is employed at the output end (Fig. 9).ConclusionsThe influence of inhomogeneous radiation on the greenhouse gas monitoring imaging spectrometer should be solved and the temporal resolution and accuracy of atmospheric greenhouse gas concentration detection should be improved. To this end, a two-dimensional spatial homogenizer for greenhouse gas monitoring imaging spectrometer is studied to achieve two-dimensional homogenization of scene radiation across and along orbits. Our study simulates and studies the homogenization performance and focal ratio degradation characteristics of the rectangular optical fiber composed of the two-dimensional space homogenizer. It is found that if the rectangular fiber length increases, the uniformity also rises, but the energy loss increases accordingly. Meanwhile, the rectangular fiber can realize the homogenization of the non-uniform scene and reduce the sensitivity of the spectrometer to the non-uniform earth scene, and the optical efficiency can reach more than 95% when the optical system of F/3.5 is adopted at the output end when the input F number of the optical fiber is 4. The simulation results reveal that the two-dimensional spatial homogenizer can provide an ideal solution to the influence of non-uniform earth scenes on the spectrometer accuracy.
Jun. 25, 2024Vol. 44 Issue 12 1212005 (2024)
Tianyu Guo, Lei Yang, Yi Wang, Wenping Zhang, Shiliang Guo, and Hongbo Xie
ObjectiveWith the continuous trend of low cost and miniaturization in satellite launch, higher requirements have been put forward for the imaging quality and overall size of the optical remote sensing imaging system which the satellite is equipped with. Under constant orbital height, reducing the pixel size and increasing the focal length of the optical system can improve the ground resolution, but this can bring rising system aperture, which increases the overall size of the imaging system and conflicts with the carrying capacity of small satellites. Compared to transmission systems with long focal length, reflective systems feature light weight, and easy installation and adjustment, without color differences. The traditional coaxial three-mirror system requires the addition of a folding mirror in the optical path to extract the image plane, resulting in secondary obstruction and an increase in overall system size. The off-axis three-mirror system can achieve a large field of view and avoid central obstruction, but the overall structure is larger in the vertical direction, with the processing and assembly cost twice that of the coaxial system. Meanwhile, the four-mirror structure can avoid image extraction and secondary obstruction simultaneously, but it has a large number of mirrors, high design difficulty, and high requirements for processing and assembly accuracy. Multi-surface integration is the process of machining multiple complex optical surfaces onto the same optical substrate, reducing the number of optical components in the imaging system and reducing assembly freedom. It is an innovative design direction for lightweight optical remote sensors.MethodsBased on the general structure of a coaxial four-mirror optical system, the obstruction ratio and magnification of each mirror are derived. Then the aperture is set on the primary mirror, and the initial structure of the system is solved by the Gaussian geometrical optics theory. According to Seidel's aberration theory, the aberration coefficient of an optical system is obtained as a function of obstruction ratio, magnification, and conic coefficient. After determining the focal length, aperture, and overall size of the system, based on the above functions, we optimize the selection of reasonable parameters to ensure that all aberration coefficients are 0 and complete the primary aberration correction of the system. The conic coefficient of the primary mirror in a coaxial four-mirror optical system only affects the primary spherical aberration and does not contribute to other off-axis aberrations. Conic coefficients of the secondary, third, and fourth mirrors can influence the primary spherical aberration, coma, astigmatism, and distortion. Additionally, it is necessary to reasonably control the conic coefficients of the three mirrors to correct related aberrations. The primary field curvature is only related to the system structure and is independent of the aspheric coefficients of each surface. It is generally corrected by controlling structural parameters.Results and DiscussionsWe carry out the design optimization in the multi-surface integration direction, and propose a coaxial four-mirror optical system with small aperture, long focal length, and high multi-surface integration degree of the primary and tertiary mirrors as same as the secondary and fourth mirrors. The field angle is 1.5°, the focal length is 737 mm, and the total system length is 150 mm, with the modulation transfer function better than 0.2 at 100 lp/mm. The image quality is close to the diffraction limit and the relative distortion is small. The final optimization results of this system design show that the curvature and cone coefficient of the primary and secondary mirrors are the same values. In actual processing, the primary and tertiary mirrors can be machined onto the same substrate material to create the same sphere, which can eliminate the tilt and eccentricity degrees of freedom between the primary and tertiary mirrors. Different high-order aspheric surfaces can be machined at different positions on the same sphere to distinguish the primary and tertiary mirrors. The situation is the same for the secondary and fourth mirrors. We analyze the system athermalization and tolerance. The assembly error of the system includes the displacement error of the four mirrors along the optical axis direction and the inclination and eccentricity error of each mirror. Compared to the traditional coaxial four-mirror optical system, the assembly error of this system is reduced from 12 items to 6 items, with reasonable tolerance allocation. The system has great advantages in terms of manufacturing and processing stability. Under varied temperatures, the conic coefficient of the aspheric surface remains unchanged, and the curvature radius at the vertex and the aspheric surface coefficients of all orders change. When the reflective substrate and mechanical support structure of the system are made of homogeneous aluminum alloy materials, there is no difference in the linear expansion coefficient. The thermal expansion of optical elements and mechanical structures caused by temperature changes can be regarded as thermal expansion or contraction in the same direction, which means the changes in the mechanical frame are synchronized with those of the system's rear intercept. Since the detector surface is still the optimal image plane of the system, the system exhibits sound thermal stability.ConclusionsAs an innovative design direction for light and small optical remote sensors, the integrated optical system with multiple mirrors can reduce assembly freedom and has caught widespread attention and exploration from domestic and foreign researchers. There are still some problems to be solved in the optical design, manufacturing, and testing of multi-surface integrated optical components, stray light suppression, and system assembly of the multi-surface integrated folding imaging system. The design of a multi-surface integrated optical system is a multi-objective optimization problem under multivariate constraints. The manufacturing of multi-surface integrated optical components should solve the problem of high-precision machining and detection of shape and position. The performance improvement of the proposed system needs to address stray light suppression and high-precision assembly. All of these point out the way for future research and will continue to promote the development of multi-surface integrated imaging optical systems.
Jun. 25, 2024Vol. 44 Issue 12 1222001 (2024)
Ziwen Duan, Yangguang Xing, Jilong Peng, Lei Yan, Yifan Huang, Yue Liu, and Lin Li
ObjectiveSpectroscopic imaging observations in the extreme ultraviolet (EUV) short-wavelength range (10-40 nm) provide rich information about eruptive solar activities in the upper solar atmosphere. Meanwhile, they encompass emission spectral lines from multi-charged ions (e.g., high-charge iron ions, helium ions, and magnesium ions) with electron excitation temperatures ranging from 104-107 K. Such observations play a crucial role in diagnosing plasma temperature, density, and velocity in the solar corona, making the He II 30.4 nm emission spectral line particularly significant for diagnosing small-scale solar eruptive events and conducting global helium abundance measurements. However, regardless of whether launched in the past or currently in orbit, existing imaging spectrometers worldwide face limitations in performing high-spatial and high-spectral resolution diagnostic observations in the EUV short-wavelength range encompassing the He II line. Therefore, we propose and design a solar EUV imaging spectrometer capable of simultaneously operating in the 17-21 nm and 28-32 nm wavebands, which features a large off-axis slit for wide field-of-view (FOV) imaging. The instrument utilizes a non-Roland grating structure and a toroidal varied-line-space (TVLS) grating design, enabling simultaneous acquisition of high-spatial and high-spectral resolution, and large instantaneous slit FOV imaging without the need for spectral scanning or detector displacement.MethodsThe slit scanning solar EUV imaging spectrometer utilizes a narrow slit to restrict the FOV and employs a combination of slit scanning, concave grating, and a two-dimensional flat field detector to achieve high spatial and spectral resolution imaging over a two-dimensional area. Solar EUV radiation passes through a preceding off-axis telescope primary mirror, forming a real image at the telescope focal plane. A narrow slit positioned at the telescope focal plane captures a portion of the image by the instantaneous FOV (IFOV). The light passing through the slit undergoes TVLS grating dispersion and is ultimately directed to two detectors, corresponding to the two wavebands of interest.The TVLS grating as the core dispersive element is analyzed for aberrations in our study. By considering the TVLS grating’s toroidal base parameters, grating groove density function, and imaging structure parameters along with the instrument’s optical path function, we perform aberration analysis. Based on the desired properties of anti-dispersion and off-axis aberration correction, we derive constraints for optimizing the TVLS grating parameters. Subsequently, we employ system resolution as an optimization constraint to further refine the instrument’s design, obtaining the initial structural parameters of the imaging spectrometer. To achieve optimal system performance, we utilize ZEMAX software for optimization via the initial parameters and aberration optimization functions. Meanwhile, the narrow slit imaging of different spectral lines in the target wavebands by non-sequential ray tracing is simulated to validate the spectral imaging performance of the designed system.Results and DiscussionsThe final optimized optical layout of our solar short EUV dual-waveband imaging spectrometer is shown in Fig. 4. It operates in the wavelength range of 17-21 nm and 28-32 nm, employing e2v CCD detectors with a pixel size of 16 μm. The entire instrument’s optical volume measures 2000 mm×280 mm×115 mm. For different spatial scales of solar eruptive targets, three slit widths of 1″, 2″, and 20″ are available. By performing stepwise rotation of the primary mirror, high-resolution spectral imaging of a 10′×12′ two-dimensional solar disc can be realized.The instrument exhibits excellent imaging performance, with the root mean square (RMS) spot size in both spatial and spectral directions being less than 6 μm in the 17-21 nm and 28-32 nm bands (Fig. 6). The RMS spot size changes smoothly with wavelength and gradually increases with larger off-axis FOV (0-6′). At the Nyquist spatial frequency (31.25 lp/mm), the modulation transfer function (MTF) values for both meridional and sagittal directions at the four edge wavelengths (17, 21, 28, 32 nm) are all greater than 0.5 (Fig. 7). The encircled energy within a single pixel for the four edge wavelengths is 90.4%, 91.6%, 88.8%, and 81.0% respectively (Fig. 8), all exceeding 80%. In the non-sequential mode, the slit image lengths for different spectral lines in the two bands are 23.28 mm, which is in close agreement with the theoretical value (23.04 mm), with all exhibiting clear peaks (Fig. 9). These results demonstrate that the instrument possesses excellent spectral imaging performance, with spatial resolution better than 1″ and spectral resolution better than 0.0055 nm.The instrument has flexible tolerance capabilities. By adopting the given tolerance values (Table 5), we perform a Monte Carlo analysis in ZEMAX software using sensitivity mode for wavebands at 19 nm and 30 nm. The results indicate that the most significant effects on spectral imaging performance are exerted by tilt tolerances of the primary mirror elements, the secondary mirror’s quadratic coefficients, and the grating’s element tilts. The RMS spot size at the image plane changes within 0.5 pixel size with a probability of 98%. Under these tolerance limits, the image quality degradation of the imaging spectrometer remains within a controllable range.ConclusionsWe propose and design a high-resolution spectroscopic imaging architecture capable of simultaneous operation in the 17-21 nm and 28-32 nm wavelength ranges. The instrument employs a TVLS grating as the dispersive element. By analyzing the TVLS grating aberrations under the non-Roland structure using the optical path function and Fermat’s principle, correction conditions for off-axis grating aberrations and anti-dispersion spectroscopic imaging are derived. Ray-tracing simulation results demonstrate that the off-axis grating aberrations and image dispersion of the imaging spectrometer are well corrected for enabling the system to yield spectral imaging performance close to the diffraction limit. The system exhibits a spatial resolution of better than 1″ and a spectral resolution of 0.0055 nm. Sensitivity-based tolerance analysis indicates that the designed solar EUV imaging spectrometer possesses flexible tolerance capabilities. The advanced design of the proposed spectrometer provides a theoretical basis for achieving high spatial resolution, high spectral resolution, and wide temperature diagnostics for solar coronal eruptive activities within a two-dimensional solar disc FOV. Additionally, it holds theoretical and practical significance for the development and construction of future EUV spectroscopic instruments in China.
Jun. 25, 2024Vol. 44 Issue 12 1223001 (2024)
Qianyu Chen, Tang Xu, Zhiqiang Liu, Zhiqiang Ma, Feng Yuan, and Yue Xu
ObjectiveThe laser ranging technology based on single-photon avalanche diode (SPAD) has been widely applied to unmanned driving, intelligent robots, and 3D imaging due to its long detection distance, high resolution, and strong anti-interference ability. The laser ranging methods mainly include direct time-of-flight (dTOF) and indirect time-of-flight (iTOF) measurement techniques. dTOF has higher anti-interference capability and a wider dynamic range than iTOF. Currently, the SPAD-based dTOF laser ranging technology is rapidly developing towards low cost and high integration with silicon-based processes. However, there are still problems such as low near-infrared light detection efficiency, poor ranging stability, and mutual constraints between time resolution and measurement error. To this end, we propose a near-infrared laser ranging system based on a 0.18 μm bipolar-CMOS-DMOS (BCD) process, which has high detection efficiency, low dark count noise, low bit error rate, high resolution, and large dynamic range.MethodsThe laser ranging system primarily consists of a pulse laser driver, an optical lens, a 4×4 SPAD array, quenching circuits, and a dTOF readout circuit (Fig. 1). The integrated SPAD device employs a high-voltage p-well (HVPW) /high-voltage n+ buried layer (HVBN)) structure as the avalanche multiplication region (Fig. 2). By utilizing the HVPW and HVBN, a thicker and deeply buried avalanche multiplication region is formed to enhance the absorption of near-infrared shortwave photons and improve quantum efficiency. Simultaneously, a low-voltage p-well is injected into the HVPW to increase the net doping concentration in the neutral photon collection region of the HVPW. This widens the effective photon collection region, and facilitates the transfer of optically generated electrons from the HVPW to the avalanche multiplication region, thereby triggering the avalanche effect and further improving the detection probability of near-infrared photons. Meanwhile, combined with an embedded deep-junction avalanche multiplication region, a low-doped p-type epitaxial layer (p-Epi) is employed to form a virtual guard ring and thus reduce dark counts. This addresses the high dark count rate (DCR) in traditional p-well guard ring or deep n-well virtual guard ring structures. The dTOF readout circuit (Fig. 4) mainly consists of a delay-locked loop (DLL), a phase interpolation circuit, and a counter. An off-chip crystal oscillator provides a clock of 50-75 MHz, which is multiplied by four to provide a high-frequency reference clock to the circuit. The timing start signal "Start" of the time-to-digital converter (TDC) is synchronized with the laser emission signal, while the timing stop signal "Stop" is generated by narrow pulse signals produced by the quenching circuit from a detection array composed of 16 SPADs and fed into OR gates. The dTOF readout circuit achieves timing by a two-stage process of an 8-bit coarse TDC followed by an 8-bit fine TDC. The coarse TDC calculates the clock cycle number of the DLL output clock Clk<0>, which is a dual-chain counter, while the fine TDC determines the start initial phase interpolation and stop final phase interpolation using the 16-phase divided clocks Clk<0—15>. Finally, this system achieves a minimum time resolution of 208 ps/312 ps and a dynamic range of 852 ns/1.28 μs.Results and DiscussionsThe proposed SPAD array and dTOF readout circuit are fabricated by the 0.18 μm BCD process, and their optical and electrical characteristics are tested. Firstly, the avalanche breakdown voltage, DCR, and photon detection probability (PDP) of the SPAD devices are tested. The results (Fig. 11) show that the avalanche breakdown voltage is 42.4 V in both light and dark conditions. The DCR gradually increases with the bias voltage and temperature. At a bias voltage of 5 V, the DCR is only 162 s-1, and it does not exceed 1000 s-1 at 60 °C. The SPAD device exhibits a strong response in the wide spectral range of 400-940 nm. At a bias voltage of 5 V, the PDP peak at 650 nm reaches over 39%. Due to the deep avalanche multiplication region, the device also demonstrates enhanced sensitivity to near-infrared photons in the range of 780-940 nm, with a PDP of 8.5% at 905 nm. The dTOF readout circuit is tested by inputting an external 50 MHz/75 MHz reference clock. The 0th and 16th phases of the voltage-controlled delay line (VCDL) in the DLL are introduced by four frequency dividers onto the PAD for output testing. The 0th and 16th phase signals almost completely overlap (Fig. 13), indicating minimal phase error. The time accuracy of the TDC is tested by generating adjustable time interval pulses using a digital delay generator, which is then adopted as the Start and Stop signals input into the TDC circuit. The test results (Fig. 14) show that the TDC linearity reaches 99.9% under 312 ps and 208 ps time resolution measurements, with measurement errors smaller than LSB (LSB represents least significant bit). The differential nonlinearity (DNL) and integral nonlinearity (INL) are within ±0.1LSB and ±0.6LSB respectively (Fig. 15). Furthermore, the performance of the laser ranging system was tested, as shown in Fig. 16. The measured values of the TOF vary linearly with the actual photon flight time, with a maximum error of 0.37 ns. Nearly 1000 consecutive single measurements are performed to evaluate the accuracy of the proposed detector, and the measurement results are concentrated around 20 ns. With a resolution of 208 ps, the RMS is only 255 ps, indicating high linearity and stability of the designed ranging system.ConclusionsA near-infrared laser ranging system with high detection efficiency, low dark count noise, low error rate, high resolution, and large dynamic range is realized based on the 0.18 μm BCD process. Test results show that the SPAD device achieves a DCR as low as 162 s-1 under 5 V excess bias voltage, and the PDP at 905 nm near-infrared wavelength exceeds 8.5%. The system can operate in the near-infrared bands with a higher eye-safe threshold. The TDC achieves a high time resolution of 208 ps and a dynamic range of 1.28 μs under 50 MHz/75 MHz input clock. The DNL and INL are within ±0.1LSB and ±0.6LSB respectively. The measurement error of dTOF for photon flight time is 0.37 ns. The proposed laser ranging system features high eye-safe threshold, high sensitivity, low noise, and high linearity, providing references for low-cost and high-precision laser ranging applications.
Jun. 25, 2024Vol. 44 Issue 12 1228001 (2024)
Huilin Shan, Wenxing Liu, Xingtao Wang, Xiangwei Fu, Changshuai Li, and Yinsheng Zhang
ObjectiveSynthetic aperture radar (SAR) is a microwave imaging radar that utilizes the principle of synthetic aperture to achieve high resolution. It has various characteristics such as all day, all weather, high resolution, and wide bandwidth. It is not affected by weather, day, and night and can obtain high-quality, high-resolution, large-scale, and long-distance images. SAR ship target detection technology can provide important technical support in industries such as ocean, oil, port management, marine resource development, and marine scientific research, as it can detect ships and equipments on the sea and detect potential safety risks in advance. At the same time, ship target detection technology has important strategic significance for strengthening maritime monitoring, border patrol, maritime rescue, and safety assurance of maritime channels. We aim to improve the accuracy of SAR ship detection, reduce false positives, and enhance the adaptability of the model.MethodsTraditional SAR image target detection methods include texture analysis, polarization characteristics, and constant false alarm rate (CFAR) algorithms. Among them, the most widely used is the CFAR detection algorithm, which has certain advantages in speed, but its drawbacks are high computational complexity and susceptibility to complex backgrounds, resulting in unsatisfactory detection efficiency. In the actual SAR imaging process, the backgrounds of SAR images are mostly ports, islands, reefs, and other buildings. These backgrounds have high grayscale characteristics and strong confusion. Therefore, for the detection of ship targets on the sea, multiple complex backgrounds, various irregular arrangements of ships, similar target misdetection, and other uncertain factors should be considered. The target features of uncertain factors have a certain degree of similarity with ships. Therefore, we propose an efficient aggregation feature enhancement network (EAFENet) to solve the problems of low accuracy, serious false detections, and unstable effects in current SAR ship target detection. The core idea is to efficiently aggregate stacking modules and introduce residual structures to effectively transmit gradient and feature information and alleviate the problem of gradient vanishing and feature loss. The combination of the CBS (convolution+batch normalization+SiLU) module, CBAM (channel spatial attention mechanism), and leaky ReLU activation function increases the sensitivity of the network to target features and introduces low-dimensional feature fusion. Through multi-layer feature pyramid connections, the expression of features is further extended and enhanced, and the residual idea is used for skip connections, enhancing the learning ability and generalization of the model.Results and DiscussionsIn this article, qualitative and quantitative experiments are conducted on EAFENet and other mainstream models for detecting SAR ships, as well as ablation experimental analysis. To demonstrate the effectiveness of each improvement point in this article, the YOLOv7 network model is used as a benchmark, and six sets of experiments are conducted on the SSDD dataset, with the same environment and parameters. The detected images include multiple targets, few targets, and complex backgrounds. As shown in Table 3, the effect is not ideal only when attention is used alone, and the effect is significantly improved when the mentioned EL-CB (efficient layer convolutional block) is used. The proposed global enhanced feature pyramid network branch structure is used to improve the performance of the feature pyramid and enhance the fusion of shallow features. The accuracy is improved by nearly three percentage points; the recall rate and mAP0.50∶0.95 are both improved by nearly 10 percentage points, and mAP0.5 is improved by 6.4 percentage points, proving the effectiveness of each module in this article. In order to further compare the performance of the proposed model, the improved algorithm is used for comparative experiments with the current mainstream algorithms. The experimental environment is the same, and the same training and testing sets are used. The indicators of Faster R-CNN, SSD, YOLOv5, YOLOv7, CenterNet, and our algorithm are shown in Table 4. In terms of accuracy, the EAFENet model is more prominent than other mainstream algorithms. EAFENet performs the best with an accuracy of 95.40%, followed by YOLOv5 and YOLOv7, with an accuracy of 93.32% and 92.90%, respectively. The accuracy of SSD and Faster R-CNN is 84.10% and 82.70%, respectively. Compared with other algorithms, EAFENet uses a more efficient feature extraction module, which to some extent reduces misjudgment. However, mainstream algorithms such as SSD have relatively weak designs in feature extraction and other aspects, as well as a lack of deeper fusion of shallow features in the feature fusion process, resulting in relatively inaccurate prediction results. Therefore, when considering the mAP value, EAFENet still performs the best, reaching 98.90% of mAP0.5, followed by YOLOv5 and YOLOv7, reaching 94.25% and 92.50%, respectively. The mAP0.5 of SSD and Faster R-CNN is 86.01% and 89.17%, respectively. However, the proposed algorithm has undergone deeper fusion in the network structure, resulting in a slight decrease in FPS (frame per second). Overall, compared with other classic algorithms, the proposed algorithm still has significant advantages in speed, and the greatly reduced false detection rate can meet the basic needs of real-time detection.ConclusionsIn response to the problems of low accuracy and high false detection rate in SAR ship detection, we propose a SAR ship detection method based on an EAFENet. An EL-CB is constructed through spatial channel attention as the feature extraction module of the backbone network, and Inception NeXt is used as the feature extraction part of neck to improve algorithm efficiency, enabling the network model to better understand multi-scale information with detail perception ability. In the network structure, a global enhanced feature pyramid branch structure is constructed by fusing deep-level features with low-level features. This enables the feature extraction network to simultaneously consider both low-level and deep-level information, effectively enhancing the ability to obtain features and ensuring better stability for ship detection in complex backgrounds. The experimental results show that compared with various current detection algorithms, the proposed algorithm has higher detection accuracy and can meet the needs of real-time detection. In future research, the network structure will be further optimized to improve detection accuracy and efficiency.
Jun. 25, 2024Vol. 44 Issue 12 1228002 (2024)
Fan Yang, Fei Gao, Xiaoli Li, Xiong Gao, Cheng'an Zhang, Li Wang, Qing Yan, Dongchen Shi, Wenhui Xin, and Dengxin Hua
ObjectiveMore than 50% of atmospheric water vapor exists mainly in the lower atmosphere within 2 km. Vibrational Raman scattering lidar is an important remote sensing tool for atmospheric water vapor measurement. However, the traditional vibrational Raman scattering lidar mainly adopts a coaxial and non-coaxial parallel transceiver system structure, and the system detection blind zone and transition zone limit their effectiveness in ground atmospheric water vapor detection. We propose a novel detection technique of lateral vibrational Raman scattering lidars based on the structure of a bistatic system, where the lateral vibrational Raman scattering signals of N2 and H2O at different heights are detected by the elevation angle scanning of the lateral receiver system. Finally, it realizes fine detection of near-surface atmospheric water vapor without a blind zone from the ground to the height of interest.MethodsWe study the lateral vibrational Raman scattering lidar technique in the application of accurate measurements of atmospheric water vapor from the ground to the height of interest. First, a novel lateral scanning vibrational Raman scattering lidar technique is proposed and designed. Two telescopes combined with specified narrow-band interference filters are utilized to detect the lateral scattering signals of the vibrational Raman scattering spectra of N2 and H2O respectively. Then, the inversion algorithm of atmospheric water vapor using the lateral vibrational Raman scattering lidar is established. Vibrational Raman scattering spectra of N2 and H2O have large wavelength differences, which lead to large differences between atmospheric transmissivity of the slant path in these two detection channels, and the aerosol extinction coefficients inverted by Raman method are adopted to correct atmospheric transmissivity of the slant path and improve the detection accuracy of the atmospheric water vapor mixing ratio. Finally, the construction of the experimental system is completed, and the preliminary experiments are conducted via the lateral scanning vibrational Raman scattering lidar. Two different rotation schemes including the continuous equidistant resolution and segmented equidistant resolution are employed during the experimental observations.Results and DiscussionsThe detection principle of the lateral vibrational Raman scattering lidar is innovatively proposed. It breaks through the traditional backward vibrational Raman scattering lidar by a monostatic transceiver system structure, which produces the blind zone and transition zone without effective detection of near-surface atmospheric water vapor. Meanwhile, this technology can utilize a continuous-wave laser featuring light weight, portability, mobility, and low cost (Fig. 1). Data correction of atmospheric water vapor is realized by analyzing the atmospheric molecular scattering phase function and the difference in slant path atmospheric transmissivity caused by the wavelength difference between the vibrational Raman scattering spectra of N2 and H2O. The aerosol extinction coefficient obtained from the inversion of the lateral N2 vibrational Raman scattering signal is employed for real-time correction of the slant path atmospheric transmissivity, which improves the accuracy of atmospheric water vapor mixing ratio detection (Figs. 2-4). Preliminary experimental observational studies of a lateral scanning pure rotational Raman scattering lidar are performed by two different rotation schemes including the continuous equidistant resolution and segmented equidistant resolution, which are employed during the experimental observations. The experimental results show that both rotation schemes can realize atmospheric water vapor detection from the ground to the height of interest. In particular, the segmented equidistant resolution scheme can realize more fine detection of atmospheric water vapor distribution in the ground zone (Figs. 5-8).ConclusionsWe focus on the detection demand for atmospheric water vapor from the ground to the height of interest using the lidar technique. Based on the theoretical basis of vibrational Raman scattering, the innovative technology of lateral scanning Raman scattering lidar for detecting atmospheric water vapor at the ground surface is proposed. This technology combines the elevation angle scanning function of the lateral receiver system to achieve non-blind scanning detection of water vapor in the lower atmosphere. Due to large differences between the wavelengths of the vibrational Raman scattering spectra of N2 and H2O, the aerosol extinction coefficients obtained by inverting the lateral N2 vibrational Raman scattering signals are adopted to make real-time corrections to the slant path atmospheric transmissivity, which improve the accuracy of atmospheric water vapor mixing ratio. If a high-power pulsed laser is applied, it can be simultaneously observed with a backward vibrational Raman scattering lidar to construct a joint detection system to realize the measurement of atmospheric water vapor from the ground to the height of interest. The experimental results show that the lateral vibrational Raman scattering lidar can detect atmospheric water vapor mixing ratios up to 1400 m with a horizontal distance of 60 m between the laser transmitter system and the lateral telescope receiver system. Additionally, the segmented equidistant resolution scheme has variable resolutions at different heights to show more details of water vapor distribution in the ground zone.
Jun. 25, 2024Vol. 44 Issue 12 1228003 (2024)
Yanli Wang, Mi Wang, Zhipeng Dong, and Chengcheng Fan
ObjectiveThe GaoFen-5B (GF-5B) satellite launched on September 7, 2021 can achieve comprehensive atmosphere and land observation. The visual and infrared multispectral sensor (VIMS) of the GF-5B satellite can obtain imagery data in 12 spectral bands from visible light to long wavelength infrared. With the advantages of a high signal-to-noise ratio and the ability of day and night observation, the imagery of visual and infrared multispectral sensors is widely applied to land degradation monitoring, crop growth analysis, and thermal pollution detection. GF-5B is equipped with three star sensors as the attitude measurement system to achieve high-precision attitude determination and geometric positioning. Among these star sensors, star sensors 2 and 3 have better measurement accuracy and stability performance and are often employed as conventional attitude determination modes to calculate satellite attitude parameters. However, owing to factors such as sunlight exposure and insufficient star number, there are only star sensors 1 and 2 or star sensors 1 and 3 working simultaneously to determine the satellite attitude parameters, which are named unconventional attitude determination modes. Due to the spatial thermal environment changes of satellites, the body structure and installation structure of the attitude measurement load undergo thermoelastic deformation, which causes attitude low frequency error related to the satellite orbit period. This seriously affects the consistency of attitude determination results between conventional and unconventional attitude determination modes and the stability of the geometric positioning accuracy of the image without ground control points. Therefore, we propose an improvement method of geometric positioning accuracy for visual and infrared multispectral imagery based on spatiotemporal compensation of attitude low frequency error.MethodsBased on the optical axis angle of star sensors, the spatiotemporal characteristics of low frequency error of star sensors are analyzed in 181 d for the GF-5B satellite. The median filtering denoising processing with the sliding window is applied to separate the low frequency error and the random error between conventional and unconventional attitude determination modes. Then, due to the complex local spatial locations, the attitude low frequency error between conventional and unconventional attitude determination modes is segmented based on satellite latitude position information. According to the spatial characteristics of attitude low frequency error, the low frequency error between conventional and unconventional attitude determination modes is calibrated in each position interval using the Fourier series model with the input parameter of satellite position latitude. For solving the drift problem of attitude low frequency error over time, we propose the sequential temporal models of low frequency error to ensure high-precision low frequency error compensation. In the attitude low frequency error compensation, the compensation model of attitude low frequency error of the unconventional attitude determination mode is selected among the sequential temporal models with the input parameter of sampling time. Then, the compensation parameter of attitude low frequency error is calculated using the Fourier series model with the input parameter of latitude position.Results and DiscussionsEmploying the experimental data of visual and infrared multispectral sensors, we analyze the calibration accuracy of attitude low frequency error, compensation accuracy of attitude low frequency error, and geometric positioning accuracy of visual and infrared images. For the calibration accuracy of attitude low frequency error, the model errors along yaw angle, roll angle, and pitch angle calibrated by the proposed method are 0.178″, 0.095″, and 0.131″ respectively (Table 3). Meanwhile, the model errors along yaw angle, roll angle, and pitch angle calibrated by the global Fourier series model are 4.155″, 2.200″, and 6.173″ respectively (Table 4). The proposed attitude low frequency error model can achieve high-precision modeling with sub angular second level and is better than the global Fourier series model. Furthermore, the geometric positioning accuracy of images of visual and infrared sensors is optimized from 4.274 pixel to 1.867 pixel (Tables 6 and 7). Before attitude low frequency error compensation, the cross-track errors fluctuate between 1 pixel and 4 pixel, and the along-track errors fluctuate between 2 pixel and 10 pixel, which makes the geometric positioning accuracy change between 40 m and 200 m (Fig. 7). After attitude low frequency error compensation, the geometric positioning accuracy of each image is significantly improved, with the cross-track error and along-track error less than 2 pixel (Figs. 7 and 8). Additionally, the proposed method can achieve high-precision geometric positioning accuracy for the images at different time and areas.ConclusionsTo improve the geometric positioning accuracy of the visual and infrared multispectral sensor of the GF-5B satellite, we put forward an attitude low frequency error compensation method based on the spatiotemporal characteristics. The spatiotemporal characteristics of attitude low frequency error within 181 d are comprehensively analyzed, and then a compensation strategy with time sequence and multi-spatial models is proposed. Additionally, we execute slowequential calibration with certain time intervals to eliminate the drift problem of low frequency error over time and build a compensation model with the input parameter of latitude position to compensate for the spatial differences of low frequency error. The low frequency error characteristics between conventional and unconventional attitude determination modes are unified by the proposed method. This method improves the geometric positioning accuracy of visual and infrared multispectral sensors of the GF-5B satellite with different imaging time and imaging areas.
Jun. 25, 2024Vol. 44 Issue 12 1228004 (2024)
Dandan Zhi, Qichang Zhao, Zijun Wang, Jingjing Ma, Liguo Zhang, Sifeng Zhu, and Aiming Zhou
ObjectiveThe output of the FY-3B satellite's medium resolution spectral imager (MERSI) visible on-board calibration (VOC) degrades with time, which causes concerns regarding its reliability in absolute radiometric calibration. The users must distinguish between the uncertainties determined by the VOC system's radiometric output and the MERSI detectors since this will lead to a detailed temporal evolution comprehension of the MERSI system and VOC radiometric characteristics. Additionally, this can ensure the remote sensing data are fully calibrated and utilized in the observed target study. We aim to investigate the output variation of the MERSI VOC system and have made special efforts to extract the information variations of VOC radiometric performance. The annual degradation rates which are defined as the percentage difference between the results of the first and last measurements of each year are employed to evaluate the VOC radiometric performance. The results are evaluated against the trap detector monitoring to further validate the proposed proceeding approach.MethodsBased on the characteristics of the satellite orbit and the structures of the MERSI VOC, we introduce a novel methodology to assess changes in the VOC system's radiometric output, with a particular focus on analyzing the relationship between the sunlight calibration opportunities and the angles of solar zenith and solar azimuth. Then we screen out the sunlight-based calibration data from multiple light sources (interior lamps, sunlight, space view background) calibration data. The analysis is to provide perspectives on the comparative radiometric performance of MERSI. Meanwhile, the majority band response seems to follow a somewhat downward trend. Subsequently, the performed relative response characterization step employs an exponential function created via least-squares fitting of the VOC data. High-quality MODIS data are leveraged to develop a top-of-atmosphere (TOA) bidirectional reflectance distribution function (BRDF) model and thus enhance the study precision. The time series of TOA reflectance acquired by BRDF model fitting is compared with that measured by MODIS, with the time series of BRDF modeling residuals analyzed. This model is consequently utilized in cross-calibration processing with nearly 10 years' worth of on-orbit data from MERSI. Cross-calibration processes include spectral matching between the two distinct sensors, viewing geometry correcting, and spectral interpolation. Additionally, the TOA reflectance is further converted to calibration coefficients using a calibration equation with zenith angle, azimuth angle, digital counts, and earth-sun distance. This is to comprehensively evaluate MERSI's absolute radiometric performance, and the relative and absolute radiometric characteristics of MERSI are standardized based on the initial regression point. This standardization treats the normalized difference as an indicator of the decay in VOC radiometric performance.Results and DiscussionsRecent studies using analysis of the MERSI sensor response to the Libya4 pseudo-invariant site and cross-calibration with MODIS show that the FY-3B MERSI has not deteriorated as much as the sunlight-based calibration trend has suggested. The comparison of the above lifetime trends and the relative and absolute radiometric characteristics of MERSI produce a distinction estimate in the calibrations of consecutive FY-3B MERSI pairs. We conclude that the degradation effects of the VOC radiometric performance can explain the observed differences. The results illustrate that the degradation rates of VOC radiometric performance are wavelength-dependent, with an initially higher rate gradually decreasing over the years and eventually stabilizing. Notably, in the early mission stages, the shortwave outputs (below 500 nm) exhibit a substantial degradation, reaching up to 49.51%. Conversely, the decay rates at longer wavelengths (800-1000 nm) are relatively modest, remaining within 26%. In the later stages of the satellite's mission life, the decay rates for most wavelengths are approximately 0.64%, except for 412 nm, which experiences a higher rate at approximately 1.91%. For further validating the employed proceeding approach, we make a comparison of the decay in VOC radiometric performance calculated by us with that monitored by the trap detector. Since we cannot determine how the data amount that passes through the filter changes while in orbit, the radiometric performance of VOC is all normalized by the first measurement value. The results indicate that the maximum percent differences observed throughout the instrument's lifetime remain below 15% at 470 nm and 14% at 65 nm.ConclusionsA general procedure is developed and implemented to provide users with the ability to characterize the decay rate in the VOC system's radiometric output. The results demonstrate that the maximum annual decay rates (ADRs) of the short-wave output (<500 nm) range from 46%-50%, while the longer wavelengths (800-10000 nm) reveal relatively smaller changes of approximately 26%. The current procedure implementation leads to further comprehension of changes in the VOC system output. The adopted novel methodology serves as a valuable reference for extending analogous endeavors that aim at conducting on-orbit absolute radiometric calibration for other sensors.
Jun. 25, 2024Vol. 44 Issue 12 1228005 (2024)
Haizhang Wu, Honglian Huang, Xiaobing Sun, Xiao Liu, Rufang Ti, and Yuxuan Wang
ObjectiveNatural objects are typically non-Lambertian, and their surface reflections have directionality. Therefore, changes in incident and observation angles can affect observation results. The bidirectional reflection distribution function (BRDF) is used to describe the directional reflection characteristics of objects. Currently, multiple BRDF-related products, such as MODIS (Moderate-resolution imaging spectroradiometer), POLDER (Polarization and directionality of the Earth’s reflectances), and MISR (Multi-angle imaging spectroradiometer) BRDF products, are available for selection. However, BRDF products, such as those aforementioned, have low spatial resolution and cannot be used for operations such as fine-grained vegetation parameter inversion and local climate scale research. Moreover, BRDF products with medium and high spatial resolutions are scarce. In recent years, with the rapid progress in medium- and high-resolution ground observation technologies, the number of medium- and high-spatial-resolution wide-field satellite remote sensing images has increased. For wide-field images, owing to their large width and field-of-view angle, the received surface reflectance is different and BRDF correction is required. Although wide-field satellite sensors provide high-resolution observational data, such data often comprise only single-angle observations. Consequently, BRDF/albedo inversion cannot easily be performed on multi-angle datasets. Therefore, for these types of satellite sensors, surface BRDF inversion can be performed by combining multi angle observation data from low-resolution satellite sensors or BRDF products. However, this may result in the problem of “mixed pixels” caused by the spatial scale differences between different resolution sensors. To address this issue, we investigate BRDF in medium- and high-resolution wide-field images. Based on the imaging characteristics of these wide-field images and using low-resolution sensors, we achieve BRDF kernel parameter inversion between multiple sensors and complete normalization correction of the wide-field images.MethodsThe image BRDF correction performed in this study employs atmospheric radiation correction; therefore, the atmospheric radiation correction of the image is first completed. The radiometric calibration coefficients are obtained to perform a radiometric correction of the HJ-2A/B satellite CCD (Charge coupled device) image, and the 6S radiative transfer model is used to establish a lookup table. Then, the atmospheric correction parameters are used to complete the atmospheric correction. Because the XML file of each scene image of the HJ-2A/B satellite CCD camera records only the illumination-observation geometry information of the image central pixel, the imaging angle information of each pixel is further analyzed and obtained using the satellite transit time, pixel latitude and longitude, and wide-field satellite imaging principles to realize pixel-by-pixel normalized BRDF correction of the image. Notably, different types of objects exhibit significant differences in their structural and optical characteristics, whereas similar objects have similar structural and optical characteristics. Assuming that the BRDFs of the same types of objects have similar shapes, the normalized difference water index (NDWI) and normalized difference vegetation index (NDVI) are used to classify different objects, and MODIS reflectance products are combined to obtain multi-angle observation data for different classifications. To address the problem of “mixed pixels” caused by the difference in resolution between CCD images and MODIS products, uniform pixels are selected for spatial scale matching using CCD images as the underlying surface, and only uniform pixel data are retained. Finally, the least squares method is used to invert the observed data to obtain the kernel parameters of different classifications. These parameters are substituted into the kernel-driven model and applied to the HJ-2A/B satellite CCD images to realize the BRDF normalization correction of the images.Results and DiscussionsThis study focuses on two types of land features, the Dunhuang Gobi and farmland in Zhaodong City, Heilongjiang Province, as the research area. A fitting comparison analysis is conducted between the RossThick-LiSparseR (RTLSR) and RossThick Maignan-LiSparseR (RTMLSR) models using the measured BRDF dataset. The results (Figs. 11-14) show that both models fit the two features and that their BRDF shapes are almost identical. The main difference is that RTLSR exhibits a relatively smooth characterization of hotspots. For areas such as the Gobi and farmland, where the hotspot effect is not significant, the RTMLSR model overestimates the hotspot to a certain extent, whereas the RTLSR model is applicable. Subsequently, the RTLSR model is selected to normalize and correct the BRDF of the HJ-2A/B satellite CCD image in the observation direction of the subsatellite point. (Figs. 15-17 and Tables 4-5.) shows that the original image has improved clarity and details after atmospheric correction and that the overall visual effect is close to natural observations after further completion of the BRDF correction. Simultaneously, the reflectance of the BRDF correction has a smaller root mean square error (RMSE) than that of the atmospheric correction and is closer to the reflectance measured in the field , effectively reducing the impact of the BRDF effect.ConclusionsThis study uses MODIS reflectance products MOD09A1 and MYD09A1 as prior knowledge, combined with detailed information on the underlying surface provided by HJ-2A/B satellite CCD camera data, to achieve joint inversion of the kernel parameters of the BRDF kernel-driven model between multiple sensors. To address the problem of “mixed pixels” caused by spatial scale differences between MODIS products and HJ-2A/B satellite CCD cameras, we use spatial position matching to select uniform pixels. The models for different ground object types are selected based on the assumption that the same type of surface BRDFs have similar shapes. The RTLSR and RTMLSR models are compared using two types of ground-measured BRDF datasets. The results show that the RTLSR model applies to areas where the hotspot effect is not noticeable. Applying the RTLSR model to the CCD images of the environment-2 satellite to achieve BRDF normalization correction effectively reduces the influence of the BRDF effect, providing an important method and reference basis for the future application of kernel-driven models in wide-field images.
Jun. 25, 2024Vol. 44 Issue 12 1228006 (2024)
Jingyuan Chen, Xiao Liu, Lili Du, Bo Song, and Xiaobing Sun
ObjectiveWith the continuous improvement in complementary metal-oxide-semiconductor (CMOS) manufacturing technology, the performance of CMOS sensors has been significantly enhanced, making them comparable to charge-coupled device (CCD) sensors. Additionally, due to their advantages such as high integration, small size, low power consumption, and fast speed, CMOS sensors have gradually become the primary imaging devices in many fields such as aerospace, biomedical, industrial vision, and digital photography. In optical remote sensing imaging, the development of high-performance optical CMOS cameras requires significant investment and long development cycles. Adopting computer technology to simulate remote sensing images is of great significance for camera design, image quality assessment, and research on data processing algorithms. Building noise simulation models that match the working principles of optical sensors is a necessary and meaningful task. Currently, there are many studies related to noise simulation of CCD and CMOS sensors, but research on noise simulation of area array CMOS sensors often focuses on one or a few types of noise. Therefore, it is necessary to comprehensively analyze the noise data characteristics of area array CMOS sensors and build a complete noise simulation model.MethodsWe analyze various sources of noise during the imaging process based on the physics of CMOS sensors, build a set of noise models for CMOS sensor images and conduct noise simulation and validation of the effects. Firstly, the noise generated during the signal conversion of CMOS sensors is analyzed. Then, based on the noise characteristics, we build a noise model and propose a parameter calibration method for this model. Finally, we carry out simulations based on the calibrated noise parameters and evaluate and compare the simulated images under different noise models with actual images. By employing aerial photography data from Huizhou, Guangdong Province captured by a CMOS camera array, we adjust the noise model parameters to simulate the main noise components, thus validating the reliability of the noise simulation model and the effectiveness of the parameter calibration method.Results and DiscussionsTo verify the superiority of the proposed noise model, we conduct laboratory simulations using two different noise models. Lab-captured R-channel bright field images with grayscale values saturated at 10%, 25%, 45%, and 60% of the dynamic range are selected as experimental objects. The simulated images using the proposed noise model exhibit brightness and noise distributions similar to those of the real images [Figs. 9(a) and 9(b)]. The average relative deviations of SNR, PSNR, and SSIM between simulated images using the Poisson-Gaussian distribution mixed noise model and real images are 4.83%, 1.21%, and 1.59% (Table 2). Meanwhile, the average relative deviations of SNR, PSNR, and SSIM between simulated images using the proposed noise model and real images are 3.85%, 0.99%, and 1.33% (Table 2). It is observed that the proposed noise model has smaller relative deviations, which validates the effectiveness of the proposed method. Furthermore, the result comparison under different grayscale values using the same noise model indicates that under identical camera settings, higher light intensity leads to higher SNR. Additionally, SNR increases more rapidly at lower illuminations and transitions to a relatively slower growth rate at higher illuminations, which conforms to the general rule of SNR varying with signal intensity. The camera is primarily affected by photon shot noise at low illuminations, while at higher illuminations, it is mainly influenced by residual noise such as read noise. This may explain the relatively larger relative deviation when the grayscale value is saturated at 45%. To verify the influence of each noise component in the noise model on the image, we make adjustments to the parameters of the noise model based on aerial photography data captured by a CMOS camera. As the total gain increases, the image photon shot noise also rises to decrease image contrast, which is particularly noticeable in darker areas [Figs. 11(a) and 11(b)]. Row noise introduces noticeable horizontal stripe distortion in the image, and as the scale parameter of row noise increases, the horizontal stripes become more pronounced [Figs. 12(a) and 12(b)]. Increasing the scale parameter of read noise leads to a decrease in image sharpness, especially in low-contrast areas. Noise blurs edges and details in the image [Figs. 13(a) and 13(b)].ConclusionsWe propose a comprehensive noise simulation model, which fits noise data with heavy-tailed distributions using the Tukey lambda distribution. Meanwhile, we provide a method to calibrate model parameters for the noise model. By applying this noise model and calibration method to a scientific-grade CMOS camera, we obtain the noise model parameters for the camera sensor. Simulations are then conducted based on the calibrated noise parameters, with the simulated images compared with real images. The results show that the average relative deviations of SNR, PSNR, and SSIM between simulated and real images are 3.85%, 0.99%, and 1.33% (Table 2). Additionally, the simulated images using our proposed noise model exhibit smaller relative deviations than those using different noise models. By adopting aerial photography data captured by a CMOS camera, we adjust the noise model parameters to simulate the main noise components. The simulation results reflect the influence of changes in noise model parameters on images and are consistent with the theoretical trends of noise characteristics. These two simulation experiments validate the reliability of the noise simulation model and parameter calibration method, and the effectiveness of the simulation method.
Jun. 25, 2024Vol. 44 Issue 12 1228007 (2024)
Weiwei He, Haochen Yuan, Jianjun Guo, Zihao Zhang, Huiliang Zhang, Yikang Zhang, Wei Zhou, and Kuijun Wu
ObjectiveWater transport has become an important pillar of global economic development owing to its numerous advantages, such as substantial capacity and low cost. However, ships release a considerable amount of harmful gases during navigation and docking. Among these emissions, SO2 accounts for a significant portion, and excessive emissions can pose significant risks to marine ecosystems, human health, and the environment at large. Therefore, it is particularly important to monitor SO2 emissions from ship exhaust. Among the various monitoring methods available, SO2 UV cameras have experienced rapid development due to their uncomplicated structure, extensive monitoring range, high measurement accuracy, and superior temporal and spatial resolution. They have found widespread application in monitoring pollutant gases in diverse fields, including volcanoes, industrial chimneys, and ships. Typically, UV cameras employ the four-image method for monitoring, wherein a series of pollutant plume images are captured over a period, followed by a change in the camera’s field of view to capture a set of images of the sky background. However, the effectiveness of the traditional four-image method is compromised by the significant fluctuations in the sky background caused by the ship’s movement within a short time series, leading to errors in the final measurement results. To enhance the result accuracy, this paper proposes a monitoring method based on the dual-channel ultraviolet camera principle and the engineering implementation of an image reconstruction method. This method enables real-time reconstruction of the background based on the plume image, facilitating accurate inversion of the SO2 column concentration.MethodsThe image reconstruction method begins by applying thresholding and labeling to the acquired plume images. Two thresholds are set using the adaptive threshold selection method, effectively distinguishing between the plume structure and the sky background based on the threshold interval. Subsequently, the labeled plume regions are removed from the image, resulting in an image devoid of plume structures. The eliminated plume structure is then replaced with null values, and a polynomial fit is employed to fill each column of the removed plume portion, thus generating a background image of the same size as the original image. This generated background image can then be merged with the captured plume image, thereby providing the optical thickness of SO2 gas within the ship's plume.Results and DiscussionsTo validate the scientific rigor and efficacy of the image reconstruction method, a self-developed dual-channel SO2 UV camera is utilized to gather ship exhaust emission data in Yantai Port, and the collected data are analyzed. Initially, SO2 column concentration inversion is conducted using both the traditional four-image method and the image reconstruction method proposed in this paper (Fig. 7). The experimental findings reveal a notable disparity between the SO2 concentrations derived from the inversions of the two methods. Specifically, the SO2 background remains elevated in the background portion of the sky in the SO2 column concentration images obtained using the conventional four-image inversion method. In contrast, the background concentration in the SO2 column concentration image obtained using the image reconstruction method appears purer and more consistent with the real situation. Subsequently, the SO2 column concentration images are integrated with the optical flow algorithm to calculate the corresponding emission rate and assess the error in the emission rate for both methods (Fig. 10). Upon comparison, it is observed that the image reconstruction method effectively rectified the errors stemming from the change in the background image in real-time, demonstrating high stability. Additionally, the variation amplitude of the calculated emission rate curve is smaller and exhibits smoother transitions, aligning more closely with the actual trends. Regarding emission rate values, the image reconstruction method reduces the error by approximately 66% compared to the four-image method, thus significantly enhancing the accuracy of the data inversion.ConclusionsThe experimental results demonstrate that the image reconstruction method proposed in this paper effectively adjusts the background image of the sky in real time, outperforming the traditional four-image method in both the inversion of SO2 column concentration and the calculation of the emission rate. This substantial enhancement significantly boosts the monitoring accuracy of UV cameras for SO2 emissions. With its technical advantages of simplicity, practicality, and accuracy, the image reconstruction method exhibits promising prospects in remote sensing monitoring of mobile pollution sources. It is anticipated that this method will offer more reference value for the development of UV remote sensing monitoring systems and further advance UV imaging technology in monitoring and application fields.
Jun. 25, 2024Vol. 44 Issue 12 1228008 (2024)
Hao Hu, Jiatian Li, Xiaohui A, Ye Duan, Jingjing Wei, and Jiayin Liu
ObjectiveOptical remote-sensing images are widely used in land planning, natural-resource monitoring, disaster response, and other fields owing to their timeliness, large observation range, and clear visual characteristics. However, approximately 70% of optical remote-sensing images are occluded by clouds. Cloud occlusion complicates ground-information extraction, thus severely limiting the application of optical remote-sensing images. Therefore, cloud removal from optical remote-sensing images is necessary in the preprocessing of remote-sensing images. Compared with the conventional method of removing clouds from optical remote-sensing images, cloud removal based on deep learning presents better effect and a higher accuracy, thus mitigating the issues of conventional algorithms. Recently, denoising diffusion probabilistic models (DDPMs) have attracted much attention due to their generation capabilities beyond generative adversarial networks. DDPMs are generative models that can generate high-quality images closely reflecting the distribution of training data and have achieved the best results in terms of image generation, super-resolution, segmentation, and repair. However, they require significant computing resources to perform denoising. By contrast, the latent diffusion model can obtain high-quality images under less demanding computing requirements. Therefore, this study proposes a cloud-removal method based on the latent diffusion model to remove cloud occlusion from optical remote-sensing images and restore their surface information.MethodsThe cloud-removal method using the hidden diffusion model for optical remote-sensing images proposed herein is outlined as follows: first, a perceptual compression model is used to learn a hidden space on a cloudless remote-sensing image, and a hidden-space perception equivalent to the original pixel space is established. Training the DDPM in a hidden space can reduce the computing requirements and ensure high-quality image generation. Subsequently, a cloudy image is added to the hidden space to guide the diffusion model to generate a cloudless image, and noise estimation is performed using a U-Net-like cross-covariance self-attention noise estimation network (NEUTViT). The NEUTViT includes a jump connection, cross-covariance attention mechanism, and gated linear unit, which can effectively utilize low-level features, significantly reduce the computational burden, improve the nonlinear characterization ability, and achieve more accurate noise estimation. Additionally, the loss of a similar structural constraint is introduced in the forward process to alleviate the randomness of model generation and guide the model to generate cloudless images closer to the source image, thereby achieving a better cloud-removal effect.Results and DiscussionsFirst, the possibility of applying the latent diffusion model for removing clouds in optical remote-sensing images is investigated. The proposed method is evaluated on the STGAN and SEN12MS-CR Winter datasets. On the STGAN dataset, the signal-to-noise ratio and structural similarity are 26.706 and 0.759, respectively, which are 9.855 and 0.171 higher than those yielded by the comparison method on average. On the SEN12MS-CR Winter dataset, the signal-to-noise ratio and structural similarity are 28.779 and 0.798, respectively, which are 7.683 and 0.124 higher than those yielded by the comparison method on average. Experimental results show that the proposed method is superior to the comparison method and can remove clouds in optical remote-sensing images more effectively (Tables 1 and 2). The cloud-removed image yielded by this method offers three advantages: 1) high color fidelity; 2) favorable textural-detail preservation; 3) considerable ability to remove shadows caused by clouds (Figs. 6 and 7).Second, we discuss the effects of the cross-covariance attention mechanism and gated linear units on a noise-estimation network. Experiments show that the cross-covariance attention not only improves the noise estimation ability of the noise-estimation network but also significantly reduces the computational complexity of the model. The gated linear unit effectively reduces the computational complexity of the network and enhances the cloud-removal ability of the model (Table 3).Finally, a model using a single loss L2 and another model using joint loss (L2+LSSIM) were compared. The model using the joint loss achieved better results. Compared with the single loss L2, the joint loss enhances the global-structure-recovery ability of the model and improves the quality of the cloud-free image generated by the model (Table 4).ConclusionsCloud removal in remote-sensing images is mandatory in the preprocessing of remote-sensing images and has been investigated extensively. This paper proposes a method to remove clouds from optical remote-sensing images using a hidden diffusion model and restore their surface information. In the forward process, a structural-similarity constraint loss is introduced to alleviate the randomness of model generation, and a U-Net-like cross-covariance attention noise estimation network (NEUTViT) is proposed to estimate the noise distribution more accurately. The cloud removal results obtained on two datasets outperform that of other single-image remote sensing cloud removal methods. The LDMCR model proposed herein performs better than other similar methods; however, it presents some limitations. For example, it can not easily reconstruct surface information enshrouded by large, thick clouds and does not use additional data as aid. In the future, we will use auxiliary data (such as SAR images) and combine them with the cloud-removal tasks of large-scale optical remote-sensing images to investigate cloud removal from optical remote-sensing images using the latent diffusion model.
Jun. 25, 2024Vol. 44 Issue 12 1228009 (2024)
Chunyuan Shao, Mingjian Gu, Chengli Qi, Lu Li, Tianhang Yang, and Xing Chen
ObjectiveThe infrared Fourier spectrometer is based on interferometric spectroscopy, which features high spectral resolution and high sensitivity. Due to the ultra-fine spectral resolution of infrared hyperspectral atmospheric detection instruments, minor errors in spectral calibration can cause radiation measurement errors. High precision spectral calibration is an important prerequisite for quantitative inversion and the application of infrared remote sensing. The spectral calibration accuracy is affected by the limited field of view and off-axis effect. The traditional method is to obtain the spectral calibration coefficient by fitting multiple spectral lines. However, for issues such as ultra-high spectral resolution and wide observation spectral bands, most spaceborne infrared hyperspectral instruments employ forward modeling methods to build instrument spectral response models and remove various spectral effects.MethodsBased on the optical field of view characteristics, we conduct spectral simulations of limited field of view and off-axis effect, and study spectral correction methods for the plane array Fourier spectrometer. Firstly, the influence of instrument line shape function (ILS) is analyzed to determine the analysis methods for different influencing factors (such as finite optical path difference, finite field of view, and off-axis effect). Next, by taking a planar circular detector as an example, the ILS function is constructed by combining the optical characteristics of the instrument itself. Then, the spectral calibration error and spectral sensitivity caused by the off-axis effect are simulated by gas absorption spectroscopy. Finally, test data of the optical field of view is obtained via slit scanning. Based on the pre-launch spectral calibration data of FY-3F/HIRAS-Ⅱ, spectral correction and calibration accuracy verification are carried out.Results and DiscussionsThe experimental results indicate that the limited field of view and off-axis effect cause the spectrum to broaden and shift to a low wavenumber direction. There is a quadratic relationship between the off-axis angle θrc and the pixel field of view angle θR and the spectral calibration accuracy. The off-axis angle is more sensitive, and its contribution to the spectral calibration accuracy is much greater than that to the pixel field of view angle. When θR =60′, the error caused by measurement accuracy of 2′ is approximately 1.3×10⁻⁶. When θrc =101.82′(-72′, 72′), the error caused by the measurement accuracy of 2′ in a certain direction is about 12×10-6. After spectral calibration and correction, the spectral calibration accuracy of the center worst pixel decreases from -24.69×10⁻⁶ to 0.54×10⁻⁶, and the edge worst pixel reduces from -513.38×10⁻⁶ to -0.15×10⁻⁶. All pixels in the three bands meet the indicator requirement of less than 7×10⁻⁶.ConclusionsBased on the characteristics of the infrared hyperspectral atmospheric detector for the FY-3F satellite, the ILS function and spectral comprehensive effect matrix are constructed. The sensitivity analysis is conducted on the spectral calibration accuracy. By adopting the simulated results of HITRAN as the standard spectral line, the spectral calibration accuracy of long-wave NH3 absorption spectral lines under different off-axis angles and pixel field of view angles is studied. There is a quadratic function relationship between the spectral calibration accuracy and the angles. The sensitivity to off-axis angles is much higher than that to the pixel field of view angles, the spectral calibration accuracy of the central pixel is -18.84×10⁻⁶, and the spectral calibration accuracy of the outermost pixel is -451×10-6. Meanwhile, the spectral calibration accuracy caused by position error and pixel size error under the existing optical field of view testing conditions is 1.3×10⁻⁶ and 12×10-6 respectively. We have studied pre-launch spectral calibration and calibration methods based on instrument optical characteristics and completed the pre-launch spectral performance evaluation of FY-3F/HIRAS-Ⅱ. After spectral correction, the maximum spectral calibration accuracy of each pixel in the three bands is 2.23×10⁻⁶, which meets the spectral calibration index requirement of 7×10⁻⁶. Additionally, our study also has guiding significance for designing and testing optical field parameters in the future and improving spectral calibration accuracy.
Jun. 25, 2024Vol. 44 Issue 12 1230001 (2024)
Linfeng He, Weihao Liu, Yifei Huang, Lifu Duan, Weilin Ye, and Chuantao Zheng
ObjectiveTrace gas detection is related to various fields in today’s world, including industrial and agricultural production, environmental monitoring, medical research, and safety protection. With the rapid development of laser technology, laser absorption spectroscopy has been widely employed in trace gas detection. Quartz-enhanced photoacoustic spectroscopy (QEPAS) based on quartz tuning fork (QTF) for detection is known for its simplicity, robust interference resistance, low cost, and quality factor. Meanwhile, resonance tubes are often coupled on both sides of the tuning to form standing sonic waves and improve the sound pressure in the QTF, which can thus enhance the tuning fork resonant for increasing the QEPAS detection performance. Although theoretical models for one-dimensional acoustic resonant tubes in co-axial QEPAS have been proposed, there remains a need for advancements in modeling, simulation techniques, and also comparative experiments to further refine the gain performance of the resonant tube in co-axial QEPAS technology.MethodsA commercial QTF operating at 32 kHz (Fig. 1) is utilized, and the theoretical model of QTF cantilever beam vibration is built, with the resonant coupling model between the QTF and resonant tubes proposed. Meanwhile, finite element analysis is employed to conduct a series of simulated studies to assess the gain performance of co-axial and asymmetric resonant tubes. The influence of the resonant tube parameters on gain performance is investigated, including the internal diameter, the length, and the gap between the tube and the tuning fork. To verify the simulations, we establish a QEPAS gas detection system. Initially, five resonant tubes with different parameters along with bare tuning forks are selected for experimental testing. By comparing the experimental results of these five resonant tube systems with the bare tuning fork system, the gain performance of the resonant tubes is confirmed. Subsequently, the optimized resonant tube system undergoes long-term measurement of standard methane gas with a volume fraction of 5×10⁻³, which verifies the stability and sensitivity of the system configured with resonant tubes.Results and DiscussionsThe effective vibration mode of the tuning fork in the simulation is identified as its fourth-order modal (Fig. 3), characterized by two opposing cantilever vibration modes. The corresponding characteristic frequency at this mode is 32772 Hz, which is close to the commonly adopted commercial tuning fork calibration frequency of 32768 Hz, with an error of 0.01%. This confirms the effectiveness of the model and simulation approach. The simulation reveals that the optimal laser incidence position for the commercial quartz tuning fork is 0.7 mm away from the top. The closer distance of the resonant tube to the tuning fork leads to a stronger coupling effect. In co-axial symmetrical resonant tube systems, as the inner diameter of the resonant tube decreases, the corresponding optimal length increases, bringing about a more significant gain effect (Fig. 6). In the same conditions of the minimum inner diameter of the resonant tube, symmetrical structures exhibit superior gain performance than asymmetrical structures (Fig. 7). The simulation-optimized tube has the inner diameter of 0.3 mm and length of 5.12 mm. The QEPAS system is set up (Fig. 8), and experimental results show that by employing this resonant tube in the detection system, the gain performance increases 15 times compared to the bare tuning fork system (Table 2). This system is further subjected to long-term measurement of standard methane gas with a volume fraction of 5×10⁻³. Allan variance analysis reveals that the detection limit of this system reaches a volume fraction 2.07×10⁻⁶ under the integration time of 72 s (Fig. 10).ConclusionsCurrently, there is a lack of comprehensive and systematic research on the gain performance of resonant tubes widely adopted in QEPAS systems. To this end, we start by building a model for a commercial 32 kHz QTF. Subsequently, we employ finite element analysis to investigate the gain performance of both co-axial symmetrical and asymmetrical resonant tubes and conduct validation experiments. Our research shows that within co-axial symmetrical resonant tube systems, a decrease in the inner diameter of the resonant tube leads to correspondingly rising optimal length, bringing about a more significant gain effect. In the same conditions of the minimum inner diameter of the resonant tube, symmetrical structures exhibit superior gain performance than asymmetrical counterparts. However, excessively small inner diameters of the resonant tubes can introduce assembly complexities and limit the beam size. Finally, the system configured with the optimized resonant tube (inner diameter of 0.5 mm, length of 5.04 mm) exhibits a 15 times improvement in gain performance compared to the bare tuning fork system. The system undergoes long-term measurement of standard methane gas with a volume fraction of 5×10⁻³, with the results indicating that the system's detection limit is 2.07×10⁻⁶ under the integration time of 72 s.
Jun. 25, 2024Vol. 44 Issue 12 1230002 (2024)
Binqiang Ye, Changhong Chen, Xuejie Cao, Hong Liu, Bin Tang, Dong Li, and Peng Feng
ObjectiveChemical oxygen demand (COD) refers to the quantity of reducing substances in water requiring oxidation. As the COD concentration becomes higher in water, the organic pollution is more severe. The decomposition of a large amount of organic pollutants excessively consumes dissolved oxygen in water, fostering anaerobic bacterium proliferation and resulting in water discoloration and malodor. Consequently, COD has become an important indicator for water pollution assessment. Spectral analysis for water quality COD assessment is one of the contemporary research focuses. Compared to conventional single-source spectral data prediction, using multi-source spectral data enables the extraction of richer feature information, thereby enhancing prediction accuracy. However, the key issue in detecting COD concentration using spectral methods is how to select appropriate feature wavelengths and establish regression models. Traditional feature extraction techniques (such as particle swarm optimization, ant colony optimization, and other swarm intelligence algorithms) exhibit screening efficacy. However, due to spectral data redundancy, more intelligent individuals are required for feature search, which greatly increases the computational load. If the number of intelligent individuals is reduced, the feature search range of spectral data needs to be narrowed, such as truncating the ultraviolet-visible spectrum to 200 to 400 nm and increasing the excitation and emission intervals of three-dimensional fluorescence spectroscopy. These methods will reduce the utilization range of spectral features. Therefore, we propose a multi-source spectral fusion algorithm for predicting COD concentration in water. The algorithm utilizes deep learning methods to train COD prediction models and determines the attention level of each position in the ultraviolet-visible absorption spectrum and three-dimensional fluorescence spectrum through a perceptual convolutional network. It continuously removes features with high attention levels and retrains the network to discover potentially overlooked effective features. Then, it further screens and utilizes the fused feature positions with the highest attention levels to establish a PLS model to predict COD concentration, aiming to better utilize all effective features in spectral data.MethodsWe introduce a multi-source spectral fusion method for water quality COD detection. The method establishes a convolutional network that integrates three-dimensional fluorescence and ultraviolet-visible spectra. The structure is depicted in Fig. 1. The model initially extracts diverse features from stacked convolutional modules of three-dimensional fluorescence and ultraviolet-visible spectra and then integrates the feature information of three-dimensional fluorescence and ultraviolet-visible spectra through two fully connected layers. Subsequently, a 2×1 fully connected output is used to predict the COD result and then used to calculated the preference of the multi-spectral convolutional network for different features. The network is continuously removed from the training process to remove the features that are highly concerned, and the removed features are used to retrain the network to explore the effective features that have been neglected as much as possible. Ultimately, the PLS model is employed to further screen the key combination features and realize the prediction of COD concentration.Results and DiscussionsThe experimental results of the PLS prediction model established by combining features are presented in Fig. 7. The left panel of Fig. 7 shows the experimental results using ten-fold cross-validation, revealing a correlation coefficient of 0.99989 and an RMSE of 1.4398. The right panel of Fig. 7 illustrates the experimental results using leave-one-out cross-validation, demonstrating a correlation coefficient of 0.99993 and an RMSE of 0.9875. Table 4 summarizes the experimental results, including correlation coefficients and root mean square errors for four modeling methods. From Table 4, we find that the proposed prediction model outperforms the other three prediction models in terms of correlation coefficients and root mean square errors using both leave-one-out cross-validation and ten-fold cross-validation approaches. The RMSE of leave-one-out cross-validation is 0.9875, which is much lower than that of the other three prediction models. Comparisons show that the prediction model proposed in this paper is superior to the other three prediction models.ConclusionsThe experimental findings show that the multi-spectral feature-level fusion model achieves better detection performance compared to SVR, PLS, and IPLS, with a reduction of 56.7% in the RMSE of the best IPLS leave-one-out method, reaching 0.9875. The modeling method proposed in this paper demonstrates good feasibility. Using deep learning methods, it can extract effective feature advantages amidst a plethora of redundant attributes while avoiding the challenges of limited generalization capabilities of deep learning models arising from sparse spectral data and water quality labels, which can more accurately detect water quality COD and provide a new means of predicting COD concentration for online water quality detection. At the same time, our multi-spectral fusion-based modeling method holds promise for application in data analysis and model establishment in other detection and recognition fields.
Jun. 25, 2024Vol. 44 Issue 12 1230003 (2024)
© Copyright 2018-2021 | Chinese Laser Press.
All Rights Reserved 沪ICP备15018463号-20