


Please enter the answer below before you can view the full text.


2024
Volume: 51 Issue 13
33 Article(s)

Zhen Liu, Xiaopeng Zhu, Decang Bi, Jiqiao Liu, and Weibiao Chen
ObjectiveCoherent detection lidar, a pivotal optical sensing technology, is widely used in various fields, including meteorological forecasting, wind energy generation, and other fields. However, the performance of coherent-detection lidar is significantly affected by atmospheric turbulence in practical applications. Turbulence induces random variations in the optical path, resulting in wavefront distortion that adversely affects the quality of the received beam. Wavefront distortion correction, achieved through adaptive optics technology, has been proved to be an effective solution. The core of this method involves the use of optimization algorithms to control a deformable mirror, generating a phase that is conjugate to the wavefront distortion, thereby compensating for wavefront aberrations. The stochastic parallel-gradient descent (SPGD) algorithm is widely used for this purpose. However, because of the introduction of random perturbations, it exhibits a slow convergence speed. The particle swarm optimization (PSO) algorithm, proposed by Kennedy and Eberhart, is favored owing to its rapid convergence, simplicity, independence from derivative information, and parallel computation capabilities. However, both algorithms are susceptible to becoming trapped in local optima, particularly when addressing large and complex problem spaces. To address this challenge, we propose an improved PSO algorithm for distortion spot correction.MethodsThe improved PSO algorithm introduces the Metropolis criterion to probabilistically accept solutions with relatively low performance, which aids in escaping local optima, thereby achieving a higher convergence limit. The application of this algorithm to wavefront distortion correction further enhances the correction capabilities. First, we simulated the laser transmission through atmospheric turbulence based on the multi-phase screen propagation principle, resulting in the generation of distorted spots. Subsequently, we optimized the inertial parameters in both the PSO and improved PSO algorithms as well as the gain coefficients and perturbation amplitudes in the SPGD algorithm. This is because different parameter values can significantly influence the optimization performance. Hence, these parameters were adjusted to ensure that the algorithms operated at their peak efficiencies. Finally, we conducted a comprehensive comparative analysis of the correction results achieved by the SPGD, PSO, and improved PSO algorithms under medium and strong turbulence conditions, using the Strehl ratio (SR) as the evaluation function.Results and DiscussionsThe improved PSO algorithm exhibited remarkable insensitivity to the inertial parameters (Fig. 9), indicating its superior robustness. All three algorithms were employed to correct the distorted spots under medium and strong turbulence conditions (Figs. 10 and 11). Based on the correction results, the convergence speed and limit were analyzed. Table 2 lists the convergence iterations and the time required by each of the three algorithms to achieve convergence. Under similar conditions, SPGD converges the slowest, followed by PSO, and the improved PSO converges the fastest. The reason for this discrepancy is the pronounced stochasticity of the SPGD algorithm during the optimization process, resulting in a longer convergence time. Additionally, the improved PSO algorithm concentrated the energy of the corrected distorted spot and achieved a higher SR because it increased the probability of accepting bad solutions (Fig. 12). Under strong turbulence conditions, the SPGD, PSO, and improved PSO algorithms contributed to SR improvements of 1.2, 2.6, and 3.2 times, respectively. Strong turbulence can result in severe spot distortion. When local optima are present during optimization, the advantages of the improved PSO algorithm become particularly prominent, enabling it to attain a higher convergence limit. This is advantageous for enhancing the system coupling efficiency, thereby effectively improving the performance of coherent detection lidar.ConclusionsCoherent detection lidar is affected by atmospheric turbulence. Turbulence results in spot distortion, which reduces the detection performance. AO technology is an effective method for mitigating this distortion, and the selection of an intelligent optimization algorithm is crucial in this process. The SPGD algorithm exhibits parallel processing capabilities; its incorporation of random voltage perturbations results in slow convergence, whereas the PSO algorithm not only offers parallel processing and simplicity but also achieves rapid convergence without the need for derivative information. Nonetheless, both algorithms easily fall into the local optima. To address this problem, this study proposes an improved PSO algorithm that introduces the Metropolis criterion to escape local optima and reach a higher convergence limit. This algorithm is insensitive to the inertial parameters and exhibits better robustness. In comparison with the SPGD and PSO algorithms, the improved PSO algorithm enhances the convergence speed and convergence limit. In summary, the improved PSO algorithm demonstrates a more advantageous capacity for improving the performance of coherent detection lidar, particularly for strong turbulence.
Jul. 10, 2024Vol. 51 Issue 13 1305001 (2024)
Wenbai Yang, Hao Xiong, Hong Yu, Zheqiang Zhong, and Bin Zhang
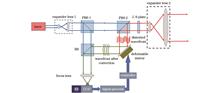
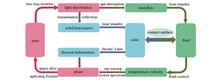
In the subsequent time step, the heat source distribution is updated based on the newly calculated optical field, and the optical field as well as the temperature, velocity, and deformation in the next moment can be obtained by repeating the iteration process. Based on this, we propose a novel approach to suppress the thermal effect of a laser via a rotating beam, which is generated by the coherent superposition of two Laguerre-Gaussian (LG) subbeams with different wavelengths and opposite topological charges. The effects of the rotation rate, topological charge number, and gas absorption coefficient on the propagation characteristics of the rotating beam in the inner channel are quantitatively analyzed.ObjectiveThe absorption of laser energy by gases and optical components in inner channels of high-power laser systems leads to complex interactions among laser, fluid, and solids. This interaction causes uneven optical path differences as laser beams propagate, significantly degrading beam quality. As laser power continuously increases, this degradation, driven by thermal effects in the inner channel, becomes more severe. Understanding the mechanism of thermal effect and developing strategies to reduce beam quality degradation are essential. However, most existing studies on mitigating the thermal effect of the inner channel focus primarily on the laser-fluid interaction, often overlooking the optical-structure interaction. In this study, a physical model of the multi-field coupling interaction of the laser-fluid-solid in the inner channel is established to reveal the propagation characteristics of a rotating beam in the inner channel and mitigation methods are proposed for the degradation of beam quality caused by the thermal effect.MethodsIn this study, a physical model is established to investigate the propagation characteristics of a rotating beam in an inner channel, considering the laser-fluid-solid multifield coupling effect. To achieve this, a split-step Fourier algorithm is used to simulate the optical field in the inner channel at each time step. The resulting heat source distributions of the optical elements and fluid are then integrated into the calculations of the flow field and solid mechanics using the finite-element-method (FEM) method. By employing ray tracing and power spectrum inversion method, the aberrations due to the nonuniform distribution of temperature and velocity within the fluid, as well as the deformation distribution of the solid, can be accurately calculated. These results are subsequently incorporated into the analysis of the laser propagation, enabling the calculation and analysis of the propagation characteristics of the rotating beam within the inner channel.Results and DiscussionsDuring the evolution of the laser beam within the inner channel, heat in the fluid primarily accumulates along the beam path, resulting in the highest temperature near the surfaces of the mirrors (Fig. 4). Owing to the influence of natural convection, a gas with a higher temperature tends to flow in the opposite direction to gravity, leading to centroid drifting of the phase screen. Additionally, the centroids of the thermal deformation distributions of the optical elements exhibit different degrees of deviation because the optical elements exhibit different angles between the normal line and gravity direction (Figs. 4 and 5). It is worth noting that the optical path difference induced by the gas thermal effects is several micrometers, whereas the thermal deformations of the window mirror and reflection mirror are several sub-nanometers and tens of nanometers, respectively (Figs. 4 and 5), which are significantly smaller than those caused by the gas thermal effects (Fig. 6). The rotating beam effectively mitigates the laser thermal effect in the inner channel. The optical path differences caused by the thermal effect of the gas and optical elements heated by the rotated beam is more uniform than those heated by the unrotated beam (Figs. 7 and 8). Moreover, the peak-valley (PV) and root mean square (RMS) values of the optical path differences and deformations induced by the gas thermal effects are minimized when compared with those of the LG beam (Table 1). Furthermore, increasing the rotating beam angular rate and topological charge number and decreasing the gas absorption coefficient can lead to reductions in the Zernike coefficients of the additional phase. This phase is induced by the combined effects of gas thermal effects and mirror thermal deformations. Furthermore, it leads to improvements in the beam quality (β) of the output beam (Figs. 10, 11, and 12).ConclusionsBased on the physical model of the multi-field coupling interaction of the laser-fluid-solid in the inner channel, in this study, the propagation characteristics of the rotating beam are investigated in the inner channel. Under the specific boundary conditions considered in this study, the primary factor affecting the output beam quality is the nonuniform optical path difference induced by the thermal effects in the gas, which is significantly more pronounced than the thermal deformations on the mirror surface. The use of a rotating beam has been proven to be an effective method for suppressing these thermal effects during laser propagation in the inner channel, particularly for mitigating beam astigmatism and comet-like distortions. Additionally, increasing the rotation rate and topological charge can significantly improve the ability to suppress thermal effects. Reducing the gas absorption coefficient can further improve the quality of the output beam.
Jun. 22, 2024Vol. 51 Issue 13 1305002 (2024)
Chengxin Zhang, Chongshang Sun, Jiabin Wu, Jianqiang Zhang, and Zhibin Li
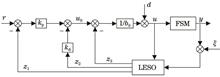
ObjectiveAs an optical beam pointing control device, fast steering mirrors (FSMs) are crucial components of essential equipment used in various fields such as aerial imaging, laser communication, and space exploration. An FSM driven by a voice coil motor has the advantages of a large stroke and low driving voltage, and it is easy to control. Quadrant detectors (QDs) have been used in FSM systems as angle sensors due to their low cost and wide measuring range. However, QDs are greatly affected by both Johnson noise and background light noise, resulting in large measurement noise. An active disturbance rejection controller (ADRC), which can effectively estimate and compensate for disturbances and unmodeled dynamics, has been applied to FSMs to improve tracking performance. Large measurement noise contaminates estimations and degrades disturbance rejection performance. Large measurement noise thus poses a significant challenge in controlling FSMs. Therefore, improving the tracking performance and disturbance rejection capabilities of FSMs driven by voice coil motors with relatively larger measurement noise is critical.MethodsAn improved ADRC (IADRC) was proposed by combining a Kalman filter with a model-assisted extended state observer (MESO). First, the effects of the selected gain of the extended state observer on the performance of the ADRC were analyzed and revealed a trade-off between disturbance rejection and noise rejection (Fig. 3?4). Second, a model identification method based on the Hankel matrix was used to identify the exact model of the FSM (Fig. 5). An IADRC was then designed (Fig. 6) that primarily consisted of a Kalman filter, model-assisted ADRC, and zero-phase error tracking controller (ZPETC). The Kalman filter was used for noise filtering, and the necessary signal was input to the MESO. The MESO-observed lumped disturbance was then added to the Kalman filter state equation. The model-assisted active disturbance rejection controller was chiefly composed of an MESO under linear state error feedback control laws. The MESO was responsible for estimating system states and lumped disturbance, and the PD controller was designed according to the states estimated by the MESO. Finally, to improve tracking performance, ZPETC was introduced as a feedforward controller.Results and DiscussionTo verify the control effect, the FSM was controlled by the IADRC, ADRC, and disturbance observer (DOB), and control performance and disturbance rejection experiments were conducted on a dSPACE platform. The experimental results show that the IADRC significantly improves the tracking performance of the FSM in high-frequency ranges (Fig. 9). The results also show that under a sinusoidal signal with an amplitude of 0.15° and frequency of 100 Hz as reference input, the tracking accuracy of the IADRC increases by 20.99% and 65.40% and the phase lag is reduced by 35.66% and 78.31% over those of the ADRC and DOB, respectively (Fig. 10). The comparisons of tracking performance were made more general by using sinusoidal signals with the same amplitude and various frequencies as well as with the same frequency and various amplitudes as reference inputs. The experimental results demonstrate that IADRC outperforms both ADRC and DOB in terms of tracking performance, showing a maximum increase in tracking accuracy of 65.40% (Tab. 1?2). Under the condition of zero input, a torque disturbance signal with an amplitude of 0.045° and frequency of 10 Hz is introduced, and the disturbance rejection performance of the IADRC is improved by 35.36% and 61.26% over those of the ADRC and DOB, respectively (Fig. 11). The IADRC can realize the accurate estimation and suppression of disturbances in the presence of relatively large measurement noise, thus effectively improving the control performance of the FSM.ConclusionsA new control method based on ADRC for an FSM system was proposed. The Kalman filter was integrated with the model-assisted ADRC to avoid control performance degradation caused by the MESO sensitivity to measurement noise. The lumped disturbance from the MESO was contained in the Kalman filter to achieve accurate estimation and rejection of the disturbance and to improve the disturbance rejection capabilities of the FSM system. The study showed that the IADRC can effectively improve the tracking performance and disturbance rejection capabilities of FSM systems and has high practicability in practical applications.
Jul. 02, 2024Vol. 51 Issue 13 1306002 (2024)
Le He, Xiaoke Yin, Yang Chen, Yingbo Chu, and Jinyan Li
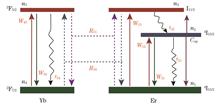
ObjectiveIn the Internet of Everything era, with the rapid development of the fifth generation mobile communication technology (5G), the traffic demand in current optical communication systems shows a rapid growth trend. However, the transmission capacity in the C-band, which is the conventional band, is insufficient to satisfy continuous requirements. Exploring new bandwidths is considered the most direct and effective solution for achieving capacity enhancement. Erbium-doped fiber (EDF) amplifiers, which are commonly used to compensate for losses, play a crucial role in achieving ultra-wideband, super-large capacity, and ultralong-distance transmission. These amplifiers rely heavily on EDF, which have prompted extensive research to realize an efficient broadband amplification performance. However, most reported EDFs utilize a core-pumping scheme that relies on low electro-optical efficiency and expensive single-mode laser diodes (LD). If the multimode pumped fiber, adopting multimode LD with high electro-optical efficiency and cost-effectiveness, performs comparably with existing commercial single-mode pumped fiber, then researching multimode pumped EDF provides a feasible method to expand the bandwidth and increase the transmission capacity.MethodsA cladding-pumping scheme using a multimode LD, known for its high power, has been extensively utilized in high-power fiber lasers. However, in the realm of fiber amplifiers for communication systems, the cladding-pumping scheme encounters the challenge of low optical pump efficiency owing to low pumping absorption. To address this issue, ytterbium is introduced into the EDF as a sensitizer to cross-relax with erbium, which enhances the pumping rate of erbium ions. Furthermore, phosphor-silicate glass is adopted to further inhibit the back-energy transfer from erbium to ytterbium and suppress the signal excited-state absorption. Using modeling based on the power propagation and rate equations, the doping ratio of ytterbium and erbium ions is optimized and verified to enhance the amplification performance. Considering that a higher erbium concentration may lead to clustering, which negatively affects the amplification performance of the fiber, the simulation ratio range of the ytterbium and erbium ions is set from 25∶1 to 40∶1. Furthermore, erbium-ytterbium co-doped phosphor-silicate fibers are fabricated using a modified chemical vapor deposition process combined with solution doping technology. The doping concentrations of ytterbium and erbium ions are measured using an electron probe microanalyzer, which shows good agreement between the simulated optimization and experimental preparation. Furthermore, the basic parameters of the fibers are tested. Additionally, a cladding-pumping erbium-ytterbium co-doped fiber amplifier is fabricated using a commercial 940-nm multimode LD. Based on the experimental setup, the amplification performance and power consumption are evaluated and compared with those of previously reported single-mode pumped fibers.Results and DiscussionsThe optimization criterion for the fiber length in the simulation is set as the fiber length corresponding to the highest flat gain at various doping ratios of ytterbium and erbium ions. As shown in Fig.2, as the doping ratio decreases, the gain of the fibers over the entire wavelength range increases. Simultaneously, the noise figure (NF) increases, and the noise deteriorates. Therefore, the doping ratio is optimized to 26∶1?30∶1 to obtain a trade-off between the gain and NF. Simulations are conducted to evaluate the gain variations with a pump wavelength of 940 nm, and results at signal wavelengths of 1580, 1600, and 1620 nm are shown in Fig.3(a). The maximum gain efficiency at 1620 nm is calculated as 33.6 dB/W, confirming the amplification advantage of the fiber at long wavelengths at this doping ratio. Furthermore, the 940-nm multimode pump LD shows an insensitivity to pump wavelength drift with gain fluctuation <0.3 dB, indicating a potential reduction in power consumption introduced via cooling equipment and mandatory temperature control. The amplification performance of the fabricated erbium-ytterbium co-doped phosphor-silicate fiber is evaluated based on the experimental setup with the cladding-pumping scheme. The gain and NF spectra are shown in Fig.6. With a signal power of -15 dBm covering 1565?1630 nm and a 940-nm pump power of 3 W, an average gain of 31.5 dB is obtained. At 1625 nm, the gain is 22.9 dB and NF is ~5.2 dB. Furthermore, a 20 dB gain bandwidth covering 1565?1625 nm (60 nm) is achieved. In contrast, conventional single-mode pumped EDFs need at least 2 W of pump power to achieve a >20 dB gain bandwidth up to 1625 nm. The electro-optical efficiencies of typical 980 nm and 1480 nm single-mode LDs are 12% and 6%, respectively, meaning that driving a 2 W pump power requires ~16.7 W and ~33.3 W electrical powers, respectively. However, this study utilizes a commercial 940 nm multimode LD with an electro-optical efficiency of 52%. Hence, only ~5.8 W electrical power is necessary to drive a 3 W pump power. This approach reduces power consumption by at least 65% when compared to that of common single-mode pumped EDFs. These findings support the conclusion that enhancing multimode-pumped erbium-ytterbium co-doped fibers offers an effective method for achieving efficient broadband amplification.ConclusionsIn this study, an erbium-ytterbium co-doped fiber is prepared via a modified chemical vapor deposition process. The doping ratio of erbium and ytterbium ions to enhance the amplification performance is optimized and verified by numerical simulations. Based on the experimental setup, the fiber exhibits 20 dB gain bandwidth covering 1565?1625 nm, with a signal power of -15 dBm and pump power of 3 W. Furthermore, the superiority of the pump scheme using 940 nm multimode is confirmed in terms of electro-optical efficiency and temperature stability.
Jul. 02, 2024Vol. 51 Issue 13 1306003 (2024)
Jia Qu, Xudong Wang, and Nan Wu
ObjectiveIn recent years, with the rapid development of wireless sensor networks and Internet of Things (IoT) technology, indoor positioning technology has been widely used in several fields, such as robot navigation. How to achieve accurate and fast positioning on the mobile platform has become a hot topic of discussion in the academic community. Visible light positioning technology based on visible light communication has the advantages of wide spectrum, good security and low cost, which makes it one of the most promising visible light positioning technologies. Common positioning methods for visible light positioning include received signal strength (RSS), time of arrival (TOA), time difference of arrival (TDOA), and angle of arrival (AOA). Neural network is a common technical means for indoor visible light positioning, but its shortcomings such as large quantity of parameters and long computing time limit the deployment of mobile platform. The emergence of high-performance and lightweight neural networks such as MobileNet and ShuffleNet provides the conditions for the deployment of visible light positioning mobile platform. In order to enhance the accuracy and real-time performance of the indoor visible light positioning system, a visible light fingerprint positioning algorithm based on improved ShuffleNet V2 neural network is proposed.MethodsIn a 5 m×5 m×3 m indoor scene, four transmitter light-emitting diodes (LEDs) are uniformly distributed on the ceiling, and the receiver is located on the ground at a height of 0 m. The channel model for line-of-sight transmission of indoor visible light communication is established, and the measurement formulas of RSS and AOA are given. The ground is divided into 2601 small cells of 0.1 m×0.1 m. The RSS and AOA at the center of each cell are collected separately, and the corresponding coordinates are recorded to construct a fingerprint library. In order to determine the suitable network structure, ablation experiments are conducted on the ShuffleNet V2 network, and the positioning network structure (Fig.12) is finally determined to compare the effects of different optimizers and learning rates on the positioning performance. The data from the fingerprint library are normalized and inputted into the improved ShuffleNet V2 network for training, preserving the trained model fixed. In order to test the generalization of the positioning algorithm, the training set is located at the ground level and fixed, and the test set is collected in the plane at heights of 0.5 m, 1 m and 1.5 m for positioning. High accuracy positioning results are obtained.Results and DiscussionsSimulation experiments are performed based on the indoor channel model. 2601 points are uniformly selected on the ground at a height of 0 m as the test set, and the data are inputted into the trained improved ShuffleNet V2 network for positioning (Fig.13). The positioning error fluctuates between 0.26 cm and 9.25 cm, with an average positioning error of 2.30 cm and an average positioning time of 174 ms. The positioning error is larger near the light source and indoor edges. Fixing the simulation parameters and comparing the positioning performance of the proposed method, convolutional neural network (CNN) and backpropagation neural network (BPNN), the proposed model converges around 10 epochs and the training set is well fitted to the validation set (Fig.15). Five repeated experiments are conducted respectively, showing that the error of the proposed model fluctuates the least (Fig.16). The cumulative distribution function (CDF) curves of the proposed model are shifted left (Fig.17) compared with those of CNN and BPNN, and are within the 95% confidence interval. The positioning errors of the three algorithms are 4.93 cm, 9.25 cm and 17.77 cm, respectively. Compared with single RSS fingerprint, the average positioning accuracy of this algorithm is improved by 54.1%, which indicates the superiority of the joint fingerprint feature positioning algorithm; in the case of unchanged fingerprints, compared with the CNN algorithm, the average positioning accuracy of the present algorithm is improved by 43.8% (Table 4). In the case of different heights (0.5 m, 1 m, 1.5 m) of the test set, the training set is still located on the ground and 121 groups of test samples are collected at intervals of 0.5 m under each height for the positioning experiments. For the height h=0.5 m, the average positioning error is 5.44 cm; for h=1 m, the average positioning error is 8.44 cm; and for h=1.5 m, the average positioning error is 16.31 cm.ConclusionsTo enhance the accuracy and real-time performance of indoor visible light positioning system, a visible light fingerprint positioning method based on improved ShuffleNet V2 is proposed. The method uses RSS and AOA of the reference nodes as joint fingerprint features and the receiver coordinates as training labels to construct the fingerprint database. Through ablation experiments, the ShuffleNet V2 network structure is improved, and the fingerprint database is introduced into the improved ShuffleNet V2 network training to achieve information exchange between different data channels and improve the feature extraction capability of the neural network. Simulation experiments are conducted for comparing and analyzing the performance of various visible light indoor positioning algorithms and confirming the technical advantages of the algorithm proposed in this paper. Under the indoor 5 m×5 m×3 m positioning scenario, the algorithm has an average error of 2.30 cm and an average positioning time of 174 ms. It proves the feasibility and efficiency of the proposed positioning method. Even if the fingerprint database data and the positioning data are located in planes at different heights, the centimeter-level positioning accuracy can be achieved, which meets the needs of most indoor positioning services.
Jun. 07, 2024Vol. 51 Issue 13 1306004 (2024)
Zhiguo Jiang, Jianing Ma, Shuxia Qian, Chaochao Wang, and Xianchao Zhang
ObjectiveThe detection of the cardiac cycle is essential for the diagnosis and analysis of cardiovascular diseases. In addition to bioelectric signals, a ballistocardiogram (BCG) is another physiological signal that can be used for cardiac cycle detection. Unlike electrocardiograms (ECGs), the collection of BCG signals does not require direct contact with the skin and is safe and noninvasive. The use of microbend fiber optic sensors for BCG sensing has the advantages such as simple structure, low cost, resistance to electromagnetic interference, and high sensitivity. When collecting BCG using a microbend fiber optic sensor, environmental noise, circuit noise, optical path noise, respiratory signals, and motion artifacts affect the performance of the sensor. These noise sources jointly destroy the BCG waveform, and the BCG exhibits nonlinear, nonstationary characteristics and significant individual differences in both the time and frequency domains, thereby affecting the accurate identification of physiological parameters such as the cardiac cycle from the BCG. Therefore, the corresponding signal-processing algorithms should be studied to achieve BCG waveform extraction and feature recognition.MethodsThe paper investigates the use of a microbend fiber optic sensor to obtain BCGs for cardiac cycle detection, which primarily includes three processes: BCG optical fiber sensing, BCG waveform extraction, and BCG feature recognition. For BCG optical fiber sensing, the microbend fiber optic sensor consists of a multimode optical fiber, grid structure, light source, photodetector, and signal processing circuit, which are embedded in the seat cushion to acquire the heart and lung vibration signals. An algorithm based on the smoothness prior approach (SPA) combined with improved variational mode decomposition (IVMD) is proposed for BCG waveform extraction. Based on the principle of regularized least squares, the SPA is first used to suppress the low-frequency trend term of the acquired signal. Subsequently, IVMD combined with central frequency and correlation analysis is used to suppress the high-frequency noise of the acquired signal. The center frequency of the intrinsic mode function (IMF) is used to determine the optimal number of layers for VMD decomposition, and the IMF correlation coefficient is used to select the IMF for signal reconstruction. For BCG feature recognition, the proposed algorithm uses prior information such as amplitude features and peak time intervals to locate feature peaks and then extracts parameters such as the heart rate and cardiac cycle.Results and DiscussionsThe weak heart and lung vibration signals acquired by the microbend fiber optic sensor contain an apparent periodic signal with a frequency of 5 Hz [Fig.5(b)], that is, the BCG, which provides a basis for the cardiac cycle segmentation of the signal. The SPA can effectively suppress the low-frequency trend term of the acquired signal (blue dotted line in Fig.7), and IVMD can effectively suppress the high-frequency noise of the acquired signal (red solid line in Fig.7). The J-peak of the BCG signal can be effectively located using the amplitude features and peak time intervals (Fig.8). The BCG and ECG signals of five participants are acquired simultaneously. With the ECG cardiac cycle as the reference standard, the algorithm obtains cardiac cycles from the BCG with a maximum standard deviation of 0.0287 s (Fig.10). The average heart rate is calculated using peak localization/wave group segmentation methods such as short-term energy (STE), template matching (TM), clustering approach (CA), and the proposed algorithm. The error of the average heart rate using the proposed algorithm is 0.69%, which is better than the three feature localization algorithms STE, TM, and CA (Table 3).ConclusionsThe proposed BCG waveform extraction algorithm combined with SPA and IVMD effectively suppresses the low-frequency trend term and high-frequency noise of an acquired signal. The proposed BCG feature recognition algorithm for locating feature peaks utilizing prior information such as amplitude features and peak time intervals can accurately obtain the cardiac cycle. The BCG-ECG signals of five participants are acquired. With the ECG cardiac cycle as the reference standard, the algorithm obtains cardiac cycles from the BCG with a maximum standard deviation of 0.0287 s, and the error in the average heart rate is 0.69%, which is better than that of the three feature location algorithms STE, TM, and CA. The BCG waveform extraction and feature recognition algorithm can effectively extract the cardiac cycle from the weak heart and lung vibration signals obtained by the microbend fiber optic sensor.
Jul. 02, 2024Vol. 51 Issue 13 1306005 (2024)
Ruixuan Zhang, Bingcai Liu, Xin Yue, Xinmeng Fang, Hongjun Wang, Xueliang Zhu, and Ailing Tian
ObjectiveAs we all know, in an ideal optical system, the object and image distances should satisfy the Gaussian formula in order to achieve clear imaging in the optical path. In digital holographic microscopy, clear imaging of the object’s light field is required for phase reconstruction. As a result, how to accurately establish the location relationship between objects and images during image capture has become a focus of current research. As the degree of defocusing grows, the image’s edge dispersion and brightness both grow, which can result in considerable disparities between defocused and focused photos. The focusing function determination is significantly hampered by holographic interference fringes, which are a component of the image information. Of these, the entire region shows high-frequency noise in both speckle and fringes, which significantly lowers the signal-to-noise ratio of the reconstructed image. Furthermore, it is challenging to identify the defocused image because conventional focusing mechanisms are typically noise-sensitive. Therefore, the key to tackling this challenge is identifying an appropriate focused picture evaluation technique.MethodsTo address the impact of noise errors introduced by holographic interference fringes during the experimental procedure on determining the ideal focal point, this research offers a digital holographic microscopic focusing imaging approach. This technique creates an off-axis digital holographic microscopic focusing imaging experimental system using transmission technology, based on the Mach-Zehnder interference system. The object optical path is scanned on-axis using a high-precision piezoelectric nano displacement stage to produce three sets of hologram sequences: digital holographic microscopic images, microscopic imaging image sequence, and simulated defocused sequence images. The impact of different speckle noise and interference fringes on the experimental results is ascertained by means of comparative observation. To address this issue, we propose a digital holographic focusing imaging algorithm based on the Butterworth feature function, which is divided into two steps. Firstly, the interference fringes of the hologram are suppressed in the frequency domain to obtain the hologram after inverse Fourier transform, and the eight-neighborhood gradient operator is used to obtain the maximum edge value. Then, different gradient operators are used to perform gradient calculations on the hologram and complete the focusing evaluation.Results and DiscussionsUsing the Butterworth low-pass filter described in this paper, the following conclusion can be reached from the holographic calculation results. The results after suppressing the interference fringes are shown in Fig.6, and the resolution plate morphology details are visible in the image, but with little oblique interference fringes in place of the more noticeable wide fringes. Because the wideband signal generated from the image’s Fourier transform is more prominent than the narrow band signal, gradient calculation is utilized to determine the total edge details in the image. When a large area of oblique fringes is suppressed, continuing to suppress small fine fringes will affect the gradient judgment of phase details. Therefore, coarse fringe suppression is only performed once for holograms. Various evaluation indicators are calculated for the results after calculation using five gradient operators, as shown in Table 1. In the same noise environment, the focus evaluation result obtained by the algorithm has a higher articulation ratio R. The sensitivity S of the hologram processed using the algorithm is significantly higher than the calculated result of the original hologram. In the presence of noise, the algorithm proposed can still maintain stability in flat areas, indicating its strong anti-noise performance. From the perspective of algorithm running time t, the algorithm has significantly improved computational efficiency. The R value of the focusing curve obtained by using the algorithm is increased to 13.34 times the original value, the S value is increased to 66.35 times the original value, the flat area volatility V value is decreased by 51.47%, and the t value is shortened by 54.78%. From the above analysis results, it can be seen that the algorithm proposed in this paper has certain advantages in various aspects. From Table 2, it can be seen that the actual measurement result of the focusing position 23 obtained by the algorithm is: the height is 0.3261 μm, which shows a relative error, in comparison with the white light measurement result of 0.3130 μm, of 4.19%; the line width is 6.810 μm, which shows a relative error, in comparison with the white light measurement result of 6.796 μm, of 0.206%. The focusing results obtained by the algorithm in this paper are accurate.ConclusionsThrough theoretical analysis and experimental verification, the focusing evaluation of the proposed holographic algorithm is completed. The experimental results highlight the advantages of the filtering model in digital holographic microscopic focusing imaging characteristics. By analyzing the calculation results of different gradient operators, it is proved that the algorithm in this paper ultimately leads to a more accurate focus position. From the perspective of reconstructed phase characteristics, the edge of the resolution plate is sharper, the focusing morphology is more prominent, and the stability of traditional operators is improved under the same noise environment. The results of quantitative analysis of the algorithm using different evaluation indicators show that, the focusing curve obtained by the algorithm in this paper has steeper peaks, uniform focus results, intense peak response, and reduced fluctuation in the flat area. The proposed algorithm can meet the requirements of digital holographic microscopy focusing imaging.
Jun. 07, 2024Vol. 51 Issue 13 1309001 (2024)
Xiafei Ma, Kaiyuan Yang, Haotong Ma, Hu Yang, and Zongliang Xie
ObjectiveOptical synthetic aperture is an effective technical approach for developing large aperture telescopes. The key to achieving diffraction limit for the actual resolution of synthetic aperture based opto-electronic telescopes lies in the real-time sensing and correction of piston error between sub-apertures. Among the traditional methods, the specific optics-based methods measure piston errors from the pupil information modulated by specially designed hardware, which inevitably increases the system complexity. The image-based methods can measure piston errors directly from the intensity image, which simplifies the system. However, it does need a large amount of iterative optimization calculation, thus failing to realize instant correction. Recently, deep learning method has contributed to many areas with piston sensing included, which is capable of achieving end-to-end piston sensing by fitting the mapping relationship between piston error and intensity image. Although many efforts have been made to improve the piston sensing performance of the deep learning model, most of the studies still stay in the simulation stage. In the few experimental studies, only piston sensing is implemented while co-phasing closed-loop correction has never been worked out. In the present study, we establish an optical synthetic aperture imaging experimental platform and implement co-phasing closed-loop experiment using deep learning approach. We hope that our research could be helpful for promoting the practical process of deep learning based co-phasing technology.MethodsReal-time closed-loop piston error correction is achieved for two-aperture system and three-aperture system, respectively. First, the experimental platform is built, where broadband light is utilized to remove 2π ambiguity and sequence piston errors are loaded to the sub-apertures to generate corresponding training images. Then, a lightweight MobileNet convolutional neural network (CNN) is established to learn the nonlinear mapping relationship between broadband point spread function (PSF) and piston error. By converting standard convolution module into depthwise separable convolution module, MobileNet effectively reduces model parameters and computational complexity while ensuring the overall performance of network, thus realizing fast inferring. When the loss function converges to the minimum stably, the training process is completed and the testing dataset is used to evaluate the performance of the network. In the next step, the well-trained model, which is capable of inferring the piston errors directly from the intensity images, is deployed on an embedded computing platform. When implementing the closed-loop correction, the image captured by charge-coupled device (CCD) is transferred to the computing platform and the instant piston error is obtained through forward inference of model in real time. Finally, piston error correction is carried out by controlling the piezo steering mirror based on the predicted output.Results and DiscussionsThe experimental results show that the lightweight MobileNet deep learning model realizes high-precision piston sensing and a large capture range of ±6λ0 (λ0=600 nm) is achieved by using 550?650 nm broadband light. For the two-aperture imaging system, the average value of the root mean square error (RMSE) between testing outputs of the network and true piston error values is about 18 nm (Fig.6). Besides, the predicted values are very close to the true values in the whole capture range. In the process of closed-loop correction, the residual curve converges to the zero line rapidly and stably. The initial piston error is 2.3λ0 and the average residual after closed-loop correction is about 0.043λ0. In addition, the PSF image with closed-loop correction is almost the same as the ideal image (Fig.7). Each piston prediction takes about 3 ms for the lightweight MobileNet, while the time is 10 ms for the VGG-19 model. It is evident that our method has significant advantage in real-time performance. Then another experiment is implemented in the three-aperture system, where the average value of RMSE between testing outputs of the network and true piston values is about 30 nm (Fig.9). The average residual after closed-loop correction is about 0.063λ0, which shows a reduced accuracy compared with the correction results of two-aperture system. This is because increasing sub-aperture number will complexify the mapping relationship between the PSF and the piston error. Correspondingly, the training data needed and the difficulty in training will greatly increase. Nevertheless, our study shows that there is little difference in the piston sensing time between the two-aperture system and the three-aperture system, which means the increase of sub-apertures to be measured has little effect on the real-time performance.ConclusionsIn the present study, deep learning based co-phasing closed-loop experiment of optical synthetic aperture is successfully implemented. This technology uses a single lightweight MobileNet CNN to extract piston information from focused PSF image, thus greatly reducing optical complexity of the system. At the same time, the end-to-end mode further simplifies the sensing process and achieves rapid and robust piston error estimation. Under the experimental conditions established in our study, it takes about 3 ms to complete each detection, which means good real-time performance is achieved. Fine co-phasing control with high sensing accuracy is realized for two-aperture system as well as three-aperture system. In summary, the reliability and superiority of deep learning co-phasing technology in engineering application have been preliminarily verified through the co-phasing closed-loop experiments.
Jul. 10, 2024Vol. 51 Issue 13 1317001 (2024)
Weizhi Liu, Xiaoliang Wang, Xianfeng Lin, Zhilun Zhang, Tao Luo, Runheng Xiao, Yingbin Xing, Jinggang Peng, Haiqing Li, Nengli Dai, and Jinyan Li
ObjectiveA pulsed fiber laser with high power, high energy, and good beam quality has significant application value in laser cleaning, deep penetration welding, and other fields. The development of double-cladding fiber, laser diodes, and passive devices has allowed the unprecedented improvement of the output power of nanosecond pulsed fiber lasers. A master oscillation power amplification (MOPA) structure is commonly used to achieve a nanosecond pulsed laser output with high average power, high single-pulse energy, and excellent beam quality, which expands the range of applications. However, this laser output improvement is limited by the parasitic oscillation caused by amplified spontaneous emission (ASE) and the stimulated Raman scattering (SRS) caused by a high peak power. Large-mode-area gain fiber is commonly used to suppress the SRS and achieve a laser output with high average power and high pulse energy. However, this also leads to serious deterioration of the beam quality. Commercial 30 μm/250 μm fibers can achieve nanosecond pulsed laser output near the diffraction limitation, but cannot simultaneously achieve high average power and high pulse energy. With the longitudinal variation of the core cladding structure, tapered ytterbium-doped fiber (T-YDF) can suppress SRS and beam-quality deterioration, realizing a laser output with high average power, high single-pulse energy, and excellent beam quality. This provides a suitable method for improving the output performance of pulsed lasers. Herein, a T-YDF with a total length of 4 m and tapered region length of 1.5 m is proposed, which experimentally provides obvious suppression effects of the SRS and beam quality deterioration.MethodsThe T-YDF shown in Fig. 1 is fabricated by modified chemical vapor deposition (MCVD) process with solution doping technology (SDT). This T-YDF can be divided into two regions along the longitudinal direction. The first is a tapered region with a gradual variation in the diameters of the core and cladding at a fixed ratio of 0.124. The diameter of the core varies from 31 μm to 62 μm, and the diameter of the inner cladding varies from 250 μm to 500 μm. The length is 1.5 m. The second is a large uniform region with core and inner-cladding diameters of 62 μm and 500 μm, respectively, with a length of 2.5 m. The numerical aperture (NA) of the T-YDF is approximately 0.06, with the 31 μm/250 μm end serving as the signal input end and the 62 μm/500 μm end serving as the signal output end. The laser performance of the T-YDF is investigated using an all-fiber nanosecond pulsed MOPA system with a forward pumping configuration, which is depicted in Fig.3. As the contrast fibers, a 31 μm/250 μm uniform ytterbium-doped fiber (YDF) and 50 μm/400 μm YDF are prepared using the same preform rod to experimentally verify the suppression effects of the T-YDF on the SRS and beam-quality deterioration.Results and DiscussionsA nanosecond laser output with an average power of 832 W, a peak power of 24.8 kW, and a pulse energy of 8.32 mJ is achieved based on the T-YDF after bending optimization experiments (Fig.4). The threshold power of the SRS effect occurring in the spectrum is 551 W, and the SRS suppression ratio at maximum output power is approximately 48.5 dB. Beam quality factors Mx2 and My2 are 3.506 and 3.465, respectively. The 50 μm/400 μm YDF prepared from the same preform rod is used in bending optimization experiments under the same system conditions, achieving a laser output with a maximum average power of 773 W, peak power of 23.3 kW, and pulse energy of 7.73 mJ (Fig.5). The threshold power of the SRS effect occurring in the spectrum is 420 W, and the SRS suppression ratio at the maximum output power is approximately 44.3 dB. Beam quality factors Mx2 and My2 are 4.897 and 4.744, respectively. Compared with that in the 50 μm/400 μm YDF, the threshold power of the SRS effect increases from 420 W to 551 W in the T-YDF, an improvement of approximately 31%, and the beam quality factor decreases from ~4.8 to ~3.5. The experimental results show that the T-YDF has preferable suppression effects on the SRS effect and beam-quality deterioration.ConclusionsBased on MCVD process and SDT, T-YDF with core diameter of 31?62 μm and inner cladding diameter of 250?500 μm is fabricated, which includes a 1.5 m long tapered region and 2.5 m long large uniform region. Based on the all-fiber nanosecond MOPA system, a laser output with an average power of 832 W, a peak power of 24.8 kW, a single pulse energy of 8.32 mJ, and a pulse width of 336 ns is achieved by a forward pumping configuration at a repetition rate of 100 kHz. The output of the single-fiber nanosecond pulsed laser with the best beam quality at the average power and single pulse energy level is realized based on the homemade T-YDF. Compared with that in the 50 μm/400 μm YDF produced using the same preform rod, the threshold of the SRS effect increases by approximately 31%, and the beam quality factor decreases from approximately 4.8 to approximately 3.5. The experimental results show that the tapered fiber has great potential for SRS suppression and beam-quality improvement. A new single-module realization method for high-power nanosecond pulsed laser combination is provided. Further optimization of the fiber structure parameters is expected to achieve a pulse laser output with higher power and better beam quality.
Jun. 22, 2024Vol. 51 Issue 13 1301001 (2024)
Zeqian Jiang, Bingxuan Li, Wenbin Liao, and Ge Zhang
ObjectiveThe development of the blue laser diode has made the visible solid-state laser generated by rare-earth-ion-doped material using laser diode (LD) pumping a research hotspot. Materials doped with trivalent praseodymium ions Pr3+ are prospective gain material in the visible range, and yttrium lithium fluoride (Pr3+∶YLF) exhibits good output performance under blue LD pumping owing to its low phonon energy. Moreover, Pr3+∶YLF provides multiple emission wavelengths including green, orange, red, and deep red light wavelengths. To meet actual requirements, the output laser can be designed to achieve different wavelengths and polarization states. Thus, Pr3+∶YLF has become a common topic in the research on solid state lasers in the visible range. By contrast, ultraviolet and deep ultraviolet lasers are obtained by infrared light. Research and application progress in visible lasers has provided another scheme towards ultraviolet laser generation, which is directly performing frequency doubling of visible lasers to obtain ultraviolet lasers. Under these circumstances, we study the laser properties of Pr3+∶YLF crystal using a weak absorption pumping strategy. In this strategy, the band is pumped with weaker absorption in the crystal, reducing the amount of pump energy absorbed by the crystal and alleviating the thermal stress caused by uneven heat distribution. By quantitatively changing the pump spot size and beam distribution in Pr3+∶YLF, different output results are obtained. The influence of factors such as pump beam distribution on laser output is analyzed and discussed, and the conditions for high-quality operation of visible lasers are explored.MethodsDespite good laser properties, the negative influence of the thermal effect of YLF crystals is poor, especially in terms of the crystal fracture caused by thermal stress. This is the primary concern restricting studies on YLF crystals. The thermal effects of a laser gain medium mainly include thermal photorefraction, thermal stress, and thermal lens. To reduce the thermal effect, different strategies, such as disk laser, side pumping, and wing pumping, have been adopted. Owing to the poor fracture property of YLF, the excessive thermal stress gradient caused by pumping absorption needs to be reduced. Therefore, we use a weak absorption pumping strategy.Results and DiscussionsThe output characteristics of the red laser are shown in Fig. 7. When the coupling ratio of the lens group is 1∶2 and the output coupler (OC) transmittance, Toc, is 1.27%, the maximum output power, PopMax, of the red laser is 2.46 W, with an oblique efficiency of 36.8%. The red laser performs best. Using a fiber spectrometer with a resolution of 0.076 nm, the center wavelength of the output laser spectrum is measured as 639.48 nm, with a linewidth of 0.23 nm and σ laser polarization state, with a polarization direction perpendicular to the crystal c-axis direction and a polarization ratio of 24.5 dB, as shown in Fig. 7(d). When the coupling ratio of the lens group is 1∶2, considering the size of the pump spot, the quality of the pump beam, and the length of the crystal, the Rayleigh length of the blue pump light is closest to Pr3+∶YLF crystal length indicating that the laser cavity mode matching effect is better. A comparison of the experimental results shows that when the coupling ratio is 1∶2, the slope efficiency is the highest, the crystal output threshold power is the smallest, and the maximum output power is the largest.ConclusionsWe report a 640 nm Pr3+∶YLF red laser pumped by a semiconductor blue laser pump. In selecting the pump source, the weak absorption pumping strategy is adopted to reduce the absorption rate of the Pr3+∶YLF crystal to pump light to ensure that the absorption of the Pr3+∶YLF crystal to pump energy along the length direction is more even. The distribution of pump light in the Pr3+∶YLF crystal is improved by adjusting the coupling ratio of the lens group. The optimal coupling ratio of the lens group is 1∶2. Simultaneously, when the OC transmittance is 1.27%, the maximum output power of the Pr3+∶YLF red laser is 2.46 W, the slope efficiency is 36.8%, the output red light wavelength is 639.48 nm, and the line skew reaches 24.5 dB. The weak absorption pumping adopted in this study can not only reduce the overall absorption rate of the crystal but also effectively output the laser, providing a solution for slowing down the thermal effect of large-sized working substances in solid-state lasers.
Jul. 02, 2024Vol. 51 Issue 13 1301003 (2024)
Zibang Xu, Xinlian Miao, Yuxian Liu, Yu Lan, Yuliang Zhao, Xiang Zhang, Guowen Yang, and Xiao Yuan
ObjectiveSemiconductor lasers have been widely used in industrial, medical, and other fields owing to their high electro-optical conversion efficiency, wide spectrum, and high power-to-volume ratio characteristics. However, as the application field expanded, higher power and reliability requirements have been stated. When manufacturing a high-power semiconductor laser, catastrophic optical mirror damage (COMD) is a key factor limiting the output power and reliability characteristics. COMD occurs due to a local temperature rise at the facet, which exceeds the material damage threshold, and it denotes the irreversible physical damage inflicted on the facet. Note that the occurrence of COMD is closely related to the output facet temperature; thus, accurately measuring the temperature and plotting its distribution are crucial for assessing the failure characteristics of high-power semiconductor lasers.MethodsThis study is based on the optical thermal reflection method used to construct a semiconductor laser output surface temperature measurement system. Accordingly, the distribution characteristics of the output surface temperature are studied. First, the thermal reflection coefficient of the output facet material used in the semiconductor laser is measured, based on which the measurement system is calibrated. Second, the lock-in method is used to improve the signal-to-noise ratio of the measurement system by increasing the number of image acquisitions. Finally, the output facet temperatures are measured under different operating currents, and the temperature information along the fast and slow axes is extracted and analyzed.Results and DiscussionsThe thermal reflection coefficient of the active region is 5.06×10⁻⁴ [Fig. 3(a)], and that of the substrate is 6.03×10⁻⁴ [Fig. 3(b)]. After 1000 iterations, the amplitude fluctuation of the thermal reflection signal tends to a smooth curve, causing a temperature fluctuation of less than 0.4 ℃ (Fig. 6). The output facet temperature under the 1?10 A current is measured; the output facet temperature of the active region of the semiconductor laser increases with an increase in the injection current (Fig. 8). The output facet temperature of the quantum well layer exhibits strong non-uniformity along the slow axis. At 10 A, the maximum temperature difference at the output facet is approximately 7.5 ℃. However, at 1 A, the maximum difference exceeds 3 ℃ (Fig. 9). The output facet temperatures of the quantum well region under currents of 2, 4, 6, 8, and 10 A are 1.4, 3.1, 4.6, 6.9, and 8.7 ℃ higher than the junction temperature, respectively. In the region with an approximate thickness of 1.3 μm at both sides of the quantum well, the output facet temperature is higher than the junction temperature. However, in other regions, the output facet temperature is lower than the junction temperature (Fig. 11).ConclusionsThis article presents a study on the high-resolution measurement of the temperature distribution at the semiconductor laser output facet using the optical thermal reflection method. The temperature distribution information from the output facet of the semiconductor laser is collected under working currents of 1?10 A. The results indicate that the measurement method presented in this study can distinguish small temperature variations at the output facet of the semiconductor laser. Moreover, it is observed that the temperature distribution at the output facet of the semiconductor laser exhibits strong non-uniformity along the slow axis, primarily due to heat generation from light absorption and non-radiative recombination occurring at the facet defects. The highest temperature is observed near the quantum well layer at the output facet, which is consistent with the fact that COMD usually occurs in this region, indicating that abnormal temperatures exceeding the damage threshold are the direct cause of COMD failure in semiconductor lasers. The research method and results presented in this study contribute to obtaining a better understanding of the heat generation mechanism at the output facet of semiconductor lasers, which hold significant practical value for optimizing their design for improving their output performance and reliability.
Jun. 22, 2024Vol. 51 Issue 13 1301004 (2024)
Yuanzhai Xu, Qiuyan Tang, Xiaojun Wang, Yading Guo, Lin Zhang, Hua Wei, Qinjun Peng, and Pin Lu
ObjectiveThe thermal effects and mechanical deformation of high-power lasers impede the output performance of laser systems. Compact laser systems, such as solid lasers, increasingly rely on adaptive optics (AO) featuring simpler structured wavefront sensors to improve beam quality. Unlike the traditional methods that retrieve wavefront from intensity distribution, deep learning, which is well-suited for nonlinear mapping, holds significant potential in this regard. In this article, we present a deep learning wavefront sensor (DLWFS) and demonstrate its applications in AO wavefront corrections. We use conditional generative adversarial networks (cGAN) to extract high-level features from the entire input intensity and retrieve wavefront from the intensity distribution. In other words, we view this intensity-to-wavefront nonlinear mapping as an image-translating problem. To overcome the compression of the wavefront information due to the diversity of coordinates during focusing propagation with a converged beam, the DLWFS relies on acquiring intensity from both the focal spot and the spot just before the focus, also called “double spots”, as input intensity distribution. By comparing the wavefront reconstruction results of DLWFS with those of commercial Shack-Hartmann wavefront sensor (SHWFS), and applying DLWFS in AO closed-loop of wavefront correction, the practicability of DLWFS can be proved.MethodsWe simulated the propagation of random initial wavefront through physical diffraction to obtain the intensity of spots on focus and defocus (0.98 times focal length) as training data and testing data of DLWFS. Network model cGAN was constructed by a generator (G) and discriminator (D). G had a U-Net structure comprising encoder-decoder convolutional neural networks (CNNs). It was trained to generate wavefront G(x) from input intensity distribution x(x1, x2), considering both on focus (x1) and defocus (x2) intensity data. The discriminator with a U-Net structure of encoder-decoder was trained to distinguish between tuple (G(x), x) of generated results G(x) with condition x as fake, and tuple (y, x) of real wavefront y with condition x as real. The training of the generator was considered completed when G was able to successfully fool D. The concept is shown in Fig.2 and is expressed mathematically in Eqs. (2)‒(5). We built an experimental platform of deformable mirrors (DM) for disturbing and correcting, and referencing SHWFS for comparison, as shown in Fig.7. DLWFS exhibits superior resolution compared to SHWFS, and SHWFS, in turn, offers higher resolution than DM for the purpose of wavefront correction. The laser beam was split 50/50 into SHWFS and DLWFS separately, to compare the wavefront results. Furthermore, by computing the wavefront response function of the DM, the closed-loop of AO used the wavefront generated from DLWFS for wavefront correction. Therefore, these experiments can serve to demonstrate the practicability of DLWFS as a wavefront sensor in AO systems.Results and DiscussionsDLWFS is capable of retrieving wavefront data with a root mean square (RMS) residual error of less than 0.3 μm at best, as shown in Fig.4. When comparing the wavefront results of DLWFS with those from SHWFS experiments, as shown in Fig.6, it becomes clear that the DLWFS generated wavefront results are smoother than referencing SHWFS, but both results have similar magnitude and shape of distribution. The RMS residual error is approximately 0.0965‒0.1531 μm in this comparison. The most noticeable disparities are observed near edges, with a significant reduction in disparity toward central areas. We conduct multiple AO wavefront correction experiments through controlling parameters and utilizing different 3D-printed apertures inducing circle and square shapes of beams. The correction results obtained by utilizing DLWFS as the wavefront sensor closely resemble the results obtained from SHWFS, as shown in Fig.9. The results of utilizing DLWFS in the correction of wavefront distortion induced by DM1 are shown in Fig.10. The first two rows depict the results with and without AO correction of the 50 mm diameter circular beam, while the last two rows depict the results of the 50 mm×50 mm square beam. We improve the circle beam quality from β=8.18 without AO to β=2.40 with AO, while we improve the square beam quality from β=10.83 without AO to β=3.61 with AO. These results demonstrate the practicability of using DLWFS in AO. Based on the experimental results mentioned earlier, we find that in retrieving wavefronts, the DLWFS shows a certain degree of deviation when compared to SHWFS. The primary causes of this deviation can be attributed to the sensitivity of DLWFS in these aspects: the parametric sensitivity of focal point position when acquiring spots, SNR of the wavefront with high frequency or small stroke aberrations, nonuniform distributed near-field intensity, and irregularly shaped beams. Hence, the performance of DLWFS can be improved by using the real data acquired by experiments conducted using an improved model.ConclusionsCompact wavefront sensor is highly suitable for improving the beam quality of compact solid lasers in AO systems. In this article, we introduce DLWFS as a new method of nonlinear mapping from intensity distribution of focus and defocus spots into wavefront. The model is trained using simulated data. By using cGAN-based generator to retrieve wavefront from input focus and defocus spots, we compare wavefront results of DLWFS with those of SHWFS. The residual error falls in the range of 0.0965‒0.1531 μm. We also apply DLWFS for AO wavefront correction and correct square and circle beams with beam quality β=3.61 and β=2.40 separately. Although there is a noticeable deviation in wavefront results compared with the reference wavefront, the wavefront correction results demonstrate the practicability of DLWFS. We believe that future improvements in the model structure and the utilization of experimentally acquired training data will enhance the performance of DLWFS in future studies.
May. 10, 2024Vol. 51 Issue 13 1301005 (2024)
Quancai Zhou, Yang Li, Chongxian Yuan, Xinye Fan, Chuanchuan Li, and Xin Wei
While substrate-transfer devices enhance electro-optical conversion efficiency, they impose stringent requirements on subsequent packaging processes. In long-pulse applications, substrate-transfer devices exhibit a shortened lifespan compared to that of their non-transferred counterparts, primarily because of the elevated thermal power density resulting from substrate transfer and subsequent packaging. Therefore, in the substrate transfer and packaging processes of high-power VCSEL arrays, process optimization is crucial for mitigating issues such as irregular surface protrusions, solder voids, and mechanical damage, thereby enhancing the reliability of high-power substrate transfer devices.The early screening of high-power VCSEL arrays in industrial production currently involves accelerated aging, which requires post-packaging electrical testing. However, this method is cumbersome and expensive. To address this, we propose an early screening method utilizing morphology detection to eliminate devices with irregular protrusion heights exceeding 20 μm and irregular protrusion areas exceeding 15%, solder void detection to remove devices with a void ratio exceeding 1.5% for a single solder void, and dark spot detection to exclude devices with dark spot quantities exceeding 1%. Compared with traditional accelerated aging methods, this approach is operationally simpler and more cost-effective. The devices selected through this screening process demonstrate, through extrapolated lifespan results, suitability for long-pulse applications.ObjectiveVertical-cavity surface-emitting lasers (VCSELs) are characterized by low divergence angle, circular output beam, low threshold current, low temperature dependence (approximately 0.07 nm/K), high efficiency, and an extended lifespan. Because the distributed Bragg reflector (DBR) mirrors of VCSELs and the laser emission are perpendicular to the wafer epitaxial surface, they facilitate the realization of two-dimensional dense integration for high-power arrays. The 808 nm wavelength is crucial in high-power laser applications, serving as an optimal pump source for Nd∶YAG or Nd∶YVO4 crystals to generate 1064 nm wavelength lasers. Its suitability for medical aesthetics, owing to melanin absorption and deep skin penetration, extends its applicability to the military and industrial domains. Therefore, conducting reliability studies and analyses of high-power 808 nm VCSEL arrays is of significant practical importance. However, the operation of high-power VCSEL arrays results in substantial heat power density. The most direct approach to address the thermal management of 808 nm high-power VCSEL arrays is substrate transfer, which involves the migration of light-emitting units from a GaAs substrate to a high-thermal-conductivity substrate. Paradoxically, a reduction in the lifespan of substrate-transfer devices has been observed despite the concurrent enhancement in the optoelectronic conversion efficiency. Consequently, it is imperative to conduct reliability studies and analyses that specifically target substrate-transfer devices. This study addresses the challenges introduced during substrate-transfer packaging such as irregular surface protrusions, high solder void rates, and an increased number of failure-emitting points (dark spots under CCD microscopy). Through the implementation of detection methods, we selectively identify the devices exhibiting these issues, categorize them, and subject them to aging experiments. By comparing the power decay rates and analyzing the locations of the newly emerged failure-emitting points, we identify the key factors influencing the reliability of substrate-transfer devices. Based on our findings, we propose a straightforward and reliable approach for early screening of high-power VCSEL arrays.MethodsIn this study, devices exhibiting irregular surface protrusions, elevated solder void rates, and a significant number of failure-emitting points (dark spots under CCD microscopy) were selectively grouped for aging experiments. The aging process involved the systematic recording of power levels at regular intervals with the prompt removal of failed devices from the aging platform. Subsequently, CCD microscopy was employed to inspect the locations of failure-emitting points on the devices. In addition, an X-ray transmission instrument was used to observe the distribution of solder voids in the bonding layers. By meticulously comparing the data collected before and after the aging process, we identified the locations of the newly emerged failure-emitting points and assessed the changes in the solder void distribution. This comprehensive analysis aimed to elucidate the factors influencing the reliability of substrate-transfer devices.Results and DiscussionsDevices with irregular protrusion heights exceeding 20 μm and irregular protrusion area ratios exceeding 15% exhibit early failures (Table 2). Higher irregular protrusion heights result in the destruction of the vertical cavity structure of the device, causing a loss of normal light emission. The associated thermal accumulation affects both the irregular protrusion area and the surrounding regions, leading to early failures (Figs. 4 and 6). Devices with larger irregular protrusion areas have dark spots localized within the irregular protrusion area without diffusion. After failure, the solder layer in this region does not exhibit extensive voids, indicating a weaker thermal accumulation that affects only the light-emitting points within the irregular protrusion area without significantly affecting the solder layer and surrounding regions (Fig. 6). Early failures occur in devices with circular solder voids and individual void ratios exceeding 1.5%, with dark spots appearing in proximity to these voids (Fig. 7). Analysis of the remaining devices with void ratios exceeding 1.5% reveals individual void ratios below 1%, confirming that individual voids with higher ratios are the cause of early failures. Devices with dark spot counts exceeding 1% experience early failures (Table 4), and the dark spot area expands after failure, indicating an increased thermal dissipation rate in malfunctioning devices (Fig. 8). An extrapolation of the lifespan for the remaining normally aged devices suggests a minimum expected lifespan of 66.02 million cycles, which meets the requirements for applications in extended pulse scenarios (Fig. 10).ConclusionsThis study focuses on aging tests and analysis of the failure mechanisms in devices that, as a result of substrate-transfer packaging, present issues such as elevated surface irregular protrusions, high solder void ratios, and an increased number of malfunctioning light-emitting points. The findings reveal that higher irregular protrusion heights directly damage the vertical cavity structure of the VCSEL, rendering it incapable of emitting light. Moreover, a direct correlation is observed between the increased irregular protrusion height and intensified thermal accumulation, affecting the surrounding light-emitting points and solder layers, and leading to early device failures. Larger irregular protrusion areas also contribute to early failures, albeit confined to the irregular protrusion regions. In high-power devices, severe solder voids adversely affect heat dissipation, causing early failures when the individual void ratio of a single solder void exceeds 1.5%. Furthermore, the thermal dissipation power of malfunctioning light-emitting points increases, and a count of dark spots exceeding 1% results in additional heat accumulation and early device failure.
Jul. 04, 2024Vol. 51 Issue 13 1301006 (2024)
Linhui Guo, Quanwei Jiang, Hualing Wu, Hao Tan, Pengfei Xie, Yun Fu, Lanping Zhang, Yonggang Zhang, Songxin Gao, Deyong Wu, and Chun Tang
ObjectiveHigh power and brightness blue semiconductor lasers are being rapidly developing into a type of laser processing light source, mainly used for high reflectivity metal welding, cutting, and engraving. Due to the degradation of beam quality and insufficient power of blue semiconductor laser sources in some processes with large processing distances, their application in this field is restricted. Therefore, the use of various beam combining techniques to improve output power and brightness has been widely studied. Laser beam combining methods include spatial, polarized, and spectral beam combining. Spectral beam combining is achieved through the non-coherent superposition principle of dispersion elements, and the beam quality after beam combining is equivalent to that of a single subunit beam, which has an effective power scaling advantage. In this study, an external cavity feedback spectral beam combining technique that combines self-excited oscillation with external optical feedback is used to obtain a laser beam output. The output power and beam quality are significantly improved, compensating for the shortcomings of poor beam quality and insufficient power in the industrial processing by blue semiconductor lasers.MethodsA multi-laser-unit spectral beam combining structure is designed based on a transmission grating (Fig. 1). First, the laser optical, packaging structure, and optical transformation lens parameters in the beam combining system are designed based on the principle of grating diffraction. According to the designed optical structure, nine blue semiconductor laser units are grouped along the fast axis direction, and the pointing accuracy and divergence angle are tested. Second, spectral beam combining experiments are conducted, and the crosstalk effect in beam combining is analyzed and studied. A method of using a beam reduction system to suppress the crosstalk effect is proposed, and the results are tested. Finally, parameters such as central wavelength, spectral width, output power, and beam quality of the combined output laser are tested, analyzed, and evaluated.Results and DiscussionsThrough chip-on-submount (COS) structure packaging, blue semiconductor lasers can achieve high operation at room temperature, with a threshold current of 0.3 A, a slope efficiency of 1.51 W/A, and an output power of 4.20 W under a continuous current drive of 3.0 A (Fig. 2). There is a strong spectral gain in the 440.0?448.0 nm (Fig. 3), indicating the feasibility of spectral beamforming. We implement a cooler with equal optical path step structure, which uses a fast axis collimating lens and a slow axis collimating lens to collimate the fast and slow axis beams, respectively (Fig. 4), and then uses a reflector for spatial beam assembly. The pointing error in the slow axis direction is better than ±0.3 mrad, and the pointing error in the fast axis direction is better than ±2.2 mrad [Fig. 7(a)]. The fast axis divergence angles are all controlled within 8.0 mrad, and the slow axis divergence angles are all controlled within 6.4 mrad [Fig. 7(b)]. The crosstalk effect in beam combining is experimentally tested [Fig. 8(a)], and a method of suppressing it using beam reduction is proposed to obtain a better far-field beam [Fig. 8(b)]. The spectral beam combining power and spectral parameters are tested. Under a current of 3 A and a voltage of 39.90 V, the continuous output power is 25.99 W, the electro-optical conversion efficiency is 21.67% [Fig. 10(a)], and the total spectral width is 2.94 nm [Fig. 10(b)], which is slightly higher than the theoretical design. The main reason is the broadening of the beam after optical alignment and the focal length error of the conversion lens. The combined laser beam basically maintains the beam quality of the unit laser (Fig. 12), which significantly improves the brightness of the existing laser in the blue laser band.ConclusionsIn response to the blue laser processing needs of non-ferrous metals, based on the grating external cavity spectral beam combining technology, this study optimizes the beam combination scheme and beam combining structure of blue semiconductor laser units to obtain the spectral beam combining output with multi-laser-unit common cavity resonance. Using nine blue semiconductor laser emitters and transmission gratings to combine beams along the fast-axis direction, we achieve a combined beam with an output power of 25.99 W, an electro-optical conversion efficiency of 21.67%, beam quality factors of Mx2=2.45 and My2=14.81, and a brightness of 56.85 MW/(cm2·sr) , which is about four times higher than the current level of blue light laser. Further expansion of sub-beams and combining of polarization hold the potential to achieve high-brightness blue semiconductor lasers in the several hundred-watt range, providing a high-performance light source for high-quality processing of highly reflective metals.
Jun. 22, 2024Vol. 51 Issue 13 1301007 (2024)
Jiaqi Yuan, Yang Li, Zhen Fang, and Zuxing Zhang
ObjectiveFiber lasers have been widely used in fields such as optical communication, radar, and signal processing, and have an irreplaceable role. Single-mode fiber (SMF) lasers typically operate at a low power and generate pulses by locking multiple longitudinal modes that are the fundamental transverse modes. However, the small mode-field area of single-mode fibers can easily lead to strong nonlinear effects, thereby limiting the performance of single-mode lasers. Owing to the limitations of the soliton area theorem and spectral sideband effect, the maximum energy of a single soliton pulse can only reach the order of 0.1 nJ. This is because nonlinearity and anomalous dispersion often lead to pulse splitting. In a dissipative soliton laser with a positive dispersion cavity, large nonlinearity can induce multiple pulses. Compared with SMFs, graded-index multimode fibers (GIMFs) can support hundreds of lateral modes, have a higher transmission capacity, carry more energy, and have complex spot characteristics. In this study, we propose a nonlinear regulation technique and implement a high-power spatiotemporal mode-locked (STML) fiber laser using nonlinear polarization rotation (NPR). The number of modes and nonlinearity in the cavity are controlled by changing the fusion misalignment between the gain and multimode fibers. By adjusting the misalignment amount to 8 μm, the maximum average spatial light power output by the laser can reach 690 mW, and the single pulse energy can reach 39 nJ at a repetition rate of 17.67 MHz. This is a suitable solution for generating high-power laser pulses.MethodsIn the current laser configuration, we first set the fusion misalignment amount between the gain fiber and GIMF to 0. In other words, there is no misalignment fusion, enabling the fiber cavity to achieve STML operation in the few-mode state. In this case, the pump light can increase from 1.32 W to 1.92 W for maintaining a single-pulse output with a maximum spatial output power of 264 mW and intracavity single-pulse energy of 15.1 nJ. An additional increase of the pump power will result in excessive nonlinearity and pulse splitting. To further increase the single-pulse energy, we offset the nonlinearity caused by the excessive power by increasing the fusion misalignment amount. When producing dissipative solitons in a positive dispersion cavity, it is necessary to balance the nonlinearity to achieve stable dissipative solitons. In the experiment, the nonlinear coefficient in the cavity increases sharply with increasing pump power in the cavity, which affects the stability of the single pulse. As the misalignment amount increases, the number of transverse modes in the cavity increases, and the corresponding high energy in the cavity is transferred to higher-order modes. Therefore, increasing the amount of fusion misalignment based on nonlinear regulation can counteract excess nonlinearity. In addition, the misalignment values are set to 4 μm and 8 μm in sequence, and the output energy and spot characteristics are analyzed.Results and DiscussionsFirst, a few-mode STML fiber laser is studied. Increasing the pump power may lead to excessive nonlinearity and pulse splitting, making it impossible for a single pulse to carry a high power. In this experiment, the number of transverse modes is increased by adjusting the fusion misalignment amount to counteract the nonlinearity caused by the excessive pump power, thereby increasing the single-pulse energy. As the fusion misalignment amount increases, the number of transverse modes also increases. Therefore, when the nonlinearity caused by the increase in pump power leads to pulse splitting, the number of transverse modes offsets the excessive nonlinearity. When the misalignment amount increases from 4 μm to 8 μm, the spectrum exhibits a blue shift trend, as shown in Fig. 4(a). This is because an increase in fusion misalignment amount leads to an increase in the intracavity loss, and the laser wavelengths shift towards shorter wavelengths with a higher gain. Stable STML operation can be achieved by adjusting the pump power to 1.9 W at 8 μm misalignment amount. Figure 4(b) records the time-domain pulse sequence at 8 μm misalignment amount with a pulse interval of 56.6 ns and a repetition frequency of 17.67 MHz. Pulse splitting is observed only when the pump power is continuously increased to 3.75 W, and the average output spatial light power is 690 mW. The maximum single-pulse energy is 39 nJ and peak power is 161.8 W.ConclusionsIn this study, a nonlinear regulation technique is proposed to realize a high-power spatiotemporal mode-locked fiber laser with a spatial structure. The changes in the output power and spot profile under different fusion misalignment amounts are investigated. In the experiment, a large number of high-order mode excitations under 8 μm fusion misalignment amount between gain fiber and graded-index multimode fiber are used to balance the high nonlinearity brought by high power, so that the single pulse can carry higher energy. The average power of the generated space light can reach 690 mW, and the single pulse energy is 39 nJ. This type of high-power single-pulse laser has application value in the fields of medical treatment and optical communication.
Jul. 02, 2024Vol. 51 Issue 13 1301008 (2024)
Yiming Chen, Qingyu Cong, Lianxi Jia, Yang Qiu, Xingyan Zhao, Shaonan Zheng, Yuan Dong, Qize Zhong, and Ting Hu
ObjectiveSemiconductor lasers are pivotal light sources in optical communication systems. Owing to their compact size and lightweight, they are beneficial for seamless integration with other devices for monolithic optoelectronic solutions. They play an important role in various fields, including fully integrated optical communication systems, optical sensing, light detection and ranging (LiDAR), and ultra-wideband wavelength division multiplexing (WDM) systems. However, silicon is an indirect bandgap material with a low luminescence efficiency, making it unsuitable as an efficient gain medium for semiconductor lasers. A practical solution involves combining Ⅲ-Ⅴ materials, known for their direct bandgap, with Si, which exhibits low propagation loss. Two-photon and free-carrier absorption are typically negligible because silicon nitride has a wider bandgap than silicon. Therefore, silicon nitride has been gaining significance for the formation of external-cavity structures in semiconductor lasers. Currently, typical external-cavity structures utilize micro-ring resonators or Sagnac loop reflectors as the reflective ends. However, the dispersion effect of the silicon nitride waveguide introduces variability in reflectivity with the operating wavelength, resulting in uncontrollable reflectivity and limiting improvements in laser performance. In this study, we report an external-cavity reflection structure designed to control reflectivity, enabling laser mode selection and the optimization of output characteristics.MethodsFigure 1 illustrates the schematic structure of a tunable silicon nitride diode external-cavity laser. Within this structure, the reflective semiconductor optical amplifier (RSOA) and external-cavity reflector collectively form a Fabry–Perot resonant cavity. Light resonates within this cavity and is amplified within the gain medium. If the resulting gain is sufficient to overcome the losses of the resonant optical mode within the cavity, a relatively coherent light is emitted. A spot-size converter is employed as an inverted cone structure to realize efficient coupling between the RSOA and external-cavity mirror. The converter has a height of 700 nm, length of 200 μm, and a width, which linearly varies from 250 nm to 750 nm. The structures of the external mirror are shown in Fig.2. It comprises three main components: a phase shifter, tunable coupler, and vernier filter. Transmission and reflection spectra of the external-cavity mirror are obtained to determine the optimal device dimensions. A phase shifter with a length of approximately 1 mm is used to adjust the longitudinal mode within the cavity. The tunable coupler consists of a symmetrical Mach-Zehnder interferometer (MZI) with an arm length of 1 mm, allowing for the control of mirror reflectivity through the application of voltage to the MZI. The vernier filter comprises two micro-ring resonators (MRR1 and MRR2) with different radii and an asymmetric MZI (d-MZI). This enhances the wavelength-tuning range and side-mode suppression ratio of the external-cavity diode laser. The radii of MRR1 and MRR2 are 81 μm and 84.3 μm, respectively. The arm length difference in the d-MZI is 264 μm. The total cavity length of the mirror is 24.3 mm, with dimensions of 6.0 mm×1.8 mm.Results and DiscussionsSimulated results indicate that applying a voltage to the tunable coupler can control the effective reflectance of the mirror from 0 to 1 (Fig.3). The dissymmetry MZI enhances the side-mode suppression ratio of the vernier filter from 0.9 dB to 8.7 dB at 1523 nm and 7.1 dB to 12.8 dB at 1586 nm. The free spectral range of the filter is 55 nm (Fig.4). The experimental results show that the laser output wavelength is 1523.8 nm without applying additional voltage, with a side-mode suppression ratio exceeding 40 dB (Fig.7). By controlling the phase shifter, the minimum and maximum wavelength tunings are 4 pm and 20 pm, respectively. A tuning range of 55 nm is realized by adjusting the voltage on the single micro-ring resonator (Fig.8). The laser output power varies from -20 dBm to -13 dBm with respect to the varying voltage applied to the tunable coupler, which is consistent with the sinusoidal trend in Fig.3 (Fig.8). Moreover, the tunable coupler can effectively avoid dual-wavelength lasing and allow the selection of the operating wavelength of the laser (Fig.9).ConclusionsAn external-cavity reflection structure, comprising two micro-ring resonators and two distinct Mach-Zehnder interferometers, is designed and fabricated using the Damascus process. A semiconductor external-cavity laser, with a side-mode suppression ratio of over 40 dB and a maximum tuning range of 55 nm, which covers the entire communication band, is demonstrated. The laser is realized by combining the Ⅲ?Ⅴ RSOA and a silicon nitride external-cavity reflection structure. In the future, a higher output optical power can be achieved by adopting RSOA chips with a higher gain. A laser mode-hopping phenomenon is observed during the experiment. A mode-hop-free laser output can be further realized by optimizing the ratio of the voltage applied to the phase shifter and micro-ring resonator.
Jul. 02, 2024Vol. 51 Issue 13 1301009 (2024)
Beifei Yan, Rui Xiao, Zhendi Cai, Yichen Zhou, Pengcheng Fang, Yanqi Xu, Yan Wang, Huanyao Sun, and Qunfeng Chen
ObjectiveUltrastable lasers offer the benefits of ultrahigh-frequency stability and extremely narrow linewidths. They are crucial in atomic clocks, optical-frequency transmission, gravitational-wave detection, Lorentz-invariance testing, and other applications. Typically, an ultrastable laser is created using the Pound-Drever-Hall (PDH) technique to lock the laser frequency to an ultrastable Fabry-Perot (F-P) cavity. Owing to the continuous progress and development of science and technology, the demand for scientific tasks is increasing. Simultaneously, higher requirements are imposed on the stability and long-term locking ability of ultrastable lasers. When the laser frequency is locked, circuits or mechanical disturbances may cause the laser to be unlocked. Once this occurs, the ultrastable laser must be relocked promptly. Analog feedback circuits are commonly used to implement frequency-locked to avoid introducing additional digital noise. However, the conventional analog circuits present some disadvantages, including inconvenient adjustment of locking parameters, difficulty in automatic locking, and necessity for remote control. Hence, this study proposes a universal analog frequency-locked circuit with digital control.MethodsA digitally controlled analog frequency-locked circuit was designed to stabilize the frequency of various types of lasers, such as Nd∶YAG, fiber, and external-cavity diode lasers. To satisfy the requirements of different lasers and cavities, the proportional-integration-differentiation (PID) parameters of the circuits were adjusted from hundreds of hertz to hundreds of kilohertz. Additionally, a microcontroller, digital switches, and digital potentiometers were integrated into the circuit to enable the digital control of the locking parameters and locking switches. To determine whether the digital chips imposed additional bandwidth limitations to the circuit, the transmission characteristics of the frequency-locked circuit in the open loop were measured using a vector network analyzer. An Agilent 34401A digital multimeter was used to measure the voltage of the error signal with a null input after locking. Subsequently, the stability of the error signal was calculated and compared to test whether the circuit stability and noise level were affected by the digital-control chips. Two identical frequency-locked circuits were applied to two ultrastable laser systems developed by our team. After the locking parameters were optimized, the laser frequency was set to off-resonance and the auto-relock function was activated to verify the automatic relocking effect of the frequency-locked circuit. Finally, the frequency stability of the locked laser was assessed by measuring and analyzing the beat frequencies of two sets of ultrastable lasers.Results and DiscussionsThe introduction of digital-control chips does not affect the feedback bandwidth of the frequency-locked circuit, as shown in Fig.3. This implies that the digital switches do not delay the signal. The stability of the error signal improved compared with that afforded by our previous purely analog design, as illustrated in Fig.4. This is because the circuit structure is optimized and the digital circuit remains in a silent state when the laser is frequency-locked, thus preventing digital noise caused by changes in the digital-circuit state. In the experiment, when the circuit’s relock function is activated, the laser frequency can be swept to the resonance and locked. The laser is obstructed when the laser frequency is locked. After the laser obstructer is removed, the laser frequency shifts rapidly (see Fig.6). After being locked, the laser frequency stability is 4.6×10⁻¹⁶ at an integration time of 1 s, whereas it is less than 4.2×10⁻¹⁶ from 2 s to 10 s (Fig.7), which is similar to the thermal-noise limit of the 10 cm ultrastable cavity.ConclusionsA digital-control analog frequency-locked circuit is developed. This circuit not only preserves the benefits of analog circuits, such as high feedback bandwidth, low noise, and high offset stability, but also achieves the digitization of frequency-locked parameters and control. As such, it enhances the adjustment flexibility and reliability of frequency-locked. It comprises a wide range of adjustable parameters and satisfies the frequency-locked requirements of various lasers. Additionally, the circuit incorporates a frequency-relock function that can automatically relock the laser frequency when it becomes unlocked, thus ensuring that the laser frequency remains locked for an extended period. The introduction of digital control chips does not increase the amount of additional noise in the frequency-locked circuit or reduce the feedback bandwidth. The feedback bandwidth of the frequency-locked circuit is approximately 20 MHz, and the locking-error stability of the circuit is 100 nV. Two circuits are used to lock the two custom-developed ultrastable lasers and evaluate the stability of the beat frequency. The short-term stability of the ultrastable laser is measured to be 4.6×10⁻¹⁶ at 1 s of integration time, less than 4.2×10⁻¹⁶ from 2 s to 10 s of integration time, and 4.0×10⁻¹⁶ at 4 s of integration time, which is similar to the thermal-noise limit of the 10 cm cavity.
Jul. 10, 2024Vol. 51 Issue 13 1301010 (2024)
Jiajun Wu, Shan Zhong, and Songbai Kang
To quantify the CCW light enhancement, we use an optical circulator to monitor the feedback light intensity and compare the intensities with and without auxiliary-prism enhancement [Fig. 2(b)]. Furthermore, we set up a WGMR SIL laser to verify the improvement in performance with the feedback-enhancement approach [Fig. 5(a)].The results show that the performance of the WGMR SIL laser improves after applying the enhanced feedback approach. In terms of instantaneous frequency noise [Fig. 4(b)], the free-running case is approximately 3.5×10⁵ Hz2/Hz (instantaneous line width is about 1.1 MHz), the Rayleigh backscattering SIL case is approximately 40 Hz2/Hz (instantaneous line width is about 125 Hz), and the enhanced feedback SIL case is 2.5 Hz2/Hz (instantaneous line width is about 7 Hz), obtaining linewidth suppression gains of almost 50 dB and 10 dB. In terms of the SIL range [Fig. 5(a)], the Rayleigh backscattering SIL case is approximately 0.8 GHz, and the enhanced feedback SIL case expands the range up to 8 GHz, substantially enhancing the injection locking robustness. In terms of the RIN [Fig. 5(b)], the free-running case is approximately -142 dBc/Hz at 10 MHz, the Rayleigh backscattering SIL case is approximately -147 dBc/Hz at 10 MHz, and the enhanced-feedback SIL suppresses the RIN to -152 dBc/Hz at 10 MHz.ObjectiveNarrow linewidth lasers based on whispering-gallery-mode resonator (WGMR) self-injection locking (SIL) have the potential for use in fields such as coherent optical communication, optical atomic clocks, high-resolution spectroscopy, and precision frequency measurement. The intensity of SIL optical feedback is a crucial parameter that determines the performance of locked lasers, including instantaneous linewidth, locking range, and relative intensity noise (RIN). At present, the SIL technique commonly uses WGMR Rayleigh backscattering to create optical feedback. However, the optical feedback intensity is uncontrollable. Investigations have been successfully conducted on the feedback control of on-chip WGMRs such as Si3N4, and AlN using micro-cavity refectors. However, there are few studies on how to control the feedback intensity for high-Q fluoride crystalline WGMRs. Liang et al. proposed a feedback-intensity enhancement scheme for crystalline WGMRs using a set of optical components, including a coupling prism, collimation lenses, and a mirror reflector. However, the additional components increased the complexity and instability of the system. In this study, we propose a compact and easy-to-operate feedback-enhancement approach for crystalline WGMRs that replaces the set of feedback-enhanced components with a designed auxiliary prism, which can be integrated with the WGMR. It provides a compact solution for controlling feedback intensity in WGMR SIL technology.MethodsWe design an auxiliary prism to enhance the counterclockwise (CCW) light amplitude inside the WGMR (Fig. 1). The auxiliary prism first extracts the clockwise (CW) light from the WGMR with a specific angle Φ that is determined by the coupling phase-matching condition. The coupled output beam travels over an optical length d in the prism and is then vertically reflected by highly reflective film coated on the prism. Finally, it is coupled back into the WGMR along the original trace to enhance the CCW light amplitude with any additional optical components. The bottom angle of the auxiliary prism is crucial and designed to equal the angle Φ for high back-coupling efficiency. In the experiment, we use a homemade high-Q value (1.97×10⁹) MgF2 WGMR [Fig. 2(a)] as the platform and an auxiliary prism to enhance the amplitude of CCW light with the transverse electric (TE) mode. The bottom angle of the prism is designed as 52.3° (for the TE mode at 1.55 μm). The output coupling point is also important and should ensure that d is approximately equal to the Rayleigh length of the light to prevent beam divergence. Therefore, the coupling point between WGMR and auxiliary prism is chosen as approximately 500 μm from the bottom corner of the prism.Results and DiscussionsCompared to the WGMR Rayleigh backscattering technique, the auxiliary prism improves the intensity of CCW light with the TE mode in the WGMR by two orders of magnitude [Fig. 3(a)] and does not enhance the intensity of the feedback light with the transverse magnetic (TM) mode [Fig. 3(b)]. If the bottom angle of the prism can be further optimized, the feedback intensity can be further increased.ConclusionsWe propose a crystalline WGMR feedback-enhancement approach with an auxiliary prism and successfully improve the CCW light intensity in the WGMR by almost two orders of magnitude. With the auxiliary-prism enhancement, the WGMR SIL laser performance, including the instantaneous linewidth, locking range, and RIN, is significantly improved compared to those in the free-running and Rayleigh backscattering SIL cases. The proposed approach provides a compact solution for controlling feedback intensity in WGMRs and is especially suitable for long-wavelength SIL lasers in which the resonator Rayleigh backscattering amplitude is low.
Jul. 02, 2024Vol. 51 Issue 13 1301011 (2024)
Yang Xu, Qiang Fang, Xuelong Cui, Yizhu Zhao, Xiangdong Ding, Haixin Xu, Lubing Chen, Bowen Hou, and Wei Shi
ObjectivePolarization-maintaining ytterbium-doped fiber (PMYDF) lasers with smaller core diameters can suppress transverse mode instability (TMI) more effectively. However, reducing the core size also decreases the stimulated Brillouin scattering (SBS) threshold, which is a major challenge for narrow linewidth (<10 GHz) linear-polarized PMYDF lasers. To suppress SBS while still suppressing TMI, larger core fibers are a better choice. In this study, SBS is effectively suppressed in a 1.6-kW 8-GHz spectral width linear-polarized fiber laser, adopting gain fiber with 25-μm core diameter and a white-noise-broadened phase-modulated single-frequency laser (PMSFL). In addition, TMI is effectively suppressed by careful application of the fiber-coiling method. The results indicate that 25-μm core diameter PMYDF has great application potential for high-power ultra-narrow linewidth (<10 GHz) linear-polarized fiber lasers.MethodsThe seed source used in this study is a white-noise-broadened PMSFL. The seed power is initially amplified from ~20 mW to ~20 W by a two-stage pre-amplifier, and then injected into a primary amplifier. The primary amplifier uses a 25-μm core diameter PMYDF with a gain-fiber length of ~5.5 m, a mode field area of ~340 μm2, and 976-nm pump light absorption of ~2 dB/m. The design of the primary amplifier is based on a backward-pumping scheme, and six non-wavelength-stabilized 976-nm fiber-coupled semiconductor lasers (LDs) with a maximum output power of >400 W serve as the pumping sources. After amplification, the output laser beam is stripped by a cladding power stripper (CPS) to remove the cladding light, and then output through a fiber endcap. The total length of the output fiber is ~1.5 m. Between the pre- and primary amplifiers, a high power fiber isolator (ISO) with a backward power monitoring port (TAP) is used to isolate and leak the backward light. A mode-field adapter (MFA) is inserted between the pre- and primary amplifiers to realize mode-field matching between different fibers. The laser system has an all-fiber structure. The laser power is directly measured using a power meter. A prism is used to attenuate the output laser beam, and a laser spectrum analyzer is used to measure the spectrum of the attenuated laser beam. After the output laser beam is collimated, the P and S waves are split using a polarization beam splitter (PBS) and their respective power levels are measured using power meters and used to calculate the polarization extinction ratio (PER). The output laser beam is collimated and attenuated, and its beam quality is measured using a beam-quality analyzer.Results and DiscussionsInitially, the primary amplifier gain fiber is coiled to a diameter of 12 cm. When the output power of the primary amplifier reaches 1 kW, the slope efficiency is significantly reduced, indicating that the TMI threshold has been reached. To suppress TMI, the gain fiber coiling diameter is decreased to 9 cm, and the laser power increases to 1.2 kW. However, there is still a significant reduction in slope efficiency. When the coiling diameter of the gain fiber is decreased further to 8 cm, the laser output power reaches 1.6 kW without obvious slope-efficiency reduction. The total injected pump power of the primary amplifier is 2400 W, and the corresponding optical conversion efficiency is ~66.5% [Fig. 2 (a)]. As the fiber coiling diameter decreases from 12 cm to 8 cm, the TMI is effectively suppressed [Fig. 2 (b)]. At full output power, the backward power leaked from the ISO TAP is 0.59 W, and the proportion of the output laser power is ~0.037%. This indicates that the output power of the system has considerable potential to increase before reaching the SBS threshold [Fig. 2 (a)]. Based on the theoretical model established to calculate the stimulated thermal Rayleigh scattering effect (STRS) in the PMYDF, the energy-coupling process between the fundamental mode (FM) and high-order mode (HOM) for different gain fiber coiling diameters is simulated according to the fiber and pump parameters adopted in this experiment. The results show that as the fiber coiling diameter decreases from 12 cm to 8 cm, the nonlinear energy coupling process from the FM to the HOM is significantly suppressed (Fig. 3). The measured laser wavelength at full output power is ~1053.15 nm and the 3 dB linewidth is ~0.0294 nm (Fig. 4). The transverse beam quality factor (Mx2), longitudinal beam quality factor (My2), and PER measured at the full laser power are 1.090, 1.166, and 96% (~14 dB), respectively (Fig. 6).ConclusionsA 1053-nm narrow spectral width linear-polarized fiber laser system is constructed based on the master oscillator power amplifier structure using a white-noise-modulated single-frequency laser as the seed source. In the primary amplifier, selection of a suitable coiling diameter for the gain fiber coiling in combination with the use of a 976-nm backward pumping scheme enables the successful suppression of the TMI effect. Finally, a 1.6-kW, 8-GHz spectral width linear-polarized fiber laser emitting at 1053 nm is achieved, with Mx2,My2, and polarization extinction ratio of 1.090, 1.166, and ~14 dB, respectively. No obvious SBS is observed during the experiment.
Jul. 04, 2024Vol. 51 Issue 13 1301012 (2024)
Yi Chen, Jinghua Yu, Zhihuan Yao, Xin Zhang, Yiwen Zhang, Chen Huang, Junjie Sun, and Fei Chen
ObjectiveThin-disk structures have excellent thermal conductivity and small thermal aspheric aberration. Therefore, thin-disk lasers have excellent power and energy scalability and simultaneously ensure good beam quality. Thin-disk regenerative amplifiers can achieve a magnification of 105?108 in a single stage, making them ideal sources for small-signal amplification. Currently, the maximum energy and highest average power of the thin-disk regenerative amplifier are 300 mJ and 1.9 kW, as reported by the Max Bonn Institute and TRUMPF Company of Germany in 2016 and 2019, respectively. Compared with foreign countries, there is a large gap in single-pulse energy and average power in China.MethodsA chirped pulse amplification technology route including pulse broadening, energy amplification, and pulse compression is used. A seed laser is generated using an all-fiber mode-locked oscillator and an amplifier, and an appropriate pulse repetition frequency is generated using a frequency selector. The regenerative amplifier is designed based on the laser resonant cavity design method, and it possesses a Yb∶YAG dual thin-disk ring cavity structure. The pulse compressor consists of two reflective gratings for pulse width compression.Results and DiscussionsThe maximum average output power of the regenerative amplifier (with uncompressed pulses) is 124.2 W, with a slope efficiency of 27.4% and an optical-to-optical conversion efficiency of 11.4%. The root-mean-square (RMS) value of the power stability at an average power of 120.4 W is 0.56% and the peak-to-valley (PV) proportion is 4.3%, indicating good power stability. The compressed pulse energy is 110 mJ, the measured center wavelength is 1030.2 nm, and the spectral bandwidth is 1.26 nm. The actual measured pulse width is 2.10 ps, and the measured beam quality, denoted M2, is less than 1.1, indicating that the amplifier has beam transmission capacity close to the diffraction limit.ConclusionsThis study designs a dual thin-disk regenerative amplifier and achieves a long-term stable laser output with a maximum power of 124.2 W, pulse width of 580 ps, and repetition rate of 1 kHz before pulse compression. Using a reflective grating compressor, the pulse width is compressed to 2.1 ps, the single pulse energy is 110 mJ, and the beam quality M2 is <1.1. The next step in this work is to use this laser as a seed source and conduct research on Joule-level high-energy thin-disk multi-pass amplifiers.
Jul. 02, 2024Vol. 51 Issue 13 1315001 (2024)
Qiuye Yu, Jianbo Wang, Cong Yin, Wenwen Bi, Lihua Lei, Baowu Zhang, and Ming Kong
ObjectiveThe precise wavelength measurement of a 543-nm He-Ne laser traditionally relies on iodine-stabilized 543-nm He-Ne laser as the wavelength reference source, which is used to measure the thermally stabilized 543-nm He-Ne laser wavelength via beat frequency beating method. Usually, thermally stabilized 543-nm He-Ne laser employs as a secondary laser wavelength standard, which is widely used in precise measurement. Furthermore, iodine-stabilized 543-nm He-Ne laser is the internationally recommended standard laser frequency reference with its relative standard uncertainty of 4.5×10⁻¹¹. The iodine-stabilized 543-nm He-Ne laser utilizes the intracavity saturation absorption frequency stabilization method, requiring the insertion of the iodine cell into the laser resonant cavity. However, the gain of the Ne atom at 543 nm is notably low, approximately 1% of that at 633 nm. Consequently, the output power of the single longitudinal mode is limited, reaching only approximately 50 μW. Influences, such as mechanical drift, device aging, and other factors, can lead to detuning of the laser resonator cavity, and mismatches with the iodine cell. Hence, prolonged absence in light might be experienced by the 543-nm iodine-stabilized laser, compromising its utility as a laser wavelength reference. Thus, the development of a new wavelength measurement method for the 543-nm He-Ne laser is deemed essential.MethodsIn this study, a new method for accurately measuring the wavelength of the 543-nm He-Ne laser with an optical frequency comb is reported. This method employs offset locking technology to lock the 1086-nm distributed feedback single frequency fiber laser to the optical frequency comb. A frequency-stabilized 543-nm laser is generated by the nonlinear crystal PPLN via a frequency doubling process. The beat notes, detected via the generated CW 543 nm laser and measured 543-nm thermally stabilized He-Ne laser, can achieve accurate wavelength measurement of the measured laser.Results and DiscussionsThe innovative approach for accurately measuring the wavelength of the 543-nm He-Ne laser using an optical frequency comb addresses the challenges of low output power and low signal-to-noise ratio typically observed in beat frequency measurements at 543 nm. Experimental data indicates a signal-to-noise ratio of 41 dB between the 1086-nm single-frequency fiber laser and optical frequency comb. After locking the 1086-nm laser, a frequency fluctuation range of 0.2 MHz is observed over 3 h, with a standard deviation of 0.03 MHz. A frequency jitter range of 1.3 MHz is noted between the 543-nm laser, produced by frequency doubling, and tested He-Ne laser, with a standard deviation of 0.2 MHz. The short-term (1 s) frequency stability and long-term (1000 s) frequency stability of the assessed 543-nm He-Ne laser outperform with values better than 2.1×10⁻¹⁰ and 1.1×10⁻¹⁰, respectively. These findings closely match the direct measurement outcomes of the iodine-stabilized laser, which exhibits a frequency difference of 2.9 MHz.ConclusionsIn this study, the method for precise wavelength measurement of 543-nm He-Ne laser via optical frequency comb is reported. This method utilizes offset locking technology to lock the 1086-nm single frequency fiber laser to the optical frequency comb. Furthermore, a frequency-stabilized 543 nm laser, generated via frequency doubling with a PPLN crystal, serves as the reference for gauging the wavelength of the thermally frequency-stabilized He-Ne laser. Within 3 h after offset locking, the beat frequency fluctuation range between the single-frequency fiber laser and optical frequency comb is 0.2 MHz, and the standard deviation is 0.03 MHz. The frequency jitter difference between the 543-nm laser, generated by frequency doubling, and measured thermally stabilized He-Ne laser is 1.3 MHz, standard deviation is 0.2 MHz, short-term (1 s) frequency stability is better than 2.1×10⁻¹⁰, and long-term (1000 s) frequency stability is better than 1.1×10⁻¹⁰. This method measuring the wavelength of 543 nm is equivalent to the direct beat frequency measurement of iodine stabilized laser. In this method, the low-power 543-nm He-Ne frequency stabilized laser wavelength measurement is realized via frequency doubling. The link between continuous laser and optical frequency combs is established and the laser wavelength measurement is directly traced to the time and frequency reference, which effectively ensures the accuracy of the measurement results.
Jun. 22, 2024Vol. 51 Issue 13 1304003 (2024)
Yingru Wang, Hongjun Wang, Xueliang Zhu, Bingcai Liu, Xin Yue, and Ailing Tian
ObjectiveWith the development of optical technology, the application fields of optical elements and optical systems are becoming increasingly extensive; however, localized microscopic defects on the surface of optics affect the corresponding system performance. Therefore, it is necessary to detect defects on the optical surface. With the development of machine vision technology, the microscopic scattering dark-field imaging method of noncontact detection has become an important method for automated surface defect detection. However, in large-aperture fine optics, there are fewer defects on the surface and a large number of sub-aperture images. When using defect images for sub-aperture stitching, the amount of data used for image storage and processing is high and increases with the size of the detection aperture, which requires a significant amount of time for detection. Accordingly, a surface defect stitching method is proposed based on a sub-aperture feature dataset, which uses the constructed sub-aperture feature dataset to realize full-aperture defect stitching, thereby reducing the amount of data stored and processed during the stitching procedure.MethodsTo perform full-aperture defect stitching, the defect feature data (defect number, type, shape feature, relative position feature, and sparse matrix data) in the binarized sub-aperture image and its overlapping area image were extracted and the sub-aperture feature dataset could be constructed. Then, based on the constructed feature dataset, for the sub-apertures containing defects in the overlapping areas, the overlapping area matching relationship and the offset parameters between the matched overlapping areas were solved and combined with the initial position calculated from the number of scanning steps of the sub-apertures to obtain an accurate positional relationship between the sub-apertures. For sub-apertures without defects in the overlapping areas, the stitching position was determined based on the theoretical position. Finally, the defect sparse matrix data of each sub-aperture were transformed to the corresponding position using coordinates to realize full-aperture defect stitching. As described herein, the sub-aperture feature dataset was constructed based on the feature data extracted from the images captured using the microscopic scattering dark-field imaging device. Full aperture defect stitching was completed based on the dataset, and then compared with the full-aperture stitching results based on the template matching method to analyze and validate the effectiveness of the proposed research method.Results and DiscussionsThe constructed sub-aperture feature dataset (Table 1) was adopted to calculate the overlapping area matching relationship and the corresponding offset parameter, and compared with the offset calculation results obtained using the template matching method (Table 3). The offset calculation results of this study are basically consistent with those of the template matching method. During the offset calculation in the proposed method, the feature data of all the defective areas extracted from the overlapping areas are used to calculate the offset parameter without the need for comparison between unrelated regions, thereby simplifying the calculation process and improving the corresponding efficiency. Meanwhile, some sub-aperture areas were selected for matching and stitching and compared with the results of the direct stitching method (Fig. 5), showing that the method in this study improves the positional deviation that exists in the defective part of the results of the direct stitching method. Thus, this method can effectively realize the accurate matching of sub-aperture areas. Finally, the full-aperture defect images were obtained using the full-aperture defect stitching method based on the feature dataset and the full-aperture stitching method based on the template matching method (Fig. 6). The number and type of defects and some of the scratch size data in the full-aperture image were detected using the connected component labeling algorithm and the minimum enclosing rectangle algorithm (Fig. 8, Table 4). The defect detection results of the full-aperture images obtained using the two methods are basically consistent. In addition, in the process of full-aperture stitching, when stitching images using the template matching method, the data volume of a single processed sub-aperture image is 1.17 MB, and the corresponding processing and storage data volume increases with each completed image stitching, the data volume of the final full-aperture stitching result image is 9.24 MB. However, the method in this study is based on the feature dataset to complete the full-aperture defect stitching; the data volume of the constructed feature dataset is 3.26 MB, and the final data volume of the full-aperture defect image converted from the full-aperture defect data is 20.9 kB. Thus, the proposed method can effectively obtain full-aperture defects, and the volume of stored and processed data in the stitching process is less than that of the image-based stitching method.ConclusionsIn this study, we extracted the feature data in a defect image to construct a sub-aperture feature dataset and complete full-aperture defect stitching. This was compared with the full-aperture image stitching method based on the template matching method. The results of the defects detected in the full-aperture images corresponding to the two methods are basically consistent. During the full-aperture stitching process, the proposed method uses the feature dataset to determine the relative positional relationship of the sub-aperture and to complete the stitching of full-aperture defects, effectively reducing the volume of processed and stored data in the stitching process compared with the image stitching method based on the template matching method.
May. 16, 2024Vol. 51 Issue 13 1304004 (2024)
Kexin Ren, Ailing Tian, Hongjun Wang, Bingcai Liu, Xueliang Zhu, Siqi Wang, Yuwen Zhang, Yuan Su, and Jintao Xu
ObjectiveThe lateral-shear-interference technique is utilized widely for measuring wavefront aberration because of its simple structure, common interference, and minimal susceptibility to external environmental interference. However, the shear interferogram reflects only the gradient of the test wavefront’s shear direction, and the wavefront information to be measured cannot be directly obtained from the interferogram. Wavefront-reconstruction methods based on modal and zonal methods typically depend on orthogonal shear interferograms to reconstruct the wavefront being measured. However, discrepancy exists between the shear direction and the orthogonal coordinate axis of the shear interferogram obtained in an actual experiment. If the wavefront to be measured is reconstructed using the method above, then the accuracy of the reconstruction will be affected. To overcome the limitation of lateral-shear interferometric wavefront-reconstruction technology, which is constrained by the shear direction, and to improve the flexibility of experimental operation, a method for lateral-shear interferometric wavefront reconstruction without directional constraints is proposed. This approach is validated via simulation analysis and experiments.MethodWe introduced a shearing-direction parameter and utilized the underlying algorithm for differential Zernike polynomial wavefront reconstruction to facilitate wavefront reconstruction based on any two directions of lateral-shear interferograms. First, the shear-direction angle θ of the two shear interferograms was calculated using the Radon transform. Subsequently, the differential wavefront information of the measured wavefront was obtained from the shear interferogram in the specified shear direction. The relationship between the differential wavefront and the differential Zernike polynomial in a specific direction was established using θ. The wavefront coefficients to be measured were determined using the least-squares method for wavefront reconstruction. The flowchart of the wavefront-reconstruction algorithm was provided, along with an analysis of the accuracy of wavefront reconstruction for several sets of arbitrary two-direction shear interferograms based on simulation and experiment. The wavefront-reconstruction results were compared with those based on two shear interferograms in the orthogonal directions of the right-angle coordinate axis. The validity of the proposed method was analyzed based on the residual peak-to-valley (PV) and root mean square (RMS) values.Result and DiscussionsThe shear interferogram (Fig.5) of the measured wavefront (Fig.4) along any direction is obtained via simulation. Since the distribution of the measured wavefront is unknown during the experiment, the angle of between the two shear directions used for reconstruction is varied from 2° to 90°. Based on the results, the reconstructed wavefront exhibits the largest PV and RMS residual errors when the angle between the two shear directions is 2°, as compared with the results of a reconstructed shear interferogram in the orthogonal direction. When the angle between the two shear directions exceeds 12°, the wavefront-reconstruction accuracy of the method proposed herein aligns with that of the shear interferogram in the orthogonal direction. Additionally, the accuracy of wavefront reconstruction remains unchanged as the angle between the two shear directions increases (Table 1, Fig.7). Meanwhile, the accuracy of wavefront reconstruction decreases as the noise levels increase at various angles (Fig.8). When the relative noise level reaches 100%, the PV and RMS residual error values of the wavefront reconstruction are λ/40 and λ/285, respectively. Under the same noise level, the wavefront-reconstruction results are consistent regardless of the angle used. When the shear interferogram used for reconstruction presents shear-rate deviation, the reconstruction error of the wavefront to be measured decreases as the angle between the two shear interferograms increases (Fig.9). When the shear-rate deviation is less than 4% and the shear-direction angle exceeds 10°, the reconstructed theoretical PV and RMS residual error values exceed λ/50 and λ/250, respectively, without any noise or systematic error. Furthermore, the accuracy of the method is confirmed experimentally. The lateral-shear interferogram aligns closely with the reconstructed surface-shape features in any two directions with respect to the orthogonal direction (Fig.13), and the measurement results are almost identical. When considering the angle between the two shear interferograms, the accuracies of the self-compared reconstructed PV and RMS exceed 0.029λ and 0.0051λ, respectively (Table 2).ConclusionsThis paper introduces an unconstrained wavefront-reconstruction method to overcome the limitations of existing lateral-shear-interferogram reconstruction methods. These methods are constrained by the directionality of the shear interferogram, which restricts their accuracy. The proposed method can achieve wavefront reconstruction using any two lateral interferograms and eliminates the necessity to consider the effect of shear-direction error on the reconstruction accuracy. Moreover, the proposed method is used to process any two directions of lateral-shear interferograms obtained experimentally. When compared with wavefront-reconstruction results based on orthogonal shear interferograms, the accuracy of the reconstructed PV and RMS values are 0.029λ and 0.0051λ higher, respectively, thus validating the accuracy and efficiency of the proposed method.
Jul. 10, 2024Vol. 51 Issue 13 1304005 (2024)
Kai Lu, Ruiyang Wang, Dahai Li, Renhao Ge, and Wanxing Zheng
ObjectiveIn recent years, the demand for improved optical systems has resulted in the utilization of spherical elements, which can correct aberrations and enhance imaging quality. However, the common practice of incorporating additional optical elements for aberration correction increases the volume and weight of optical instruments, thus contradicting the trend toward lightweightness and miniaturization. By contrast, aspherical optical elements with varying curvatures can effectively correct aberrations, improve imaging quality, and satisfy the requirements of lightweightness for optical systems. Consequently, they have broader applications in healthcare, aerospace, astronomy, and high-power lasers. The non-coincidence of the geometric and optical axes in off-axis aspherical elements provides additional degrees of freedom for aberration correction in optical system designs. Whereas this addresses issues such as center obstruction, which can degrade the imaging quality, it increases the difficulty in measuring the surface of the elements. Commonly used methods for measuring the surfaces of off-axis aspherical elements include interferometry and profilometry. Interferometry utilizes changes in the optical-path difference to generate interference fringes, thereby enabling high-precision surface measurements. However, interferometric precision is affected by the environment and typically requires additional compensatory devices for off-axis aspherical-element measurements. Profilometry, which uses a mechanical probe in contact with the surface of an element and a detector to sense changes in the height of the contact point, achieves point-by-point measurements of an elements profile. However, its motion mechanism renders high-precision measurement challenging and contact between the probe and the tested elements surface can cause surface damage. Conventional phase-measuring deflectometry has been widely applied as a non-destructive and efficient technique for measuring the shape of optical-element surfaces. However, obtaining highly accurate coordinates of the reflection points is challenging because of the ambiguity between the slope and height. The off-axis aspherical element introduces an additional off-axis parameter in the standard aspherical configuration. As a countermeasure, the measurement region is modified, which renders it difficult to determine the central position. Therefore, accurate and efficient methods for the surface measurement of off-axis aspheric elements are scarce.MethodsTo accurately and efficiently measure an off-axis aspheric surface, this study proposes a method based on stereo deflectometry combined with point-cloud-matching data processing. This approach was utilized to accommodate the structural parameters and measure the surfaces of off-axis aspheric mirrors. First, the point-cloud data of an off-axis aspherical mirror were obtained based on the principles of stereo deflectometry. Subsequently, the geometric relationship between the point-cloud data and the theoretical model of the off-axis aspheric mirror was utilized. A nonlinear least-squares algorithm was employed to optimize the pose errors and aspherical structural parameters. Finally, utilizing the geometric relationships, pose errors, and optimized structural parameters, the point-cloud data were matched with the theoretical model, which yielded the surface of the off-axis aspherical mirror. To validate the feasibility of the proposed method, numerical simulations were conducted on an off-axis aspheric mirror with vertex curvature c=1/678.91 mm-1, off-axis distance b=100 mm, and conic constant k=-1 within a measurement range of 142 mm, including the surface error. In the experiments, measurements were performed on the off-axis aspherical mirror, and its structural parameters were optimized, which yielded surface measurement results similar to those achieved via interferometry. This method is viable for the surface measurement of off-axis aspherical mirrors.Results and DiscussionsThis study introduces a point-cloud-matching method based on stereo deflectometry. The proposed approach is validated via numerical simulations and experiments on targeted elements. In the numerical simulations, the parameters are consistent with the actual measurements, and surface errors are introduced [Fig. 6(a)]. The simulation results are presented in Figs. 6(b) and (c). The surface yielded by the proposed method is consistent with the actual surface. Based on a comparison of the Zernike coefficients (Fig. 7), the simulation results closely approximated the defocus, astigmatism, coma, and spherical aberration terms set in the preset parameters. During the experiments, the surface of an off-axis aspherical mirror with a diameter of 142 mm was measured. The experimental results (Fig. 10) indicate that the proposed method achieves an element surface RMS value of approximately 31 nm, whereas the interferometer achieves an RMS value of approximately 15.9 nm. The optimized structural parameters are obtained (Table 1), which can serve as reference for the measurement of actual mirror structural parameters. The results show that the proposed method exhibits good accuracy for off-axis aspherical surface measurements.ConclusionsThis study introduces a point-cloud data-matching method for stereo deflectometry based on a vision ray model, which facilitates the fitting of structural parameters and surface measurements for off-axis aspherical mirrors. First, the principles of stereo deflectometry point-cloud reconstruction within the vision ray model are described. Subsequently, the point-cloud-matching method and specific data-processing procedures are explained in detail. The reconstructed results are matched with the theoretical model via point-cloud matching, thus enabling an accurate measurement of the surface of the off-axis aspherical mirror. Moreover, the proposed method is validated via numerical simulations, where the surface error of an off-axis aspherical mirror is incorporated. In the experiment, a measurement system is implemented to confirm the effectiveness of the proposed method for off-axis aspherical surface measurements. The reconstructed surface is consistent with the interferometer results.
Jul. 04, 2024Vol. 51 Issue 13 1304006 (2024)
Yanqing Wang, Weifeng Du, Yongkang Wu, Zhengyi Zhai, Zhongjia Zhu, and Zhaohui Cao
Secondly, we conduct thermal stability simulation on the star sensor, simplify the structural model of the star sensor, remove small features and holes, refine the grid of the circuit box area locally, and establish a thermal simulation model. The meshing of the model and coordinate system definition are shown in Fig.4. Under the given thermal boundary conditions (installation surface temperature control of 10‒30 ℃, mainly achieved through precision temperature control modules on the inner side of the bracket, and temperature control of 25‒45 ℃ for the baffle, mainly achieved through an outer ring of heating plates), a micro star sensor model is used to complete the thermal simulation according to the simulation input conditions. The simulated temperature field is mapped to the finite element model for structural thermal deformation simulation. The change in the optical axis is calculated based on the tilt result data of the optical axis.Based on the simulation results and the thermal conductivity and expansion coefficients of the material, as shown in Table 2, the structure and material are optimized. Silicon carbide is selected and the structure is designed symmetrically. In order to avoid the baffle being exposed to sunlight and heat being transmitted to the star sensor circuit box, the installation method of the baffle is improved and changed from the original contact type installation to an isolated type installation (Fig.6). The baffle is fixed to the installation surface through a bracket and an insulation washer.Finally, thermal stability tests are conducted on the improved star sensor design to verify the simulation results.Most previous literature has modeled the optical mechanical system of star sensors and conducted simulation analysis by setting temperature, structure, and other parameters. A few have described the thermal stability test methods of star sensors. However, due to the complexity of the optical mechanical system of the star sensor and the influence of solar radiation changes on the space orbit, simulation analysis is difficult to fully reflect the actual situation in orbit. The reported thermal stability test method is only a test of existing products and cannot improve the thermal stability of the star sensor. Instead, we propose a thermal stability test method to simulate the in-orbit environment and test the changes in the optical axis direction of the micro star sensor. Then, based on the analysis of experimental data and simulation results, targeted optimization design is carried out for the structure and materials of the product. Finally, thermal stability simulation and experimental verification are carried out on the improved product. The results indicate that the thermal stability test method can effectively measure the optical axis pointing offset caused by thermal stress deformation of the star sensor. Material optimization can improve the overall structural strength and reduce thermal deformation, and structural symmetry design can improve the balance between the optical axis pointing in both directions, ultimately reducing the optical axis pointing offset from 1.0394″/℃ to 0.1695″/℃. The design of independent installation and insulation of the baffle can effectively reduce the impact of thermal deformation of the baffle on the optical axis direction, reducing the optical axis pointing offset from 0.2403″/℃ to 0.0054″/℃.ObjectiveThe resolution of the new generation of commercial remote sensing satellites should be better than 0.5 m for high-precision topographic mapping and centimeter-scale surface deformation detection, but the thermal control conditions are not as abundant as those of the satellite, and the temperature of the mounting surface of the micro star sensor fluctuates greatly, which leads to the drift of the optical axis and affects the attitude control precision of the satellite as well as the high-resolution index. Star sensors work in the harsh environment with strong radiations, bearing periodic heating and cooling from the solar radiation and the space heat sink, experiencing a variety of thermodynamic environment drastic changes, so that the temperature of star sensors fluctuates periodically. The fluctuation of the ambient temperature leads to the fluctuation of the temperature of the baffle of the star sensor up to 80 ℃ and the fluctuation of the mounting surface up to 40 ℃. The temperature distribution in the star sensor is not uniform, resulting in thermal stress and thermal deformation, which leads to wavefront distortion of the optical system and image blurring, thus affecting the attitude measurement accuracy. In order to ensure the normal operation of the star sensor in orbit, it is urgent to study the temperature distribution characteristics of the star sensor and the mechanism influencing the measurement accuracy of the star sensor, with the operating environment in orbit and the structural characteristics of the star sensor considered. The influence of temperature change on optical axis pointing offset of star sensor is studied quantitatively by thermal stability test. It provides an important theoretical basis and technical method for the scheme design, index demonstration, performance evaluation and improvement of star sensor system. In a word, it is of great significance and practical value to study the thermal stability test method and corresponding improvement and optimization of star sensor.MethodsFirstly, a set of thermal stability testing equipment is constructed and thermal stability tests are conducted on the current star sensor, as shown in Fig.1. In response to the high accuracy of thermal stability test and high sensitivity to the surrounding environment, a marble optical platform is used on the isolation foundation to ensure the isolation of star sensors, static multi star simulators, and installation brackets from the surrounding environment. Besides, molecular pumps and flexible pipelines are used to prevent vibration transmission during vacuum operations.Results and DiscussionsIn this paper, we give a thermal stability design and experimental verification method for micro star sensors.ConclusionsIn this paper, we simulate the in-orbit environment and conduct thermal stability tests on existing micro star sensors based on the thermal stability requirements and harsh thermal control conditions of the new generation of commercial remote sensing satellites. Based on the test results and simulation results, the optical mechanical structure of the star sensor is symmetrically balanced, the main frame material is improved, the baffle is installed independently, and insulation is optimized to improve the thermal stability ability. The optimized design of the micro star sensor increases the optical axis pointing accuracy. Thus, it can adapt to the harsh thermal control conditions of commercial remote sensing satellites and ensure the stability of star sensor optical axis pointing under a wide range of temperature fluctuation. The thermal stability test scheme, simulation design scheme, optical mechanical structure optimization design scheme, and measured data mentioned in this paper can provide some reference for other space situational awareness sensors.
Jul. 10, 2024Vol. 51 Issue 13 1304007 (2024)
Yuzhi Chen, Tonglu Xing, Qiang Lin, Cheng Liu, and Jianqiang Zhu
ObjectiveOne of the main technical difficulties in the measurement of large differential dimensions and oversized components using optical elastometers is that only spatial scanning and splicing measurements are realizable, which significantly reduces the measurement accuracy. According to the basic principle of liquid-crystal displays (LCDs), liquid-crystal panels can be modulated rapidly under the action of the applied voltage and the pixel-by-pixel light polarization state. Moreover, technological advancement has enabled the size of a single liquid-crystal panel to reach 10 m2 or larger. If the liquid-crystal panel can be used as a light source for photoelasticity instruments, then high-speed rail windshields and float-glass assembly lines on flat glass and other large-sized components can be inspected online at high speeds. Thus, the speculative large-diameter measurement problems inherent in existing photoelasticity-measuring instruments can be overcome. However, most liquid-crystal panels emitting elliptically polarized light cannot be used easily to obtain the ideal circularly polarized light, which implies that the existing circularly polarized light cannot be used directly. Therefore, a measurement method for elliptical-light illumination must be developed.MethodsUsing an LCD instead of a quarter-wave plate enabled the system used in this study to automatically adjust the form of elliptically polarized light, thus significantly reducing costs and providing a theoretical basis for large-sample measurements. The illumination involved two lights of similar wavelengths, and the LCD directed both forms of elliptically polarized light onto the sample vertically. Subsequently, a CCD was used to record an image of a linearly polarized light modulated by a quarter-wave plate and polarizer. Finally, the principal-stress difference was accurately determined from a set of 12 phase-shifted images using the developed algorithm.Results and DiscussionsTo verify the comprehensive performance of the developed instrument, we used a classic counterpressure sheet as the sample to be measured. We measured it using our developed instrument and the classical six-step phase-shift method; subsequently, we compared the measurement results yielded by the two methods. The sample to be measured is a polycarbonate circular plate with a diameter of 120 mm and a thickness of 4 mm, which is counter-pressed in the direction of the diameter. After the power switch was turned on, the control software of the measuring instrument was started, and the system completed the data acquisition and calculation within 10 s. Figs. 5(b)?(g) show the six difference plots corresponding to I in Eq. (8), which were obtained by subtracting each pair of wavelengths of the 12 original bright- and dark-field photoelastic stripes from each pair of bright- and dark-field photoelastic stripes obtained by the system. Figs. 5(b)?(d) correspond to the wavelength pass and Figs. 5(e)?(g) correspond to the wavelength. Using the six intensity-difference plots shown in Fig. 5, the sums in Fig. 6(a) and 6(b) were calculated using Eq. (11), and the wrapped phase in Fig. 6(c) was calculated using Eq. (12). By removing the wrapping and dividing it by the optical-stress constant, the principal-stress difference in Fig. 6(c) was calculated based on the elliptically polarized photoelasticity. To facilitate the quantitative measurement of the accuracy of the measuring instrument, we used the classical six-step phase-shift method to measure the sample for comparative measurements, and the measurement results are presented in Fig. 7. Figs. 7(a1)?(a6) show the intensity images obtained using the classical six-step phase-shift photoelasticity, Fig. 7(b) shows the difference in principal stresses computed using the classical six-step phase-shift method, and Fig. 7(c) shows the difference between the results measured using the developed instrument and the classical phase-shift method. The result shows that the maximum difference between them is 0.082 MPa and that the relative accuracy error is 2.85%. Fig. 8 shows the measurements of the stress-direction angle, where the average deviation of the direction angle is 0.01 rad.ConclusionsIn this study, an optical instrument that can measure the stress distribution in a sample is developed using advanced light sources, i.e., dual-wavelength LEDs and liquid-crystal spinning plates, as well as advanced light-modulation devices. Relevant experimental measurements were performed, and experimental comparisons were conducted with the classical six-step phase-shift method to validate the method, which yielded a relative error of 2.85%. The photoelastic liquid-crystal measuring instrument investigated in this study presents a simple structure, can be operated rapidly, and does not require complicated mechanical rotations or other manual interventions. The maximum resolution of the instrument is 0.5 mm, which satisfies the standard for photoelasticity measurement.
Jul. 02, 2024Vol. 51 Issue 13 1304008 (2024)
Tianyu Zhang, Wei Fan, Xiaochao Wang, Lin Yang, Neng Hua, Guoyang Li, Xiuqing Jiang, Yajing Guo, Panzheng Zhang, Zhiyong Xie, Mingying Sun, Shengjia Zhang, Tao Wang, Jiaju Song, and Kan Gu
Fig. 8 shows the eight test results of the relative delay measurement of the first signal light and the infrared reference light, where the red line is the average of the eight signals. The average of the eight signals was 852.208ps, the peak valley (PV) value was 3.660 ps, and the root mean square (RMS) was 1.213 ps. An off-line experiment was performed to analyze the inter-beam jitter caused by the method. A scattering sphere combined with an oscilloscope was used for the measurements. The experimental optical path is shown in Fig. 10. The interbeam jitter of the relative delay of the dual-channel signal under 10, 20, 50, 100, 150, and 200 shots was tested. The jitter test results are listed in Table 1. When the test involved 10 shots, the jitter PV value was 2.53 ps, and the RMS value was 0.821 ps. Under the maximum test of 200 shots, the jitter PV value was 5.98 ps, and the RMS value was 1.124 ps. Subsequently, the two optical signals do not pass through the scattering spheres. The optical path diagram is shown in Fig. 11. The jitter test results are shown in Fig. 2. The jitter PV value of the two pulses was 2.51 ps, and the RMS value was 0.771 ps for 10 shots. The relative jitter PV value at 200 rounds was approximately 6.19 ps, and the RMS was approximately 1.10 ps. By comparing Tables 1 and 2, introducing the scattering sphere does not affect the measurement of inter-beam jitter. Comparing offline jitter test results obtained from the scattering sphere and oscilloscope dual-channel with online jitter measurements using a single pulse from the SGII device, the PV value was 3.660 ps, and the RMS value was 1.213 ps. These data can be considered the inherent jitter of online synchronous measurement devices.Subsequently, the relative delay between the multiple signal lights to be measured and the reference light was tested and averaged for the SG II device’s second, fifth, and sixth channels. Fig. 9 shows the final test results for the relative delay of the final four beams. The PV value between the beams was 3.144 ps, and the RMS was 1.476 ps. In multichannel laser synchronous measurements, delay errors primarily stem from the geometric structure of the scattering sphere, positioning accuracy, oscilloscope indication errors, and collimation drift. In this experiment, the error in interbeam synchronous measurement was determined to be 762 fs.ObjectiveLaser inertial confinement fusion (ICF) achieves controllable nuclear fusion to produce clean and safe energy. The ICF experiment has stringent energy, power balance, and waveform consistency requirements for pulses arriving at the target point. Uniform driving of the target surface requires accurate beam synchronization to achieve an accurate power balance. Therefore, synchronous measurement and adjustment technology for multibeam lasers is critical.MethodsTo achieve synchronous measurements of multiple beams at the target point, the testing method and principle employed are shown in Fig. 4. The seed light was sampled and coupled as the reference light after passing through the regenerator and then connected to a 1053 nm single-mode fiber with a length of approximately 130 m. After transmission through the fiber, it was converted into an electrical signal using a photodiode and entered an oscilloscope. The central target sphere in the target chamber is replaced by an ~800 μm diameter alumina scattering sphere positioned at the center of the target chamber using the target positioning system. In this experiment, a single beam of ultraviolet light from any direction is scattered isotropically at a solid angle of 4π, covering the entire target chamber. A fused quartz nonspherical mirror was placed on a flange in the direction of non-transmitting light to capture the scattered light. The scattered light is detected using a fast photomultiplier tube and converted into an electrical signal, which is input into another oscilloscope channel. The synchronization time delay between the measured beam and the time reference can be measured.Results and DiscussionsThe time delay between the first signal light and the infrared reference light of the Shenguang-II device is measured. Fig. 6 shows the track data obtained using an oscilloscope. The blue curve represents the infrared reference light, and the red curve represents the ultraviolet signal light. The infrared reference and ultraviolet signals are fitted with second- and first-order Gaussian functions. The vertex of the fitted Gaussian pulse is selected as the characteristic point to measure the difference in the delay between the two pulses. The experiment measures the delay between the signal light and the reference light eight times, and the average time difference is obtained.ConclusionsA method is proposed for time synchronization measurement of multibeam laser targets using a scattering sphere tailored explicitly for large laser devices like SG-II. Through a verification experiment based on the target synchronization measurement of the SGII device, the final synchronization measurement results of the four beams were found to be 3.144 ps (PV) and 1.476 ps (RMS). While the maximum delay error in interbeam synchronization measurement due to this scheme reached 5.06 ps, the interbeam synchronization error for the simultaneous measurement of four beams with identical scattering angles was approximately 762 fs. The final experimental measurements and analysis concluded that the time-synchronization jitter and delay based on the target achieved precision at the picosecond level for both nanosecond-long pulses and picosecond-short pulses. In addition, the inherent jitter of the method was obtained by comparing the offline and online experiments.
Jul. 02, 2024Vol. 51 Issue 13 1304009 (2024)
Junlin Chen, Defeng Mo, Mengdie Jiang, Haiyong Zhu, Qinfei Xu, Zhijiang Zeng, Jinglin Zhang, Xiaoyang Yang, and Xue Li
ObjectiveThe miniaturization and integration of multispectral detectors have become one of the development directions for infrared detectors. This paper proposes a component structure that integrates a lens and window with airtight packaging, focusing on the characteristics of integrating low-temperature optical lenses for multispectral detectors. Various aspects are investigated, including high-precision optical alignment for different focal planes of the same component multispectral detector, low deformation filter support structure, and suppression of optical crosstalk and stray light. These studies address a series of issues related to high-precision alignment, low deformation filter support, prevention of optical crosstalk, and suppression of stray light in the miniaturization and integration packaging of multispectral detectors. The developed component has been successfully applied in a spectral imaging instrument for a specific project.MethodsA component structure for a multispectral infrared detector with an integrated lens has been designed (Fig.3). The airtight packaging component structure of the multispectral infrared detector with an integrated lens includes a component housing, cover plate, lens, primary aperture, filter holder, filter, chip module, electrode plate, and filter holder support. Before packaging, the entire component is evacuated, followed by filling with inert gas, and finally sealed using parallel seam welding. The airtightness meets the long-term requirements of the payload.By designing a three-layer laminated low-deformation multispectral filter holder assembly, multiple small filter pieces are adhered to the low-stress filter holder structure. This structure can also be used for the assembly of multiple mid-wave and long-wave filter pieces with the detector. It overcomes the problems of size interference and complex integration process with low yield associated with traditional bonding methods. It achieves the coupling of low-deformation multispectral filters with the detector (Fig.4).This study employs the micro-adjustment technique for different focal planes of the multispectral infrared detector and the coaxial lens adjustment technique. It achieves a precision deviation of less than ±5 μm between different focal planes and the filter assembly for a three-band detector within the same component. The lens-to-detector alignment precision within ±15 μm is achieved (Table 1). Spectral tests are performed using the infrared detector component with an integrated lens, and the results indicate no significant optical crosstalk among channels (Fig.6).Results and DiscussionsThrough the design of a three-layer laminated structure with low deformation, multiple small filters have been successfully bonded to the low deformation stress filter frame. The maximum low-temperature deformation of the 1.64 μm filter at 130 K is 0.9278 μm, while the maximum low-temperature deformation of the 2.13 μm and 1.38 μm filters at 130 K is 0.2292 μm (Fig.5). By using micro-adjustment techniques for different focal planes of the multi-band infrared detectors and coaxial lens adjustment techniques, the deviation in the alignment between different focal planes of the three-band detectors and the filters within the same component is better than ±5 μm, and the alignment precision between the lens and the detectors is better than ±15 μm. Spectral testing is conducted using the integrated lens infrared detector component. The results of the spectral testing indicate that there is no significant optical crosstalk among channels. A series of low-stress design and process improvements are applied to the low-temperature lens, and the results show that the band detection rate is greater than 1.5×1011 cm·Hz1/2·W-1 (130 K). The maximum absolute variation in band response rate before and after rigorous environmental testing is 8.5% (Fig.9). The high-performance multi-spectral integrated infrared detector component is obtained, and the experimental results confirm that the detector functions properly and the component performs well (Table 2).ConclusionsThis article focuses on solving the packaging technology of multi-channel integrated infrared detector components, proposes a multi-band infrared detector airtightness packaging component with integrated lenses, and emphasizes the key technologies such as jointing of different focal planes for different bands and coaxial lens adjustment technology for the same component, high reliability support structure for multi-filter narrow seam splicing, and stray light suppression, solving the high-precision alignment of multi-channel integrated infrared detector components, low stress control, low optical crosstalk, low power consumption, and high reliability of the detector. A high-performance multi-band infrared detector component with integrated lenses has been obtained.
Jul. 10, 2024Vol. 51 Issue 13 1310001 (2024)
Yuqiang Yang, Yuting Li, Xiaoguang Mu, Jiale Gao, Yuying Zhang, and Lei Bi
ObjectiveFiber optic sensors play an important role in the field of optoelectronics and have advantages such as small size, light weight, high sensitivity, anti-electromagnetic interference, and remote sensing. Temperature detection is one of the most basic applications of fiber optic sensors. Optical fiber temperature sensing is mainly based on the fiber optic grating and interferometer structures. Fiber optic gratings have a relatively low sensitivity to temperature, typically in the order of pm/℃, whereas the temperature sensitivity of fiber interferometers, such as Fabry-Perot (FPIs), Mach-Zehnder (MZIs), and fiber Sagnac interferometers (SIs), is relatively high, reaching the order of nm/℃. However, in some application areas, a temperature sensitivity of the order of nm/℃ still cannot meet the requirements. To further improve the sensitivity of optical fiber interferometers, researchers have recently proposed the ordinary vernier effect (OVE) and harmonic vernier effect (HVE). Both the OVE and HVE are based on two cascaded or parallel interferometers. However, unlike the OVE, the HVE breaks the restriction stating that the optical path differences of cascaded or parallel interferometers in the OVE must be approximately equal. The optical path difference of one interferometer in the HVE can be an integer multiple of that of the other interferometer. Therefore, compared to the OVE, the HVE increases the design freedom of the sensor, which can lower the preparation difficulty to some extent. However, to date, there has been no research reported on this issue. Therefore, this study conducts an in-depth investigation on this issue.MethodsA fiber-optic temperature sensor based on the HVE generated by a cascaded SI and FPI is proposed, in which the free spectral range of the FPI is approximately a multiple of that of the SI. First, we derive the sensitivity and detuning of the proposed sensor when the HVE is generated and then verify them via experiments. To facilitate analysis and verification, the magnifications for different order HVEs are designed to have the same value. In the experiments, by fixing the length of the FPI and adjusting the panda fiber length in the SI, the sensor generates the 0th- (that is, the OVE), 1st-, and 2nd-order HVEs with approximately the same magnification.Results and DiscussionsBoth the simulation and experimental results show that when the free spectral ranges of the FPI and SI satisfy RFSR,FPI=i+1RFSR,SI, the i-order HVE can be generated. If RFSR,FPI>i+1RFSR,SI, the interference spectrum envelope gradually blueshifts with increasing temperature, whereas if RFSR,FPI<i+1RFSR,SI, the interference spectrum envelope gradually redshifts with increasing temperature. For the 0th-, 1st-, and 2nd-order HVEs, the temperature sensitivities of the sensor are 18.88, 18.49, and 17.80 nm/℃, respectively. Compared with that of a single SI, their sensitivity is amplified by 10.12 times, 10.10 times, and 9.64 times, respectively, with corresponding panda fiber length detunings of 48, 90, and 150 mm, respectively. If the amplification is the same, the OVE and HVE have almost the same temperature sensitivity; however, the panda fiber length detuning of the HVE is significantly larger than that of the OVE, and the higher the order of the HVE, the larger the detuning.ConclusionsA fiber-optic temperature sensor based on the HVE generated by a cascaded SI and FPI is proposed, in which the free spectral range of the FPI is approximately a multiple of that of the SI. By fixing the length of the FPI and adjusting the panda fiber length in the SI, 0th-, 1st-, and 2nd-order HVEs with approximately the same magnification are generated. Both the simulation and experimental results show that if the amplifications are the same, the OVE and HVE have almost the same temperature sensitivity; however, the panda fiber length detuning of the HVE is significantly larger than that of the OVE, and the higher the order of the HVE, the larger the detuning. Therefore, in terms of preparation difficulty, the HVE is evidently better than the OVE.
Jun. 22, 2024Vol. 51 Issue 13 1310002 (2024)
Huchen Li, Haiyan Guan, Xiangda Lei, Nannan Qin, and Huan Ni
ObjectiveAccurate and efficient point cloud classification plays a vital role in tasks such as scene understanding and digital twin city classification. Traditional classification methods manually extract features and construct discriminative models to classify point clouds. However, with the increasing density of point cloud acquisition and growth in data volume, it is difficult for traditional methods to achieve accurate and efficient point cloud classification. Recently developed deep learning-based point cloud processing methods promote the development of point cloud classification. Among them, methods using visual structural data, such as unique points or voxels, are prone to losing critical geometric features, whereas methods fusing multiple structural data can learn multilevel and multiscale features of different data. However, it is difficult to balance the differences between various data, which reduces the accuracy of point cloud classification. In addition, LiDAR point clouds acquired from complex urban scenes contain large amounts of noise and outliers that are difficult to process. These challenges have become a problem to be solved in current point cloud classification research.MethodsTo address these problems, a point-voxel consistency constraint network (PVCC-Net) is proposed to accurately segment point clouds with different sizes in urban scenes. The overall structure of PVCC-Net is designed with a dual-branch U-Net encoding-decoding structure. First, the point and voxel branches extract features from different receptive fields. The point branch extracts point-level geometric semantic features through a local feature aggregation (LFA) module, which helps reduce the effects of feature redundancy and noise. The voxel branch stepwise expands the receptive field by using a convolutional network to extract voxel features at different levels. The voxel format is regular and ordered in the memory, which maintains the continuity of spatial information and compensates for the shortcomings of point clouds. The point fine-grained feature and voxel coarse-grained feature branches cover a range of spatial scopes with different resolutions, thus combining this multilevel contextual information to enhance feature extraction capabilities. The point-voxel consistency constraint (PV-CC) module adequately integrates fine-grained and coarse-grained features and enhances the adaptive ability between point clouds and voxels by constraining the distances between feature branches of different granularities in the same layer of the network, which enables the model to produce more stable prediction results. Subsequently, the point-voxel self-attention (PV-SA) mechanism sufficiently fuses point and voxel features while enhancing the expression of the global features. Finally, the performance of the network is further improved via weighted cross-entropy and Lovasz loss functions, which result in accurate and efficient point cloud classification in urban scenes.Results and DiscussionThe proposed PVCC-Net is trained and evaluated on three urban scene datasets, namely, Toronto3D, Semantic3D, and SensatUrban, with performances of 97.97%, 93.80%, and 93.00% in terms of overall accuracy (OA) and 82.92%, 75.70%, and 55.40% in terms of mean intersection of union (mIoU), respectively. All experimental results outperform the Baseline network (Table 2, Fig.6, and Fig.9). In addition, PVCC-Net achieves competitive experimental results compared with other state-of-the-art methods, which fully demonstrates its strong generalizability (Tables 3 and 4). Notably, PVCC-Net not only maintains the integrity of the internal structure of the categories but also makes the segmentation boundaries between different categories clear and accurate (Figs.4, 7, and 10). Comparative experimental and ablation studies demonstrate that different granular features have different semantic representation capabilities. The combination of fine-grained point features and coarse-grained voxel features can significantly improve the accuracy of point cloud classification, and the consistency constraint reduces the differences between different granularity features by minimizing the feature distance, thereby improving the stability and robustness of the model (Table 5). However, the complexity analysis indicates a higher number of parameters and FLOPs in PVCC-Net, mainly because the convolution and deconvolution operations in the voxel branch incurred considerable computational costs. However, the Latency is close to that of the point-based and point-voxel fusion methods (Table 6).ConclusionsIn this study, PVCC-Net is used for the LiDAR point cloud classification of urban scenes. The network first aligns the distribution of point fine-grained features and voxel coarse-grained features through a point-voxel consistency constraint module and then uses a point-voxel self-attention mechanism to capture long-distance context information, enhancing the global feature representation, and finally alleviating the imbalance of point cloud categories in the urban scene via the square-root-weighted cross-entropy and Lovasz loss functions for accurate point cloud classification. On the Toronto3D, Semantic3D, and SensatUrban datasets, PVCC-Net improves the mIoU by 3.44 percentage points, 0.90 percentage points, and 2.30 percentage points, respectively, compared with RandLA-Net. In addition, the classification performance of PVCC-Net is comparable to that of other advanced methods. The results of comparative experiments and ablation studies show that deeply fused point fine-grained features and voxel coarse-grained features can enhance the capability of the model to extract complex features in urban scenes and further constrain point and voxel features to maintain the consistency of the feature distributions and improve the stability of the model prediction results. However, PVCC-Net has a higher number of parameters and computational cost. Therefore, in future research, we will explore the synergistic and complementary effects of points and voxels in a lightweight scene point cloud classification task.
Jul. 02, 2024Vol. 51 Issue 13 1310003 (2024)
Xiangda Lei, Haiyan Guan, Ke Chen, Nannan Qin, and Yufu Zang
ObjectiveA mobile laser scanning (MLS) system can quickly and accurately acquire 3D point cloud data of a scene around a road, and such a system has the advantages of fast acquisition speed, high positioning accuracy, high point cloud density, strong anti-interference ability, and information richness. Thus, MLS systems are widely used in many fields, such as intelligent transportation, digital twin cities, high-precision maps, and assisted driving. As the basis of this system application, people need to extract accurate and semantically rich information from large-scale and complex MLS point clouds. Although there are many large-scale deep learning point cloud classification methods that achieve competitive classification accuracy, they still suffer from problems such as insufficient original training scenes and incomplete point cloud feature expression. To further expand the distribution of the training data and improve the feature representation of the model, we propose an MLS point cloud classification method based on data augmentation and mask learning.MethodsThe proposed method is divided into two main parts: an elevation-calibrated Mix3D (EC-Mix3D) data augmentation strategy and a mask learning framework. Specifically, the EC-Mix3D data augmentation strategy first extracts the normalized elevation of the point cloud through a cloth simulation filtering algorithm. Then, the point clouds of two independent sub-point clouds are mixed via normalized elevation calibration. Because the point clouds of the two scenes have the same elevation reference, they can be effectively mixed to generate training data with a new context, which expands the distribution of the training data. The mask learning framework first generates mask data by applying a random block mask operation to the input data. Then, the original input data and mask data are fed into the Siamese two-branch network and predicted. Finally, label supervision, consistency constraints, and error prediction entropy maximization based on two-branch predictions are performed to enhance the expressiveness of the point cloud features and reduce the model's overconfidence when predicting in complex regions. Specifically, the label supervision of the original branch provides the underlying supervised signal for model training, and the label supervision of the mask branch can motivate the model to efficiently learn additional point cloud context features by predicting masked data from unmasked data. Consistency constraints increase point cloud feature expressiveness and model prediction stability by minimizing the difference between the predicted values of the masked input branch and the original point cloud branch, and error prediction entropy maximization increases prediction uncertainty in complex scenarios by encouraging high entropy posterior probabilities for misclassified points, which suppresses classification model overfitting.Results and DiscussionsThe Toronto3D and Paris public MLS datasets were used to validate the proposed method. Experimental results (Fig.6, Fig.7) show that the proposed method can effectively classify most MLS point clouds. However, the classification results for points far from the center and feature similarities are unconvincing. Comparing these results (Table 1, Table 2) with those obtained via other methods shows that the proposed method can effectively improve the accuracy of the baseline method and obtain optimal accuracy. Specifically, we obtain 97.7% and 93.20% overall accuracy (OA), and 83.8% and 68.74% mean intersection of union (mIoU) on the Toronto3D and Paris datasets, respectively. The ablation experiment results (Table 3) show that each component of the proposed method improves the classification performance of the model. By sequentially adding the EC-Mix3D data augmentation strategy and mask learning framework to the baseline method, the mIoU can be improved by 3.38 percentage points and 6.34 percentage points, respectively. The results of different mask voxel sizes (Table 4) and mask ratios (Table 5) indicate that the proposed method employs the mask parameters that are the most suitable for Toronto3D point cloud classification. Finally, the results of a model complexity analysis (Fig.8) show that the proposed method enhances model classification performance without increasing model complexity.ConclusionsIn the present study, a novel MLS point cloud classification method is proposed to improve model robustness and the expressiveness of the point cloud features via an EC-Mix3D data augmentation strategy and a mask learning framework. Specifically, the EC-Mix3D strategy expands the training sample distribution by scene mixing the training data to improve the robustness of the model. The mask learning framework obtains a masked point cloud by applying a random block mask to the input point cloud, and it then utilizes the predicted values of the original and masked point cloud for label-supervised learning, consistency constraints, and error prediction entropy regularization, aiming to enhance the feature representation capability of the model. Two public MLS datasets (namely, the Toronto3D and Paris datasets) are used to validate the proposed method. The results show that the proposed method can effectively classify MLS point clouds and obtain mIoU of 83.8% and 68.74%, respectively, which are better than those of other methods.
Jul. 02, 2024Vol. 51 Issue 13 1310004 (2024)
Lili Dong, Jiasen Wu, Xiangyu Xia, Chuanqi Wu, and Junshan Xiu
ObjectiveWith the rapid advancement of research in nanomaterials, many functional oxide nanofilms have been widely used in various fields. CuO films are low-cost, excellent thin film materials. Elemental doping is possible because of the presence of Cu vacancies in the structure. Co-doped CuO films are prepared by doping Co in CuO thin films. Radio frequency (RF) magnetron sputtering, a method for preparing thin-film materials, has been widely used in scientific research and industrial fields because of its stability and high film-forming quality. However, during the preparation of Co-doped CuO film materials, changes in the magnetron sputtering parameters often lead to differences in the composition ratio, resulting in different sample performances. Therefore, it is necessary to analyze the composition ratio of prepared Co-doped CuO films to analyze the performance of the samples and optimize the process parameters for magnetron sputtering. For this purpose, an existing effective analytical method is used to perform a multidimensional analysis of the composition ratio for the prepared Co-doped CuO films by RF magnetron sputtering at different sputtering parameters.MethodsCo-doped CuO films are prepared by magnetron sputtering under different sputtering pressures and powers. The composition ratios of the samples are influenced by sputtering pressure and power, as listed in Table 1. In this study, a multidimensional analysis of Co-doped CuO films is conducted using laser-induced breakdown spectroscopy (LIBS), including quantitative analysis of the element atomic number fraction ratio, two-dimensional mapping of the LIBS intensity ratios of Co/Cu in the films, and optical performance evaluation of the films.Results and DiscussionsThe LIBS experimental setup (Fig. 1) and the corresponding LIBS spectra of the Co-doped CuO films (Fig. 2) are shown. Plotted calibration curves of the Co/Cu content ratios in the films under different sputtering pressures and powers show that the linear fitting coefficient exceeds 0.99. This indicates good consistency between the LIBS intensity ratio and the element atomic number fraction ratios in the films. In addition, a rapid quantitative analysis of the element atomic number fraction ratio in the film is realized (Fig. 3). Based on the two-dimensional mapping of the LIBS intensity ratios of Co/Cu in the films (Fig. 4), the Co/Cu intensity ratio first increases with increasing sputtering pressure, then decreases, and subsequently increases. The intensity ratio decreases with an increase in sputtering power, but the distribution uniformity of Co/Cu in the films worsens. In the transmittance spectral analysis of the films (Fig. 5), the bandgap of the film reaches a high value at a sputtering pressure of 3.0 Pa and a sputtering power of 75 W. In addition, the evolution laws of the optical bandgaps of the films and the LIBS intensity ratios of Co/Cu are consistent with the sputtering parameters (Fig. 6), which provide technical support for the optical performance evaluation of the films.ConclusionsIn this study, LIBS technology is used to analyze the atomic number fraction ratios of Co/Cu in Co-doped CuO films prepared by magnetron sputtering. The calibration curves of Co/Cu in Co-doped CuO films are plotted using the LIBS intensity ratios and their energy dispersive spectrometry (EDS) values; the linear fitting coefficients are as high as 0.99, indicating rapid qualitative and quantitative analysis of doped elements in CuO films. Two-dimensional distribution mapping of the LIBS intensity ratios of Co/Cu in films is valuable for optimizing magnetron sputtering parameters. By analyzing the transmission spectral evolution of Co-doped CuO films with different sputtering parameters and the corresponding optical bandgap evolution of CuO films with different sputtering parameters, the evolution of the LIBS spectral line intensity ratios of Co/Cu is found to be consistent with the evolution of the optical bandgap of the corresponding CuO films. Based on the Co/Cu atomic number fraction ratios in Co-doped CuO films, the optical properties of CuO films using LIBS are evaluated. The results show the potential of LIBS technology for the multidimensional analysis of Co-doped CuO films, laying a foundation for the analysis of other thin films.
Jun. 23, 2024Vol. 51 Issue 13 1311001 (2024)
Yuntao Peng, Zhirong Zhang, Hua Xia, Yongjun Cai, Pengshuai Sun, Qianjin Wang, Xiachun Wang, Tao Pang, Bian Wu, and Xu Liu
ObjectiveWith the rapid expansion of oil and gas pipelines in China and the growing implementation of urban gas pipelines, pipeline leakages have garnered significant attention. These leakages directly affect the safety of human lives and property. Consequently, pipeline leakages have emerged as a prominent research area. Volatile gases released during oil and gas leaks consist not only of methane but also of characteristic gases such as propane and butane. Precisely measuring the volume fractions of these gases can help in addressing the limitations of isolated measurements of methane. This comprehensive approach has significant value in terms of safety and environmental protection.MethodsBecause the stretching vibration of C—H chemical bonds in alkane macromolecules can cause the superposition of absorption spectra in the near-infrared region, it is difficult to achieve accurate measurements of propane and butane using traditional tunable diode laser absorption spectroscopy technique. In this study, a traditional tunable diode laser absorption spectroscopy technique was combined with a stoichiometric algorithm. Direct absorption signals and second harmonic signals within the range of 1685.9?1686.8 nm were recorded using a tunable diode laser absorption spectroscopy technique platform. The quantification of the two gas components was then achieved through the application of a partial least squares regression algorithm, which effectively addresses the challenges posed by overlapping absorption spectra. The study shows that this approach significantly enhances the accuracy and sensitivity of the quantitative analysis model.Results and DiscussionsInitially, a regression relationship between the volume fractions of elementary propane and butane gas and the second-harmonic signal was established using partial least squares analysis. This relationship enabled the prediction of unknown gas volume fractions below 2000×10-6. The experimental results demonstrate that the maximum prediction error for propane is 14×10-6, whereas for butane, it is 41×10-6. The correlation coefficients R2 are 0.9999 and 0.9995 for propane and butane (Fig.6), respectively. These findings serve as preliminary evidence for the partial least squares algorithm and its ability to accurately demodulate wide-spectrum absorption gas lines. Next, based on the mixture of propane and butane, the study observed that the amplitude of the second-harmonic signal demodulated from propane and butane at the same volume fraction differs by two orders of magnitude (Fig.7). This difference does not pose an issue for the inversion of their respective volume fractions in the presence of elementary gases. However, in the case of mixed gas, the butane signal with a smaller amplitude is submerged within significant variations in the propane signal. Consequently, the amplitude of the second-harmonic signal at the absorption center of propane is significantly reduced. Thus, modeling the second harmonic signal alone results in unacceptable errors. To address this challenge, the characteristic absorption information represented by the second harmonic signal was combined with the spectral band absorption information represented by the direct absorption signal. Both signals were collected and used as independent variables to train the regression model for gas mixtures. This approach ensures a more comprehensive and accurate analysis of the volume fractions of mixed gases. The developed model is capable of detecting low volume fraction gas mixtures, including propane and butane at volume fractions of 0.8% and 0.9%, respectively, of the lower explosive limit. The maximum prediction errors in the low volume fraction group, ranging from 100×10-6 to 800×10-6, are found to be propane at 34×10-6 and butane at 51×10-6 (Fig.8). Similarly, the maximum prediction errors in the high volume fraction group, ranging from 2000×10-6 to 10000×10-6, are found to be propane at 64×10-6 and butane at 148×10-6 (Fig.9). Importantly, all the prediction errors remain below 3% of the lower explosion limit, which aligns with the safety requirements of the petroleum industry. This methodology caters to the specific safety requirements of the petroleum industry by enabling the precise and sensitive detection of low volume fraction gas mixtures and ensuring production safety and hazard prevention. To further validate the dynamic reliability of the model during continuous operation, two continuous tests were conducted at low (Fig.10) and high (Fig.11) volume fractions. These tests successfully confirmed the stability and reliability of the partial least squares regression model in predicting the volume fraction of each component in the propane and butane mixtures throughout the dynamic process.ConclusionsThis study relies on a tunable diode laser absorption spectroscopy technique and leverages multiple measurement signals that represent gas absorption within a narrower scanning range. This approach enables the quantitative analysis of the overlapping spectral lines of propane and butane. Consequently, it offers a practical solution for accurately measuring the volume fractions of various volatile oils and gases. This solution is particularly well suited for addressing the specific needs encountered at oil and gas storage sites. The approach exhibits tremendous potential for expanding its applications and will undergo further validation in the field of oil and gas pipeline leakages.
May. 09, 2024Vol. 51 Issue 13 1311002 (2024)
© Copyright 2018-2021 | Chinese Laser Press.
All Rights Reserved 沪ICP备15018463号-20