


Please enter the answer below before you can view the full text.


2024
Volume: 51 Issue 14
31 Article(s)

Qinghua Gao, Xinmeng Li, Baichao Zhang, Dongyuan Yang, Yong Yu, Weiqing Zhang, Zhigang He, Shengrui Yu, Guorong Wu, and Xueming Yang
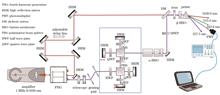
ObjectivePhotoinjector lasers, which stimulate the photocathode surfaces for electron-bunch generation via the photoelectric effect, are crucial components of free-electron laser (FEL) facilities. The Dalian advanced light source (DALS), which is a newly proposed light source operating in the extreme ultraviolet spectrum, is a continuous-wave FEL with a maximum repetition rate of 1 MHz and is designed for chemical physics research. To achieve the optimal brightness of the DALS, one must ensure that the electron bunches exhibit a sufficiently low emittance. An effective method for reducing emittance is by shaping the photoinjector laser three dimensionally, both transversely and longitudinally. This study specifically addresses longitudinal shaping. Current longitudinal shaping techniques include manipulating the light spectrum using devices such as spatial light modulators or acousto-optic modulators, or employing pulse stacking in the time domain. However, the direct adaptation of these techniques to our system poses significant challenges. In this study, based on the fundamental principles of pulse stacking, we utilize a grating pair, two interferometers, and a sequence of birefringent crystals to generate flat-top pulses with durations exceeding 40 ps. Results of electron-beam dynamics simulations show that the generated flat-top pulse significantly improved the emittance of electron beams, thus demonstrating its potential for optimizing the performance of FELs.MethodsWe directed infrared laser pulses generated by a Yb-doped fiber amplifier into a fourth-harmonic generator to generate ultraviolet laser pulses with a repetition rate of 1 MHz, a wavelength of 257.5 nm, and a pulse duration of approximately 200 fs. Subsequently, the ultraviolet light was stretched to 1.5 ps by passing it through a grating pair, which introduced the appropriate second-order dispersion. The stretched single pulse was segmented into four equally spaced sub-pulses using two interferometers. Finally, three birefringent crystals were used to further segregate the light, which resulted in overlapping pulse sequences that formed a pulse with a relatively flat top. The shaping results were measured using optical cross-correlation by mixing the shaped ultraviolet laser pulses with fundamental infrared pulses emitted from the amplifier. The intensity distribution was obtained by varying the temporal delay between two light paths. To evaluate the pulse-shaping performance, electron-beam dynamics simulations were conducted using a DALS injector. The simulations yielded four initial electron-beam distributions: two based on actual laser measurements and two theoretical distributions (ideal flat top and Gaussian), with almost identical pulse base widths. In the simulations, a multi-objective genetic algorithm based on the electromagnetic simulation code ASTRA was used, which optimized for a Pareto front comprising the bunch length and normalized emittance at the injector exit. The results were compared and evaluated.Results and DiscussionsThe temporal distributions of the ultraviolet laser pulses generated by the fourth-harmonic generator after undergoing stretching, interferometer splitting, and birefringent crystal manipulation are presented in Fig. 3. The post-stretching pulse duration is approximately 1.5 ps, which is consistent with the calculated value. After passing through the two interferometers, the interval between the four sub-pulses is approximately 11 ps, with almost equal light intensities. The final flat-top distribution achieves through three α-BBO crystals exhibits rising and falling edges of 2.0 ps and 1.9 ps, respectively, with the middle flat-top region spanning approximately 42 ps. The intensity fluctuation in the flat-top region is 5.7% (Root mean square, RMS). The spectrum remained unchanged after shaping. Because of the aperture limitations of the optical components, the intensity at the edges of the shaped light spot is truncated. However, considering the subsequent transverse shaping through aperture truncation, this does not significantly affect the final results. The overall transmission efficiency of the shaping process is approximately 45%, and the obtained energy satisfies the requirements of an electron gun. The beam-dynamics simulation results show that regardless of whether the laser distributions are measured or ideal, the Pareto front for the flat distribution consistently performs better than that for the Gaussian distribution, with the minimum emittance improved by approximately 20%. For each distribution type (flat or Gaussian), the minimum emittances of the measured and ideal lasers are almost identical, with a variance of less than 5%. These results indicate that lasers with flat temporal distributions, instead of Gaussian distributions, are significantly better for DALS injectors.ConclusionsThis study demonstrates the longitudinal flat-top pulse shaping of the photoinjector laser for the DALS and validates the effect of the longitudinal distribution of the photoinjector laser on electron-beam emittance via electron-beam dynamics simulations. Specifically, we employ the pulse-stacking method, where we initially calculate the parameters and design the layout of the optical components based on the requirements for a flat-top pulse. Subsequently, we conduct shaping experiments. The experimental results show that the appropriate combination of gratings, interferometers, and birefringent crystals can effectively transform femtosecond Gaussian pulses into flat-top pulses with durations exceeding 40 ps. While the incident power is increased gradually, the transmission efficiency of the pulse-shaping optical path remained consistently above 45%, thus exhibiting stable operational performance without significant nonlinear effects such as two-photon absorption. The electron-beam dynamics simulations indicate that, under almost identical base durations, the experimentally obtained flat-top pulses can reduce the emittance by 20% compared with Gaussian pulses, thus significantly improving the beam quality. This provides substantial support for the construction of a DALS injector with improved performance. Additionally, the results suggest that the shaping method employed in this study can be broadly applied to the development and construction of photoinjector-driven laser systems.
Jul. 25, 2024Vol. 51 Issue 14 1405001 (2024)
Kun Li, Mingming Zhang, Weihao Li, Ziwen Zhou, Siqi Yan, and Ming Tang
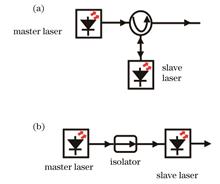
ObjectiveIn the big-data era, owing to the promotion of explosive digital applications such as artificial intelligence (AI), cloud computing, virtual reality/augmented reality (VR/AR), and data centers, network traffic has increased continuously, thus placing higher requirements on optical-fiber communication systems. In this context, because of concerns such as bandwidth and cost, the conventional coherent optical communication technology is no longer advantageous for supporting industrialized short-distance transmission. Additionally, owing to frequency-selective fading caused by low sensitivity and dispersion, the conventional intensity modulation direct detection (IMDD) technology commonly used for short distances cannot continue to cooperate with the further upgrading and evolution of next-generation communication. Simultaneously, the increase in data-center traffic has become the main component of the global Internet Protocol (IP) traffic. For short-distance coherent optical communication, the self-homodyne coherent detection (SHCD) system significantly reduces the system complexity, cost, and power consumption compared with conventional coherent optical communication systems. It is considered the most promising solution in data centers but still presents the issues of power and polarization fading. In this study, we use optical injection locking (OIL) to overcome power fading and introduce active polarization scrambling (APS) prior to OIL, which can avoid the potential occurrence of long-term, low-optical-power injection and thus prevent polarization fading. This approach facilitates OIL and maintains a highly sensitive coherent detection effect in the SHCD system.MethodsFirst, a numerical model was established for theoretical and simulation analyses. During the simulation, we simulated the frequency change of the injected light amplitude prior to OIL to replace the external APS and then analyzed the effect of APS on the OIL. We discuss the locking characteristics under different injected light-amplitude variation frequencies, as well as the effect of APS on the locking/unlocking characteristics (locking range and minimum unlocking threshold power) of OIL. We fitted the relationship between the APS frequency and the minimum unlocking threshold power for OIL. Subsequently, we conducted transmission experiments to verify the high-capacity SHCD system.Results and DiscussionsBy utilizing OIL, we effectively increased the local oscillator (LO) power at the receiving end while maintaining the frequency and phase locking, thereby overcoming the issue of power fading. Introducing APS prior to OIL can avoid potential situations where the injected light power is extremely low for a long time, thus preventing polarization fading. When the frequency of the injected light-amplitude change is relatively low, the OIL system experiences locking loss. However, as the frequency increases gradually, the output phase difference changes irregularly, thus resulting in nonperiodic output-phase-difference oscillations. When the frequency reaches a certain threshold, the output phase difference stops oscillating and remains relatively stable, thus indicating a locking state (Figs. 3 and 4). As the frequency of the APS increases, the locking range increases accordingly (Fig. 6). Additionally, the minimum unlocking threshold power for the OIL differs depending on the APS frequency. When the APS frequency is low, the minimum threshold power for locking loss is minimally affected by the change in the APS frequency. When the APS frequency is high, the minimum threshold power for locking loss decreases significantly as the APS frequency increases (Fig. 8). The APS deteriorates the system performance slightly, and the severity of the deterioration is proportional to the APS frequency. The higher the frequency, the more significant is the performance degradation. However, the phase diagram shows that when the APS frequency is high, the probability of locking loss is reduced significantly (Fig. 11). Therefore, an appropriate APS frequency must be selected for practical use to achieve high-sensitivity SHCD.ConclusionsOIL can provide high gains for LO within a narrow bandwidth, thus significantly improving the signal-to-noise ratio. When the APS frequency is high, the minimum threshold power for locking loss decreases significantly with the increase in the APS frequency, thus indicating that the OIL system with external APS exhibits a more stable locking state and stronger anti-locking-loss ability. By selecting an appropriate APS frequency at the transmitting end and utilizing OIL at the receiving end, the SHCD system can be matched well, thus resulting in a stable and high-sensitivity self-homodyne coherent transmission. This provides a favorable solution for addressing signal fading in optical-fiber transmission and is a promising method for achieving high-performance, low-cost, and simplified high-speed optical digital signal processing (DSP) transmission in short-range scenarios in the big-data era.
Jul. 25, 2024Vol. 51 Issue 14 1406001 (2024)
Yuting Liu, Jianguo Zhang, Qing Bai, Zhixi Yao, Xuan Wang, Yu Wang, and Baoquan Jin
ObjectiveIn long-range Brillouin optical time-domain reflectometer (BOTDR) sensors, owing to the excessive attenuation of optical signals and low signal-to-noise ratio (SNR), the BFS fluctuation range measured at a certain position of the fiber can be significantly larger than that at other positions. Solving this problem by only increasing the average number of traces is challenging. Increasing the average trace time significantly increases the measurement time and degrades the real-time performance of the sensor. Therefore, an effective denoising method must be devised to prevent the BFS fluctuation range from increasing, decrease the trace average time, and improve the measurement accuracy of long-range BOTDRs.MethodsIn this study, an backward Raman amplification scheme was used to improve the energy of a Brillouin backscattered signal, avoid nonlinear effects, and increase the sensing distance. Simultaneously, block matching and 3D filtering algorithm (BM3D) were introduced to solve the problem of expanding BFS fluctuation range in long-range BOTDRs. The search window used to identify similar blocks in the BM3D algorithm was adjusted to a rectangle, which increased the search range in the distance direction and rendered it more adaptive to the BGS-distance matrix.Results and DiscussionsAt a sensing distance of 100 km, with a spatial resolution of 2 m and trace average number of 100, the BFS fluctuation range reduced from ±15.761 to ±2.276 MHz before and after denoising (Fig. 6), and the BFS fluctuation range is consistent throughout the fiber. The BFS fluctuation range is ±6.598 MHz under trace average number of 10000, and it continues to increase at the position featuring the lowest SNR. The maximum RMSE value is reduced from 6.477 to 1.028 MHz before and after denoising, and the maximum root mean square error (RMSE) value is ±3.246 MHz under an average of 10000 trace times (Fig. 8). In addition, the linearity and spatial resolution remains almost unchanged before and after denoising (Figs. 9 and 10). Finally, the performance of the BM3D algorithm is compared with the trace average and wavelet threshold denoising algorithm, and the RSNR En of each method is calculated (Fig. 11, Table 1). The results show that a 6.301-dB SNREn is achieved by the BM3D algorithm and that the BFS fluctuation range processed by the BM3D algorithm is the smallest.ConclusionsIn this study, the measurement accuracy of long-distance BOTDRs is improved and the trace average times required to measure the BFS is reduced. Experimental results show that the RMSE of the system after denoising is 1.028 MHz and that the BFS fluctuation range is ±2.276 MHz under a spatial resolution of 20 m, a 100-km-long sensing fiber, and trace average number of 100. The linearity and spatial resolution are not significantly affected. The proposed system improves the engineering application potential of BOTDRs in the monitoring of large-scale infrastructures, such as long-distance high-voltage transmission cables and submarine fiber-optic communication cables.
Jul. 02, 2024Vol. 51 Issue 14 1406002 (2024)
Huanlin Liu, Wenjie Song, Yong Chen, Tong Zhang, Haonan Chen, Yuxin Xie, and Di Deng
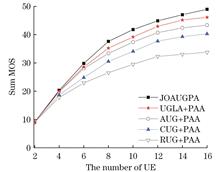
ObjectiveWith the development of 5G applications, the demand for high-quality services has increased rapidly. The mean opinion score (MOS) and user fairness have become important performance indicators for measuring the quality of 5G applications. Orthogonal multiple access-based visible-light communication (VLC-NOMA) can provide high capacity and speed to satisfy the requirements of 5G applications. However, according to Shannon’s formula, whether the user's achievable rate can satisfy its minimum and recommendation rate requirements is an important factor affecting the MOS value in VLC-NOMA. Therefore, developing an effective resource allocation method is an effective way to improve the MOS value and user fairness of indoor VLC-NOMA networks.MethodsA joint optimization method for adaptive user grouping and power allocation (JOAUGPA) is proposed to improve the MOS and user fairness of large-scale equipment access in VLC-NOMA. In JOAUGPA, adaptive user grouping based on hierarchical agglomerative clustering (HAC) is proposed to group users into NOMA groups, which combines NOMAs that satisfy the criteria for hierarchical clustering and NOMA grouping to increase the MOS value of the system. In addition, a power-adaptive adjustment (PAA) method is designed to improve the system MOS value and user fairness while satisfying the minimum rate and MOS requirements of users. The proposed PAA can adaptively allocate the remaining power of the NOMA group to different users based on changes in the MOS value of the NOMA group. Its objective is to maximize the MOS value of the NOMA group.Results and DiscussionsBy simulating a room with 5 m×5 m×3 m with one light emitting diode (LED) on the ceiling as a VLC AP and randomly distributing multiple users at a height of 0.85 m from the ground, the Monte Carlo method is used to verify the performance of proposed sub algorithms HAC and PAA in JOAUGPA algorithm in a given simulation parameter scenario (Table 1 and Table 2). The comparison methods for HAC include adaptive user grouping (AUG), random user grouping (RUG), traditional user grouping (CUG), and user grouping based on linear search (UGLS) algorithms. The PAA comparison methods include fixed power allocation (FPA) and gain ratio power allocation (GRPA) algorithms. The simulation results show that compared with other NOMA grouping methods, the proposed JOAUGPA method can obtain a higher total system MOS value. When M=12, the proposed JOAUGPA achieves a network total MOS increase of 3.25% compared with the UGLS+PAA algorithm, 4.69% compared with the AUG+PAA algorithm, 5.86% compared with CUG+PAA, and 6.88% compared with RUG+PAA (Fig. 1). When the number of users is 10, as the minimum user equipment (UE) demand rate and recommendation rate increase, the proposed JOAUGPA network has the least decrease in total MOS value (Fig. 2). The proposed PAA method obtains larger MOS values and minimizes the MOS value reduction compared with the GRPA and FPA power allocation methods when they adopt the same NOMA grouping (Fig. 3). Compared with other NOMA grouping methods and power allocation methods, the proposed JOAUGPA algorithm has the least decrease in Jain’s fairness index (JFI) as the number of users increases (Figs. 5 and 6).ConclusionsTo improve the MOS value and user fairness of indoor VLC-NOMA downlink transmission systems, a joint optimization method for adaptive user grouping and power allocation is proposed in the paper. Using HAC to form the NOMA group and the PAA method, the MOS value of VLC-NOMA can be maximized, and user fairness can be improved while ensuring the user's MOS threshold and successive interference cancellation (SIC) decoding constraints. With the development of indoor Internet applications, the proposed JOAUGPA can improve the high-speed data transmission of indoor users, increase their quality of experience (QoE), and promote the development of mobile Internet applications.
Jul. 02, 2024Vol. 51 Issue 14 1406003 (2024)
Shaokun Liu, Yingbo Chu, Nengli Dai, and Jinyan Li
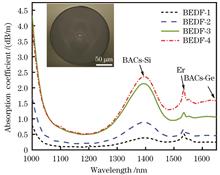
ObjectiveExisting communication systems continue to use traditional erbium (Er)-doped fiber amplifiers, which can amplify only the C or L band, severely limiting further expansion of communication transmission bandwidth. To expand the transmission bandwidth, a common method is to connect fiber amplifiers in different bands in parallel and then couple the amplified signals in different bands into a single fiber for transmission. However, this method also faces problems such as severe gain imbalance, the existence of gain “dead zones,” and complex structures with high equipment costs. Therefore, achieving simultaneous amplification of multiple bands in a single fiber is considered a major solution for expanding gain bandwidth and improving transmission capacities. Due to their ultra-wideband emission characteristics, bismuth (Bi) Er co-doped fibers (BEDFs) are considered the most feasible solution for achieving simultaneous multiband amplification and have attracted widespread attention from academia and industry. With reliance placed on the joint action of Er and germanium-related bismuth active centers (BACs-Ge), ultra-wideband flat amplification can be achieved in the C+L+U band. In 2017, the Fiber Optic Research Center of Russia (FORC) successfully prepared for the first time a BEDF with a gain of over 15 dB at 1515?1775 nm. However, to date, no studies have been reported in China on BEDFs that can simultaneously achieve a positive gain in the C+L+U band.MethodsPreforms with different concentrations of Bi and Er are prepared using a modified chemical vapor deposition (MCVD) method. The GeO2 content in the BEDF core is measured using an electron probe micro analyzer (EPMA), and the Er and Bi contents in the BEDF core are measured using inductively coupled plasma mass spectrometry (ICP-MS). The absorption spectrum of the BEDF is measured using a fiber analyzer based on the truncation method. The amplification testing system is built based on a self-made BEDF using three different pumping schemes, namely, forward, backward, and bidirectional. The input signal is provided by a 32-channel comb light source in the range of 1515?1670 nm with a wavelength interval of 5 nm, and the total power is set to -25 dBm. Laser diodes (LDs) of 1460 nm and 1480 nm are used as pump light sources at powers of 500 mW and 583 mW, respectively.Results and DiscussionsThe gain performance of the BEDFs is tested using a forward pump amplification testing system, and the results are shown in Fig. 3. The ratio of unsaturated loss to absorption coefficient of the BEDFs is tested at a pump wavelength of 1460 nm, as shown in Table 2. Figure 3 shows that the optimal length is shortened from 240 m (BEDF-1) to 45 m (BEDF-4) as the absorption coefficient at 1650 nm increases from 0.24 dB/m (BEDF-1) to 1.6 dB/m (BEDF-4), which are mainly affected by the concentration of BACs-Ge. The gain of BEDF-1 at 1670 nm is significantly lower than those of other BEDFs, mainly because its ratio of unsaturated loss to absorption coefficient (28%) at 1460 nm is significantly higher than those of other BEDFs. The difference in the ratio of unsaturated loss to absorption coefficient also leads to an opposite trend in the gain of BEDF-1 and other BEDFs between 1580 nm and 1670 nm. A higher ratio of unsaturated loss to absorption coefficient leads to greater pump energy loss. Although the absorption coefficients and usage lengths of BEDF-2 and BEDF-3 differ, their maximum gains at 1670 nm are similar. This is mainly due to the similar ratios of unsaturated loss to absorption coefficient of BEDF-2 and BEDF-3 at a pump wavelength of 1460 nm, which significantly affects the maximum gain. The ratio of unsaturated loss to absorption coefficient of BEDF-4 at 1460 nm is 15%, which is lower than those of BEDF-2 and BEDF-3, but its gain at 1670 nm is not significantly different from the latter. This is because the concentration of Er in BEDF-4 is significantly higher than those in BEDF-2 and BEDF-3, and the loss of Er at long wavelengths is greater than the gain, which reduces the luminescence intensity of BACs-Ge at long wavelengths. To observe the effects of pump wavelength changes on the gain spectrum, a 1480-nm pump light is also used. Based on the 1460-nm and 1480-nm LDs, the gain and noise spectra of BEDF-4 are tested using the three schemes of forward, backward, and bidirectional pumping, as shown in Fig. 4. The gain under backward pumping at 1480 nm decreases in the range of 1515?1580 nm as compared with the gain spectrum under forward pumping at 1460 nm, whereas it increases in the range of 1580?1670 nm. This is because the absorption coefficient of BACs-Ge increases, whereas that of Er for the pump light decreases after the pump wavelength shifts from 1460 nm to 1480 nm. This results in more pump light energy being transferred to longer wavelength direction. Compared with that under unidirectional pumping, the gain under bidirectional pumping increases, and the corresponding noise coefficient decreases. A bidirectional pumping scheme is also adopted for BEDF-2, as shown in Fig. 5. The figure shows that the gain is over 11.8 dB in the range of 1530?1670 nm, and the corresponding noise figure is 6.3 dB?9.3 dB.ConclusionsThis study prepares a BEDF with C+L+U-band amplification capabilities based on MCVD combined with liquid-phase doping technology. An ultra-wideband amplification testing platform is built to test and analyze the BEDF. The BEDF-2 achieves a gain of over 11.8 dB in the range of 1530?1670 nm with a noise figure of 6.3 dB?9.3 dB under the conditions of an input signal power of -25 dBm and bidirectional pumping.
Jul. 02, 2024Vol. 51 Issue 14 1406004 (2024)
Laiben Gao, Qiang Liu, Chuanhao Wei, Lingge Gao, and Yiping Wang
ObjectiveOwing to the difference in the response of photodetectors (PDs) and the difference in losses between different optical paths, the conventional three-wavelength demodulation scheme requires relatively complex early calibrations to maintain sensitivity. Additionally, a multi-optical path structure requires multiple PDs for synchronous detection and multichannel data acquisition, which increases the volume and cost of the system. Moreover, this scheme requires an upper computer to achieve sound-signal demodulation, thus significantly restricting on-site sound signal detection. To further optimize the feedback control logic and simplify the demodulation-system structure, this study investigates a three-wavelength adaptive intensity-demodulation technology based on a fast-tunable modulated grating Y-branch (MG-Y) laser. The demodulation system can flexibly adjust the operating-wavelength interval based on the initial cavity length of the sensor to flexibly match fiber-optic acoustic sensors with different initial cavity lengths. The storage, transmission, and feedback logic judgment of the data are implemented using field-programmable gate array (FPGA) modules, which can demodulate complex acoustic signals without requiring complex structures such as upper computers.MethodsThe three-wavelength adaptive intensity-demodulation scheme was classified into parameter-calibration and real-time detection stages. In the parameter-calibration stage, the phase difference caused by the corresponding optical-path difference between the three operating wavelengths in the same Fabry-Perot (F-P) cavity was 2π/3. Three operating wavelengths with a 2π/3 phase difference were determined based on the initial cavity length of the sensor. In the absence of an acoustic signal, the reflected light intensity and direct flow rate of the three operating wavelengths were sequentially detected, and the threshold range of the sensitive area was calculated. In the real-time detection stage, the reflected-light-intensity data obtained in real time were used to determine whether the current operating wavelength was within the sensitive area and capable of wavelength-adaptive adjustment. Suitable wavelengths were output among the three working wavelengths to ensure that the acoustic sensing system maintained a high detection sensitivity. The detection sensitivity of the system remains at 0.866 times (or higher) the highest sensitivity.Results and DiscussionsUsing the MG-Y laser for full-spectrum scanning, we obtained relationship between interference spectrum and interference intensity at different output wavelengths. The free spectral range is 4.92 nm and the initial cavity length of the sensor is 243.23 μm (Fig. 4). Subsequently, the switching of the work points was monitored (Fig. 5). The sound pressure was calibrated using an electrical microphone, the speaker was controlled to emit sound signals ranging from 1 to 20 kHz, and the frequency response of the sensor was tested (Fig. 7). The frequency of the signal emitted by the speaker was controlled to remain constant, the sound pressure was varied, and the demodulated waveforms were compared under different sound pressures. The demodulated waveforms have the same frequency and the amplitude is proportional to the sound pressure. The speaker was controlled to emit a signal with a constant sound pressure. Subsequently, the frequency was changed and the demodulated waveforms under different sound pressures were compared. The demodulated waveform frequency is directly proportional to the sound signal frequency (Fig. 8). The speaker was controlled to play audio. Subsequently, the audio signals received by the electrical microphone and diaphragm sensor were recorded and compared. Based on observation, the demodulation system can demodulate multifrequency mixed sound-pressure signals (Fig. 9). The demodulation of the system was continuously tested for a long time and 70 h of sample detection was recorded. The amplitude of the demodulated signal was recorded as a function of time. Calculations show that the minimum amplitude was approximately 0.868 times the maximum amplitude, whereas the minimum sensitivity was approximately 0.868 times the maximum sensitivity. Thus, the principle was validated (Fig. 10).ConclusionsIn this study, a three-wavelength adaptive intensity demodulation technology and an acoustic sensing system based on a modulated grating Y-branch laser are proposed to solve the complex structure and feedback control logic of conventional fiber optic F-P acoustic sensing systems. The proposed three-wavelength adaptive-intensity demodulation scheme utilizes a single widely tunable MG-Y laser to achieve flexible control of the operating wavelength. Experimental results show that the three-wavelength adaptive strength-demodulation system presents high resistance to environmental interference, favorable demodulation performance, high stability, and the ability to demodulate multifrequency mixed sound-pressure signals. The proposed demodulation scheme can be implemented easily using microcontrollers or FPGAs without requiring a host computer, which is conducive to the development of low-cost, miniaturized systems. It may facilitate the effective detection of sound signals in harsh environments, such as those with high temperature, high pressure, and strong electromagnetic interference.
Jul. 25, 2024Vol. 51 Issue 14 1406005 (2024)
Luwei Shuai, Liuxin Zhang, Lei Ye, Zhaoyong Wang, Kan Gao, and Qing Ye
Specialized calculators and programmable logic devices have proven their advantages for data processing in various fields, and in recent years, GPUs have achieved good results in the fields of artificial intelligence and big data owing to their large number of built-in stream processing units and extremely strong computing power. However, GPUs have high power consumption, high heat generation, a low power-to-energy ratio, and poor external scalability, and they often require synchronous use with computers and acquisition boards. The structure of the FPGA is different from that of the GPU. Although an FPGA does not have a large number of stream processors, its programmability is higher. The FPGA integrates dedicated multipliers or digital signal processing (DSP) units internally, which can provide data processing capabilities while offering strong scalability.In this study, we propose a real-time processing system based on low-error parallel computing acceleration to address the difficulties in OFDR data processing. We optimize the system according to its data characteristics and achieve real-time processing of OFDR data.ObjectiveAs a type of fiber-optic sensing technology, optical frequency domain reflection (OFDR) technology has received increasing attention in the field of temperature and stress measurement owing to its high spatial resolution and sensitivity. Many scholars have focused on improving the spatial resolution and extending the detection distance of OFDR. However, with improvements in the spatial resolution and detection distance, the data volume and processing difficulty of OFDR have also shown explosive growth. In static testing, it is permissible to handle hysteresis. However, it is difficult to adapt to situations that require high levels of dynamism and repeatability. In response to this issue, Sheng et al. adopted a data caching method; however, this method is only suitable for short-term real-time requirements and cannot perform long-term operations. Therefore, it is extremely important to design a system that satisfies the real-time processing requirements of OFDR.MethodsIn this study, we classified the data processing of OFDR and divided it into parts that can be directly processed in real time and parts that are difficult to process in real time. The frequency-sweep nonlinear correction algorithm is the main algorithm that can be processed directly in real time. We propose a frequency-sweep nonlinear correction algorithm using a dual-threshold comparator. A dual-gate limited-latch mechanism was used to reduce the false triggering of false resampling and minimize errors. The parts that are difficult to process in real-time primarily include the spectrum. We used a dual-address loop method in the DDR3 storage chip to achieve FIFO ping pong operation. We designed a kernel based on single-point computing and utilized the parallel scalability of an FPGA to expand multiple computing kernels. Because the DSP48E1 unit in the FPGA can only be used for fixed-point calculations, we analyzed the calculation error and designed a rotation factor with dynamic accuracy that can achieve minimum calculation error while ensuring no overflow in the calculation.Results and DiscussionsTo verify the effectiveness of the algorithm, we built an experimental platform and separately tested the calculation error and time. In the calculation error testing, computers and an FPGA were used to test and analyze the experimental optical path, and all data and local detail data were compared. For comparison, the effective proportion of the input signal is approximately 0.1, the number of calculation points is approximately 110000, and the dynamic bit width of the rotation factor is 23 bit. The maximum calculation error measured is 5.2×10⁻⁸, which is less than 10-7, proving that the FPGA is consistent with the computer calculation results. When using a fixed bit width and retesting the same data, the maximum calculation error measured was 6.4×10⁻⁶. Therefore, under these testing conditions, the proposed dynamic bit width algorithm can reduce the calculation error by approximately 100 times, and the calculation time was measured multiple times at 500 and 3000 points. The operating times of the FPGA and computer were measured using the oscilloscope and software timer methods, respectively. The results indicate that the FPGA can achieve computational acceleration at various effective points. In the case of 500 points, it can provide 11 times processing speed of the compupter. At 3000 points, it can provide 16 times processing speed of the compupter.ConclusionsThrough experimental verification, the proposed system can effectively accelerate the process of OFDR data processing and achieve low error. Compared with traditional fixed accuracy, the proposed system reduces the calculation error by approximately two orders of magnitude. Compared with computer processing, the proposed system can obtain faster speed and achieve real-time processing of 20 frame/s. However, this system has several limitations. Real-time data processing cannot be guaranteed when the number of effective OFDR points increases. However, this problem can be solved by upgrading the FPGA chip and using devices with more resources and higher clock frequencies.
Jul. 25, 2024Vol. 51 Issue 14 1406006 (2024)
Tianyi Lu, Jianhua Chang, Tengfei Dai, Youpeng Su, Zhiyuan Cui, Qian Tu, and Yunhan Zhu
ObjectiveWith the advancements in laser technology, pulse lasers have been widely used in optical fiber communication, medical surgery, power transmission, material processing, and other fields. Pulse lasers can be classified into bright- and dark-pulsed lasers. A bright pulse refers to a significant increase in light intensity under a stable continuous light background, which is highly sensitive to noise and loss generated during the transmission of the optical waveguide and results in its power gradually decreasing during the transmission process. By contrast, a dark pulse exhibits a significant decrease in light intensity against a stable and continuous light background. Compared with bright pulses, dark pulses have unique advantages such as better stability in the presence of noise and reduced loss in optical fibers, and they are less influenced by stimulated Raman scattering within the pulse. These advantages enable dark pulses to have broad prospects in the fields of signal processing and long-distance communication. This study demonstrated that a fiber laser based on a Ti3C2Tx optical device has the advantages of a lower dark-pulsed pumping threshold power and higher opto-optical conversion efficiency. It can realize the switching of bright and dark pulses as well as dark-pulsed pairs, thereby enriching the photon application of Ti3C2Tx in fiber lasers.MethodsThe nonlinear optical device investigated in this study was composed of a quartz substrate, HF-etched single-mode fiber (SMF), and Ti3C2Tx material. Ti3C2Tx powder of 10 mg was dissolved in 10 mL of N-methylpyrrolidone solvent and stirred with a magnetic mixer. Ultrasonicated treatment was then conducted in an ice bath for 120 min. Finally, the supernatant was centrifugated for 30 min at 3500 r/min, and 1 mg/mL of Ti3C2Tx dispersion was obtained. A section of 30 cm standard single-mode fiber SMF (core diameter: 9 μm; cladding diameter: 125 μm) was examined, on which a wire stripper was used to strip the coating layer and regulate the corrosion length to 5 mm. The treated SMF was then fixed on a quartz substrate and placed in a fume hood for corrosion, and a 40% HF solution was added to the corrosion area for 103 min. The diameter of the SMF corrosion area prepared by the HF corrosion method was 15 μm. Finally, Ti3C2Tx was attached to the surface of the etched optical fiber via light deposition, which allowed the evanescent wave to fully interact with Ti3C2Tx. The produced nonlinear optical device was connected to an optical fiber mode-locked laser cavity, and relevant information related to the pulse signal, including the spectrum, pulse repetition rate, pulse width, and output power, was obtained using a power meter, fast photodiode, digital oscilloscope, and optical fiber spectrometer.Results and DiscussionWhen the pump power reaches 18 mW, a continuous wave (CW) output appears in the laser cavity. When the pump power is continuously increased to 65.27 mW, the laser outputs a bright-pulse sequence, where the period is 74 ns, the central wavelength is 1562.75 nm, the spectral bandwidth of 3 dB is 0.56 nm, the repetition frequency is 13.5 MHz, and the radio frequency (RF) signal-to-noise ratio (SNR) output of the bright pulse is approximately 56 dB. These indicate that the laser has good stability. When the pump power is increased to 110.2 mW and the polarization state is changed by carefully adjusting the polarization controller, a dual-wavelength dark-pulsed output is obtained with central wavelengths of 1562.34 and 1563.11 nm. The pulse duration is 3.8 ns, repetition rate is 13.5 MHz, and SNR is 49 dB. The fluctuation amplitude of the pulse train is small, and the operation of the dark pulse is relatively stable. When the pump power is increased to 163.62 mW, a stable pair of dark and bright pulses is generated by adjusting the polarization controller to alter the polarization state. The average output power of the laser increases linearly, and the corresponding light-to-light conversion efficiency is 6.55%.ConclusionsThis study presented a bright- and dark-pulsed switching mode-locked fiber laser based on Ti3C2Tx, which uses HF to etch SMF to generate evanescent waves. Its material properties were analyzed by Raman spectroscopy, and nonlinear absorption was examined using balanced synchronous dual-detector technology and a self-made femtosecond pulse source. When the threshold power and repetition frequency are 110.2 mW and 13.5 MHz, respectively, a dual-wavelength dark pulse output with central wavelengths of 1562.34 and 1563.11 nm, pulse duration of 3.8 ns, and SNR of 49 dB is obtained. When the pump power is changed and the polarization state is adjusted, the light and dark pulses and dark-pulsed pairs can be switched. Experimental results show that Ti3C2Tx has significant application potential in fiber lasers and significantly promotes the development of nonlinear optics.
Jul. 02, 2024Vol. 51 Issue 14 1401002 (2024)
Ziwen Wang, Xuechen Cao, Yanlin Zhang, Donglin Cheng, Pixian Jin, and Huadong Lu
ObjectiveAll-solid-state high-power deep ultraviolet (DUV) 266 nm lasers are widely employed in various fields, including Raman spectroscopy, photo-biological imaging, integrated circuit etching, and precision micromachining, owing to their compact structure, high single-photon energy, and good long-term stability. Thus far, the fourth harmonic generation (FHG) of a 1064 nm laser based on nonlinear crystals, including cesium lithium borate (CLBO) and barium metaborate (BBO), is the most widely adopted method for generating a DUV 266 nm laser. However, its significant nonlinear absorption results in a large temperature gradient inside the crystal, which prevents the complete phase matching of the entire crystal. Consequently, the output power of the DUV 266 nm laser saturates easily in experiments. Although many methods for alleviating nonlinear absorption and eliminating power saturation have been devised, one must comprehensively investigate the thermal characteristics of BBO crystals when they are used to generate high-power DUV 266 nm lasers. Therefore, in this study, the effects of the phase-matching temperature of BBO crystal on heat generation inside the crystal and the output power of a 266 nm laser are first investigated during FHG. Experimental data show that an increase in the phase-matching temperature can effectively alleviate the thermal effect caused by nonlinear absorption inside the crystal, thus improving the output power of the 266 nm laser. In particular, when the phase-matching temperature of the BBO crystal increases from 60 ℃ to 180 ℃, the maximum output power of the 266 nm laser increases from 2.25 W to 2.56 W. Second, a theoretical model of nonlinear absorption is established to explain the experimental results, and the nonlinear absorption coefficient (βNLA) and normalized color center density at different phase-matching temperatures that affect heat generation in the crystal are calculated using the experimental data. This study provides an instructive reference for generating high-power 266 nm DUV lasers.MethodsTo achieve a 266 nm DUV laser, an all-solid-state cavity-dumping Nd∶YVO4 1064 nm laser with an average output power, a repetition rate, and a pulse width of 26 W, 20 kHz, and 5 ns, respectively, was designed and then fabricated. Subsequently, a nonlinear LBO crystal with non-critical phase matching was employed to convert the fundamental-wave 1064 nm laser into a second-harmonic 532 nm laser, which yielded an average power of 16 W. Next, the heat generated inside the crystal during FHG was measured based on the temperature offset ΔT of the crystal heater when the optimal output power of the 266 nm DUV laser was achieved under different input powers of a 532 nm laser. Subsequently, the heat generated inside the crystal and the output power of the 266 nm laser were compared when the phase-matching temperature of the BBO crystal was 60 ℃, 120 ℃, and 180 ℃. Simultaneously, a theoretical model of nonlinear absorption was established by analyzing the mechanism of heat generation inside the crystal during FHG, and a two-dimensional heat-conduction equation was obtained. Finally, based on experimental data, the βNLA and normalized color center density at different phase-matching temperatures, which affected heat generation inside the crystal, were numerically simulated using finite-element analysis software.Results and DiscussionsWhen the phase-matching temperature of the BBO crystal is 60 ℃, as the input power of the 532 nm laser is increased gradually from 0 W to 4, 8, 12, and 16 W to achieve the optimal output power for the 266 nm laser, the temperature of the crystal heater decreases continuously from 60 ℃ to 59 ℃, 53 ℃, 45 ℃, and 36 ℃, respectively [Fig.2(a)]. In particular, when the 532 nm laser with a maximum power of 16 W is injected, the ΔT of the heater is 24 ℃, at which time the maximum output power of the 266 nm laser is 2.25 W. However, when the phase-matching temperature is increased gradually to 120 ℃ and 180 ℃, ΔT decreases gradually from 24 ℃ to 22 ℃ [Fig.2(b)] and then to 20 ℃ [Fig.2(c)], whereas the maximum output power of the 266 nm laser increases from 2.25 W to 2.39 W and 2.56 W. The experimental results show that an increase in the phase-matching temperature of the BBO crystal can effectively alleviate the thermal effect inside the crystal and improve the output power of the 266 nm DUV laser. Using the nonlinear absorption theory model and solving the heat-conduction equation of the BBO crystal, when the phase-matching temperature of the crystal is 60 ℃ and as the power of the 266 nm laser increases gradually from 0.32 W to 1.24, 2.09, and 2.25 W, the fitted βNLA increases from 0 to 0.079, 0.128, and 0.189 cm/GW, respectively. However, it decreases as the phase-matching temperature of the crystal increases. In particular, when the phase-matching temperature is 180 ℃ and the power of the 266 nm laser is 2.25 W, βNLA is only 0.07 cm/GW [Fig.4(a)]. Meanwhile, compared with the case of 60 ℃, the color center density inside the crystal with phase-matching temperatures of 120 ℃ and 180 ℃ decreases by approximately 35% and 57%, respectively [Fig.4(b)].ConclusionsAn experimental setup for the generation of a 266 nm DUV laser based on the FHG of a 1064 nm laser is constructed to investigate the effects of the phase-matching temperature of BBO crystal on heat generation inside the crystal and the output power of a 266 nm laser. Results show a significant amount of heat generated inside the BBO crystal during FHG. However, increasing the phase-matching temperature of the BBO crystal can effectively alleviate the thermal effect of the crystal and improve the output power of the 266 nm DUV laser. Finally, when the phase-matching temperature of the BBO crystal is increased to 180 ℃, a 266 nm DUV pulse laser with a maximum power of 2.56 W, a repetition frequency of 20 kHz, and a pulse width of 4 ns is obtained. Based on a nonlinear absorption theoretical model, the root cause of heat generation inside the crystal during FHG is explained, and the βNLA and normalized color center density at different phase-matching temperatures that affect the heat generation of the crystal are calculated. The results show that when the power of the 266 nm laser is 2.25 W, the βNLA of the crystal with a phase-matching temperature of 180 ℃ is reduced by approximately 63% and the color center density is reduced by 57% compared with the results based on 60 ℃. Increasing the phase-matching temperature of the BBO crystal is shown to reduce the heat generated inside the crystal during FHG via a reduction in the βNLA and color center density of the crystal, thus improving the output power of the 266 nm DUV laser, which supports the experimental results of this study.
Jul. 02, 2024Vol. 51 Issue 14 1401003 (2024)
Wenjie Fan, Zhaohui Li, Yong Liu, Huan Zhang, and Shasha Yin
ObjectiveThe performance of a beam expander, as a key component for improving laser divergence angle in high-energy laser emission systems, directly affects the collimation and beam quality of laser emitted by the system. However, when all-weather operation is required, changes in the ambient temperature affect the wavefront stability of the internal beam expander in high-energy laser emission systems. The conventional design concept of passive thermal compensation is to compensate for the thermal displacement of optical surfaces via the reverse expansion deformation of two different material support structures in a thermal environment. However, the structural form of supporting structures connected by different materials can generate thermal stress in the thermal environment, thus resulting in the uncontrollable deformation of the structure and increasing the design risk of the system. In this study, a new design method for injection thermal compensation is proposed, which compensates for thermal deformation via the flexible force of the silicone-rubber layer. This method offers good thermal compensation and avoids the irregular deformation and stress generation of the support structure during thermal compensation. We hope that our basic research can provide new ideas and data support for the thermal compensation design of coaxial reflective systems.MethodsIn this study, a laser-beam expander was regarded as the research object. First, the effect of temperature change on the wavefront root mean square (RMS) and Zernike fringe coefficients of the beam expander in the temperature range of 0 ℃ to 40 ℃ was investigated via integrated optomechanical analysis. Subsequently, a temperature test platform was established, and the accuracy of the integrated simulation results was discussed using wavefront test data from 0 ℃ to 40 ℃. Next, to accommodate the significant changes in the power of the system during temperature rise and fall, a method for designing the thermal compensation of the injection rubber was proposed. The relationship between the thickness and diameter of the silicone rubber layer and the thermal-compensation effect was investigated via integrated optomechanical analysis, and the suitable thickness of the silicone-rubber layer for the thermal compensation of laser-beam expanders was determined. Finally, experimental testing and simulation analysis were performed, which verified that the laser-beam expander designed with thermal compensation presents favorable thermal-environment adaptability and satisfies the usage requirements.Results and DiscussionsThe simulation analysis results are consistent with the experimental test results (Fig. 11), thus indicating that the first-order astigmatism and coma of the system vary marginally within 0 ℃ to 40 ℃, and that the power change caused by the change in the distance between the primary and secondary mirrors contributes primarily to the wavefront increase of the system (Fig. 7 and Fig. 8). The analysis on the thermal compensation of the beam expander shows that both the thickness and diameter of the rubber layer affect thermal compensation, and that the effect of the rubber-layer thickness on thermal compensation is more significant. The thickness of the silicone-rubber layer ranges from 0.15 mm to 0.25 mm. As the thickness increases, the system wavefront RMS and power decrease. When the thickness of the adhesive layer exceeds 0.25 mm, overcompensation occurs, and the power changes from positive to negative (or from negative to positive), whereas the RMS of the system increases with the rubber-layer thickness (Fig. 12). By considering thermal compensation in the design of the laser-beam expander, the wavefront RMS and beam quality equivalent β factors at 0 ℃, 20 ℃, and 40 ℃ are 0.373λ@633 nm, 0.0319λ@633 nm, 0.397λ@633 nm and 1.385, 1.331, and 1.402, respectively, thus demonstrating the good thermal stability of the beam expander (Fig. 14).ConclusionsIn the present study, the wavefront variation of laser-beam expanders in the temperature range of 0 ℃ to 40 ℃ is revealed. Because the power of beam expanders is sensitive to temperature change, a new passive thermal-compensation design method suitable for coaxial reflective optical systems is proposed. The compensation design involves injecting silicone rubber on the back of optical components to compensate for the change in optical spacing with the expansion or contraction flexible force of the silicone-rubber layer in the thermal environment. It can effectively reduce the occurrence of uncontrollable thermal stress and deformation in the thermal environment caused by the connection of different material support structures in conventional, passive, mechanical, non-thermal designs. After considering thermal compensation, the wavefront variation of the laser-beam expander within the temperature range of 0 ℃ to 40 ℃ remain less than 0.0078λ@633 nm. Additionally, β does not exceed 0.071, which signifies that the usage requirements are satisfied.
Jul. 02, 2024Vol. 51 Issue 14 1401004 (2024)
Jiakun Han, Guotai Li, Shuai Li, Jing Zhao, Zhanda Zhu, Hong Lei, and Qiang Li
ObjectiveHigh-power ultrashort-pulse lasers operating in the picosecond and femtosecond time domains have important applications in strong-field physics, biomedical imaging, optical frequency conversion, and nuclear laser fusion. The direct output of mode-locked lasers has a more promising signal-to-noise ratio, beam quality, and stability than the power amplification method for high-power ultrashort pulse generation. Commonly used mode-locking methods for high-power mode-locked lasers include semiconductor saturable absorber mirror mode-locking (SESAM), Kerr lens mode-locking (KLM), and non-linear mirror mode-locking (NLM). In particular, the NLM mode-locking method, which utilizes a nonlinear crystal and an output coupling mirror, has demonstrated significant potential owing to its high stability, wide range of applicable wavelengths, and large modulation depth. However, achieving saturation in the NLM method requires a high power density, resulting in a peak power density within the cavity that is typically lower than that required for reflectivity saturation. The quality factor (Q) of a cavity in an NLM mode-locked laser increases with the peak power density within the cavity. This phenomenon results in Q-switching instability, making it challenging to attain stable continuous-wave mode-locking (CWML). This challenge can be addressed by introducing an early saturation tendency for the nonlinear reflectivity of NLM devices. This ensures a balance between gain and loss at the saturation point, ultimately achieving stable continuous-wave mode-locked pulses. Hence, the development of a straightforward, stable, and dependable method to achieve early saturation is important for achieving high-power mode-locked outputs.MethodsIn this paper, we present a novel NLM structure involving two crystals that undergo frequency doubling twice. This design introduces loss by incorporating a crystal that doubles the second harmonic, achieving early saturation of reflectivity to effectively suppress Q-switching instability and facilitate CWML. Based on the single-crystal NLM nonlinear reflectance expression, we derive an NLM reflectance expression for the two crystals undergoing frequency doubling twice. The materials and lengths of the two crystals are determined using a reflectance formula combined with their crystal properties. The calculation results show that the addition of a second frequency-doubling crystal introduces a rollover in the nonlinear reflectivity curve, thereby forming a new saturation point. This reduces the saturated peak power density and modulation depth of the NLM, theoretically proving the potential of suppressing Q-switching and mode-locking. The experimental validation involved a cavity comprising a semiconductor laser pump source, a large-core crystal waveguide, a 4f system, a dispersion compensation device, a polarizer, and an NLM device. In this experiment, the first frequency-doubling crystal was deployed and adjusted to the optimal state, which resulted in unstable Q-switched and mode-locked pulses. Subsequently, with the addition of a second frequency-doubling crystal and adjustments under the same conditions, the output signal transitioned from unstable Q-switching and mode-locking to stable CWML. This observation proves the effectiveness of our early saturation method employing a second frequency-doubling crystal to achieve CWML.Results and DiscussionsThe output power of the laser varies with the pump power [Fig. 4(a)], with a maximum value of 26.5 W. In the mode-locking experiment, the laser spectral curve at the maximum output power [Fig. 4(b)] exhibits a center wavelength of 1030.1 nm and a spectral width of 1.3 nm. A signal diagram of the mode-locked pulses detected by the oscilloscope is shown in Fig. 4(c). The radio frequency spectrum, presented in Fig. 4(d), reveals a repetition frequency of 31.2 MHz and a signal-to-noise ratio of 46 dB, demonstrating excellent inter-pulse stability without side peaks. The autocorrelation curve in Fig. 4(e) exhibits a mode-locked width of 0.95 ps. Fig. 4(f) depicts the measurements of the beam radius with a calculated beam quality factor of M2=1.05.ConclusionsIn this paper, we present a novel NLM crystal waveguide laser that effectively suppresses the Q-switching instability. The position of the saturation point can be tuned by adjusting the crystal thickness, thereby achieving a simple, stable, and reliable structure. We derive a nonlinear reflectivity expression and verify that the reflectivity produces a rollover to achieve early saturation. Stable continuous mode-locking can be experimentally obtained to verify the feasibility of this structure. A CWML output with an average power of 26.5 W, a pulse width of 0.95 ps, and a repetition frequency of 32.2 MHz is obtained. Future enhancements, such as utilizing a double-clad crystal waveguide and optimizing the equivalent transmittance, are expected to achieve higher-power CWML pulse outputs. This novel NLM device exhibits significant potential for the development of high-power mode-locked lasers.
Jul. 25, 2024Vol. 51 Issue 14 1401005 (2024)
Zhichao Shao, Lingzhen Yang, Yisong Li, Hanlu Feng, Jia Li, and Juanfen Wang
ObjectiveChaotic lasers have a strong anti-interference ability, wide bandwidth, and good randomness. They are widely used in chaotic secure communication, random number generation, and optical fiber sensing. A fiber laser can generate a chaotic laser by the nonlinear Kerr effect of the fiber. Visible-wavelength chaotic lasers can be used in detecting hemoglobin concentrations, blood flow velocity, and fat foreign bodies, and in underwater ranging and other fields. In this study, a green chaotic laser with a wavelength of 535 nm is developed using a frequency-doubled ytterbium-doped fiber chaotic laser and nonlinear crystal. The output of the green chaotic laser at different powers is achieved by adjusting the pump current. The randomness of the green chaotic laser is analyzed using permutation entropy, skewness, and kurtosis.MethodsFigure 1 shows the experimental setup of the 535 nm green chaotic laser. The setup is composed of an ytterbium-doped fiber chaotic laser, fiber amplifier, and frequency-doubling crystal. The 1070 nm chaotic laser is generated by adjusting the polarization controller (PC) and pump current. The ytterbium-doped fiber chaotic laser is composed of a 980 nm pump source 1 (LD 1), wavelength division multiplexer 1 (WDM 1), ytterbium-doped fiber 1 (YDF 1), single-mode fiber (SMF), polarization-independent isolator 1 (ISO 1), and coupler (OC). The YDF 1 with a length of 4 m is used as the gain medium to produce a chaotic laser with a wavelength of 1070 nm. The SMF with a length of 500 m is used to enhance the nonlinear effect in the cavity. The chaotic fiber amplifier is composed of isolators 2 and 3 (ISO 2 and ISO 3), 980 nm pump sources 2 and 3 (LD 2 and LD 3), wavelength division multiplexers 2 and 3 (WDM 2 and WDM 3), a ytterbium-doped fiber 2 (YDF 2), a double-cladding ytterbium-doped fiber (DCYDF) with a cladding pump absorption of 4.95 dB/m @975 nm, and a cladding power stripper (CPS). The YDF 2 with a length of 4 m is used for pre-amplification. The DCYDF with a length of 5 m is used to amplify the chaotic laser. Frequency doubling of the chaotic laser is realized using a barium metaborate (BBO) crystal, harmonic beam splitter (M), and two focusing lenses (L) with focal lengths of 150 mm.Results and DiscussionsThe output power of the chaotic laser with a wavelength of 1070 nm is analyzed. Results show that the power output of the 1070 nm chaotic laser with pump currents has a good linear relationship. In the amplification process, the 1070 nm chaotic laser exhibits obvious spectral broadening (Fig. 3). The randomness of the 1070 nm chaotic laser is then analyzed. Results show that the permutation entropy is stable at 0.997881 as the pump current changes, indicating that the chaotic laser has good randomness. The randomness of the chaotic laser is improved after amplification (Figs. 2 and 4). The skewness and kurtosis of the 1070 nm chaotic laser fluctuate randomly with changes in the pump current. The output characteristics of the 535 nm chaotic laser are then analyzed. Results show that the power output of the 535 nm chaotic laser with the pump current has a good linear relationship, and the maximum output power is 2.5 mW (Fig. 5). The randomness of the 535 nm chaotic laser is then studied by permutation entropy. When the pump current is 4.00?4.75 A, the permutation entropy is found to be stable at 0.988579. The permutation entropy first decreases and then is stable when the pump current is 5?10 A (Fig. 6). For the 535 nm chaotic laser, the skewness and kurtosis at the pump current of 4–10 A fluctuate with the pump current (Fig. 7).ConclusionsIn this study, a green chaotic laser with a wavelength of 535 nm is realized using a frequency-doubled ytterbium-doped fiber chaotic laser and nonlinear crystal. The randomness of the chaotic laser before and after frequency doubling is analyzed by permutation entropy, skewness, and kurtosis. Fundamental-frequency light with a stable randomness is experimentally obtained. The 535 nm chaotic laser with a permutation entropy of 0.985150 is realized by frequency doubling, and the skewness kurtosis tends to be normally distributed. The 535 nm chaotic laser exhibits good randomness and conforms to a normal distribution. The research results are significant for the study of the randomness of chaotic lasers in the visible wavelength range and can be used for applications in sensing and biomedicine.
Jul. 02, 2024Vol. 51 Issue 14 1401006 (2024)
Jing Wu, Ming Tian, Fei Wang, Chengshuang Zhang, Yanling Bao, Yingbo Ruan, and Zhongmin Su
ObjectiveLaser irradiation is a rapid, efficient, non-contact, and high-precision method that has been widely used in carbon-fiber composite processing. Using laser technology to heat carbon-fiber composites is crucial for improving productivity. To enhance the precision, quality, and industrial applicability of carbon-fiber composite processing while minimizing damage, a laser-processing technology that can achieve larger processing areas and higher processing quality must be developed. Array-laser irradiation technology is an effective approach for curing carbon-fiber composites rapidly and efficiently. The temperature-field uniformity in the irradiation region is an important factor affecting the quality of the components and thus must be analyzed quantitatively. Based on the principle of array-laser irradiation, this study establishes a finite-element temperature-field analysis model for carbon-fiber composites, which is then verified based on experiment. Additionally, the effects of spot spacing, spot size, and laser power on the temperature field of the material are evaluated based on the uniformity index and the maximum temperature difference. These results serve as an important reference for optimizing laser-processing parameters and improving the heating uniformity and efficiency of materials.MethodsThe material used in this study is an orthogonal woven laminate of CF/PPS, which is modeled as a macroscopic equivalent homogenized model to simplify the calculations. The geometrical and thermodynamic properties of the material are modeled using the COMSOL simulation software. A 980 nm continuous semiconductor laser is used to irradiate the material, obtain the overall warming pattern of the material target plate, calculate the overall temperature-rise effect on the material plate after the laser arrives at the target, and calculate the temperature-field distribution on the surface of the laminate when it is irradiated by the laser. An array-laser irradiation control system is constructed to regulate and control the laser power by processing the acquired temperature signal. Infrared thermometers and thermal cameras are used to establish an infrared temperature-measurement system as well as to accurately measure the heating-area temperature. The temperature differences between points in the horizontal direction under different parameter conditions are investigated using the control variable method, whereas the temperature-field distribution is quantitatively analyzed based on the uniformity index and the maximum temperature difference. The experimental results verify the accuracy and reliability of the simulation model.Results and DiscussionsBased on a comparison of simulated and experimental results of temperature-field maps under different conditions, the temperature-field-distribution laws of the array-laser-irradiated carbon-fiber composite laminates are consistent with each other, which verifies the accuracy of the simulation model. Comparing and analyzing the temperature difference between the points in the horizontal direction under different parameter conditions, the experimental results deviate by approximately 10% from the simulation results, which proves that the finite-element model established in this study can accurately characterize the temperature change of the material during irradiation. In this study, the uniformity of the temperature-field distribution is evaluated based on the uniformity index and the maximum temperature difference, and the effects of different parameter conditions on the uniformity of the temperature field are investigated. As the laser-spot center spacing increases from 45 mm to 55 mm with a fixed side length of 50 mm for each laser spot, the heat-affected zone increases gradually, whereas the uniformity index first increases and then decreases. When the laser-spot center spacing and the laser-spot side length are equal, the uniformity index is the highest (i.e., 0.95), whereas the maximum temperature difference is only 23.47 ℃ (Fig. 4). When the laser-spot edge length is increased from 40 mm to 60 mm, the heat-affected zone increases gradually, the uniformity index increases from 0.92 to 0.98, and the maximum temperature difference decreases from 29.89 ℃ to 11.86 ℃ (Fig. 8). When the laser power is increased from 50 W to 250 W, the area of the heat-affected zone remains almost unchanged, the uniformity index decreases from 0.97 to 0.93, and the maximum temperature difference increases from 12.83 ℃ to 37.75 ℃ (Fig. 12).ConclusionsIn this study, the theoretical and experimental results of a material temperature field are calculated and compared, demonstrating a consistency between the two sets of results. The uniformity index and maximum temperature difference are used as evaluation indices to assess the uniformity of the temperature field of an array-laser-irradiated carbon fiber reinforced polymer (CFRP), and the effects of spot center spacing, spot size, and laser power on the temperature-field uniformity are investigated. The results show that when the spot center spacing is equal to the side length of the spot, the uniformity index reaches the maximum value of 0.95, whereas the maximum temperature difference is only 23.47 ℃, which corresponds to the best temperature-field uniformity achieved at this time. As the spot size increases, the uniformity index increases, the maximum temperature difference decreases, and the temperature-field uniformity improves; meanwhile, as the laser power increases, the uniformity index decreases and the maximum temperature difference increases, thus resulting in a gradual decrease in the temperature-field uniformity. In addition, these three influencing factors affect the average heating rate of CFRP, among which laser power exerts the most significant effect. This study provides an important reference for optimizing laser-processing parameters and improving material heating uniformity and efficiency.
Jul. 10, 2024Vol. 51 Issue 14 1401007 (2024)
Lei Huang, Jisi Qiu, Yaodong Qi, Feng Yuan, and Hao Liu
ObjectiveA pulse-train laser refers to a laser that has a “continuous” pulse output over a period of time with multiple sub-pulses included in a pulse envelope. The characteristics of intermittent operation can, to some extent, alleviate the thermal effect of continuous laser output. However, in the development process of pulsed lasers, the background noise between pulses and the gain saturation effect of the amplification stage restrict the further development of pulsed lasers toward high peak power. Currently, pulse trains are mostly generated using electro-optical modulators (EOMs) and free-space acousto-optic modulators (AOMs) to chop the continuous laser output. This out-of-cavity modulation method can directly control the amplitude and interval of sub-pulses in the pulse-train envelope. However, background noise between sub-pulses remains a problem. Simultaneously, the obtained single-pulse energy requires a system gain of 107?109 levels to generate high-energy output at the nanojunction level. Therefore, investigating high extinction ratio pulse-train-laser generation technology with single-pulse energy above the μJ level, along with flexible and adjustable time-domain parameters, is of great significance for the development of pulse-train lasers in terms of high repetition rate and high peak power.MethodsIn this study, a semiconductor optical amplifier (SOA) is used to modulate a 1064-nm continuous laser source outside the cavity to produce a pulse-train laser. We use the SOA as a modulation device to chop 1064-nm continuous light from distributed feedback (DFB) lasers under amplification and absorption with and without trigger signal excitation to generate optical pulses. Through measurements of the output spectrum of the SOA, the signal-to-noise ratio (SNR), extinction ratio, and other SOA performances are analyzed. The repetition frequency, pulse width, and single-pulse energy of the output pulse-train laser are controlled by designing the time-domain parameters of the trigger signal and the power of the input light. By pre-amplifying the seed light through an ytterbium-doped fiber amplifier (YDFA), we can obtain sufficient energy for the nanosecond pulse-train seed laser.Results and DiscussionsResults show that when the input power and center wavelength are 10.8 mW and 1064.15 nm, respectively, the SNR of the SOA output is 13.02 dB. Approximately 95.25% of the SOA output power derives from signal light amplification power, and the extinction ratio is 41.29 dB (Fig. 4). The pulse-train laser beam generated through SOA modulation has good quality, with beam quality factor in horizontal direction (Mx2) of 1.11 and beam quality factor in vertical direction (My2) of 1.15, and no significant spectral broadening is observed (Fig. 7). When the triggering signal is adjusted, a high-beam-quality 1064-nm pulse-train laser output is achieved with a sub-pulse repetition frequency of 10?100 kHz (Fig. 6), sub-pulse width of 8.6?88.2 ns, and single-pulse energy of 0.892?6.124 μJ (Fig. 9). The maximum average power is 86.4 mW, and the output instability is 1.66% (Figs. 10 and 11). The Mx2 and My2 are 1.12 and 1.16, respectively (Fig. 13). These results show that this study achieves a nanosecond pulse-train laser using an SOA with high beam quality, extinction ratio above 40 dB, and high power.ConclusionsUsing an SOA with a high extinction ratio to modulate a continuous laser source outside the cavity and generate a pulse-train laser, this study realizes a 1064-nm pulse-train seed laser with an extinction ratio of over 40 dB. Flexible adjustable time-domain parameters are obtained by adjusting the trigger signal amplitude and time-domain parameters of the SOA. The pulse-train sub-pulse width is 8.6?88.2 ns, and the single-pulse energy is 0.892?6.124 μJ. The repetition frequency is 10?100 kHz, and the duration of the pulse train reaches the millisecond level. These results verify the effectiveness of using an SOA as a modulator to modulate the continuous laser source outside the cavity and in turn produce a pulse-train laser. When the trigger signal has a pulse width of 100 ns, repetition frequency of 100 kHz, and amplitude of 1.8 V, the average output power of the pulse-train laser reaches 86.4 mW with an energy instability of 1.66%. Research has shown that pulse-train lasers using an SOA as a modulation device can achieve higher single-pulse energy, stable output, and flexible and tunable time-domain parameters. This method of generating pulse-train lasers using modulation devices with a high extinction ratio provides a new research approach for the design of high average power, adjustable time-domain parameters, and high SNR pulse-train lasers.
Jul. 02, 2024Vol. 51 Issue 14 1401008 (2024)
Pengye Song, Jianing Tao, Pengrun Ying, Haoshu Jin, Haiyang Xie, Lei Hou, Siyuan Xu, and Hui Liu
ObjectiveDual-comb mode-locked lasers are emerging laser sources that have attracted significant attention in the fields of dual-comb spectroscopy, optical sensing, and absolute-distance measurements. In recent years, the use of dual-comb spectroscopy to detect fast dynamic processes has become a new development trend but has also presented corresponding technical challenges. The detection of fast processes requires the shortest possible detection time and high update speed while maintaining a certain spectral bandwidth, signal-to-noise ratio, and accuracy. A high repetition rate and large repetition rate difference are essential for improving the detection speed of dual-comb spectroscopy, which can reach a time resolution on the order of nanoseconds. However, this may reduce the spectral bandwidth. Another approach is to use a tunable wavelength in a dual-comb light source. In this study, we present a dual-comb laser with tunable wavelength and flat-topped spectrum generated from an all-normal dispersion linear-cavity fiber laser. This novel dual-comb light source with flat-top spectral characteristics and tunable wavelength provides a scheme for fast segmented scanning dual-comb spectroscopy that has good reference value for rapid dual-comb spectroscopic applications.MethodsThe hybrid cavity investigated in our study is linear and consists of a fiber and free space, as shown in Fig. 1. The cavity is 3.97 m in length. In the fibered section, a single-mode ytterbium-doped fiber (YDF) with a length of 0.4 m is pumped by a 976-nm diode through a single-mode fiber wavelength division multiplexer. The group velocity dispersion introduced by the YDF is 23 ps2/km. The output of the fiber output coupler is 40% of the intra-cavity power. At one end of the cavity, a semiconductor saturable absorber mirror (SESAM) is attached to the fiber jumper, which has a polarization-maintaining fiber (PMF) tail of 0.75 m in length. The SESAM, which has a modulation depth of 30% and relaxation time of 500 fs, is used to achieve self-started mode locking. The PMF provides a certain amount of birefringence to the cavity, producing two pulsed lasers with different repetition rates. The light is coupled from the fiber to free space by a collimator. In the free space, a quarter-wave plate (QWP), half-wave plate (HWP), and blazed grating are used. The blazed grating has the engraved line density of 600 line/mm and is arranged in a Littrow configuration, which enables first-order diffraction light to be reflected into the cavity to form a filtering mirror. The filtering bandwidth can be controlled by adjusting the distance between the grating and fiber collimator. The polarization states of the intra-cavity light are adjusted using the HWP, QWP, and polarization controller 1. Polarization controller 2 and a fiber polarization beam splitter are used to isolate the two pulse trains that are orthogonally polarized.Results and DiscussionsIn the experiments, when one pulse train is triggered, the other pulse train moves periodically due to the different repetition rates. Figure 2(d) shows the spectrum when the two pulse trains are not isolated. The central wavelength is 1037.5 nm and the 3 dB bandwidth is 4.05 nm. The flat-top shape of the spectrum indicates that the pulses are dissipative solitons derived from the all-normal dispersion. Notably, the use of dissipative soliton mode-locking under all-normal dispersion not only prevents the problem of intra-cavity dispersion compensation and simplifies the laser structure, it also allows for higher single-pulse energy without pulse splitting and produces a flat-top shape spectrum, which are attractive features for dual-comb light sources. To verify whether common-mode noise can be effectively eliminated, we simultaneously measure the change in the repetition rate of each comb and derive the repetition rate difference (RRD), as shown in Fig. 4. This measurement lasts 35 min and no shield is used to protect the laser from environmental disturbances. Results show that due to the common noise cancelation in the shared cavity, the peak-to-peak value and standard deviation of RRD fluctuation is suppressed to 7.1 Hz and 2.5 Hz, respectively. An interferogram is observed, as shown in Fig. 5, which benefits from the excellent mutual coherence. When the grating is rotated, the center wavelength of the spectrum is tuned from 1028.3 nm to 1041.1 nm, representing a tuning range of 12.8 nm, as shown in Fig. 6(b). During wavelength tuning, the spectral bandwidth and RRD of the dual-comb laser remain stable. A larger wavelength tuning range is possible, but the pump power and optical polarization state must be readjusted to reconstruct the dual-comb mode-locking state.ConclusionsWe present a dual-comb laser with tunable wavelength and flat-topped spectrum generated from an all-normal dispersion linear-cavity fiber laser. Results show that the central wavelength is tunable to a range larger than 10 nm, and the spectra are flat-topped with a bandwidth of approximately 4 nm. The fluctuation in the repetition rate is cancelled out by 80%, and the amount of drift in the repetition rate difference in the long-term drift is compressed to the Hz-order. In the experiment, the entire device is not encapsulated and therefore the coherence of the dual-comb laser can be further improved by isolating the device from the external environment. We believe that with appropriate optimization, this innovative dual-comb light source featuring flat-top spectral characteristics and an adjustable wavelength offers a promising approach for rapid segmented scanning dual-comb spectroscopy and thus has significant reference value for applications in the field of dual-comb spectroscopy.
Jul. 02, 2024Vol. 51 Issue 14 1401009 (2024)
Wei Chen, Wei Fan, and Lin Yang
ObjectiveAn inertial confinement fusion (ICF) high-power laser driver with a high-quality near-field distribution is key to enhancing the output performance of a facility. Meanwhile, a high-quality beam with a uniform intensity distribution is beneficial for the protection of the subsequent optics and reduces the operating costs of the facility. Furthermore, it can satisfy the long-term high-fluence operation requirements of a system and improve the frequency-conversion efficiency and beam focus. Therefore, assessment methods should be used to evaluate the quality of near-field beams to provide early warning to operators. However, the current methods for evaluating near-field beam quality are incomplete and cannot analyze status changes and the details of near-field beam quality under the normal operating conditions of a facility. Additionally, the multiple outputs of high-power laser facilities place stringent requirements on real-time analysis; therefore, a multidirectional assessment of the facility operating status must be provided to the operators. This study may provide a theoretical basis and experimental support for the safe operation of the SG-II UP grade facility under high-load irradiation, thus facilitating timely maintenance and adjustments to the operating strategy.MethodsDomain evaluation and distribution statistics were proposed to analyze the fundamental frequency near-field status of the SG-Ⅱ upgrade laser facility in our study. First, the probability density function of the near-field fluence distribution (Rician distribution) and its approximate expression (Gaussian distribution) were obtained using statistical optics theory, which was used to analyze the effects of high and low fluences in the near-field distribution on beam quality. We solved for the noise fluence, signal fluence, and near-field distribution signal to noise ratio, which were used to reflect the magnitude of and variation in random perturbations in the near-field distribution. Subsequently, local contrast and local modulation were proposed to further analyze the local features and variations in the near-field distribution using image-segmentation processing algorithms. Next, statistical methods and threshold labelling were used to analyze the accumulation and evolution of high-fluence points in the local regions. Finally, an exponential model was used to describe the statistical relationship between the high-fluence points and the contrast of the near-field beam. Additionally, we discussed the possible reasons for the anomalous near-field distribution and provided recommendations for the operation and maintenance of the facility.Results and DiscussionsSignal and noise fluences can be used to describe the ideal beam distribution and perturbation [Figs. 4(a) and 4(b)]. The signal to noise ratio (SNR) of the near-field distribution reflects the degree to which the beam is affected by perturbations [Fig. 4(c)]. The tail dragging and bias of the probability density function of the near-field fluence distribution reflects its overall distribution characteristics and the reasons for the changes observed (Fig. 6). It provides early warning to the operator such that the operator would verify the effectiveness of gain-inhomogeneity compensation in the pre-amplifier and main-amplifier system, the pointing stability of the pre-amplifier system, and the optics damage. When the local areas of the near-field beam are abnormal, the local contrast and local modulation are significantly higher than those in other cases, thus enabling the identification of anomalous regions (Figs. 8 and 9). However, the status evolution of the near-field can be analyzed during the operation of the facility and operators can perform the necessary pre-shielding measures in a timely manner (Fig. 13). Additionally, we investigate the evolution of high-fluence points using fluence statistics from the near-field beam to identify regions where damage is suspected to occur (Fig. 14). An exponential model between the high-fluence points and SNR suggests a control requirement for contrast; when the number of high-fluence pixel points increases as the SNR decreases, the contrast C is approximately 0.16 (Fig. 16). Using the historical near-field data of the SG-II UP grade facility, this study provides a theoretical basis and experimental support for the safe operation of high-power laser drivers under high-load irradiation, expands the dimensions of near-field status evaluation, and provides guidance for laser-facility maintenance.ConclusionIn the present study, based on the existing near-field beam-quality analysis methods, domain evaluation, and distribution statistics, we evaluated the near-field beam quality of each shot in terms of multiple aspects during the operation of a high-power laser facility to understand the possible issues of a facility and provide the corresponding maintenance suggestions. Contrast and modulation can be used to evaluate the safety of facility operations at a global level. Based on an image-segmentation processing algorithm, we used the local contrast for near-field beam uniformity analysis, whereas local modulation was used for emphasis and optics damage analysis, which revealed the occurrence of abnormalities and areas in the operation, thus facilitating the timely implementation of maintenance measures. Meanwhile, the fluence-point statistics was used to comprehensively monitor the accumulation of abnormal regions in the near-field beam and any changes. For the design and operation of a facility, high-order contrast and near-field intensity entropy can be used to define the emergence of small-scale self-focusing and provide the B-integral criteria. The PSD curve was used to analyze the development of near-field modulation, optics damage, and small-scale self-focusing in the frequency domain. Based on the theory of statistical optics, the signal fluence, noise fluence, and signal to noise ratio were used to present the deterioration of the near-field distribution more intuitively. The probability-distribution-function model was used to analyze the ratio of high and low fluences in the near field to provide maximum support for usable data. Our study show that these methods can provide a theoretical basis and experimental support for the safe operation of the SG-II UP grade facility under high-load irradiation, expand the dimensions of near-field status evaluation, and guide facility maintenance and operation strategy adjustments.
Jul. 25, 2024Vol. 51 Issue 14 1401010 (2024)
Ziao Gong, Shunchao Yu, Yonggang Zou, Yingtian Xu, and Jie Fan
ObjectiveAn active multimode interference (MMI) semiconductor laser (DTM-LD) with a double-trapezoidal multimode interference (DT-MMI) coupler structure is designed and fabricated. Based on the self-mapping distribution reconstruction effect of a double-trapezoidal MMI multimode waveguide, the laser has a shorter device cavity length while maintaining the same active area as the traditional rectangular active MMI laser (MMI-LD), which is beneficial for improving the electro-optical conversion efficiency of the device. A DTM-LD device with a double trapezoidal base width of 15 µm and a waist width of 30 µm is fabricated experimentally. When the active area is approximately 3.33×104 µm2, the cavity length of the laser device decreases by 4.2% compared to that of the MMI-LD. When the injection current is 1 A, the electro-optic conversion efficiency of DTM-LD increases from 14.5% to 16.3%, a relative increase of 12.4%, and its maximum output power slightly increases from 355 to 360 mW. When the width of the MMI multimode waveguide is reduced by 0.5 µm, the output power loss of DTM-LD reduces by 21.6% from 51 to 40 mW compared with that of the MMI-LD device, indicating that DTM-LD has lower sensitivity to manufacturing error.MethodsA double-trapezoidal multimode interference coupler structure was developed , and it was found that the length difference between the rectangular MMI and DT-MMI could be increased by increasing the difference between Wbot and Wmid while maintaining the area of the multimode waveguide unchanged, as shown in Fig. 3(a). However, the insertion loss of the device also increased significantly when the maximum light intensity was the output, as shown in Fig. 3(b). The sensitivity of the output light intensity of the DT-MMI structure to manufacturing errors was less than that of the rectangular MMI structure when parameters Wbot and Wmid were changed owing to process errors. This provided a basis for parameter selection of the device. Therefore, the DT-MMI region was designed with a base width Wbot of 15 µm, waist width Wmid of 30 µm, length L of 1436 µm, single-mode waveguide width of 5 µm, and length of 100 µm; the active area of the device was approximately 3.33×104 µm2. Semiconductor laser devices (DTM-LDs) had a waveguide structure etching depth of 1.4 µm. For comparative analysis, an MMI-LD device with a width of 21.7 µm and a length of 1508 µm with the same active area was fabricated for subsequent testing.Results and DiscussionThe DTM-LD and MMI-LD are tested and analyzed at a room temperature of 20 ℃. Fig. 5 shows the power-current-voltage (P-I-V) characteristic curves of the DTM-LD and MMI-LD. It can be seen that the electro-optic conversion efficiency of DTM-LD slightly increases to 16.3%, which is 12.4% higher than that of the MMI-LD, indicating that reducing the cavity length of the active MMI semiconductor laser can improve the electro-optic conversion efficiency. Fig. 6 shows the spot distributions of the MMI-LD and DTM-LD devices at 0.06, 0.5, and 1 A. When the injection current increases from 0.06 to 0.5 A, both the MMI-LD and DTM-LD can maintain near-single-lobe output, as shown in Figs. 6(a),(b),(d), and (e). However, there is a small sidelobe distribution on both sides of the main lobe of the far-field spot of the two laser devices because some photons from the input end directly reach the output end without interference gain from too many mode interference couplers, forming a Fabry Perot gain. With an increase in the injection current, the light spot exhibits an apparent segmentation phenomenon, as shown in Figs. 6(c) and (f). Fig. 7 shows the drift characteristic curve of the peak wavelength of the device at different operating temperatures. The wavelength temperature drift coefficient of the MMI-LD is 0.24 nm/℃, and the wavelength temperature drift coefficient of the DTM-LD is 0.23 nm/℃, indicating that the DTM-LD can maintain the same temperature drift performance as the MMI-LD. However, during the rise of 17℃ to 19℃, the refractive index of the MMI material changes, resulting in a significant increase in the central wavelength of the laser, which increases the temperature drift coefficient of the device. Fig. 8 shows the relationship between the device output power and the variation in the multimode waveguide structural parameters in the presence of process errors. The figure shows that when the parameter changes by 0.5 µm, the maximum output power of the MMI-LD device decreases by 14.4% from 355 to 304 mW. The output power of the DTM-LD device decreases from 360 to 320 mW, a decrease of 11.2%. Compared with the MMI-LD, the output power of the DTM-LD decreases from 51 mW to 40 mW, a reduction of 21.6%. Therefore, the output power of the DTM-LD is less sensitive to manufacturing errors than that of the MMI-LD.ConclusionsThe mechanism of the double-trapezoidal MMI is analyzed theoretically to reduce the length and sensitivity to manufacturing errors, and a new type of active MMI semiconductor laser with a double-trapezoidal MMI structure is designed and fabricated. The test results show that the cavity length of the laser device decreases by 4.2% compared to that of the MMI-LD while maintaining an active area of about 3.33×104 µm2. When the injection current is 1 A, compared with MMI-LD, the electro-optic conversion efficiency of DTM-LD is increased from 14.5% to 16.3%, a relative increase of 12.4%, higher than that of the MMI-LD devices, and its maximum output power slightly increases from 355 mW to 360 mW. When the overall width changes by 0.5 µm, the output power loss of the DTM-LD decreases from 51 mW to 40 mW, which is 21.6% lower than that of the MMI-LD device, indicating that the DTM-LD has lower sensitivity to manufacturing error and lower process difficulty and preparation cost.
Jul. 25, 2024Vol. 51 Issue 14 1401011 (2024)
Wenxuan Wang, an Lian, Lianyan Li, Yunshan Zhang, Yaxi Yan, Changyuan Yu, and Xiangfei Chen
ObjectiveBroadband, narrow-linewidth, and ultralinearly swept optical sources are critical in several applications, including fiber network diagnostics, environmental monitoring, laser radar imaging, and phase-coherent optical communication. Current methods for optical frequency sweeping include the inner-cavity tuning of a tunable laser and the external modulation of a continuous-wave (CW) light wave. One of the most recent solutions involves employing a wavelength-tunable laser array to achieve a wide sweep range. However, the complex internal-cavity tuning control results in sweeping linearly differences and broad linewidths. By contrast, external high-order modulation uses a swept radio frequency (RF) signal combined with a four-wave mixing (FWM) process to achieve ultralinearly frequency sweeps and millimeter resolutions. Nevertheless, phase noise increases in FWM, thus complicating the structure for implementing a multichannel swept source. Herein, we report the development of a multichannel ultralinearly swept optical source (SOS) with broadbands and narrow linewidths based on high-order sideband modulation and an optical injection-locked Fabry-Perot (F-P) laser. This approach enables wide sweep ranges, high resolutions, and multiple channels to be obtained. We hypothesize that the injection-locked F-P laser can provide multichannel frequency sweeps as well as serve as an optical filter and amplifier. The SOS is particularly suitable for precision LiDAR and remote, optical frequency-domain reflectometry (OFDR) systems.MethodsA tunable laser array comprising multiple narrow-linewidth tunable lasers converted a frequency-swept RF signal into the optical domain. To expand the optical sweeping range, high-order sidebands were generated by increasing the injected RF power and using low-Vπ intensity modulators (IM). According to high-order modulation theory, the frequency shift Δω of the RF-driven signal corresponded to the frequency shift nΔω of the nth sideband. The injection-locking setup was utilized as an optical filter to prevent two neighboring sidebands from overlapping and to isolate the desired sideband. Furthermore, to generate multiple frequency-swept signals simultaneously, an F-P laser with different modes was used to replace the distributed feedback laser (DFB) laser as a slave laser (SL). Additionally, by controlling the F-P laser drive current with synchronized current compensation, the injection-locking range was increased, thus resulting in a wider frequency sweep. In other words, multiple optical waves from a narrow-linewidth laser array were processed with a chirped RF signal to generate multichannel high-order sideband signals, which can subsequently be enlarged using multiple injection-locking F-P modes. We experimentally generated a four-channel linearly sweeping laser source using a four-channel narrow-linewidth laser source with injection-locking third-order modulation sidebands. The frequency-sweeping range of this scheme can be derived from a fiber asymmetric Mach-Zehnder interferometer.Results and DiscussionsThe triangular sawtooth wave of the pre-compensated signal has the same shape as the arbitrary waveform generator (AWG) output signal, with a period of 5.5 ms and a peak-to-peak value of 120 mV [Fig. 4(a)]. Based on measurements, the current applied to the SL can achieve continuous injection locking with a circuit tuning range of 50‒70 mA, a frequency increment of approximately 1 GHz requiring a 1 mA current increment, and a tuning linearity of 0.9998 [Fig. 4(b)]. An example of the four third-order sideband signal injection-locking four longitudinal modes of the custom-developed F-P laser is presented in Fig. 5(d). Considering a center wavelength of 1550 nm as an example, the output power is 6 dBm, and the power ratio between the injection-locked sideband and the neighboring sideband is 30.8 dB, which is more than 18 dB higher than that without injection locking. Within the current adjustment range of 50 mA to 75 mA, a locking range from 0.34 to 0.39 nm for four injection-locked sidebands is observed (Fig. 6). Based on calculations, the frequency sweep range is 39.8‒44.2 GHz, which is approximately thrice that of the RF variation. After filtering, we extract each individually swept signal with a side-mode suppression ratio (SMSR) and a swept-frequency linearity exceeding 32 dB (Fig. 7) and 99.9992% (Fig. 8), respectively.ConclusionsUsing an optical injection-locked F-Perot laser and external high-order modulation, we designed a novel frequency-swept optical source to be used in multichannel, long-range, and high-resolution measurement systems. The source offers several advantages: 1) the F-P laser features multiple longitudinal modes and uses a synchronous compensation current to maintain stable optical injection locking, which extends the sweep range; 2) the nth sideband-modulation technique preserves the linearity of the swept frequency and the stability of the RF signal while increasing the frequency sweep range and speed by a factor of n; 3) this scheme provides a simple and effective method without requiring phase-noise compensation or optimization technology; 4) the injection-locked SL provides a narrow linewidth that is approximately equal to that of the master laser, which implies a large measurement range. In the future, we plan to develop a modulator with a lower Vπ to minimize the comparatively high injected power of the carrier and first-order sideband to obtain sidebands exceeding the fifth order. The proposed structure is suitable for frequency-modulated continuous-wave (FMCW) laser radars and OFDR-distributed optical fiber sensing.
Jul. 25, 2024Vol. 51 Issue 14 1401012 (2024)
Actively‐Passively Doubly‐Q‐Switched MgO∶ PPLN Intracavity Mid‐Infrared Optical Parametric Oscillator
Miaoxin Wu, Xiaoping Jin, Xiaodai Yao, Hang Liu, Yongji Yu, Zhongyu Liu, and Guangyong Jin
ObjectiveMid-infrared lasers with a narrow pulse and high peak power in 3‒5 μm band have important research value in practical applications in laser communication, lidar, and atmospheric environment detection. Optical parametric oscillators (OPOs) are attracting increasing attention as a common method for fabricating lasers in this band. Currently, the OPO nonlinear crystals used to generate mid-infrared lasers mainly include ZnGeP2 (ZGP), AgGaSe2 (AGS), and period-polarized LiNbO3 (PPLN). Among these, ZGP and AGS crystals have high growth costs and strong absorption of lasers less than 2 μm, which is not suitable for pumping with a 1 μm laser, and PPLN crystals are prone to photorefractive damage at room temperature. Period-polarized LiNbO3 doped with MgO (MgO∶PPLN) is the preferred nonlinear crystal for quasi-phase matching, owing to its large nonlinear coefficient, high damage threshold, and wide light transmission range. However, owing to the inherent properties of MgO∶PPLN crystals, the mid-infrared laser obtained using an acousto-optic Q-switched MgO∶PPLN intracavity optical parametric oscillator has a wide pulse width and low peak power, which makes it difficult to meet market demands. To solve these problems, a 3.8 μm intracavity optical parametric oscillator (IOPO) with an MgO∶PPLN crystal based on a double Q switching of an acousto-optic modulator and a Cr4+∶YAG saturable absorber is reported in this study.MethodsIn this study, the pulse width of the mid-infrared laser is significantly compressed, and the peak power and beam quality of the mid-infrared laser are improved. First, based on OPO theory, the polarization period and temperature of the crystal required for the output of the 3.8 μm mid-infrared laser by the MgO∶PPLN intracavity optical parametric oscillator are determined. Second, an experiment using an acousto-optic Q-switched MgO∶PPLN intracavity optical parametric oscillator is performed, and the output characteristics of the idler light are measured. Then, we analyze the influence of different small-signal transmissions on the output characteristics of a double Q-switched MgO∶PPLN intracavity optical parametric oscillator to find the best small-signal transmittance of Cr4+∶YAG passive Q crystals. Next, we perform an experiment using a double Q-switched MgO∶PPLN intracavity optical parametric oscillator and measure its idler light output characteristics, including the output power, pulse width, single pulse energy, peak power, beam quality, and spectral wavelength. Finally, the experimental results of two types of intracavity optical parametric oscillators pumped by an acousto-optic Q-switched laser and a double Q-switched laser are compared.Results and DiscussionsIn this study, experiments on two types of intracavity optical parametric oscillators pumped by an acousto-optic Q-switched laser and a double Q-switched laser are carried out. When the pump power is 18.41 W and the repetition frequency is 40 kHz, the 3.8 μm idler light with a pulse width of 9.50 ns and peak power of 1.29 kW is obtained for acousto-optic Q-switching (Fig. 3). Meanwhile, the beam quality factor (Mx2) of the idler light in horizontal direction and beam quality factor (My2) of the idler light in vertical direction in acousto-optic Q-switching is 3.11 and 3.44, respectively (Fig. 4). When the pump power is 18.41 W, repetition frequency is 40 kHz, and small-signal transmittance of the inserted Cr4+∶YAG passive Q crystal is 92.67%, the 3.8 μm idler light with a pulse width of 6.43 ns and peak power of 1.48 kW is obtained for double Q-switching (Fig. 6). The experimental results show that, compared with an acousto-optic Q-switched OPO, the 3.8 μm idler light pulse width of a double Q-switched IOPO is compressed by 32.3%, and the peak power is increased by 14.7% (Fig. 9). Simultaneously, the beam quality of the idler light in double Q-switching is improved, and the Mx2 and My2 is 1.98 and 2.05, respectively (Fig. 8).ConclusionsIn this study, a mid-infrared intracavity optical parametric oscillator with a MgO∶PPLN crystal based on a double Q-switched pumping is reported. The experimental results show that when using an acousto-optic Q-switching and a Cr4+∶YAG passive Q crystal with a small-signal transmittance of 92.67%, the pulse width of 3.8 μm idler light can be effectively compressed, and the peak power can be increased in the single resonant intracavity optical parametric oscillator. Compared with an acousto-optic Q-switched IOPO, the 3.8 μm idler light pulse width of a double Q-switched IOPO is compressed by 32.3%, and the peak power is increased by 14.7%. When the pump power is 18.41 W, repetition frequency is 40 kHz, and small-signal transmittance of the inserted Cr4+∶YAG passive Q crystal is 92.67%, the 3.8 μm idler light with a pulse width of 6.43 ns and peak power of 1.48 kW is obtained for double Q-switching. Simultaneously, the beam quality of the idler light is improved, and the Mx2 and My2 is 1.98 and 2.05, respectively. The results of this study provide new technical support for the development of high-quality mid-infrared light sources with narrow pulse widths and peak powers.
Jul. 25, 2024Vol. 51 Issue 14 1401013 (2024)
Yan He, Yi Man, Xiaowu Shi, Qingyong He, Hui Xu, and Dan Zhang
ObjectiveErbium-doped waveguide amplifiers (EDWAs) applied in on-chip photon integration fields have been widely studied over the past two decades owing to their low cost, compensation for optical loss, and potential applications in integrated optical systems. Due to the limitations of traditional inorganic EDWA research methods, 976 nm or 1480 nm lasers are usually chosen as pump sources to pump polymer EDWAs, which achieves a radiative transition (4I13/2→4I15/2) through the intrinsic absorption (4I15/2→4I11/2 or 4I13/2) of Er3+ ions. However, the intrinsic absorption cross-section of Er3+ ions in polymers is small, and high-power laser pumping can easily cause damage to polymer waveguides, which limits the development of polymer EDWAs. In this work, a low-power blue violet LED is used as the pump source instead of a traditional semiconductor laser. By utilizing the strong absorption performance of organic ligands in the blue violet light band and the intramolecular energy transfer mechanism between ligands and Er3+ ions, the efficient luminescence of Er3+ ions at 1550 nm is achieved.MethodsUsing the chelating phosphine oxide ligands DBFDPO as the neutral ligand and β-diketone ligand DBTTA as the anionic ligand, respectively, the erbium complex Er(DBTTA)3(DBFDPO) is synthesized and doped into polymethylmethacrylate (PMMA) to prepare active polymer films. The absorption spectra, photoluminescence (PL) spectra, and atomic force microscope (AFM) image of the film are measured at room-temperature. A passive SU-8 channel waveguide with a cross-sectional size of 4 μm×4 μm is fabricated via a one-step lithography process, using a 3-μm-thick Er(DBTTA)3(DBFDPO)-doped PMMA as the active top cladding to prepare a polymer optical waveguide amplifier. With the 365 nm LED vertical top-pumping method, optical gains at 1550 nm are achieved in the waveguide based on the evanescent-wave amplification principle.Results and DiscussionsBy using a 462 mW 365 nm LED as the pump source instead of conventional 976 nm or 1480 nm semiconductor lasers, a relative gain of 7.4 dB/cm at 1550 nm is achieved in a 0.9 cm-long waveguide. The output optical intensity increases as the pump power increases when the 1550 nm signal power at the input waveguide facet is 1.8 μW. For a fixed signal power, the relative gain increases as the pump power increases. This approach is expected to reduce the commercialization costs of the waveguide amplifier by utilizing LED pumping for optical gain in the C-band of optical communication.ConclusionsBased on the intramolecular energy transfer mechanism among the chelating phosphine oxide ligands DBFDPO, β?diketone ligand DBTTA and the central Er3+ ions, the optical gain of 7.4 dB/cm is demonstrated at 1550 nm by using a 365 nm LED instead of 976 or 1480 nm lasers as the pump source in complex Er(DBTTA)3(DBFDPO)-doped PMMA waveguides. In this way, the waveguide thermal damage caused by traditional laser pumping can be overcome. Moreover, the erbium complex Er(DBTTA)3(DBFDPO)-doped PMMA polymer in this work can be conveniently spin coated on different types of low loss waveguides to compensate for losses in optical links, which greatly improves the universality of materials in planar photonic integration. The LED vertical top-pumping method is expected to reduce commercial costs, and it is expected to be widely applied in the field of planar photon integration.
Jul. 04, 2024Vol. 51 Issue 14 1401014 (2024)
Muqi Feng, Qiming Xu, Yu Zhan, and Changsheng Liu
ObjectiveIn actual applications, owing to long-term high loads on their surfaces, rail tracks inevitably develop surface fatigue cracks that propagate in depth, which can cause abrupt rail breakages. Therefore, periodic in-situ defect non-destructive testing must be performed on service rails without affecting the normal operation of the railway. Laser ultrasonic technology can achieve non-contact detection and exhibits outstanding on-site testing capabilities, showing promising application prospects in the field of non-destructive testing. Previously, researchers primarily focused on simulation methods for crack detection using laser ultrasonic technology, whereas experimental studies pertaining to crack detection are scarce. Additionally, a few researchers successfully performed crack localization and quantitative detection via overall crack imaging. This study proposes a dual-side line-scanning imaging method based on laser ultrasonics for rapidly detecting surface cracks on rail tracks via line scanning. The defect images obtained can effectively reflect the positions, lengths, and widths of the cracks.MethodsLaser ultrasonic dual-side scanning is adopted in this study to detect surface cracks on steel rails. The laser ultrasonic experimental system includes excitation devices, reception devices, mobile scanning devices, and signal acquisition and processing devices, as shown in Fig.4. By fixing the excitation and detection devices and actuating the sample, a line scan is conducted on each side of the crack to achieve dual-side line scanning for crack detection. Wavelet packet transformation is employed to denoise ultrasonic waveform data obtained from bilateral line scanning. Subsequently, the denoised ultrasonic data are subjected to B-scan imaging processing, which converts the resulting B-scan image into left and right images of the crack and merges the images from both sides to achieve an overall image of the crack. To mitigate errors in crack-length detection using the line-scanning imaging method, a scan position versus maximum amplitude difference graph is plotted to determine the start and end positions of the crack, from which the crack length can be determined, thus facilitating improvement to the accuracy of crack-length detection.Results and DiscussionsThe wavelet packet transform effectively enhances the signal-to-noise ratio of ultrasonic signals (Fig.5). The laser ultrasound single-side B-scan image, as shown in Fig.7(b), allows for the indirect extraction of the position and length of cracks but does not provide the width information. Similarly, the laser ultrasound single-side line-scan image shown in Fig.8 can directly yield the position and length of cracks but not the width. Meanwhile, the imaging method shown in Fig.9 directly provides information regarding the position, length, and width of cracks, with precise detections of crack position and width but with relatively large errors in terms of length detection. Figure 11 shows the scan position versus maximum amplitude difference graphs obtained by line scan on both sides of crack, from which the start and end positions of cracks can be determined directly to obtain the crack length. The detection results indicate that compared with applying the laser ultrasound dual-side line-scan imaging method, using the scan position versus maximum amplitude difference graph significantly improves the accuracy of crack-length detection.ConclusionsIn this study, the principles of laser ultrasonics are utilized to conduct a dual-side line scanning detection of surface cracks on U71Mn steel plates using a custom-developed laser ultrasonic scanning detection system. By employing wavelet packet denoising, applying the dual-side line-scanning imaging method, and plotting the scan position versus maximum amplitude difference graph, surface cracks on rails can be imaged rapidly and cracks can be detected quantitatively with high accuracy. Wavelet packet denoising significantly improves the signal-to-noise ratio of ultrasonic signals, thus facilitating the extraction of defect information after imaging. The dual-side line-scanning method enables an overall imaging of cracks, thus enabling the direct acquisition of the crack position, length, and width from the images. Compared with the conventional point-by-point comprehensive scanning detection method, the proposed method only requires B-scanning on both sides of the rail, thus eliminating the necessity for scanning detection at the middle of the rail, which improves the scanning speed and efficiency. By extracting the maximum amplitude difference and plotting the scan position versus maximum amplitude difference graph to determine the crack length, the relative errors obtained are 1% and 4%, respectively, as compared with relative errors of 7%, 10%, and 8% yielded by imaging methods. Thus, errors are reduced significantly and the accuracy of crack-length detection is enhanced successfully.
Jul. 02, 2024Vol. 51 Issue 14 1404001 (2024)
Rui Ban, Rifeng Zhang, Zhiyong Tao, and Yaxian Fan
ObjectiveMetallic materials are extensively used in scientific instruments and modern industrial equipment. Various challenges are encountered throughout the processes of fabrication, manufacturing, and long-term utilization of metallic materials, among which the generation and accumulation of small defects significantly affect their applications. These small defects, which cause structural performance degradation due to corrosion, fatigue, and stress concentration, can progress gradually and ultimately result in quality issues or safety hazards in the equipment. Hence, precise and efficient detection of such small defects is imperative. Although several common detection methods have been investigated, such as piezoelectric detection, they still exhibit limitations in applications, such as non-contact or simultaneous detections of multiple points. Therefore, more advanced technologies are warranted to address these challenges. The method proposed in this study is based on multi-channel fiber interferometric sensing and laser ultrasonic inspection, which offers significant innovation and application prospects. This approach integrates multi-channel fiber interferometers and laser ultrasonic techniques, thereby overcoming the limitations of conventional methods and providing precise, high-resolution detection capabilities.MethodsThe Fizeau fiber interferometer utilizes the same single fiber as both the sample and reference arms. Therefore, by constructing a multi-channel Fizeau fiber interferometer, information can be acquired simultaneously from multiple points in an extremely small scale. This technology processes and analyzes the propagation characteristics and frequency properties of multipoint signals simultaneously, thus enabling the rapid detection of elastic waves along the sample surface without necessitating probe scanning. We conduct defect detection on aluminum alloy plates with circular hole defects experimentally and assess the result based on a comparison with aluminum plates without defects. By analyzing echo signals from the boundaries and defect reflections, we successfully reconstruct the optical paths and accurately determine the boundaries and positions of the defects. In this study, we not only generate and localize individual defects but also conduct multipoint detection simultaneously at different locations, thus significantly improving the detection efficiency and precision. Compared with conventional scanning methods, this technique based on a Fizeau fiber interferometer provides much better real-time performance and accuracy, thus enabling more precise detections of small defects inside the samples. Additionally, by comparing samples with and without defects, we successfully differentiate and validate the echo signals from the plate boundaries and defect reflections.Results and DiscussionsThe multi-channel Fizeau fiber interferometer constructed for the experiment (Fig. 2) enables simultaneous and high-resolution detections. The inner diameter of the multi-channel fiber probe (Fig. 3) is much smaller than those of common piezoelectric ultrasonic transducers, with a spatial interval between consecutive detection points of less than 0.24 mm. Additionally, the lateral resolution is determined by the precision of the stepper motor, which can be 10 μm at the minimum. This multi-channel signal-processing technique facilitates the capture of more detailed features of small defects with a much higher resolution. Based on a multiparameter analysis of the signals, parameters characterizing the size of the metal sample and the propagation characteristics of internal elastic surface waves can be obtained. During the inspection of the defect-free aluminum plate, echo signals are detected and then analyzed (Fig. 8). To inspect the aluminum plate with circular hole defects, an experiment is conducted in three sets comprising six channels per set, thus resulting in the measurement of 18-channel elastic wave signals (Fig. 10). The specific size and boundary positions of the circular hole defects can be identified and delineated based on the actual parameters of the reflected signals. This provides a practical new approach for the quality inspection of metallic materials.ConclusionsIn this study, a laser ultrasonic non-destructive testing method based on multi-channel fiber interferometry is proposed that utilizes multiple Fizeau fiber interferometers to construct a multi-channel elastic surface wave detection system. Under laser pulse excitation, non-contact excitation and detection are achieved using multi-channel fiber probes. Compared with the conventional ultrasonic probe detection system, this multi-channel fiber interferometric detection system enables simultaneous multipoint measurements of elastic surface waves with a much higher resolution. It can obtain more information simultaneously at much smaller scales. By analyzing the frequency and propagation characteristics of elastic surface wave signals, the elastic wave velocity within the sample can be detected rapidly without necessitating probe scanning. Based on a multiparameter analysis of the multi-channel signals, not only the size of the metal plate samples is obtained but also the morphology of the circular hole defect boundary within the plate is delineated. This system can detect elastic surface wave signals at different positions simultaneously. Furthermore, it offers extremely high temporal and spatial resolutions, thus providing a new technological reference for the laser ultrasonic non-destructive testing of small defects in metals.
Jul. 02, 2024Vol. 51 Issue 14 1404002 (2024)
Ting Ding, Wei Wang, Xiao Li, Jianglin Xu, Sicheng Zhang, Zhubing Cheng, Enchen Wu, Qiuyu Zhang, and Xiaoye He
ObjectiveThe Hefei Advanced Light Facility (HALF) is an international, advanced, fourth-generation synchrotron radiation light source in the low-energy region with world-leading design specifications for emissivity and brightness. However, challenges arise in the construction and operation of the HALF, one of which is the method to efficiently perform highly accurate pre-alignments. To improve the magnet pre-alignment accuracy and work efficiency, members at the HALF design a four-channel laser system for pre-alignment. Owing to space limitations, the actual four-channel laser system cannot fulfill the theoretical angle and distance requirements. Hence, the best layout for a four-channel laser system must be determined and the effects of angle and distance on the layout accuracy must be analyzed to improve the measurement performance of the four-channel laser system. Additionally, a simple and rapid adjustment method and an evaluation indicator suitable for accelerator alignment measurements are used to improve the efficiency of the four-channel laser system.MethodsFitting-error indicators and the unified spatial metrology network (USMN) weight-allocation-optimization adjustment method were used to optimize the layout of the four-channel laser system. The USMN weight-allocation-optimization adjustment dynamically adjusted the divergence-angle parameters to determine the most suitable parameter combination, reduce the angle weight, and improve the measurement accuracy. Meanwhile, the fitting-error evaluation was based on magnet points. The measured and theoretical values were used to perform a fitting conversion to obtain the fitting errors. We strictly derived the relationship between the fitting error and four-channel laser layout error and confirmed that the fitting error can be used as an indicator to evaluate the accuracy of the four-channel laser layout. The effects of angle and distance on the layout accuracy were analyzed to improve the measurement performance of the four-channel laser system.Results and DiscussionsThe feasibility of the USMN weight-allocation-optimization adjustment method is investigated via simulation analysis. The divergence-angle error is dynamically adjusted to obtain the fitting errors of different parameter schemes, and the optimal parameter scheme is identified via comparative analysis (Table 1). Using the optimal parameter scheme, the adjustment is analyzed more comprehensively, and the result confirms that the adjustment can fully exploit the ranging information, avoid the interference of angle-measurement errors, and confirm the principle of modifying instrument parameters to adjust the distance and angle weights (Table 2?4). Additionally, four layout schemes are designed. Using the USMN weight-allocation-optimization adjustment method and fitting error, the right-angled regular triangular pyramid is shown to be the best layout. The position dilution of precision (PDOP) of the four layout schemes is calculated, which proves that an inaccurate random model affects the accuracy of the PDOP as a previous evaluation indicator. The fitting error is more suitable for alignment measurement than PDOP (Table 6). This study focuses on analyzing the effects of angle and distance on layout accuracy. In the actual layout process, ensuring that the top surface is an isosceles right triangle is not necessary. The vertex angle of the top surface is only required to be within [88°, 94°], which satisfies the pre-alignment accuracy requirements of the HALF for the magnet unit (Fig. 3). By improving the accuracy in the y- and z-directions, the overall layout accuracy of the four-channel laser can be improved without diminishing the lateral accuracy (Fig. 4). The greater the absolute height difference in the z-direction, the higher is the overall layout accuracy of the four-channel laser. However, when combined with the actual layout of the pre-alignment experimental platform, if the instrument is installed at an extremely high position, then the amplification effect of the ground vibrations will severely affect the system stability. The absolute height difference in the z-direction should be set reasonably based on the actual situation (Fig. 5). This study provides a theoretical basis for the actual layout of four-channel lasers.ConclusionsIn this study, a four-channel laser system is designed; additionally, the USMN weight-allocation-optimization adjustment method and the fitting error are used to optimize the four-channel laser layout. By optimizing the instrument parameters for this adjustment, the interference of angle-measurement errors on the measurement results is avoided and the measurement accuracy is improved. Compared with the PDOP as a previous evaluation indicator, the fitting-error index for the quantitative analysis of lateral accuracy is more suitable for particle-accelerator alignment measurements. The right-angled regular triangular pyramid layout demonstrates the highest accuracy, and the lateral accuracy of its magnet unit reaches 7.5 μm, which satisfies the pre-alignment requirements of the HALF. This study focuses on analyzing the effects of angle and distance on layout accuracy, thus providing a theoretical basis for the actual layout of four-channel lasers.
Jul. 25, 2024Vol. 51 Issue 14 1404003 (2024)
Junyong Zhang, Jian Lin, Xiuping Zhang, and Yaling Yang
ObjectiveLarge-aperture optical elements are widely used in a variety of optical systems, such as astronomical telescopes and inertial confinement fusion laser devices. To reduce the laser damage to the devices, it is usually necessary to increase the aperture of the optical elements to reduce the energy density. Although real-time on-line dynamic detection of large-aperture optical components has great significance, a large aperture under test is in contradiction with the small target surface of the detector. Therefore, the large-aperture wavefront must be reduced to match the detector size. Among the current wavefront sensors, radial-shearing interferometry can convert a large beam into a small diameter beam to fit the measurement instruments in a diagnostic system. In present study, we report a novel type of single-shot radial-shearing interferometry with an ultra-large aperture ancient Greek-ladder membrane photon sieve (aGPS). This method has the advantages of common path, strong stability, and high accuracy, and meets the requirement of large-aperture wavefront sensing. The proposed approach can be helpful for wavefront measurements of meter-scale optical elements and 10-m space telescopes.MethodsSingle-shot radial-shearing interferometry with an ultra-large aperture aGPS is proposed for the first time. The ancient Greek-ladder sequences are first encoded and then mapped into the photon sieves to generate an aGPS, which has the optical function of multiple foci in space. The 114 mm diameter aGPS with 150 million holes is designed and machined to carry out radial-shearing interferometry. In the experiment, the reason of low-contrast interferogram at different positions is analyzed, indicating the direction for later research. Furthermore, to improve the signal-to-noise ratio of the interferogram, the optical software GLAD is used to simulate the radial-shearing interferometry with sphere-wave illumination. Finally, based on the above analysis, non-confocal radial-shearing interferometric experiments with the aGPS are carried out to verify our proposed method.Results and DiscussionsTaking into account the difficult manufacture of a large-aperture membrane aGPS, two non-confocal mono-focal photon sieves are used to construct the radial-shearing interferometric path. Before properly starting the experiment, the two photon sieves are adjusted and placed in confocal condition. Then, the short focal-length photon sieve can move forward or backward from the confocal spots, and its transmission function is equivalent to that of an aGPS (Fig.2). The large-aperture radial-shearing interferometric path with an aGPS is shown in Fig. 3. The entire interference wavefront detection system consists of only one bifocal aGPS. Overall, compared with the mono-focal Fresnel zone plate, the aGPS has complex optical functions, which is conducive to the improvement and optimization of the interference path. The designed aGPS has a self-supporting structure, and it enables the processing and production of ultra-large aperture membrane photon sieves and does not introduce background aberrations (Fig.6). In addition, that only one aGPS realizes the radial-shearing interference optical path, breaks through the limitation of the aperture, and provides a new option for a large-aperture and high-precision wavefront sensing method. The experimental results exhibited in Figs. 7 and 8 show that photon sieves can be used for radial-shearing interferometry, and the wavefront measurement result of window glass with non-confocal photon sieves is consistent with that of the two traditional Fresnel zone plates.ConclusionsThis study demonstrates that the method of single-shot radial-shearing interferometry with an ultra-large aperture aGPS is effective. The aGPS not only has functions of axial splitting to realize radial-shearing interferometry with variable shear ratio but also can be fabricated with large aperture and does not introduce system aberration. Different from confocal radial-shearing interferometry, the non-focal radial-shearing interferogram is modulated by the spherical wave that can magnify the interference effect of the small-aberration wavefront. Our proposed method is verified by the optical experiment and provides a new way to measure the wavefront distributions of meter-scale optical elements and 10-m space telescopes.
Jul. 25, 2024Vol. 51 Issue 14 1404004 (2024)
Yibiao Hu, Jiajing He, and Jun Wang
ObjectiveWith breakthroughs in fabrication techniques, integrated optical components have been developed on a lithium niobate on insulator (LNOI) platform with unprecedented performance. However, with the requirement for large-scale integration of devices on the LNOI platform, multimode crossing waveguides, which have low crosstalk and loss, are essential to enhance integration density and routing flexibility. Because of the anisotropic characteristics of lithium niobate, the design of crossing waveguides must consider the different refractive indices in different propagation directions. In this work, we propose and demonstrate a 2×2 crossing waveguide based on self-imaging theory under different waveguide sizes in the X-cutting Y-propagating and X-cutting Z-propagating directions to satisfy practical requirements.MethodsThis study employs self-imaging theory to design the crossing waveguide. First, the relationship between the lithium-niobate waveguide width and effective refractive index is obtained by simulation, and the optimal beat length is calculated using the self-imaging principle. Subsequently, the calculated parameters are introduced into the software as initial values. In this process, the structural parameters of the multimode waveguide in both directions are set to be the same, and the optimal values are found by parameter scanning. The structural parameters in one direction are fixed as previously described, and those in the other directions are scanned to find the best structural parameters. Finally, a simulated crossing waveguide is fabricated and measured. The LNOI wafers are cut into 25 mm×21 mm pieces. All pieces are cleaned with a piranha solution. Hydrogen silsesquioxane (HSQ) resist is then spin-coated onto the samples. The HSQ resist is exposed by electron beam lithography and subsequently developed. The patterns are then transferred to the LNOI device layer via reactive-ion etching, where the etching depth of the LNOI layer is 300 nm. Finally, a 500-nm-thick SiO2 layer is formed on the lithium niobate waveguide through plasma-enhanced chemical vapor deposition (PECVD). The crossing waveguide is connected to the fiber using a grating coupler. The crosstalk and insertion losses are determined by subtracting the grating coupler spectrum from the measured spectrum. The insertion loss of the crossing waveguide is measured and averaged using cascade numbers. To understand the effects of process errors, the relationships among the device performance, waveguide width, and angle error are obtained by simulation.Results and DiscussionsThe insertion loss and crosstalk of the device are measured in two directions (Fig.8). The minimum insertion losses of the crossing waveguides in the X-cutting Y-propagating and X-cutting Z-propagating directions are 0.094 dB and 0.356 dB, respectively. The corresponding crosstalk values are less than -33.31 dB and -30.81 dB in the C band, respectively. However, resonance dips appear in the transmission spectra in the X-cutting Y-propagating direction (Fig.8). This is because the cascaded crossing waveguides can be regarded as long-period waveguide gratings, which introduce resonance dips due to the coupling of the waveguide guiding mode to the radiative cladding modes. The insertion loss in the X-cutting Z-propagating direction is approximately 0.4 dB. The crosstalk values in both directions follow the same trend, which decrease in the C band. Differences in the experimental and simulation results can be seen, which mainly derive from fabrication imperfections, scattering losses, and waveguide absorption losses caused by the roughness of the sidewall edge of the lithium niobate waveguide. These process errors can be further optimized in subsequent processing to improve device performance. The relationships among the device performance, waveguide width, and angle error are obtained by simulation (Fig.9). Waveguide width errors have less effect on device performance than angle errors do, whereas the angle error has a greater effect in the X-cutting Z-propagating direction. Overall, the designed device has relatively high process tolerance. In addition, compared with the previously reported lithium niobate crossing waveguide, this work shows an improvement in the device size and crosstalk.ConclusionsIn this study, a 2×2 crossing waveguide with different structural parameters in the X-cutting Y-propagating and X-cutting Z-propagating directions is fabricated by single-step etching on X-cutting LNOI. The minimum insertion losses of the crossing waveguides in the X-cutting Y-propagating and X-cutting Z-propagating directions are 0.094 dB and 0.356 dB, respectively. The corresponding crosstalk values are less than -33.31 dB and -30.81 dB in the C band. The waveguide crossing has a footprint of 36.57 µm×31.90 µm. The performance can be further enhanced by optimizing the fabrication process.
Jul. 25, 2024Vol. 51 Issue 14 1413001 (2024)
Xinhui Ding, Hui Yu, Dawei Li, Junyong Zhang, Li Wang, Qiong Zhou, and Xingqiang Lu
ObjectiveThe current application of domestic grating design software has long been dependent on commercial solutions such as VirtualLab and Gsolver. This reliance restricts the autonomy and innovation in the design of grating, metasurfaces, and microstructures. To meet the requirements of their design and analysis, there is an imperative need to fill the gap with domestic grating design software. The Grating Designer software, developed by Chinese researchers, not only satisfies the diverse requirements of grating and microstructure design, which ranges from modeling to analysis and optimization, but also has the ability to accelerate optimization and iterative convergence in the process of grating design.MethodsThe development of Grating Designer involves a comprehensive exploration of the Fourier modal method (FMM), also known as rigorous coupled wave analysis (RCWA), supported by thin element approximation, Gaussian elimination, matrix eigenvalue and eigenvector solving, matrix inversion, and other solution methods. The FMM serves as the analytical core, rigorously solving Maxwell equations within the periodic region of the grating. This method transforms the solution of Maxwell equations into determination of eigenvalues and eigenvectors. It applies them to the boundary conditions of the grating and substrate or medium regions, ultimately yielding results such as optical field, phase, and diffraction order. The software offers functionalities including construction, visualization, diffraction angle calculation, order calculation, diffraction efficiency analysis, reflection calculation, internal field calculation, transmission field calculation, and parameter scanning for 16 types of one-dimensional gratings and their derived two-dimensional gratings. The software development, driven by practical grating design and analysis requirements, features user-friendly tabular parameter input, simultaneous multi-parameter scan, and efficient parallel processing capabilities. Compared with mainstream grating design software, Grating Designer has a completely independent core code, supporting analysis of a wider range of grating types, including one- and two-dimensional gratings, microstructures, and metasurfaces, while facilitating the convenient addition of cladding layers, inner layers, outer layers, and other structures. The software diffraction efficiency and field distribution calculation results are consistent with those of mainstream design software such as VirtualLab and Gsolver.Results and DiscussionsThe domestically developed software Grating Designer is innovative owing to its status as a completely independent software with a fully controllable core code. This independence provides it with a high degree of reliability and the agility to adapt and evolve according to user needs. Grating Designer innovative use of tabular parameter input, and features such as one-click selection, one-click display of grating morphology, and grating design cases considerably facilitate the construction of complex grating structures. User-friendly interface allows users to manipulate parameters such as duty cycle and modulation depth, as well as the addition of cladding layers and inner/outer membrane layers with ease (Fig.5). Grating Designer excels by introducing a feature that allows for the simultaneous scanning of multiple parameters (Fig.12), making it an all-encompassing solution for grating design and optimization. This multifaceted capability ensures that grating designs are both precise and adaptable to real-world conditions. Unlike VirtualLab and Gsolver softwares, Grating Designer encompasses various pre-set grating structures and design cases, allowing for arbitrary changes to the geometric parameters when constructing grating sawtooth structures, thus enhancing the flexibility of one-dimensional grating design. All one-dimensional grating morphologies constructed by Grating Designer can be transformed into novel two-dimensional grating morphologies through symmetric rotation and translation, high-low cross translation, and coordinate plane transformation (Fig.8), significantly expanding the design scope of two-dimensional gratings and microstructures. Grating Designer supports the calculation of electromagnetic waves from extreme ultraviolet to terahertz bands, and under a broader wavelength range, Grating Designer supports the use of conductivity to define materials. This feature expands its range of applications beyond grating design and analysis to accommodate metallic metasurfaces, antennas, and other design and analysis applications. Considering the complexity of grating construction in Grating Designer, the software employs multi-threaded parallel algorithms to achieve efficient parallel computing, as evidenced from tests on highly complex two-dimensional microstructures constructed within Grating Designer.ConclusionsThis paper presents the development and features of Grating Designer, a fully independent software with computational capabilities and precision in diffraction order, diffraction efficiency, and field distribution comparable to those of mainstream international grating design software. Additionally, Grating Designer possesses a more extensive capability for one- and two-dimensional grating construction, facilitating efficient design and analysis across a broader wavelength range for a wider range of grating, metasurfaces, and microstructures. Grating Designer represents a novel software development in domestic grating design, and its computational accuracy and range of applications will continue to be optimized.
Jul. 25, 2024Vol. 51 Issue 14 1413002 (2024)
Chang Guo, Kezheng Dang, Tianyi Wu, Jungang Yang, Yang Ran, Zichao Zhou, and Chen Dong
ObjectiveCoherent states are important information carriers in the field of communication and are widely used in star-ground coherent optical communication and star-ground quantum key distribution scenarios. Improving the discrimination accuracy for coherent states is a key method for achieving longer communication distances. The quantum-enhanced measurement technique can overcome the limitations of shoot noise and the standard quantum limit (SQL), allowing increased communication distance of star-ground optical communication systems. Researchers have conducted a series of studies on quantum-enhanced measurements and proposed various schemes including adaptive feedback strategies and optimization of displacement operators. Although the SQL is surpassed in quantum-enhanced measurement schemes that use adaptive feedback strategies, the experimental structures of these schemes are usually complex. Therefore, designing such a scheme with a simple structure and good performance for weak signals remains an unresolved research problem. We hope to construct a measurement scheme for weak coherent states with a simple experimental structure that can surpass the SQL.MethodsTo determine weak coherent states, this paper proposes a new hybrid measurement scheme based on homodyne and binary quantum measurements, as depicted in Fig.1. The scheme includes two successive measurements of the coherent states: the first involves a homodyne detector, which can preliminarily determine the received coherent states. The results of the first measurement are then provided as feedback for the second stage. Subsequently, the second measurement stage involves a binary quantum measurement with two partitions, which discriminates the signal states. The received coherent state is first divided using a beam splitter (BS) with transmittance T and reflectivity R. The transmitted and reflected parts of the received signal state are output to the quantum measurement and HD stages, respectively. T and R can be varied to adjust the signal amplitude for the different measurement stages. Accordingly, the hybrid measurement scheme was optimized via enhancement of the ratio of each measurement stage. In addition, the displacement operator was optimized to improve the performance of the quantum measurement stage.Results and DiscussionsFirst, the displacement operator was improved, and the results are shown in Fig.6. It is clear that for weak signals, optimization of the displacement operator significantly reduces the symbol error rate in the quantum measurement stage, particularly when the average number of photons in the signal is 0.25, and the decrease is close to 0.1. Second, we analyzed the partition ratio in the binary quantum measurement stage and calculated the optimal partition ratio using a global search algorithm, as shown in Fig.7. The experimental results indicate that the partitioning scheme reduces the symbol error rate during the quantum measurement stage by approximately 1% compared with the normal scheme. Finally, the partition ratio between the quantum and classical measurements was enhanced using the gradient descent method, as presented in Fig. 8. From the experimental results, the partition ratio gradually decreases as the signal is enhanced, implying that more energy of the signal is allocated to the classical measurement stage. Under the optimal partition ratio, the error probability of the hybrid scheme for weak QPSK signals with an average photon number of less than two is significantly lower than the 66% SQL (considering the SQL when the detection efficiency is 66%). In addition, the hybrid solution has some advantages over 100% SQL. The experimental results show that the designed hybrid measurement scheme, with simpler experimental structure, can exceed the SQL under the current experimental conditions, and thus is of great significance for future engineering applications in practical coherent optical communications.ConclusionsIn this study, we developed a hybrid measurement scheme including homodyne and binary quantum measurements and optimized the corresponding parameters based on the experiment. In addition, the performance of the hybrid measurement scheme under the experimental parameters was calculated using Monte Carlo and numerical simulations. The simulation results illustrate that for weak signals with a mean photon number of less than two, the hybrid measurement scheme can surpass the SQL under practical conditions. For example, at the mean photon number of two, the error probability was reduced by 10% compared with the SQL. The proposed hybrid measurement scheme has a simpler experimental structure, compared with others, and can surpass the SQL under the current experimental conditions for weak coherent states.
Jul. 04, 2024Vol. 51 Issue 14 1412001 (2024)
Dongchen Jin, Yunfeng Duan, Qing Sun, Juyun Zhao, Bailin Cao, and Xiaohua Chen
Jul. 10, 2024Vol. 51 Issue 14 1416001 (2024)
Yafei Wang, Zhiquan Lin, Mengting Guo, Yinggang Chen, Shikai Wang, Fan Wang, Meng Wang, Lei Zhang, Suya Feng, Chunlei Yu, and Lili Hu
Jul. 10, 2024Vol. 51 Issue 14 1416002 (2024)
Tao Jiang, Zerui Wang, Lei Zhou, Zhou Zhou, Zhichen Zhao, Xinbin Cheng, and Zhanshan Wang
SignificanceScattering-type-scanning near-field optical microscopy (s-SNOM) is one of the most widely used near-field optical microscopy techniques. It enables nanoscale spatial resolution of the surface of a sample or at a specific depth below the surface without causing damage to the sample. Consequently, its application spans across diverse scientific disciplines, such as physics, chemistry, and biology. Through the photoexcitation at the tip-sample boundary, s-SNOM simultaneously generates weak near-field-scattering signals containing crucial near-field information and intense background scattering signals that can obscure this information. The challenge lies in suppressing the background noise, and various near-field signal extraction techniques have been proposed to address this issue. These techniques play a pivotal role in extracting genuine near-field information, enabling a more precise clarification of the sub-wavelength characteristics of samples in multiple research areas.Such potency in revealing the intricate nanoscale underscores the importance of mastering these techniques. In the pursuit of this objective, it is imperative to extensively investigate the mechanism for generating near-field-scattering signals and techniques for extracting near-field optical signals and their underlying principles. Such detailed investigations help refine near-field extraction techniques and are significant in observing the physical changes that occur during s-SNOM experiments. This knowledge facilitates the thorough analysis of near-field optical research findings and their practical applications, promoting advancements in various scientific disciplines.ProgressTo advance the techniques for extracting near-field optical signals, researchers have examined the generation mechanism of near-field-scattering signals inherent in the near-field detection process. They established several physical models, including the point-dipole and finite-dipole models, to analyze tip-sample interactions. These models enable a more accurate analysis of near-field experimental results, even without resorting to computationally tasking simulation methods. In addition, research on these models provides theoretical support for the development of near-field extraction techniques: the near-field-scattering signal exhibits a more pronounced variation in higher-order harmonics with tip vibration, which distinguishes it from the background scattering signal. This dissimilarity in response to periodic modulation of the tip allows for effective demodulation at higher harmonics of the vibration frequency of the tip using a lock-in amplifier, achieving signal suppression against background noise. Building upon demodulation at higher harmonics, researchers have proposed techniques for extracting near-field optical signals, including intensity and electric-field detection techniques.The intensity detection techniques, which were earlier and more extensively adopted, include prevalent techniques, such as the self-homodyne, (quadrature) homodyne, and pseudoheterodyne detection techniques. In addition, less-used techniques, such as phase-shifting interferometry, synthetic optical holography, and self-heterodyne detection, were developed. These intensity detection techniques often involve the addition of components, such as plane mirrors and acousto-optic modulators, to the interferometer system and generate reference signals with a specific phase or frequency. Such modifications effectively suppress the background noise, enabling the acquisition of a high signal-to-noise ratio and pristine near-field information. Some of these methods also facilitate the separation of near-field information into amplitude and phase components, which is crucial for the advancement of s-SNOM applications.Electric-field detection techniques, including electro-optic sampling and photoconductive antennas, are applied in radio frequency and terahertz detection bands because of their simple experimental setups and electric-field detection characteristics. Although electric-field detection techniques may not achieve the same extent of background noise suppression as the intensity detection techniques, these techniques contribute to diversifying technological options for experiments employing s-SNOM, further enriching the potential applications of this innovative microscopy.Conclusions and ProspectsIn this review, we first clarify the mechanism of near-field-scattering signals using tip-sample physical models and present an overview of the research development in tip-sample interactions. Subsequently, various techniques for extracting near-field optical signals developed to date are systematically introduced, with emphasis on crucial techniques, such as self-homodyne, (quadrature) homodyne, heterodyne, and pseudoheterodyne detection. Through comparative experiments, the distinctions between several widely used techniques, including self-homodyne, quadrature homodyne, and pseudoheterodyne detection, are intuitively demonstrated, consistent with the theoretical expectations. Finally, the state-of-the-art advancements in near-field optical signal extraction are presented, along with a prospective outlook on their future development.Currently, several mainstream techniques for extracting near-field optical signals have distinct advantages in terms of the signal-to-noise ratio, experimental efficiency, and complexity, helping researchers to make selections based on the specific requirements of their experiments. Consequently, research efforts in near-field extraction techniques predominantly concentrate on the advancement of existing techniques. This can be achieved by incorporating additional computation or experimental components. A typical example is the pseudoheterodyne interferometry for multicolor near-field imaging, which achieves simultaneous imaging of multiple spectra in a single experiment by calculating coefficient variations corresponding to the separation of the amplitude and phase at different detection wavelengths. Enhancements such as this maintain the original near-field optical signal extraction capabilities and address a broader range of experimental requirements, such as the improvement of experimental efficiency and the increase in imaging resolution. These advancements contribute to the improvement of experimental efficiency and the richness of information acquisition in s-SNOM experiments, encapsulating the future trajectory of near-field optical signal extraction techniques.
Jul. 02, 2024Vol. 51 Issue 14 1400001 (2024)
Ji Shen, Nianwen Cao, Xinglai Lu, Hao Chen, Han Wang, Dongming Zhang, Zhicheng Wang, and Zhangwei Wang
The systematic error is primarily due to the ozone-measurement error caused by aerosols. Based on the dual-wavelength differential absorption algorithm, the ozone-measurement error estimated using aerosol optical parameters retrieved from Mie lidar data requires the assumption of aerosol parameters (aerosol AE, aerosol backscatter ratio, and aerosol extinction-backscatter ratio). Compared with the ozone-measurement error contributed by an aerosol extinction-backscatter ratio of 50, an aerosol AE of 1.0, and an aerosol backscatter ratio of 1.01 in this experiment, the maximum difference in ozone concentration caused by an aerosol backscatter ratio of 1.002 or 1.05 for the signals of the 287/299 nm pair is (4.82±0.47) μg/m3 (Fig. 6). The maximum difference in ozone concentration due to a deviation of 50% in the aerosol extinction-backscatter ratio is (21.15±1.77) μg/m3 (Fig. 5). The maximum difference in ozone concentration due to a deviation of 50% in the aerosol AE is (30.11±2.12) μg/m3 (Fig. 5). The results show that the deviations of the aerosol AE and aerosol extinction-backscatter ratio significantly affect ozone-concentration retrieval, whereas the deviation of the aerosol backscatter ratio affect ozone-concentration retrieval less.To reduce the deviations of the aerosol AE and aerosol extinction-backscatter ratio, we proposed a new idea involving two steps. In step 1, we assumed that the aerosol extinction-backscatter ratio in the experiment was stable. Thus, the AERONET data near the lidar measurement point was interpolated to obtain the aerosol extinction-backscatter ratio at 396 nm (average was 72.75±11.53), and the average value was considered as the accurate value to retrieve the aerosol extinction coefficient and aerosol backscattering coefficient. In step 2, we acquired the aerosol AE profile, as shown in Fig.7. In this experiment, the tropospheric ozone concentration retrieved from the aerosol AE profile was considered the actual value. The root mean square error of the tropospheric ozone concentration retrieved based on the assumed aerosol AE of 1.0 is 15.67 μg/m3 (Fig. 10).ObjectiveTo address the severe ozone pollution in China in recent years, monitoring tropospheric ozone concentration has become extremely important for effectively controlling tropospheric ozone pollution. Lidar is suitable for the in-depth study of regional tropospheric ozone because of its high spatial resolution, fast real-time operation, and large dynamic range. The dual-wavelength differential absorption algorithm is widely used to retrieve ozone concentrations measured using lidar. Most researchers retrieve aerosol optical parameters using the assumed value of the aerosol extinction-backscatter ratio or the aerosol angstrom exponent (AE), after which these aerosol optical parameters are used to estimate the ozone-measurement error caused by aerosols. This results in a significant error in the retrieval of the tropospheric ozone concentration. To obtain a relatively accurate ozone concentration using the dual-wavelength differential absorption algorithm, we combine ultraviolet multiwavelength lidar (276, 287, 299, and 396 nm) data with aerosol extinction-backscatter ratios provided by AERONET to retrieve the tropospheric ozone concentration. This approach can reduce the deviation of the aerosol optical parameters.MethodsBased on the dual-wavelength differential absorption algorithm, we retrieved the ozone concentrations in the aerosol zone using four-wavelength ultraviolet (UV) lidar (276, 287, 299, and 396 nm) data. A more accurate ozone-measurement error estimated using aerosol optical parameters retrieved from lidar data at 396 nm requires a more accurate aerosol AE and aerosol extinction-backscatter ratio. To obtain a more accurate aerosol extinction-backscatter ratio, we interpolated multichannel data from AERONET to obtain aerosol extinction-backscatter ratios at 396 nm using a cubic spline function. These ratios were combined with the 396 nm channel data measured using the UV multiwavelength lidar to retrieve the aerosol optical parameters (aerosol extinction coefficient and aerosol backscattering coefficient). Subsequently, the aerosol optical parameters at 276, 287, and 299 nm were obtained for different aerosol AEs. The ozone concentrations were retrieved by the signals of 276/287, 276/299, and 287/299 nm wavelength pairs. The difference between the ozone concentrations retrieved by the signals of two wavelength pairs was calculated, and the minimum difference was used to determine the aerosol AE. A relatively accurate ozone concentration obtained was the mean of the two ozone concentrations corresponding to the aerosol AE.Results and DiscussionsWhen ultraviolet multiwavelength lidar data are used to retrieve the ozone concentration in the aerosol zone, the errors in the ozone concentration are primarily statistical and systematic errors. The statistical errors arise primarily from the signal quantum noise and background noise. To reduce the statistical error, We perform wavelet transform denoising on the original signal with a resolution of 7.5 m, which resulted in ?4.81% for the mean of relative errors of ozone concentrations under 2 km. This indicates that the statistical error of the ozone-concentration profile below 2 km is significantly reduced after wavelet denoising (Fig.2).ConclusionsBy applying the dual-wavelength differential absorption algorithm, when ultraviolet multiwavelength lidar (276, 287, 299, and 396 nm) data are used to measure the ozone concentration in the aerosol zone and then combined with the aerosol extinction-backscatter ratio from AERONET, we successfully estimate the ozone-concentration measurement error contributed by the aerosol extinction coefficient and atmospheric backscattering coefficient more accurately. Additionally, the deviation of the aerosol optical parameters in the ozone measurement is reduced and more accurate aerosol AE and ozone concentrations in the aerosol zone are retrieved.
Jul. 25, 2024Vol. 51 Issue 14 1411001 (2024)
© Copyright 2018-2021 | Chinese Laser Press.
All Rights Reserved 沪ICP备15018463号-20