


Please enter the answer below before you can view the full text.


2025
Volume: 45 Issue 15
31 Article(s)

Jiajia Ding, Haiqiu Liu, Kai Zhang, Qian Liu, Huimin Ma, and Lichuan Gu
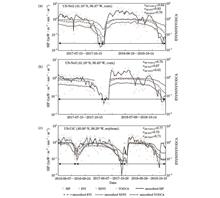
ObjectiveSolar-induced chlorophyll fluorescence (SIF), a byproduct of photosynthesis, exhibits a strong correlation with electron transport in the photosystem and functions as a reliable indicator of vegetation photosynthetic activity. However, its broad application in global productivity assessments, vegetation growth monitoring, and environmental stress detection remains constrained by data sparsity and insufficient long-term time series. To address these limitations, research focusing on SIF prediction through multiple explanatory factors has gained prominence. Studies incorporating multi-source explanatory factors have partially addressed issues concerning spatial discontinuity and low resolution of SIF products from atmospheric satellite sensors. However, a significant challenge persists: optical remote sensing imaging’s inherent susceptibility to cloud reflection or absorption results in lost ground-level information. Consequently, optical remote sensing-based vegetation indices cannot retrieve information from cloud-obscured areas, compromising SIF prediction accuracy. In contrast to optical remote sensing, microwave remote sensing enable ground-level information retrieval because of microwave penetrating non-precipitating and some precipitation clouds. This characteristic makes microwave remote sensing particularly suitable for continuous monitoring in cloud-prone regions. Microwave remote sensing-derived vegetation indices demonstrate both robust cloud penetration capabilities and reflection of vegetation’s internal physiological characteristics. Therefore, this study introduces a method for SIF prediction based on microwave vegetation indices, facilitating surface information acquisition in cloud-covered areas and enhancing SIF prediction accuracy.MethodsThis study utilizes global ozone monitoring experiment-2 (GOME-2) SIF data from 2013 to 2015, integrating it with MODIS-derived normalized bidirectional reflectance (NBAR), land surface temperature (LST), photosynthetically active radiation (PAR), and vegetation optical depth datasets. A bilinear interpolation or aggregation method is then applied to generate 0.25° grid data for dataset construction. The research implements machine learning algorithms for model training and employs cross-validation for hyperparameter optimization, establishing a microwave vegetation index-based SIF prediction model. Additionally, independent satellite-based observation data, including TROPOMI SIF, OCO-2 SIF, and MODIS gross primary productivity (GPP), were collected. The model’s performance evaluation metrics such as the coefficient of determination (R2) and root mean square error (RMSE) are used to assess differences between predicted results and original satellite data.Results and DiscussionsThe microwave vegetation index-based SIF prediction model developed in this study demonstrates validation results against multi-source satellite SIF and GPP products, as illustrated in Fig. 3, achieving R2 values of 0.921, 0.935, 0.923, 0.875, 0.812, and 0.802. The study compared the effectiveness of microwave and optical vegetation indices for SIF prediction under extreme satellite observation conditions. The experimental results indicate that for each 10% increase in effective cloud coverage, the R2 value of the optical vegetation index-based SIF prediction model decreases by 0.042, 0.041, and 0.031 in 2013, 2014, and 2015, respectively (Fig. 6). In comparison, the R2 values of the proposed model decrease by only 0.025, 0.022, and 0.017 (Fig. 6). The decay rate of R2 values for the proposed model decreased by 43%, indicating that the decay rate of SIF prediction accuracy based on optical remote sensing exceeds that of the presented model by a factor of 1.7 (Table 3).ConclusionsThis study presents an SIF prediction method based on microwave vegetation indices, and the potential for satellite-scale SIF prediction of the method is investigated. The method’s accuracy undergoes quantitative evaluation using SIF/GPP products from multi-source remote sensing satellites in orbit (including GOME-2 SIF, TROPOMI SIF, OCO-2 SIF, and MODIS GPP). The results demonstrate that the microwave vegetation indices-based model achieves an R2 value of up to 0.935. Additionally, compared to optical remote sensing-based SIF prediction models, the microwave-based model exhibits a 43% decay rate with increasing effective cloud coverage. This finding confirms that microwave remote sensing’s superior penetration capability effectively mitigates cloud contamination effects on SIF predictions. However, microwave data typically offer lower spatial resolution than optical data, limiting the spatial detail in SIF predictions. For instance, in the current dataset, the microwave vegetation index has a spatial resolution of 0.25°, whereas the optical vegetation index provides a finer resolution of 0.05°. Consequently, applications requiring high spatial resolution should employ optical vegetation index-based methods for SIF prediction, while areas with substantial cloud cover would benefit from microwave vegetation index-based methods for enhanced accuracy.
Aug. 18, 2025Vol. 45 Issue 15 1501001 (2025)
Yujie Wu, Conghui Li, Yong Zhu, and Jie Zhang
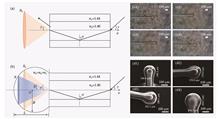
ObjectiveOne key point in the preparation of optical fiber surface-enhanced Raman spectroscopy (SERS) probes is the enrichment of metal nanoparticles on the fiber end face. When using self-assembly methods to enrich metal nanoparticles, it is necessary to soak the fiber in a solution to deposit the metal particles, which requires a relatively long time, typically 1?2 h. In addition, photolithography methods involve high equipment costs. To reduce both time and experimental costs, we propose the use of laser-induced metal deposition technology. Laser-induced metal deposition, a method that has become relatively popular in recent years, enables rapid and controllable enrichment of metal particles on the fiber end face. To address the fragility of tapered fibers, a more robust spherical-tip fiber is fabricated. The spherical-tip structure overcomes the evanescent field limitations of traditional planar optical fibers and achieves synergistic optimization of spatial light field compression and electromagnetic enhancement through curvature tuning. By controlling the gradient distribution of silver nanoparticles during the laser-induced deposition process, an Ag NP aggregation zone is formed at the apex of the sphere, effectively increasing the density of hot spots.MethodsIn this paper, spherical-tip optical fibers with controllable radii are prepared using a fusion splicer via a melting process. Fibers with radii of 70, 80, 90, and 100 μm are fabricated by adjusting the discharge time and intensity. Uniformly shaped silver nanoparticles are synthesized using a chemical reduction method. A 532 nm laser is then introduced into the prepared spherical-tip fibers, and via laser-induced deposition methods, silver nanoparticles are enriched at the fiber tip, forming the spherical-tip fiber-optic SERS probe. Scanning electron microscopy (SEM) is used to characterize the morphology and size of the probes with different tip radii. A confocal Raman microscope is employed to optimize the Raman characteristic parameters (radius R, cycle number N, and evaporation time t2) and to perform Raman measurements. Moreover, COMSOL software is used to model and simulate the spherical fiber tip, and radius parameters are simulated and analyzed.Results and DiscussionsWe demonstrate that spherical-tip fibers with controllable radii can be prepared via a simple melting method (Fig. 1). The spherical-tip fiber-optic SERS probe shows favorable Raman performance. The maximum electric field at the tip increases initially and then decreases as the radius increases. At a radius of 80 μm, the maximum electric field intensity reaches 27 V/m (Fig. 3). Through optimization of R, N, and t2, the Raman response of the spherical-tip fiber is enhanced (Fig. 4). The optimized probe achieves a detection limit for R6G as low as 10-10 mol/L. Tests with multiple fibers demonstrate that the prepared optical fiber SERS probe has good stability, with a relative standard deviation (dRSD) of 12.2%. In addition, the probe detects multiple molecules (MG, CV, R6G) and real-world molecules (uric acid), confirming its practical application (Fig. 5).ConclusionsWe present a high-performance SERS probe based on a spherical-tip optical fiber. Efficient fabrication is achieved by combining the melting method with a simplified laser-induced nanoparticle self-assembly process. The probe demonstrates excellent sensitivity, achieving a detection limit as low as 10-10 mol/L and strong enhancement capability, with an analytical enhancement factor of 2.07×10⁸ for R6G detection. The spherical geometry enhances the coupling between the localized surface plasmon resonance (LSPR) of silver nanoparticles and the light field through total internal reflection, increasing both light field energy density and the distribution intensity of hot spots. The probe also demonstrates good stability (dRSD=12.2%) and effective detection of malachite green, crystal violet, and uric acid, validating its utility in multiplexed analysis under complex conditions. Future work will focus on two directions: 1) development of a controllable self-cleaning probe structure to improve long-term stability and reusability via surface chemical modification or photocatalytic design; 2) optimizing the laser-induced nanostructure assembly process by integrating a machine learning-driven parameter control strategy to push the limits of single-molecule detection and expand its application in in vivo biosensing.
Aug. 07, 2025Vol. 45 Issue 15 1504001 (2025)
Henglei Ren, Wei Jia, Hailiang Dong, Kaida Jia, Rui Wang, Pengqi Dong, and Bingshe Xu
ObjectiveThe p-n junction ultraviolet (UV) photodetectors based on wide bandgap semiconductor materials demonstrate advantages including low energy consumption, rapid response, and high responsivity, enabling applications in fire warning, ozone detection, and missile tracking. Gallium oxide (Ga2O3), a next-generation semiconductor material, exhibits excellent thermal stability and an optical bandgap ranging from 4.4 to 5.2 eV, enabling strong UV light absorption. Its inherent oxygen defects provide n-type conductivity properties, although achieving stable p-type conductivity remains a technical challenge. Gallium oxide (GaN), another wide bandgap material, exhibits high carrier mobility and superior thermal stability, with well-established p-type doping technology. The combination of Ga2O3 and GaN forms a heterojunction interface characterized by minimal lattice mismatch and low conduction band offset. These properties establish Ga2O3/GaN heterojunction as an optimal material for UV photodetector fabrication. While significant advances have been achieved in aspects of the preparation and UV detection performance of porous Ga2O3/GaN heterojunctions, the oxidation mechanism of various porous GaN films and their influence on heterojunction detection performance remain unclear, which is essential for developing high-performance photodetectors. This research initially employs UV-assisted electrochemical etching to fabricate porous GaN films in different electrolytes, followed by high-temperature oxidation to produce porous Ga2O3/GaN heterojunctions. The study compares and analyzes the oxidation mechanism of different porous GaN films and the detection performance of Ga2O3/GaN heterojunctions.MethodsThe p-GaN epitaxial wafer is initially cut into 10 mm×5 mm segments. These segments undergo sequential ultrasonic cleaning in isopropanol, acetone, and deionized water for 15 minutes each, followed by nitrogen gas drying. The cleaned p-GaN film serves as the anode, with a platinum plate as the cathode. Under UV light irradiation, porous GaN films are prepared through 10-minute etching at 10 V using NaCl, NaNO3, and NaOH solutions as electrolytes. The three porous GaN films undergo thermal oxidation in a quartz tube furnace for 120 minutes at 900 ℃, maintaining an oxygen flow rate of 1.5 L/min. Following oxidation and furnace cooling, the porous Ga2O3/GaN heterojunctions are completed. A portion of the Ga2O3 film is removed using hot phosphoric acid to expose the underlying GaN layer, and circular Ag/In contact electrodes are deposited on the Ga2O3 and GaN film areas via DC magnetron sputtering, completing the porous Ga2O3/GaN heterojunction detector (Fig. 1). Scanning electron microscopy characterizes the microstructures of the porous GaN films and porous Ga2O3/GaN heterojunctions. X-ray diffractometer analysis examines the crystalline structures of the porous Ga2O3/GaN heterojunctions. Room-temperature Raman spectral measurements utilize a Raman spectrometer. An Ultraviolet-Visible-Near Infrared Spectrophotometer tests the optical properties, while a semiconductor parameter analyzer collects and analyzes the detector’s electrical signals.Results and DiscussionsThe Ga2O3 films formed through thermal oxidation of porous GaN films maintain a three-dimensional porous structure, with an irregular interface between the Ga2O3 and GaN films due to lattice structure differences. The porous Ga2O3/GaN heterojunctions prepared via etching in NaCl, NaNO3, and NaOH solutions followed by oxidation exhibit average pore sizes of 28.6, 36.7, and 41.3 nm, respectively, with corresponding Ga2O3 layer thicknesses of 269, 327, and 502 nm. The enhanced thickness of the Ga2O3 film correlates with the increasing pH value of the etching solution, where holes and OH? ions jointly facilitate the GaN film oxidation process, resulting in porous GaN films with larger pore sizes and higher pore densities. This configuration provides additional oxidation sites, yielding a thicker Ga2O3 layer (Fig. 2). XRD and room-temperature Raman spectra reveal characteristic peaks corresponding to β-Ga2O3 films, confirming their formation during thermal oxidation. The GaN (001) plane predominantly transforms into the β-Ga2O3 (-201) plane during this process. Peak intensity variations reflect the thickness changes of the Ga2O3 layer in the Ga2O3/GaN heterojunction (Fig. 3). The porous Ga2O3/GaN heterojunction prepared through NaOH solution etching and subsequent oxidation demonstrates enhanced UV light absorption capacity, attributed to its larger pore size and complex microcavity structure, which effectively restrict photon escape and extend the light transmission path (Fig. 4). This heterojunction exhibits superior light absorption capability and increased Ga2O3 layer thickness, resulting in enhanced photocurrent while maintaining low dark current. Under 0 V bias, the heterojunction maintains a dark current of 0.22 nA. The photo-to-dark current ratio under 254 nm UV illumination achieves 10520, with a responsivity of 108.4 mA/W, an external quantum efficiency of 52.9%, a detectivity of 1.36×10¹² Jones, and a response time of 0.35 s/0.13 s. The device exhibits consistent stability during continuous on-off light cycling (Figs. 6 and 7).ConclusionsIn summary, porous Ga2O3/GaN heterojunctions were successfully fabricated on porous GaN films through etching with NaCl, NaNO3, and NaOH solutions utilizing thermal oxidation methodology. The heterojunction prepared via NaOH solution etching and subsequent oxidation demonstrated optimal detection performance. Under 0 V bias, the device achieved a dark current of 0.22 nA, a photo-to-dark current ratio exceeding 104 under 254 nm UV illumination, a responsivity of 108.4 mA/W, an external quantum efficiency of 52.9%, a detectivity of 1.36×10¹² Jones, and a response time of 0.35 s/0.13 s. The exceptional detection performance stems from the large pore size and complex microcavity structure of the heterojunction, which effectively restrict photon escape and extend the light transmission path, enhancing UV light absorption. Furthermore, the porous GaN film etched in NaOH solution exhibits higher average pore size and pore density, providing additional oxidation sites and yielding a thicker Ga2O3 layer post oxidation. The increased intrinsic resistance of the thicker Ga2O3 layer reduces dark current, enhancing overall device performance. This research contributes significantly to the advancement and application of high-performance Ga2O3/GaN heterojunction photodetectors.
Aug. 18, 2025Vol. 45 Issue 15 1504002 (2025)
Zhan Shen, Lu Cai, Gang Yang, and Shen Liu
ObjectiveAs a non-contact and highly sensitive monitoring method, optical fiber curvature measurement is widely applied in structural health monitoring, environmental sensing, and other fields. However, traditional optical fiber speckle pattern analysis methods face issues of insufficient information extraction and low measurement accuracy when dealing with large curvatures or complex environments, which limits the widespread application of optical fiber sensing technology. Previous research has explored the use of single-mode to multimode fiber structures, as well as the optimization of image processing algorithms, but these methods have relatively high requirements for camera resolution and light sources. Deep learning algorithms can improve anti-interference capability and prediction accuracy when they are introduced into optical fiber sensing technology. We proposed a high-precision curvature measurement method based on the VggNet 16 model and specialty optical fiber speckle patterns. By designing a single-mode-multimode-specialty optical fiber structure and utilizing deep learning technology, the accuracy and anti-interference capability of optical fiber curvature measurement have been significantly improved.MethodsFirst, a single-mode-multimode-specialty optical fiber structure is designed, in which the multimode fiber increases the mode field diameter, while the dual-core single-side hole fiber excites asymmetrically distributed modes, enhancing the information content of speckle patterns and improving curvature measurement accuracy. The single-mode fiber serves as the signal input channel, ensuring high fidelity of the signal source and avoiding intermodal dispersion. The multimode fiber supports multiple transmission modes, laying the foundation for complex interactions. The specialty fiber section promotes optical field redistribution and strong coupling between modes, enhancing the complexity of the light spot morphology and increasing the response sensitivity to stress and curvature changes. Then, an automated experimental platform is established. A device is constructed that automatically provides curvature variations, automatically changes the degree of fiber bending, and saves the speckle patterns along with curvature labels. The experimental platform consists of a coherent light source, fiber optic sensing structure, complementary metal-oxide-semiconductor (CMOS) camera, three-dimensional displacement stage, stepper motor, and host computer. A 632.8 nm laser from a He-Ne laser source is coupled into the single-mode fiber through a collimating mirror and then coupled into the multimode fiber through mode mismatch, exciting multiple conduction modes. After passing through the multimode-specialty fiber fusion point, the various modes are coupled into the asymmetric dual-core off-center hole fiber, where coupling and interference occur. The superimposed optical field is focused and magnified by a lens, and finally, the speckle pattern is captured by a CMOS camera. After collecting and processing a large dataset, we conduct tests using the VggNet 16 classification model. Analysis of prediction errors reveal that the model will misidentify speckle patterns with similar curvatures, rather than making chaotic or random misjudgments, indicating that the speckle patterns presented by this fiber structure have a correlation when curvatures are similar. Subsequently, the dimension of the final output layer of the VggNet 16 model is adjusted to train a regression model, and its performance and accuracy are compared with traditional algorithms.Results and DiscussionsThe combination of specialty optical fiber and the VggNet 16 model achieves extremely high prediction accuracy on the test set, with 100.00% of samples having an error less than 0.1 m-1, 97.03% of samples having an error less than 0.07 m-1, and 96.04% of samples having an error less than 0.05 m-1. The mean square error (MSE) of the prediction is 5.877×10⁻⁴ m-2,and the root mean square error (RMSE) is 2.424×10⁻² m-1. The prediction results are then compared with typical structures and traditional algorithms. First, Fig. 14 reveals that traditional algorithms will make misjudgments in cases where timestamps are similar. Fig. 15 compares typical optical fiber structures with the structure designed in this paper, showing that the addition of specialty optical fiber improves this phenomenon, specifically by reducing the numerical differences in feature indicators at the same curvature. Fig. 18 compares the VggNet 16 model with the ResNet 50 model, and the results indicate that VggNet 16 performs better under certain error thresholds, especially when the error is less than 0.05 m-1 and 0.1 m-1, where VggNet 16 has higher accuracy. Therefore, the superiority of VggNet 16 in curvature sensing has been verified, and the advantages of the optical fiber structure have been further enhanced on the foundation of deep learning.ConclusionsThe stress measurement sensing method for specialty optical fiber structures based on the VggNet 16 model proposed in this paper can improve the accuracy and stability of curvature measurement. By comparing the performance between different optical fiber structures, as well as various traditional algorithms and deep learning algorithms, this method has been verified to demonstrate superior measurement performance across different curvature ranges and achieve high-precision regression prediction of curvature values. Through the use of various gradient-weighted class activation mapping techniques for activation area visualization analysis, the key regions focused on by the VggNet 16 model during the prediction process are revealed, enhancing the model’s interpretability and reliability. Simultaneously, the designed single-mode-multimode-specialty optical fiber structure effectively increases the information content of the speckle images, improving the performance of curvature measurement. The automatic curvature setting device designed in the experiment greatly reduces experimental costs and provides support for future research on optical fiber curvature detection methods. Future research can further explore model optimization strategies and the application of these technologies in other related fields.
Aug. 15, 2025Vol. 45 Issue 15 1506001 (2025)
Yuanzhen Liu, Liqiang Zhang, Shijie Ren, Yuman Suo, Yicun Yao, and Minghong Wang
ObjectiveHigh-sensitivity strain sensors play a crucial role in various fields such as aerospace engineering, structural health monitoring, human healthcare, and motion tracking. Over the past few decades, a wide range of optical strain sensors have been developed using different methods and structures. However, many of these sensors require costly equipment or specialized optical fibers, increasing both expense and fabrication complexity. In recent years, the Vernier effect has attracted significant attention due to its ability to substantially enhance the sensitivity of various optical fiber sensors. A typical Vernier-effect-based fiber sensor consists of two interferometers with similar free spectral ranges (FSRs). A minor spectral shift in one interferometer leads to a pronounced shift in the superimposed spectrum, which significantly improves the sensitivity by several orders of magnitude. Various Vernier-effect-based sensor structures have been proposed for measuring physical parameters such as temperature, refractive index, displacement, and strain. However, traditional fiber-optic sensors often rely on broadband light sources, resulting in low optical transmission power and wide 3 dB bandwidths, which compromise sensing accuracy. If a light source with higher power and a narrower 3 dB bandwidth is used, sensing accuracy can be significantly improved. Fiber laser sensors offer a promising solution to these limitations. In such systems, the sensing element acts as a filter, and its central wavelength determines the operating wavelength of the laser. Changes in external conditions lead to a shift in the central wavelength of the filter, which in turn alters the operating wavelength of the laser. While the integration of the Vernier effect with fiber laser sensing has enhanced the performance of strain sensors, challenges such as limited stability and high temperature cross-sensitivity remain. To address these limitations, we propose a high-sensitivity fiber laser strain sensor based on a Vernier effect filter.MethodsThe core of the proposed sensor is a Vernier-effect-based filter composed of two cascaded Mach-Zehnder interferometers (MZIs), where one functions as the reference arm and the other as the sensing arm. The FSRs of the two MZIs are matched by carefully adjusting the length difference between the arms, ensuring the generation of a Vernier effect. When external stress causes a change in the optical path of the sensing MZI, the laser’s central wavelength experiences a significant shift, enabling high-sensitivity strain detection.Results and DiscussionsThe sensing MZI is stretched in increments of 72 nm, corresponding to a strain change of 0.72 με. As strain increases, the peak wavelength of the laser shifts accordingly. Within the strain range of 0?3.6 με, the sensor exhibits a sensitivity of 4.15 nm/με (Fig. 6). In repeatability tests, the maximum deviation in strain sensitivity across four experiments is 0.023 nm/με (Fig. 6). During a 1-h stability test, the wavelength drift remains between 0.04 nm and 0.06 nm (Fig. 7). After temperature compensation, the temperature sensitivity is 0.097 nm/℃, and the temperature cross-sensitivity is 0.023 με/℃(Fig. 9).ConclusionsWe present a high-sensitivity strain fiber laser sensor based on a Vernier effect filter, which comprises two cascaded MZIs serving as reference and sensing arms. The FSR of the two MZIs is closely matched to generate a Vernier effect. By integrating the Vernier effect filter into a ring fiber laser, the sensor achieves a high strain sensitivity of 4.15 nm/με over a range of 0?3.6 με. The system also shows excellent repeatability, with a maximum strain deviation of 0.023 nm/με across four trials, and good stability, with a wavelength drift of only 0.04?0.06 nm over 1 h. After temperature compensation, the temperature sensitivity reaches 0.097 nm/℃, and the temperature cross-sensitivity is 0.023 με/℃. To the best of our knowledge, this sensor demonstrates the highest strain sensitivity among reported MZI-based fiber sensors. By leveraging the inherent advantages of fiber lasers, the proposed sensor exhibits excellent repeatability and stability, making it highly suitable for applications across a wide range of fields.
Aug. 15, 2025Vol. 45 Issue 15 1506002 (2025)
Tengxiao Zhang, Yang Qiu, Bo Ye, and Jing Xu
ObjectiveUnderwater wireless optical sensor network (UWOSN) represents a vital technology for high-speed, low-latency underwater data transmission, supporting applications from environmental monitoring to underwater exploration. The performance of UWOSN critically depends on the accuracy of node localization. The underwater environment introduces distinct challenges, including node mobility due to ocean currents, severe signal attenuation, and energy constraints, which complicate precise localization. Although existing dynamic localization algorithms have advanced the field, they frequently struggle to address the unpredictability of node movement and environmental effects on signal propagation. This paper presents a novel dynamic localization algorithm based on optimal anchor node combination selection (DLOS) to address these challenges. The proposed DLOS algorithm combines advanced optimization techniques and machine learning to improve localization accuracy and success rate in dynamic underwater conditions.MethodsThe proposed DLOS algorithm incorporates four key innovations. First, it introduces a comprehensive fitness function to evaluate anchor node combinations by simultaneously considering three critical factors: position uncertainty, residual energy, and geometric coplanarity. This multi-criteria approach ensures the selection of anchor nodes that are both reliable and energy-efficient. Besides, the proposed DLOS algorithm employs an improved Lévy flight-based grey wolf optimizer (LGWO) to efficiently search for the optimal anchor combination. The LGWO is enhanced with a nonlinear distance control parameter and a good-point-set initialization method to improve convergence speed and avoid local optima. Additionally, the proposed DLOS algorithm incorporates a random forest-based dynamic ranging model to handle time-varying parameters such as trajectory angle and optical signal attenuation. This model is trained on extensive datasets to predict accurate distance measurements despite environmental fluctuations. To further enhance performance, by employing a hybrid localization approach that integrates time difference of arrival (TDOA) and received signal strength (RSS) ranging techniques, the proposed DLOS algorithm effectively mitigates localization errors induced by clock asynchrony. Based on the above key innovative methods, the proposed DLOS algorithm effectively increases localization accuracy and localization success rate in despite of node mobility.Results and DiscussionsThe performance of the proposed localization algorithm DLOS is verified by simulations. In order to visually validate the performances of the proposed DLOS algorithm, the M-RSS algorithm, the LLSH algorithm, the RSS/KF algorithm, and the DLNS algorithm are selected as the compared algorithms. The proposed DLOS algorithm shows an obvious improvement in localization accuracy compared to the other four algorithms across varying numbers of anchor nodes (Fig. 7). Evidently, the DLOS algorithm leverages its optimal-anchor-combination selection mechanism for global search and rapid convergence, identifying the most suitable anchor combination. This significantly shortens localization time and reduces localization errors. As the ranging noise variance gradually increases from 0 to 1, the proposed DLOS algorithm outperforms the other four compared algorithms in RMSE (Fig. 8). In UOWSNs, both anomalous ranging values and amplified noise variance can affect the overall accuracy of position estimation. The DLNS and the DLOS algorithms consider the impact of noise on distance measurements. They utilize a random forest model to process each input data instance, ultimately yielding excellent distance values. Specifically, the localization accuracy of the DLOS algorithm, which incorporates the anchor node selection mechanism, significantly surpasses that of the DLNS algorithm. This is mainly because the anchor node selection mechanism can alleviate the generation of abnormal distance measurement. As the node communication radius varies, the proposed DLOS algorithm maintains lower RMSE compared to the other four algorithms (Fig. 9). This is attributed to the fact that the anchor node selection mechanism in the DLOS algorithm considers both remaining energy and node mobility, thereby reducing the impact of increased energy consumption caused by enlarging node communication radius on localization accuracy. The proposed DLOS algorithm exhibits the lowest RMSE with diverse attenuation coefficient compared to the other four algorithms (Fig. 10). This phenomenon mainly results from the fact that the mentioned algorithms all employ the RSS ranging technology, making their localization accuracy heavily depend on the extent of underwater signal path loss. As for the DLOS and DLNS algorithms, they use the variation of attenuation coefficient as input to the random forest model and train an effective model to predict the precise distance values between nodes. Additionally, the DLOS and DLNS algorithms integrate both RSS and TDOA ranging, alleviating the limitations of solely relying on RSS ranging, resulting in smoother error curves. The proposed DLOS algorithm outperforms the other four algorithms in localization success rate with different number of simulation times (Fig. 11). This can be attributed to the fact that the DLOS algorithm incorporates an optimal-anchor-combination selection mechanism based on an improved LGWO and employs the random forest model to reduce dynamic ranging errors. This enables the DLOS algorithm to maintain the highest localization success rate in the five algorithms.ConclusionsThis paper presents a dynamic localization algorithm based on optimal anchor combination selection, namely DLOS, for UOWSN. Through the implementation of a novel optimal anchor node combination strategy utilizing a comprehensive objective function and an improved LGWO, the proposed DLOS algorithm enhances localization accuracy and success rate. Furthermore, considering the stochastic mobility of underwater nodes and optical wave attenuation characteristics, a dynamic localization model based on random forest is incorporated to improve accuracy and success rate. The proposed DLOS algorithm also implements a hybrid localization strategy based on TDOA and RSS ranging approaches to minimize localization errors caused by clock asynchrony. Simulation results confirm that the proposed DLOS algorithm achieves superior performance in localization accuracy and success rate compared to the four reference algorithms.
Aug. 08, 2025Vol. 45 Issue 15 1506003 (2025)
Optical Generation and Time-Frequency Reconstruction of Wideband Frequency-Modulated Radar Waveforms
Lin Zhao, Jing Li, Miaoxia Yan, Cheng Tian, Li Pei, and Tigang Ning
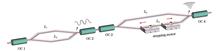
ObjectiveReconfigurable broadband linear frequency-modulated (LFM) signals are essential for modern radar systems to achieve high-resolution target detection and reliable operation in complex electromagnetic environments. Existing photonic approaches encounter significant limitations: conventional electronic methods (high-speed AWGs, ≥256 GSa/s) face difficulties balancing >10 GHz bandwidth with real-time parameter tuning, while photonic techniques such as spectral stitching or photon-assisted frequency multiplication necessitate hardware reconfiguration, restricting software-defined adaptability. Current solutions typically depend on expensive ultra-high-speed electronics or complex optical components, impeding practical implementation. Modern applications—including cognitive radar for dynamic spectrum sharing, adaptive electronic warfare for anti-jamming, and joint spectrum sensing—require agile waveform control across bandwidth, center frequency, and time-frequency patterns, which current methods cannot adequately provide. This study introduces a novel optical LFM generation scheme utilizing fiber nonlinearity and low-speed AWGs (≤10 GSa/s). Through self-phase modulation (SPM) in highly nonlinear fibers (HNLFs), broadband signal processing transitions to the optical domain, enabling software-defined dynamic adjustment of key parameters—bandwidth (4?8 GHz), center frequency (20?30 GHz), and waveform duration—through basic electrical signal modifications. This research presents a cost-effective, simplified hardware solution bridging photonic processing and electronic stability. It enables next-generation radar systems with real-time reconfigurability, suitable for civilian-military integrated applications including 5G/6G beamforming, autonomous vehicle perception, and intelligent electronic countermeasures.MethodsThe proposed system comprises two optical paths (Fig. 1). In the upper path, a low-speed AWG generates electrical shaping signals to intensity-modulate an optical carrier via a dual-drive Mach-Zehnder modulator (DD-MZM). The modulated optical signal is amplified and fed into a highly nonlinear fiber (HNLF) for spectral broadening via SPM. The lower path employs a dual-parallel MZM (DP-MZM) to generate a frequency-shifted optical carrier. The spectrally broadened signal and the shifted carrier are then heterodyned at a photodetector to produce the LFM waveform. Key parameters—bandwidth, center frequency, and duration—are controlled by adjusting the AWG’s driving signal, peak optical power, and frequency shift. Simulations in MATLAB and OptiSystem validate the scheme’s performance under varying conditions (Table 2).Results and DiscussionsSimulations demonstrate that a 10 GSa/s AWG produces an 8 GHz bandwidth LFM signal centered at 30 GHz with high linearity [Fig. 4(f)]. Lower sampling rates (1 GSa/s) reduce frequency linearity [Fig. 4(c)], while higher rates (20 GSa/s) provide no substantial improvement [Fig. 4(i)]. Modifying the peak optical power (1?2 W) or AWG signal period (5?10 ns) enables bandwidth tuning from 4 GHz to 8 GHz [Figs. 5(c)?(f)]. Adjusting the frequency shift modifies the center frequency [20 GHz to 30 GHz, Fig. 5(a)]. Through specialized electrical driving signals, the system generates LFM waveforms with time-frequency diagrams representing arabic numerals 1?5 [Fig. 6(d)]. This illustrates the system’s capability for arbitrary waveform design, essential for adaptive radar and electronic warfare applications.ConclusionsThis study presents a highly reconfigurable LFM signal generation scheme based on optical nonlinear effects. By exploiting SPM in HNLF and low-speed AWGs, the method achieves continuous control over bandwidth (4?8 GHz), center frequency (20?30 GHz), and waveform envelope without hardware reconfiguration. Key advantages include reduced reliance on high-speed electronics, software-defined flexibility, and compatibility with mainstream radar frequency bands. The scheme offers a cost-effective solution for software-defined radar systems, cognitive electronic warfare, and adaptive spectrum sensing, bridging the gap between photonic processing and electronic stability. Future work will focus on experimental validation and extending the bandwidth beyond 10 GHz.
Aug. 18, 2025Vol. 45 Issue 15 1507001 (2025)
Tiehua Zhang, Bing Han, Meng Lian, and Tun Cao
ObjectiveThe rapid advancement of direct and indirect reconnaissance technologies with wide-area and full-spectrum coverage has exposed limitations in traditional digital camouflage methods. Current camouflage techniques primarily rely on background color distribution, achieving initial concealment but lacking precise target edge feature perception. This deficiency results in visible target contours and inadequate environmental integration, compromising camouflage effectiveness. Consequently, the accurate perception of target edges and generation of seamlessly integrated digital camouflage images has emerged as a critical challenge. This study addresses these limitations by proposing an adaptive digital camouflage generation method based on deep learning. The approach combines the you only look once version 8 (YOLOv8) object detection algorithm with resolution-robust large mask inpainting with Fourier convolutions (LAMA), establishing a comprehensive closed-loop pipeline from target perception to camouflage generation. The effectiveness of the proposed method is evaluated against existing approaches using three objective metrics: structural similarity index (SSIM), peak signal-to-noise ratio (PSNR), and mean squared error (MSE). Experimental results indicate that the proposed method effectively processes target edge regions and generates digital camouflage images that achieve superior background integration.MethodsThis study presents an adaptive digital camouflage image generation algorithm leveraging deep learning capabilities. The algorithm automatically generates digital camouflage images that closely match the surrounding environment based on acquired background images, enabling target concealment in the visible spectrum. The methodology employs the YOLOv8 deep learning model for target object detection and mask generation, establishing the foundation for edge-aware camouflage processing. To overcome limited training data constraints, the YOLOv8 training process incorporates a few-shot learning strategy to enhance detection accuracy. The target mask and background image are subsequently processed through the digital camouflage generation network, which perceives target edge features while extracting background texture and semantic information through deep learning. Furthermore, a single-objective optimization algorithm refines the YOLOv8-generated target mask, facilitating the production of digital camouflage images with enhanced texture, color, and structural consistency with the background.Results and DiscussionsThe performance evaluation of the proposed method involved comparison with six representative baseline methods, all applied to identical target objects (Fig. 7). Traditional approaches demonstrate inadequate perception of target color space information and environmental edge characteristics, resulting in poor spatial localization of color distribution. Consequently, the target region remains visually distinct, yielding low fusion quality in the generated camouflage image. While deep learning-based methods show improved fusion, they are hindered by excessive edge sharpness that compromises camouflage effectiveness. The proposed method successfully addresses target edge regions, producing camouflage images with markedly enhanced background integration. Quantitative assessment employed three established image quality metrics—SSIM, PSNR, and MSE. Higher SSIM and PSNR values, coupled with lower MSE, indicate superior visual similarity and background integration. Statistical analysis of the results, expressed as mean±standard deviation (xMean±xStd), demonstrates that the proposed method achieves an average SSIM increase of 0.028, PSNR improvement of 0.14 dB, and MSE reduction of 1.14, confirming its superior performance. Additional experiments conducted across diverse background scenarios (Figs. 8?10) demonstrate consistent production of high-quality camouflage images, validating the method’s robustness and broad applicability.ConclusionsThis paper presents a deep learning-based optical adaptive digital camouflage generation method to address the limitations of traditional approaches, particularly their inadequate perception of target edge features and subsequent poor background integration. The proposed methodology encompasses two primary stages: target detection and camouflage image generation. The approach implements data augmentation techniques to enhance YOLOv8 detection network generalization, followed by the LAMA image inpainting algorithm for high-quality digital camouflage image generation through target mask optimization. Performance evaluation utilizes objective metrics including SSIM, PSNR, and MSE. Experimental results demonstrate superior performance across all objective evaluation metrics compared to conventional methods, with improvements of 0.028 in average SSIM, 0.14 dB in PSNR, and a reduction of 1.14 in MSE. Additional experiments across varied environmental backgrounds confirm the method’s robustness and general applicability.
Aug. 08, 2025Vol. 45 Issue 15 1510001 (2025)
Sicheng Jiang, Xiaodong Chen, Huaiyu Cai, and Yi Wang
ObjectiveThe limited depth-of-field (DoF) in optical imaging systems poses a fundamental challenge in digital photography, making it difficult to capture all scene elements in sharp focus simultaneously. Multi-focus image fusion (MFIF) addresses this limitation by integrating multiple images with varying focus regions into a single all-in-focus image. Traditional MFIF methods typically follow a sequential “match-then-fuse” paradigm, which is susceptible to artifacts caused by imperfect registration, particularly in stereo scenarios with significant disparities. While deep learning-based methods have improved upon traditional techniques, they mostly target monocular cases and often struggle with large-scale content mismatches caused by stereo disparities or dynamic scene changes. In this paper, we tackle the more general and challenging scenario of stereo multi-focus image fusion, where issues such as lens breathing, defocus spread effects (DSE), and inter-view disparities further complicate content alignment and information preservation. The two primary goals are: 1) to achieve robust stereo matching that accommodates large disparities without explicit image registration, and 2) to ensure high-quality fusion that retains both local details and global semantic coherence. By addressing these challenges, the proposed method enhances the applicability of MFIF in critical fields such as microscopic imaging, industrial inspection, and security surveillance, where stereo vision systems are increasingly used but existing fusion methods often fall short.MethodsThe proposed framework incorporates several key innovations to meet the demands of stereo multi-focus fusion. Central to the design is a novel asymmetric network architecture that explicitly separates processing into primary and secondary branches, breaking away from traditional symmetric structures. The primary encoder, based on ResNet-101, extracts fine-grained local details using a multi-scale feature pyramid (Conv 1?Conv 4). Meanwhile, the secondary encoder leverages a Vision Transformer (ViT-B/16) to capture global context by dividing input images into 16×16 patches and encoding them into 768-dimensional token vectors. This dual-path structure enables the model to simultaneously preserve fine details and global coherence. A key innovation is the disparity-aware matching module, inspired by the querying Transformer (Q-Former)’s modality alignment capabilities. This module consists of six stacked matching blocks, each incorporating self-attention and cross-attention layers. Learnable queries facilitate feature alignment between the two branches, supporting stereo matching without explicit registration. The module is trained using a hybrid loss function that combines matching loss and feature reconstruction loss, with differentiated treatment for positive and negative sample pairs. The fusion module adopts cross-attention mechanisms to compare and selectively integrate sharp features from both branches. Unlike the matching module, it treats both streams symmetrically and uses residual learning to blend high-frequency details and inconsistent content. A U-Net-based decoder with skip connections reconstructs the final all-in-focus image. The end-to-end uses a composite loss comprising matching loss, fusion loss, multi-scale reconstruction loss, and a perceptual anti-artifact loss based on the learned perceptual image patch similarity (LPIPS) metric. The training dataset includes synthetic datasets (NYU-D2 and InStereo2K with simulated defocus) and real-world datasets (Lytro and Middlebury 2014), with a balanced emphasis on monocular and stereo tasks.Results and DiscussionsExtensive experiments validate the effectiveness of the proposed method. In monocular fusion tasks using the Lytro dataset, the method achieves state-of-the-art results, with a QAB/F score of 0.7894, a 0.021 improvement over the IFCNN baseline. The normalized mutual information (NMI) score of 1.1034 further confirms its strong capacity for transferring information from input images to the fused output (Table 1). In stereo fusion tasks on the Middlebury 2014 dataset, the method shows remarkable robustness to disparities. The artifact metric (NAB/F) drops to 0.0715, a 0.06 improvement over conventional methods, while maintaining high visual fidelity [visual information fidelity for fusion (VIFF) score of 0.9813]. These results validate the effectiveness of the Q-Former-inspired matching module in handling large content mismatches (Table 2). Qualitative comparisons (Figs. 9 and 10) reveal several key advantages: 1) In regions with abrupt DoF transitions, the method achieves smooth blending without halo artifacts; 2) In regions affected by DSE, it successfully reconstructs textures that other methods blur or miss; 3) In stereo cases with substantial disparity, it preserves sharp details and avoids ghosting effects common in registration-dependent approaches. Ablation studies (Table 3) show that removing the matching module degrades NAB/F by 0.08, confirming its importance for stereo tasks. Likewise, omitting the fusion module leads to a 0.027 drop in QAB/F, affirming its relevance to both monocular and stereo fusion. The asymmetric design also proves more effective than symmetric alternatives in addressing content mismatches.ConclusionsWe present a robust solution for stereo multi-focus image fusion, featuring several novel components. The asymmetric network structure balances local detail preservation with global context modeling. The Q-Former-inspired matching module establishes a new paradigm for handling stereo disparities without explicit registration. The cross-attention fusion mechanism effectively integrates complementary sharp features while suppressing artifacts. Experimental results across multiple benchmarks confirm that the proposed method outperforms existing approaches in both monocular and stereo settings. The framework’s robustness to content mismatches and ability to reconstruct missing details in defocused regions significantly expands the practical applicability of multi-focus fusion technology. Current limitations include computational demands from Transformer components and reduced effectiveness in extreme cases of content mismatch (e.g., full occlusion or severe motion blur). Future work will focus on 1) developing lightweight variants for real-time applications, 2) enhancing adaptability to extreme scene variations, and 3) exploring applications in multi-modal fusion and dynamic scene reconstruction. Overall, the proposed method offers a flexible and high-performance solution for advancing image fusion technologies in both academic and industrial applications.
Aug. 15, 2025Vol. 45 Issue 15 1510002 (2025)
Jia Lü, Mingkai Yu, Xin Chen, and Ling He
ObjectivePneumonia represents a respiratory disease with high incidence and mortality rates in childhood. The accurate segmentation of lung computed tomography (CT) images plays a crucial role in early diagnosis and treatment planning. The manual labeling of infected regions, however, is time-intensive and burdensome, significantly increasing radiologists’ workload. Therefore, developing efficient automatic segmentation methods holds substantial practical significance in alleviating medical resource constraints. Current predominant medical image segmentation approaches primarily utilize U-shaped architecture, known for its semantic modeling capabilities. However, the encoder-decoder structure inherently requires multiple down-sampling operations, resulting in the loss of critical spatial structure information and compromising segmentation accuracy. Furthermore, infected regions in childhood pneumonia CT images typically present with scattered and fragmented multifocal distribution patterns, demanding enhanced model capabilities for capturing long-distance dependencies and maintaining overall structural coherence. While Transformer-based segmentation networks have demonstrated strong performance in global modeling recently, their limited local spatial priors and patch size constraints often lead to inadequate local detail segmentation. Additionally, normal anatomical structures such as the lung hilum exhibit morphological similarities to infected regions, necessitating superior network anti-interference capabilities. To address these challenges, this study proposes a U-Net-based difference aware guided boundary Transformer segmentation network.MethodsDBTU-Net aims to enhance both local structural detail modeling and global semantic dependency modeling capabilities, enabling accurate segmentation of fragmented and scattered multi-focal regions. The network architecture builds upon the classical U-shaped structure, incorporating three key components: gated channel Transformer (GCT), difference aware fusion (DAF), and boundary Transformer (BT), as shown in Fig. 1. During the feature extraction phase, multi-scale semantic information is progressively extracted through multilayer convolution and down-sampling operations. To enhance the network’s context modeling capability, the GCT module (Fig. 2) is integrated into each encoder layer. This module dynamically models channel dependencies to adaptively adjust the importance distribution across different semantic channels, thereby strengthening global information perception. The DAF module is implemented in the skip connection path, explicitly enhancing spatial structure by computing difference information between adjacent encoder layer features. This mechanism mitigates spatial detail loss from down-sampling while providing the decoder with comprehensive structural priors, improving the model’s capacity to recognize small lesion regions. At the network’s bottleneck layer, the BT module (Fig. 3) further enhances global modeling capability. This module utilizes encoder multi-scale disparity maps for guidance, establishing potential connections between distant lesion regions through Transformer architecture, improving distant lesion recognition, and refining boundary segmentation while maintaining global consistency. The decoder ultimately produces a high-quality segmentation map through up-sampling operations.Results and DiscussionsExperimental analyses are conducted on a private childhood pneumonia CT dataset (Child-P) and two public COVID-19 CT datasets (COVID, MosMed) to validate DBTU-Net’s effectiveness. Eight ablation schemes were designed to evaluate the performance of three key modules: GCT, DAF, and BT. The results demonstrate that each module enhances network segmentation performance (Table 2), with the DAF module showing notable improvements of 8.21 percentage points, 12.34 percentage points, and 13.94 percentage points for Dice similarly coefficient (Dice), Jaccard index (JI), and sensitivity (SE) metrics, respectively, confirming its effectiveness in enhancing spatial detail expression, preserving structural information, and improving lesion integrity. Module combination experiments further validate the DAF module’s importance. Without DAF, retaining only GCT and BT leads to performance decreases of 1.09 percentage points and 0.99 percentage points in JI and SE metrics compared to the full model. The DAF and BT combination achieves 25.24 pixel in Hausdorff distance (HD) metrics while maintaining high comprehensive performance, demonstrating their synergistic effect on boundary detail extraction. In comparison experiments, DBTU-Net achieves optimal results across all five metrics on the Child-P dataset (Table 3), with Dice and JI reaching 89.61% and 81.17%, representing improvements of 8.17 percentage points and 12.48 percentage points over the baseline network, surpassing the suboptimal CASCADE network. Visualization results indicate DBTU-Net’s superior sensitivity in identifying scattered and tiny lesions, reducing missed segmentation and over-segmentation instances (Fig. 6). The decreased HD metrics demonstrate the model’s advantage in lesion boundary modeling, validating the effectiveness of cross-scale difference perception and boundary modeling mechanisms. On the COVID dataset, DBTU-Net leads in all five metrics, with JI, SE, and Matthews correlation coefficient (MCC) reaching 69.66%, 77.02%, and 81.04%, significantly outperforming U-Net++ in balancing lesion pixel identification and background differentiation (Table 4). On the MosMed dataset, despite slightly lower SE than TransDeepLab, DBTU-Net achieves optimal results in Dice, JI, and MCC metrics (Table 5), demonstrating robust lesion structure modeling. Visualization results show DBTU-Net’s advantage in reducing mis-segmentation and false positives, attributed to its contextual modeling mechanism integrating GCT and BT (Fig. 7). Multiple local detail visualizations confirm DBTU-Net maintains consistent segmentation in regions with blurred edges or irregular lesion morphology, validating its local segmentation accuracy and robustness under complex structures (Fig. 8).ConclusionsThis research focuses on childhood pneumonia segmentation. DBTU-Net addresses the limitations of traditional U-shaped networks in segmenting small, fragmented, and complex lesions due to spatial information loss and limited global feature extraction. The network enhances spatial structure expression by utilizing the DAF module to mine differential features between layers, while incorporating the BT module to guide high-level semantic information for boundary enhancement. This combination improves the modeling capability for distant lesions and local boundary segmentation accuracy, reducing mis-segmentation in complex lesion regions. Experimental results on the private childhood pneumonia dataset demonstrate DBTU-Net’s superior performance compared to existing mainstream methods across multiple evaluation metrics. Additionally, its strong performance on the public COVID-19 dataset validates the method’s generalization capabilities.
Aug. 08, 2025Vol. 45 Issue 15 1510003 (2025)
Xiyu Liu, Jun Wang, Quanying Wu, Junliu Fan, Baohua Chen, Zhixiang Li, and An Xu
ObjectiveSparse aperture optical systems consist of multiple sub-apertures. By optimizing the array structure and performing image restoration, the information obtained about the target object can be comparable to that of an equivalent single-aperture optical system, effectively addressing problems caused by increasing aperture size. However, since the light-transmitting area of a sparse aperture system is smaller than that of its single-aperture counterpart, it results in the loss of intermediate-frequency information, leading to issues such as blurred texture details and reduced image contrast. To address these problems, we combine polarization imaging with sparse aperture imaging.MethodsIn this paper, we propose a polarization image fusion method for sparse aperture optical systems. This process mainly includes the following steps: First, a Golay 3 polarization sparse aperture imaging system is built to capture polarization images at four different polarization angles. Second, these images are preprocessed to calculate the degree of linear polarization and the angle of polarization. Then, the polarization sparse aperture fusion network (PSAFNet) is used to fuse the polarization intensity image, the degree of linear polarization, and the polarization angle, integrating the polarization information into the intensity image and producing a more information-rich result. Next, intermediate-frequency regions of the full-aperture image, sparse-aperture image, and fused image are extracted. The Canny operator is applied to extract intermediate-frequency edges to compare the richness of intermediate-frequency information. Information entropy, standard deviation, and the multi-scale structural similarity index (MS-SSIM) are also used to evaluate PSAFNet and other fusion methods.Results and DiscussionsThe proposed PSAFNet method effectively alleviates the decline in intermediate-frequency information caused by the sparse aperture structure. In an indoor scene (Fig. 8), compared with the sparse aperture image, the fused image shows increases of 26.2%, 21.0%, and 27.0% in edge density, information entropy, and the number of connected regions, respectively (Fig. 9). In an outdoor scene (Fig. 12), the fused image shows corresponding improvements of 32.9%, 23.6%, and 16.6% (Fig. 13). Compared with other fusion methods, the proposed method performs better in indoor scenes (Fig. 10), with higher information entropy, standard deviation, and MS-SSIM (Table 1). The MS-SSIM of PSAFNet is close to 1, indicating higher similarity to the single-aperture image in contrast and structure, with lower image distortion. Compared with the sparse aperture image, the information entropy increases by 10.10%, and the standard deviation increases by 63.49%. In outdoor scenes (Fig. 14), the proposed method also surpasses other fusion methods, with information entropy increasing by 3.55% and standard deviation by 30.35% (Table 2).ConclusionsWe propose a polarization image fusion method, PSAFNet, for sparse aperture optical systems based on a deep learning network. The method extracts texture features from the polarization intensity image and the degree of linear polarization, as well as semantic features from the polarization intensity and polarization angle using an encoder. The fusion module uses spatial and channel attention mechanisms to enhance image details and preserve semantic information. In addition, edge features are extracted and fused with attention-enhanced features to further strengthen edge representation. Finally, combined deconvolution is used in the decoder to generate the fused image. To validate the performance of the method, polarization images are collected using the Golay 3 sparse aperture imaging system. Experimental results show that the algorithm achieves stable and optimal results in preserving texture detail and the overall image structure. Compared with sparse aperture images, the fused image contains more intermediate-frequency information, clearer contours, and richer texture details. The introduction of polarization information effectively addresses problems such as image smoothing and weakened textures due to intermediate-frequency loss. Compared with traditional fusion methods such as wavelet transform and PFNet, this method more effectively enhances texture details and contrast in sparse aperture.
Aug. 15, 2025Vol. 45 Issue 15 1510004 (2025)
Jing Wu, Rong Luo, Feng Huang, Zhewei Liu, and Yunyi Chen
ObjectiveImage dehazing represents a crucial research direction in low-level vision, aimed at restoring visibility and details in hazy images. This capability holds significant importance for applications including autonomous driving, surveillance systems, and remote sensing. While deep learning-based single-image dehazing algorithms have demonstrated notable advances in recent years, they continue to face adaptability challenges when processing real-world hazy scenes characterized by complex lighting conditions and diverse haze distributions. Traditional polarization-based dehazing methods demonstrate effectiveness in complex hazy environments, yet they frequently overlook the polarization degree of transmitted light and exhibit limited adaptability to global illumination changes, constraining their practical performance. Consequently, developing a more effective and adaptive image dehazing method that maximizes polarization information benefits while addressing existing methodological limitations remains essential.MethodsThis paper addresses these challenges by introducing a polarization-aware dual-encoder dehazing network that utilizes scene polarization information for image restoration. The network implements a dual-encoder architecture (Fig. 1), consisting of two parallel branches: convolutional neural networks (CNN) encoding and Transformer encoding. The CNN encoding branch captures local details and texture information, while the Transformer encoding branch processes long-range dependencies and global contextual information. Within the CNN branch, a multi-angular polarization aggregation (MAPA) module embeds distinct position encodings into multi-angular polarization information and performs compression. Subsequently, a dynamic large kernel (DLK) module extracts multi-scale polarization local features. The Transformer branch employs a retentive meet transformer (RMT) module to extract multi-scale global feature information and integrate fine local features from the CNN branch, enhancing the Transformer module’s local representation capability. An adaptive dynamic feature fusion (ADFF) module dynamically fuses features from different levels. The architecture concludes with a Transformer decoder that globally decodes the multi-level feature layers, progressively upsampling the resolution and restoring image details to produce the dehazed result.Results and DiscussionsThe experimental results demonstrate the algorithm’s superior performance in both objective evaluation metrics and visual quality. For comprehensive evaluation, this study employed parametric metrics including peak signal-to-noise ratio (PSNR), structural similarity (SSIM), and visibility index (VI), alongside non-parametric metrics such as natural image quality evaluator (NIQE) and blind/referenceless image spatial quality evaluator (BRISQUE), conducting assessments across multiple datasets (Table 1). On the IHP dataset, the method achieved optimal performance with PSNR, SSIM, and VI values of 22.54 dB, 0.8379, and 0.8669, respectively, surpassing the second-best results by 0.85 dB, 0.012, and 0.0161. The method achieved the highest PSNR on the Cityscapes-DBF dataset, exceeding FocalNet by 1.05 dB and ConvIR by 2.64 dB. The synthetic dataset’s use of coarse semantic segmentation maps for probabilistic filling resulted in average SSIM performance. In outdoor real-world scenes, the method achieved NIQE and BRISQUE scores of 12.83 and 40.28, ranking first and second respectively. Visually, the algorithm effectively removes haze while maintaining crucial scene details and color information (Figs. 6?8). Extensive ablation studies, documented in Tables 2?4, and Fig. 9, confirmed the effectiveness of the dual-encoder structure and key modules, showing decreased performance when using single-branch structures or removing key components.ConclusionsThis paper presents an advanced deep learning-based dehazing method for polarized images. The research introduces three innovative modules: MAPA, DLK, and ADFF, integrating CNN and Transformer features to construct a dual-encoder?single-decoder polarization dehazing network that estimates residuals for image restoration from four polarization states. This approach extends polarization-based dehazing applications, operating independently of prior knowledge while utilizing semantic and contextual information to address spatially varying scattering phenomena. The method demonstrates state-of-the-art performance on the IHP and Cityscapes-DBF datasets, with proven robustness in real outdoor environments. Current limitations include reduced effectiveness in processing hazy images containing sky regions, due to training dataset constraints. Future research will focus on dataset enrichment to enhance algorithm performance across diverse environments.
Aug. 08, 2025Vol. 45 Issue 15 1510005 (2025)
Zixiang Zhao, Bingzhen Li, Tao Lian, Xuan Liu, Li Li, and Lei Yan
ObjectiveLow-level-light night vision technology enables the generation of visible-light images that are clearly recognizable to the human eye under low-illumination conditions. An electron bombarded active pixel sensor (EBAPS) represents a vacuum-solid hybrid low-level-light imaging device that delivers exceptional performance in sensitivity, resolution, power efficiency, and compact design, making it valuable for low-light-level night vision applications. However, the imaging procedure introduces complex noise patterns. The electron bombardment process used for signal enhancement generates electron bombarded semiconductor (EBS) noise, characterized by spatially random distribution, multi-pixel aggregated clusters, and a diffuse pattern that gradually darkens from center to edges, manifesting as bright spots. While traditional denoising methods effectively address common Gaussian noise and salt-and-pepper noise that occur in solid-state imaging devices, they prove inadequate for EBS noise removal. Currently, effective methods for EBS noise removal remain limited. Previous attempts combining noise detection with median filtering yielded unsatisfactory results. Processing speed represents another critical factor in practical applications, with some complex algorithms requiring extensive processing time. Deep learning-based approaches show promise in handling unconventional EBS noise but face challenges in dataset construction, processing speed, and generalization capability. Therefore, we propose a Harris-guided adaptive switching median and bilateral filtering (HASMBF) algorithm for rapid and effective EBAPS image noise removal.MethodsThe proposed algorithm comprises three main components: EBS noise detection, adaptive switching median filtering, and bilateral filtering. The Harris corner detector demonstrates effectiveness in EBS noise detection. However, it exhibits over-detection tendencies, where non-noise pixels surrounding EBS noise pixels are incorrectly classified as noise pixels. These misclassified pixels typically display significant brightness differences from actual noise pixels. To address this limitation, we incorporate the Otsu threshold to optimize the Harris corner detector results, developing a Harris-Otsu joint noise detection algorithm. The Otsu method functions as an adaptive thresholding technique based on image histogram statistics. Its fundamental principle maximizes between-class variance, enabling automatic computation of optimal segmentation thresholds based on image grayscale distribution, thus effectively separating targets from backgrounds without manual intervention. The process begins with Harris corner detector identifying approximate EBS noise regions, followed by retention of only pixels exceeding the Otsu threshold as final detection results. Subsequently, an adaptive switching median filter guided by detection results removes EBS noise. Finally, a bilateral filter eliminates residual Gaussian and Poisson noise.Results and DiscussionsThe proposed Harris-Otsu joint noise detection algorithm accurately detects EBS noise pixels (Fig. 4). To verify the denoising performance of the HASMBF algorithm, denoising experiments were subsequently conducted using both simulation images with artificially added noise and real EBAPS images. The simulation images are generated by adding artificial EBS noise and Gaussian noise, and are divided into three categories based on illumination levels (Fig. 6). The real EBAPS images were captured using an EBAPS camera under illumination condition of 5×10⁻⁴ lx (Fig. 10). Experiment results show that the algorithm proposed in this paper is effective in removing the mixed noise in EBAPS images (Figs. 7, 8, 9 and 11). EBS noise is significantly removed after being processed by the proposed algorithm. Our method also performs well in both PSNR and SSIM (Tables 1, 2, 3 and 5), and it also attains a competitive processing speed (Tables 4 and 5). For real EBAPS images, the proposed algorithm improves PSNR by approximately 10 dB and achieves an SSIM above 0.9. Meanwhile, the processing time is only 1.8 times that of the classic bilateral filtering algorithm.ConclusionsThis study analyzes the imaging principle and noise characteristics of EBAPS, including Gaussian noise and EBS noise. The proposed HASMBF algorithm demonstrates accurate EBS noise detection and effective mixed noise removal in EBAPS images. The denoising performance evaluation utilizes both simulation and real images. Experimental results confirm the method’s effectiveness in noise suppression while maintaining efficient processing speed. However, the algorithm requires parameter adjustments based on environmental variations, including noise detection threshold and bilateral filtering kernel parameters. Further research should focus on developing an adaptive parameter-setting mechanism to enhance the algorithm’s environmental adaptability.
Aug. 13, 2025Vol. 45 Issue 15 1510006 (2025)
Xiaodong Zhang, Dianwei Zhang, Yuanyuan Li, Shanshan Peng, and Long Zhang
ObjectiveDue to current technical limitations and the influence of shooting environments, images captured by the same device often fail to provide a comprehensive description of different scenes. The visible sensor can generate visible images that contain rich texture details, but the image quality is easily affected by harsh environments. On the other hand, the infrared sensor can generate infrared images that offer distinct salient targets but lack texture details. Infrared and visible image fusion aims to integrate the complementary information from infrared and visible modalities to generate a single image. The fused image exhibits more prominent targets along with abundant texture details, thereby facilitating downstream visual tasks. Although most current methods have proven effective in generating satisfactory fused images in typical scenarios, performance remains unsatisfactory in strong light scenes. To achieve a fused image that contains prominent targets and rich texture details under strong light scenes, we propose a mask-guided two-stage infrared and visible image fusion network.MethodsConsidering the issue of blurred salient targets and texture details under strong light conditions, we design a salient object detection (SOD) network in the first stage to extract salient targets from the infrared image to guide feature extraction and reconstruction. Specifically, we embed RepVGG block into U2-Net, achieving structural reparameterization, which effectively enhances U2-Net’s ability to extract salient object instances. In the second stage, due to the degradation of texture details in strong light scenes, we establish a scene segmentation and enhancement module (SSEM) in the encoder stage. This module uses discrete wavelet transform to extract high-frequency information and supplements it into the hierarchical features, thus providing texture details. In addition, to avoid interference from redundant information between foreground and background, a dual-branch feature fusion module (DFFM) is designed to separately fuse the foreground and background, and then merge them into a unified feature map during the fusion stage. Moreover, in the decoder stage, a mask-guided reconstruction module (MGRM) is proposed to fully utilize the mask and address the problem of indistinct salient targets in strong light scenes. This module employs two sets of channel and spatial attention modules to extract critical information. It enhances significant regions while suppressing redundant information in both channel and spatial dimensions, improving the network’s ability to extract crucial features. For loss functions, in the first training stage, the loss function contains the loss of side output saliency maps and the final fusion output saliency map, which constrains the multi-scale saliency maps to focus on key features. In the second training stage, pixel intensity loss and structural similarity loss are used to guide the fused images in retaining salient targets, texture details, and structural information.Results and DiscussionsDuring the testing stage, comparative experiments are conducted on the TNO, RoadScene and FLIR datasets. The proposed method is compared with nine other methods, and eight quantitative indicators are used to assess the performance of the aforementioned ten methods. In qualitative experiments, compared to other methods, the proposed method can generate fusion results with clear salient targets and rich texture details under both normal and strong light environments. In quantitative experiments, the proposed method achieves the best discrete cosine features mutual information (FMIdct), small Baud sign mutual information (FMIω), visual-fidelity (VIF), and the second-best mutual information (MI) values. This suggests that the proposed method effectively transfers relevant information from the source images to the fused image while maintaining high visual fidelity. Finally, ablation experiments are conducted to validate the effectiveness of the proposed salient object detection network, the scene segmentation and enhancement module, and the mask-guided reconstruction module. These results confirm the contributions of each proposed module.ConclusionsIn this study, we propose a mask-guided two-stage infrared and visible image fusion method, which consists of two phases: Firstly, a RepVGG module is introduced to reparameterize U2-Net, which enhances its ability to extract salient targets. Secondly, a two-stage autoencoder-based infrared and visible image fusion method is designed. In the encoder phase, wavelet transform is employed to extract high-frequency information to supplement texture details. During the fusion phase, the foreground and background are fused separately to minimize redundant information. Finally, an attention mechanism is used to incorporate the extracted foreground targets for supplementing the salient information. The fused images contain richer texture details and enhanced salient target information. Applying this method in strong light scenes can mitigate information loss caused by intense illumination. This approach provides a novel image processing strategy to preserve more salient information under strong light conditions.
Aug. 15, 2025Vol. 45 Issue 15 1510007 (2025)
Hailong Zhao, Yeqing Li, Shiwei Hou, Yiying Zhao, Bin Jia, Honggang Lu, Yibiao Yang, and Xiao Deng
ObjectiveAs the core components of clouds, the measurement of cloud particle characteristic parameters, such as size, shape, phase, number concentration, and spectral distribution, plays a key role in atmospheric detection, aircraft icing warning, and artificial weather modification. At present, the most widely used method for in-situ measurement of cloud particles is the optical array probe (OAP) with a high-speed linear array detector. However, this method faces the challenge of low detection accuracy for the spectral distribution of small-sized cloud particles, which is mainly due to limitations in detector resolution and the diffraction effects of particles. Furthermore, OAP images are easily influenced by sampling space and lack texture information, making particle identification and classification more difficult. To improve the reliability of OAPs and the efficiency of in-situ cloud observations, we propose a method to identify the shape and rotation orientation of small-sized cloud particles using image diffraction features. In addition, a size feature extraction algorithm combining edge detection and contour smoothing is studied to reduce measurement errors. In this paper, we enable accurate measurement of characteristic parameters, such as size and shape, for heterogeneous multi-particles, and thus allow for high-precision spectral distribution information.MethodsFirst, the single-particle diffraction propagation model is constructed using the LightPipes simulation software. Three plane geometric masks, including circular, regular hexagonal, and rectangular, are designed to represent spherical water droplets, plate-shaped ice crystals, and columnar ice crystals. The diffraction characteristics of these three particle shapes under different size conditions are then studied. Second, the characteristic parameters, such as array direction size (Dx), velocity direction size (Dy), maximum geometric size (Dmax), and contour enclosing area (S), are calculated. An image processing algorithm combining edge detection and contour smoothing is proposed. A cloud particle diffraction imaging measurement system based on a linear array detector is developed, and an optical mask method is used to simulate real water droplets and ice crystal particles. The influence of sampling distance on diffraction imaging is analyzed to determine the detection limit of the system. Finally, a series of turntable calibration experiments are carried out to measure the size, shape, and rotation orientation of heterogeneous multi-particles, while obtaining the spectral distribution statistics of continuous random particle groups to verify the feasibility of the proposed method.Results and DiscussionsSimulation results show that spheroid droplets, plate ice crystals, and column ice crystals exhibit different diffraction stripes and bright spot characteristics, which can aid in contour identification and shape recognition (Fig. 2). By varying the sampling distance (l) and recording the size of the Poisson bright spot (Dp) in the diffraction image, the optimal sampling distance is found to be l=50 mm (Fig. 4). The numerical aperture of the system is inferred from the Dp data of small-sized particles, and the diffraction limit (Ddif≈14.42 μm) is estimated, which is greater than the resolution limit, Dres,pix=4.31 μm. The theoretical detection limit is considered to be 14.42 μm. The experimental detection limit of the system is found to be Dlim=15 μm, which aligns with the theoretical estimate (Fig. 5). The error is defined as the difference between the maximum geometric size (Dmax) and the theoretical particle size (D). The turntable calibration experiments show that the size measurement error is the smallest for spheroid droplets and largest for 90° column ice crystals. However, the maximum error is only 4.51 μm (Fig. 6). In addition, rotation orientation experiments demonstrate that diffraction features can be used to identify the rotation angle of small-sized cloud particles (Fig. 7). The system can also perform spectral distribution statistics of continuous random particle groups. The error distribution for each particle size interval is between 2 and 4 μm (Fig. 8). In this paper, we address the problem of low measurement accuracy for small-scale cloud particle spectral distributions.ConclusionsTo address the challenge of low measurement accuracy and difficulty in accurately identifying the shape of small-sized cloud particles during in-situ measurement with OAPs, we propose a cloud particle diffraction imaging and characteristic parameter measurement method based on linear array detectors and Fresnel diffraction principle. Based on LightPipes simulation results, a cloud particle diffraction imaging measurement system is designed using linear array detectors. Optical masks are customized on the calibration turntable to simulate real cloud particles, including spherical water droplets and plate-shaped and columnar ice crystal particles in the atmosphere. The detection limit of the system is discussed in terms of both resolution and diffraction limits, and the effect of sampling distance on particle imaging is analyzed. The diffraction imaging behavior of heterogeneous multi-particles is explored, and the system’s ability to recognize ice crystal particles of different shapes and rotational orientations on a large scale is verified. The spectral distribution statistics of continuous random particle groups are also obtained. The experimental results show that the particle images exhibit diffraction characteristics consistent with simulations. The system’s size detection limit, at an optimal sampling distance of l=50 mm, is 15 μm. The size measurement range is between 15 and 1000 μm, with a full-scale error of less than 5 μm. For particles larger than 100 μm, the relative error is less than 5%. Compared to other in-situ cloud particle detection methods, this method improves the accuracy of contour recognition for particle shape, distinguishes particle rotation orientation, and acquires images in real time using diffraction features. However, this method still has the limitation of not being able to measure the three-dimensional information of particles. In summary, we provide a new technical approach to solve the problem of low measurement accuracy for small-sized cloud particles and offer a means for precise measurement of important meteorological parameters, such as particle concentration, liquid water content (LWC), and mean droplet diameter (MVD) in cloud microphysics.
Aug. 07, 2025Vol. 45 Issue 15 1511001 (2025)
Fuping Qin, Guihua Liu, Huiming Huang, Lei Deng, Tao Song, and Wencan Ju
ObjectiveLine-structured light scanning offers significant advantages in speed, precision, interference resistance, and applicability to medium- and large-scale industrial object scanning. Compared to other laser scanning systems, the laser galvanometer system features a simple structure, lower cost, higher single-reconstruction efficiency, and notable benefits in both reconstruction accuracy and real-time performance, which makes it an effective method for the rapid acquisition of surface features. We aim to address critical issues in traditional laser galvanometer-based three-dimensional (3D) reconstruction systems, such as low reconstruction efficiency, challenges in calibrating the light plane in multi-line systems, and significant errors in laser center-point matching. Unlike single-line scanning, multi-line laser scanning can acquire multiple laser stripes simultaneously, thereby significantly enhancing point cloud density and coverage. Moreover, compared to traditional monocular and binocular reconstruction methods, the trinocular reconstruction approach offers greater stability and robustness in terms of matching, error control, and precision, which effectively resolves the matching errors and occlusion problems commonly encountered in binocular systems under complex conditions. Therefore, research on the trinocular multi-line laser galvanometer scanning method is crucial for improving industrial measurement accuracy and achieving precise reconstruction of complex object surfaces.MethodsWe present a trinocular multi-line laser galvanometer system and propose a spatial-geometry-constrained laser center-point matching method. First, the three-view geometric projection matrix (TGPM) is estimated using matching points from the three views on a standard target surface, then optimized via the Levenberg?Marquardt (LM) algorithm to establish an accurate mapping between 3D space and two-dimensional (2D) image projections. Next, refined laser points from the three views are obtained using a sub-pixel-level laser stripe centerline extraction algorithm. A hybrid 2D?3D constraint method—integrating epipolar geometric slope constraints with 3D Euclidean distance consistency constraints—is then employed to achieve coarse matching of laser center points across the three views. Specifically, candidate matches for the left-view laser points in the middle and right views are first generated using epipolar geometric slope constraints; these initial matches are then reconstructed in 3D space, and coarse matching triplets are determined by enforcing 3D Euclidean distance consistency constraints. Finally, a fine matching strategy is applied to eliminate mismatched points by combining TGPM projection error constraints with laser stripe positional index consistency constraints. The coarse matching triplets are further refined through TGPM projection error enforcement, and the positional indices of multi-line laser stripes in the images are used to verify the consistency of laser stripe indices across the three views. Only matches with consistent stripe indices are retained for 3D point cloud reconstruction, which ensures that the matched points correspond to the same laser stripe in all views. This hierarchical coarse-to-fine framework significantly enhances the accuracy and robustness of 3D reconstruction.Results and DiscussionsExperimental validation of the proposed system demonstrates a 91.71% matching accuracy under 7-line laser conditions (Table 2), with strong adaptability and stability observed in center-point matching tasks for both 11-line and 15-line configurations (Fig. 9, Table 3). Repeated measurements on a step-standard component reveal height errors below 0.061457 mm (Table 5). The system achieves high-quality reconstructions of plaster statues, highly reflective cups, and culturally significant artifacts with complex textures (Figs. 12?14). Moreover, by leveraging compute unified device architecture (CUDA)-based graphics processing unit (GPU) acceleration, the system achieves single-frame reconstruction in 15.080 ms during 7-line scanning, which demonstrates superior efficiency (Table 6).ConclusionsThe trinocular multi-line laser galvanometer 3D reconstruction method, based on spatial geometric constraints proposed in this study, significantly enhances matching accuracy and reduces mismatched points by integrating epipolar geometric slope constraints, Euclidean distance consistency constraints, TGPM projection error constraints, and laser stripe index consistency constraints. This approach effectively addresses the limitations of traditional systems in light-plane calibration and laser point matching, eliminating the need for complex multi-line plane calibration during 3D reconstruction. A hierarchical coarse-to-fine matching strategy is adopted to minimize the mismatching rate of multi-line laser center points, thereby achieving high-precision and robust reconstruction results that meet the stringent accuracy requirements of industrial measurements. Furthermore, CUDA-based GPU acceleration is employed to significantly optimize computational efficiency, which makes the method suitable for large-scale industrial measurement tasks by reducing reconstruction time and improving productivity. Despite the notable advancements in multi-line laser galvanometer 3D reconstruction achieved in this study, several limitations warrant further optimization and investigation: 1) The current method is primarily designed for static scenarios; when objects or the scanning system are in motion, laser stripes may deform or cause ambiguous matching, compromising matching accuracy and reconstruction quality. 2) Although the method performs well under standard experimental conditions, its robustness may be affected by complex illumination environments (e.g., intense ambient light interference or dynamic lighting variations), thus leading to reduced precision in laser stripe extraction. The proposed 3D reconstruction method holds broad application potential across diverse fields, including industrial metrology, cultural heritage preservation, medical imaging, robotic vision, and reverse engineering. With ongoing advancements in hardware computational capabilities and intelligent algorithms, this approach is poised to play a pivotal role in practical applications and further drive the development of high-precision 3D reconstruction technologies.
Aug. 15, 2025Vol. 45 Issue 15 1511002 (2025)
Rui Mo, Bo Dong, Shengli Xie, and Yulei Bai
ObjectivePhase-contrast optical coherence elastography (PC-OCE) measurements involve collecting interference spectra before and after sample deformation, performing Fourier transforms, and conducting differential analysis to obtain wrapped phase containing deformation information. Strain calculations typically employ vector methods or deep learning approaches. However, excessive sample deformation can cause speckle decorrelation, which submerges the PC-OCE phase in noise and significantly complicates strain calculations. To address this challenge, researchers developed a time-domain tracking-based strain increment calculation method. This approach collects sequential interferometric spectra during deformation, selects appropriate inter-frame spacing, and divides large deformations into multiple smaller ones for separate strain calculations, followed by cumulative reconstruction. While recent PC-OCE strain adaptive incremental calculation methods utilize noise thresholds for frame spacing selection and vector-based strain calculation, limitations persist. These methods indirectly assess strain quality through wrapped phase noise levels, resulting in smaller inter-frame spacing and increased cumulative error when speckle noise is strong and unevenly distributed. Consequently, there is a need to develop an improved PC-OCE strain increment calculation method capable of handling complex and intense speckle noise conditions.MethodsThis paper proposes an adaptive incremental approach integrating Bayesian neural networks with incremental computation methods for temporal tracking. The method requires pre-training a Bayesian neural network to establish an end-to-end mapping from wrapped phase to strain. The trained network predicts strain while generating uncertainty distributions to evaluate strain quality. These uncertainty measurements guide inter-frame interval selection during incremental computation. Following the establishment of an uncertainty threshold, the optical coherence tomography (OCT) system captures sequential interference spectra during object deformation. The network performs strain prediction and generates corresponding uncertainty distributions, with the calculated average uncertainty optimizing inter-frame spacing adaptively. This process enables high signal-to-noise ratio strain calculation under phase speckle decorrelation conditions.Results and DiscussionsThe method's effectiveness is evaluated using an OCT system to calculate strain under speckle decorrelation phase for both uniform and non-uniform deformation conditions. Experiment 1 involved uniform compression loading of a silicone film sample, as illustrated in Fig. 4. Figure 4(a) displays the wrapped phase obtained through Eq. (3) during compression loading, with Fig. 4(a-1) to Fig. 4(a-5) corresponding to mechanical loads of 3, 5, 7, 9, and 11 μm, respectively. Increasing loads resulted in greater film deformation and denser phase fringes. Speckle decorrelation emerged at the sample edge, as shown in Fig. 4(a-3), progressively expanding until phase fringes were substantially submerged, as evident in Fig. 4(a-5). Figure 4(c) presents strain results from the noise threshold-based adaptive incremental method, while Fig. 4(e) shows results from the Bayesian neural network-based approach. The strain distributions in Fig. 4(d-1) to Fig. 4(d-3) align with their corresponding Fig. 4(e-1) to Fig. 4(e-3) counterparts. This consistency occurs because the average uncertainty of direct Bayesian neural network strain calculations falls below the incremental method's preset threshold, resulting in single strain accumulation. Comparatively, the traditional method requires multiple accumulations, potentially increasing error propagation and reducing imaging signal-to-noise ratio. Experimental results demonstrate signal-to-noise ratio improvements of 28.2% and 74.3% for uniform and non-uniform deformation cases, respectively, compared to traditional methods.ConclusionsExcessive sample deformation causes speckle decorrelation in PC-OCE, significantly complicating strain calculation. This paper introduces a novel Bayesian neural network-based strain increment calculation method with two key features: 1) Bayesian network uncertainty directly reflects strain quality, enabling adaptive and efficient frame spacing optimization while reducing cumulative errors common in traditional calculations; 2) following threshold establishment, the method requires no additional parameter settings and achieves automatic processing.
Aug. 15, 2025Vol. 45 Issue 15 1511003 (2025)
Fan Huang, Yi Xu, Wanying Liu, Jing Zhang, Yinpeng Chen, Xueqian Zhang, Quan Xu, Liyuan Liu, and Jianqaing Gu
ObjectiveTerahertz time-domain spectroscopy (THz-TDS) systems effectively overcome the limitations of conventional imaging methods in terms of penetration depth and biosafety, demonstrating broad application prospects. However, traditional THz-TDS systems are constrained by scanning speed and diffraction limit, failing to achieve signal acquisition with both high speed and high spatial resolution. Photoconductive probes with subwavelength antenna structures offer an effective approach for high-spatial-resolution characterization. Nevertheless, when point-by-point high-resolution scanning is performed on large-scale samples, enormous pixels generate massive time-domain datasets. Moreover, the terahertz time-domain signal acquisition at each pixel is inherently limited by the translation speed and delay length of the mechanical delay line, exacerbating the conflict between scanning speed and delay range. The electronically controlled optical sampling (ECOPS) technique achieves nonlinearly varying time delays through periodic sinusoidal voltage modulation of the repetition frequency offset between two femtosecond laser pulses, enabling high-speed sampling. However, the nonlinear sampling under sinusoidal modulation requires additional measurement devices and complex post-processing for time axis extraction, which increases system complexity and cost and compromises sampling accuracy. This challenge drives the development of novel ECOPS compatible with photoconductive probes to achieve convenient, stable, and high-speed terahertz time-domain signal acquisition. In this study, piecewise voltage function modulation was introduced into the ECOPS, which was then integrated with photoconductive probes, facilitating the development of a rapid terahertz probe system with spatial resolution at the subwavelength level.MethodsWe proposed and built a terahertz characterization system integrating piecewise voltage modulated-ECOPS with photoconductive probes. The system comprises two femtosecond fiber lasers, a fiber optical module, terahertz emission/detection modules, a trigger module, and a repetition frequency control module. By locking the repetition frequency of two lasers to identical values and injecting a periodic piecewise voltage function into the phase-locked loop of one laser, linearly varying time delays were achieved. The linear time axis was calibrated using a 1 mm thick high-resistivity silicon wafer. To investigate the effect of different steady-state voltages and modulation frequencies of piecewise voltage functions on the terahertz time-domain signals and frequency-domain amplitude spectra, we set the modulation frequency at 500 Hz and adjusted the steady-state voltages to 0.7, 0.8, and 0.9 V. Subsequently, we fixed the steady-state voltage at 0.9 V and changed the modulation frequencies to 500, 400, and 250 Hz. Comparative analyses between asynchronous optical sampling (ASOPS) and ECOPS were performed under identical acquisition time. To validate the rapid and high-resolution field characterization capability, two-dimensional scans of terahertz spots and metallic cross structures were conducted over a 5.1 mm×5.1 mm area with a 300 μm step size. The imaging frequencies were at 0.55 THz and 0.60 THz.Results and DiscussionsThe ECOPS terahertz probe system with piecewise voltage modulation enables high-speed scanning with high spatial resolution. By truncating the top and bottom of sinusoidal waveform, the piecewise voltage function can enable the repetition frequency offset unchanged in period of steady-state voltage, thereafter achieving linearly time-domain sampling (Fig. 2). Measuring the time interval between transmitted main terahertz pulses and secondary reflections through a 1 mm high-resistivity silicon wafer, we can deduce the delay extension factor for determining repetition frequency offset and time window length (Fig. 3). Under 500 Hz modulation frequency and 0.9 V steady-state voltage, the system achieves waveform acquisition rate of 1 kHz, bandwidth of 1.4 THz, time window of 134.226 ps, and dynamic range of 41 dB (Fig. 4). The time-domain signal and frequency-domain amplitude spectrum at different modulation frequencies and steady-state voltages reveal that steady-state voltage primarily governs time window length and time-domain peak-to-peak value, while modulation frequency controls the time window without significantly altering spectral characteristics (Fig. 5). Compared to ASOPS, ECOPS achieves superior noise suppression through increased signal averaging within identical acquisition times (Fig. 6). Although ECOPS exhibits lower frequency resolution than ASOPS, it enhances bandwidth and dynamic range by sacrificing time window length. Two-dimensional scans of terahertz spots and metallic cross structures demonstrate the intensity and phase distributions (Fig. 7 and Fig. 8), with single-pixel acquisition time reduced to 100 ms.ConclusionsWe propose and build a terahertz characterization system combining ECOPS with photoconductive probes, realizing high-speed linear sampling through periodic piecewise voltage modulation. Compared to ECOPS based on sinusoidal modulation, this approach eliminates complex auxiliary measurements and post-processing of the time-domain signal required for nonlinear sampling. Experimental results demonstrate a bandwidth of 1.4 THz, a time window of 134.226 ps, and a dynamic range of 41 dB at 1 kHz waveform acquisition rate, with single-pixel scanning time compressed to 100 ms in two-dimensional imaging. The results under different modulation frequencies and steady-state voltages reveal that modulation frequency manipulates the time window, while steady-state voltage regulates the time window length and peak-to-peak value of the time-domain signal. In the future, in order to further enhance the imaging rate of the system, it can be considered to store and correctively align a single signal from each forward/backward sampling separately to achieve the simultaneous leveraging of forward/backward signals. Moreover, the continuous translation function based on the electronically controlled two-dimensional translation stage can be developed to achieve high-speed continuous scanning.
Aug. 15, 2025Vol. 45 Issue 15 1511004 (2025)
Yangyang Li, Liyuan Xie, Rongsheng Lu, Xiuyong Yang, and Jingtao Dong
ObjectiveDriven by rapid advancements in modern precision manufacturing and machining, the demand for high-precision measurements is continually increasing, with displacement measurement accuracy requirements reaching the nanometer scale. Owing to their high resolution and precision, laser interferometers serve as primary tools for nanometer-scale measurements. Unlike traditional Gaussian beams, vortex beams possess a helical phase factor exp(i?θ) in the complex amplitude of their optical field, thus carrying orbital angular momentum, where ? is the topological charge, and θ is the azimuthal angle. The helical phase center contains a phase singularity, resulting in a hollow ring-shaped intensity distribution. These characteristics provide new degrees of freedom for optical field manipulation and analysis. Among these, vortex interferometers are formed by employing optical vortex beams as the carrier within the laser interferometer. Vortex interferometers encode axial phase variations into the azimuthal rotation of the resulting interference fringes. Furthermore, as the azimuthal angle provides an inherent 2π metrological datum, this approach enables high-precision phase demodulation. Moreover, vortex interferometers permit the direct determination of phase or displacement changes from the azimuthal rotation angle within a single interference fringe pattern, thus inherently possessing dynamic phase demodulation capabilities. However, conventional vortex interferometry demodulation relies on area-array cameras for real-time fringe capture and frame-by-frame image processing. The finite pixel size limits the phase shift resolution, while camera frame rate constraints and the high data volume associated with image sequences impede the measurement of dynamic displacement velocities.MethodsConsequently, this paper establishes a carrier vortex interferometer and proposes a novel demodulation method based on the Doppler effect. A vortex beam generated by a gradual-width Fermat spiral mask (GW-FSM) is used as the test beam of a Mach-Zehnder interferometer to produce vortex interference fringes. A rotating chopper, a focusing lens, and a photodetector are successively set at the exit of the Mach-Zehnder interferometer to convert the vortex interference field into a one-dimensional (1D) temporal modulated signal. When the measured surface is stationary, the carrier frequency is obtained by the Fourier transform of the 1D temporal signal. When the measured surface moves at a certain velocity, the vortex interference fringes rotate azimuthally, generating a Doppler frequency shift relative to the carrier frequency, and the surface displacement velocity and instantaneous displacement can be obtained.Results and DiscussionsThe results of the experiment are as follows:1) The intensity distributions of the vortex beam captured at different observation distances, as well as the vortex interference fringes recorded at different observation distances after introducing the vortex beam into a Mach-Zehnder interferometer, are compared with the simulation results. The experimental results show a high degree of agreement with the simulations (Fig. 6).2) When the measured surface is stationary, the experimental results under different carrier frequencies show a high degree of agreement with the simulation results (Fig. 7). The carrier frequency error is mainly caused by the jitter of the vortex interference fringes induced by the rotational vibration of the hollow rotary motor (HRM), as well as the angular velocity error of the HRM.3) Experiments show that the experimental values of the Doppler frequency shift of the measured surface at different displacement velocities under different carrier frequencies have errors in the range of [-0.13 Hz, 0.1 Hz] compared with the theoretical values. The errors of the measured values of the surface displacement velocity compared with the theoretical values are in the range of [-34 nm/s, 26.6 nm/s] (Fig. 9).Finally, this paper discusses the angular deviation between the reference wavefront and the measurement wavefront in a vortex interferometer, which is induced by the inclination of the measured surface. It indicates that the carrier vortex interferometer can solve the difficulty encountered by traditional vortex interferometric image post-processing algorithms in handling distorted interference fringes and exhibits strong robustness in dynamic surface displacement measurements (Fig. 10). The upper and lower limits of the displacement velocity are discussed.ConclusionsThis paper proposes a carrier vortex interferometric system and method for dynamic displacement measurement. On the one hand, a Bessel-Gauss (BG) vortex beam generated by GW-FSM diffraction is used as the measurement carrier in a Mach-Zehnder interferometer, endowing the vortex interferometric system with the potential for compactness, robustness, and ease of integration. On the other hand, a rotating chopper and a single-point photodetector are used to convert the two-dimensional (2D) vortex interference field into a 1D temporal modulated signal. The conventional phase demodulation algorithm based on pixel-wise processing of interference image sequences is improved into a frequency-domain analysis of time-domain signals, enabling the extraction of dynamic displacement velocity information of the surface through carrier frequency and Doppler shift. This method demonstrates strong robustness against distorted vortex interference fringes caused by surface inclination. The current study only carries out experimental research on surface displacement under uniform motion. However, by applying time-frequency analysis methods for non-stationary signals, such as short-time Fourier transform and wavelet transform, this approach can be extended in the future to dynamic displacement measurements of surfaces under non-uniform motion, exhibiting application potential in the field of nanometer-scale dynamic displacement measurement.
Aug. 15, 2025Vol. 45 Issue 15 1512001 (2025)
Yisu Wang, Dongyu Yan, Bowen Liu, Youjian Song, and Minglie Hu
ObjectiveDispersion represents a critical parameter influencing optical transmission performance, and its control technology has been widely applied to ultrafast optics, nonlinear optics, and fiber optic communication. Precise dispersion measurement systems are essential for developing accurate dispersion compensation schemes and optimizing optical system designs. Among various measurement techniques, white light interferometry emerges as particularly advantageous due to its high temporal and spatial resolution, broad spectral range, and straightforward experimental setup. Measurement accuracy remains a primary consideration for dispersion measurement systems. The spectrometer resolution and light source bandwidth constrain the number of interference fringes in the spectrum, while the delay difference between reference and measurement arms affects interference fringe density, subsequently impacting data processing sampling points. Addressing these challenges requires establishing a theoretical model to systematically evaluate how these factors affect measurement accuracy, analyze suitable delay differences and effective bandwidth for measurement systems, and experimentally demonstrate how appropriate parameter selection enhances system measurement accuracy.MethodsThis article presents a theoretical model for a white light spectral interference dispersion measurement system that processes the interference spectrum through normalization and phase information extraction using Hilbert transform (Fig. 2), and investigates the effects of bandwidth and time delay on measurement accuracy (Fig. 3). Concurrently, a measurement system was constructed to evaluate SF66 and F2 glass samples with a thickness of 10 millimeters (Fig. 1). The investigation involved varying spectral bandwidth and time delay, comparing experimental results with simulation outcomes (Fig. 5). The root mean square error (RMSE) served as the measurement accuracy metric.Results and DiscussionsSimulation analysis reveals that for ideal Gaussian light sources, RMSE remains below 7 fs2 when time delay exceeds 8 ps and effective bandwidth surpasses 12 dB. For actual light sources, RMSE stays below 20 fs2 with 20 dB effective bandwidth and delays between 7 to 12 ps (Fig. 3). This occurs because increased bandwidth generates spectral noise that adversely affects phase extraction accuracy. While time delay correlates positively with interference fringe quantity, the spectrometer’s wavelength resolution imposes an upper limit on interference fringe numbers. Experimental results demonstrate RMSE values not exceeding 30 fs2 when using 20 dB bandwidth and time delays between 5 and 10 ps (Fig. 5). Furthermore, Fourier transform analysis of the interference signal explains the time delay upper limit (Fig. 6). The analysis indicates that increasing time delay progressively reduces the interference spectrum’s signal-to-noise ratio, potentially due to light spot shape differences during beam combination. The experimental data demonstrates strong correlation with theoretical simulation results.ConclusionsThis study establishes a dispersion measurement system for white light spectral interferometry and investigates the effects of bandwidth and time delay on phase extraction both theoretically and experimentally. The research develops a theoretical model based on system wavelength resolution, utilizing ideal Gaussian spectra and actual measured spectra to calculate dispersion RMSE curves through varying bandwidth factors and time delays. Simulation results indicate optimal performance with a bandwidth factor of 2 (corresponding to 20 dB calculated bandwidth) and time delays between 7?12 ps. Experimental validation through measuring standard optical glass dispersion curves of SF66 and F2 samples under various time delay conditions confirms the simulation trends. Through optimization of time delay and bandwidth factors, measurement errors for both glass samples remained below 50 fs2 throughout the 42 nm spectral range.
Aug. 13, 2025Vol. 45 Issue 15 1512002 (2025)
Dongdong Han, Ying Li, Xiyang Wei, Tiantian Li, Kaili Ren, Yipeng Zheng, Lipeng Zhu, and Zhanqiang Hui
ObjectiveFiber lasers have gained widespread adoption in scientific, industrial, and medical applications due to their superior beam quality, thermal management, compact design, and minimal maintenance requirements. Passively mode-locked fiber lasers serve as essential platforms for investigating soliton interactions. Soliton molecules, extensively studied in optics and physics, emerge through attractive or repulsive forces between solitons. The intricate internal dynamics of soliton molecules have been revealed through dispersive Fourier transform (DFT) technology, enabling high-resolution, real-time monitoring. Through DFT, researchers have identified two primary types of relative phase dynamics in soliton molecules: phase drifting and relative phase oscillation. These investigations have illuminated the formation and manipulation of soliton molecules. Current research has predominantly focused on controlling and analyzing the relative phase of individual soliton molecules. This paper demonstrates effective control of the relative phase of two-soliton molecules by introducing a modulation signal into the pump driving current of a passively mode-locked fiber laser. The implementation of a modulation signal to the pump driver current facilitated the transition from a regular mode-locked pulse to a soliton molecule exhibiting relative phase oscillation. By adjusting the modulation signal amplitude, dual soliton molecules with co-directional and counter-directional relative phases are achieved. DFT technology enables the study of relative dynamic processes within these soliton molecules, leading to analysis of the mechanisms underlying various soliton molecule formations.MethodsThe experimental configuration utilizes a 980 nm semiconductor laser diode (LD) as the pump source. A square-wave modulation signal, generates by a signal generator, is applied to the pump driver to regulate soliton dynamics through electronic modulation. The pump light entered the laser cavity via a 980 nm/1550 nm wavelength division multiplexer. The cavity contained a 3.3 m long erbium-doped fiber serving as the gain medium. A polarization-independent isolator (ISO 1) is incorporated to ensure unidirectional light propagation within the cavity. The system employs a polarization controller for adjusting the cavity light’s polarization state, and a 60% output coupler extracts the laser output. Single-walled carbon nanotubes function as a saturable absorber to achieve mode-locking. Standard single-mode fiber comprises the remaining cavity fiber, totaling approximately 12.2 m. An additional polarization-independent isolator (ISO 2) is positioned outside the cavity to prevent external light reflection re-entry. The DFT technique implementation incorporates dispersion-compensating fiber with approximately 660 ps/nm dispersion, a 24 GHz photodetector, and a 59 GHz high-speed real-time oscilloscope to monitor real-time soliton dynamics within the laser cavity.Results and DiscussionsWithout modulation signal application, a soliton singlet emerged at a pump driver current of 43 mA (Fig. 2), exhibiting a central wavelength of approximately 1530 nm. Upon introducing a square-wave modulation signal to the pump driver current while maintaining 43 mA, a soliton molecule formed, displaying periodic variations in both relative phase and temporal separation (Fig. 3). The function generator provides a modulation signal with 0.266 V amplitude, 99% duty cycle, and 17 kHz frequency. These conditions produce periodically varying interference fringes in the real-time spectrum. When the modulation amplitude increased to 0.701 V, maintaining constant pump current, duty cycle, and frequency, dual soliton molecules with co-directional relative phase variations are observed (Fig. 4). The solitons maintaine approximately 16 ns temporal separation, both exhibiting interference fringes with nearly identical fringe periods. Further increasing modulation amplitude to 0.719 V while maintaining other driving parameters produce dual soliton molecules with counter-directional relative phase oscillations (Fig. 5). The temporal separation between solitons increase to approximately 24 ns. The relative phase evolution diagrams indicate similar oscillation periods of approximately 38 round trips for both solitons, despite significant differences in phase dynamics.ConclusionsThis research demonstrates successful generation and control of soliton molecules exhibiting periodic changes in relative phase and spacing within a passively mode-locked fiber laser using pump modulation techniques. The relative phase and spacing variations of soliton molecules are effectively controlled through modulation signal amplitude adjustments in the pump drive current. DFT technology enables real-time observation of internal relative phase and spacing variations within the soliton molecules. The experiments produce three distinct types of vibrating soliton molecules under varying modulated signal amplitudes: single soliton molecules with phase vibration, double soliton molecules with in-phase vibration, and double soliton molecules with out-of-phase vibration.
Aug. 08, 2025Vol. 45 Issue 15 1514001 (2025)
Jiaoling Zhao, Xiaoran Li, Hetao Tang, Fenghua Li, Wenjie Xu, Tonglin Huo, and Jianda Shao
ObjectiveCurrently, the selection of a working wavelength around 6.X nm is considered a leading candidate for optical lithography of the next generation, known as the beyond extreme ultraviolet (BEUV) lithography. The selection of the 6.X nm wavelength can be determined by two key considerations. First, this wavelength lies near the boron K-absorption edge, enabling high reflectivity in boron-containing multilayer mirrors. Specifically, theoretical models predict that La/B and La/B4C multilayer structures can achieve up to 75% reflectivity at normal incidence, comparable to the performance of conventional Mo/Si optics at 13.5 nm. Second, experimental studies have demonstrated that the reflectivity of La/B4C multilayer mirrors is more than 40%, hinting towards their potential in practical applications. The periodic thickness of La/B4C multilayers for the BEUV band is about 3.4 nm, which is around half that of the Mo/Si multilayers. The number of periods required in La/B4C multilayers is about 300, about five times greater than that of Mo/Si multilayers. These differences render the La/B4C multilayers much more challenging in terms of deposition processes and interface optimization techniques. Consequently, more researchers have been carrying out interface studies of La/B4C multilayers. Previous studies have indicated that the interface width of B4C-on-La is more than twice that of La-on-B4C. It is suggested that reducing the interface width of B4C-on-La is the key factor in enhancing reflectivity. The interface width of B4C-on-La is reduced from 1.5 nm to 1.2 nm by using LaN instead of La with nitrogen reactive sputtering. The LaN/B4C multilayers achieve a reflectivity of 58.1% at a central wavelength of 6.65 nm, which is 7% higher than that of La/B4C multilayers, a step forward for the BEUV multilayers. However, the degradation of the LaN layer in the La/B4C-based multilayers remains unsolved currently, hindering its further applications.In this work, a method of inserting an ultra-thin carbon interfacial barrier layer at the B4C-on-La interface is introduced to improve the interface quality of La/B4C multilayers and enhance their reflectivity. The optimized La/C/B4C multilayers achieve a reflectance of 60% at 6.65 nm under an incident angle of 12.5°. This interface engineering strategy provides significant advances and further guidance for the development of 6.X nm and/or X-ray multilayers, fulfilling the requirements for BEUV multilayers used in the lithography of the next generation at the operating wavelength around 6.X nm.MethodsThe La/B4C multilayer samples are deposited on silicon wafer substrates by using pulsed direct current (DC) magnetron sputtering. The substrate roughness is around 0.15 nm, and the periodic thickness of all samples is about 3.42 nm. The interface structures are characterized by using X-ray reflectivity (XRR) and high-resolution transmission electron microscope (HRTEM) images. The EUV reflectance spectra are measured at the National Synchrotron Radiation Laboratory (NSRL). Furthermore, the measured reflectivity of the La/B4C and La/C/B4C multilayers with 100 periods in the 6.5‒6.7 nm band is compared with the calculated results using the XRR fitting parameters.Results and DiscussionsAccording to the XRR results shown in Fig. 1 and Fig. 2, the measured periodic thickness of all samples is about 3.42 nm. The results indicate that the La/C/B4C interface structure exhibits the best performance, as confirmed by both XRR and HRTEM analyses (Fig. 2 & Fig. 4). The BEUV reflectivity of the La/C/B4C multilayer with 100 periods is about 25%, which is 7% higher than that of the La/B4C multilayer. This is attributed to the carbon layer preventing the direct contact of La with B4C. The theoretical calculations using the XRR fitting parameters are in good agreement with the measured results of reflectivity curves, as shown in Fig. 3. Therefore, the width of the transition region between the two primary materials in the multilayers should not exceed the thickness of the inserted carbon layer. This reduction in the transition region width substantially compensates for the increased absorption caused by the addition of the (extra) carbon in the La/C/B4C multilayers, eventually leading to the overall increase of their BEUV reflectivity.ConclusionsA high-reflectivity BEUV mirror is successfully prepared by inserting a single interfacial barrier layer of 0.2 nm carbon at the B4C-on-La interface. The La/C/B4C multilayer mirror (with 250 periods) is measured at the NSRL and achieves a reflectance of 60.0% at 6.65 nm under an incident angle of 12.5° (Fig. 5). This result addresses the gap in the high-reflectivity La/B4C multilayers in Chinese research and plays a significant role in advancing the application of BEUV multilayer mirrors for the lithography of the next generation. It substantially expands the potential applications of high-reflectivity mirrors in areas such as BEUV lithography and other X-ray scientific facilities. Next, our research will focus on the reflectivity enhancement, large-diameter mirror preparation techniques, stability evaluations, and validations for further practical applications.
Aug. 07, 2025Vol. 45 Issue 15 1536001 (2025)
Yanchao Hu, Wenhao Zhang, Jing Hu, Wei Su, and Hong Wu
ObjectiveTerahertz (THz) technology holds immense potential in wireless communication, sensing, and biomedical applications, yet its development is hindered by the limitations of conventional metamaterials, such as fixed resonance frequencies, polarization dependence, and environmental inflexibility. To address these challenges, we proposed a novel polarization-independent dual-mode THz metamaterial integrating graphene and vanadium dioxide (VO2). The primary objective is to achieve switchable functionalities between triple plasmon-induced transparency (PIT) and quadruple narrowband perfect absorption in the THz regime, while ensuring polarization insensitivity and dynamic reconfigurability. This design overcame the shortcomings of previous works, such as polarization-dependent responses, structural complexity, and limited operational bandwidth, thereby advancing the development of multifunctional photonic platforms for applications in optical switching, sensing, and slow-light systems.MethodsIn this paper, the proposed metamaterial comprises a vertically stacked structure with patterned graphene arrays (square and circular rings), a VO2 phase-change layer, and dielectric spacers (SiO2 and ion-gel). The graphene layer was patterned into concentric nested square and circular rings (G1 and G2), with optimized geometric parameters (period P=6 μm, square side length l=5.09 μm, width w=1 μm, and ring radii R1=1.10 μm and R2=0.81 μm). The VO2 layer, acting as a dynamically tunable medium, enabled dual-mode operation through its insulator-to-metal phase transition. In the insulating state (σ=10 S/m), the structure supported triple PIT via bright-bright mode coupling between graphene resonators. In the metallic state (σ=200000 S/m), the device transitions to a quadruple narrowband perfect absorber. The finite-difference time-domain (FDTD) method with periodic boundary conditions and perfectly matched layers was used to investigate electromagnetic responses within the structure. Coupled mode theory and impedance-matching analysis were employed to explain the underlying physical mechanisms. Key parameters, including graphene’s Fermi level (EF) and VO2’s conductivity (σ), are independently and dynamically modulated via gate voltage and Joule heating, respectively.Results and Discussions We revealed the multifunctional electromagnetic response characteristics of the proposed structure under different operational states. When VO2 is in the insulating state (σ=10 S/m), the device exhibits triple PIT with transmission dips at 3.90, 3.36, 5.01, and 6.83 THz (Fig. 2). The coupling of three bright modes from square-ring (G1) and one from circular-ring (G2) creates distinct transparency speaks with strong dispersion, resulting in a significant slow-light effect. A maximum group delay of 0.73 ps is achieved (Fig. 6). The PIT spectrum is dynamically modulated by adjusting graphene’s Fermi level between 0.9 and 1.1 eV, resulting in a blue shift of the transmission spectrum (Fig. 3 and Fig. 5). Transitioning VO2 to its metallic state (σ=200000 S/m), the structure exhibits four narrowband absorption peaks at 2.31, 3.90, 6.02, and 7.91 THz, each exceeding 98% absorption (Fig. 8). Impedance-matching analysis reveals near-unity real impedance and near-zero imaginary impedance at these frequencies (Fig. 8), ensuring perfect absorption. Field distributions indicate local plasmon resonances in graphene and Fabry?Pérot-like magnetic resonances between graphene and VO2, which together enhance absorption (Fig. 9). The Fermi level of graphene enables continuous blue-shifting of both PIT and absorption spectra, which is linearly correlated with the applied gate voltages. The conductivity of VO2 modulates the transition between PIT and absorption modes without changing the structural parameters. In addition, the key design advantage lies in the centrally symmetric architecture, which ensures stable performance at different polarization angles (0°?90°). This polarization independence was verified by consistent transmission and absorption spectra under different polarization conditions (Fig. 11).ConclusionsIn this study, a polarization-independent and dual-mode THz metamaterial integrating graphene and VO2 is theoretically proposed. By leveraging VO2’s phase transition and graphene’s tunable plasmonic, the device dynamically switches between triple PIT (with slow-light capabilities) and quadruple narrowband perfect absorption, validated by theoretical models (coupled-mode theory and impedance matching) and numerical simulations. Key achievements include a high group delay of 0.73 ps, absorption peaks of more than 98%, and robust polarization insensitivity. These results advance the development of integrated THz devices for applications in optical modulation, sensing, and slow-light systems, providing a versatile platform for next-generation photonic technologies. Future work will focus on experimental validation and further optimization for industrial scalability.
Aug. 15, 2025Vol. 45 Issue 15 1523001 (2025)
Wenjun Sun, Jingli Wang, Ying Yang, Hongdan Wan, Heming Chen, and Kai Zhong
ObjectiveTerahertz (THz) vortex beams are electromagnetic waves characterized by helical phase structures and frequencies ranging from 0.1 to 10 THz (wavelengths from 30 to 3000 μm). These beams demonstrate significant potential in emerging applications, including broadband communication, military radar, high-resolution THz imaging, electron acceleration, and quantum state manipulation. While current research has achieved multimodal vortex beams, their elevation angles remain fixed. This paper introduces a 2-bit coding phase gradient metasurface designed to generate multimodal vortex beams with switchable elevation angles. The integration of two tunable materials enables dynamic switching of the elevation angle of multimodal vortex beams, presenting applications in radar detection, wireless communication, and stealth technology.MethodsAccording to the Pancharatnam-Berry (PB) geometric phase principle, a phase gradient is introduced to design the coding elements, which are arranged following a specific coding sequence. Through the phase superposition principle, a multimodal vortex beams coding phase gradient metasurface is developed. The coding elements incorporate two tunable materials, photosensitive silicon and vanadium dioxide (VO2). By modifying the control methods, the top-layer structure of the metasurface unit undergoes adjustments, introducing different phase gradients and forming three distinct sets of coding elements. State A represents an unregulated condition, where neither material is affected. During this state, VO2 maintains a dielectric state, and the photosensitive silicon exhibits dielectric properties. State B implements optical control, regulating the photosensitive silicon while leaving VO2 unaffected. In this state, the photosensitive silicon displays metallic properties, while VO2 remains dielectric. State C employs both thermal and optical controls, regulating both materials, resulting in metallic properties for both VO2 and photosensitive silicon.Results and DiscussionsUnder linearly polarized (LP) wave excitation, the co-polarized reflection amplitude and phase difference of the designed coding phase gradient metasurface unit (Fig. 1) satisfy the requirements of the PB geometric phase principle (Fig. 3). In different states, the top structure of the metasurface unit changes, leading to variations in the phase gradient and the size of the coding elements, thereby realizing the control of the elevation angle of the emitted beam. In state A, the central open circle is active; in state B, the small open ring is active; in state C, the large open ring is active (Fig. 2). Subsequently, three sets of coding elements with different phase gradients were formed in states A, B, and C, with sizes of 4×4, 6×6, and 9×9, respectively (Figs. 4?6). After arrangement, the far-field scattering of the coding phase gradient metasurface was simulated using CST Microwave Studio. The results indicate that without regulation, when a 1.2 THz LP wave is incident perpendicularly, the metasurface generates multimodal vortex beams with an elevation angle of 16° (Fig. 7); with optical control alone, a 1.0 THz LP wave incident perpendicularly yields an elevation angle of 20° (Fig. 8); and when both optical and thermal controls are applied, a 0.54 THz LP wave incident perpendicularly results in an elevation angle of 28° (Fig. 9). The simulation results are basically consistent with the theoretical values calculated using the generalized Snell’s law.ConclusionsThis research presents a coding phase gradient metasurface capable of simultaneously generating vortex beams with topological charges of l=-1 and l=+1 in the x-direction, and l=+2 and l=-2 in the y-direction. The elevation angles can be switched by modifying the control methods of two tunable materials to activate different coding elements on a single metasurface, thereby altering the phase gradient. This approach provides an efficient method for flexible control of terahertz beams, offering significant potential in wireless communication, radar detection, and high-resolution imaging applications. The capability to switch angles of multimodal vortex beams enhances adaptability across various applications, establishing this metasurface as a promising component for advanced terahertz technologies.
Aug. 10, 2025Vol. 45 Issue 15 1523002 (2025)
Zhongbao Zhang, and Youliang Cheng
ObjectiveWith the rapid depletion of global fossil resources and the acceleration of urbanization, the development of clean and sustainable energy has become imperative. Among various alternative energy sources, solar energy stands out for its cleanliness and abundance, with solar cells being the primary means of utilizing this resource. Dye-sensitized solar cells (DSSCs) are a highly promising third-generation photovoltaic technology, featuring low cost, convenient manufacturing, and abundant materials. However, traditional DSSCs based on liquid electrolytes have problems such as leakage and poor long-term stability. Solid-state DSSCs (ssDSSCs) effectively address these shortcomings, offering higher durability and operational stability. Despite these advantages, ssDSSCs still face key challenges, including insufficient light collection efficiency and rapid charge recombination. In recent years, D-A-π-A structured dyes have attracted great interest due to their ability to enhance intramolecular spatial resistance by introducing long alkoxy chains as donor substituents. This structural modification can effectively suppress charge recombination and improve the performance of the device. In this study, D-A-π-A-based dyes are used as the sensitizing agent layer in the modeling of ssDSSCs. The purpose is to systematically study its influence on the device performance through simulation. We aim to provide theoretical guidance for optimizing ssDSSC performance, thereby promoting their large-scale application and industrial development.MethodsBased on the SCAPS-1D simulation software, we construct a solid-state dye-sensitized solar cell model with the FTO/TiO2/AQ310/Spiro-OMeTAD/Ag structure. The photoelectric performance is systematically optimized by the control variable method. By analyzing key photoelectric parameters such as open-circuit voltage (Voc), short-circuit current density (Jsc), fill factor (FF), and photoelectric conversion efficiency (PCE), the influence of various factors on device performance is evaluated. Furthermore, the two-factor dynamic variational method is adopted to deeply study the influence of the synergistic changes in the defect density and thickness of the dye layer, the doping concentration of both the electron transport layer (ETL) and the hole transport layer (HTL) on battery performance. Meanwhile, the regulatory effects of environmental temperature and the selection of back electrode materials on device performance are explored. Based on the analysis of the optimization results for each parameter, the mechanism of its effect on the performance of the DSSC is revealed, which provides a reference basis for the theoretical simulation and practical design of solid-state DSSCs.Results and DiscussionsWhen the thickness of the dye layer is relatively small, appropriately increasing its defect density is helpful to enhance the performance of the device. However, when the thickness exceeds 700 nm, the improvement of the photoelectric parameters tends to be slow, the light absorption gradually approaches saturation, and at the same time, the carrier transport path becomes longer and the recombination effect intensifies, which limits the further improvement of performance (Fig. 3). When the thickness of the dye layer is fixed at 700 nm, the device performance is better at a low defect density. However, as the defect density increases, the carrier recombination effect intensifies, which results in a decline in performance. When the defect density is 1015 cm-3, the device exhibits the best photoelectric performance (Fig. 4). It is found in the doping concentration analysis that the influence of HTL doping concentration on Voc is relatively weak, while the change of ETL doping concentration has a significant enhancing effect on Voc. When the doping concentration of HTL is fixed, Voc continuously increases with the increase of the doping concentration of ETL. In contrast, Jsc is not sensitive to changes in the doping concentration of ETL. However, FF is significantly affected by the ETL doping concentration. Under high doping conditions, the carrier mobility increases and the interface recombination loss decreases, thereby significantly enhancing FF (Fig. 5). In addition, the increase in doping concentration will also lead to a decrease in the width of the depletion region, shorten the carrier transport path, and reduce the recombination probability, thereby further enhancing Jsc and FF (Fig. 6). Temperature also has a significant effect on the performance of devices. As the temperature rises, the band gap of the material gradually narrates, thus resulting in a decrease in Voc, while at the same time, Jsc increases. In the short-wavelength range, the increase in temperature enhances the electron mobility and reduces the interfacial potential barrier, resulting in a significant improvement in quantum efficiency (QE). In the long-wavelength region, the collection efficiency of photogenerated carriers remains stable, and QE curves basically overlap (Fig. 7). The variation of the work function of the back contact metal also has an important influence on the performance of the device. With the increase of the work function, the energy level matching between HTL and the metal back electrode improves, and J-V characteristics and PCE of the device are significantly enhanced. When the work function is further increased, the barrier height of the majority of carriers significantly decreases, forming ohmic contacts. These device parameters tend to be saturated, and the performance no longer improves significantly. Comprehensively considering performance, cost and resource availability, carbon (C) as the back contact metal is a more suitable choice.ConclusionsWe use the D-A-π-A dye AQ310 as the photosensitive material, and construct the FTO/TiO2/AQ310/Spiro-OMeTAD/Ag device structure based on the SCAPS-1D software. In addition, we systematically study these effects of key factors such as the thickness of the dye layer, defect density, doping concentrations of ETL and HTL, working temperature, and back contact metal on the performance of solid-state DSSC. These results show that, on the premise of a low defect density in the dye layer, appropriately increasing the thickness is helpful in improving the performance of the device. Higher doping concentrations of ETL and HTL can significantly improve the photoelectric parameters. Although the increase in temperature can enhance the short-circuit current, the narrowing of the material band gap leads to a decrease in the open-circuit voltage, and the overall efficiency is somewhat reduced. Improving the work function of the back contact metal optimizes the characteristics of the HTL/ metal interface. Among them, carbon materials show good application prospects due to their performance, cost and resource advantages. Based on an in-depth analysis of various influencing factors, we systematically optimize the device parameters and finally achieve excellent performance with Voc=0.950 V, Jsc=19.84 mA·cm-2, FF of 79.80%, and PCE of 15.05%. It provides theoretical support for the structural design and performance improvement of solid-state DSSC. This study not only helps promote the development of solid-state DSSC towards commercialization but also provides a feasible path for its application in fields such as large-scale photovoltaic system integration and green energy utilization. It is worth noting that compared with the theoretical efficiency limit, there is still considerable room for improvement in the device performance. In the future, strategies such as optimizing the molecular structure of dyes to expand the absorption range and introducing an interface passivation layer to reduce recombination losses can be adopted to further enhance the performance and stability of the devices.
Aug. 15, 2025Vol. 45 Issue 15 1523003 (2025)
Tengfei Chai, Xiaoyun Liu, Siyu Gao, Ying Liu, Hongwei Wang, Yumeihui Jin, and Yueqiu Jiang
ObjectiveOptical vortex beam (OVB) is characterized by orbital angular momentum (OAM), a helical phase front, and a dark core, demonstrating promising applications in quantum entanglement, optical imaging, nonlinear optics, and optical communication. The ring-like intensity distribution of an OVB can be described by exp(imθ), where m, the topological charge, is proportional to the photon’s OAM. OVB signals employing different coding modes demonstrate resistance to interference and improve data transmission rate and communication capacity. However, atmospheric turbulence and aberrations significantly degrade the performance of OVB in practical applications. Spherical aberration, a common coaxial aberration typically represented by the coefficient kC4, significantly affects beam spreading and energy dispersion. Atmospheric turbulence significantly affects the propagation of beams with spherical aberration. Studies have shown that positive spherical aberration beams exhibit a comparatively smaller divergence effect, whereas negative spherical aberration beams are more susceptible to turbulent conditions, leading to increased beam spreading and energy dispersion. Moreover, the effect of spherical aberration on beam drift intensifies with increasing transmission distance. Consequently, a network model based on depthwise separable convolutions is proposed for the concurrent identification of topological charges and spherical aberration coefficient of spherical aberration vortex beams transmitted through atmospheric turbulence.MethodsWe developed a neural network model, SepNet, based on depthwise separable convolutions, to simultaneously identify the topological charge and spherical aberration coefficient from spot images. The SepNet architecture comprises an input layer, an initial convolutional module, depthwise separable convolutional modules, a final convolutional module, an adaptive global pooling layer, and a fully connected layer. The model took a single-channel spot image and associated parameters as input. The initial convolutional module utilized two convolutional layers, incorporating batch normalization (BN) and a rectified linear unit (ReLU) activation function, for feature extraction and spatial downsampling. The depthwise separable convolutional modules consist of three repeated blocks, each with a similar internal structure and progressively increasing number of channels, so as to enhance representational capacity. Skip connections were integrated into these blocks to mitigate gradient vanishing. The final convolutional module consists of two layers designed to extract high-level semantic features. An adaptive global pooling layer transformed the feature map into a feature vector, which was then flattened and input to the fully connected layer, consisting of two independent dense layers. To enhance model generalization and prevent overfitting, a dropout mechanism was implemented before the fully connected layer, effectively reducing reliance on specific input features and enhancing robustness. The topological charge and spherical aberration coefficient changed within the range of [1.1, 5.0], with an interval of 0.1. We utilized the SepNet model to investigate the influence of different turbulence intensities and transmission distances on the identification of topological charges and spherical aberration coefficient in vortex beams carrying spherical aberration phases and propagating through turbulent media.Results and DiscussionsThe results of the study demonstrate that the SepNet model achieves optimal recognition performance for turbulence intensity values of 2000 m, 3000 m, and 4000 m, respectively, and that all three evaluation metrics (including Precision, Recall, and F1-score) are at 100%, as shown in Fig. 4(a). At the transmission distance of 3000 m and turbulence intensities of 10-16 m-2/3 and 10-15 m-2/3, the model maintains optimal performance with all metrics at 100%. Increasing the turbulence intensity to 10-14 m-2/3 results in good recognition performance for the topological charge, with corresponding metrics reaching 100%, while the spherical aberration coefficient metrics decrease to 99.61%, 99.52%, and 99.56% [Fig. 4(b)]. In the comparative study of the performance of the two groups of models, all models exhibit high proficiency in identifying topological charges. However, when the identification of the spherical aberration coefficient kC4 is identified, the SepNet model demonstrates superior performance, achieving success rates exceeding 99.50% across all three evaluation metrics and indicating a notable improvement over Resnet 18, Resnet 34, and Xception models (Table 1). The topological charge range is expanded to [1.1, 7.0] (with an interval of 0.1), while the spherical aberration coefficient range remains at [1.1, 5.0] (with an interval of 0.1). The SepNet model’s combined performance in identifying topological charges and spherical aberration coefficient outperforms Resnet 18, Resnet 34, and Xception models (Table 2). The experimental results demonstrate the superiority of SepNet in terms of network performance. Moreover, an evaluation of the generalization ability and robustness of the SepNet model is conducted. It is demonstrated that the model can maintain a high level of accuracy in scenarios where the turbulence intensity is unknown (Fig. 5?7).ConclusionsWe propose a neural network model, SepNet, based on depthwise separable convolution and investigate its performance under atmospheric turbulence conditions. We examine the influence of varying atmospheric turbulence intensities and transmission distances on the model’s recognition accuracy. The results demonstrate that SepNet demonstrates high performance in the recognition of topological charges and spherical aberration coefficient, exhibiting high stability. Notably, under strong turbulence conditions (Cn2=10-14 m-2/3), at a transmission distance of 3000 m, SepNet exhibits the best overall performance compared to Resnet 18, Resnet 34, and Xception. Moreover, the SepNet model has shown good generalization capabilities and robustness, retaining high accuracy in scenarios even where the turbulence intensity is unknown. These research findings have important implications for the design of OAM encoding approaches used in free-space optical communication systems. Although this paper has investigated the combined effects of spherical aberration and atmospheric turbulence on topological charge identification, practical applications are often confronted with complex and variable atmospheric conditions. Beyond turbulent effects, phenomena such as gas absorption and scattering are also frequently encountered. Therefore, to enhance the practicality and performance of the SepNet model, multi-scenario testing is essential, along with the integration of advanced architectures such as attention mechanisms and inverted residual structures to improve its adaptability and robustness in complex atmospheric environments.
Aug. 15, 2025Vol. 45 Issue 15 1526001 (2025)
Hui Chen, and Zixu Li
ObjectiveWith the rapid advancement of remote sensing imaging technology, remote sensing image classification has become a critical research focus due to its foundational role in tasks such as agricultural management, urban planning, and disaster monitoring. However, existing methods still suffer from insufficient discriminative feature extraction, challenges in capturing global relationships and long-range dependencies, and low computational efficiency. To address these limitations, this study proposes a novel remote sensing image classification model, GCDM-Mamba, which integrates attention mechanisms and the Mamba architecture to enhance both accuracy and efficiency.MethodsThis paper presents GCDM-Mamba, a remote sensing image classification model that combines attention mechanisms with the Mamba architecture. The model incorporates a spatial grouping coordinate attention (GSCA) module, which utilizes global information from feature map spatial dimensions to generate attention maps. These maps subsequently weight the input feature maps to enhance feature expression capabilities. Additionally, the model employs position encoding to capture spatial information and implements a class token to generate global semantic representation for the input sequence, providing comprehensive category information. The proposed dual-stream multi-directional Mamba encoder (DMME) extracts features in parallel across the channel dimension and implements a multi-directional state space model (MDS) to capture spatial information in remote sensing images.Results and DiscussionsThe GCDM-Mamba network model utilizes the GSCA module (Fig. 3) to leverage global information from the spatial dimensions (height and width) of feature maps for constructing attention maps, which then weight the input feature maps to enhance feature representation. Experimental results demonstrate that after integrating the GSCA module, the model’s precision (P), recall (R), and F1 score (F1) improved by 2.26 percentage points, 2.22 percentage points, 2.23 percentage points on the UCM dataset; 2.22 percentage points, 2.23 percentage points, 2.13 percentage points on the AID dataset; and 2.32 percentage points, 2.41 percentage points, 2.43 percentage points on the NWPU-RESISC45 dataset respectively (Table 4). Through parallel processing of channel-wise feature extraction via the DMME module and multi-directional SSM module (Fig. 4), the model simultaneously enhances feature extraction capabilities and computational efficiency. Experiments reveal that with the DMME module, the model’s P, R, and F1 increased by 1.75 percentage points, 1.90 percentage points, 1.94 percentage points on the UCM dataset; 1.85 percentage points, 1.91 percentage points, 1.85 percentage points on the AID dataset; and 1.52 percentage points, 1.58 percentage points, 1.58 percentage points on the NWPU-RESISC45 dataset (Table 4). Comparative experiments confirm that the GCDM-Mamba model achieves state-of-the-art classification performance across all three datasets, outperforming the current best model RSMamba-H with F1 improvements of 1.88 percentage points, 1.78 percentage points , and 1.15 percentage points respectively (Table 1, Table 2, Table 3).ConclusionsTo address the challenges of insufficient feature discrimination and low computational efficiency in remote sensing image classification tasks, a novel method named GCDM-Mamba is proposed. The method begins by employing a GSCA module, where feature maps are grouped and processed through average pooling and max pooling along the height and width dimensions to construct attention maps. These maps utilize multi-dimensional global information to weight the input feature maps, thereby enhancing feature representation. Subsequently, positional embeddings are integrated to capture spatial information, while a class token is adopted to provide global category-related context for the entire image. Finally, DMME is introduced to further improve computational efficiency and strengthen the network’s ability to model long-range dependencies. Experimental evaluations on the UCM, AID, and NWPU-RESISC45 datasets demonstrate that the proposed GCDM-Mamba achieves superior classification performance compared to existing methods. With reduced parameters, the model effectively extracts image features and captures long-range dependencies, validating its effectiveness in remote sensing image classification tasks.
Aug. 08, 2025Vol. 45 Issue 15 1528001 (2025)
Jiajun Wu, Chen Chen, Xiaoyuan Liu, Binfeng Ju, and Din Ping Tsai
SignificanceMetasurfaces represent a paradigm shift in optical device design, offering unprecedented capabilities for manipulating light at subwavelength scales. High-dimensional perceptual systems that integrate spectral, spatial, and geometric information are emerging as the core enablers of next-generation artificial intelligence (AI)-driven machine vision and autonomous decision-making. Leveraging their compact, ultrathin, and highly integrable design, metasurfaces are highly compatible with the demands of advanced high-dimensional perceptual systems. In advanced multispectral imaging and image feature detection, such as hyperspectral sensing, depth mapping, and edge recognition, metasurfaces enable functionalities that are difficult or impossible to realize with traditional bulky optics. By integrating these functionalities through metasurfaces, optical hardware can be significantly simplified while enabling new paradigms of intelligent and data-driven imaging. This is especially crucial for portable, energy-efficient, and high-resolution systems required in applications ranging from environmental monitoring to space exploration and biomedical diagnostics. We highlighted recent breakthroughs in metasurfaces-based spectral imaging and feature detection and emphasized the transformative potential of integrating AI into these systems. The synergy between metasurfaces and AI is expected to promote smart sensing and autonomous perception.ProgressOver the past decade, metasurfaces have emerged as a groundbreaking new class of flat optical devices with significant application potential. Enabled by tailored nanoresonators and subwavelength structures, metasurfaces allow precise control over the phase, amplitude, polarization, and dispersion of optical waves. These capabilities have significantly advanced next-generation spectral imaging and optical information processing, particularly in scenarios where traditional bulky and multi-element optical systems are constrained by size and integration complexity.In the field of hyperspectral imaging, a variety of novel approaches have been proposed to realize lightweight, high-resolution, and multi-band integrated spectral imaging systems. According to the underlying working principles, metasurfaces-based spectral imaging strategies can be classified into three main categories: dispersive type, narrowband filtering type, and computational reconstruction type. For each category, we outlined the fundamental operational mechanisms and summarized the current state-of-the-art developments. Unlike achromatic metasurfaces, dispersive spectral imaging metasurfaces spatially separate different wavelengths onto distinct positions on the image sensor, thereby enabling the acquisition of multispectral images (Fig. 1). Researchers have explored the applications from spectral detection toward multispectral imaging based on metasurfaces. Another promising method for multispectral imaging is to use narrowband filter arrays, where each filter is designed to transmit a specific wavelength band (Fig. 2). Metasurfaces-enabled narrowband filtering offers potential for lightweight integration and tunable spectral filtering functionalities. Computational spectral imaging reconstructs the original spectral image by establishing a spectral transfer model (Fig. 3 and Fig. 4). This approach mitigates the low efficiency caused by filtering and achieves high spatial and spectral resolution, making it a promising direction for the next-generation of spectral imaging technologies.In parallel, researchers have also recently explored metasurfaces?based techniques for depth and edge feature detection. Depth sensing enables devices to perceive the spatial positions of objects, whereas edge detection facilitates the identification of their geometric contours. In this review, depth sensing techniques were classified as either passive or active, depending on whether external illumination is required. Passive methods based on meta-lenses (Fig. 6) and active approaches that employ metasurfaces to generate structured light (Fig. 7) currently represent the dominant research directions. In comparison, active depth sensing based on metasurfaces can achieve higher spatial/angular resolution and a wider measurement field of view (FOV), yielding markedly denser point clouds and broader angular coverage than traditional components. Edge feature detection is a paradigmatic optical analog computing application. It significantly reduces data?processing requirements while preserving essential image characteristics. Leveraging the principle of optical differentiation, metasurfaces-based devices can perform direct edge imaging, offering a low?power and real?time solution for extracting edges from large?volume image data (Fig. 8 and Fig. 9).It is worth noting that with the rapid development of computer computing power over the past two decades and the breakthroughs in technologies such as deep learning, the convergence of AI and metasurfaces has emerged and was discussed in this review. In this context, AI serves both as a powerful tool for inverse design and optimization of metasurfaces and as a robust means for data?driven post?processing in metasurfaces?based optical systems (Fig. 5 and Fig. 10). Finally, building upon the aforementioned advances, we discussed the prospects of metasurfaces in demanding environments such as marine and space applications, underscoring their exceptional performance (Fig. 11).Conclusions and ProspectsWith continuous advancements in nanofabrication techniques and optimization methodologies, a variety of high-performance metasurfaces-based devices have emerged these years. In the fields of hyperspectral remote sensing imaging and compact machine vision detection systems, metasurfaces-based devices have demonstrated performance that surpasses traditional complex optical systems. Moreover, their unique advantages of miniaturization and low power consumption make them more suitable for widespread integration into microdevices. It is widely anticipated that AI-assisted advancements in metasurface design and applications will represent a key direction for future development. These emerging breakthroughs are expected to enable the practical deployment of meta-devices in complex and demanding environments. In the near future, optical components based on metasurfaces are likely to become integral parts of our daily life, serving as core elements of next-generation optical systems.
Aug. 15, 2025Vol. 45 Issue 15 1500001 (2025)
Peng Shan, Menghao Zhi, Teng Liang, Guodong Pan, Zhigang Li, and Zhonghai He
ObjectiveAttenuated total reflection Fourier transform infrared spectroscopy (ATR-FTIR) has emerged as a critical analytical technique for characterizing complex mixed solutions, including glutamate fermentation broths and biological fluids such as blood. However, its quantitative accuracy is often compromised by the interplay of physical and chemical factors. Physical variations, such as fluctuations in optical path length, refractive index mismatches, and light scattering, introduce multiplicative scaling distortions across spectral bands. Concurrently, chemical interactions, such as hydrogen bonding between analytes and solvents or conformational changes in macromolecules, generate component-specific spectral shifts. Traditional correction methods, primarily developed for near-infrared (NIR) spectroscopy, typically rely on a single global scaling factor to address multiplicative effects. These approaches fail to disentangle the spatially heterogeneous distortions inherent to ATR-FTIR spectra, where physical and chemical effects are tightly coupled. To overcome this limitation, we proposed the bidimensional modified optical path length estimation and correction algorithm (Bi-OPLECm), which introduces a dual-layer parameterization framework to systematically decouple and correct these effects.MethodsBi-OPLECm employs a hierarchical model to decompose multiplicative distortions into two distinct layers. The first layer addresses sample-wide physical effects through a single outer parameter that accounts for global variations in optical path length and refractive index. The second layer incorporates analyte-specific inner parameters to model chemical interactions that differentially alter spectral bands associated with individual components. The algorithm iteratively optimizes these parameters using an alternating strategy over ten cycles. Initially, the inner parameters were fixed while the outer parameter was estimated via constrained least-squares optimization within a low-dimensional subspace defined by spectral singular values. Subsequently, the outer parameter was held constant while each inner parameter was calibrated by minimizing the root mean squared error (RMSE) of partial least squares (PLS) regression models during both calibration and prediction phases. Spectral datasets were partitioned into training and test subsets using the SPXY algorithm at a 3∶1 ratio, ensuring representative sampling across mass concentration ranges. PLS models were further refined through five-fold cross-validation to determine the optimal number of latent variables, balancing model complexity and predictive performance.Results and DiscussionsThe efficacy of Bi-OPLECm was validated on two datasets: γ-PGA (151 samples containing glucose and sodium glutamate) and blood (106 samples containing glucose and triglycerides). For the γ-PGA dataset, Bi-OPLECm reduces the RMSEP by 26.2% for glucose from 2.439 to 1.801 and 11.0% for sodium glutamate from 0.929 to 0.827 compared to uncorrected spectra. In blood analysis, improvements are even more pronounced, with RMSEP reductions of 18.5% for blood glucose from 1.801 to 1.467 and 43.5% for triglycerides from 2.108 to 1.190. When benchmarked against the traditional single-parameter OPLECm method, Bi-OPLECm achieves RMSEP reductions of 24.4%, 10.7%, 16.6%, and 34.9% for the four analytes, respectively. These improvements are accompanied by substantial increases in test set R2 values, reflecting enhanced model robustness and predictive reliability. The success of Bi-OPLECm lies in its ability to isolate physical effects—common to all spectral features—from chemical distortions that selectively influence specific functional groups. For instance, hydrogen bonding between glutamic acid molecules and water alters carboxylate absorption bands, while glucose hydroxyl stretching modes are sensitive to solvation dynamics. By resolving these distinct contributions, the algorithm mitigates overcorrection and undercorrection artifacts common in single-factor methods.ConclusionsBi-OPLECm represents a significant advancement in multiplicative effect correction for ATR-FTIR spectroscopy. By integrating a global physical scaling factor with analyte-specific chemical adjustment parameters, the algorithm effectively addresses the spectral heterogeneity inherent to complex mixtures. The alternating optimization framework ensures stable parameter estimation and guards against overfitting, as evidenced by consistent cross-validation results. Practical applications span industrial bioprocess monitoring, clinical diagnostics, and environmental analysis, where accurate quantification of multicomponent systems is essential. Future work will explore adaptive parameterization schemes for dynamic systems and integration with deep learning architectures to further enhance computational efficiency. Our study not only extends the methodology of ATR-FTIR spectroscopy but also provides a generalizable solution for correcting multiplicative distortions in other vibrational spectroscopy modalities.
Jul. 27, 2025Vol. 45 Issue 15 1530001 (2025)
Muran He, Bowen Zhu, Qiao Pan, and Weimin Shen
ObjectiveImaging spectrometers enable simultaneous detection of target images and spectra, finding widespread applications in agroforestry monitoring, mineral exploration, and ecological environment surveillance. When comparing convex and concave grating imaging spectrometers, plane grating imaging spectrometers demonstrate superior relative aperture and spectral resolution, making them particularly advantageous for detecting fine spectra of geographical objects, such as monitoring greenhouse gases in specific areas. However, as the field-of-view expands, the inherent spectral distortion of plane gratings increases significantly, adversely affecting the instrument’s spectral response consistency and reducing detection accuracy for edge targets with large field-of-view. To address the challenge of eliminating spectral distortion in ultra-high spectral resolution imaging spectrometers with large field-of-view, this study proposes utilizing prisms with specific vertex angle direction and incidence angle to counteract plane grating spectral distortion. To validate this correction method’s feasibility, an imaging spectrometer featuring ultra-high spectral resolution, large field-of-view, and low spectral resolution is designed.MethodsInitially, the concepts of spectral distortions, including smile and keystone, are introduced to demonstrate the necessity for elimination. Subsequently, a spectral distortion model for the plane grating spectrometer system is established, with calculation formulas for smile and keystone derived from definitions and geometric relationships. A transmissive plane grating spectrometer system example is presented, and spectral distortion calculations are performed. The mechanism of prism correction for smile at central wavelength is then proposed, followed by calculations of spectral distortion in the prism-grating+prism spectrometer system. Incorporating distortion introduced by the focusing system, the minimum achievable smile and keystone for the prism-plane grating imaging spectrometer are analyzed and predicted. Finally, four prism-plane grating configurations are comparatively evaluated based on application requirements, leading to the selection of the spectrometer system structure. An imaging spectrometer incorporating ultra-high spectral resolution, large field-of-view, and low spectral distortion is designed.Results and DiscussionsThe smile introduced by high groove density plane grating is much larger than the keystone (Fig. 3). The prism with specific vertex angle facing chief ray of edge field-of-view can completely offset the smile at central wavelength (Fig. 4). The smile at both edge wavelengths is approximately equal in value but opposite in direction, and the keystone at both edge wavelengths is approximately equal in value and has the same direction (Fig. 5). So, the distortion of image-plane spectrum after correction by prism is just like pillow-shaped distortion (Fig. 6). By introducing a certain amount of negative distortion of the focusing system, the smile and keystone of the spectrometer system can be corrected to a small value at the same time. Four prism-plane grating spectrometer systems including PG structure, P+PG structure, PG+P structure and PG+P+P structure with the same requirements are designed and compared (Fig. 8), and the results show that PG+P+P structure can eliminate spectral distortion better and have medium size (Table 2). In order to verify the feasibility of the correction method, we design an imaging spectrometer based on PG+P+P structure with 0.06 nm ultra-high spectral resolution and 16° large field-of-view corresponding to 84 mm long slit length (Fig. 9). The results show that the imaging spectrometer has good imaging quality (Figs. 9 and 10) and low smile and keystone of about 1 μm (Fig. 12).ConclusionsThis study addresses the challenge of correcting spectral distortion in large field-of-view imaging spectrometers with ultra-high spectral resolution and improving spectral fidelity through investigation of a prism-plane grating spectrometer system. A spectral distortion model establishes the distortion characteristics of the prism-plane grating spectrometer system, revealing the mechanism of prism-based correction for plane grating spectral distortion. Comparative analysis of various prism-plane grating configurations validates the theoretical analysis. Results demonstrate that immersing the plane grating within a prism and incorporating two additional prisms at specific incidence angles effectively reduce spectral distortion to 1 μm for an ultra-high spectral resolution plane grating imaging spectrometer with 0.06 nm spectral resolution and 84 mm slit length, substantially reducing post-processing data requirements.
Aug. 13, 2025Vol. 45 Issue 15 1530002 (2025)
Long Geng, Yifan Cheng, Chen Wang, Kaiwen Sun, Peng Suo, Xian Lin, Di Wu, Xinjian Li, and Guohong Ma
ObjectiveSince the discovery of graphene in 2004, two-dimensional (2D) materials, owing to their atomic-scale thickness, absence of surface dangling bonds, and quantum confinement effects, have provided a revolutionary platform for the design of optoelectronic and spintronic devices. Semiconducting transition metal dichalcogenides (TMDs) represented by MoS2 can achieve tunable bandgaps (1.2?1.9 eV) through layer-number modulation. However, their inherently low carrier mobility and environmental sensitivity limit their applications in high-frequency optoelectronics. Moreover, most 1T-phase TMDs are prone to oxidation and instability in air, and their high phase-transition energy barriers pose challenges to controllable preparation. As a member of TMDs, MoTe2 has a 1T′ phase (semi-metal) and a 2H phase (semiconductor) that stably exist at room temperature, as well as a Td phase (semi-metal) that exists only at low temperatures (<240 K), endowing it with rich phase-transition conditions. We focus on the 1T′-MoTe2 semimetallic thin film at room temperature to deeply analyze its ultrafast carrier dynamics mechanism and obtain key material parameters, laying a solid theoretical foundation for the design of ultrafast optoelectronic devices based on MoTe2.MethodsWe utilize a self-built optical pump-terahertz probe (OPTP) spectroscopy system. An ultrafast pulsed laser output from a titanium-doped sapphire regenerative amplifier is employed as the light source. The laser has a central wavelength of 780 nm, a pulse width of 120 fs, a repetition rate of 1 kHz, and a single-pulse energy of 3 mJ. In this system, the laser is split into generation light, pump light, and probe light by beam splitters. The generation light is focused on a 1-mm-thick ZnTe crystal with a 110 orientation to generate terahertz waves. These waves are then collimated and focused onto the detection crystal ZnTe. By using the Pockels effect induced by the terahertz wave electric field, combined with a balanced photodetector and a lock-in amplifier, the synchronous detection of terahertz signals is achieved. By moving the delay line of the pump light path, the change in the terahertz instantaneous transmittance induced by light is accurately measured, thereby obtaining the kinetic information of non-equilibrium carriers. Simultaneously moving the delay lines of both the pump and probe light paths allows for the measurement of terahertz transmission spectra at different pump delay time. Combined with relevant formulas, the change in the transient conductivity of the photo-excited sample is calculated, providing data support for the study of carrier dynamics.Results and DiscussionsA series of innovative results are achieved in the experiment. Under 780-nm light excitation, the 1T′-MoTe2 thin film exhibits positive terahertz photoconductivity, and its decay process shows obvious biexponential characteristics: a sub-picosecond fast process and a hundred-picosecond slow process. Through in-depth analysis, it is determined that the fast process originates from electron-phonon coupling, during which hot electrons rapidly transfers energy to optical phonons. The slow process is dominated by phonon-phonon interactions, facilitating the diffusion of heat in the lattice until thermal equilibrium with the environment is reached. By fitting the pump-dependent fast process using the two-temperature model (TTM), the electron-phonon coupling coefficient g∞ of 1T′-MoTe? is accurately obtained as 7.7×10¹⁵ W·m-3·K-1, and the electron specific heat coefficient γ is 2.1 J·m-3·K-2, indicating a relatively high electron-phonon coupling strength in this semimetallic phase. When we study the complex photoconductivity of 1T′-MoTe2, fitting with the Drude?Smith model reveals that the enhanced localization trend of the fitting parameter c with the increase in the delay time before 0.6 ps might imply the rapid formation and dissociation of certain quasiparticles (such as large polarons). Although this phenomenon still requires further experimental verification, it provides a new perspective for studying carrier behavior.ConclusionsBased on the comprehensive research results, it can be concluded that the relaxation of non-equilibrium carriers in the 1T′-MoTe2 semimetallic thin film under photoexcitation is mainly dominated by the electron?phonon coupling and phonon?phonon interactions. It is the first to comprehensively explore the ultrafast carrier dynamics of 1T′-MoTe2 using the optical pump-terahertz probe ultrafast spectroscopy among the massive literature. We clarify the physical mechanism of non-equilibrium carrier relaxation, which is derived from electron?phonon coupling and phonon?phonon interactions. Moreover, the relationship between the time constant of the fast process of non-equilibrium carrier relaxation and the excitation power density can be effectively described by the two-temperature model. These results not only deepen the understanding of the carrier dynamics of 2D semimetallic materials but also provide a crucial theoretical basis and accurate experimental data for the design and development of ultrafast optoelectronic devices based on 1T′-MoTe2, strongly promoting the applied research of two-dimensional materials in the field of terahertz optoelectronics.
Aug. 07, 2025Vol. 45 Issue 15 1530003 (2025)
© Copyright 2018-2021 | Chinese Laser Press.
All Rights Reserved 沪ICP备15018463号-20