


Please enter the answer below before you can view the full text.


2025
Volume: 45 Issue 12
45 Article(s)

Beibei Xie, Wang Gao, Yingjie Wang, Kaijie Ma, and Xiuzhi Kong
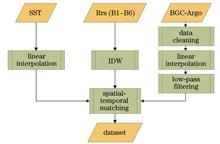
ObjectiveColored dissolved organic matter (CDOM) plays a pivotal role in the global carbon cycle and climate change. The rapid development of satellite remote sensing technology has provided a vast amount of ocean surface remote sensing data for oceanographic research, reflecting the internal state of the ocean to a certain extent. We combine multi-source ocean remote sensing data with deep learning techniques to propose a remote sensing inversion method for subsurface CDOM in the ocean. This method inverses the vertical distribution of subsurface CDOM by employing ocean surface remote sensing data, thus providing a new perspective and theoretical support for a deeper understanding of the mechanisms of the ocean carbon cycle and its interactions with climate change.MethodsFirstly, the CDOM profile data obtained from BGC-Argo is preprocessed to address the uncertain vertical resolution. By conducting linear interpolation, the data is standardized to an interval of 1 m, ensuring consistency in depth between data points for subsequent analysis. Additionally, a low-pass filter is adopted to reduce peak fluctuations in the data, enhancing its smoothness and reliability. To address the missing ocean remote sensing data, we employ the inverse distance weighting (IDW) interpolation method, effectively filling in missing values in remote sensing images. The K-fold cross-validation method is utilized to evaluate the interpolation model, with the mean absolute percentage error (MAPE) selected as the evaluation metric. Given the spatial resolution mismatch between sea surface temperature (SST) data and remote sensing reflectance data, the bilinear interpolation algorithm is employed to reconstruct the resolution of the SST dataset, enhancing its resolution and ensuring spatio-temporal consistency of the model input data. Finally, based on the convolutional neural network (CNN) model, we design a subsurface CDOM inversion model for the ocean, adopting multi-band remote sensing reflectance, SST, and other parameters as inputs. This model consists of an input module, a CNN feature extraction module, and a prediction module, enabling the vertical distribution prediction of subsurface CDOM concentration in the ocean. As a result, the model’s applicability is evaluated via a test set and two independent test areas.Results and DiscussionsThe filtered profile data of CDOM of the ocean exhibits smoother and more stable characteristics, effectively eliminating the interference of outliers on the overall data trend (Fig. 3). To achieve spatio-temporal consistency between BGC-Argo data and remote sensing reflectance data, we employ the IDW method to interpolate missing values in remote sensing reflectance images and validate the spatial interpolation model through K-fold cross-validation. By taking the Rrs443 remote sensing data from the first day of each month in 2020 as an example, the initial distribution of remote sensing data is shown in Fig. 4, while the reconstructed remote sensing data after IDW spatial interpolation is presented in Fig. 5. During cross-validation, the K value is set to 5, with the MAPE employed as the evaluation criterion. The results indicate that the overall error of the interpolation model remains below 30%, demonstrating the sound performance of the interpolation model. The proposed inversion model achieves a root mean square error (RMSE) of 0.14 μg/L, a correlation coefficient (r) of 0.73, and a coefficient of determination (R2) of 0.74 in the test set. Furthermore, in the validation of two independent test areas, the RMSE values are 0.13 μg/L and 0.18 μg/L respectively, with r values of 0.81 and 0.74, and R2 values of 0.79 and 0.69 respectively. By analyzing the vertical distribution plots of predicted and actual values for independent test zones A and B (Figs. 8 and 9), combined with the residual scatter plot between predicted and actual values (Fig. 10), it is evident that the predicted values are mostly concentrated around the y=x diagonal with the actual values. This result demonstrates a high degree of consistency between the model’s predictions and the measured CDOM distribution characteristics, thereby confirming the validity and applicability of the proposed model. The correlation between the distribution of CDOM and SST is explored via the subsurface CDOM-SST scatter plot (Fig. 11), which further validates the rationality of the inversion results.ConclusionsWe leverage multi-band ocean remote sensing spectral data (B1: Rrs412; B2: Rrs443; B3: Rrs490; B4: Rrs510; B5: Rrs560; B6: Rrs665), SST remote sensing data, and BGC-Argo data, combined with a CNN model, to develop an inversion model for the vertical distribution of marine subsurface CDOM in the Northwest Pacific region (131°E?180°E, 26°N?54°N). To validate the accuracy of this model, we evaluate the performance of this model by adopting a test set, proving the model’s sound performance. Additionally, to further verify the model’s applicability, we conduct predictions for the vertical distribution of CDOM in two independent test areas, which reveals a high degree of consistency between the predicted and measured CDOM distribution characteristics, thereby proving the model’s effectiveness in presenting the vertical distribution characteristics of marine subsurface CDOM. Meanwhile, an analysis of the vertical distribution characteristics of subsurface CDOM in the Northwest Pacific region is conducted by utilizing the constructed vertical distribution maps of CDOM in the independent test areas. Notably, the mass concentrations in spring and summer are significantly higher than those in autumn and winter, with CDOM mass concentrations gradually increasing with depth. As a crucial component of the oceanic carbon cycle, the distribution and variation of CDOM significantly influence this cycle. We not only uncover these key features of the vertical distribution of marine subsurface CDOM but also provide a solid theoretical foundation and support for its inversion, facilitating a deeper understanding and prediction of the dynamic changes in the oceanic carbon cycle. However, our study has certain limitations. For instance, the IDW remote sensing data reconstruction method based on spatial correlation can be further optimized by incorporating factors such as time series to enhance the model’s ability to capture dynamic temporal changes. Additionally, considerations can be given to adjusting the model structure, increasing network depth, and exploring the inclusion of additional remote sensing parameters such as sea surface elevation and wind speed to delve deeper into the complex relationship between ocean remote sensing data and the vertical distribution of marine subsurface CDOM and improve prediction accuracy.
Mar. 26, 2025Vol. 45 Issue 12 1201001 (2025)
Lulu Wang, Hanwei Liang, Shengqiang Wang, Deyong Sun, and Hailong Zhang
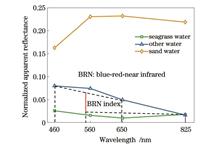
ObjectiveSeagrass, a typical aquatic flowering plant, thrives in shallow coastal and estuarine waters, playing an important role in maintaining ecosystem stability and facilitating the carbon cycle. However, it is currently facing a significant decline, necessitating effective monitoring. The coastal zone imager (CZI) onboard the HY-1C/D satellite provides 50-m resolution data and high-frequency observations twice every three days, facilitating satellite remote sensing of seagrass. In this study, we analyze the spectral differences among seagrass water, sand water, and other water types in Swan Lake using numerous CZI images from 2018 to 2023, employing the spectral-index method. We then propose a seagrass remote sensing detection model based on the constructed Blue-Red-NIR index (BRN index) and Δz index. The accuracy validation results show that this model performs well in both qualitative and quantitative assessments. Subsequently, we apply the seagrass remote sensing model to CZI images from 2023 to reveal trends in seagrass distribution based on cumulative pixel area and aggregation density. Overall, we provide a reference for monitoring seagrass resources using domestic satellites, which would be beneficial in broadening their application in marine resource monitoring.MethodsIn this study, we employ the spectral-index method to develop a seagrass remote sensing detection model. Firstly, we identify the substrate types for water in Swan Lake using in-situ surveys and star-earth matching technology, categorizing them into seagrass water, sand water, and other water (excluding the first two). Then, we select adequate pure samples for the aforementioned three water types through visual interpretation. Following this, we calculate the normalization of remote sensing reflectance of pixels and analyze the spectral differences between seagrass water, sand water, and other water based on numerous samples chosen from CZI images. Next, we discard sand water pixels, which exhibit higher normalized apparent reflectance than the other two water types in the red band. We further distinguish seagrass water from other water pixels by constructing two indexes, i.e., the BRN index and the Δz index. The BRN index denotes the difference between the green band and the NIR band, while the Δz index represents the difference between the blue band and the green band, and is used for separating seagrass water from other water pixels. Subsequently, the seagrass remote sensing detection model is developed based on these indexes, and a confusion matrix is employed to evaluate its performance.Results and DiscussionsThe accuracy evaluation indicates that the seagrass distribution detected by the seagrass remote sensing detection model closely aligns with that of the false-color images [Figs. 8(a) and 8(e)]. Furthermore, a comparison between the seagrass distributions detected by our model and another model using Landsat images, proposed by Liang et al., demonstrates that our model effectively monitors the majority of seagrass in the central part of Swan Lake [Figs. 8(b) and 8(f)], exhibiting good performance in the cumulative seagrass pixel area. Additionally, the confusion matrix results reveal that the seagrass detection model performs well, with Overall Accuracy (OA) exceeding 80% and F1-Score above 0.85 (Table 1). We then apply this model to CZI images from 2023 to calculate the cumulative pixel area and aggregation density, respectively. It is observed that the cumulative pixel area first increases and then decreases, specifically rising gradually from June to August before declining (Fig. 9), while aggregation density peaks in August (Fig. 10). Moreover, we observe stability with slight fluctuations in the cumulative pixel area from 2018 to 2023 (Fig. 11). Overall, the robust performance of the seagrass remote sensing detection model can be attributed to the normalization process based on numerous CZI images (Fig. 12). Furthermore, sensitivity analyses in turbid waters demonstrate that our model remains stable (Fig. 13). Looking ahead, future research should explore the applicability of the seagrass remote sensing detection model in other regions. Additionally, more high-spatial-resolution domestic satellite images, along with hybrid image decomposition technologies, need to be synthesized to achieve highly accurate seagrass detection.ConclusionsIn this paper, we propose a seagrass remote sensing detection model based on two constructed indexes, the BRN index and the Δz index, developed after analyzing the spectral differences among seagrass water, sand water, and other water using HY-1C/D CZI images. Accuracy evaluations show that this model aligns well with false-color images and seagrass distribution results detected by Landsat images. Moreover, it achieves OA exceeding 80% and an F1-Score above 0.85. When applying this model to CZI images from 2023, we find that the cumulative pixel area of seagrass increases from June to August and decreases after peaking in August. Aggregation density shows a similar trend, first increasing and then decreasing from June to October, peaking in September. We also observe stability with slight fluctuations in the annual changes in cumulative pixel area over the last six years. Our proposed seagrass remote sensing detection model using domestic HY-1C/D CZI satellite data provides a reference for monitoring seagrass resources with domestic satellites, broadening their application in marine resources monitoring.
Jun. 23, 2025Vol. 45 Issue 12 1201002 (2025)
Jin Xu, Peng Zhang, Hang Chen, Yuanxin Wang, Liang Wu, Sheng Luan, Heshu Wang, and Shoufeng Tong
ObjectiveRecently, some scholars have proposed inverted pin beam (IPB) with a Bessel-like shape and found that compared with Bessel beam (BB), pin beam (PB), and Gaussian beam (GB), IPB have a lower scintillation index during moderate to strong atmospheric turbulence transmission. Although IPBs have a superior anti-turbulence ability in long-distance transmission, the characteristic of the gradually increasing beam width during transmission will result in lower received power in the far field. Therefore, we propose nonuniformly correlated inverted pin beam (NUCIPB), which can further reduce the light intensity fluctuations and other perturbation effects caused by atmospheric turbulence and improve the received power in a certain range of the far field by introducing self-focusing characteristics with the assistance of nonuniform correlation modulation.MethodsBased on the coherent mode decomposition and random phase screen methods, a numerical simulation model of NUCIPB transmitting in atmospheric turbulence is built, and the light intensity evolution characteristics of the beam transmitting through free space and turbulent atmosphere are simulated and analyzed. The aperture averaged scintillation index, beam wander, and beam broadening are employed to evaluate the beam quality affected by atmospheric turbulence. On this basis, the average bit error rate (BER) of the system is calculated when the beams are adopted as a space optical communication link, and the transmission and communication performances of the NUCIPB, IPB, PB, BB, and GB are compared in the same conditions.Results and DiscussionsThe light intensity evolution during free space transmission of IPB and NUCIPB shows that the trend of spot size variations for NUCIPB and IPB is identical, but the intensity distribution of NUCIPB is more uniform. Meanwhile, NUCIPB also show the characteristics of Bessel-like distribution in the paraxial region. The difference is that it will degenerate into a Gaussian-like distribution after a certain distance, and the attenuation degree of light intensity along the axis increases significantly lower than that of IPB with the increasing transmission distance (Figs. 1?5). The fluctuation degree of light intensity for all beams increases with the rising transmission distance and turbulence intensity, and the corresponding communication performance also degrades gradually. The comparison of the two sizes of receiving apertures indicates that an increase in the receiving aperture can significantly reduce the scintillation index and the communication BER. Under strong turbulence and Ra=0.10 m, compared with GB, the scintillation index of BB, PB, IPB and NUCIPB decreases by 55.1%, 16.8%, 67.2%, and 78.0% respectively after atmospheric turbulence transmission of 10 km, and the BER also decreases by 50.7%, 12.6%, 63.4%, and 78.5% respectively (Figs. 8 and 13). The optical power in the two receiving apertures gradually decreases with the increasing transmission distance, and the greater turbulence intensity leads to a faster decline rate. The power in the bucket (PIB) of BB is greatly affected by the aperture size and NUCIPB will have self-focusing characteristics compared with IPBs during the transmission. In the case of strong turbulence and Ra=0.10 m, the PIB of NUCIPB at the focusing position will increase by nearly 38.6% compared with IPB (Fig. 9). Meanwhile, the beam spreading degree of NUCIPB after 10 km transmission in strong turbulence is 38.4%, 13.7%, 22.6%, and 5.1% lower than that of GB, BB, PB, and IPB respectively (Fig. 10). In terms of the degree of beam wander, NUCIPB have a certain advantage in weak to moderate turbulence for long-distance transmission (Fig. 11).ConclusionsWe propose and construct NUCIPB, and build an atmospheric turbulence transmission model based on the coherent mode decomposition and the random phase screen methods. The transmission and communication characteristics of NUCIPB are simulated, and compared with GB, BB, PB, and IPB, the simulation results show that as the transmission distance and turbulence intensity increase, the intensity fluctuations of all beams continually intensify, causing gradual degradation of corresponding communication performance. A comparison between two sizes of receiving apertures reveals that increasing the receiving aperture size can significantly reduce intensity scintillation and decrease the communication BER. Under strong turbulence and Ra=0.10 m, compared with GB, the scintillation index of BB, PB, IPB, and NUCIPB decreases by 55.1%, 16.8%, 67.2%, and 78% respectively after 10 km atmospheric turbulence transmission, and the BER also decreases by 50.7%, 12.6%, 63.4%, and 78.5% respectively. Additionally, the optical power in the two receiving apertures gradually decreases with the increasing transmission distance, and the greater turbulence intensity leads to a faster decline rate. The PIB of BB is greatly affected by the aperture size and NUCIPB will have self-focusing characteristics compared with IPB in the transmission process. Under strong turbulence and Ra=0.10 m, the PIB of NUCIPB at the focusing position will increase by nearly 38.6% compared with IPB. Meanwhile, with the rising transmission distance, beam spreading becomes more severe. There is little difference between beam spreading in weak and moderate turbulence intensity. Compared with GB, BB, PB, and IPB, the beam spreading of NUCIPB after 10 km is reduced by 38.4%, 13.7%, 22.6%, and 5.1% respectively. In terms of the degree of beam wander, NUCIPB have certain advantages in long-distance transmission under weak to moderate turbulence, but with the rising turbulence intensity, there is little difference between NUCIPB and IPB. Compared with fully coherent IPB, NUCIPB perform better in reducing the negative effects caused by turbulence, such as light intensity fluctuations, beam wander, and beam spreading. Meanwhile, due to the introduction of self-focusing characteristics, NUCIPB surpass IPB in far-field energy focusing within a specific transmission range, which can improve the far-field energy receiving efficiency. Although the current research is entirely based on simulation calculations to explore the performance of NUCIPB in atmospheric turbulence channels, we can further employ digital micro-mirror devices (a modulation rate of 17 kHz) and programmable lithium niobate SLMs (a modulation rate able to reach 5 MHz and 1.6 GHz respectively) with high modulation rates to construct NUCIPB and experimentally verify the feasibility of NUCIPB for free space optics (FSO) communication.
Jun. 23, 2025Vol. 45 Issue 12 1201003 (2025)
Shuai Feng, and Chao Ding
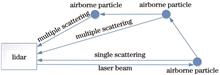
ObjectiveAtmospheric visibility plays a crucial role in aerospace, transportation, and environmental monitoring, directly affecting traffic safety and transportation efficiency. In automatic observation, visibility is represented by the meteorological optical range (MOR), defined as the path length through which the luminous flux of a parallel beam of light emitted by an incandescent lamp with a color temperature of 2700 K is attenuated to 5% of its initial value in the atmosphere. In photon counting mode, lidar captures return energy by receiving backscattered photon signals, which consist of both single-scattered and multiple-scattered photons. Single-scattered photons follow definite paths and directly convey target information, while multiple-scattered photons have complex trajectories and carry significant non-target information, increasing uncertainty and noise. To obtain the true atmospheric visibility, we need to calculate the actual extinction coefficient considering only single-scattered photon returns. However, since lidar cannot distinguish between single-scattered and multiple-scattered photons, the extinction coefficient directly derived from lidar return signals is the apparent extinction coefficient, which is influenced by multiple scattering. Therefore, in-depth research on lidar-based apparent extinction coefficient inversion and the multiple-scattering processes in the atmosphere is crucial for accurately calculating the actual extinction coefficient.MethodsWe derive the relationships among the actual extinction coefficient, apparent extinction coefficient, and multiple-scattering factor based on the lidar equation and the parameterized lidar equation, laying a theoretical foundation for subsequent analysis. Then, we generate 10000 sets of simulated signals under typical weather conditions and construct a comprehensive dataset by combining these simulated signals with real measurement data. This ensures that our model has broad adaptability and accurately reflects the complexities in practical applications. After that, we perform data preprocessing to enhance the linear correlation between features and labels and train the temporal convolutional network (TCN). This neural network model can accurately estimate the atmospheric apparent extinction coefficient by analyzing lidar return signals. Based on the apparent extinction coefficient estimated by the TCN, we determine an initial scattering free path and conduct multiple-scattering simulations to obtain an initial multiple-scattering factor and simulated photon number. We then calculate the relative error between the simulated photon number and the theoretical photon number derived from lidar return signals. If the relative error exceeds a predetermined threshold, we correct the scattering free path using the multiple-scattering factor and repeat the multiple-scattering simulation. This iterative process continues until the error falls below the set threshold, yielding the final multiple-scattering factor. Finally, we substitute the estimated apparent extinction coefficient and final multiple-scattering factor into the derived relationships to accurately calculate the actual extinction coefficient.Results and DiscussionsUnder low visibility conditions, the visibility calculated by our proposed method shows significant differences compared to the results without considering multiple-scattering effects. Simulation results show that at a visibility of 100 m, the initial accuracy of the multiple-scattering simulation is relatively low, with substantial deviations between the simulated photon number/multiple-scattering factor and theoretical value. However, as the number of iterations increases, the accuracy of the multiple-scattering simulation gradually improves, with the simulated photon number and multiple-scattering factors converging towards the theoretical values (Figs. 8 and 9). The mean actual extinction coefficient calculated by our proposed method is 29.45 km-1, with a relative error of 1.70% compared to the theoretical value. In contrast, the mean actual extinction coefficient obtained using the Klett algorithm is 25.88 km-1, with a relative error of 13.61%. Correspondingly, the average visibility calculated by our proposed method is 101.73 m, while the Klett algorithm yields a visibility of 115.76 m. The root mean square errors of the actual extinction coefficients calculated by our proposed method and the Klett algorithm relative to the theoretical values are 10.49 and 18.63, respectively. The calculated results by our proposed method is closer to the theoretical values, and the calculated visibility is more accurate (Fig. 10). At visibility of 800 m, the multiple-scattering photon number is relatively low, and the effect of multiple scattering on the return signal is smaller (Fig. 11). Using our proposed method, only one iteration is required, and the return signal is nearly identical to the theoretical value, while the multiple scattering factor approaches the theoretical value (Figs. 13 and 14). The mean actual extinction coefficient calculated by our proposed method is 3.73 km-1, while that of the Klett algorithm is 3.68 km-1. Compared to the theoretical value, the relative errors are 0.26% and 1.60%, respectively, with root mean square errors of 0.27 and 0.30. The average visibility calculated by our proposed method is 803.21 m, while the Klett algorithm gives 814.13 m. For the experimental signals, we select two actual lidar return signals, A and B, with measured visibilities of 1.41 and 4.44 km, respectively (Fig. 16). The visibility calculated by our proposed method for these signals is 1.23 and 5.93 km, while the Klett algorithm calculates 1.26 and 6.06 km. Compared to the measured values, the relative error for signal A is 2.44% for the Klett algorithm and 0.81% for our proposed method, with a reduction of 1.63 percentage point. For signal B, the relative errors are 2.19% for the Klett algorithm and 1.01% for our proposed method, with a reduction of 1.18 percentage point (Figs. 17 and 18). These results demonstrate that our proposed algorithm, which accounts for multiple-scattering effects, offers significant advantages over the Klett method which does not consider multiple scattering, thus validating its effectiveness under multiple-scattering conditions.ConclusionsWe propose an iterative solution algorithm for atmospheric visibility based on the TCN and multiple-scattering simulation. This algorithm is used to solve the actual extinction coefficient and improve the accuracy of visibility inversion under multiple-scattering conditions. It estimates the apparent extinction coefficient through a TCN, then repeats multiple-scattering simulations to obtain multiple-scattering factors, and finally solves for the actual extinction coefficient to obtain atmospheric visibility. The simulation results show that under visibility conditions of 100 and 800 m, the algorithm we propose significantly improves the accuracy of visibility calculation compared to the case without considering multiple scattering. The comparison of measured signals and calculation results also confirms this conclusion. The advantage of our algorithm is that in estimating the apparent extinction coefficient, the TCN effectively avoids the cumulative error caused by the calculation error of the boundary value of the apparent extinction coefficient. In multiple-scattering simulations, iterative correction of the scattering free path is used to gradually improve simulation accuracy, ultimately enabling accurate calculation of multiple-scattering factors and actual extinction coefficients.
Jun. 23, 2025Vol. 45 Issue 12 1201004 (2025)
Erchang Sun, Xianhua Wang, Hanhan Ye, Shichao Wu, Hailiang Shi, Chao Li, and Yuan An
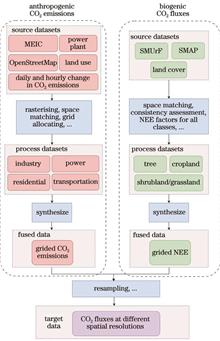
ObjectiveUrban areas contribute approximately 70% of global anthropogenic carbon dioxide (CO2) emissions, making them a key area in carbon monitoring efforts. The “top-down” approach, which uses measured atmospheric CO2 concentrations, allows for near real-time emission estimates on a global urban scale and serves as a crucial tool for verifying urban emission reductions. Currently, the prior estimates of urban CO2 fluxes in top-down assessments rely on data from open-source data inventory for anthropogenic CO2 (ODIAC) and vegetation photosynthesis and respiration model (VPRM). However, these prior fluxes possess high spatial uncertainty, resulting in significant bias in urban emission estimates and failing to meet the sub-kilometer resolution required for urban grids. In our study, we construct a high-resolution spatial and temporal dataset for urban CO2 fluxes by integrating multi-source data. We also evaluate the effect of this spatial optimization using column-averaged dry-air mole fraction of CO2 (XCO2) data from the orbiting carbon observatory-3 (OCO-3) satellite. The results indicate that using the optimized CO2 fluxes enables more accurate simulations of local CO2 concentration variations, achieving a closer match with observations. Our high-resolution urban CO2 flux dataset can contribute to reducing uncertainty in CO2 flux estimates and provide more accurate prior values for “top-down” urban emission estimates.MethodsFor CO2 fluxes, there are significant spatial dependencies. Anthropogenic emissions mainly come from fixed sources such as power plants, transportation networks, and industrial zones, while biogenic fluxes are concentrated in vegetation-covered areas like forests, croplands, and grasslands. To represent these spatial patterns, we use land cover types as proxies for CO2 fluxes. For anthropogenic CO2 emissions, we utilize datasets such as the global power plant database, OpenStreetMap, and the essential urban land use categories (EULUC), which offer detailed representations of emissions from power plants, industry, residential areas, and transportation networks. For biogenic CO2 fluxes, we select the WorldCover land cover dataset to distinguish key land cover types, including forests, croplands, and grasslands. The construction of CO2 flux grids involves specific methodologies for anthropogenic and biogenic fluxes. For anthropogenic emissions, we utilize sector-specific, grid-based emission data from the multi-resolution emission inventory for China (MEIC) and process spatial proxy data grid by grid to accurately allocate total emissions across geographic regions. For biogenic fluxes, we estimate flux factors for various vegetation types and integrate them with land use data to calculate precise flux values for each vegetation category. To validate the CO2 flux datasets, we adopt an indirect evaluation approach. We assess the accuracy of the constructed datasets by comparing observed and simulated CO2 concentrations. Simulations are carried out using the stochastic time-inverted Lagrangian transport (STILT) model, and the outputs are validated against XCO2 observations from the OCO-3 satellite. This approach provides a robust evaluation of the spatial representation of CO2 fluxes and their alignment with observed atmospheric CO2 distributions.Results and DiscussionsIn our study, we take Hefei as a case study to develop a high-resolution urban CO2 flux grid with a spatial resolution of 0.002°×0.002° (Figs. 3 and 4). The constructed grid data effectively captures the detailed distribution characteristics of CO2 sources and sinks, which are not well represented in previous datasets. We compare the spatial patterns of the improved CO2 emissions with those from the MEIC and ODIAC datasets (Figs. 5 and 6). Additionally, we analyze the changes in biogenic CO2 fluxes before and after optimization using remote sensing imagery with a spatial resolution finer than 1 m (Fig. 8). To evaluate the effectiveness of the CO2 flux optimization, we employ the X-STILT model to simulate XCO2 concentrations based on both pre- and post-optimization CO2 flux data. These simulations are then validated against XCO2 observations from the OCO-3 satellite. The validation utilizes OCO-3 data from three observations: June 16, 2022 (Fig. 9), June 4, 2021 (Fig. 11), and October 11, 2020 (Fig. 12).ConclusionsIn the present study, we develop a high-resolution grid of urban anthropogenic and biogenic CO2 fluxes by integrating effective information from multi-source datasets with varying formats, spatial resolutions, and temporal coverage. We validate and evaluate the spatial optimization of CO2 fluxes using observational data from OCO-3. The analysis highlights pronounced local spatial heterogeneity in urban anthropogenic CO2 emissions. Strong point sources, such as power plants, and weaker sources, such as residential areas, lead to significantly different variations in local CO2 concentrations. Coarse-resolution emission data tend to average these differences in simulations, making it difficult to capture localized CO2 peaks. Compared to ODIAC data, the spatially optimized emission data substantially refine the urban CO2 emission distribution, transforming it from a “Gaussian-like” pattern to a “multi-centered” distribution. For biogenic CO2 fluxes, the optimized data successfully identify small-scale urban green spaces, enabling a more precise simulation of vegetation’s influence on local CO2 concentration dynamics. Using the WRF-XSTILT model, we compare simulations of XCO2 concentrations before and after optimization against OCO-3 observations. The results show significant improvements in both validation cases: correlation coefficients increase from 0.26 to 0.46, from 0.62 to 0.73, and from 0.50 to 0.60, respectively, while biases decrease from 1.36×10⁻⁶ to 1.24×10⁻⁶, from 0.87×10⁻⁶ to 0.80×10⁻⁶ and from 0.80×10⁻⁶ to 0.73×10⁻⁶. These findings underscore the enhanced capability of the optimized data to accurately represent the spatial distribution of CO2 fluxes.
Apr. 18, 2025Vol. 45 Issue 12 1201005 (2025)
Zikang Zhang, Blake Cohen Jason, Kai Qin, Shuo Wang, Luoyao Guan, Zhewen Liu, and Tiwari Pravash
ObjectiveXinjiang, recognized as a crucial coal resource area and strategic reserve in China, possesses abundant coal resources. The Zhundong coalfield, a large-scale open-pit mining area within this region, significantly contributes to increased concentrations of light-absorbing aerosols due to its coal production activities and associated industrial processes. These activities also produce substantial amounts of black carbon (BC), which, through atmospheric transport, mixes with snow and ice, influencing glacier ablation in the Tianshan Mountains. While previous studies on the Zhundong coalfield have predominantly concentrated on the ecological pollution resulting from mining activities, they have overlooked the implications for climate and radiative forcing in the area. In this context, it is crucial to employ satellite remote sensing technology to analyze and assess the optical properties and radiative forcing effects of light-absorbing aerosols in the Zhundong coalfield region. Such an approach is significant for understanding the regional environmental and climatic impacts associated with the development of open-pit coal resources in the arid regions of western China.MethodsWe investigate the temporal and spatial characteristics of aerosol optical depth (AOD) in the Zhundong coalfield by utilizing MODIS aerosol product (MOD04~~L2) data spanning from 2005 to 2020. To simulate aerosol particle size information, a Mie scattering model is employed under the “core-shell” assumption. An uncertainty interval of 0.03 is selected to estimate the possible range of particle sizes within each grid, constrained by maximum and minimum values. The intersection of these constraints is then used to calculate the optical parameters for various particle size combinations. Additionally, the influence of sand and dust aerosols is considered by setting the single scattering albedo (SSA) range for these aerosols between 0.93 and 0.96. The simulated extinction coefficient (σext) is used as a threshold value; any portion smaller than this threshold is excluded to quantify the concentration of local BC columns. Finally, the radiative forcing effect of light-absorbing aerosols in the Zhundong coalfield over the past decade is evaluated using the SBDART radiative transfer model.Results and DiscussionsThe AOD in the Zhundong coalfield exhibited pronounced spatial heterogeneity from 2005 to 2020, with high AOD values predominantly concentrated in the mining area and its surrounding regions (Fig. 2). Seasonal variations reveal the highest concentrations in spring and winter, followed by fall, with the lowest levels observed in summer. During spring and winter, AOD values generally exceed 0.15, except in certain desert areas. Interannual fluctuations in AOD are frequent, marked by significant turning points in 2010, 2012, and 2017 (Fig. 3), which indicates that coal production, energy restructuring, and capacity reduction policies have a significant effect on air quality in mining regions. The inter-monthly variation displays a distinct “U” pattern (Fig. 3), with AOD peaking at 0.27 in February, which highlights the substantial influence of anthropogenic activities on regional air quality. Dusty weather in spring emerges as a dominant factor. Overall, the temporal variation in AOD in the Zhundong coalfield reflects the combined effects of natural factors and human activities. In the Wucaiwan and Dajing mining areas, the range of BC number density is (1?3)×1018 grid-1 (Fig. 6). In 2012, against the backdrop of China’s coal economic performance, open-pit mining was less affected by the decline in production growth due to its larger production capacity and lower costs, influenced by mining methods, climatic conditions, and economic activities. In contrast, shaft mining is more heavily affected by safety risks and environmental constraints, which may lead to production limitations, especially under strengthened policy and regulatory measures. As a result, there are greater fluctuations in BC number density in the Dajing mining area (Fig. 6). The range of BC number density is 20?40 kg/grid, with seasonal variations largely consistent, although peak months differed. This suggests that BC mass concentration is closely related to particle aging and size (Fig. 7). Radiative forcing values at the top of the atmosphere, at the surface, and within the atmosphere showed varying degrees of decrease between 2011 and 2017, followed by a gradual increase. This suggests that reducing emissions of light-absorbing aerosols from mining sites can effectively lower regional radiative forcing values in the context of reduced coal production (Fig. 10). Radiative forcing values are higher in March and April during spring, when BC is aged and mixed with other aerosol components through mutual encapsulation, which results in more complex microphysical-chemical properties. This process enhances the absorption capacity of BC for both short- and long-wave radiations (Fig. 10).ConclusionsWe analyze the overall change in AOD in the Zhundong coalfield from 2005 to 2020 using the MODIS aerosol dataset. By integrating a meter scattering model to simulate optical parameters under various particle size combinations and constraining these simulations with single scattering albedo (SSA) observations from MODIS, this approach allows us to determine the eligible particle size information and optical parameters, enabling the calculation of BC mass concentration within the atmospheric column of the Zhundong coalfield. Subsequently, the area’s radiative forcing is estimated using the SBDART radiative transfer model. The findings reveal several key insights. 1) The changes in AOD are closely linked to policy implementation and economic activities within the coal mining area. Interannual variations indicate that AOD peaked in 2012 and subsequently declined, which suggests that policies and economic activities significantly affect AOD levels. Seasonally, AOD is higher in spring and winter and lower in summer. The unique topographic and meteorological conditions facilitate the transport of BC from the mining area to other regions, which highlights the combined effects of seasonal meteorological conditions and human activities. 2) The column concentration of light-absorbing aerosols in the coal mine area is affected by both anthropogenic activities and meteorological conditions, particularly during sandy and dusty weather. A comparison of column concentrations between the Wucaiwan and Dajing mines shows that open-pit mining adapts more effectively in 2012, given the context of China’s coal economic operations, whereas shaft mining may face greater challenges. 3) By examining the changes in AOD and light-absorbing aerosols, it is evident that reducing emissions of light-absorbing aerosols from coal mining areas can effectively decrease regional radiative forcing values in the short term. Inter-monthly variations reveal that atmospheric radiative forcing trends differ from those at the surface and the top of the atmosphere, with the latter two being closely related to the optical properties of light-absorbing aerosols. In spring, the frequent occurrence of sand and dust facilitates the mixing of BC with other substances, forming light-absorbing aerosols with a “core-shell” structure. This significantly enhances the light-absorbing capacity of BC, thereby increasing radiative forcing.
Jun. 25, 2025Vol. 45 Issue 12 1201006 (2025)
Zengchang Fan, Hailong Yang, Lingbing Bu, Xuanye Zhang, Zhihua Mao, and Zhiqiang Tan
ObjectiveCarbon dioxide (CO2) is the most significant anthropogenic greenhouse gas in the atmosphere. Accurately assessing CO2 emissions is critical for developing effective and feasible reduction policies to mitigate global warming. Spaceborne platforms equipped with active and passive remote sensing instruments enable high-precision global column-averaged dry air mole fraction of CO2 (XCO2) observations, supporting the “top-down” approach to carbon emission estimation. Among these, spaceborne integrated path differential absorption (IPDA) lidar offers resilience to aerosol interference and, with its high pulse repetition frequency, can achieve global XCO2 observations with high temporal and spatial resolution. However, due to single observation errors, the data often need to be processed using the sliding average algorithm, which diminishes the high temporal and spatial resolution advantages of spaceborne IPDA lidar. Therefore, we propose using the Kalman smoothing algorithm to reconstruct the high temporal and spatial resolution lidar XCO2 observation from spaceborne IPDA data. Simulation experiments validate the algorithm’s filtering performance, and its application to point-source emission monitoring highlights its potential for high-resolution XCO2 monitoring. These findings underscore the significance of the Kalman smoothing algorithm in enhancing global carbon emission quantification using spaceborne IPDA lidar data.MethodsBased on the high temporal and spatial resolution advantage of spaceborne IPDA lidar XCO2 data and its offline acquisition characteristics, we propose using the Kalman smoothing algorithm to reconstruct high temporal and spatial resolution XCO2 observation results. First, a pseudo-true value sequence is constructed based on XCO2 data simulated by weather research and forecasting model with greenhouse gases module (WRF-GHG). Various levels of observation errors are then superimposed on this sequence to create a pseudo-observation sequence. The filtering performance of the Kalman smoothing algorithm is tested with different state transfer matrices, and the optimal matrix is selected. Comparative experiments show that the Kalman smoothing algorithm outperforms the sliding average algorithm in terms of filtering performance. Finally, both the Kalman smoothing and sliding average algorithms are used to estimate the carbon emission rate of the same point source at the same time, confirming the Kalman smoothing algorithm’s applicability in high-resolution XCO2 monitoring.Results and DiscussionsSimulation experiments first determine the state transfer matrix for the Kalman smoothing algorithm, followed by a comparison of its filtering performance with the sliding average algorithm, which uses a spatial resolution of 50 km. The results show that the Kalman smoothing algorithm not only retains the original observation’s temporal and spatial resolution (0.05 s, 337.5 m), but also improves the mean absolute error (MAE) by 9.46%, reduces the root mean square error (RMSE) by 13.39%, and increases the correlation coefficient by 6.46%, compared to the sliding average algorithm with a temporal and spatial resolution of 7.4 s and 50 km. The monitoring capabilities of the Kalman smoothing algorithm and the sliding average algorithm for the same point source emissions are further compared. The XCO2 enhancement, obtained using the Kalman smoothing algorithm, estimates the point source emission rate at that moment to be 843.2 kg/s, with a correlation of 0.98 between the XCO2 enhancement and the Gaussian point source model simulation results. In contrast, the sliding average algorithm estimates the point source emission rate at that moment to be 1876.8 kg/s, with a lower correlation of 0.81 between the XCO2 enhancement and the Gaussian point source model simulation results. According to the emission inventory data for this point source, the annual average emission rate is 1100 kg/s. The instantaneous emission rate calculated by the Kalman smoothing algorithm is closer to this annual average, and the XCO2 enhancement shows a higher correlation. Therefore, it can be concluded that the Kalman smoothing algorithm offers superior point source emission monitoring capabilities compared to the sliding average algorithm.ConclusionsIn response to the demand for high temporal and spatial resolution in the application of XCO2 observation results from spaceborne IPDA lidar, we propose the use of the Kalman smoothing algorithm to process the original XCO2 data. We discuss the selection of the state transfer matrix in the Kalman smoothing algorithm and compare its filtering performance with that of the commonly used sliding average algorithm. The MAE between the Kalman smoothing algorithm’s filtering result and the true value is reduced by 9.46% compared to the sliding average algorithm, which has a temporal and spatial resolution of 7.4 s and 50 km. In addition, the RMSE is reduced by 13.39%, and the correlation coefficient is increased by 6.46%. Therefore, it’s concluded that the Kalman smoothing algorithm provides better filtering performance than the sliding average algorithm, which has a theoretical temporal and spatial resolution of 7.4 s and 50 km while retaining the original high temporal and spatial resolution (0.05 s, 337.5 m). The application of the Kalman smoothing algorithm in point source emission monitoring is also tested. The instantaneous emission rate calculated by the Kalman smoothing algorithm is closer to the annual average, and the XCO2 enhancement shows a higher correlation. Therefore, it’s shown that the Kalman smoothing algorithm can be effectively applied to high temporal and spatial resolution XCO2 observation scenarios. High-resolution XCO2 observations are crucial for assessing regional carbon sources and sinks, and the XCO2 observations reconstructed using the Kalman smoothing algorithm can provide vital data support.
May. 16, 2025Vol. 45 Issue 12 1201007 (2025)
Haosen Wang, Chen Cheng, Hailiang Shi, Xianhua Wang, Hanhan Ye, Shichao Wu, and Erchang Sun
ObjectiveThe atmospheric profile is a critical component in radiative transfer calculations, and constructing an atmospheric model that accurately reflects regional atmospheric conditions is essential to ensure the precision of these calculations. In this paper, we aim to explore atmospheric profile variations and improve the accuracy of radiative transfer calculations by proposing a novel method for constructing atmospheric models.MethodsWe analyze the vertical distribution and variation patterns of key atmospheric parameters, including temperature, water vapor, pressure, carbon dioxide, ozone, and methane. A new approach based on K-means clustering and random forest regression is developed to construct atmospheric profiles. Data sources include ERA5, WACCM, and CarbonTracker, covering historical atmospheric profile data over the past two decades. To address the resolution differences among these data sources, spatiotemporal interpolation, and height normalization methods are applied. We focus on the eastern region of China, where temperature, pressure, water vapor, and ozone profiles are clustered to reveal their seasonal and regional variation patterns. Subsequently, carbon dioxide and methane profiles are reconstructed using newly processed data.Results and DiscussionsThe self-developed atmospheric model is compared with the 1976 US standard atmosphere using MODTRAN software to simulate spectral data. The simulated spectra are then compared with actual measurements from the FengYun satellite. The results show that the self-developed model improves simulation accuracy by 11.2% in January and 10.5% in July compared to 1976 US standard atmosphere model, indicating that the proposed model better approximates real atmospheric conditions (Fig. 5). This method offers a new approach for constructing atmospheric profiles for radiative transfer calculations.ConclusionsThe proposed method, which combines K-means clustering and random forest regression, significantly improves the accuracy of radiative transfer calculations by better capturing regional and seasonal variations in atmospheric profiles. This approach not only enhances the precision of radiative transfer simulations but also provides a valuable tool for atmospheric research and applications.
Apr. 27, 2025Vol. 45 Issue 12 1201008 (2025)
Jinhui Shi, Bingyi Liu, Peizhi Zhu, Qi Zhou, Qiuyue Xu, and Yan He
ObjectiveSeawater depth information is of great significance for marine navigation, environmental monitoring, and seabed topography research. However, traditional depth measurement methods face difficulties in specific areas, such as remote waters and shallow regions. Satellite remote sensing depth measurement offers advantages such as wide coverage and cost-effectiveness, which makes it particularly suitable for the continuous monitoring of shallow marine areas and other regions that are difficult to reach with conventional field measurement methods. As a result, it has gained considerable attention. However, most existing remote sensing depth inversion models only use remote sensing reflectance as input features, which neglects the effect of water environmental factors on the results. To improve the accuracy and adaptability of depth inversion models, we introduce the chromaticity angle as a new feature and combine machine learning techniques to enhance the precision and applicability of existing remote sensing depth inversion methods, thereby providing effective technical support for remote sensing depth inversion in shallow marine areas.MethodsWe introduce the chromaticity angle as a new feature and combine it with remote sensing reflectance data to develop a shallow water depth inversion model using three machine learning algorithms: random forest (RF), extreme gradient boost (XGB), and support vector regression (SVR). First, Sentinel-2 satellite imagery is used to collect water reflectance data, and the chromaticity angle is calculated as an additional feature. This angle effectively captures the optical properties of the water, compensating for the limitations of using only reflectance in traditional remote sensing methods. Then, machine learning models are built using both the reflectance and chromaticity angle data for depth inversion. RF handles nonlinear relationships by constructing multiple decision trees, while SVR excels in dealing with small sample sizes and high-dimensional data. XGB, an advanced ensemble algorithm, iteratively optimizes the model’s performance for complex regression tasks. The inversion accuracy of the models is assessed using metrics such as root mean square error (RMSE), mean absolute error (MAE), and mean relative error (MRE). Additionally, Shapley additive explanations (SHAP) values are applied to analyze the contribution of each feature variable to the model’s output, which further confirms the significant role of the chromaticity angle in improving inversion accuracy.Results and DiscussionsAfter combining the chromaticity angle with the remote sensing reflectance data, the accuracy of the shallow water depth inversion model is effectively improved. The comparative analysis of the three machine learning algorithms indicates that the improved XGB model performs the best, with an RMSE of 1.11 m, MAE of 0.81 m, and MRE of 11.05% (Table 2), which demonstrates a clear advantage over traditional empirical algorithms. Additionally, the XGB model exhibits robust inversion performance in areas with steep depth gradients (Fig. 9). The scatter plot demonstrates that the chromaticity angle enhances the correlation between predicted and observed values and improves the coefficient of determination R2 (Fig. 5). Residual analysis shows that the application of the chromaticity angle feature results in a more concentrated distribution of residuals, with smaller deviations between predicted and observed values (Figs. 6 and 7). Compared to other depth ranges, the effect of the chromaticity angle is more significant in the deeper water range of 15?25 m (Table 3). SHAP analysis quantifies the contribution of each input variable to the model, which confirms that the chromaticity angle feature is a crucial predictor of water depth and has a more substantial impact in deeper waters (Fig. 10).ConclusionsWe propose a shallow water depth inversion method assisted by the chromaticity angle based on machine learning. The chromaticity angle is calculated from the remote sensing reflectance of the red (R), green (G), and blue (B) bands as a new inversion feature to improve the accuracy of satellite bathymetry. The method is applied and validated using three machine learning models: RF, XGB, and SVR. The results show that incorporating the chromaticity angle as an input feature can effectively enhance the predictive performance of the machine learning models. Among them, the improvement in the RF model is the most significant, while the XGB model, combined with the chromaticity angle, achieves the best performance. Compared to other machine learning algorithms and traditional empirical methods, this approach demonstrates clear advantages and higher fitting accuracy in areas with steep depth changes, which exhibits excellent water depth inversion performance. A depth-segment analysis reveals that the effect of the chromaticity angle is more pronounced in waters deeper than 15 m. Additionally, since the calculation of the chromaticity angle is based on widely available remote sensing imagery data, the proposed method has great potential for application in different geographic regions.
Jun. 23, 2025Vol. 45 Issue 12 1201009 (2025)
Rongchang Wang, Haiping Mei, Shuran Ye, Xifu Yue, Sen Jiang, and Xiaoxuan Ma
ObjectiveThe atmospheric turbulence simulation device is used to study the propagation effects of laser in atmospheric turbulence. Most previous turbulence simulation devices generate turbulence by adjusting parameters such as temperature difference and wind speed. Although they successfully simulate the basic characteristics of atmospheric turbulence, the environmental parameters that can be measured and controlled are limited, and the automatic control capability is relatively weak. To generate a stable and controllable turbulent state in the simulation chamber, it is necessary to create stable boundary conditions. Therefore, the measurement and control system of the atmospheric turbulence simulation device must have high precision, stable control capabilities, and intelligent characteristics. At the same time, a model linking turbulence intensity and control parameters should be established based on the measured data.MethodsTo simulate atmospheric turbulence under various conditions, we develop a turbulence simulation chamber that integrates control functions for temperature difference, wind speed, and air pressure. The chamber is equipped with hot and cold plates to create temperature differences, fans to adjust wind speed, and a vacuum pump to create a low air pressure environment by sealing the chamber. Based on the principles of turbulence generation, we design a system that considers both convective and hot air characteristics to simulate high-frequency turbulence. To meet control requirements, we develop an integrated measurement and control system based on a programmable logic controller (PLC) and host computer software (Fig. 3). This system combines various sensors and actuators to monitor temperature, humidity, air pressure, and wind speed throughout the simulation chamber. Additionally, it can be integrated with specialized test equipment to measure the atmospheric coherence length along the integral path within the turbulence simulation chamber. We calculate and analyze the control accuracy and uncertainty of the system. By measuring turbulence intensity under different temperature differences and air pressure conditions, we build a model that describes the relationship between turbulence intensity, air pressure, and temperature difference. The accuracy of this model has been analyzed based on the measured data.Results and DiscussionsInitially, we design the turbulence simulation chamber and its measurement and control system based on the principles of turbulence generation. We then analyze the control errors and uncertainties of the control variables (Figs.5,6,and 7). The results indicate that the absolute value of control errors for different temperature differences is less than 1.40%, and the absolute value of control errors for different air pressures is less than 0.425%. The control uncertainty of r0 under different temperature differences is limited to a maximum of 0.0490 cm. Additionally, we establish a log-linear relationship between turbulence intensity and air pressure (Fig. 9), which can be used to calculate the input temperature difference required to achieve a specific r0 at different air pressures. The correlation coefficient between the fitted values based on the turbulence model and the measured values exceeds 0.99, and the root mean square errors do not exceed 0.10854.Conclusions1) The measurement and control system has functions for measurement, control, real-time display, and data storage, with high automation and control accuracy, which effectively ensures that the turbulence state in the turbulence simulation chamber remains stable and controllable. 2) The turbulence intensity in the turbulence simulation chamber mainly depends on the temperature difference. As the temperature difference grows, the turbulence intensity becomes stronger. They exhibit a clear logarithmic linear relationship. At the same time, the turbulence intensity and the chamber air pressure also show a logarithmic linear relationship. 3) By logarithmic linear fitting of the measured data under different temperature differences and air pressure conditions, we build a turbulence state control function model for the simulation chamber. This model can be used to predict the required plate temperature difference within the allowable error range, based on the target turbulence intensity to be simulated under specific air pressure conditions.
Jun. 23, 2025Vol. 45 Issue 12 1201010 (2025)
Xuezhi Yan, Hua Xu, Ying Zhang, Yisong Xie, Xingyu Yao, and Zhengqiang Li
ObjectiveAccurate monitoring of global carbon dioxide (CO?) column concentrations (XCO2) is crucial for understanding carbon cycles and supporting climate mitigation policies. However, current methods, including satellite observations and atmospheric transport models, each face significant limitations. Satellite-based XCO2 products are hindered by limited spatial-temporal coverage and retrieval uncertainties caused by cloud interference and surface reflectance variability. Meanwhile, chemical transport models, such as GEOS-Chem, often exhibit systematic biases due to uncertainties in emission inventories and parameterizations. To overcome these challenges, we aim to develop a high-precision, spatiotemporally continuous global XCO2 dataset by assimilating multi-source satellite observations into the GEOS-Chem model using an ensemble Kalman filter (EnKF). This approach is designed to meet the urgent need for reliable, high-resolution CO? monitoring systems that can support carbon flux inversion and global carbon budget assessments.MethodsWe integrate three satellite-based XCO2 products (TanSat, OCO-2, and GOSAT) into the GEOS-Chem v14.2.3 chemical transport model using an ensemble Kalman filter with covariance localization. The assimilation system is designed to generate a global XCO2 dataset with a 3-hourly temporal resolution and a 2.0°×2.5° spatial resolution for the period from March 1, 2017 to February 28, 2018. Satellite data are preprocessed with quality screening and weighted averaging based on normalized prior uncertainties [Eqs. (3)?(6)]. Model output from GEOS-Chem is vertically integrated to obtain column-averaged concentrations [Eqs. (1)?(2)], and a 20-member ensemble is constructed using perturbed initial states to represent model uncertainty. Covariance localization is applied using a Schur product approach [Eqs. (10)?(11)] to mitigate spurious correlations in the high-dimensional state space. The Kalman gain and state update equations [Eqs. (12)?(14)] ensure physical consistency during the assimilation. The final dataset is validated against ground-based TCCON measurements from 16 globally distributed sites.Results and DiscussionsWe propose and implement a data assimilation framework tailored for multi-source satellite observations, effectively addressing the challenges of data fusion and error propagation within the ensemble Kalman filter. The results demonstrate that integrating multi-source satellite data significantly enhances the spatiotemporal coverage of global XCO2 observations, which effectively fills previous observational gaps and substantially increases the volume of assimilable data (Figs. 2 and 3). Validation shows that the GEOS-Chem model generally underestimates XCO2 concentrations, with overestimations in polar regions—consistent with previous studies. By assimilating multi-source satellite observations, these systematic biases are effectively corrected: the model’s RMSE is reduced from 1.27×10⁻⁶ to 1.19×10⁻⁶, and the mean bias improves from -0.42×10⁻⁶ to -0.28×10⁻⁶ (Fig 4). Moreover, seasonal deviations are notably mitigated (Figs. 6 and 9), and the model’s performance under extreme climatic conditions becomes more consistent with actual observations (Fig. 10).ConclusionsWe develop a global XCO2 reanalysis dataset by assimilating multi-source satellite observations into the GEOS-Chem model using an ensemble Kalman filter. The assimilation significantly enhances spatial-temporal data coverage, reduces systematic model biases, and improves agreement with ground-based measurements. The final dataset not only preserves realistic seasonal XCO2 dynamics but also captures extreme meteorological and geographic influences more accurately. While limitations remain due to restricted satellite data availability and the potential introduction of new observational errors, we provide a solid foundation for future carbon flux inversion studies and support enhanced climate policy implementation. Further improvements can be achieved by expanding domestic satellite participation and developing higher-resolution assimilation frameworks.
Jun. 24, 2025Vol. 45 Issue 12 1201011 (2025)
Heng Zhang, Bo Fang, Yanbo Gai, Jiarong Li, Weimin Duan, Yang Chen, Nuo Chen, Weixiong Zhao, and Weijun Zhang
ObjectiveHydroxyl radical (?OH), the most significant oxidant in the atmosphere, initiates oxidation reactions of most natural and anthropogenic trace gas species, determines the atmospheric lifetimes of these pollutants, and regulates the atmosphere’s self-cleaning capacity. Time-resolved measurements of ?OH provide an essential tool for researching chemical reaction kinetics and field measurements of atmospheric ?OH total reactivity, which is crucial for understanding ozone formation and secondary organic aerosols. The pump?probe technique represents a vital method for time-resolved ?OH measurements. This technique employs a 266 nm UV photolysis laser to generate ?OH and initiate its chemical reaction with reactants while synchronously detecting ?OH in another optical path. Using an optical multi-pass cell (MPC) to increase the overlap path length between the detection optical path and the UV photolysis beam effectively enhances pump?probe detection sensitivity. Several research groups have implemented Herriott-type multi-pass cells for pump?probe applications. Although these multi-pass cells provide powerful tools for pump?probe technology, their effective utilization efficiencies remain relatively low compared to designed path lengths, limiting further improvements in detection sensitivity. This study developes a high-efficiency Herriott pump?probe cell and constructed a pump?probe system based on the cell for time-resolved ?OH measurements.MethodsThe spot distribution pattern of the Herriott cell is investigated. A pump?probe MPC with an optical path utilization efficiency of 75.4% is developed. Based on the cell, a Faraday rotation spectroscopy system for time-resolved measurement of ?OH is constructed (Fig. 5). ?OH radicals are generated through the photolysis of O3 and H2O at 266 nm. The system uses a 2.8 μm continuous-wave distributed feedback (cw-DFB) laser as the probe light source. The Q(1.5e) line of ?OH at 3568.523 cm-1 is selected as the detection absorption line, with a line intensity of S=9.023×10⁻²⁰ cm-1/(molecule·cm-2). By measuring the beam waist position of the laser (Fig. 4) and matching it with the multi-pass cell, the problem of beam divergence is solved. The stability and detection precision are evaluated by Allan deviation analysis. The kinetic rate constant for the reaction between ?OH and CH4 is measured. The dynamic monitoring performance of the system is tested in a photochemical smog chamber. Additionally, the system is applied to real atmospheric field observation.Results and DiscussionsThe distributions of the reflection spots on the mirror surface and at the cell center position are simulated under reflection angles of 50.4°, 79.2°, 122.4°, and 158.4°, respectively (Fig. 2). When the reflection angle is set to 158.4°, the system achieved an effective absorption path length of 28.5 m, with an overlapping efficiency of 75.4%. The red light test demonstrates that positioning the laser beam waist outside the multi-pass cell results in significant beam dispersion after several reflections, preventing the formation of a clear and complete spot pattern (Fig. 3). When the laser beam waist matches the cell center, a distribution of 25 reflection spots, including the light-through hole, is obtained on the mirror surface with relatively uniform spot sizes. The Allan deviation analysis (Fig. 7) of zero air measurement indicates a measurement precision of 0.22 s-1 with an acquisition time of 60 s, improving to 0.14 s-1 and 0.11 s-1 at averaging times of 180 s and 300 s, respectively. The statistical histogram exhibits a normal distribution, indicating system stability without obvious drift. The measured reaction rate constant for ?OH+CH4 is 6.49(-1.1, +1.3)×10-15 cm3 molecule-1 s-1 (Fig. 8). The time series of kOH' monitored in the smoke chamber correlate well with calculated values from measured CO particle concentration (Fig. 9), demonstrating good agreement in numerical values and change trends with a slope of 0.95 and a linear correlation coefficient of R2=0.97. The daily variation of atmospheric kOH' is measured in the Shouxian area in May 2024 (Fig. 10). The daily average value of kOH' is 18.4 s-1, with peaks of 19.6 s-1 at 06:00 and 21.1 s-1 at 19:00, respectively. A trough of 15.8 s-1 occurres at 14:00.ConclusionsA pump?probe MPC with an optical base length of 77.2 cm achieves an overlap efficiency of 75.4%. The ray propagation in the cell is confirmed using red light. Through precise alignment of the incident laser beam’s waist position with the cell center, the beam maintains consistent propagation during multiple reflections, producing 25 uniformly distributed spots on the mirror surface. The beam waist position of the 2.8 μm cw-DFB laser is determined and aligned with the cell center. A Faraday rotation spectroscopy system is established for time-resolved ?OH measurements. Allan deviation analysis reveals a measurement precision of the ?OH decay rate at 100 mbar of 0.22 s-1 (1σ, 60 s). The measured reaction rate constant for ?OH+CH4 demonstrates strong agreement with the recommended values from the International Association of Pure and Applied Chemistry (IUPAC). The system’s deviation from dynamic measurements of kOH' in the smog chamber remains below 5%. The daily variation of atmospheric kOH' is monitored in the Shouxian area in May 2025.
Jun. 24, 2025Vol. 45 Issue 12 1201012 (2025)
Pengfei Wu, Huan Wang, Sichen Lei, Jiao Wang, and Zhenkun Tan
ObjectiveCompared with traditional acoustic communication technologies, underwater vertical wireless optical communication (UVWOC) offers several advantages, including high bandwidth, low latency, compact device size, and energy efficiency. These qualities make it highly promising for applications in high-speed data transmission, multimedia content distribution, and real-time marine communication. However, the performance of UVWOC is significantly affected by the combined effects of absorption, scattering, and turbulence in seawater, all of which vary considerably with depth. Existing simulation methods face critical limitations: Monte?Carlo (MC) techniques are commonly used for modeling absorption and scattering effects, while phase screen approaches are typically employed for turbulence simulation. However, optical turbulence fundamentally arises from random variations in the refractive index along the light propagation path, driven by depth-dependent fluctuations in temperature and salinity. These environmental parameters exhibit strong stratification in ocean environments, leading to complex vertical heterogeneity that cannot be adequately captured by conventional decoupled modeling approaches. In this study, we develop an integrated photon transport model that captures the continuous interplay between particulate interactions and refractive turbulence in stratified marine environments. By unifying these physical processes within a single MC framework, we enable accurate simulation of optical signal degradation across the entire water column. The model incorporates empirical data from oceanic sensors to ensure a realistic representation of vertical stratification effects.MethodsThe MC simulation framework developed in this study employs a multi-layer photon transport model to characterize light propagation in stratified underwater optical channels. Photon packets are initialized with spatial and angular distributions that match practical laser diode outputs, which feature beam divergence angles ranging from 0.1 to 50 mrad. During propagation, each photon packet undergoes energy attenuation and trajectory deviation due to combined absorption, scattering, and turbulence effects. The model implements wavelength-dependent absorption coefficients derived from empirical seawater databases, with scattering effects calculated using the Henyey?Greenstein phase function. Turbulence is simulated using a refractive cell approach, which vertically discretizes the water column into 0.1?1 m thick layers. Each layer contains spherical turbulence elements, with refractive index fluctuations determined by local temperature and salinity gradients. The receiver module incorporates a 0.2 m aperture diameter and a 120° field-of-view constraint. Photon tracking continues until either successful detection within the receiver criteria, energy falling below the detection threshold, or divergence beyond the effective propagation range. Model validation employs three complementary approaches: first, confirming that simulated light intensity distributions under pure turbulence conditions conform to lognormal statistics; second, implementing controlled verification by comparing pure turbulence channels against composite channels with scattering artificially disabled (scattering coefficient set to 0); third, comparing with field measurements from South China Sea waters.Results and DiscussionsThe simulation results demonstrate three key characteristics of underwater vertical optical channels through a comprehensive parametric analysis. Under pure turbulence conditions, scintillation index analysis reveals that the link distance contributes approximately 60% to the overall turbulence intensity, followed by refractive index variations (~30%) and layer spacing (~10%) (Fig. 6). The research defines threshold criteria for turbulence regimes of weak, moderate, and strong (Fig. 7). Path loss measurements show that absorption and scattering dominate signal attenuation, with coastal waters exhibiting a 10 dB higher loss than that of clear oceanic waters, while turbulence introduces an additional 1 dB penalty due to beam wander and distortion (Fig. 10). Comparative analysis between pure turbulence and composite channels reveals significant nonlinear interactions between scattering and turbulence effects. In turbid coastal waters (scattering coefficient >1.5 m-1), the presence of multiple scattering amplifies turbulence-induced signal fluctuations by 35%?40% compared to clear ocean conditions, as quantified by the enhanced scintillation index values. The vertical stratification effects are particularly pronounced in thermocline regions (100?700 m depth), where temperature and salinity gradients cause scintillation indices to fluctuate between 0.8?1.3, compared to the more stable mixed layer (0?100 m, σSI=0.04?0.08) and deep-water regions (>700 m, σSI=0.05?0.1) (Fig. 12). The model’s accuracy is confirmed through excellent agreement (R2>0.9) with lognormal distributions in turbulence-only scenarios and successful reproduction of field measurement data from South China Sea campaigns, particularly in predicting the nonlinear relationship between water depth and signal degradation.ConclusionsWe develop a MC-based simulation framework for underwater vertical wireless optical communication (UVWOC) that systematically integrates absorption, scattering, and turbulence effects in stratified marine environments. The model demonstrates high fidelity in characterizing channel behavior, with validation results confirming its accuracy in predicting both turbulence-induced signal fluctuations (scintillation index) and beam wander effects. Key findings reveal that link distance (L) dominates turbulence intensity, which contributes approximately 60% to the observed scintillation index (σSI), while refractive index variation (Δn) and turbulent layer spacing (Δz) account for 30% and 10%, respectively. The research defines threshold criteria for different turbulence regimes: weak turbulence (σSI<0.15) occurs when refractive index variation Δn<1.8×10⁻⁴ and turbulent layer spacing Δz>0.50 m, primarily found in optically stable surface mixed layers; moderate turbulence (0.15≤σSI≤1) emerges at Δn=1.8×10⁻⁴?2.6×10⁻⁴ with Δz=0.25?0.50 m, typically observed in thermocline transition zones; while strong turbulence (σSI>1) dominates when Δn>2.6×10⁻⁴ and Δz<0.25 m. In composite channel simulations, absorption and scattering are identified as the primary drivers of power attenuation, with coastal waters exhibiting 10 dB higher path loss compared to clear oceanic conditions. The integration of real-world Argo float temperature-salinity profiles confirms the model’s applicability across distinct oceanic layers—mixed layer (0?100 m), thermocline (100?700 m), and deep water (>700 m)—where turbulence characteristics vary significantly with depth. This framework offers a robust tool for optimizing UVWOC systems in challenging scenarios such as deep-sea exploration and cross-layer communication. Future enhancements will incorporate machine learning for real-time turbulence prediction and expand experimental validation through controlled underwater trials, which further improves the model’s predictive reliability in dynamic marine environments.
Jun. 25, 2025Vol. 45 Issue 12 1206001 (2025)
Yang Wang, Guokun Chen, Xingwu Duan, Qingke Wen, Jiatian Li, and Zhen Zhang
ObjectiveThin cloud contamination in remote sensing images presents a significant challenge affecting data quality, resulting in imprecise analysis and interpretation across applications including land cover classification, environmental monitoring, and disaster assessment. Conventional thin cloud removal methods typically depend on feature extraction at a single scale and inadequately capture the multi-scale characteristics of clouds, leading to suboptimal declouding results. Furthermore, deep learning-based approaches, particularly those utilizing generative adversarial network (GAN), frequently encounter detail loss and texture blur in generated images and demonstrate limited capability in modeling local features accurately. To address these challenges, this study introduces a novel GAN-based method incorporating a convolutional block attention module (CBAM) and a multi-scale attention mechanism. The proposed approach aims to enhance the accuracy of thin cloud removal while maintaining the spectral and spatial details of the original imagery, thus improving the overall quality of remote sensing data.MethodsThe proposed framework integrates the GAN architecture with CBAM and multi-scale attention mechanism for effective thin cloud removal. The generator network is engineered to capture global and local features of the input image, enabling the model to restore detailed surface information while removing thin clouds effectively. The discriminator network assesses the authenticity of the generated image, ensuring high similarity to the real cloud-free image. The multi-scale attention mechanism serves a crucial function by implementing parallel convolution branches with independent parameter optimization strategies. This approach enables differentiated feature expression, enhancing the model’s capacity to process cloud contamination and underlying surface features at various scales. Furthermore, CBAM is integrated for enhanced feature extraction at different scales. CBAM applies sequential channel and spatial attention to feature maps, adaptively emphasizing important features while suppressing irrelevant noise. This integration of multi-scale attention and CBAM substantially improves the model’s capability to restore image brightness and recover fine details. Comprehensive experiments were conducted on the RICE1 dataset and a custom remote sensing cloud removal dataset based on Sentinel-2 imagery. The model’s performance is evaluated using quantitative metrics including peak signal-to-noise ratio (PSNR) and structural similarity index (SSIM). The proposed method is compared against several state-of-the-art thin cloud removal techniques, including Haze Removal, FFA-Net, C2PNet, CGAN, and SpA-GAN, to demonstrate its effectiveness.Results and DiscussionsExperimental results show that the proposed method surpasses traditional thin cloud removal techniques in both visual quality and quantitative metrics. The integration of CBAM with the multi-scale attention mechanism substantially enhances the model’s ability to recover detailed surface information while effectively removing thin clouds (Figs. 8?11). Comparative analysis reveals that the proposed method achieves a PSNR of 31.321 dB and an SSIM of 0.894, exceeding the performance of state-of-the-art methods (Tables 1 and 2). The generated images are further analyzed based on the average brightness of the RGB channels (Figs. 11 and 12). The results indicate that the cloud-free images generated by the proposed method most closely match the real images in terms of RGB channel brightness, validating the method’s effectiveness in preserving spectral details. An ablation study examines the synergistic contribution of the two attention mechanisms (Table 4 and Fig. 14). The results confirm that their combination significantly enhances model performance, demonstrating their complementary role in improving image quality. Specifically, the multi-scale attention mechanism facilitates feature capture at different scales, while CBAM enhances feature extraction accuracy through channel and spatial dimension focus.ConclusionsThis study presents a novel method for thin cloud removal from remote sensing images based on GAN enhanced with CBAM and multi-scale attention mechanism. The proposed approach enhances cloud removal accuracy while preserving the spectral and spatial details of the original image. Experimental results validate the effectiveness and robustness of the proposed method, demonstrating its superior performance compared to state-of-the-art techniques in terms of visual quality and quantitative metrics. The integration of CBAM and multi-scale attention mechanism proves instrumental in achieving these results, underscoring their significance in enhancing model performance. The proposed method offers a promising solution for improving remote sensing data quality. Future research will concentrate on optimizing the model architecture and expanding its applicability to additional types of cloud pollution and remote sensing datasets.
Jun. 23, 2025Vol. 45 Issue 12 1210001 (2025)
Han Pei, Sheng Cai, Jiulong Wang, Yan Xing, Luwei Zhang, Jinfeng Li, and Le Liu
ObjectiveWith the continuous development of space technology, an increasing number of spacecraft have been launched into near-Earth orbit. According to a report by the Union of Concerned Scientists, as of May 2021, over 35 countries operate more than 5000 satellites, with an additional 750000 fragments larger than 1 cm also present in orbit. This proliferation of space assets and debris significantly increases the risk of collisions, posing threats to space safety and efficient orbital resource management. Therefore, rapid and accurate initial orbit determination (IOD) of space targets is crucial for ensuring space security. Traditional IOD methods, such as Laplace’s and Gauss’s methods, often struggle under short arc observational conditions due to their sensitivity to measurement errors. To address these challenges, we explore the application of spatial filtering velocimetry to enhance the accuracy and robustness of IOD under limited observational data and significant error conditions.MethodsIn this paper, we integrate the principles of spatial filtering velocimetry with IOD algorithms to achieve accurate orbit determination of space targets. Spatial filtering velocimetry utilizes a uniformly distributed grating to measure a target’s angular velocity. A detailed mathematical formulation of the method is included, supplemented by imaging simulations to evaluate the influence of observational errors on IOD accuracy. The simulation platform employed features an i5-12500H processor @3.10 GHz with 32 GB of RAM. Observational parameters and scenarios (Tables 1 and 2) are meticulously designed to replicate real-world conditions. During simulations, targets are observed over 20 s, approximately 1/276 of an orbital period. Gaussian noise with varying standard deviations (0″, 5″, 10″, 15″, 20″, and 25″) is introduced to simulate angular errors. In addition, a sinusoidal grating with an appropriate period is used to modulate the target’s brightness, enabling the extraction of frequency information to calculate angular velocity and acceleration. The proposed method is compared with traditional IOD techniques, including Laplace’s method, Gauss’s method, Gooding’s method, and the AURORAS method. Comparative analysis focuses on accuracy and robustness under varying observational error conditions.Results and DiscussionsThe results demonstrate that the relative errors in distance measurements using the spatial filtering velocimetry method are 0.83%, 4.32%, 1.23%, 1.42%, 3.19%, and 1.32% for six targets under ideal conditions (Table 3). When the standard deviation of observational error increases to 25″, the relative errors remain stable at 0.77%, 4.24%, 1.27%, 1.43%, 3.21%, and 1.33%, respectively. While the method shows higher absolute errors compared to others under ideal conditions, it exhibits superior robustness, with minimal error fluctuation as measurement noise increases (Fig. 10). In contrast, other methods experience significant degradation in accuracy. The robustness of spatial filtering velocimetry arises from its direct measurement of angular velocity, which reduces the coupling between angular position errors and angular motion. In addition, we also analyze the influence of spectral bandwidth on orbit determination accuracy by varying the window length of the short-time Fourier transform function (Fig. 12). Results indicate that distance error decreases initially with increasing window length but rises once becomes too large. The behavior is attributed to the trade-off between spectral signal bandwidth and the resolution of frequency changes, affecting the accuracy of angular velocity extraction.ConclusionsIn this paper, we propose a novel method for initial orbit determination of space targets based on spatial filtering velocimetry. By directly measuring angular velocity using a uniformly distributed grating, the method minimizes the coupling between angular position errors and angular motion, thus enhancing robustness under significant observational errors. The accuracy of the method and its performance under varying observational error conditions are evaluated through imaging simulations. The results indicate that, while the method’s distance measurement accuracy is relatively low under ideal conditions, remarkable robustness, and stability are demonstrated as measurement errors increase. To further enhance orbit determination accuracy, efforts will focus on extending the sampling time, refining time-domain spectral analysis techniques, achieving orbit correlation, and introducing additional constraints. Furthermore, observational experiments will be conducted to validate the effectiveness of these methods, providing robust support for space situational awareness and the determination and prediction of space debris orbits.
Jun. 25, 2025Vol. 45 Issue 12 1211001 (2025)
Zheng Zhen, Chenxiao Li, Bo Zhang, Zonglin Liang, Yiqiao Yuan, Mingxu Piao, Keyan Dong, and Huilin Jiang
ObjectiveThe seeker imaging system is crucial for missile detection and guidance, operating in dynamically complex environments. During missile flight, significant decreases in altitude and increases in speed induce large-scale and dynamic aerodynamic thermal aberrations that degrade imaging quality. Traditional correction methods, including adaptive optics and image processing, have limitations in real-time correction under such dynamic conditions. To address these challenges, we leverage wavefront coding technology to propose an innovative correction method for multi-environment dynamic aerodynamic thermal aberrations. This research aims to mitigate dynamic aberrations efficiently, enhancing imaging quality and reliability in challenging scenarios.MethodsWe begin with simulations of aerodynamic thermal effects on sapphire hemispherical optical domes under varying flight conditions. Eight unique scenarios are generated, including altitudes of 10 km and 5 km, and Mach number ranging from 1.5 to 3.0. Dynamic deformation patterns [Fig. 1(a)] and their impacts on imaging quality are analyzed. The deformation is characterized as primarily defocus-related, and its severity increases with increasing speed and decreasing altitude. A wavefront coding system is designed using a cubic phase plate optimized for modulation transfer function (MTF) consistency (Fig. 6). The encoded system is evaluated across environments (Figs. 7 and 8), demonstrating reduced sensitivity to dynamic defocus aberrations but revealing limitations in maintaining point spread function (PSF) consistency. To address this, a synthetic PSF is constructed by weighting PSFs from multiple scenarios. Genetic algorithms are employed to optimize the weights and related deconvolution parameters. The fitness function combines peak signal-to-noise ratio (PSNR) and structural similarity index measure (SSIM) with constraints on weight sum normalization. The decoding algorithm utilizes Wiener filtering based on the optimized synthetic PSF. Experiments simulate imaging across the eight scenarios, comparing original blurred images, encoded images, traditional decoded images, and synthetic PSF decoded images (Figs. 10 and 11).Results and DiscussionsThe results demonstrate that the proposed method effectively addresses challenges of dynamic aerodynamic thermal aberration correction. The wavefront coding system, optimized for MTF consistency, significantly mitigates defocus-related aberrations caused by dynamic aerodynamic conditions. However, the initial coding method reveals limitations in maintaining PSF consistency under extreme conditions. To overcome this, a synthetic PSF is constructed by weighting PSFs from multiple flight scenarios, and genetic algorithms are employed to optimize the weights and related deconvolution parameters. The optimized system achieves notable improvements in image quality, with the decoded images attaining an average PSNR of 25.375 dB and SSIM of 0.7546, representing increases of 15.11% and 34.77%, respectively, compared to traditional decoding methods. The synthetic PSF decoding method effectively eliminates ringing artifacts and ensures high-quality reconstruction across diverse flight conditions, particularly in challenging low-altitude, high-speed scenarios. These improvements are evident in the visual comparisons (Figs. 10 and 11), where the decoded images retain clarity and reveal fine details, such as aircraft outlines, even in zoomed regions. The method’s robustness and adaptability across multi-environment scenarios highlight its potential to enhance imaging system reliability and performance in dynamic aerodynamic environments.ConclusionsWe propose a wavefront coding-based correction method for dynamic aerodynamic thermal aberrations in infrared seeker systems. By simulating sapphire hemispherical optical domes under various flight conditions, the method addresses significant challenges posed by dynamic defocus aberrations. Key innovations include the use of MTF-consistent cubic phase plates and synthetic PSF decoding optimized via genetic algorithms. The proposed method enhances imaging quality, evidenced by notable improvements in PSNR and SSIM and the elimination of visual artifacts. This method demonstrates high efficiency and reliability, meeting the stringent requirements of dynamic missile environments. It offers valuable insights for advanced imaging systems, particularly in high-speed, variable-altitude operations, and holds significant potential for broader aerospace and defense applications.
Jun. 25, 2025Vol. 45 Issue 12 1211002 (2025)
Taojun Feng, Jilong Peng, and Qian Yu
ObjectiveSolar extreme ultraviolet (EUV) imaging spectrographs utilize the Doppler effect of spectral lines to derive plasma velocity during solar explosive activities. The multi-order slitless imaging spectrograph has overcome the spatial and spectral desynchronization issues present in traditional slit spectrographs and has become an important tool for observing solar activities. The spectral information obtained by the multi-order diffraction imaging system is mixed within the multi-order image data, and an inversion algorithm is needed to extract and reconstruct it. Due to the limited number of observation orders in multi-order Solar EUV spectrographs (MOSES), the retrieval error of plasma velocity can reach up to 40%. To improve the inversion accuracy of the multi-order slitless imaging system, we design an inversion algorithm based on a five-order slitless imaging spectrograph to obtain solar plasma velocity. By adding observation data, we aim to improve the inversion accuracy of plasma velocity and enhance the practicality of the slitless imaging spectrograph.MethodsTo reconstruct a three-dimensional data cube containing spatial dimensions (x, y) and spectral dimensions (λ) from six two-dimensional projection images, an initial data cube is first generated using images I0 and I∞. This initial data cube is then used to reproduce six new projection images. The radiation intensity differences between the original observation images and the reproduced images are used to optimize the initial data cube. The spectral dimension of the optimized data cube is fitted to a Gaussian function, and a new input data cube for the next iteration is generated by sampling the Gaussian profile. These steps are repeated until the difference percentage between two consecutive data cubes is less than a predefined threshold. Finally, plasma velocity is derived from the spectral shifts at each spatial position.Results and DiscussionsTo facilitate comparison with the SMART algorithm used in MOSES, the projection angle α of the imaging system is set to 45°, and the dispersion angles θ of images I1, I2, I3, and I4 are set to 0°, 90°, 180°, and 270°, respectively. Five two-dimensional images projected onto the x-y plane and one prior image on the y-λ plane are used to simulate the five actual observation images and introduce prior knowledge. The convergence threshold t is set to 0.1%, and the algorithm performs 986 iterations. The evaluation parameters for the inversion results of spectral line center offsets are shown in Table 1, including the correlation coefficient R, linear fitting slope s, and root mean square error ERMS between the retrieved and true center offsets at all spatial positions. For comparison, the SMART algorithm results on MOSES data are also listed. The proposed algorithm achieves better inversion accuracy than the SMART algorithm, with a 4.65% increase in R, an 18.75% increase in slope, and a 17% decrease in ERMS. The fitting results of the spectral line offsets from the inversion algorithm are shown in Fig. 5. The data points represent reconstructed and simulated spectral line center offsets at various spatial positions. The dashed line represents the fitting result, with a slope of 0.76, indicating that the inversion results are systematically underestimated by 24%. Compared with the SMART algorithm, the systematic error is significantly reduced. According to Eq. (5), the plasma Doppler velocity is derived from the spectral line center offset. The simulated and reconstructed center offsets on the x-y plane are shown in Figs. 6(a) and 6(b), respectively. Through comparison, it is found that the overall retrieved Doppler velocity is lower than the original velocity. The spatial distribution of velocity error, obtained by subtracting the simulated result from the reconstructed one, is shown in Fig. 6(c), with most errors falling within ±5 km/s. The variation of Doppler velocity along the x-axis at y=64 is presented in Fig. 7. The reconstructed curve (solid line) closely matches the original velocity curve (dotted line), indicating high inversion accuracy.ConclusionsWe propose and design an inversion algorithm for extracting spectral information from multi-order diffraction images captured by a five-order slitless spectral imaging spectrograph. This algorithm reconstructs a three-dimensional data cube containing spatial and spectral information and then derives solar plasma velocity from the spectral deviations. Numerical simulation validates the proposed algorithm, showing that it achieves better performance than the SMART algorithm by reducing the plasma velocity retrieval error to 24%. The correlation coefficient increases by 4.65%, the linear fitting slope by 18.75%, and the root mean square error decreases by about 17%. A high-precision inversion algorithm can enhance the practicality of multi-order diffraction imaging systems and serves as an important foundation for optimizing instrument design.
Jun. 23, 2025Vol. 45 Issue 12 1211003 (2025)
Lidan Weng, and Guoqiang Zeng
ObjectiveWith advancements in aerospace technology, remote sensing satellite imagery applications are evolving toward high precision, refinement, and commercialization. The geometric positioning accuracy of satellites has reached the meter level, imposing new requirements on satellite development and attitude determination. In remote sensing applications, acquiring accurate geometric positioning information is critical. Satellite positioning accuracy is closely tied to attitude determination precision, where a 1″ error in attitude determination can cause a 3?5 m deviation in positioning. Consequently, attitude determination accuracy has become the most critical factor limiting improvements in geometric positioning. The star camera is the most commonly used sensor in satellite attitude determination, and there are two primary methods based on star camera measurements. The first constructs an observation model using star vectors captured by the star camera and determines orientation relative to the inertial coordinate system by comparing observed and reference vectors. The second builds upon this method to obtain absolute attitude by fusing data from multiple sensors, such as gyroscopes, using filtering algorithms for high-precision measurements. Although these filtering algorithms enhance accuracy, they require additional sensors, increasing power consumption and costs, which is unsuitable for micro-satellite platforms. Furthermore, since these algorithms rely on star camera measurements for correction, their precision is directly influenced by the observation precision of the star camera. Therefore, it is of great engineering value to enhance the accuracy of single-star camera attitude determination by modeling its observations and fully utilize inter-star information to reduce errors.MethodsTo address the technical challenges outlined above, we first analyze the principles of traditional star camera attitude determination methods. This analysis reveals that accuracy primarily depends on four factors: the precision of navigation star vectors, the accuracy of matching observed stars with navigation stars, the accuracy of observed star vectors, and the weighting of star points. Navigation star vector accuracy can be improved by correcting star positions using stellar motion models, while matching accuracy can be improved via optimized star map recognition algorithms. In this paper, we focus on improving attitude accuracy by refining the precision of observed vector and optimizing the distribution of star point weights. First, considering observational noise, certain stars within the field of view (FOV) may exhibit lower measurement accuracy and negatively influence attitude results. To mitigate this, a threshold is introduced that dynamically adjusts based on real-time noise analysis of in-orbit star images, ensuring a balance between data retention and error elimination under varying conditions. Second, since the weight of a star point in the observation model correlates with its accuracy, we propose a method that evaluates observation vectors based on angular distance errors invariant across coordinate systems. Cross-validation of all FOV data enables optimal weight allocation. Finally, we build a topological model linking multiple stars, use redundant observations to construct constraint equations, and iteratively correct measurement errors using adjustment algorithms. The refined vectors and weights are then input into the quaternion estimator (QUEST) algorithm to determine the current frame’s attitude.Results and DiscussionsTo evaluate the performance of the proposed method, we assess its sensitivity to errors through comparative simulations with traditional algorithms and verify its robustness under observation noise. In addition, we confirm the method’s effectiveness in practical applications using in-orbit star images captured by star camera A and star camera B on board the Wuhan-1 satellite. Simulation parameters are set based on the actual optical system design specifications of the star cameras (Table 1). The precision of star observation vectors is affected by multiple coupled error sources, which collectively act as deviations on star centroid extraction positions. These disturbances are simulated by adding positional noise of different magnitudes to theoretical star imaging positions. To reduce the influence of star distribution and density on attitude determination accuracy, all-sky imaging scenarios are simulated by randomly selecting the star camera’s pointing directions. Simulation results (Fig. 2) demonstrate that, at varying error levels, the proposed method achieves higher attitude determination accuracy and superior noise resistance compared to traditional algorithms, maintaining high precision even under poor imaging conditions. For practical validation, we process the in-orbit star images captured by the Wuhan-1 satellite’s star cameras using the proposed method. Prior to attitude determination, it is necessary to calibrate the optical parameters of the star cameras in orbit according to the actual star images. Star screening thresholds are established using star maps under both normal (Fig. 5) and high-noise imaging conditions (Fig. 6), with Starpoint retention criteria determined by measurement errors. Since we have no way of knowing the true attitude pointing of the real star images, we assess the algorithms’ attitude determination accuracy based on the following two dimensions: inter-frame attitude stability of a single star camera and optical axis angle stability between two star cameras. For inter-frame attitude stability evaluation, we analyze 3600 consecutive frames of in-orbit star images by different attitude determination algorithms. The accuracy on the X and Y axes for a single star camera, as determined by the proposed algorithm, is better than 0.55″, a 15% improvement over the traditional algorithms. For optical axis angle stability between two star cameras, data from star camera A and star camera B during four 30-s in-orbit missions are analyzed, demonstrating that the proposed method achieves precision better than 0.5″, representing a 50% improvement over traditional methods.ConclusionsIn this paper, we present a high-precision star camera-based attitude determination algorithm suitable for micro-satellite platforms. The proposed algorithm leverages redundant observed stars in the attitude determination process, integrates the star camera imaging model, and assesses the credibility of star observation results through the invariant characteristics of interstellar angular distances across different reference frames. The star centroid positions are corrected to achieve precise attitude determination using the star camera. Simulation experiments and real-star image measurements validate the robustness and effectiveness of the proposed method, achieving sub-arcsecond accuracy in in-orbit star image attitude determination. This paper introduces a novel technical approach for high-precision post-mission attitude determination.
Jun. 25, 2025Vol. 45 Issue 12 1211004 (2025)
Zhigang Zhao, Xiaohu Yang, Yu Huang, Zihui Zhang, Zhanfeng Li, Heng Wu, and Guanrui Li
ObjectiveThe ultraviolet (UV) transmittance of the entire atmosphere is a key parameter for understanding the transmission of UV radiation through the atmosphere. This parameter is crucial for advancing ground-based UV astronomical observations and developing accurate atmospheric transmission models. In astronomy, stellar UV radiation serves as an essential source of information. By studying UV emissions, we can not only gain insights into evolutionary processes of stars, but also obtain critical data on chemical abundances of the universe and the elemental evolution of stars. Currently, stellar UV radiation is primarily observed from space. However, space-based observations are costly and pose significant technical challenges. Therefore, exploring the feasibility of ground-based UV observations is necessary. Due to atmospheric absorption and scattering, only a limited portion of the UV spectrum (280?400 nm) can be observed from the ground. Nevertheless, this accessible wavelength range still provides valuable astronomical information, making ground-based UV observations an important avenue for further research. A fundamental requirement for conducting ground-based celestial UV observations is the identification of an observatory site with optimal conditions for detecting UV radiation. Once such a site is selected, large-scale UV observation equipment can be deployed to measure stellar UV emissions. Typically, an ideal observatory site should exhibit high atmospheric UV transmittance, which necessitates precise measurements of UV radiation reaching the ground. These measurements are essential for evaluating the suitability of a site for UV observations. Investigations reveal that most ground-based UV radiation measurements, both domestically and internationally, focus primarily on daytime solar observations. However, these measurements are generally limited to the Sun as the sole target. There is currently a lack of equipment specifically designed for observing the UV radiation of stars at night. However, nighttime measurements offer significant advantages, including access to a greater number of observation targets and the ability to survey multiple regions of the sky. These measurements are crucial for constructing atmospheric transmission models and advancing astronomical observations. Therefore, developing an instrument capable of accurately measuring stellar UV radiation at night is essential for determining the atmospheric UV transmittance under nighttime conditions.MethodsDue to atmospheric absorption and scattering, the UV radiation reaching the ground is relatively weak. To address this challenge, we develop a specialized instrument for measuring faint UV radiation at night. First, considering characteristics of stellar UV radiation that reaches the ground, a photomultiplier tube (PMT) is employed for detection, while guide star technology is integrated to enable long-term tracking of the instrument. Since PMT cannot be used for imaging, and guide star technology requires target star imaging to correct tracking errors, we propose a novel stellar radiometer design. The proposed radiometer employs a dichroic mirror for spectral separation and is divided into two channels: an imaging channel and a detection channel. The imaging channel captures the star’s visible light, facilitating target acquisition and tracking through guide star technology, thereby compensating for the limitations of PMT. The detection channel focuses the UV radiation onto the cathode surface of the PMT while ensuring that the exit pupil of the optical system is well-matched to the PMT cathode. This design minimizes measurement errors introduced during the guiding process and enables precise UV radiation measurements. Additionally, a field diaphragm is positioned at the primary image plane to adjust the field of view and reduce the influence of sky background noise. In the instrument design process, spectral characteristics of the dichroic mirror are analyzed, confirming the feasibility of the proposed system. Based on the available atmospheric UV transmission window, stellar UV radiation will be measured in the 288–400 nm range, divided into sub-bands. By measuring stellar radiation at various zenith angles, the atmospheric UV transmittance for each band will be determined using the Beer-Lambert law and the Langley-plot calibration method.Results and DiscussionsThrough analysis and calculation, we design a stellar UV radiometer suitable for nighttime observations (Fig.5). The root-mean-square (RMS) radius of the imaging channel within the field of view is smaller than the Airy disk (Fig.6), meeting the requirements for guide star tracking. The exit pupil diameter of the detection channel is 6 mm (Fig.7), which is smaller than the 8-mm cathode surface of the PMT, effectively minimizing the influence of the guide star and ensuring accurate UV radiation measurements. Following the development of the instrument, field tests are conducted (Fig.8). During testing, the field diaphragm has a radius of 0.25 mm, corresponding to a field of view of 28 arcsec. The stellar UV radiometer is used to observe the star HR153 by controlling the equatorial mount. Results demonstrate that the imaging channel successfully control the equatorial mount, enabling long-term star tracking with an accuracy of ±2″ (Fig.9). Subsequently, the measured data from the detection subchannels u1, u2, u3, and u4 are subjected to linear fitting (Fig.10), and Langley calibration is performed to derive the atmospheric UV transmittance in Changchun (Fig.11). A comparison between the measured data and software-simulated results shows strong agreement (Fig.12), confirming the reliability of the instrument.ConclusionsIn this study, we develop a device capable of measuring the UV radiation of stars at night, with design results meeting practical application requirements. After the development phase, field tests demonstrate that the device achieves its intended performance, with the star offset during tracking remaining within ±2″. Additionally, UV radiation in the 288?400 nm range is measured across different sub-bands, and the atmospheric UV transmittance for each channel is obtained. These results indicate that the device enables long-term tracking of target stars and high-sensitivity UV detection, confirming its reliability. Furthermore, the proposed portable stellar radiometer has the potential to aid in the selection of observatory sites. In future developments, a smaller field stop will be implemented to further reduce sky background interference and enhance the instrument’s limiting magnitude. Additionally, narrower bandwidth filters will be used to improve the precision of stellar UV radiation measurements. These advancements will contribute to the establishment of a domestic standard atmospheric UV model and support the development of ground-based UV astronomical observations.
Jun. 23, 2025Vol. 45 Issue 12 1212001 (2025)
Jianing Wang, Zhipeng Xue, Lei Zhang, Jinquan Liu, Shanshan Cong, Chang Liu, Hongwei Zhang, Haowei Xiao, and Wenyan Li
ObjectiveThe opto-mechanical structure is a critical component of the space camera, which requires sub-micron accuracy. The fabrication and testing of the space camera occur under earth gravity, while its on-orbit operation takes place in a microgravity environment. The change in gravity conditions causes deformation of the opto-mechanical structure, which can alter the relative position of the mirror. This, in turn, affects the imaging performance of the space camera. Therefore, we study the effect of gravity load on the consistency of the opto-mechanical structure between ground and space.MethodsWe propose a non-contact optical measurement method, considering measurement error, to test the deformation of the opto-mechanical structure. This method is based on the self-collimation technique and is implemented by combining cubic prisms and a theodolite. The cubic prisms are attached to the load-bearing structure of the opto-mechanical system, and a theodolite with a self-collimating lamp is used to measure the normal direction of each cubic prism, thus representing the deformation of the assembly plane. Furthermore, the accuracy of the experimental results is verified through simulation by comparing the positive and negative gravity conditions. Moreover, the influence of gravity load on the consistency of the opto-mechanical structure between ground and space is comprehensively evaluated by combining the results from both the test and simulation.Results and DiscussionsIt can be seen from the test that the angular deviation of each mirror assembly plane of the opto-mechanical structure under the gravity condition is within 1″, and the dimensional deviation is within 1 μm (Table 5). Since the measured angular deviation is smaller than the measurement error of the theodolite, it is necessary to take into account the influence of measurement error on the results. The deformation obtained after considering the measurement error is within 3 μm, which is much smaller than the accuracy requirement (Table 1). Numerical simulation is used to extract and calculate the relative deformation of the mirror assembly planes, and the deformation obtained from the simulation is within 5 μm (Table 6). Comparing the experimental and simulation results (Fig. 5), the results show that the accuracy of the non-contact optical measurement method is verified. The deformations of the designed front frame and rear frame are less than 5 μm, which verifies the designed support structure’s high stiffness and stability.ConclusionsIn this paper, we propose a non-contact optical measurement method, considering the measurement error, for testing and analyzing the effect of gravity on the consistency of the opto-mechanical structure between ground and space. Additionally, the deformation of the structure is characterized by the relative position change of the assembly planes. The method of mutual verification between testing and simulation is introduced to verify the feasibility and accuracy of the proposed measurement method. The proposed non-contact measurement method, combining cubic prisms and the theodolite, can be used to test the deformation of large opto-mechanical structures under gravity loading, which requires consideration of the influence of measurement errors. The deformation of the opto-mechanical structure under both positive and negative gravity conditions can be obtained through experiments and simulations as mutual verification. Simultaneously, the accuracy of the established simulation model and the feasibility of the test method can also be verified. Through the combination of experimental and simulation results, it can be concluded that the deformations of the designed large opto-mechanical structures under gravity conditions are all within 5 μm, and the deformations of the front and rear frames are less than 5 μm. This verifies that the consistency of the opto-mechanical structure between ground and space under gravity conditions meets the tolerance requirements of the optical system.
Jun. 25, 2025Vol. 45 Issue 12 1222001 (2025)
Tingcheng Zhang, Xu Yan, Xiaolin Liu, and Zheng Wang
ObjectiveInfrared optical systems possess excellent penetrability and offer advantages in applications such as target tracking. Particularly, cooled long-wave infrared optical systems exhibit superior transmittance and detection performance, enabling all-weather operations. Combined with continuous zoom functionality, these systems can seamlessly transition from wide-field-of-view search to narrow-field-of-view detailed inspection while maintaining image stability and clarity. As a result, cooled long-wave infrared optical systems are widely used in fields such as coastal defense and ground-based air defense. To adapt to detectors with smaller pixels and avoid the use of binary surfaces, while also achieving a larger zoom ratio, the general rules of power distribution and the conditions for cold aperture matching based on the theory of mechanical compensation zoom are discussed. A method is proposed for rapidly obtaining initial structures by studying the Gaussian layout of cooled long-wave infrared optical systems, which can significantly improve optical design efficiency. Additionally, the irradiance values of thermal stray light introduced onto the image plane by the system itself are calculated. This effectively shifts the subsequent stray light analysis to the optical system design stage, allowing for the anticipation and avoidance of potential risks.MethodsBy integrating the rear fixed group into the secondary imaging system, the structure of the cooled long-wave infrared optical system is simplified while still achieving 100% cold shield efficiency and avoiding system vignetting. Based on the theory of mechanical compensation zoom systems, we propose a design method for rapid zooming to meet the requirement of a large zoom ratio. The core of this method is the allocation of optical power among different lens groups and the smooth zoom transition, which can be achieved by solving a quadratic equation. The quantitative relationships are provided between the first-order parameters and the general principles for determining these parameters. By tracing ideal rays, we study Gaussian structure layouts, which can quickly and in real-time verify the rationality of the solved first-order parameters, greatly improving design efficiency. Considering the inherent thermal stray light problem in long-wave infrared systems, we establish a linear mapping relationship between the surface temperature of the optical system and the irradiance on the image plane from the same surface. When the optical surface temperature changes, new irradiance values can be obtained without performing a new round of ray tracing. Moreover, this method of thermal stray light analysis can also be extended to the thermal stray light analysis of general optomechanical systems.Results and DiscussionsWith the reasonable allocation of optical power and research on Gaussian structure layouts, the initial structure can be obtained immediately. Further optimization by implementing the CODE V software results in an optical system that meets all the technical requirements. The materials chosen for the lenses are Germ, ZnS, Germ, Germ, ZnS, and GaAs (Table 2), and the introduction of sulfur glass helps control chromatic aberrations. In this optical system, four even-ordered aspherical surfaces are employed (Table 3), with the remaining surfaces being standard spherical surfaces. The modulation transfer function (MTF) at all focal lengths is close to the diffraction limit (Fig. 8). The root mean square (RMS) diameter is within the pixel size at all focal lengths for all fields of view (Fig. 9). Meanwhile, the distortion is also well corrected, with a maximum value of 1.66% (Fig. 10). Considering the needs of manufacturing and alignment, the zoom cam has been optimized to ensure that the rise angles of the two zoom paths can be controlled between 5.19° and 30.47° (Fig. 7). The design example is a cooled long-wave infrared continuous zoom optical system with a magnification ratio of 20, an image plane size of 9.60 mm×7.68 mm, a maximum focal length of 400 mm, a constant F# of 3, and distortion and chromatic aberrations corrected, which provides new ideas and insights for the design of such optical systems. The results of the thermal stray light analysis indicate that zooming does not significantly affect the irradiance on the image plane.ConclusionsFor the cooled long-wave 640 pixel×512 pixel infrared detector with pixel dimensions of 15 μm×15 μm, a cooled long-wave infrared zoom optical system with a smooth zoom transition has been designed to meet the need for reducing axial dimensions. The system achieves MTF values close to the diffraction limit at all focal lengths, which indicates excellent image sharpness. It features a compact structure, minimal aberrations, and high overall imaging quality. The system achieves a zoom ratio of 20, a large relative aperture (with a constant F# of 3), a short and smooth zoom curve, and excellent correction of various aberrations. Additionally, the irradiance values formed on the image plane by the thermal stray light of the optical system itself have been calculated, which can serve as supplementary data for subsequent calculations of dynamic range, contrast, and other parameters. The optical system designed in this paper can be applied in fields such as surveillance, reconnaissance, and air defense.
Jun. 24, 2025Vol. 45 Issue 12 1222002 (2025)
Xin Liu, Zikang Jiang, Haoran Guo, Lijie Zhu, Xiaojie Li, and Chunhui Niu
ObjectiveTraditional star simulators are limited by short exit pupil distances (300?500 mm), which restrict their compatibility with large multi-axis turntables used in high-precision testing of star sensors. These limitations arise from the trade-off between extending the exit pupil distance and maintaining imaging quality, as longer distances often exacerbate optical aberrations and reduce illumination uniformity. Additionally, conventional illumination systems struggle to achieve high light efficiency and uniformity, leading to inconsistent star-point brightness. This study addresses these challenges by proposing a novel optical system design for dynamic star simulators, integrating collaborative optimization of projection and illumination subsystems. The primary objectives are to achieve a 700 mm exit pupil distance, ensure high modulation transfer function (MTF) values, minimize distortion and spot radius, and deliver 98% illumination uniformity. These advancements aim to enhance ground-based testing accuracy for star sensors in aerospace applications.MethodsThe projection optical system was designed using Zemax software with sequential ray-tracing mode. The Erfle eyepiece, known for its wide field of view (65°?75°) and long back focal length, was selected as the initial structure to accommodate the extended exit pupil distance. A polarizing beam splitter (PBS) was integrated to optimize the optical path layout, reducing stray light and controlling distortion. To achieve the target exit pupil distance of 700 mm, a stepwise optimization strategy was implemented: incremental adjustments of 50 mm were made to the exit pupil distance, followed by local optimization to correct aberrations. When local optimization failed, global optimization using the hammer algorithm was applied, with material selection constrained to H-K9L glass for PBS components to ensure manufacturability. Key parameters included an F-number of 7, a focal length of 384.7 mm, and a working wavelength range of 450?700 nm. For the illumination subsystem, LightTools software facilitated non-sequential ray tracing. A TIR (total internal reflection) lens was designed using PMMA material to collimate light from a 1 mm×1 mm LED source (550 nm center wavelength). The TIR lens featured dual surfaces: a refractive surface for low-angle light collimation and a reflective surface for high-angle light redirection. Compound-eye lenses were then employed to homogenize the collimated beam. The first compound-eye lens array split the beam into sub-sources, while the second array, positioned at the focal plane of the first, superimposed these sub-sources to achieve uniform illumination. The system’s performance was evaluated based on irradiance uniformity and divergence angle, with a target uniformity of 98% over a 35 mm×35 mm LCOS target area.Results and DiscussionsThe projection optical system achieved a 700 mm exit pupil distance with a 55 mm diameter, surpassing traditional designs. At 61 lp/mm (Nyquist frequency), the MTF values exceeded 0.6 across all fields (Fig. 2), ensuring high-resolution imaging. The root-mean-square (RMS) spot radius remained below 8.2 μm (Fig. 3), matching the LCOS pixel size and minimizing centroid calculation errors for star sensors. Distortion was controlled below 0.4% (Fig. 4), critical for maintaining positional accuracy of simulated stars. Field curvature, though less critical for centroid detection, was constrained to <0.08 mm. Tolerance analysis reveals that 80% of Monte Carlo samples retain MTF of >0.56 (Table 3), validating the robustness of the design under manufacturing variations. The illumination subsystem demonstrated exceptional performance. The TIR lens achieved a collimation divergence angle of <24°, with optimized surface curvatures (refractive surface: -1.5 curvature, 20 mm radius; reflective surface: -1.165 curvature, 7.4 mm radius). Compound-eye lenses with 2 mm×2 mm spherical micro-lenses further homogenized the beam, achieving 98% irradiance uniformity across the LCOS target (Figs. 8 and 9). This uniformity ensures consistent star-point brightness, a critical factor for accurate sensor calibration. Additionally, the compact design of the compound-eye lenses reduced system volume compared to traditional light-pipe solutions.ConclusionsThis study presents a groundbreaking optical system design for dynamic star simulators, resolving the longstanding conflict between extended exit pupil distances and high imaging quality. By leveraging the Erfle eyepiece’s inherent advantages and integrating PBS-based path optimization, the projection system achieves a 700 mm exit pupil distance with MTF of >0.6 and distortion of <0.4%. The illumination system, combining TIR collimation and compound-eye homogenization, delivers 98% uniformity, addressing a key bottleneck in star simulator performance. These innovations enable precise testing of star sensors on large turntables, enhancing reliability in aerospace applications. Future work may explore material alternatives for thermal stability in non-laboratory environments and adaptive optimization algorithms for even longer exit pupil distances.
Jun. 23, 2025Vol. 45 Issue 12 1222003 (2025)
Li Ma, Ying Wang, Ying Zhang, Min Li, Xiangyu Wang, Pengcheng Liu, and Yaru Gao
ObjectiveRadar systems, which acquire precise target information through electromagnetic wave transmission and reception, maintain critical strategic importance in both national defense security and civil monitoring applications. To address the persistent challenge of limited detection accuracy in conventional radar systems under complex electromagnetic environments, this study introduces a novel radar detection system incorporating vortex beams with distinct topological properties, establishing a spiral multi-pinhole array coaxial vortex modulated radar filtering detection scheme. Utilizing the unique spatial characteristics of the vortex signal beam and stray light components, this radar detection system enables target information acquisition without noise interference, thereby substantially enhancing detection accuracy.MethodsThe proposed coaxial vortex radar system employs a dual-stage phase modulation process with a spiral multi-pinhole array, encompassing vortex detection beam generation through phase modulation and vortex signal beam reconstruction via conjugate phase matching. Based on the differential modulation effects for the vortex signal beam and stray light, effective noise-suppressed radar filtering detection is achieved by utilizing the spatial separation characteristics arising from topological differences. Through integrated theoretical analyses and numerical simulations, we systematically examine the generation of vortex detection beam, reconstruction of the vortex signal beam, and spatially filtering detection of noise-suppression. The theoretical framework applies diffraction optics principles to analyze coaxial vortex modulation mechanics. The numerical simulations utilizing wave propagation algorithms illuminate spatial evolution characteristics, including intensity distributions, phase profiles, and signal-noise spatially separational filtrations.Results and DiscussionsThe results present a comprehensive analysis of the coaxial vortex modulations in radar detections. The theoretical modeling confirms that the coaxial modulations through the spiral multi-pinhole array generate the vortex signal beam exhibiting the central brightness intensity distribution with topological charge of l+l′=0. In contrast to stray light, the natural noise beam displays the vortex characteristics of an annular intensity with topological charge of l′. These findings theoretically demonstrate the fundamental differences in topological characteristics between the vortex signal beam and natural vortex beam. Combined with numerical simulations, the parametric analyses reveal increasing spatial separation efficiency with higher topological orders [Fig. 4(a)]. Consequently, to achieve complete noise-suppression, the topological charge must exceed a critical order, specifically at least 4-order in our configuration [Figs. 4(b)?4(d)].ConclusionsThis study presents a novel radar detection system based on the coaxial modulations of vortex beams by a spiral multi-pinhole array. The dual-stage vortex modulation system creates inherent topological differences between vortex signal and stray components, resulting in distinct spatial distributions. Utilizing the spatially separational filtrations, this radar detection system effectively filters out stray interference and achieves complete noise-suppression. This research not only validates the feasibility of vortex modulations in radar detection but also establishes a paradigm for deep fusion of photon orbital angular momentum and classical radar technology, providing crucial technical support for photoelectric fusion detection technology systems.
Jun. 23, 2025Vol. 45 Issue 12 1226001 (2025)
Shu Li, Xingyuan Ji, Xiaoxue Chu, Song Ye, Ziyang Zhang, Yongying Gan, Xinqiang Wang, and Fangyuan Wang
ObjectiveCloud-related uncertainties in global climate models (GCMs) significantly affect the accuracy of global climate simulations. The presence of clouds poses challenges to remote sensing applications, such as atmospheric and surface parameter retrieval, limiting the usability of remote sensing images and reducing data utilization rates. Accurate cloud information extraction from remote sensing images helps mitigate the negative effects of cloud cover on applications like aerosol parameter retrieval, atmospheric correction, and land cover change detection, while also enhancing the accuracy of cloud parameter inversion. Therefore, precise cloud detection is crucial for optimizing the application of remote sensing data.MethodsIn recent years, deep learning has been extensively applied to cloud detection, with convolutional neural networks (CNNs) playing a pivotal role. However, traditional CNNs typically focus on either spectral or spatial image information, neglecting the multi-angle, multi-dimensional space that can provide richer image context and improve detection outcomes. In addition, deep learning approaches often require large training datasets, while cloud samples are typically fragmented, sparse, and scattered, necessitating significant labor and time for manual annotation. To address these challenges, we propose a multi-information fusion cloud detection network (MIFCD-Net) that integrates spectral, polarization, and multi-angle information. The MIFCD-Net framework (Fig. 2) leverages training data sourced from the ICARE website, eliminating the need for manual cloud label annotation. MIFCD-Net comprises three primary modules: the data preprocessing module, the spectral-polarization-spatial global multi-angle information perception module and the spectral-polarization-spatial global multi-angle information fusion module. The data preprocessing module performs multi-dimensional feature selection (FE) and processing (FP) to eliminate scale differences and enhance category separability. The spectral-polarization-spatial global multi-angle information perception module employs a multi-path structure, including a multi-angle adaptive attention module, a spectral-polarization attention module, and a spatial-global attention module. This module captures local features in detail, comprehensively considers global multi-angle information, dynamically adjusts focus on different features, and extracts multi-angle, multi-spectral, polarization, and spatial texture information. Finally, the spectral-polarization-spatial global multi-angle information fusion module effectively integrates multi-dimensional feature information while minimizing redundancy and noise, enabling robust cloud detection and classification through a fully connected layer (Fig. 3).Results and DiscussionsExtensive qualitative and quantitative experiments are conducted to evaluate MIFCD-Net’s performance across diverse global surface types, supplemented by ablation studies for in-depth analysis. To validate its effectiveness, MIFCD-Net is compared with the ResNet model, a benchmark in tabular tasks. The experimental results (Table 3) show that MIFCD-Net achieves a consistency rate of 95.53% for oceanic cloud detection, 81.49% for mountainous regions, and 75.98% for agricultural areas—outperforming the official POLDER3 cloud labeling algorithm. Furthermore, MIFCD-Net demonstrates superior performance in capturing cloud boundary contours (Figs. 3?5). While challenges such as surface type influence on detection accuracy and cloud boundary misclassification remain, MIFCD-Net exhibits strong overall detection performance. Ablation experiments (Fig. 6) confirm that the spectral-polarization-spatial global multi-angle perception module significantly enhances feature extraction and boundary detection, with each component contributing to the model’s accuracy and robustness. Comparisons further underscore MIFCD-Net’s superiority in detection precision and adaptability.ConclusionsIn this paper, we propose MIFCD-Net, a novel multi-information fusion cloud detection network that integrates multi-spectral, polarization, and multi-angle detection. MIFCD-Net is constructed using a spectral-polarization-spatial global multi-angle information perception module and a spectral-polarization-spatial global multi-angle information fusion module, designed to fully capture the multi-angle and multi-band information of clouds while supplementing contextual details. We utilize POLDER3 multi-band and multi-angle data as research samples to validate the cloud detection capabilities of the proposed model by comparing its consistency with MODIS cloud label data. The results demonstrate that this method outperforms the official POLDER3 cloud detection algorithm in identifying various surface types and cloud shapes, particularly excelling in capturing cloud texture details. Moreover, this approach provides innovative insights for advancing cloud detection within China’s “polarization exchange” detection framework.
Jun. 23, 2025Vol. 45 Issue 12 1228001 (2025)
Yanqing Wang, Weifeng Du, Yongkang Wu, Yuan Gao, and Jinfeng Zhong
ObjectiveWe aim to better evaluate the accuracy of star sensors and provide accurate guarantees for satellite measurement accuracy. When remote sensing satellites are in orbit, the requirements for imaging quality are increasingly high. In addition to high-resolution imaging of the payload, the satellite platform attitude must also have high accuracy. Star sensors are high-precision satellite attitude measurement sensors, and their measurement accuracy directly determines the accuracy of satellite attitude determination. Their measurement accuracy is mainly influenced by factors such as measurement noise of star sensors, calibration errors of installation matrices, and thermal deformation of satellite structures. Usually, when calculating attitude measurement errors, a reference attitude, also known as the true attitude, is required. The measurement error is obtained by statistically comparing the measured attitude with the reference attitude. After the satellite enters orbit, it is usually difficult to establish this true reference attitude, so it cannot be compared with the reference attitude. The current method for calculating the measurement error of star sensors in orbit is to statistically analyze the change in attitude quaternion output by the star sensor or to quantitatively analyze the representation of the star sensor’s optical axis in inertial space. The implementation of determining the measurement error of star sensors through camera payload or using landmarks to measure the low-frequency error of star sensors is complex and difficult to generalize. At present, there is little systematic analysis in the literature on the low-frequency errors, noise equivalent angles, optical aberration, and precession of star sensors, especially the influence of satellite thermal environment changes on the accuracy of star sensors, including thermal deformation of the optical mechanical structure and support convex platform of the star sensor itself. Therefore, to better evaluate the accuracy of star sensors and provide accurate guarantees for satellite measurement accuracy, it is necessary to conduct a detailed analysis of multiple aspects such as random measurement errors, thermal deformation errors, optical aberration, and precession based on the in-orbit measurement data of star sensors.MethodsFirst, we classify the in-orbit errors of star sensors. Second, we present three methods for analyzing in-orbit errors: epoch difference method, polynomial fitting method, and optical axis angle method. To eliminate the shaking of the satellite platform, we use the optical axis angle method to analyze the four star sensors of the four-dimensional Gaojing-3 satellite. We obtain the orbital period errors (including the thermal stability error of the star sensors and the thermal deformation error of the support convex platform) and the random errors of the star sensors such as low-frequency error and noise equivalent angle (Figs. 1?4). Based on the analysis of in-orbit data, we identify the reason for the large orbital period error of star sensor 2 and propose a method for correcting optical aberration. Using UTC, satellite orbital velocity, and star sensor quaternion, we calculate the attitude matrix after optical aberration correction and the quaternion after optical aberration compensation. We upgrade the optical aberration function of star sensor 2 in application software through in-orbit programming method and analyze the corrected data of optical aberration, resulting in a significant reduction in in-orbit error. Through the analysis of the angle between the optical axes of star sensors 1 and 2, we find that there is an error with an orbital time period (Fig. 8), and provide a precession correction method (Eqs. 10?14). We verify the necessity of precession correction by analyzing the optical axis angles of different star sensors before and after precession correction (Fig. 9).Results and DiscussionsThe orbital period error of single star sensors 1 and 2 is 1.1112″, while the orbital period error of single star sensors 3 and 4 is 11.2637″. The difference in orbital period error between star sensors 1 and 2 is significant (Table 1). Considering that the materials, installation positions, and angles of the two types of star sensor bracket protrusions are basically same in the design of the entire star, and the thermal deformation of the bracket protrusions caused by the alternation of cold and hot orbits is basically same, the main reasons for the differences are the measurement errors and thermal deformation of the star sensors themselves. Optical aberration correction can significantly reduce orbital period errors, with little effect on noise equivalent angle and low-frequency errors. After optical aberration correction, the orbital period error of individual star sensors 3 and 4 is reduced from 11.2637″ to 2.5689″, and the optical aberration is effectively eliminated (Table 2). The main component of the orbital period error of star sensors 3 and 4 after optical aberration correction is the thermal stability error caused by the thermal deformation of the support and the star sensor. Meanwhile, the noise equivalent angle and low-frequency error of the star sensor are not affected before and after optical aberration correction. From the in-orbit data, it can be proven that the thermal stability error of star sensor 1 is about 4.73% of the thermal stability error of star sensor 2 [0.1203 (″)/℃)/(2.5414 (″)/℃]. By analyzing the angle between the optical axes of star sensors 2 and 4, it can be found that there is an error with a period of one orbital time, and the difference between the maximum and minimum values reaches 144″. One of the two star sensors has not enabled precession correction, which may result in a deviation in orbital period and requires precession correction (Fig. 8). Before and after correcting the precession of the star sensor, the average range of change in the optical axis angle between star sensor 1 and star sensor 2 decreases by 79″, accounting for 65.24%, which can effectively reduce the orbital period error of the star sensor (Table 3).ConclusionsWe provide a detailed classification of the in-orbit errors of star sensors, analyze the sources of errors, and make corrections to the errors. Star sensors are high-precision satellite attitude measurement sensors, and their measurement accuracy directly determines the accuracy of satellite attitude determination. We analyze the in-orbit data of four star sensors 1, 2, 3, and 4, based on the requirements of the Four Dimensional Gaojing-3 satellite for the allocation of measurement link accuracy indicators such as star sensors, GNSS, satellite platforms, and time benchmarks. Firstly, we introduce the in-orbit errors of star sensors, including random measurement errors of star sensors, thermal deformation errors of star sensor brackets, thermal deformation of bracket mounting surfaces relative to camera reference, thermal drift of star sensor visual axis pointing, aberration, and precession. The methods for analyzing in-orbit errors of star sensors, such as epoch difference method, polynomial fitting method, and optical axis angle method, are provided. We provide a detailed analysis of the low-frequency error, noise equivalent angle, and thermal stability error of the four star sensors 1, 2, 3, and 4. The random noise of the star sensor is 1.3525″, with a noise equivalent angle of 0.9940″ and a low-frequency error of 0.9197″, which meets the accuracy index allocation requirements of the sensing satellite for the star sensor. The orbital period error (X or Y axis of a single star sensor) of star sensor 1 (including thermal deformation of the bracket) is 0.7857″@±1 ℃, and the calculated thermal deformation of the star sensor bracket boss is 0.5458″. The orbital period error of star sensor 2 is 1.8165″@±0.25 ℃. The thermal stability error of star sensor 1 is 0.1203 (″)/℃, and the thermal stability error of star sensor 2 is 2.5414 (″)/℃. Star sensor 1 can effectively improve the thermal stability of in-orbit star sensors by independently isolating and installing a light shield, optimizing the design of the main frame material and structure, and improving the optical and mechanical assembly process. This method reduces the thermal stability error by 95.27% compared to star sensor 2 and can provide a reference for the subsequent thermal stability design of star sensors. Finally, through in-orbit data analysis, the aberration and precession of star sensors are discovered, and corresponding in-orbit correction methods are proposed. After aberration correction, the orbital period error of individual star sensors 3 and 4 is reduced from 11.2637″ to 2.5689″, effectively eliminating aberration. By using precession correction, the error between star sensor 1 and star sensor 3 with one orbital period is reduced from 144″ to 25″, which can reduce the orbital period error by 85.63%. The correction method can improve the in-orbit measurement accuracy of star sensors, assure satellite measurement accuracy, and also provide a reference for future high-precision star sensor design.
Jun. 23, 2025Vol. 45 Issue 12 1228002 (2025)
Xinglei Zhao, Meili Zhu, Kewen Hu, and Fengnian Zhou
ObjectiveIn 1996, McFeeters proposed the normalized difference water index (NDWI), leveraging the unique reflectance characteristics of water bodies in remote sensing images, high reflectance in the green band and low reflectance in the near-infrared band. This index enables effective extraction of water bodies from remote sensing images and has become a classic and widely cited method in water body extraction, with thousands of references in academic research. While NDWI is widely applied to remote sensing images, its application to airborne LiDAR point cloud data remains limited. Compared to remote sensing image data, airborne LiDAR offers advantages such as high-precision laser point cloud data acquisition, independence from solar radiation, and greater operational flexibility. To address this gap, we propose a novel NDWI-LiDAR method that facilitates the rapid and accurate extraction of water body information by using only the elevation data from dual-frequency laser point clouds, overcoming the dependence on full waveform data.MethodsIn this paper, the proposed NDWI-LiDAR leverages the uncertainty and measurement bias of green lasers in water surface measurements and is based on the point clouds generated by airborne infrared and green lasers. The expression form of this index is similar to that of the NDWI, but the pixel values of the near-infrared and green bands in remote sensing images are replaced by the elevations of infrared and green laser points. First, the raw measurement data from the infrared and green lasers are used to calculate the positions of the laser footprints, resulting in infrared and green laser point clouds, respectively. Second, the expression for NDWI-LiDAR is provided based on the different characteristics of infrared and green lasers in water and land measurements. Third, a land?water discriminator utilizing the NDWI-LiDAR is introduced, with the Otsu method applied to establish the threshold for water extraction. Finally, the pulse numbers of adjacent laser points are analyzed to differentiate and eliminate noisy water points, thus obtaining the final water surface laser points and realizing accurate water body extraction from airborne laser point clouds (Fig. 5).Results and DiscussionsThe measurement datasets collected by the Optech CZMIL system are used to validate the correctness and effectiveness of the proposed method. In the experimental area, the NDWI-LiDAR values for land tend toward 0 and negative, whereas those for water are positive. As shown in the NDWI-LiDAR probability density distribution image (Fig. 10), the land and water NDWI-LiDAR data exhibit distinct dual peaks: the peak NDWI-LiDAR density value for water is approximately 0.3, whereas that for land is approximately 0. Compared with the traditional random sample consensus (RANSAC) method, which is based on single-frequency laser point clouds, the NDWI-LiDAR method proposed in this paper reduces the number of incorrectly extracted water points by 86.7% (Fig. 12). Equations (12) and (13) are used to calculate the distance bias and structural similarity (SSIM) index of the land?water interface determined by the two methods. The maximum bias, mean bias, and standard deviation of the land?water interface determined by the NDWI-LiDAR are 25.2, 4.2, and 4.2 m, respectively, with an SSIM value of 0.92. In contrast, the maximum bias, mean bias, and standard deviation determined via the RANSAC method are 50.3, 8.8, and 6.7 m, respectively, with an SSIM value of 0.89 (Table 1).ConclusionsIn the experimental area, the NDWI-LiDAR values for land tended toward 0 and negative values, whereas those for water are positive. From the perspective of the NDWI-LiDAR probability density distribution, the values for land and water significantly differ. The peak NDWI-LiDAR density for water is approximately 0.3, whereas that for land is approximately 0. The results indicate that the NDWI-LiDAR values for land and water are significantly different, suggesting that it is reasonable to use NDWI-LiDAR as a LiDAR-based index for water extraction. Compared with the traditional RANSAC method, which relies on single-frequency laser point clouds, the NDWI-LiDAR method proposed in this paper reduces the number of incorrectly extracted water points by 86.7%, reduces the standard deviation of the land?water interface by 37.3%, and improves the SSIM index by 3.3%. The results demonstrate that the NDWI-LiDAR method effectively leverages the advantages of dual-frequency laser point clouds, thus enabling accurate and efficient acquisition of spatial distribution information for water bodies based on LiDAR point clouds.
Mar. 26, 2025Vol. 45 Issue 12 1228003 (2025)
Yifan Zhong, Liyuan Li, Tianyu Tao, and Fansheng Chen
ObjectiveDue to the vertical temperature stratification of the sea surface, ship wakes can extend over hundreds to thousands of meters and are often more spatially observable than the ships themselves. Meanwhile, these wakes contain valuable dynamic information about ship movements and provide a critical means for detecting maritime activities, especially in all-weather conditions. The detection of ship wakes via thermal infrared (TIR) images has become increasingly important for both civilian and military applications, such as navigation safety improvement and maritime security monitoring. We aim to develop an effective and robust method for detecting ship wakes in TIR remote sensing images, thereby overcoming challenges such as complex sea surface noise, low-resolution limitations, and environmental variability.MethodsTo address these challenges, we propose a novel ship wake detection method based on an improved line segment detector (LSD) algorithm. This approach leverages the unique characteristics of TIR ship wakes, such as their stable energy intensity and grayscale contrast with the background. The detection process consists of the following key steps. First, Gaussian blur preprocessing is applied to reduce grid-like noise patterns inherent in satellite images, which are caused by scanning mechanisms. Then, we introduce an adaptive thresholding technique to segment the image, utilizing the average grayscale values of wake pixels identified by the LSD algorithm. This step isolates potential wake regions based on their intensity differences from the surrounding sea surface. After segmentation, the method employs Canny edge detection to refine wake boundaries, enhancing the clarity of the detected structures. Finally, the Douglas-Peucker curve fitting algorithm is adopted to smooth the detected wakes and remove noise, which ensures accurate extraction of both linear and curved wakes. The algorithm also identifies and discards false positives caused by non-wake features in the image to maintain high precision.Results and DiscussionsExperiments are conducted by utilizing TIR data from the SDGSAT-1 satellite, which captures images over the Mediterranean Sea in clear weather conditions. The results confirm the effectiveness of the proposed method. Compared to traditional LSD and Hough Transform approaches, the improved method demonstrates superior noise resistance, enhanced wake segmentation accuracy, and sound performance in detecting wakes with varying linearity. The adaptive thresholding step successfully identifies wake regions with high contrast, enabling the precise separation of wakes from the surrounding sea surface. This is particularly effective in addressing the challenges posed by periodic noise patterns and low signal-to-noise ratios in TIR images. Edge detection and curve fitting further refine the detected wake structures to make the method reliably extract both linear and curved wakes. This capability is critical, as not all ship wakes exhibit perfect linearity and curved wakes often contain valuable dynamic information about ship movement. Furthermore, the method exhibits the ability to detect multiple wakes within a single image, which serves as an essential feature for monitoring dense maritime traffic. Additionally, it also demonstrates robustness across different sea surface conditions, thereby highlighting its adaptability and scalability for diverse operational scenarios. Importantly, the method's reliance on a deterministic algorithm rather than deep learning simplifies the dataset preparation process, making it more suitable for generating ship wake datasets and supporting subsequent analyses. We also explore the limitations of current TIR imaging systems, such as their relatively low spatial resolution (30 m) and the presence of grid-like noise. Despite these constraints, the proposed method provides a reliable framework for wake detection and segmentation, contributing to the construction of high-quality TIR wake datasets. These datasets have significant potential for advancing research on wake morphology analysis and dynamic ship information retrieval.ConclusionsThe proposed LSD-based adaptive threshold detection method represents a significant advancement in the detection of ship wakes in TIR remote sensing images. By combining Gaussian blur preprocessing, adaptive threshold segmentation, Canny edge detection, and Douglas-Peucker curve fitting, the method addresses such challenges as noise, complex sea surface backgrounds, and varying wake linearity. Experimental results demonstrate that the method reliably detects complete information about wake structures, including curved and multi-wake scenarios, with high accuracy and noise resistance. The robust performance highlights the method's potential for constructing comprehensive TIR wake datasets, analyzing wake features, and extracting ship-related information for both scientific and operational purposes. Additionally, the approach's independence from deep learning frameworks ensures a streamlined and efficient process for dataset preparation. Future research will focus on optimizing the algorithm's computational efficiency, enhancing its adaptability to diverse environmental conditions, and integrating it into real-time monitoring systems. These efforts will further strengthen the method's applicability to maritime surveillance and security applications.
Jun. 23, 2025Vol. 45 Issue 12 1228004 (2025)
Xue Li, Dong Li, Jiandong Fang, and Xueying Feng
ObjectiveBuilding change detection has caught wide attention as an important research direction with the continuous progress made in change detection technology of remote sensing images. Accurate building change detection is crucial for land utilization assessment, urban development monitoring, and disaster damage assessment. Although traditional change detection methods can provide some assistance for building change detection, they usually rely on spectral information or simple pixel-level differences and have certain limitations, especially when dealing with high-resolution remote sensing images of complex scenes with low accuracy. With the rise of deep learning, especially convolutional neural networks (CNNs), the change detection tasks of remote sensing images have been significantly improved. However, methods based on CNNs usually employ simple fusion operations as the last step of the detection results and fail to pay sufficient attention to effective change information extraction. Additionally, existing feature extraction methods tend to ignore the feature interactions between two spatiotemporal images and usually focus only on features at isolated time points, which restricts the ability to capture the change information and fails to recognize the dynamic feature interactions between two spatiotemporal images. When high-resolution remote sensing images still face shortcomings such as complex spatial features and much scale information, especially during extracting the relationship between the target of interest and other targets in the changing region, the Transformer-based method also cannot fully capture the long-distance dependency between different areas, resulting in limited performance improvement. To this end, we propose a new method for change detection in high-resolution remote sensing images based on spatiotemporal fusion and SFMRNet.MethodsThe proposed SFMRNet employs an encoder-decoder architecture, where a two-branch weight-sharing encoder processes the dual time-phase images, feature extraction is carried out in each branch by adopting ResNet 18, and a feature exchange module (FEM) is utilized to efficiently extract the key information related to building changes after the stage 1 and stage 3 of ResNet 18. The extracted dual time-phase features from each layer are processed by the spatiotemporal fusion module (STM) to capture important information between different temporal features. The fused output is further fed into the multi-feature relationship module (MFA), which leverages self-attention and cross-attention mechanisms to capture intra-class relationships and parse the interaction information between the changing region and the environment respectively. Next, the multi-layer perceptron (MLP) is adopted to optimize the global information related to the channels in the feature map and generate the attention map. During the decoding, the attention map is restored to its original spatial resolution by up-sampling step by step to reduce the spatial information lost from deep features and ensure full utilization of multi-scale information. Finally, the difference feature maps restored to their original size are processed by a pixel classifier to generate the final change prediction map.Results and DiscussionsWe conduct experiments on two public datasets (LEVIR-CD and WHU-CD) to validate the model’s effectiveness. The results show that SFMRNet achieves 91.54%, 90.32%, 81.54%, and 89.80% on the WHU-CD dataset for the precision (Pr), F1 score, intersection of union (IoU), and recall (Rc) metrics respectively, which have improved by 1.90 percentage points, 2.34 percentage points, 3.56 percentage points, and 4.32 percentage points compared to the BIT method as the second best-ranked method in terms of composite ranking. Especially in the F1 metric, SFMRNet reaches 90.32%, which is 0.82 percentage points higher than the second-ranked SNUNet (89.50%), while in the over accuracy (OA) metric, it is 0.30 percentage points higher than BIT. On the LEVIR-CD dataset, SFMRNet achieves 90.32% and 81.54% for F1 and IoU respectively. Compared with FC-EF, FC-Sima-Diff, FC-Sima-Conc, DTCDSCN, SNUNet, BIT, and STANet, the F1 values of SFMRNet are improved by 7.71 percentage points, 4.80 percentage points, 7.42 percentage points, 3.44 percentage points, 2.95 percentage points, 1.80 percentage points, and 4.34 percentage points respectively. In addition, SFMRNet achieves an OA metric of 99.14%, which is 0.22 percentage points higher than the second-ranked BIT (98.92%). The visualization results further demonstrate the effectiveness of SFMRNet, showing that the model can effectively avoid the interference of shadows and environmental factors in detection. The generated change maps retain the continuous boundaries of the changing buildings and have high internal compactness, which are closer to the real labels. To validate the effectiveness of the proposed modules FEM, STM, and MFA, we conduct a series of ablation experiments on the two datasets, the results of which are shown in Table 3. These experiments further confirm the effectiveness of each FEM, STM, and MFA and show their synergistic effect in improving the change detection performance.ConclusionsWe propose a remote sensing change detection network that integrates time-domain fusion and multi-feature relationships. The network employs the FEM to enhance feature interactions between dual-temporal images and filter out irrelevant information, thereby improving building change detection. The STM dynamically identifies important features by fusing temporal information, thus enhancing the integration of dual-temporal features and ensuring key information retention. Additionally, the MFA utilizes self-attention and cross-attention mechanisms to capture the varying levels of intrinsic relationships between the features, which enhances the segmentation accuracy of changing regions. We validate the superiority of SFMRNet via qualitative and quantitative comparisons across multiple remote-sensing image datasets. Ablation experiments further confirm the contribution of each module to overall performance, demonstrating SFMRNet’s capability to capture subtle change information and reduce background noise interference. These results indicate that SFMRNet provides an innovative and efficient solution for change detection, thereby facilitating performance improvement in practical applications.
Jun. 13, 2025Vol. 45 Issue 12 1228005 (2025)
Mu Zhou, Haocheng Ran, Yong Wang, and Nan Du
ObjectiveWith the rapid advancement of automobile intelligence, the demand for high-precision object detection of road obstacles in autonomous driving continues to grow to ensure driving safety. However, existing object detection methods based on lidar point clouds face significant challenges. For instance, direct point cloud processing consumes substantial computational resources, voxel-based methods still have high computational costs, and approaches combining point clouds with visual images encounter complex data fusion challenges. While point cloud projection methods simplify data representation and reduce computational demand, they suffer from issues such as information loss and feature fusion difficulties. Consequently, simplifying point cloud representation, reducing computational overhead, and improving detection precision have become pressing challenges. To address these issues, we propose a multi-view fusion object detection method based on lidar point cloud projection.MethodsIn this paper, we propose a multi-view fusion object detection method to address three-dimensional (3D) point cloud detection tasks. The system architecture is shown in Fig. 1. Specifically, to achieve dimensionality reduction, the 3D point clouds are first projected onto a plane to generate a two-dimensional (2D) bird’s eye view (BEV). Simultaneously, the 3D point clouds are converted into cylindrical coordinates, and the cylindrical surface is unfolded into a rectangle to create a 2D range view (RV). Projection views are encoded into multi-channel images from the point cloud data. These images serve as input to the object detection network. In addition, the efficient channel attention (ECA) mechanism is incorporated into the Complex-YOLO and YOLOv5s networks, which are employed as the object detection networks for BEV and RV, respectively. The preliminary object detection results from both views are then fused at the decision-making level using weighted Dempster-Shafer (D-S) evidence theory, resulting in the final detection outputs.Results and DiscussionsIn scenarios without occlusion, the proposed method achieves slightly lower detection precision for pedestrians and cyclists compared to BEVDetNet and sparse-to-dense (STD), respectively. Specifically, the precision for detecting pedestrians is 1.22 percentage points lower than BEVDetNet (Table 2), and the precision for detecting cyclists is 0.40 percentage points lower than STD (Table 3). However, under occlusion conditions, the method significantly improves detection precision by 1‒5 percentage points. This improvement is primarily due to the integration of information from both views, which compensates for occlusion effects. When detecting cars (Table 1), the physical shapes of cars in the two different views are relatively regular, making their features easier to extract. After fusing the object detection results from the two views, precision under the three occlusion levels improves to varying degrees. Compared with STD, a method with relatively strong detection performance, the precision is improved by 0.52 percentage points under the easy level, 2.04 percentage points under the moderate level, and 1.25 percentage points under the hard level. These performance indicators demonstrate significant improvement, particularly in cases of occlusion. Using the object detection method proposed in this paper, average AP values achieved are 81.37% for cars, 49.34% for pedestrians, and 67.97% for cyclists. In ablation experiments (Table 5), compared with the original single-view object detections for BEV and RV, the average precision (AP) for cars increases by 4.70 and 6.16 percentage points, respectively. For pedestrians, AP increases by 3.44 and 2.73 percentage points, and for cyclists, by 4.06 and 3.63 percentage points. Overall, the mean average precision (mAP) improves by 4.07 and 4.18 percentage points for BEV and RV, respectively. In addition, visualization results demonstrate that the proposed method effectively reduces false detections (Fig. 7) and missed detections (Fig. 8).ConclusionsTo address missed and false detections in single-view lidar point cloud projection methods, we propose a multi-view fusion object detection method. The point clouds are projected into BEV and RV views and encoded into three-channel images. The ECA module is integrated into Complex-YOLOv4 and YOLOv5s networks, which are used as detection models for BEV and RV, respectively, to generate preliminary results. These results are then fused using weighted D-S evidence theory to produce the final detection outputs. Compared to single-view methods, the mAP is improved by 4.07 and 4.18 percentage points for BEV and RV, respectively. By reducing 3D point clouds to 2D images, our method significantly reduces computational complexity. It also combines information from multiple views to overcome challenges such as occlusion and feature extraction limitations. Future research will focus on balancing precision and recall in point cloud object detection, refine objective functions, and further enhance detection performance.
May. 16, 2025Vol. 45 Issue 12 1228006 (2025)
Yichen Pan, Zhengyuan Xiao, Jiageng Chen, and Zuyuan He
ObjectiveCoherent Doppler wind lidar (CDWL) has become an essential tool for wind velocity measurement in various fields, including wind resource assessment, aviation safety, and meteorological research. In applications like turbulence monitoring and aircraft wake vortex detection, where fine-scale wind field analysis is crucial, enhanced range resolution and improved velocity measurement precision are required. Traditional pulsed CDWL systems employ short pulses to achieve high-range resolution. However, shorter pulses compromise frequency resolution, leading to a decline in wind velocity measurement precision. Phase-coded modulation schemes offer a potential solution by decoupling range and frequency resolutions. However, in these schemes, the pulse width is typically constrained by spread spectrum crosstalk if the modulation format is not appropriately selected. To overcome these limitations, we propose a novel long-pulsed CDWL system based on minimum shift keying (MSK) modulation. Due to the effective crosstalk suppression of MSK signals, the advantages of a longer coding sequence are fully utilized. Consequently, the range resolution is determined by the chip duration, while the extended pulse duration ensures high-frequency resolution and signal-to-noise ratio, contributing to precise wind velocity measurement.MethodsWe employ an all-fiber coherent receiving architecture. The signal beam is frequency-shifted and gated by an acousto-optic modulator (AOM) and subsequently encoded by an I/Q electro-optic modulator for MSK modulation. The amplified probe pulse is transmitted into the atmosphere via an optical antenna. The Mie backscattering from aerosols is received by the same antenna and then coherently detected. Through digital signal processing, the radial wind velocity at various ranges is finally retrieved from the Doppler frequency shift. Phase or frequency coding modulation leads to spectral spreading. Therefore, in the decoding process, the scattered signal is despread when multiplied by a decoding sequence with different time delays. Based on this architecture, theoretical analysis, simulations, and experiments are conducted. The crosstalk suppression performance of MSK modulation is first explained through theoretical evaluation. Subsequent simulations are conducted based on available experimental conditions, comparing the MSK scheme with non-coded and classical binary phase shift keying (BPSK) schemes. The clearer spectral peaks and higher precision in wind velocity estimation further demonstrate the low crosstalk characteristic of MSK-modulated signals. In the experiments, a comparative measurement is conducted between a 63-bit MSK-coded pulse and a non-coded pulse with a duration of 300 ns to validate the effectiveness of the MSK coding scheme. Additionally, the MSK scheme is compared with the BPSK scheme under the same conditions to prove the superior performance of the MSK scheme.Results and DiscussionsThe simulation results demonstrate that the MSK-modulated pulse offers better frequency estimation performance than the other two pulses due to its effective crosstalk suppression (Fig. 4). To evaluate the precision and accuracy of wind velocity estimation, the standard deviation (SD) and root mean square error (RMSE) are calculated for different modulation schemes. As a result, the MSK-modulated scheme not only has an advantage in range resolution over the 300 ns non-coded pulse, but also achieves higher wind velocity estimation precision, accuracy, and a longer reliable detection range compared with both the non-coded pulse and the BPSK modulation (Fig. 5). In the experimental measurements, the superiority of MSK modulation is further demonstrated. Compared to the BPSK-modulated pulse, the MSK-modulated pulse provides more stable wind velocity estimates in regions with significant velocity variation, which results in smaller velocity SD across multiple measurements (Fig. 8). Especially, 3 m range resolution and 0.20 m/s wind velocity precision within a 450 m detection range are achieved in the MSK modulation scheme, using a pulse peak power of only 20 W. Despite the promising results, there is still room for improvement in the current system. The reflection of the optical antenna directly causes a detection blind zone because of the deployment of a monostatic transceiver configuration. Therefore, in applications where the blind zone needs to be minimized, a bistatic system with separate antennas for transmission and reception should be considered. Furthermore, future work will aim to optimize the telescope diameter and receiver efficiency to extend the detection range.ConclusionsWe introduce a novel MSK-modulated CDWL system that effectively resolves the trade-off between range and frequency resolutions of pulsed CDWL. Due to its crosstalk suppression performance, a longer pulse duration can be applied to wind velocity measurements. Therefore, the signal-to-noise ratio gain provided by the long-coded pulse reduces the reliance on high peak power in pulsed CDWL systems. Both simulation and experimental results consistently show that the MSK scheme, with its superior crosstalk suppression, outperforms BPSK in terms of wind velocity measurement precision and detection range under the same conditions. Moreover, thanks to its phase continuity, the proposed scheme requires a lower bandwidth, which allows simplification of the CDWL system architecture. Given an optimized peak power and optical antenna telescope size, MSK modulation can fully exploit its potential at extended detection ranges, offering a promising approach to enhancing range resolution and velocity measurement precision in pulsed CDWL systems.
Jun. 13, 2025Vol. 45 Issue 12 1228007 (2025)
Qingting Zhu, Bin Yang, Lingbing Bu, Zengchang Fan, and Haiyang Cai
ObjectiveAs one of the most important components of the atmosphere, ozone is typically categorized into stratospheric and tropospheric ozone. Tropospheric ozone accounts for only 10% of the total ozone content, but its pollution is a significant threat to human health. In 2020, the institute for health metrics and evaluation (IHME) identified environmental ozone as a level 3 risk to human health, linking it to chronic obstructive pulmonary disease (COPD) and premature death. Ozone is not only influenced by its photochemical precursors but also by meteorological factors, pollution transport, and stratospheric ozone. Since the 1970s, differential absorption lidar (DIAL) technology has been widely used for remote sensing of tropospheric ozone concentrations with high spatial and temporal resolution. Early DIAL systems mostly use complex dye lasers, require frequent maintenance, and have poor frequency stability and short lifespans. Nowadays, many ozone lidar systems employ fixed-frequency laser sources such as gas-stimulated Raman lasers. However, the large size and poor thermal conductivity of these devices limit their flexible application in high repetition frequency pumping lasers. To reduce instability caused by tunable light sources and miniaturize the system, an all-solid-state tunable Raman laser is used as the emission source, resulting in a compact ozone DIAL system suitable for multi-platform observation.MethodsThis ozone lidar system uses a 532 nm solid-state laser with a high repetition rate as the pump source. It generates a Raman frequency shift using a SrWO4 Raman crystal, producing a first-order Stokes laser at 560 nm and a second-order Stokes laser at 590 nm. The system then doubles the frequency using a BaB2O4 (BBO) crystal. The 590 nm optical path uses a half-wave plate to adjust the polarization, producing a dual violet output at 280 nm and 295 nm. Two high-damage dichroic mirrors are used to separate visible and ultraviolet light. Both ultraviolet beams have a divergence angle of less than 0.35 mrad, as confirmed through testing. As shown in Fig. 1(a), optical components such as the Raman and frequency-doubling crystals are tightly mounted on the optical platform, ensuring the compactness and stability of the optical path. The Cassegrain-type receiving telescope system is compact in both size and structure, with an aperture of about 150 mm, further reducing the overall size of the lidar system. To validate the accuracy of the DIAL’s vertical detection data, validation experiments are carried out.Results and DiscussionsA thermo fisher model 49i ozone analyzer is installed at a horizontal distance of about 800 m from the lidar, with the lidar mounted on the pylon at an approximate horizontal angle towards the ozone analyzer. The data from both the lidar and the ozone analyzer are processed to calculate the average ozone concentration per hour, excluding data from precipitation and instrument maintenance periods. The inversion results for the lidar’s detection at about 800 m are compared with those of the ozone analyzer. As shown in Fig. 3, the lidar and ozone analyzer data exhibit good consistency over time. The DIAL measurements are about 11 μg/m3 lower than those of the ozone analyzer. This deviation is primarily due to the height difference of about 100 m between the lidar and the ozone analyzer. In clear weather, as solar radiation increases in the morning, ozone generation on the ground is enhanced, and the ozone is transported upward. Before the photochemical reaction diminishes, the ground serves as an ozone source, leading to slightly higher ozone concentration at altitudes up to 100 m. The detection data of the two devices are linearly fitted, and the correlation coefficient reaches 0.888. Then, a sounding balloon is launched at the meteorological bureau of Baoshan District, Shanghai, and its data are compared with those from the lidar at the same location and time. The experiment includes four time nodes: 8:00 AM, 1:00 PM, 6:00 PM, and midnight. Fig. 7 shows the ozone concentration profile from near the ground to an altitude of 3 km as detected by both the lidar and the sounding balloon. The results demonstrate that the mean deviation of ozone concentration within 3 km is less than 7.9 μg/m3, with a correlation coefficient of 0.857. This confirms the reliability of vertical detection of DIAL.ConclusionsDuring the Spring Festival period, the ozone concentration is higher than that during non-festival time due to the effects of fireworks and firecrackers. In addition to local photochemical generation, external transport from western regions significantly affects the diurnal variation of ozone. An airborne vehicle lidar experiment conducted in Zhejiang Province shows that high ozone values are concentrated near 600 m. The source of the high ozone concentrations is traced. Throughout the observation period, the ozone lidar system, equipped with a solid Raman light source, operates reliably, providing accurate monitoring data that capture fluctuations in environmental ozone levels and identify ozone concentration hotspots. This system offers a new technical means for the detection of spatial and temporal distribution of regional atmospheric ozone.
May. 16, 2025Vol. 45 Issue 12 1228008 (2025)
Yanfeng Li, Han Wang, Yueran Sun, and Wenzhe Dong
ObjectiveAerosols are one of the important parameters affecting the atmospheric radiation balance. They have a wide range of sources and a relatively short life cycle in the atmosphere, exhibiting significant spatiotemporal variability, which makes it particularly difficult to accurately quantify aerosol information in the atmosphere. Traditional multispectral satellite detection signals only provide single-intensity radiation information. This signal is more sensitive to surface information and contains weaker aerosol information, which leads to limitations in the types and accuracy of aerosol parameters that can be retrieved. Compared to hyperspectral remote sensing methods, which increase the number of bands, multi-angle and polarization play an important role in improving aerosol retrieval due to their unique advantages. Multi-angle polarization sensors combine angle and polarization parameters, enabling more accurate retrieval of atmospheric and surface parameters. Given the significant advantages of multi-angle polarization data, observation angles, and polarization are crucial parameters in aerosol retrieval, which makes it particularly important to analyze their effect on aerosol retrieval. We use visible-near infrared band satellite observation data simulated based on polarization simulation technology and the official generalized retrieval of aerosol and surface properties (GRASP) program module to study the aerosol optical thickness retrieval of the simulated data. By comparing and analyzing the retrieval results under different numbers of observation angles and polarization band states, we conduct an in-depth study of the impact of observation angle numbers and polarization channel settings on aerosol optical thickness retrieval, aiming to provide references for the parameter design of multi-angle polarization sensors.MethodsFirst, polarization simulation technology is used to model the radiation transfer process of sunlight, which addresses the lack of angle and polarization observation data. A simulated dataset is established based on surface and atmospheric parameter characteristics provided by moderate-resolution imaging spectroradiometer (MODIS), hyper-angular rainbow polarimeter #2 (HARP2), polarization and directionality of the earth’s reflectances-3 (POLDER3), and GRASP. The bidirectional surface reflectance distribution function model, Ross-Li, and the bidirectional surface polarized reflectance distribution function model, Maignan, are used to simulate the surface contribution during the radiation transfer process. The aerosol model is simulated using a bimodal normal particle size distribution method, while the atmospheric contribution during the radiation transfer process is modeled using the second simulation of the satellite signal in the solar spectrum code (6SV) model. Finally, considering land-atmosphere coupling effects and satellite observation errors, the intensity and polarization of satellite observation data are simulated under more realistic conditions. The official GRASP inversion algorithm is then applied, using the multi-pixel inversion module for aerosol inversion research. Based on the inversion results, we evaluate the observation angle and polarization dependencies in aerosol remote sensing.Results and DiscussionsBy analyzing the inversion accuracy with different numbers of polarization channels, we find that as the number of channels increases, the Pearson correlation coefficient (R) rises from 0.835 for non-polarized channels to 0.876 for fully polarized channels. The root mean square error (RMSE) and mean absolute error (MAE) decrease from 0.124 and 0.098, respectively, to 0.076 and 0.059. The proportion of points within the expected error (EE) range increases from 69% to 91% (Fig. 3). These results indicate that increasing the number of polarization channels significantly enhances aerosol inversion accuracy. However, the overall trend of inversion accuracy improvement becomes more gradual, which reveals that there is an upper limit to the enhancement effect of polarization. For specific polarization combinations, the higher sensitivity of shorter wavelengths to aerosols means that better inversion results are mainly concentrated in combinations with shorter wavelengths. In contrast, for longer wavelength combinations such as “565 nm, 670 nm” (Fig. 5); “490, 565, 670 nm” (Fig. 6); “490, 565, 670, 865 nm” (Fig. 7); and “490, 565, 670, 865, 1020 nm” (Fig. 8), a significant decrease in inversion accuracy is observed. By analyzing the aerosol optical depth (AOD) scatter verification results under different observation modes, we hold that as the number of observation angles increases from 1 to 14, the R rises from 0.378 to 0.872, RMSE decreases from 0.234 to 0.095, and MAE drops from 0.194 to 0.075. The proportion of points within the expected error range increases from 28.46% to 82.9% (Fig. 9). These results demonstrate that the aerosol inversion capability of a multi-angle polarization payload improves significantly with an increasing number of observation angles. However, as the number of observation angles increases, the improvement in the inversion effect becomes less pronounced (Fig. 10). This is because, while the increase in the number of angles significantly enhances the information volume, the effective observation volume gradually saturates, and new errors are introduced. As a result, the aerosol inversion accuracy tends to stabilize as the number of observation angles increases, and in some cases, the inversion accuracy may even decrease despite the addition of more angles.ConclusionsWe employ simulated multi-angle and multi-spectral intensity and polarization data to retrieve AOD using the GRASP inversion algorithm under varying numbers of observation angles and polarization bands. The retrieved AOD is compared with the true AOD to assess consistency. Evaluation metrics, including the R, RMSE, MAE, and expected error, are used to analyze the dependence of multi-angle polarization aerosol inversion on the number of observation angles and polarization bands. The results indicate that the aerosol inversion capability improves with an increasing number of polarization channels, but the trend of accuracy enhancement becomes more gradual, which suggests an upper limit to the improvement from additional polarization channels. Additionally, due to the higher sensitivity of shorter wavelengths to aerosols, inversion results are more accurate when polarization channels are set at shorter wavelengths rather than longer ones. Furthermore, as the number of observation angles increases, the consistency between the retrieved AOD and the true AOD improves significantly, which reveals the enhanced aerosol inversion capability of multi-angle polarization payloads. However, as the number of observation angles continues to increase, the effective observation information saturates, and new errors are introduced, which causes the improvement in inversion accuracy to plateau.
Jun. 25, 2025Vol. 45 Issue 12 1228009 (2025)
Yang Zhao, Jiankang Zhou, Qiao Pan, and Weimin Shen
ObjectiveTo meet the low polarization sensitivity requirements of space-borne multi-channel imaging spectrometers for atmospheric environment detection, and to overcome the shortcomings of traditional wedge crystal depolarizers which degrade instrument imaging quality, we design a multi-channel depolarizer based on the elasto-optical effect without causing image quality loss. The depolarizer overcomes the limitations of new liquid crystal and metasurface depolarizers such as narrow band range, low transmittance, and complex preparation. Based on existing research on photoelastic modulators, the complete theoretical analysis formula is derived for missile optical depolarizers, along with an examination of the influencing factors on the depolarizing effect and the optimal depolarizing conditions. To meet the multi-channel detection requirements of atmospheric environment detection imaging spectrometers, we propose a multi-channel depolarization method. This method uses the driving term to compensate for the delayed dispersion, which addresses the inherent wavelength dependence of the time-type photoelastic depolarizer and ensures that the residual polarization of each channel of the atmospheric detection imaging spectrometer is less than 2%.MethodsIn this paper, the complete theoretical calculation formula for the photoelastic depolarizer is derived from the Mueller matrix and the Stokes vector. The degree of polarization is analyzed with respect to key factors, such as the frequency of the photoelastic modulator, the peak delay, the polarization angle of the incident light, the integration time, and the angle between the optical axes of the two photoelastic modulators. The peak delay of the photoelastic modulator is 2.405 rad when the optimal depolarization is achieved. A method for compensating the delayed dispersion of the photoelastic modulator using the driving term is proposed, based on the relationship between the depolarization spectrum width, central wavelength, and residual polarization degree. This method can effectively overcome the inherent wavelength dependence of the photoelastic modulator, thereby enabling multi-channel simultaneous and efficient depolarization of the spaceborne atmospheric detection imaging spectrometer, which lays a theoretical foundation for improving the accuracy of atmospheric parameter inversion.Results and DiscussionsA single photoelastic modulator cannot effectively depolarize linearly polarized light in all directions. The dual photoelastic modulator structure can achieve omnidirectional depolarization, but the optical axes of the two modulators need to be placed at 45° to avoid the phenomenon where the residual degree of polarization oscillates with the integration time (Fig. 6). Theoretical calculations show that the best depolarization effect can be achieved under multiple peak delays. Selecting the first peak delay of 2.405 rad can minimize the peak-to-peak value of the driving voltage and reduce the difficulty of circuit design (Fig. 3). The peak delay of the photoelastic modulator is greatly affected by the driving circuit. Under the existing circuit stability conditions, a delay deviation of 0.01 rad will lead to a 0.5% decrease in depolarization (Table 2). The influence of incident light polarization angle and integration time is relatively small and easy to control. In this paper, the relationship is established between the depolarization spectrum width, center wavelength, and residual polarization degree. In addition, based on the establishment of this relationship, a method using the driving term to compensate for the delayed dispersion of the photoelastic modulator is proposed to achieve multi-channel depolarization of the photoelastic depolarizer. However, the maximum depolarization degree that each channel can achieve is limited by the channel bandwidth (Fig. 8). Therefore, it is necessary to divide channels with wide bandwidths into two or more segments for depolarization. Finally, we design a photoelastic depolarizer, which allows each channel of the four-channel imaging spectrometer to achieve a depolarization degree of more than 98% under the adjustment of the peak-to-peak value of the five driving voltages (Tables 3 and 4).ConclusionsTo solve the inherent limitations of traditional wedge crystal depolarizers and time-type depolarizers, we propose a method for realizing multi-channel depolarization by extending the theoretical formula for missile optical depolarizers and analyzing the influence of key parameters. The dual-elastic-optic modulator structure can effectively realize the depolarization of omnidirectional linearly polarized light, and selecting the first peak delay can reduce the difficulty of designing the driving circuit. A multi-channel depolarization technique is also proposed, which uses the driving term to compensate for delayed dispersion. By adjusting the five peak-to-peak voltage values to drive the photoelastic depolarizer, the depolarization degree of each channel in the four-channel spaceborne atmospheric detection imaging spectrometer can exceed 98%. The depolarizer offers advantages such as minimal image quality loss and autonomous switching between application channels, which makes it highly promising for future applications. Before practical implementation, however, it is necessary to consider the influence of environmental factors, calibration and installation errors, and driving circuit stability on the depolarizer’s performance, to enable the engineering application of the photoelastic depolarizer in spaceborne imaging spectrometers.
Jun. 18, 2025Vol. 45 Issue 12 1228010 (2025)
Chenyu Yang, Xiao Liu, Honglian Huang, Zhuoyi Chen, Rufang Ti, and Xiaobing Sun
ObjectiveAerosols play a critical role in the Earth’s climate system and hydrological cycle. They not only alter the Earth’s energy balance by directly absorbing or scattering solar radiation but also profoundly influence climate and hydrological processes by indirectly affecting the physical and optical properties of clouds. For instance, aerosols such as carbon particles can enhance scattering effects or act as cloud condensation nuclei, promoting the formation of cloud droplets. Furthermore, aerosols have significant impacts on regional visibility, air quality, and human health. Despite growing attention to the environmental and climatic effects of aerosols, their complex chemical composition, short lifetimes, and highly uneven spatial distribution make it challenging to accurately characterize their global distribution and dynamic changes, remaining one of the critical difficulties in current research. The particulate observing scanning polarimeter (POSP), onboard the GF-5 satellite launched on September 7th, 2021, adopts a cross-track scanning approach and collects polarized radiometric data across nine spectral bands ranging from ultraviolet to shortwave infrared. Equipped with onboard polarization calibration and solar diffuse reflectance calibration functionalities, POSP offers multi-spectral channels with high polarization accuracy, making it particularly suitable for achieving precise aerosol retrievals. While many studies have explored aerosol optical depth (AOD) retrieval using machine learning methods, there is currently no aerosol retrieval algorithm for POSP data that operates without prior knowledge of surface types and atmospheric states. Therefore, this study focuses on developing a neural network-based aerosol retrieval method for POSP data, with case studies in representative regions of China, such as the Beijing-Tianjin-Hebei region and Taiwan region, underscoring its significance for advancing aerosol remote sensing.MethodsThe proposed algorithm enables the independent retrieval of AOD over land without requiring prior knowledge of surface types or atmospheric conditions. The model utilizes apparent reflectance and apparent polarized reflectance from seven spectral bands as training inputs. Training data is generated using the unified linearized vector radiative transfer model (UNL-VRTM) and further supplemented by constructing a truth-based training dataset through spatiotemporal matching between POSP observations and aerosol robotic network (AERONET) ground-based AOD measurements, as well as between POSP observations and moderate-resolution imaging spectroradiometer (MODIS) AOD products. After neural network parameter optimization, the model is capable of real-time AOD retrieval without the need for additional radiative transfer computations.Result and Discussions To evaluate aerosol retrieval accuracy in typical regions of China, four observation sites—Beijing, Baotou, Taiwan, and Hong Kong—are selected for validation [Figs. 5(a)?(d)]. At the Beijing site, Bias, correlation coefficient (Corr), and root-mean-square error (RMSE) are -0.01, 0.94, and 0.06, respectively, demonstrating the algorithm’s excellent performance in urban environments, accurately capturing aerosol optical properties. At Baotou, the correlation is lower (Corr is 0.56) due to high surface reflectance variability and complex aerosol characteristics in arid regions, while RMSE remains low (0.07). Taiwan and Hong Kong showed moderate to strong applicability in island and coastal regions, with correlations of 0.64 and 0.72, and RMSEs of 0.05. Validation using eastern China data (Table 5) further assessed POSP AOD’s applicability in complex environments, highlighting its advantages in diverse conditions. On June 10th, 2024, the Beijing-Tianjin-Hebei region’s AOD retrieval (Fig. 6) shows consistent spatial trends between POSP AOD [Fig. 6(a)] and MODIS AOD [Fig. 6(b)], with higher values in the south and lower values in the north due to limited pollution sources in higher-altitude, vegetated regions. Scatterplot analysis [Fig. 6(c)] shows high agreement (Corr is 0.93, Bias is 0.03, RMSE is 0.11). Similarly, for Hefei on January 12th, 2024 (Fig. 7), POSP exhibits a high correlation (Corr is 0.95, Bias is 0.04, RMSE is 0.07) and superior detail in high AOD regions due to higher spatial resolution and polarization data. For Taiwan on February 14th, 2024 (Fig. 8), POSP and MODIS AOD shows strong consistency (Corr is 0.90, Bias is 0.01, RMSE is 0.06), with lower AOD in the east due to mountainous terrain, vegetation, and monsoon-driven aerosol dispersion.ConclusionsWe propose a neural network-based AOD retrieval method using the multi-spectral and polarization observation data from the POSP sensor. By taking multi-band apparent reflectance and polarized reflectance as inputs, the method achieves high-precision AOD retrieval without relying on prior surface or atmospheric information. Training data are generated using the UNL-VRTM, supplemented with true-value data from joint modeling of satellite and ground-based observations. Optimized neural network parameters enhance the algorithm’s robustness and applicability. Validations in the Beijing-Tianjin-Hebei industrial region, Hefei agricultural region, and Taiwan island region demonstrate the method’s performance. Against AERONET data, POSP achieves Corr of 0.94 and RMSE of 0.06 in Beijing, capturing complex urban aerosol characteristics. In Baotou, despite surface variability, it achieves an RMSE of 0.07, with moderate Corrs in Taiwan (0.64) and Hong Kong (0.72), verifying its adaptability to diverse environments. Overall, Corr with AERONET is 0.90, with RMSE of 0.06. Compared to MODIS, POSP demonstrates better spatial resolution and detail in high-AOD regions, particularly in industrial, agricultural, and coastal regions. This method effectively mitigates surface reflectance variability impacts, showing broad applicability and accuracy in complex environments. Future work will expand the algorithm globally, leveraging multi-source data to enhance retrieval accuracy, supporting large-scale aerosol monitoring and operational applications.
Jun. 24, 2025Vol. 45 Issue 12 1228011 (2025)
Qinshun Luo, and Zhongfeng Qiu
ObjectiveSecchi disk depth (SDD) reflects the turbidity and transparency of seawater and serves as an intuitive indicator of water quality. As a key parameter in marine ecological environment monitoring, it is closely related to the physicochemical properties of seawater, fishery production, and issues such as water eutrophication. It also plays a significant role in the study of the optical characteristics of water bodies. While traditional in-situ measurement methods can indeed provide accurate information on transparency, these methods are resource-intensive and labor-consuming, which makes it difficult to meet the demands of dynamic spatiotemporal monitoring of transparency. With the advancement of satellite remote sensing technology, satellite imagery enables the acquisition of water transparency data on a much larger spatial and temporal scale. An increasing number of ocean color sensors with varying radiation accuracies are also being used to estimate transparency. Transparency is influenced by environmental conditions and shows complex spatiotemporal variations. Currently, inversion models for transparency are highly regional and local in nature. Traditional remote sensing inversion methods have mostly been based on spectral data. The spectra themselves are influenced by many factors, such as satellite sensor band settings, bandwidth, and signal-to-noise ratio. The consistency of transparency inversion methods between different satellites requires further validation. Currently, there is no universal transparency inversion model applicable to different multispectral satellites, which makes achieving consistency and comparability in transparency estimates from different satellites challenging. Water chromatic parameters are closely related to water body scattering, the aquatic environment, and water color components. They contain rich environmental information that can also be used for transparency inversion. Unlike spectral-based transparency remote sensing inversion methods, the advantage of using chromatic parameters for transparency inversion is that they are less affected by spectral influences, which makes them more suitable for water transparency inversion. With the development of remote sensing technology, the acquisition of ocean color satellite data has continuously increased, and data processing algorithms have advanced. Machine learning techniques have been widely applied in the inversion of water quality parameters. In this study, we construct the coefficient matrix for Aqua-MODIS, S3A-OLCI, S3B-OLCI, and NOAA-20-VIIRS ocean color satellites based on in-situ data from the Bohai Sea. Using the CatBoost machine learning algorithm, we develop a transparency inversion model for the Bohai Sea, aiming to obtain consistent and comparable transparency inversion results from multiple satellite sources.MethodsBased on in-situ spectral and transparency cruise data from the Bohai Sea, we use chromatic parameters as key variables and apply the CatBoost machine learning algorithm to develop the transparency inversion model for the Bohai Sea. The model’s accuracy is validated using the leave-one-out cross-validation method. Using hyperspectral remote sensing reflectance (Rrs) collected during the cruise, we simulate spectral bands Rrs for Aqua-MODIS, S3A-OLCI, S3B-OLCI, and NOAA-20-VIIRS ocean color satellites. A coefficient matrix between the central wavelengths of the four satellites and the XYZ tristimulus values is constructed to calculate the chromatic parameters for each satellite. We analyze the precision and consistency of the chromatic parameter inversion results and transparency inversion results for different satellites. Using S3A data, we study the spatiotemporal variation characteristics of transparency in the Bohai Sea for the four seasons, along with the annual average temporal variation of transparency in the Bohai Sea from 2019 to 2024.Results and DiscussionsWe use Aqua-MODIS, S3A-OLCI, S3B-OLCI, and NOAA-20-VIIRS Rrs to calculate the chromatic parameter information. The constructed transparency inversion model for the Bohai Sea is then applied to obtain the transparency estimation results for the four satellites. The accuracy and consistency of the chromatic parameter inversion results and transparency inversion results for different satellites are analyzed. The hue angle and saturation inversion results from the four satellites are as follows: R2>0.97, MAPE<3%, compared to in-situ measurements (Figs. 4 and 5). The results indicate that the chromatic parameter inversion method used in this study demonstrates excellent consistency for multispectral satellites with different central wavelengths and bandwidths. The accuracy of the transparency inversion model developed in this study is as follows: for model training, the R2 is 0.97, the Pearson correlation coefficient is 0.98, the RMSE is 0.24 m, and the MAPE is 14.3% (Fig. 6); for model validation, the R2 is 0.87, the Pearson correlation coefficient is 0.93, the RMSE is 0.48 m, and the MAPE is 25.6%, which indicates high validation accuracy (Fig. 6). The model demonstrates high accuracy for transparency inversion in the Bohai Sea. For the transparency inversion models of the Bohai Sea developed by other researchers, the same in-situ data used in this study are applied. After calibrating the model parameters, the leave-one-out cross-validation method is performed for inversion accuracy verification. The comparison between the accuracy of other inversion models and the accuracy of the inversion model in this study shows that the Bohai Sea transparency inversion model in this study demonstrates higher accuracy (Fig. 7, Table 3). The consistency analysis of transparency inversion results from different satellite sensors is as follows. In terms of inversion accuracy for the four satellites, the average RMSE values are 0.47, 0.30, 0.30, and 0.51 m, the average MAPE values are 17.73%, 14.23%, 14.25%, and 19.63%, and the average Pearson correlation coefficients are 0.94, 0.98, 0.98, and 0.93, respectively. Regarding the transparency inversion results among different satellites, the max RMSE is 0.31 m, the max MAPE is 7.3%, and the Pearson correlation coefficients are all above 0.97 (Fig. 8). The chromatic parameter inversion model and transparency inversion model for the Bohai Sea developed in this study effectively solve the limitations of single-satellite sensor inversion models in satellite spectral bands. From 2019 to 2024, in terms of time, the highest average transparency of the Bohai Sea occurred in summer, approximately 3 m, while the lowest occurred in winter, around 1.5 m. Spatially, the transparency near Qinhuangdao is higher than that in other regions. Near the coast, the transparency is lower, and further offshore, the transparency is higher (Figs. 9 and 10).ConclusionsWe utilize chromatic parameters and the CatBoost machine learning algorithm to establish the transparency inversion model in the Bohai Sea. The spectral band simulation method and the chromatic parameter coefficient matrix for the four multispectral satellite sensors—Aqua-MODIS, S3A-OLCI, S3B-OLCI, and NOAA-20-VIIRS—are used to obtain long-term transparency information of the Bohai Sea. The inversion results for hue angle and saturation from the four satellites, compared with in-situ measurements, show that R2 values are greater than 0.97 and MAPE values are lower than 3%. This demonstrates that the chromatic parameter inversion method used in this study exhibits excellent consistency for multispectral satellites with different central wavelengths and bandwidths. The transparency inversion model in this study shows the following validation results: model training shows R2 of 0.97, RMSE of 0.24 m, MAPE of 14.3%, and the Pearson correlation coefficient of 0.98; model validation shows R2 of 0.87, RMSE of 0.48 m, MAPE of 25.6%, and the Pearson correlation coefficient of 0.93, indicating high accuracy (Fig. 6). The transparency inversion results for the Bohai Sea from the four satellites, compared with in-situ measurements, show that the average RMSE for all satellites is below 0.6 m, the average MAPE is below 20%, and the average Pearson correlation coefficient is above 0.9. This indicates that the model developed in this study provides high accuracy and strong consistency for transparency inversion across different multispectral satellites. The multi-source satellite transparency inversion model for the Bohai Sea based on chromatic parameters holds significant value and necessity. As parameters reflect the color characteristics of water bodies, chromatic parameters are not constrained by the satellite’s central wavelength. Additionally, high-resolution imaging equipment can also capture chromatic parameters, which highlights the practical application value of the model developed in this study. Future research will explore inversion algorithms for other water quality parameters, aiming to obtain the water quality parameters using water chromatic parameters and apply them in water quality monitoring.
Jun. 24, 2025Vol. 45 Issue 12 1228012 (2025)
Zhiyuan Zhang, Hongyao Chen, Wenxin Huang, Xiaolong Si, Shiwei Bao, and Xiaobing Zheng
ObjectiveIn the solar reflective band, the on-board calibration method based on solar diffuser (SD) allows for full-aperture, full-field-of-view, end-to-end absolute radiometric calibration of optical remote sensors. The bidirectional reflectance distribution function (BRDF) of the SD is a key parameter that can affect on-board calibration accuracy. The SD is typically made from fired polytetrafluoroethylene (PTFE), a material that suffers from non-Lambertian reflective properties, non-specular peaks for in-plane reflections, and susceptibility to contamination and degradation. These characteristics can affect the accuracy of on-board calibration. In the present study, we present the measurement results from the BRDF absolute measurement facility for the SD used in on-board calibration. The measurement angles ranged from 0° to 75° for the incident zenith angle, 15° to 75° for the reflected zenith angle, and 60° to 360° for the azimuthal difference. The results show that the relative difference in the SD BRDF at different reflection angles can exceed 350% at a 75° incidence angle. We then analyze the influence of the SD BRDF characteristics on on-board calibration in terms of the measurement accuracy of the SD BRDF, the calculation of the SD attenuation factor, and the placement error of the SD. The analysis shows that the SD BRDF characteristics can affect on-board calibration accuracy by more than 1% if the geometric relationship between the incident and reflected vectors in the on-board calibration is not properly set. Finally, based on the analysis and measurement results, we propose suitable angular geometric relations for on-board calibration that can effectively reduce the relative change in the BRDF across the field of view of the remote sensor during on-board calibration. These angular geometric relations can serve as a reference for the design of future on-board calibrators.MethodsIn this paper, we measure the BRDF (with angles ranging from 0° to 75° for the incident zenith angle, 15° to 75° for the reflected zenith angle, and 60° to 360° for the azimuthal difference) of the SD for on-board calibration. Additionally, we measure the BRDF of the SD under various geometrical conditions after 100 h of irradiation, using the same batch of SD samples, with a high-accuracy absolute BRDF measurement facility. Based on these measurements, the effect of the SD BRDF characteristics on the accuracy of on-board calibration is analyzed. The factors influenced by the SD BRDF characteristics include the measurement uncertainty of the SD BRDF, the degradation of the SD, and the variation of the SD BRDF due to placement errors. Finally, the combined effect of these three factors on the accuracy of on-board calibration is analyzed using the example of a remote sensor with an SD stability monitor.Results and DiscussionsAccording to the SD BRDF measurement, Fig. 6 shows that the SD for the on-board calibration is not an ideal Lambertian surface. When the geometric relationship between the incident and reflected zenith angles is 75° and the azimuth difference is 180°, the SD BRDF is close to 1. This is determined by the nature of the uniformly rough surface. Figure 8 shows the relationship between the SD BRDF and the incident zenith angle, as well as the reflected azimuth angle at large reflected zenith angles. It can be seen that when the azimuth angle between the incident and reflected vectors is small, the SD BRDF hardly changes with the incident zenith angle. However, as the azimuth angle increases, the BRDF increases rapidly with the increase in the incident zenith angle. According to the degradation of the SD BRDF measurement, Fig. 10 shows that the degradation of the SD BRDF does not remain constant. Instead, it is related to the incident and reflected angles. For a small incident angle, the degradation of the SD BRDF at 400 nm does not vary much with the reflected angle and is better than 0.8%. When the incident zenith angle increases to 65° and 75°, the relative changes in SD BRDF degradation are 2% and 2.9% respectively. The results of the analysis of the three factors affecting the on-board calibration accuracy are shown in Table 5. Table 5 demonstrates that if the angles for the on-board calibrator are set unreasonably, the accuracy of the on-board calibration will be reduced by 1.1%.ConclusionsAn SD for the on-board calibration is not an ideal Lambertian surface and in some cases, particularly at large incident zenith angles, the BRDF characteristics of the SD deviate significantly from those of an ideal Lambertian surface. At an incident zenith angle of 75°, the proportion of the first reflections is increased, leading to a significant increase in the BRDF in the specular direction, reaching approximately 310% of the BRDF of an ideal Lambertian surface. Furthermore, the BRDF measurement results of the SD after the 100 h irradiation and the same batch of samples of this SD demonstrate that the degradation of the SD BRDF is not isotropic. When the incident zenith angle is 75°, the relative variation of the BRDF degradation for each reflected angle is close to 3%. When the on-board calibration angle is not reasonably designed, the above two characteristics will affect the accuracy of the on-board calibration of remote sensors. The analysis demonstrates that if the angles for the on-board calibrator are set unreasonably, the accuracy of the on-board calibration will be reduced by 1.1%. Based on the measurement and analysis results in this paper, a range of reflected angles suitable for the on-board calibration is given when the incident zenith angle is both 50° and 55°. Within this specified angle range, the relative change of the SD BRDF in the field of view of the remote sensor during the on-board calibration process is minimal. In this case, it is possible to reduce the influence of the SD BRDF characteristics on the on-board calibration.
Jun. 25, 2025Vol. 45 Issue 12 1228013 (2025)
Yuhe Zhang, Jing Zhang, Xinfang Yuan, Xiaohui Li, Jiajia Zhu, Lin Mi, Binbin Chen, Guang Yang, and Shuai Dou
ObjectiveWith the advancement of Earth observation technology, there is an increasingly urgent need to develop remote sensing edge intelligence applications. These applications aim to perform object detection and analysis directly on edge devices such as satellites or drones, thereby conserving transmission bandwidth, processing time, and resource consumption. Deep learning, renowned for its powerful feature extraction capabilities, has been extensively researched and applied in optical remote sensing image object detection. However, the continuous pursuit of higher detection accuracy has led to deep learning object detection models grappling with issues such as high complexity, a large number of parameters, massive scale, and low algorithmic efficiency. Due to constraints on volume, weight, and power consumption, edge devices often lack large storage and computational resources, limiting the deployment and application of many high-precision deep learning models on them. Therefore, the design of intelligent algorithm models that are faster, more accurate, and more lightweight, has attracted more and more attention in the field of remote sensing. We focus on edge intelligence applications and address the lightweight optimization problem in existing object detection tasks in optical remote sensing images. We pay attention to the detection of diverse object shapes in remote sensing images and propose a deformable convolution-based lightweight model (DCBLM), based on deformable convolution, using YOLOv8n as the baseline model. By employing deformable convolution for feature extraction, optimizing multi-scale feature fusion strategies, and introducing the minimum-point-distance-based intersection over union (MPDIoU) loss function to address shortcomings of the original loss function, the model achieves lightweight optimization while enhancing accuracy. DCBLM reduces the number of model parameters, computational complexity and memory usage, and improves the deployment flexibility of the model in practical applications.MethodsWe propose a lightweight model, DCBLM, based on deformable convolution, using the lightweight network YOLOv8n as the baseline model. The C2f deformable convolution feature extraction (C2f~~DCFE) module enables the network to dynamically adapt to varying shapes, sizes, and positions of objects, achieving efficient feature extraction while reducing the number of parameters. The cross-scale feature fusion module (CFFM) effectively integrates multi-level features, addressing the issue of feature redundancy in the neck network, thereby enhancing the efficiency of feature fusion and significantly decreasing the number of parameters. The improved MPDIoU loss function specifically mitigates the failure of the loss function when the predicted bounding box and the ground truth bounding box share the same aspect ratio, effectively improving the detection accuracy of the model.Results and DiscussionsAs is shown in Table 4, DCBLM outperforms other lightweight detection methods in the selected dataset. Compared to the baseline model YOLOv8n, DCBLM achieves a 0.8-percentage-point improvement in detection accuracy, while reducing number of parameters, computational load, and model size by 39.5%, 22.2%, and 36.5%, respectively. Table 6 illustrates that for drone-based multi-angle livestock detection in grassland environments, DCBLM also excels, with a 0.9-percentage-point increase in detection accuracy and reductions in number of parameters, computational load, and model size by 39.5%, 22.2%, and 36.5%, respectively. These improvements significantly improve the model’s deployment flexibility. This is attributed to the enhanced C2f~~DCFE module, which enables dynamic adaption to varying shapes, sizes, and positions of objects, achieving efficient feature extraction with fewer number of parameters. The CFFM effectively integrates multi-level features, further reducing the number of parameters. Additionally, the MPDIoU loss function enables more accurate object localization, effectively improving detection accuracy. Visualization results in Figs. 6 and 7 demonstrate DCBLM’s superiority over YOLOv8n across different scenarios, validating proposed improvements. Furthermore, inference experiments on an unknown dataset show that DCBLM exhibits lower maximum utilization of graphics processing unit (GPU) than YOLOv8n, indicating that it reduces computational demands, alleviates computational bottlenecks, and enhances inference efficiency. Moreover, DCBLM achieves a mean average precision (mAP) above 60% across all three datasets, with an improvement of over 2 percentage points compared to YOLOv8n. These results highlight that DCBLM offers superior detection accuracy and lightweight performance, with enhanced capabilities for detecting densely distributed small objects and morphologically diverse objects. The model demonstrates excellent applicability for both general and specialized object detection tasks.ConclusionsIn this study, a lightweight model DCBLM based on deformable convolution is proposed. The C2f~~DCFE module enables the optimized backbone network to dynamically adapt to varying shapes, sizes, and positions of objects, acquiring more accurate feature information while reducing the number of parameters. The CFFM enhances the efficiency of feature fusion by uniformly reducing the number of channels in feature maps at different scales, achieving effective integration of multi-level features and further reducing the number of parameters. The MPDIoU loss function specifically addresses the issue of loss function failure when the predicted bounding box and the ground truth bounding box share the same aspect ratio, effectively improving detection accuracy and simplifying computations. Experimental results demonstrate that DCBLM exhibits superior detection accuracy and lightweight performance, showing excellent applicability for both general and specialized object detection tasks. Future work will involve optimization and validation across multiple domains and scenarios based on practical application requirements, aiming to further improve the performance and adaptability of the model.
Jun. 25, 2025Vol. 45 Issue 12 1228014 (2025)
Jun Wu, Chongmiao Jiao, Decang Bi, Fengxin Xin, Fengde Jia, Fengfeng Lin, Yiyang Wang, Yue Zhao, Jiqiao Liu, and Chenyang Li
ObjectiveThe atmospheric wind field is closely related to human activities, and airborne wind lidar is a critical tool for obtaining atmospheric wind field data. During flight, airborne platforms undergo continuous changes in three attitude angles: yaw, roll, and pitch. These variations alter the line-of-sight wind speed values during measurement integration time, leading to measurement errors. Compensating for airborne platform attitude deviations is therefore of significant practical importance for atmospheric wind field measurements. This study proposes a mechanical motion device-based attitude compensation method. To meet practicality and system simplification requirements, an FPGA (field programmable gate array)-controlled compensation algorithm is introduced, building on the existing dual-axis scanning device and FPGA system of the wind lidar. This system achieves real-time, high-precision compensation for airborne platform attitude angle changes.MethodsTo reduce directional errors of the emitted laser beam, we combine an FPGA control algorithm with a dual-axis compensation device to correct yaw, roll, and pitch deviations of the airborne platform. The attitude measurement unit employs an MEMS (micro-electro-mechanical system) inertial/satellite integrated navigation module (equipped with a triaxial gyroscope and accelerometer) to acquire platform attitude information with an accuracy of 0.03°. Azimuth and pitch motors are connected to angle encoders for position feedback. The FPGA receives IMU (inertial measurement unit) measurement data every 60 ms. The motors operate in a variable-speed stepping mode, completing each compensation motion within 60 ms, achieving a system compensation bandwidth of 16 Hz. After parsing IMU attitude data, dual-axis compensation angles are calculated to control motor movements. Physical equivalence experiments were conducted to test motor repeatability positioning accuracy and compensation angle errors, determining the actual compensation error of the dual-axis scanning mirror system. Additionally, radial wind speed errors caused by the interaction between attitude angle changes and wind speed during integration time in a single direction were analyzed. Finally, simulations were performed to evaluate radial wind speed errors induced by compensation system errors under specific flight conditions.Results and DiscussionsTo validate the compensation effectiveness of the device on airborne platform attitude changes, equivalent experiments were conducted for azimuth and pitch compensation angles in laser pointing adaptive control. The rotation angle derived from encoder monitoring values was used as the basis for laser pointing compensation. Attitude change angles and laser pointing compensation angles were measured multiple times at varying angular velocities, with a turntable motion range of 0°?21°. Through semi-physical experimental simulations and combined with pointing repeatability positioning accuracy, when the platform attitude angular velocity was below 20 (°)/s, the azimuth and pitch compensation accuracies of laser pointing reached 0.048° and 0.043°, respectively, with compensation error ranges of -0.1° to 0.1°. The dual-axis compensation accuracy of the laser pointing system was 0.064°, with a compensation error range of -0.141° to 0.141°. We compare the final motion compensation results with other classic compensation methods, further compare the effectiveness of motion correction methods and post-processing correction methods, and analyze the propagation of attitude-related errors to horizontal wind speed errors.ConclusionsAn FPGA-controlled adaptive scanning mirror pointing scheme for airborne wind lidar is designed. The FPGA acquires platform attitude information via an IMU, dynamically adjusts motion parameters using attitude compensation and variable-speed stepping algorithms, and achieves adaptive control of the dual-axis compensation device to complete laser pointing compensation. The system exhibits a compensation speed range of 0?20 (°)/s, a bandwidth of 16 Hz, a compensation accuracy of 0.064°, and a compensation error range of -0.141° to 0.141°. Under conditions of a platform attitude angular velocity of 3 (°)/s, a relative wind speed of 10 m/s, and a 1-min measurement duration, the horizontal wind speed measurement accuracy improved from 5.223 m/s to 0.023 m/s, and the horizontal wind direction deviation decreased from 176.2° to 0.28° after implementing adaptive pointing control. This scheme provides an effective approach for stabilizing laser pointing in airborne wind lidar systems.
Jun. 23, 2025Vol. 45 Issue 12 1228015 (2025)
Dongcai Tan, Shunkun Liang, Zi Wang, Jing Tao, Ang Su, Wenlong Zhang, Jianbing Liu, Aojia Ma, Banglei Guan, Yang Shang, and Qifeng Yu
ObjectiveWe investigate a height estimation method for non-cooperative aerial targets without feature information during take-off phase. The observation process of the flight target can be divided into two distinct phases: small-angle and large-angle phases. Two height estimation methods are proposed based on geometric optics modeling. In the small-angle phase, scene features are utilized to estimate the height via optimizing the iterative solution of the camera focal length. In the large-angle phase, the height is calculated based on known camera parameters and geometric relationships in the absence of reference objects. Experimental results demonstrate that the proposed method achieves high precision and reliability, with average height estimation errors of 0.246 m and 0.108 m for the small-angle and large-angle phases, respectively. This study not only provides a novel technical approach for state estimation of flying targets during the take-off phase but also offers theoretical support for flight fault analysis and safety evaluation.MethodsAiming at the issues of unknown camera parameters and possible pitch deviations in the initial take-off phase of non-cooperative targets, we propose a parameter estimation method based on a measurable reference object. By utilizing the pixel dimensions of the reference object, the camera focal length is precisely estimated. The camera inclination angles and target altitude are calculated by analyzing pixel coordinate variations between the target and reference object. During the target's ascent phase, when there is a lack of reference benchmarks within the field of view, the camera focal length and initial height estimated in the small-angle observation phase are used as known quantities. By modeling the actual motion state of the target, the accuracy of altitude estimation is further optimized. This method effectively addresses the challenges posed by unknown camera parameters and target deviations in the initial take-off phase, providing a high-precision solution for state estimation of non-cooperative targets during take-off.Results and DiscussionsIn our experiment, the height estimation methods for non-cooperative flight targets were precisely validated. The results show that, in the small-angle phase [Fig.7(a)], the maximum difference between the estimated height and the true value measured by the laser rangefinder was 2.77 m, with an average difference of 0.246 m. Regarding camera inclination angles, the maximum difference was 0.23°, with the average difference of 0.11° compared with the values measured by the inclinometer. These data indicate that the height estimation method has high accuracy in the small inclination angle phase.In the large-angle phase [Fig. 7(b)], at calculation frame 7, despite clear power pole visibility, the estimated flight height deviated by 21.85 m from the true value, while the camera inclination angle differed by 7.51°. The cause of this outlier has been analyzed in detail in Section 2.3. Excluding this anomalous data point, the maximum height estimation deviation decreased to 1.4 m, averaging 0.108 m. Meanwhile, the maximum difference between the estimated camera inclination angle and the true value is reduced to 0.59°, and the average difference is 0.258°. The experiment proves that the height estimation method can also meet the accuracy requirements in the large-angle phase. Overall, the experimental results from both the small and large inclination angle phases demonstrate the high accuracy of the two proposed height estimation methods. These methods offer essential theoretical support and precise data for relevant task analysis.ConclusionsThis research addresses non-cooperative flight target altitude estimation during take-off without feature information, presenting two geometric optical modeling-based methods. Field flight validation experiments confirmed the methods’ effectiveness. During the small-angle phase, the average difference between estimated altitude and laser rangefinder measurement value is 0.246 m, while average difference between estimated camera inclination angle and inclinometer reading is 0.11°. The large-angle phase showed average differences of 0.108 m in altitude estimation and 0.258° in camera inclination angle estimation. These results demonstrate the methods’ high precision for non-cooperative flight target state estimation during take-off. This research advances non-cooperative target position estimation theory while supporting flight failure analysis and safety assessment. Current estimation errors primarily stem from imaging distortion and feature extraction inaccuracies. Future research will focus on developing self-calibration and feature extraction algorithms to enhance method applicability across diverse practical scenarios.
Jun. 25, 2025Vol. 45 Issue 12 1228016 (2025)
Xuelong Li, Zhe Sun, and Guojun Wu
SignificanceAutonomous Underwater Vehicles (AUVs) are pivotal tools for ocean exploration, resource utilization, and environmental monitoring. The underwater docking process, which enables AUVs to physically connect with recovery stations for energy replenishment and data transmission, is critical for enhancing operational efficiency and mission continuity. Traditional guidance methods, such as acoustic and electromagnetic systems, face limitations in precision, robustness, and adaptability to complex underwater environments. Acoustic guidance suffers from low resolution and susceptibility to multipath interference, while electromagnetic signals degrade rapidly in water. Optical guidance, leveraging high-resolution visual or photoelectric detection, has emerged as a promising solution for close-range docking due to its superior accuracy, real-time performance, and stealth advantages. This review highlights advancements in optical guidance technologies, focusing on monocular vision, binocular vision, and position detectors, and outlines their transformative potential in enabling reliable AUV underwater recovery.Progress1) Monocular vision guidance. Monocular vision systems utilize a single camera to detect active or passive optical markers on docking stations. Active markers, such as LED arrays, offer long visibility ranges but require precise geometric configurations to avoid ambiguity in pose estimation. Passive markers (e.g., ArUco codes or geometric patterns) provide unique identification but are limited by shorter detection distances. Recent studies have improved robustness through multi-marker fusion and deep learning. For instance, irregularly arranged four-light beacons [Figs. 5(a)?(c)] and hybrid markers combining LEDs with black-and-white codes [Fig. 5(d)] enhance feature matching accuracy. Deep learning frameworks like YOLOV5 and CNN-based models [Fig. 6(a)] further optimize marker recognition in turbid water. Currently, deep learning-enhanced monocular visual guidance achieves sub-3 cm localization accuracy by combining beacon recognition with PnP algorithms or fusing visual data with multi-sensor inputs, but faces challenges in underwater optical attenuation, high computational demands, and limited real-time pose estimation frequency.2) Binocular vision guidance. Binocular vision systems leverage stereo cameras to resolve depth through disparity analysis [Fig. 7(b)] . By correlating pixel coordinates of guide lights in dual images, 3D coordinates are derived using triangulation. Key advancements include camera calibration and distortion correction. Traditional calibration methods (e.g., Zhang’s checkerboard approach) ensure sub-pixel accuracy, while neural networks address nonlinear distortions caused by underwater optical windows [Fig. 7(a)]. Binocular vision guidance enhances beacon recognition range and accuracy, enabling AUVs to achieve sub-centimeter localization precision (~10 mm error) and 30-meter docking range, though its computational speed (milliseconds to hundreds of milliseconds per cycle) requires further optimization despite low hardware demands.3) Position detector-based guidance. Position detectors, such as quadrant photodetectors (QPDs), track light spots from docking station beacons. These systems excel in high-speed tracking and angular resolution but require precise optical alignment. Experimental validations demonstrate their robustness in turbulent flows, achieving angular accuracies within 0.1°. The sea trial demonstrated that the multi-branch network optical guidance method, based on multi-quadrant photoelectric detection and real-time angle data processing, achieved an AUV position resolution speed of 5.650 ms/cycle and a mean coordinate error of 58.292 mm (best 7.107 mm at 2?3 m), fulfilling precision and efficiency requirements for terminal docking with lower computational power and energy consumption compared to existing methods.Conclusions and ProspectsOptical guidance for AUV underwater docking, a cornerstone technology enabling safe, continuous, and efficient marine operations, has garnered significant attention from researchers globally. This study systematically reviews two primary optical guidance paradigms: image sensor-based methods and position detector-based methods. Image sensor-based approaches, characterized by intuitive data acquisition and high positioning accuracy, dominate current practices by leveraging visual or photoelectric sensing to extract beacon features and resolve relative pose. Meanwhile, position detector-based methods, exemplified by multi-quadrant photoelectric detectors, highlight advantages in detection speed and communication-integration potential.Despite progress, critical challenges persist: benchmark dataset limitations. While datasets have been developed, acquiring high-fidelity ground truth data remains arduous due to dynamic underwater environments and system-induced noise. Image sensor-based methods suffer from low frame rates, exacerbating latency and computational burdens during real-time processing. Position detectors, though faster, lack sufficient modulation bandwidth for high-speed communication.To address these gaps, future advancements should focus on three synergistic directions:1) High-speed, stable, and intelligent guidance systems. The integration of deep learning architectures, particularly large-scale models, with edge-computing frameworks will enhance real-time decision-making capabilities. Model quantization and lightweight design facilitate deployment on embedded devices, ensuring adaptive navigation in dynamic underwater scenarios.2) Integrated optical-acoustic communication guidance. The development of multi-quadrant photodetectors with high-frequency modulation capabilities enables unify positioning and communication functions. Utilizing optical communication’s short-range high-bandwidth advantages while compensating for acoustic latency bridges the gap between near-field precision and long-range connectivity.3) Multi-sensor fusion perception. The fusion of heterogeneous sensor data (e.g., GPS, INS, DVL) with optical guidance through advanced communication protocols and collaborative control algorithms enhances system performance. The incorporation of deep learning enables robust feature extraction and target perception, achieving centimeter-level accuracy and cross-domain sensor synergy. By synergizing these innovations, AUV underwater docking systems will evolve toward autonomous, resilient, and intelligent operation, unlocking new frontiers in marine exploration, infrastructure maintenance, and underwater robotics.
Jun. 25, 2025Vol. 45 Issue 12 1200001 (2025)
Dong Liu, Xiaohang Ji, Shaohang Cui, Qiaoyu Liu, Xiwen Qiang, Wenyue Zhu, Lin Ma, and Lan Wu
SignificanceThe atmosphere, as the interface between terrestrial and space environments, plays a crucial role in various aspects of human civilization and technological development. It is a dynamic and complex fluid system that not only sustains life but also serves as the medium through which many modern technologies operate. The atmosphere is responsible for weather patterns, climate regulation, and the distribution of natural resources, all of which are vital for human survival and societal progress. Remote sensing, optical communication, astronomical observation, and high-energy laser applications all rely on atmospheric transmission properties. Understanding and predicting atmospheric conditions is therefore essential for both scientific advancement and practical applications in fields ranging from meteorology to national defense. Moreover, the atmosphere influences global ecosystems and biodiversity, affecting agriculture, water resources, and energy production. As such, comprehensive research into the atmospheric environment is imperative for addressing contemporary challenges such as climate change, resource management, and environmental sustainability.Atmospheric optical turbulence, characterized by small-scale fluctuations in the refractive index of air, represents one of the most significant challenges in atmospheric optics. These fluctuations are primarily caused by temperature variations and air mixing processes, creating dynamic disturbances that affect light propagation through the atmosphere. The consequences include wavefront distortion, beam wandering, intensity scintillation, and degradation of spatial coherence. These phenomena directly limit the performance of high-energy laser systems, compromise the stability of free-space optical communication links, and reduce the resolving power of ground-based astronomical telescopes. The refractive index structure parameter Cn2 has become the standard metric for quantifying optical turbulence intensity, making its accurate measurement and prediction critical for optical system design and operation.Detection and prediction of atmospheric optical turbulence profiles have garnered significant attention due to their practical importance. For high-energy laser applications, knowledge of turbulence distribution enables adaptive optics systems to compensate for wavefront distortions, dramatically improving beam quality and effective range. In astronomical observations, understanding turbulence profiles allows for site selection optimization and implementation of multi-conjugate adaptive optics. For free-space optical communications, especially in satellite-to-ground links, turbulence profile information facilitates link budget calculations and helps optimize system parameters to maintain communication reliability. The military significance is equally profound, as turbulence directly impacts target acquisition, tracking, and pointing capabilities in laser weapon systems.Various methods have been developed to measure and predict atmospheric optical turbulence profiles, each with distinct advantages and limitations. Traditional approaches include temperature fluctuation methods using micro-temperature sensors and acoustic sounders, which provide direct measurements but suffer from limited range or efficiency. Optical observation techniques employing differential image motion monitors and multi-aperture scintillometers offer passive detection capabilities but are constrained by specific observation targets. Lidar-based methods have emerged as particularly promising, utilizing differential image motion, differential light column, and scintillation techniques to provide high-resolution vertical profiles with extended detection ranges. Complementing these detection technologies, prediction methodologies based on profile models, numerical weather prediction systems, and neural network approaches have made significant progress in forecasting Cn2 profiles. These prediction capabilities are especially valuable for planning operations in remote or harsh environments where continuous instrumental measurements are challenging or impossible.ProgressDetection and prediction methods for the atmospheric refractive index structure constant Cn2 have been thoroughly examined. The overall detection methods for Cn2 were first presented (Fig. 1), detailing the characteristics of temperature pulsation methods and sodar detection techniques. The device structures of passive optical detection schemes were analyzed (Fig. 2), and a comparative analysis of parameters such as resolution and accuracy was conducted (Table 1). Among the various passive detection approaches, the Fang’s research team at Tsinghua University intensively studied wide-field wavefront sensors for turbulence detection with good results. Subsequently, it was noted that lidar detection technologies are generally more flexible than passive detection methods. Therefore, a focus was placed on the working principles, development processes, and accuracy indicators of lidar turbulence detection techniques, such as differential image motion and differential column image motion lidar. A comparison of parameters such as resolution and detection height was also provided (Table 2). Additionally, the principles and current research status of optical turbulence fusion detection technology were analyzed. Zhu et al. of Anhui Institute of Optics and Fine Mechanics at Chinese Academy of Sciences have conducted in-depth research on various turbulence detection schemes. Following this, turbulence prediction technologies were introduced, including the available regions and data sources for various profile models (Tables 3 and 4). The working principles and research progress of weather forecast models such as WRF and neural network models were also discussed. Finally, conclusions were drawn, and future research directions were analyzed, highlighting trends in multi-source data fusion for detection technologies and the application of turbulence profiles for adaptive optics system correction.Conclusions and ProspectsThis review examines current turbulence detection and prediction technologies, detailing their characteristics and applicable limitations to inform optimal technology selection for diverse applications. In summary, turbulence profile acquisition will increasingly integrate multiple technologies, leading to miniaturized, intelligent detection hardware and advanced data processing algorithms that utilize neural networks for high-precision detection. Additionally, turbulence prediction will evolve towards comprehensive coverage and high temporal-spatial resolution, enabling accurate forecasting of Cn2 profiles. The integration of Cn2 profiles with adaptive optics systems offers significant potential for improving laser system performance and enhancing imaging quality in various applications.
Jun. 23, 2025Vol. 45 Issue 12 1200002 (2025)
Yongming Ren, Guifen Wang, Wenlong Xu, Long Jiang, and Zhaohua Sun
ObjectiveCoastal and estuarine environments often present complex optical conditions due to high turbidity, strong riverine influence, and diverse phytoplankton assemblages. Remote sensing reflectance (Rrs) measured from above the water’s surface is crucial for characterizing these waters and retrieving key bio-optical variables, such as suspended particulate matter (SPM) and chlorophyll-a (Chl-a). However, the accuracy and stability of Rrs retrievals can be hindered by various factors, such as skylight reflection, sun glint, whitecaps, and fluctuations in environmental conditions like wind speed and viewing geometry. In this study, we aim to investigate the performance of shipborne apparent optical properties observation system (AOP-Cruise) in the Yangtze River estuary and adjacent waters, and conduct a systematic comparison of four commonly used on-water spectral correction methods (RSOA, G01, M99, and J20) across varying water types, wind speeds, and observation angles.MethodsField observations were carried out in July 2023 in the Yangtze River estuary and adjacent coastal waters, covering salinities from 16 to 31 psu and a wide range of turbidity levels. Thirty-two stations are sampled, and over 2000 hyperspectral measurements are obtained during daytime cruises using the AOP-Cruise system. The system continuously measures three above-surface radiometric quantities [Lt(λ), Ls(λ), and Es(λ)] with high spectral resolution. Before deriving Rrs(λ), the measurements are interpolated onto a 1 nm grid from 320 nm to 950 nm. Four spectral correction methods are applied: M99 (fixed reflectance ρ≈0.028 and near-infrared residual correction), G01 (ρ≈0.021 with specific near-infrared channels), J20 (residual skylight removal near 810 nm), and RSOA (a spectral optimization approach modeling ρ(λ) and minimizing residual biases). After spectral calibration, quality checks (e.g., filtering out high sun zenith angles), and Savitzky-Golay smoothing, the resulting Rrs spectra from each method are used in empirical single-band (555 nm) and fluorescence-based retrievals of SPM and Chl-a, respectively. The SPM and Chl-a measurements taken at each station are used for model validation and comparison.Results and DiscussionsOver 80% of the processed Rrs data have high spectral quality scores, which demonstrates that the four correction methods yield plausible Rrs under favorable conditions (wind speed <5 m·s-1, viewing azimuth near 135°, and solar zenith angle <60°). Differences emerge in the blue-green region (412?555 nm), where G01 and J20 tend to overestimate Rrs, whereas M99 exhibits a closer alignment with RSOA. The linear comparison with RSOA indicates that G01 and J20 have higher slopes (~1.18 and ~1.17, respectively), while M99 has a slope near unity and a lower mean absolute percentage deviation (~27%). When the wind speed exceeds 5 m·s-1 or the viewing azimuth deviates more than ±10° from 135°, the derived Rrs display larger variances due to increased surface roughness, whitecaps, and greater sky-glint contamination. Under these conditions, RSOA’s adaptive spectral approach and M99’s near-infrared correction remain relatively robust, while G01 and J20 show more pronounced biases. Retrievals of SPM and Chl-a from the four methods show a good correlation with in situ measurements (mean R2 around 0.74?0.77 for SPM and ~0.75 for Chl-a), though higher SPM (>20 mg·L?1) introduce larger scatter, with G01 and J20 frequently overestimating and M99 slightly underestimating. For Chl-a, all four approaches are relatively consistent across low-to-moderate concentrations. The spatial distributions of SPM and Chl-a show nearshore maxima and offshore decreases, which highlights both natural gradients and method-dependent differences. The analysis by water type (clear vs. turbid) indicates that RSOA achieves lower variability in clearer waters, whereas M99 performs better in more turbid areas, which reflects each method’s sensitivity to wind speed, geometry, and water optical properties.ConclusionsIn summary, we confirm the applicability of RSOA, G01, M99, and J20 for on-water spectral correction and subsequent SPM/Chl-a retrievals in the Yangtze River estuary and adjacent regions. Under near-ideal conditions, all methods produce consistent Rrs results. However, G01 and J20 tend to overestimate in the blue-green domain, while M99 aligns more closely with RSOA. Higher wind speeds or non-standard viewing angles exacerbate the differences between methods, which highlights the complexities of skylight reflection and whitecap effects. While all methods demonstrate good overall performance in retrieving SPM and Chl-a, RSOA generally provides greater stability in clear waters under moderate wind conditions, whereas M99 shows stronger robustness in higher turbidity or wind speeds. G01 and J20 are found to be sensitive to geometric or surface perturbations. We underscore the potential of the domestic AOP-Cruise system for real-time hyperspectral observations and stress the importance of choosing suitable correction methods based on local water types and environmental conditions. Future efforts could focus on refining site-specific calibration or extending the comparison to a wider range of coastal and inland water environments to further improve measurement reliability and accuracy.
Jun. 18, 2025Vol. 45 Issue 12 1230001 (2025)
Yunhan Long, Fan Yang, Haoping Zhang, Kehao Chi, Fengxiang Wang, Genghua Huang, Buhua Tu, and Congfeng Liu
ObjectiveHyperspectral remote sensing combines imaging and spectroscopic technologies, serving as a multidimensional information acquisition tool. With the expanding applications of hyperspectral remote sensing, the volume of data has rapidly increased, creating an urgent demand for efficient compression techniques. The strong spatial and spectral correlations inherent in hyperspectral images make data compression feasible. In addition, due to the influence of the same types of gases during imaging, non-adjacent bands may exhibit higher correlations than adjacent bands. This phenomenon suggests that adjusting the sequence of spectral bands can improve the correlation between reference bands. However, most existing hyperspectral image compression methods allow each band to serve as the reference band only for adjacent bands. In reality, a single band may exhibit strong correlations with multiple non-adjacent bands, leading to inefficient use of inter-band correlations. To address this limitation, we propose an approach for optimizing reference bands based on inter-band correlations, integrating the CCSDS-123-B-2 lossless compression standard recommended by the Consultative Committee for Space Data Systems (CCSDS). The proposed method aims to improve the efficiency of inter-band correlation use, enhancing overall compression performance.MethodsThe core of this algorithm lies in using the correlation coefficients between spectral bands to select optimal reference bands. By pairing the current band with the newly selected reference band for compression, the algorithm enables the reuse of reference bands. This overcomes the limitation of traditional methods where each band serves as a reference only once. In addition, to further optimize the adjustment and use of reference bands, the algorithm introduces two thresholds: the continuity breakdown threshold and the reference band usage threshold. Experiments are conducted to determine the optimal values for these thresholds, ensuring that the adjusted reference bands achieve superior compression performance.Results and DiscussionsAs shown in Table 4, the computational results demonstrate that the proposed method improves compression performance for hyperspectral images, with greater improvements observed for multispectral images. By adjusting the reference bands, the number of bits required for hyperspectral image compression is reduced, leading to higher compression ratios. Specifically, in experiments involving multispectral image data, the proposed reference band adjustment method improves compression performance by 2.1% to 4.6% compared to the original CCSDS method, showing significant gains. For hyperspectral image data, the method also achieves significant improvements, with compression performance increasing by 1.5% to 2.8% over the original CCSDS method.ConclusionsIn this paper, we propose a reference band adjustment method based on correlation coefficients, which is combined with the CCSDS-123-B-2 standard to present a novel hyperspectral image compression scheme. The core of this method lies in adjusting the reference bands used during prediction based on the correlation coefficients between bands. It also introduces a continuity breakdown threshold and a reference band usage threshold to restrict the adjustment of reference bands. Through a systematic study of the values of these thresholds, this approach addresses the issue of non-reusability of bands in existing band reordering techniques, thus enhancing the efficiency of reference band correlation use. The proposed method has been validated on a range of hyperspectral and multispectral datasets. Experimental results demonstrate that the reference band adjustment method significantly improves the compression performance of hyperspectral images, with a greater enhancement observed in multispectral image data. Specifically, for the multispectral data used in this study, compression performance increases by 2.1% to 4.6%, while for the hyperspectral data, the improvement ranges from 1.5% to 2.8%. Future work will extend the reference band adjustment method from a single band to multiple bands, further improving the utilization of inter-band correlation.
Jun. 24, 2025Vol. 45 Issue 12 1230002 (2025)
Design and Ground Verification of Detection Scheme of Sun-as-a-Star Extreme Ultraviolet Spectrograph
Sifan Guo, Xianyong Bai, Wei Duan, Yufei Feng, Xiaoming Zhu, Hui Tian, Yuanyong Deng, Zhiwei Feng, Haiying Zhang, Ziyao Hu, Xiao Yang, and Qi Yang
ObjectiveThe detection of the line-of-sight (LOS) velocity of coronal mass ejections (CMEs) is essential for understanding their origins and early propagation, and for predicting their arrival time at Earth. The true velocity and evolution of CMEs are crucial for studying the mechanisms of solar eruptions and space weather forecasting. However, the velocity obtained from imaging observations represents only the plane-of-sky (POS) component, not the true velocity vector. To obtain the true velocity, both the POS and LOS components are essential. Based on the Doppler effect, it is possible to measure the LOS velocity of CMEs using a Sun-as-a-star extreme ultraviolet (EUV) spectrograph with a spectral resolving power greater than 500. However, the spectral resolutions of existing instruments are insufficient to meet the detection requirements of CMEs LOS velocity. Therefore, to achieve a spectral resolving power of 500 for detecting the LOS velocity of CMEs, we propose a new detection scheme using a concave varied-line-spacing (VLS) grating and an sCMOS detector. We design and develop a prototype in the wavelength range of 18?30 nm, which achieves EUV spectra with spectral resolving powers greater than 700. Additionally, we propose a data processing method to obtain the one-dimensional spectrum by integrating the two-dimensional spectrum along the slit. This method can improve the signal-to-noise ratio and significantly reduce the downstream data volume, which is suitable for deep space exploration missions. Our investigation provides important support for the development of full-disk integrated spectrograph (FIS) for the solar polar-orbit observatory (SPO) and for detecting the LOS velocity of CMEs.MethodsWe first determine the requirements of the Sun-as-a-star EUV spectrograph based on scientific objectives. The field of view (FOV) of the spectrograph is configured to 34', covering most of the EUV radiance from both the solar disk. The wavelength range of 18?30 nm is selected to measure the LOS velocity of CMEs formed at typical temperatures. A spectral resolving power exceeding 500 is necessary to achieve an accurate measurement of the CMEs LOS velocity. These requirements are ensured in the optical design, structure design, and data processing. Second, we use a new detection scheme with a concave VLS grating and an sCMOS detector, which is designed as a grazing incidence optical structure referring to MEGS-A in SDO/EVE. We comprehensively consider the slit width, grating, and pixel resolution to ensure spectral resolution. Based on the meridian focusing condition of the concave grating and line dispersion, we select the grating with a larger curvature radius and variable line spacing to reduce aberration and improve spectral resolution. The detector, with a pixel size of 6.5 μm, is the sCMOS detector validated by the solar upper transition region imager (SUTRI). The slit width is set to be 20 μm according to the sampling theory and the magnification of the grating. We also use SHADOW VUI ray tracing software to calculate the spectral resolution and error range of the system. Then, we optimize the structure design and assembly methods. We rely on machining accuracy and high-precision turntables to ensure the accuracies of the distance from slit to grating and the incident angle in the air, and fine-tune the detector position through a flexible corrugated pipe in the vacuum environment. Using a narrow linewidth EUV light source, namely a hollow cathode lamp, helium gas can be ionized under high pressure to obtain EUV radiation. Finally, we propose a data processing method for the uneven and tilted spectra: 1) reducing the dark field of the superimposed images from multiple frames and performing spectral line identification; 2) identifying and correcting thermal and damaged pixels in the image using median filtering; 3) calculating the spectral tilt using cubic spline interpolation for sub-pixel translation; 4) integrating 2048 rows of spectra along the slit.Results and DiscussionsBased on the optical parameters of the grating and sCMOS detector (Table 2), we obtain the simulated spectral resolving powers of 772, 876, and 965 for 24.3, 25.63, and 30.37 nm, respectively (Fig. 2). We further design and develop a prototype for the Sun-as-a-star EUV spectrograph (Figs. 3 and 4), equipped with relevant gas injection systems, high-pressure molecular pumps, refrigeration equipment, etc., and finally obtain three ionization spectral lines of helium at He Ⅱ24.303 nm, He Ⅱ25.632 nm, and He Ⅱ30.378 nm (Fig. 5). The superimposed spectrum shows a significant improvement in the signal-to-noise ratio compared to the spectrum extracted from single row after correction by dark field (Fig. 6). We use Gaussian fitting on the corrected spectra and obtain spectral resolving powers of 745, 788, and 865 for the three spectral lines, respectively (Fig. 6, Table 3). These results indicate that the new detection scheme can achieve a high spectral resolving power of over 500, which meets the detection requirement for CMEs LOS velocity. Compared with existing Sun-as-a-star EUV spectrographs, we use a larger curvature radius, a longer slit, and a data processing method that improves the signal-to-noise ratio and reduces the amount of downstream data. It offers more comprehensive advantages in terms of luminous flux, spectral resolution, and data transmission (Table 4).ConclusionsWe propose a new scheme with high spectral resolution using concave VLS grating and sCMOS detector for the detection of CMEs LOS velocity. We complete simulation calculations, optics and structure design, actual spectral calibration, and the exploration of data processing method on orbit for the Sun-as-a-star EUV spectrograph. Using helium as the ionized gas, we obtain spectra of He Ⅱ24.303 nm, He Ⅱ25.632 nm, and He Ⅱ30.378 nm. We propose a data processing method for the measured spectra that involves reducing the dark field, identifying and correcting thermal and damaged pixels, and correcting spectral tilt. This method can integrate two-dimensional array data into one-dimensional spectral data, which can improve the signal-to-noise ratio without reducing spectral resolution and significantly decrease transferred data. Therefore, this method is highly suitable for data processing on orbit in deep space exploration missions. The spectral resolving powers of He Ⅱ24.303 nm, He Ⅱ25.632 nm, and He Ⅱ30.378 nm are 745, 788, and 865, respectively, which are three times higher than the similar instrument SDO/EVE. The research provides an important basis for the detection of CMEs LOS velocity and the development of the FIS equipped on the SPO in China.
Jun. 25, 2025Vol. 45 Issue 12 1230003 (2025)
Huiying Chen, Xinhua Chen, Qiao Pan, and Weimin Shen
ObjectiveGreenhouse gases have a significant impact on the global climate and ecological environment, and are considered one of the primary contributors to global warming. In particular, anthropogenic greenhouse gas emissions have accelerated climate change, with long-term effects on biodiversity, sea-level rise, and extreme weather events. Point source regions emission from power plants, industrial facilities and waste treatment plants are the main sources of carbon emissions from human activities. Accurate monitoring of these sources is important for obtaining high-precision greenhouse gas emission data, evaluating carbon emissions and formulating rational emission reduction policies. The satellite imaging spectrometer is an important optical payload for greenhouse gas emissions monitoring. In order to realize accurate detection of greenhouse gas emissions from point sources, the point source detection payload must exhibit both high spatial resolution and high detection accuracy. This paper presents the design of a high spatial resolution, wide swath, lightweight and compact greenhouse gas point source monitoring payload. The designed imaging spectrometer demonstrates superior imaging quality and compact structural configuration, facilitates straightforward assembly and adjustment, and meets all designated performance requirements.MethodsA wide-swath, compact imaging spectrometer with high spatial and spectral resolution is proposed to meet the monitoring requirements of greenhouse gases in point-source regions. Firstly, according to the detection needs of greenhouse gases, the specifications of the imaging spectrometer are analyzed, and the working band, spectral resolution, signal-to-noise ratio and system F-number of the imaging spectrometer are determined, and the design parameters of the imaging spectrometer are calculated. Then, combined with the system design specifications, the structure selection of the spectroscopic system is carried out, and a symmetric double off-axis three-mirror structure is proposed on the basis of analyzing and comparing the three structures of Chrisp-Offner, Littrow-Offner, and Reflective Triplet. Aberrations of this configuration is examined using wavefront aberration theory, and an initial design incorporating aspheric surfaces is established. In order to further balance and eliminate the system aberration, improve the image quality and reduce the volume, freeform surfaces are introduced to increase the degrees of freedom for optimization. Finally, the design result of the symmetric double off-axis three-mirror structure based on freeform surfaces is presented, along with the evaluation of the imaging quality.Results and DiscussionsBased on the results of gas retrieval simulation analysis, a symmetric double off-axis three-mirror structure is proposed to meet the design requirements of high spectral resolving power, large spectral dispersion width, and a large numerical aperture. The structure adopts planar transmission grating spectroscopy, and the collimating lens and imaging lens both adopt off-axis three-mirror structure which are symmetrical about the grating (Fig. 10). The aperture stop of the system is set on the planar transmission grating. The symmetric double off-axis three-mirror structure can overcome the problem of the object plane and image plane being too close to each other at large numerical apertures, which is conducive to the suppression of stray light in the system. The final design result of the system shows that the symmetric double off-axis three-mirror structure based on the freeform surface has a size of 310 mm×240 mm×125 mm, the modulation transfer function at Nyquist frequency is close to the diffraction limit, and the spectral bending and color aberration are less than 0.35 pixel size, delivering exceptional imaging quality, compact structural layout, and straightforward assembly and adjustment capabilities, fulfilling all design specifications (Figs. 11?14).ConclusionsThis paper presents the design of a light and compact imaging spectrometer with high spatial resolution for monitoring of greenhouse gas point source regions, based on the results of a specification analysis. In order to overcome the problem that the object plane and image plane are too close to each other caused by the large numerical aperture, a symmetric double off-axis three-mirror structure with plane transmission grating is proposed. The introduction of freeform surfaces significantly improved the imaging quality and effectively corrected aberrations, achieving a lightweight and compact system. The design results indicate that the imaging spectrometer system exhibits excellent imaging quality and compact structure, and has significant implications for enhancing the spatiotemporal resolution of greenhouse gas emission monitoring and for the formulation of effective emission reduction policies.
Jun. 24, 2025Vol. 45 Issue 12 1230004 (2025)
© Copyright 2018-2021 | Chinese Laser Press.
All Rights Reserved 沪ICP备15018463号-20