


Please enter the answer below before you can view the full text.


2024
Volume: 44 Issue 18
41 Article(s)

Kai Zhang, Dong Liu, Weize Li, Yao Sun, Xianzhe Hu, Shuaibo Wang, and Xiaotao Li
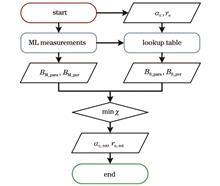
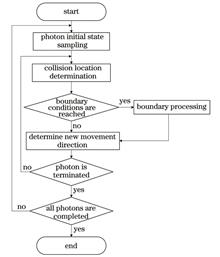
ObjectiveHigh-precision detection of the optical and microphysical properties of water clouds is essential for understanding climate change processes. Effective retrieval of the extinction coefficient and effective radius of water clouds can be achieved by utilizing the multiple scattering effect in water cloud signals detected by lidar. In this work, two water cloud retrieval methods based on polarized Mie-scattering lidar (ML) and dual-field-of-view high spectral resolution lidar (HSRL), respectively, are introduced. The performances of these methods are compared through the retrieval results from four representative water cloud cases. The results indicate that while both methods exhibit comparable retrieval accuracies for water cloud extinction coefficients, the dual-field-of-view HSRL method demonstrates superior performance in retrieving the effective radius retrieval. Enhancing the retrieval accuracy of the polarized ML method is possible by increasing the resolution of the lookup table points, though this comes at the cost of some algorithmic efficiency. Due to the weaker signal intensity at the HSRL molecular channel, the retrieval stability of the dual-field-of-view HSRL method is more sensitive to the signal noise from the molecular channel. The evaluation presented in our study provides an important reference for the future development of instruments and algorithms for observing water clouds based on lidar.MethodsThis paper presents and compares two water cloud retrieval methods based on polarized ML and dual-field-of-view HSRL, respectively. The modified gamma distribution is adopted to parameterize the droplet size distribution of water clouds, while the adiabatic model is used to characterize the vertical distribution of water cloud properties. The Monte Carlo model and analytical model simulate multiple scattering lidar signals from water clouds during the retrieval process. Lastly, a detailed description of the polarized ML method and the dual-field-of-view HSRL method is provided, along with their respective flowcharts illustrated in Figs. 1 and 2.Results and DiscussionsA series of Monte Carlo simulations involving various water clouds is conducted to investigate the multiple scattering effect on the depolarization ratio of signals and signal variations at different field-of-views (Fig. 3). Subsequently, four representative water cloud cases are defined, and their signals are simulated using the Monte Carlo model as input for two retrieval methods (Fig. 4). The retrieved values of water cloud properties (extinction coefficient and effective radius) at a reference height by polarized ML method are illustrated in Fig. 5. For the dual-field-of-view HSRL method, the dual-field-of-view molecular signals reconstructed by retrieved water cloud properties are compared with the input signals (Fig. 6). Comparing the water cloud properties retrieved from the two methods to the true input values is depicted in Fig. 7. The results reveal that both methods accurately retrieve the extinction coefficient, while the dual-field-of-view HSRL method showing higher retrieval accuracy for the effective radius.ConclusionsWe introduce the fundamental principles of two water cloud retrieval methods based on polarized ML and dual-field-of-view HSRL. The methods utilize signals simulated by the Monte Carlo model as the input for retrieval, and the accuracy of their retrieval results is compared. The findings demonstrate that both methods accurately retrieve the extinction coefficient of water clouds. However, the polarized ML method encounters limitations in retrieving the effective radius due to the point resolution of the lookup table, resulting in a larger retrieval error. In contrast, the dual-field-of-view HSRL method, unrestricted by this limitation, achieves higher retrieval accuracy. Specifically, the root-mean-square error of the retrieved effective radius in the HSRL method is approximately 22% to 89% of that obtained by the polarized ML method. The lookup table-based polarized ML method is constrained by the computational speed of the Monte Carlo model, necessitating a reduction in the point number of the lookup table (100×100 in our study) to enhance algorithm efficiency. On the other hand, the dual-field-of-view HSRL method faces challenges with weaker molecular channel signals compared to the ML signals, leading to increased susceptibility to signal noise and greater fluctuations in retrieval results, especially at lower signal-to-noise ratios near cloud tops. Overall, while the dual-field-of-view HSRL method offers higher accuracy in retrieving water cloud properties without lookup table resolution constraints, the higher signal intensity of polarized ML signals ensures more stable retrievals in the presence of larger signal noise. Future research could enhance the retrieval performance of both the polarized ML and dual-field-of-view HSRL methods by improving the lookup table resolution or the signal-to-noise ratio, respectively, to advance lidar-based water cloud research.
Sep. 25, 2024Vol. 44 Issue 18 1801001 (2024)
Zhen Wang, Chaoyang Fan, Suhui Yang, Xinyu Liu, and Zhen Xu
ObjectiveAs the demand for ocean development continues to increase, underwater target detection technology becomes increasingly crucial. Radar offers numerous advantages over sonar, which currently dominates the ocean detection field. Radar provides higher imaging resolution and better anti-interference capability and features a compact detection structure. It can be deployed on ships, aircraft, or satellites, offering high detection efficiency and promising applications in ocean exploration. However, due to water’s scattering and attenuation effects on lasers, underwater lidar echo signals often exhibit significant weakness and backscattered noise. This issue is exacerbated in turbid waters, where water attenuation and backscattering combine to obscure target signals. Simply increasing laser power can intensify backscattering noise, saturating the receiving system without improving overall performance. Backscattering noise severely impacts detection accuracy and imaging quality in underwater lidar systems. Common methods to mitigate water-induced backscattering noise include distance gating, polarization detection, spatial filtering, and carrier modulation. These methods leverage differences in time distribution, polarization characteristics, spatial distribution, and frequency characteristics between signal light and scattered light to suppress unwanted scattering. Currently, underwater target detection radar faces challenges such as limited detection range and low resolution. Addressing these challenges by integrating advanced backscattering noise suppression technologies is crucial for enhancing underwater lidar performance. Our study applies the fast independent component analysis (FastICA) algorithm to process underwater lidar echo signals, aiming to effectively remove backscattering noise and thereby improve ranging accuracy and imaging quality.MethodsDue to water’s scattering effect, photons received by underwater lidar detection systems typically consist of three components: 1) photons directly reflected by underwater targets; 2) backscattered photons, which are scattered and returned by the water without contacting the target directly; 3) forward scattered photons, which are scattered by water on their return path after initially reflecting off the target. The transmission process of photons reveals that backscattered photons do not interact with the target and are independent of photons reflected by the target. Therefore, the FastICA algorithm can be utilized to separate backscattered photons from the detection signal. Photon scattering and absorption caused by water present a typical random problem, hence the Monte Carlo method is employed to simulate photon transmission in non-uniform media. The FastICA algorithm is applied to the photon underwater transmission model based on the Monte Carlo algorithm. This facilitates the separation of underwater target echo signals from backscattering signals for studying the algorithm’s effectiveness. Subsequently, a scanning experiment system is established in a laboratory setting to conduct scanning experiments on underwater targets, generating three-dimensional point cloud images. The three-dimensional point cloud images of the targets processed using the FastICA algorithm are compared with those without algorithmic processing under various turbid water conditions. This comparison aims to assess the FastICA algorithm’s impact on enhancing the accuracy of underwater lidar ranging and improving imaging quality.Results and DiscussionsThe FastICA algorithm effectively separates the target echo signal from the backscattering signal (Fig. 3). By removing most of the backscattering signals from the echo signals, the ranging accuracy of underwater targets is notably improved. During the experiment, three-dimensional scanning and imaging of underwater four-level ladder targets are conducted under varying water turbidity conditions of 4.2, 12.2, and 20.5 NTU. As water turbidity increases, the discrepancy between the distances measured in the underwater target point cloud and the reference values becomes more pronounced (Fig. 6). After applying the FastICA algorithm, the point cloud distribution more closely aligns with the reference values under different turbidity conditions, reducing the deviation between measured and reference values and enhancing the quality of three-dimensional point cloud imaging (Fig. 7). The root mean square error of all three-dimensional point cloud rangings in water with varying turbidity levels is calculated. Applying the FastICA algorithm reduces the root mean square error of three-dimensional point cloud ranging in different turbid waters. The reduction effect is more evident as turbidity increases. For instance, when water turbidity reaches 20.5 NTU, statistical analysis indicates that the root mean square error of point cloud ranging decreases from 3.9 cm to 3.5 cm. Experimental results show that applying the FastICA algorithm to underwater lidar effectively mitigates the impact of backscattering noise on ranging accuracy, thereby improving both the accuracy of ranging and the quality of imaging in underwater lidar applications.ConclusionsBy employing the Monte Carlo simulation method, our study simulates the detection echo signals of underwater lidar in water bodies with varying scattering coefficients. The simulation results indicate that as the water scattering coefficient increases, the backscattering noise in the lidar echo signal significantly increases, leading to a notable decrease in the echo signal-to-noise ratio. Under high scattering coefficients, the target echo can become submerged in scattered noise. The FastICA algorithm is applied to the photon underwater transmission model established using the Monte Carlo algorithm to separate the echo signal from the backscattering noise. The results demonstrate that the FastICA algorithm effectively separates the underwater target echo signal and backscattering noise, thereby improving the signal-to-noise ratio of the denoised echo signal. An experimental system for underwater lidar scanning imaging is constructed to scan and range underwater targets. The host computer controls the vibrating mirror scanning and signal acquisition card, processes the signals, and achieves three-dimensional point cloud imaging of underwater targets. FastICA is implemented in the scanning of underwater lidar for three-dimensional point cloud imaging. Post FastICA processing, the quality of three-dimensional point cloud imaging is significantly boosted. Statistical analysis is conducted on ranging errors of all three-dimensional point clouds in water with varying turbidity levels. Applying the FastICA algorithm results in a notable reduction in the root mean square error of three-dimensional point cloud ranging. Experimental findings unveil that integrating the FastICA algorithm into an underwater lidar system effectively mitigates the influence of backscattering noise, thereby strengthening system ranging accuracy and imaging quality.
Sep. 25, 2024Vol. 44 Issue 18 1801002 (2024)
Wei Qiang, Chong Wang, and Xianghui Xue
ObjectiveAtmospheric environmental problems such as air pollution and greenhouse gas emissions not only impact climate change but also seriously threaten human life. Both greenhouse gas emissions reduction and air pollution control are related to changes in atmospheric compositions. In the context of “double carbon”, China aims to increase its national contribution, striving to peak carbon dioxide emissions by 2030 and achieve carbon neutrality by 2060. The basis for all policies formulated on atmospheric environmental improvement relies on accurate data of air pollution and greenhouse gas emissions. For this reason, the solution to atmospheric environmental problems depends on accurate monitoring technologies and forecasting methods of atmospheric parameters. Lidar has obvious advantages in atmospheric parameters monitoring because of its high spatial and temporal resolution, high sensitivity, real-time operation, non-contact, etc. To achieve compactness and lightweight design suitable for various load platforms, the all-fiber coaxial lidar is an attractive option. In recent years, all-fiber lidar has been widely applied in atmospheric parameters measurement due to its flexible transformation of light beams, less susceptibility to temperature, pollution, and other environmental factors, and ability to achieve higher precision measurement. Compared with the biaxial system, the all-fiber coaxial system has significant advantages, such as low cost, simple, compact and stable structure, and small blind zone. Meanwhile, the amplified spontaneous emission (ASE) noise from the fiber amplifier is inevitable for a coaxial lidar system and degrades the performance of the lidar system. The ASE backscattering from specular reflection results in a decreased signal-to-noise ratio, shortened effective measurement distance, and even misidentification. The ASE noise of the amplifier could be regarded as a fingerprint function. To improve the performance of the all-fiber coaxial lidar, a method for calibrating ASE noise is proposed and changes in mirror reflectivity of telescope and laser power have been included. By calibrating the function of the ASE noise of the fiber amplifier in a lidar system, the ASE noise of the all-fiber coaxial lidar is mitigated, thus improving the signal-to-noise ratio and performance of the all-fiber coaxial lidar.MethodsTo acquire accurate data for all-fiber coaxial lidar, it is necessary to remove the ASE noise, requiring a calibration method for ASE. Coaxial lidar and biaxial lidar simultaneously measure atmospheric backscattering signals along the same optical path. The backscattering photon counts received by both the coaxial and biaxial systems are first denoised. Subsequently, the denoised photon counts are normalized to indicate those received by the coaxial system. By comparing the backscattering data from the coaxial lidar with that from the biaxial lidar, specifically subtracting the biaxial system’s photon counts from the coaxial system’s, the ASE noise is revealed. The ASE noise function, which can be seen as a “fingerprint function”, is derived by fitting the ASE noise data. This ASE noise function enables the determination of the true photon counts for the coaxial lidar and effectively mitigates the ASE noise. Atmospheric aerosol extinction coefficients and other atmospheric parameters are then derived from the true data. In the case of laser power or telescope specular reflectivity changes due to long-term use or operation in a poor environment, the ASE noise function may also change. By measuring the laser power or reflectivity of the telescope, estimating the ratio of variation, and adjusting the ASE noise function accordingly, accurate results can be obtained without needing to recalibrate the ASE noise function. Additionally, time-sharing optical switching allows for accurate background noise measurement of the detector.Results and DiscussionsAn experiment has been conducted to verify the validity of the calibration method of ASE noise by comparing the aerosol extinction coefficient data retrieved from the coaxial lidar with the biaxial lidar. The measured data and the fitted function of ASE noise of coaxial lidar are shown, and the ASE noise function agrees with the measured data perfectly [Fig. 2(a)]. The photon counts of coaxial lidar after ASE noise mitigation are compared with biaxial lidar, and the result shows that the ASE noise function could be applied to mitigate ASE noise in coaxial lidar [Fig. 2(b)]. A field experiment conducted in Hefei on October 25, 2021, was performed to verify the effectiveness and reliability of this method. For a coaxial lidar, after the measured data are denoised and ASE noise mitigated, the backscattering photon counts are obtained. The extinction coefficients are retrieved with the photon counts by means of Fernald’s method. Extinction coefficient data retrieved for coaxial and biaxial single-photon lidar are compared (Fig. 3), and the relative deviation of data of coaxial lidar with biaxial lidar is shown [Fig. 3(b)]. The result shows that the atmospheric extinction coefficient obtained by the coaxial lidar agrees well with that of the biaxial lidar, with a maximum difference between ±10%. The result indicates that the calibration method could mitigate ASE noise effectively.ConclusionsThe ASE noise from the fiber amplifier is inevitable and degrades the performance of all-fiber coaxial lidar significantly. The ASE backscattering from specular reflection results in decreased signal-to-noise ratio, shortened effective measurement distance, and even misidentification. A calibration method is proposed by comparing the backscattering data received from the coaxial lidar with that of the biaxial lidar, and then the ASE noise function is derived. The ASE noise is subtracted from the backscattering data of coaxial lidar and true data of photon counts is obtained by the ASE noise function. An experiment has been conducted and verified the validity of the method by comparing the aerosol extinction coefficient data retrieved from the coaxial lidar with the biaxial lidar. The results show that the method could effectively improve the performance of coaxial lidar with a data relative deviation of less than ±10% when compared with biaxial lidar. The calibration method effectively improves the performance of the coaxial lidar. Additionally, changes in the mirror reflectivity of the telescope and laser power have been included in the method.
Sep. 25, 2024Vol. 44 Issue 18 1801003 (2024)
Haitao Chen, Huajun Yang, Zenghui Gao, and Xueqiong Liu
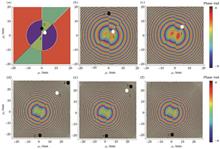
ObjectiveSingular optics has been associated for decades with the study of phase singularities in fully coherent beams. There are two main types of phase singularities: optical vortices and edge dislocations. Recent research has shown that the correlation functions of partially coherent beams can also exhibit types of phase singularities. This has led to the introduction of a new type of singularity, namely the correlation vortex, which is similar to the optical vortex and is defined as a phase singularity of the two-point cross-spectral density (CSD) function of the fields. While much research has focused on fully coherent beams, partially coherent beams have practical advantages due to their greater resistance to degradation when propagating through random media. In addition to correlation vortices, we propose the existence of another type of correlation singularity: the coherent edge-dislocation. Therefore, we introduce the concept of the coherent edge dislocation carried by the Gaussian Schell-model (GSM) beams, since GSM is a classic example of a partially coherent beam. We then study the interaction of two coherent edge dislocations carried by GSM beams as they propagate through free space and atmospheric turbulence, both theoretically and numerically.MethodsBy drawing an analogy with edge dislocations in coherent beams, we show that coherent edge dislocation exists in partially coherent beams. Based on the extended Huygens-Fresnel principle, we derive the analytical expression for the CSD of GSM beams carrying two edge dislocations propagating through atmospheric turbulence. This expression is used to study their interaction in both free space and atmospheric turbulence. The positions of the correlation singularities of partially coherent beams in the z-plane can be determined from the real and imaginary components, as well as from the phase distribution of the spectral degree of coherence of the GSM beams.Results and DiscussionsThe CSD of partially coherent beams has a well-defined phase with respect to two points, and the phase singularities of the CSD are called the correlation singularities. In line with previous research, we propose the existence of another type of correlation singularity: the coherent edge dislocation, which exhibits a π-phase shift along a line in the transverse plane of the correlation function. The refractive index structure constant Cn2=0 leads to an expression for the CSD that degenerates to the CSD formula of GSM beams in free space, allowing us to discuss their interaction in this environment. The two coherent edge dislocations disappear with propagation, while two correlation vortices with opposite topological charges emerge due to their interaction. However, the total topological charge of the correlation vortices is not conserved due to the possible appearance or disappearance of correlation vortices during propagation, unlike the interaction of two edge dislocations, where the total topological charge is zero and conserved during propagation (Fig. 1). The total topological charge is not conserved in the propagation of initial beams with coherence vortices, and off-axis edge dislocation in oceanic turbulence due to the possible appearance or disappearance of correlation vortices. This result is compared with the interaction of a phase vortex and an off-axis edge dislocation in free space, where the total topological charge is conserved. When GSM beams carrying two parallel coherent edge dislocations propagate, the coherent edge dislocations disappear, but no correlation singularities appear in the fields. However, coherent edge dislocations can appear with propagation, which is different from the evolution of two parallel edge dislocations in free space (Fig. 3). The result is compared with the evolution of two parallel edge dislocations in free space, where phase singularities disappear with propagation. When GSM beams carrying two perpendicular coherent edge dislocations propagate, the coherence edge dislocations disappear while perpendicular coherent edge dislocations vanish, with one or two correlation vortices appearing during free space propagation (Fig. 4). This result differs from the interaction of two perpendicular edge dislocations, where no optical vortices appear during propagation. The value of the refractive index structure constant affects the appearance, number, and position of correlation vortices when GSM beams carrying two coherent edge dislocations propagate through atmospheric turbulence (Fig. 5). Correlation singularities may appear, but no coherent edge dislocations are observed with the propagation of GSM beams when the two coherent edge dislocations are parallel in the initial plane, which is different from the free-space case, where coherent edge dislocations may recur, but no correlation singularities appear (Fig. 6). Conversely, coherent edge dislocations may appear but no correlation vortices appear, if the two coherent edge dislocations are perpendicular at the initial plane, which is different from the free space case (Fig. 7).ConclusionsIn addition to correlation vortices, coherent edge dislocations are shown to exist. The CSD of GSM beams carrying two coherent edge dislocations is derived based on the extended Huygens-Fresnel principle. The coherent edge dislocations are generally unstable and disappear, while correlation vortices or edge dislocations may appear during propagation. The number of correlation vortices can change due to the creation or disappearance of these vortices in the fields. A comparison of the interaction of coherent edge dislocations in atmospheric turbulence with that in free space is made.
Sep. 25, 2024Vol. 44 Issue 18 1801004 (2024)
Rui Dong, Wangquan Ye, Bin Gui, Yu Chen, Yuan Lu, Jinjia Guo, and Ronger Zheng
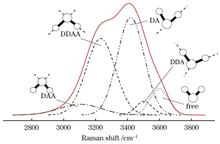
ObjectiveThe monitoring of temperature and salinity (electrical conductivity) in seawater is of significant importance for understanding and predicting the responses of marine ecosystems, hydrological cycles, climate change, and the sustainable utilization of marine resources. The high spatial gradient characteristics of extreme environmental regions, such as hydrothermal or cold seep areas, pose new requirements for in situ measurements of temperature and salinity. Traditional conductivity, temperature, and depth (CTD) equipment, based on contact measurement, cannot achieve high spatial resolution simultaneous measurement of temperature and salinity, nor perform simultaneous measurement of temperature and salinity at a single point. It has been proven that the Raman spectrum of water exhibits a clear linear relationship between temperature and salinity. Raman spectrum can offer non-contact measurements and simultaneous detection of various water parameters. These capabilities provide the potential for measuring temperature and salinity in extreme submarine environments. In this study, we aim to achieve fast, accurate, and real-time insitu detection of seawater temperature and salinity using the Raman spectrum.MethodsA 532 nm excitation optical setup (Fig. 2) is established in the laboratory to acquire Raman spectra of OH bonds at different temperatures and salinities. Simulated seawater samples are prepared with varying concentrations of NaCl, and their salinities are measured using a conductivity meter. Temperature control is achieved using a Peltier-based cuvette holder for precise temperature regulation. A total of 170 sets of Raman spectra are obtained (Tables 1 and 2), divided into training and prediction sets at a ratio of 7∶3. The acquired Raman spectra are baseline subtracted and normalized for consistency. The Levenberg-Marquardt (L-M) method is employed to decompose the Raman spectra into five Gaussian peaks (Figs. 3 and 4). The extracted peak heights, widths, and positions of these Gaussian peaks are used as training features, in conjunction with machine learning methods including partial least squares regression (PLSR), minimum absolute shrinkage and selection operator (LASSO) regression, support vector regression (SVR), and long short-term memory network with an integrated attention mechanism (LSTM+AM). To enhance predictive performance, a Stacking ensemble learning model is constructed using PLSR, SVR, LASSO, and multiple linear regression (MLR) as primary learners, with MLR serving as the secondary learner to simultaneously predict temperature and salinity. Evaluation metrics are utilized such as mean squared error (EMS), mean absolute error (EMA), and coefficient of determination (R2).Results and DiscussionsThe OH stretching vibration peak spectra of water are compared at different temperatures under the same salinity and at different salinities under the same temperature. Figure 5 illustrates that the Raman shifts at 3170 and 3536 cm-1 exhibit the highest sensitivity to temperature, whereas 3195 cm-1 shows the highest sensitivity to salinity. Changes in spectral intensity demonstrate a clear linear relationship with both temperature and salinity. The OH stretching vibration peak is resolved into five sub-peaks, each of which also displays a robust linear relationship with temperature and salinity. Quantitative analysis is independently conducted using PLSR, LASSO, SVR, and LSTM+AM. LSTM+AM yields the best simultaneous predictions for temperature and electrical conductivity, with mean squared errors below 0.28 ℃ and 1.89 mS/cm, respectively (Fig. 8). A subsequent Stacking model incorporating PLSR, LASSO, SVR, and MLR achieves even better quantitative results (Fig. 9), with mean squared errors of 0.23 ℃ for temperature prediction and 1.63 mS/cm for electrical conductivity prediction.ConclusionsThe Raman OH stretching vibration peak of water molecules consists of multiple sub-peaks due to the local hydrogen bond network effect. Changes in temperature and salinity influence the hydrogen bond composition, thereby altering the spectral shape. Analysis of simulated seawater Raman spectra across varying temperatures and salinities reveals that OH sub-peak intensities exhibit clear linear relationships with temperature and salinity respectively. With the help of this linear relationship, the Raman spectrum proves capable of accurately measuring seawater temperature and salinity. The L-M algorithm decomposes the water peak into five sub-peaks corresponding to different hydrogen bonds, utilizing peak intensity, width, and other sub-peak characteristics for simultaneous calibration of temperature and salinity. While several traditional multivariate calibration methods are employed for simultaneous prediction, the LSTM+AM model outperforms them. To further strengthen accuracy and robustness, we use a Stacking ensemble learning model to integrate multiple base models such as PLSR, LASSO, and SVR during training. Quantitative results demonstrate the proposed method’s effectiveness in simultaneously measuring water temperature and salinity. Mean squared errors for temperature and electrical conductivity are 0.23 ℃ and 1.63 mS/cm respectively. This method of using Raman spectrum for simultaneous prediction of seawater temperature and salinity holds promise for in situ Raman spectrum research, particularly in extreme deep-sea environments.
Sep. 25, 2024Vol. 44 Issue 18 1801005 (2024)
Meishu Wang, Jianguo Yang, Weiqi Jin, Su Qiu, and Yixue Wang
ObjectiveChina has vast water areas and a long coastline. Unlike sensor detection technology, imaging detection technology provides a direct display of water conditions through non-contact remote sensing images, which is of great significance for the development of water economy and water-related scientific research. In an outdoor environment, sunlight reflected on the water surface forms strong polarized glints and affects the water brightness, making it extreme challenging to obtain clear images and affecting water surface imaging. This leads to large-area pixel saturation and pixel information loss in imaging detector. Therefore, high dynamic range (HDR) imaging is required for water surface scenes. Fully utilizing polarization information can provide new insights for HDR technology in water scenes. Although glint on the water surface exhibits distinct polarization characteristics, polarized images can reduce such impacts on the rough water surface. In this study, we report a method called water surface polarization HDR (WP-HDR), which utilizes a division of focal plane (DOFP) system to suppress sunlight glints and achieve HDR imaging of water scenes. Real-time water surface HDR imaging is achieved based on the DOFP system. We hope that our basic strategy and findings can contribute to applications such as water environment protection and aquatic meteorological monitoring.MethodsWe focus on the polarization water surface HDR method and use the DOFP system to obtain four images in polarization directions in 0°, 45°, 90°, and 135°, respectively. Firstly, based on the principles of polarization imaging and Stokes vector calculation, we process a frame of an image from the DOFP system to obtain an image in any polarization direction. Through polarization processing, we suppress the high-intensity glints on the water surface, obtaining the maximum and minimum grayscale images simultaneously, Imax and Imin. We then use the Otsu segmentation method and filtering to segment Imax and identify the regions of interest Idark for enhancement. Finally, we apply pixel-wise linear fusion to enhance the underexposed regions. Based on Imin and Idark, we employ Laplacian filtering to enhance image details. The liner enhancement coefficient is determined based on the variance and mean of the dark regions targeted for enhancement.Results and DiscussionsWe use the DOFP system to capture images for testing in three actual water scenes. The experimental results indicate that the selection of the polarization direction is consistent with theoretical analysis. The employed segmentation strategy effectively extracts dark regions. The WP-HDR and DOFP systems produce an effect that cannot be achieved with single polarization direction images, highlighting the necessity of our method and device selection. Results from real-world experiments demonstrate that bright spots in HDR images are effectively suppressed. The contour information of both background and target details becomes clearer, and the composite contrast, standard deviation, and average gradient show significant improvement. The proposed composite contrast, reflecting the degree of light suppression and the accuracy of target representation, can be increased by up to three times. The experiments confirm that our method is suitable for water surface imaging under strong reflection interference and can identify targets in aquatic environments. It also possesses advantages of scene universality, processing adaptability, and real-time handling of dynamic targets. The results are shown in Fig. 8(d).ConclusionsBased on the polarization of water surface reflections, we propose an HDR imaging method called WP-HDR, which employs a DOFP system to suppress sunlight reflection in water scenes. The method utilizes the DOFP system to capture images with different polarization directions at the same moment, enabling polarization measurements of reflective water surface. The image processing involves three main steps. First, The bright spot areas in the image exhibit strong polarization characteristics. By leveraging the optimal polarization angle, minimum average grayscale, and the polarization image, the reflection on the water surface is effectively suppressed. Based on the principles of polarization imaging, we can calculate the images with the maximum and minimum grayscale, Imax and Imin. Imax features the largest inter-class variance, while Imin suppresses the light. Second, applying the Otsu image segmentation and filtering on Imax, we determine the enhancement region to reduce the introduction of discrete pixels caused by reflections, accurately extracting background and targets. Third, based on image information, we apply an adaptive linear fusion to the regions requiring enhancement, enhancing the darker areas. Experimental results demonstrate that the processed images effectively suppress glints, resulting in clearer details and contour information of both the background and targets. The composite contrast, standard deviation, and average gradient show significant improvements. The proposed composite contrast reflects the degree of glare suppression and target accuracy, a potential threefold enhancement effect. The correctness and necessity of the proposed method are validated. Compared to time-domain algorithms, this method has advantages such as good real-time performance, a simplified mechanical structure, and accurate regional computation, making it more versatile and flexible. The WP-HDR method exhibits pivotal practical applications in water imaging technologies like target detection, recognition, and tracking. By utilizing polarization information, glint interference can be effectively suppressed, enhancing the effectiveness of image observations. It holds significant practical application significance for water surface environmental engineering.
Sep. 25, 2024Vol. 44 Issue 18 1801006 (2024)
Taifei Zhao, Yuxin Sun, Feixiang Pan, and Shuang Zhang
ObjectiveWireless ultraviolet scattering communication is a wireless communication technology based on atmospheric particle scattering. Due to its strong scattering characteristics, wireless ultraviolet can be applied to special scenarios such as non-direct vision. However, this strong scattering effect can lead to an obvious multipath effect of wireless ultraviolet and cause serious pulse broadening. In the case of a high data rate, this phenomenon will cause inter-symbol interference and even cause information misjudgment, leading to the increase of bit error rate and poorer communication performance. To improve wireless ultraviolet communication, it is necessary to study the signal processing technology for ultraviolet scattering channel. As a key technology in wireless optical communication, channel equalization can effectively suppress or eliminate inter-symbol interference. As an artificial intelligence method, deep learning has developed rapidly in recent years. With wide application, it can also be applied to the signal processing of wireless optical communication, which inspires channel equalization. In this paper, we combine deep learning technology with ultraviolet optical communication to achieve more efficient and intelligent wireless ultraviolet optical communication.MethodsWe study the channel problem of wireless ultraviolet (UV) scattering communication, and establish a single scattering channel model for non-line-of-sight UV. We analyze the scattering channel characteristics in terms of impulse response and path loss, to provide a suitable channel model for subsequent equalization. Then, we combine long short term memory recurrent neural network (LSTM) and deep neural network (DNN) to develop a blind equalization method for UV scattering channel based on a hybrid neural network, which can preprocess the training data into a time sequence, and process the temporal dependence of the input signals through LSTM to extract useful temporal features. The nonlinear features of the signal data are further explored using DNN to enhance the prediction performance of the model, which features flexibility, adaptivity, and nonlinear modeling capability, and is capable of learning and adapting to complex UV scattering channels without prior information. With sufficient training sample data and the learning capability of the hybrid neural network, the signal can be equalized accurately and efficiently.Results and DiscussionsBased on the bit error rate (BER) and mean square error (MSE) as indicators, the proposed scheme (LSTM-DNN), the classical adaptive equalization algorithms [least mean square (LMS) and recursive least square (RLS)], and the DNN-based channel equalization scheme are comprehensively compared and analyzed. When the signal-to-noise ratio (SNR) is less than 5 dB, the BER curves of the algorithms are close to coincident; when the SNR is greater than 5 dB, it is observed that the BERs of DNN and LSTM-DNN begin to be gradually lower than those of LMS and RLS, with the BER of LSTM-DNN significantly lower than that of the DNN; when the SNR exceeds 9 dB, the BER of LSTM-DNN can be reduced by 0.5 to 2 orders of magnitude compared with that of the traditional algorithm [Fig. 10(a)]. Similarly, when the SNR is less than 5 dB, the MSE curves of LSTM-DNN and DNN are close to coincident, and the MSE is slightly lower than those of LMS and RLS; when the SNR is greater than 5 dB, the MSE of the LSTM-DNN is the lowest of all the algorithms [Fig.10(b)]. These results show that with a high SNR, the neural network model can better capture the difference between signal and noise, so DNN and LSTM-DNN show better equalization performance when the SNR is greater than 5 dB, while the LSTM in LSTM-DNN can automatically capture the temporal correlation in the signal, so it is more suitable for feature extraction of signal sequences.ConclusionsAiming at the serious pulse broadening and signal attenuation of non-line-of-sight wireless UV optical communication due to various factors such as atmospheric scattering, we propose a blind equalization method based on a hybrid neural network for the UV scattering channel. In this method, LSTM and DNN are combined, and the received signal is treated as a time sequence, without the need to study prior channel information. Also, LSTM’s powerful learning ability regarding temporal memory sequence is used to extract the characteristics of the received signal to recover the original signal. Simulation results show that when the SNR is greater than 11 dB, the BER of the proposed algorithm can be reduced by one to two orders of magnitude and the MSE is reduced by more than 0.5 orders of magnitude compared with the LMS algorithm and the RLS algorithm; compared with DNN, the equalization performance of the proposed algorithm is better, and the BER and the MSE of the proposed algorithm are reduced by 81.0% and 27.8% respectively when the SNR is equal to 11 dB, proving that the hybrid neural network has stronger noise suppression ability.
Sep. 25, 2024Vol. 44 Issue 18 1801007 (2024)
Yuwei Pan, Jingjing Chen, Liang Sun, Pengfei Zhang, Feinan Chen, Binghuan Meng, Guangfeng Xiang, and Jin Hong
ObjectiveChlorophyll-a (Chl-a) mass concentration is a primary indicator for water color retrieval. In the visible wavelength band, compared to the contribution of atmospheric radiance, the contribution of water radiance constitutes only a small fraction of the total radiance received by the remote sensing sensor at the top of the atmosphere. Therefore, there is a high demand for the radiance detection accuracy of the remote sensors, which requires accurate on-orbit radiometric calibration before the data can be applied. The large field-of-view remote sensor, the directional polarimetric camera (DPC), is not designed with an on-board calibration and cross-calibration system. With the development of remote sensing technology, site calibration has become a common method for alternative calibration of satellite remote sensors in orbit. We use the ocean scene to carry out the on-orbit calibration of the visible band and verify the water color remote sensing products before and after the calibration. This proves that Rayleigh scattering calibration based on the ocean scene can improve the authenticity and accuracy of the water color remote sensing products of the DPC.MethodsGuided by this concept, to expand the application scope of the Carbon Monitoring in Terrestrial Ecosystems Satellite (TECIS)’s DPC, we initially perform Rayleigh scattering calibration on the DPC for ocean scenes from the CM Satellite, screening according to surface atmospheric conditions to obtain calibration sample points. Subsequently, we estimate the top-of-atmosphere apparent reflectance of the DPC in the blue and green bands, comparing it with the measured reflectance of the DPC to derive the radiometric calibration factor A. Finally, we validate the accuracy of the radiometric calibration. Then, combining the MODIS aerosol optical thickness product with the look-up table method, we estimate the atmospheric range radiation for atmospheric correction. The DPC bands at 443, 490, and 565 nm, pre- and post-radiometric calibration, are used as inputs to the Chl-a retrieval algorithm. The inversion region is selected from data detected in the northwest Australia ocean region on August 22, 2022, with authenticity testing conducted using Moderate Resolution Spectroradiometer (MODIS) water color retrieval data from the same region and date.Results and DiscussionsWe obtain results from Rayleigh scattering calibration, atmospheric correction, and validation of retrieved Chl-a mass concentrations: 1) At ocean calibration sites, we verify the accuracy of radiometric calibration in the blue-green bands of the DPC (443, 490, 565, 670 nm bands). Results indicate that the radiometric calibration factors for each band are close to 1, with correlation coefficients (R2) above 0.9, root-mean-square errors (RMSE) below 2%, and mean absolute errors (MAE) below 0.02, suggesting minimal dispersion in these calibration results. Rayleigh scattering calibrations are validated using desert and polar calibrations, with radiative calibration factors for the ocean scene deviating about 3% from those for snow/ice and desert scenarios (Figs. 3-4 and Tables 6-8). 2) Utilizing the 6SV atmospheric radiative transfer model and combining it with the MODIS aerosol optical thickness product along with other observational and atmospheric environmental parameters, we performed atmospheric corrections for the study area. Results show that the corrected surface reflectance is generally lower than the apparent reflectance before correction, with the Surface Reflectance Product MOD09GA verifying relatively with an error of less than 25% in each band (Fig. 5 and Table 9). 3) Employing the OC3 Chl-a retrieval algorithm, we test the authenticity of water color remote sensing products before and after calibration. Results reveal that the R2 for Chl-a mass concentrations measured by the post-calibration DPC is higher at 0.7720, with a lower RMSE at 0.0578 and MAE at 0.0457 (Fig. 6 and Table 10).ConclusionsIn this study, we establish a water color retrieval algorithm suitable for the DPC. To enhance the retrieval accuracy of water color remote sensing products, we employ a Rayleigh calibration method combining multiple ocean scenes for rapid on-orbit calibration tests in the visible wavelength band before applying water color products. We also conduct authenticity tests on water color remote sensing products pre- and post-adjustment of calibration coefficients. The consistency between calibration results and measurements is good, demonstrating minimal dispersion in calibration outcomes, thereby affirming the effectiveness and reliability of this calibration method. We also use MODIS aerosol optical thickness products and look-up tables to carry out atmospheric correction, and the results show that the atmospheric correction results are good, basically eliminating the influence of the atmosphere. Finally, we perform water color product retrieval and authenticity tests on water color remote sensing products pre- and post-calibration coefficient adjustment, confirming that Rayleigh scattering calibration based on ocean scenes significantly improves the authenticity and accuracy of DPC water color remote sensing products. Test outcomes substantiate a notable rise in the correlation between Chl-a mass concentrations measured by the post-calibration DPC and MODIS data.
Sep. 25, 2024Vol. 44 Issue 18 1801008 (2024)
Luoyao Guan, Cohen Jason Blake, Kai Qin, Shuo Wang, and Tiwari Pravash
ObjectiveIn coal mining regions, extensive coal dust is generated during mining, transportation, and storage, coupled with substantial black carbon produced resulting from incomplete coal combustion in the industry chain. Over time, these materials form absorbable substances, evolving into core-shell aerosols with inorganic salt shells. These aerosols, including sulfate, nitrate, and water, exert significant climate impacts through direct and indirect radiation effects. The environmental and radiative forcing effects are substantial. Absorbing aerosol demonstrates strong solar radiation absorption across the ultraviolet to infrared spectrum. However, past studies primarily focus on their optical properties in visible and infrared bands, overlooking ultraviolet band absorption. Current research often assumes a lognormal particle size distribution for absorbing aerosols, neglecting variations in distribution and optical properties resulting from diverse emission scenarios. Therefore, a thorough analysis of absorbing aerosol optical properties at local scales is crucial. Quantitative assessments of particle size distribution, mixing state, and spatio-temporal variations are vital for elucidating the intricate interactions with boundary layer development, radiative forcing changes, and air pollution.MethodsIn our study conducted in the coal mining area of Changzhi City, Shanxi Province, various datasets are collected, including surface black carbon concentration, particle size distribution, and columnar aerosol optical depth (AOD). The investigation commenced with the utilization of the variance maximization method to categorize AOD data into distinct pollution events. Subsequent analysis involved evaluating the particle size distribution corresponding to different pollution degrees through probability density functions. The uncertainty of particle size for the desorption aerosol core and shell is then determined by integrating black carbon mass concentration data and particle size distribution information. These uncertainties are then used as input parameters to run the Mie scattering model based on the “core-shell” structure. This process results in the inversion of the multi-band optical characteristic parameters of absorbing aerosol in the coal mining area. The computations are carried out under both the assumption of a uniform distribution and a non-uniform distribution, representing different mixing degrees of aerosols. To complete the picture, the uncertainty interval for the single scattering albedo (SSA) of absorbing aerosol was constrained through the application of absorption Ångström exponent (AAE) theory. This comprehensive approach provides a nuanced understanding of the complex dynamics of absorbing aerosol in the specific context of coal mining environments.Results and DiscussionsIn the coal mining area, absorbing aerosols are influenced by emission sources, manifesting a particle size distribution divergent from the lognormal model. Under various pollution conditions, robust peaks are discernible in smaller particle size ranges (0.28-0.3 μm), with weaker peaks present around 0.58-0.65 μm. The relative proportion between the two peaks fluctuates in tandem with the pollution severity (Fig. 3). Using the Mie scattering model, the optical characteristics of absorbing aerosol are inverted based on AOD information, black carbon mass concentration, and particle number concentration. Results indicate that under the assumption of a uniform distribution (Fig. 4), the average size of the “core” particles at 0.28, 0.58, and 0.7 μm is relatively low, leading to corresponding patterns in SSA with changes in “core” particle size. Additionally, the average “core” particle size shows no significant variation with changes in wavelength in different size ranges. SSA decreases with increasing wavelength, with greater fluctuations in the smaller particle size range (0.25-0.58 μm) and more stable changes in the larger particle size range (0.58-1.6 μm). Under this assumption, the AAE theory is found to be inapplicable. In the case of a non-uniform distribution (Fig. 5), SSA values exhibit a slow, followed by a gradual and then rapid increase in the shortwave region, while in the longwave region, SSA first rapidly increases and then gradually levels off. For shorter wavelengths (500 nm and above), AAE theory proves effective for absorbing aerosol with smaller particle sizes. For longer wavelengths (675 nm and above), AAE theory is applicable to absorbing aerosol with moderate particle sizes. However, for larger particles such as coal dust, AAE theory is not suitable. It is noteworthy that, under both assumptions, the inversion results of SSA values in the longwave spectrum (such as 870 and 936 nm) are relatively lower compared to the shortwave spectrum (such as 440 and 500 nm). This discrepancy will lead to an underestimation of emission quantities.ConclusionsWe conduct on-site observations in the coal mining area of Changzhi City, Shanxi Province, aiming to capture the variation characteristics of AOD, particle concentration, and black carbon mass concentration. Utilizing the Mie scattering model based on the “core-shell” hypothesis, we simulate the SSA of absorbing aerosol under two different mixing states. Additionally, we calculate the optical variations of absorbing aerosol constrained by the AAE. The research findings reveal the following:1) The particle size distribution of absorbing aerosol in the coal mining area deviates from the assumptions made in previous studies, which typically assumed single or double-peaked distributions. Influenced by emission sources, the characteristics vary under different pollution conditions. Smaller particles predominantly originate from the incomplete combustion of coal in local power plants and coking factories, producing black carbon. Larger particles stem from the aging processes of black carbon in the atmospheric environment and coal dust generated during coal transportation.2) Comparison of the SSA variations under different mixing states simulated by the two hypotheses indicates that particle size, mixing state, and spectral range significantly impact the SSA of absorbing. In contrast to previous studies using the infrared spectrum, the present investigation reveals higher SSA values in the ultraviolet and visible light spectrum, suggesting a potential underestimation of black carbon emissions.3) The AAE theory is applicable only to certain particle size ranges in different spectral bands. For large-sized absorbing aerosol in the coal mining area, using the AAE theory to estimate SSA introduces uncertainty, and applying the AAE assumption across all particle size ranges leads to an underestimation of emissions. These findings underscore that the distribution characteristics of SSA in absorbing aerosol do not strictly adhere to the power-law relationship of the AAE index but are collectively determined by particle size distribution, mixing state, and spectral range.
Sep. 25, 2024Vol. 44 Issue 18 1801009 (2024)
Ming Dong, Gaofang Yin, Nanjing Zhao, Renqing Jia, Mingjun Ma, Peng Huang, Xiang Hu, Xiaoling Zhang, Xiang Wang, and Tianhong Liang
ObjectiveThe quantum yield of photosynthesis is a crucial parameter that reflects the efficiency of utilizing absorbed light quanta in initial photochemical reactions. It plays a pivotal role in assessing the strength of plant photosynthesis and primary productivity, with extensive applications in plant physiology, pathology, and toxicology. Various technologys have been developed for measuring photochemical quantum yield (FV/FM) since the advent of fluorescence kinetics. The pulse amplitude modulation (PAM) technology, proposed by Schreiber et al., involves inducing fluorescence dynamics using saturating light exceeding 10000 μmol/(m2·s), which fully reduces all PSII reaction centers in a short duration. This approach allows chlorophyll fluorescence to peak before measuring photochemical quantum yield with weak modulated light. While widely applied in higher plant research, PAM suffers from a low signal-to-noise ratio due to the low intensity of measuring light, making it challenging for low-chlorophyll environments, and unsuitable for phytoplankton monitoring. Kolber et al. introduce the fast repetition rate (FRR) fluorescence measurement technology, utilizing rapid, repeated saturation pulses to block the photosynthetic electron transfer chain and modulate chlorophyll fluorescence. By fitting the fluorescence dynamics curve using the exponential curve, FV/FM can be obtained. FRR employs high-frequency sequences (up to 250 kHz) of narrow light pulses (0.3 to 2 μs full width at half maximum) as the excitation light source, providing a high signal-to-noise ratio for measuring FV/FM in phytoplankton. However, it poses high demands on the excitation light source driving circuit and high-speed data acquisition circuit design, increasing the system design complexity and cost. Building upon FRR, Shi et al. propose the tunable pulse light induced fluorescence (TPLIF) technology. The TPLIF technology changes the fast-repeated pulse light excitation in the single turnover mode to single pulse light excitation, reducing the requirements for signal sampling rate and simplifying system design complexity. Based on this, Wang et al. study an adaptive excitation light intensity method. By regulating the saturation excitation light to block the photosynthetic electron transfer chain based on fluorescence saturation parameters, they accurately obtain photochemical quantum yield for different growth stages of phytoplankton. However, phytoplankton classes vary significantly in their light-harvesting pigment compositions and characteristic absorption bands. Eukaryotic algae cells like green algae, diatoms, dinoflagellates, and coccolithophores mainly concentrate their characteristic absorption of light-harvesting pigments in the blue-green light region, with lower absorption in the longer wavelength range. Cyanobacteria, as large single-celled prokaryotic organisms, concentrate their characteristic absorption in the orange-red light region, with lower absorption in the shorter wavelength range. Therefore, when measuring photochemical quantum yield for different classes of phytoplankton, the TPLIF technology using single-wavelength excitation faces challenges in simultaneously saturating different classes of phytoplankton, leading to large errors in the measurement of photochemical quantum yield.MethodsBased on the light absorption characteristics of different classes of phytoplankton, focusing on Microcystis aeruginosa (belonging to phylum Cyanophyta) and Chlorella pyrenoidosa (belonging to phylum Chlorophyta), we employ a dual-band pulse excitation comprising red and blue light. Saturation conditions are optimized to achieve 99% closure of PSII photosynthetic reaction centers within a single turnover cycle, with adaptive adjustments made to excitation wavelength and intensity. Fluorescence kinetics curves are fitted under saturation excitation to accurately measure photochemical quantum yield across phytoplankton classes.Results and DiscussionsFor Microcystis aeruginosa, errors in 10 repeated FV/FM measurements compared to FastOcean sensor results are 26.50%, 1.58%, and 1.12% under blue light, red light, and combined light excitation modes, respectively (Fig. 3). Similarly, for Chlorella pyrenoidosa, errors are 1.12%, 8.99%, and 0.53% under the respective excitation modes (Fig. 4). Measurements of mixed algae with varying volume ratios show errors of 11.95%, 14.02%, and 0.94%, under blue light, red light, and combined light excitation modes compared to FastOcean sensor results (Fig. 6).ConclusionsTo address the limitations of the single-wavelength TPLIF technology, which fails to simultaneously saturate different classes of phytoplankton and leads to significant errors in measuring photochemical quantum yield, we propose a dual-band TPLIF technology. This method is designed for the accurate measurement of the photochemical quantum yield of photosynthesis based on the light absorption characteristics of various classes of phytoplankton. Our measurements of pure algae demonstrate that the error in measuring photochemical quantum yield using the characteristic absorption of the excitation wavelength is similar to that of the dual-band excitation mode. However, the error is significantly higher when using non-characteristic absorption of the excitation wavelength compared to the dual-band excitation mode. Under blue light, red light, and dual-band excitation modes, the measurement errors of photochemical quantum yield for Microcystis aeruginosa are 26.50%, 1.58%, and 1.12%, respectively, in comparison with FastOcean sensor measurements. For Chlorella pyrenoidosa,the measurement errors are 1.12%, 8.99%, and 0.53%, respectively. In addition, measurements of mixed algae show that the error in measuring the photochemical quantum yield using the dual-band excitation mode is significantly lower than that using the single wavelength excitation mode. Relative errors for measuring the photochemical quantum yield of mixed algae are 11.95%, 14.02%, and 0.94%, respectively, when compare to FastOcean sensor results. The dual-band excitation mode effectively saturates and excites different phyla of phytoplankton simultaneously, leading to high accuracy in measuring photochemical quantum yield. We introduce a dual-band TPLIF technology for the measurement of phytoplankton quantum yield of photosynthesis, enabling precise measurement of the quantum yield of photosynthesis across different classes of phytoplankton. This technology offers a significant advancement for assessing photosynthetic strength and calculating primary productivity.
Sep. 25, 2024Vol. 44 Issue 18 1801010 (2024)
Zhiang Ma, Dacheng Li, Jun Wu, and Chen Cheng
ObjectiveWith the development of infrared and laser technology, the computational demand for high-resolution atmospheric gas absorption spectra is continuously increasing. Instruments featuring ultra-high spectral resolution, exemplified by the Tropospheric Emission Spectrometer (TES), have already been developed internationally. To retrieve valid information from high spectral resolution devices, rapid computation of atmospheric transmittance at higher spectral resolutions is imperative. At the same time, in specialized application fields such as the simulation of high-altitude flying object plumes, reliance on specialized spectral databases like the high-temperature molecular spectroscopic database (HITEMP) becomes essential for high spectral resolution calculations. However, some specialized models addressing these challenges have already been developed abroad, and domestic resources for addressing the above issues are still relatively scarce. In atmospheric radiation transmission calculations, the computation of transmittance presents a significant challenge. Currently, the line-by-line integration method offers the highest calculation accuracy, up to 0.5%, but it is extremely time-consuming. Consequently, calculating absorption coefficients for broader bands imposes numerous practical engineering usage restrictions. In recent years, graphics processing unit (GPU) parallel computing technology has been widely applied in scientific computation. We design a general high-resolution atmospheric spectral line parallel computing model based on GPU, which has increased the computing speed by one to three orders of magnitude. On this basis, combined with the correlated K distribution algorithms, a correlated K distribution coefficient table with a spectral resolution of 1 cm-1 has been constructed, achieving a parameterized representation of line-by-line integration calculation results and enhancing the universality of computational products. Our work endeavors to present a novel technical approach for high-resolution, rapid radiation transmission calculations under standard atmospheric conditions and high-temperature gases.MethodsWe first design a parallel computation for both the thermodynamic state and spectral line calculations based on the computational characteristics of the line-by-line integration method. Then, through a central processing unit (CPU) +GPU heterogeneous platform, the design processes for both the CPU and GPU sides are optimized by employing parallel computing techniques such as shared memory optimization, atomic operations, loop unrolling, and pre-processing of complex calculations, thereby constructing an efficient parallel computing model. Subsequently, this model is utilized to verify the accuracy of absorption cross-section calculations under atmospheric conditions and radiance calculations under non-uniform paths, demonstrating the computational accuracy of the model. Tests and analyses are also conducted on the parallel computation between spectral lines and under various thermodynamic states, confirming the model’s computational efficiency. Furthermore, based on this model and employing the Malkmus band model parameter fitting method, we conduct a correlated K distribution coefficient table with a resolution of 1 cm-1, enabling rapid atmospheric transmittance calculation under non-GPU hardware conditions. Finally, we compare the transmittance calculated using the correlated K distribution coefficient table with that calculated by the line-by-line integration method, verifying the accuracy of the correlated K distribution table.Results and DiscussionsWe design a universal high-resolution atmospheric spectral line parallel computing model based on GPU, according to the computational characteristics of the line-by-line integration method, which achieves an acceleration effect of one to three orders of magnitude (Table 3). Without compromising computation accuracy, the method significantly improves the efficiency of atmospheric spectral line calculation, providing a powerful tool for atmospheric radiation transmission calculation. On this basis, combined with the correlated K distribution coefficient table constructed by the Malkmus band model parameter fitting method, it is compared with the calculation results of the line-by-line integration method under the same computing conditions, also demonstrating good computational accuracy (Fig. 9).ConclusionsWe combine line-by-line integration with GPU parallel computing, utilizing techniques such as shared memory optimization, atomic operations, loop unrolling, and the preprocessing of complex computations to construct an efficient parallel computing model. This model facilitates rapid calculations of high-resolution absorption coefficients, atmospheric transmittance, and other typical radiative transfer results in environments ranging from 1 to 5000 K. Subsequently, we use the model to calculate CO2 infrared radiation problems in atmospheric and high-temperature environments and conduct accuracy verification, followed by an in-depth analysis of the model’s parallel acceleration capability in different environments. The research results show that the designed parallel computing model can accurately produce the required computation results and achieve a speed-up ratio of over 800 times when processing large-scale spectral line calculations. Finally, by integrating the parametric method of the Malkmus spectral band model, a new process for quickly generating correlated K distribution coefficient tables is realized. This approach, distinct from previous research, extends the parallel computing achievements to devices without GPU or with limited memory. This technological approach not only expands the application field of existing technologies but also provides a new and efficient solution for research and practical applications in related fields.
Aug. 25, 2024Vol. 44 Issue 18 1801011 (2024)
Zhiqiang Sun, Xianhua Wang, Hanhan Ye, Chao Li, Yuan An, Erchang Sun, Shichao Wu, and Hailiang Shi
ObjectiveSince the industrialization era, with the continuously growing industrialization, urbanization, and energy consumption, greenhouse gas emissions have risen sharply, thus causing a constant increase in global temperatures. Atmospheric CO2 is a crucial factor in global warming, and as a major anthropogenic greenhouse gas emission, it has caught continuous attention from the international community. Current high-precision CO2 observations primarily rely on ground-based measurements and satellite remote sensing. While ground-based observations have advantages such as high accuracy and strong reliability, they are essentially single-point measurements and sparsely distributed globally, unable to provide detection on a global scale. Therefore, atmospheric CO2 satellite remote sensing has become the main method for high-precision CO2 monitoring on a global scale. However, with the development of satellite remote sensing from discrete to imaging observation techniques, there has been a substantial increase in remote sensing data volume, and existing retrieval algorithms struggle to meet computational time requirements. In our study, we propose a fast retrieval method for atmospheric CO2. By constructing a suitable look-up table to replace the time-consuming components in the original algorithm, we aim to achieve fast atmospheric CO2 retrieval.MethodsWe focus on the observational data from China’s Gaofen-5 satellite (GF-5), equipped with the greenhouse gas monitoring instrument (GMI), and present a fast retrieval algorithm for atmospheric CO2. First, by leveraging the spectral characteristics of GMI, a line-by-line integration method is employed to construct a gas absorption cross-section look-up table suitable for GMI data, thereby expediting the calculation of gas absorption optical thickness. Secondly, via adopting data from the Modern-Era Retrospective analysis for Research and Applications, Version 2 (MERRA-2), and based on Gaussian line shapes, fitting is performed on aerosol optical thickness profiles to establish a look-up table for Gaussian parameters of aerosol optical thickness, thus facilitating the computation of aerosol optical parameters. Finally, combined with atmospheric environmental parameters and satellite data, the atmospheric XCO2 results are obtained by utilizing a radiative transfer calculation model and a physical retrieval algorithm, achieving fast retrieval of atmospheric CO2.Results and DiscussionsWe conduct a comparative validation of retrieval accuracy and computational efficiency by adopting total carbon column observing network (TCCON) site data and GMI observational data. Regarding computational efficiency, the original GMI retrieval algorithm and the proposed improved algorithm are compared in terms of processing time. In the context of single forward model calculation time, the improved algorithm reduces the forward model calculation time by over 85% compared to the original GMI algorithm, leading to an approximately 21.5 times improvement in calculation time. In terms of total computation time, the proposed algorithm achieves a time scale in minutes, significantly lower than the original algorithm’s computation time of over 1.5 h, which represents a substantial improvement in computational efficiency (Table 4). Regarding retrieval accuracy, a comparison is conducted between the retrieval results of the proposed algorithm and the original GMI algorithm. The error in the column concentration of CO2 between the two algorithms remains within 2×10⁻⁶ [Fig. 4(a)]. The average absolute error of XCO2 between the two algorithms reaches 0.75×10⁻⁶, with the high consistency of results reaching 85.5% [Fig. 4(b)]. This indicates that the proposed algorithm has a minimal influence on the error in the calculation results of GMI retrieval. By comparing the retrieval results of the original GMI algorithm, the improved algorithm, and TCCON site observational results, it is observed that the concentration discrepancies between the proposed algorithm and TCCON mostly stay within 4×10⁻⁶. The average absolute error in the results is 3.01×10⁻⁶, and the retrieval error is less than 1% (Fig. 5). Furthermore, the retrieval results of both algorithms are generally consistent, meeting the precision requirements for CO2 retrieval.ConclusionsTo address the inefficiency in atmospheric CO2 retrieval, we propose a fast atmospheric CO2 retrieval method by adopting look-up tables for acceleration based on the practical requirements of GMI retrieval calculations. By constructing look-up tables for gas absorption cross-sections, the method achieves fast calculation of atmospheric layer-wise gas absorption optical thickness. Combined with molecular scattering calculations and fitting calculations for aerosol optical thickness based on aerosol parameter look-up tables, it reduces the computational time for time-consuming molecular absorption calculations in radiative transfer. By comparing the original GMI retrieval algorithm and the improved algorithm, the average absolute error between their retrieval results is 0.75×10⁻⁶ with high consistency. When compared to TCCON site observational results, the average absolute error in the retrieval results is 3.01×10⁻⁶, meeting the 1% precision requirement for retrieval accuracy. In terms of computation time, the improved retrieval algorithm significantly reduces the computation time while ensuring retrieval accuracy. The retrieval computation time can be reduced by over 80%, shifting the computational performance from the hourly level to the minute level. By conducting retrieval experiments and result verification, the proposed fast atmospheric CO2 retrieval algorithm can substantially enhance the retrieval calculation speed while maintaining retrieval accuracy. In the future, this algorithm can be applied to multi-year GMI data at a global scale and other satellite observational data.
Sep. 25, 2024Vol. 44 Issue 18 1801012 (2024)
Yang Zhao, Hongxi Yin, and Xiuyang Ji
ObjectiveIn recent years, the growing demand for ocean exploration and exploitation has led to an increasing need for underwater high-rate, high-capacity, and low-latency communications. Orbital angular momentum (OAM), as a new multiplexing dimension, can provide additional multiplexing degrees of freedom that are structurally independent of amplitude, polarization, phase, and subcarriers. This is expected to substantially improve spectral efficiency and communication capacity, which makes it a recent hotspot in research for underwater wireless optical (UWO) communications. However, when the OAM beam propagates in an oceanic random turbulence channel, the seawater medium causes both absorption and scattering of the transmitted beam. Additionally, seawater turbulence, influenced by salinity and temperature fluctuations, disrupts the phase profile of the helical wavefront, which greatly affects the performance of the UWO-OAM communication system. In practical applications, the beam must carry information from the deep ocean to the shallow ocean, encountering vertical or slant optical links with seawater parameters that vary with water depth. Furthermore, there has been no research on the performance of the UWO-OAM communication system based on real ocean data. Therefore, it is of great significance to construct a more generalized ocean-inclined optical link.MethodsBased on the power spectrum inversion method, a random phase screen of ocean turbulence related to seawater depth is generated and compensated for. The propagation channel model for vortex beams in an oceanic turbulent slant optical link is established using the multi-phase screen approach. Numerical simulations and analyses are conducted to study the effects of the scintillation index and detection probability of Laguerre-Gaussian (LG) vortex beams transmitted through slant oceanic turbulence channels across varying transmission distances, seawater turbulence parameters, average temperature and salinity, and link tilt angles. Finally, the performance of the OAM modulation communication system for turbulence slant channels is assessed numerically using real data from Argo, a global real-time ocean observing network. The results underscore the effectiveness of the proposed channel model for underwater vortex beam turbulence slant optical links.Results and DiscussionsIn our study, we present two-dimensional and three-dimensional plots depicting random phase screens of ocean turbulence at different seawater depths. These plots illustrate how the intensity and phase of LG beams vary across various transmission distances and modes. Additionally, through numerical simulations, we analyze the scintillation index and the probability of detecting LG beams. This analysis takes into account factors such as transmission distance, seawater turbulence, average temperature, salinity, and the tilt angle of the link. Utilizing data from the Argo network, we investigate how the depth of the transmitter and the slant angle of the link influence the bit error rate (BER) of the UWO-OAM communication system at specific nodes.ConclusionsWe propose a channel model for turbulent slant link communication using underwater vortex beams, which correlates the distribution of seawater temperature and salinity across different depths with the optical turbulence in the ocean. Based on this underwater slant optical channel model, the transmission process of LG beams is simulated in a generalized ocean turbulence environment. The results indicate that an increase in the scintillation index of the LG beam and a decrease in the probability of detection are influenced by an increase in the rate of dissipation of mean-squared temperature of turbulence, a decrease in the rate of dissipation of kinetic energy per unit mass of fluid, an increase in seawater temperature or salinity, or an increase in transmission distance. Real data from the Argo, a global real-time ocean observing network, is used to numerically simulate the effects of transmitter depth and link slant angle on the BER of the UWO-OAM communication system at specified nodes. This research holds substantial practical significance for enhancing the understanding and optimizing the performance of actual underwater communication systems.
Sep. 25, 2024Vol. 44 Issue 18 1806001 (2024)
Yuting Li, Jiaying Liu, Ziting Pan, Ziqiang Li, Chao Geng, and Xinyang Li
ObjectiveThe combination of spatial diversity receiving signals in free space optical communication can be classified into optical and digital combinations. While the digital combining technique has been widely recognized and applied, a significant portion of research on optical combining aims at enhancing combining efficiency. However, in practical applications, the prerequisite for correctly demodulating signals is the temporal synchronization of diversity signals. Constrained by factors such as spatial transmission aberrations, inconsistent fiber optic lengths, optical device errors, and external environmental interference, inevitable optical path differences, and phase differences exist among spatial diversity signals, significantly impacting the effectiveness of the optical combination. Therefore, we explore the influence of optical path differences and phase differences among diversity signals on the demodulation of combined signals and propose an optical combining method for spatial diversity signals.MethodsThe overall architecture of optical combination of spatial diversity receiving signals is illustrated in Fig. 1. The received spatial diversity signals are coupled into optical fibers and connected to optical fiber delay lines to compensate for static optical path difference, ensuring temporal synchronization between information. Then, phase modulators and couplers are introduced to compensate for dynamic wavefront aberrations among beams using the blind optimization SPGD algorithm, achieving independent and parallel control of multiple phases. The real-time detected optical intensity signal from the photodetector is used as feedback to converge toward the direction of maximum output intensity. Furthermore, we analyze the requirements for optical path differences based on pulse broadening and derive the phase control conditions for co-phasing combination based on a 3 dB coupler. Finally, simulation analysis and experimental verification of two-channel diversity signal combination are carried out.Results and DiscussionsTaking communication bit error rate and combined optical intensity as evaluation indicators, the performance of this optical synthesis scheme is presented in Fig. 6. In the open-loop state, the combined optical intensity fluctuates sharply, with an average bit error rate of 6.05×10⁻¹ within one minute. After implementing only phase control, the combined optical intensity is stable, with an average bit error rate of 5.35×10⁻¹. By adjusting the optical path difference, the drift of the combined optical intensity becomes slower, and the bit error rate drops to 4.03×10⁻⁴. Under the simultaneous control of optical path difference and phase difference, the bit error rate reaches 0, and the combined optical intensity remains stable. The effective value of the normalized output optical intensity increases from 0.547 to 0.914, and the mean square error decreases from 0.304 to 0.0142. These results demonstrate the significant efficacy of this solution in improving the stability of the communication system. In addition, we explore the tolerance range of optical path time domain synchronization among diversity signals. For non-return-to-zero (NRZ) pulse signals, the maximum allowable optical path difference among signals is approximately 70% of the bit period length, which is verified in both simulation and experimentation (Fig. 4 and Table 1). Furthermore, a combining experiment of four-channel diversity signals is conducted and achieved a 0-bit error rate as well, demonstrating the scalability of the proposed method.ConclusionsWe analyze the impact of optical path difference and phase difference on optical signal combination and communication demodulation. The optical path synchronization requirements and coherent combining conditions for NRZ signals are deduced. We propose using fiber delay lines and fiber phase modulators to achieve optical path synchronization correction and coherent control. Subsequently, diversity receiving signals are simulated in the optical fiber, conducting an optical combination for two channels of signals. Under the optical path difference correction and phase difference control, the combined optical intensity is stable, achieving a coupling efficiency of up to 90%, and a communication bit error rate of 0 within five minutes. Finally, the proposed approach is extended to achieve optical combination for four channel signals, also achieving a 0-bit error rate and demonstrating the feasibility of applying this approach to the combination of signals from multiple diversity channels.
Aug. 25, 2024Vol. 44 Issue 18 1806002 (2024)
Zhaoyu Pei, Zhihai Xu, Yongliao Zou, Qiong Wang, Shiqi Chen, Jing Peng, Changbin Xue, Zhengyue Zhuge, and Qi Li
SignificanceThe Moon has emerged as a global hotspot for deep space exploration. Since the former Soviet Union launched the first lunar probe satellite in 1959, human understanding of the Moon has been gradually deepened. China launched its first lunar satellite, Chang’e-1, in 2007, and by 2020, the Chang’e-5 mission successfully returned lunar samples to Earth, marking the successful completion of the first three phases of the lunar exploration project (orbiting, landing, and returning). Today's lunar exploration is shifting from a focus solely on mastering technology to a comprehensive development of technology, science, and application. Currently, the International Lunar Research Station (ILRS) planned by China will be the first scientific research facility on the moon. A large number of facilities including orbiters, landers, rovers, power stations, network communication stations, scientific equipment, and various robots will collaborate in near-lunar space and on the Moon. Comprehensive planning of various types of optical cameras to form an optical monitoring network is of significant importance for the construction and operation of the ILRS. The ILRS constitutes a long-term and intricate space infrastructure construction initiative, entailing multiple launches, each comprising several modules. These missions necessitate engineering payloads endowed with continuity, universality, and reliability across various tasks. Among them, optical imaging payloads, serving as the eyes of lunar exploration, play a vital role in facilitating both scientific investigations and engineering tasks. In the future, on the lunar research station, a substantial array of equipment and facilities will operate in concert across the lunar surface and in cislunar space. Strategically planning the various optical cameras in these facilities to form an integrated optical imaging surveillance network system holds paramount importance. This endeavor will collectively realize scientific and application objectives, and it is of great significance for the engineering construction and safe operation of the future International Lunar Research Station, as well as for showcasing the station’s distinctive features to the world. Over the past few years, the field of optical surveillance has witnessed the development of a variety of key technologies, including the optimization of network architectures for surveillance systems, camera systems with multiple optical modules, embedded intelligent image processing technologies, ultra-lightweight camera mounting technologies, and risk mitigation technology. These key technologies complement each other and have shown promising application prospects in major scientific and technological areas. However, there are still a series of challenges in terms of engineering feasibility and performance stability in the field of deep space exploration. Therefore, organizing the technology tree and addressing the direction of key technologies are very important and necessary for more rationally guiding the future development of this field.ProgressFirst, the concept and overall plan of China’s lunar research station are briefly introduced. Second, a detailed survey has been conducted on the current state of optical surveillance systems in domestic and international deep space exploration missions, summarizing the technical characteristics of optical surveillance cameras used in these missions. Third, based on the overall requirements of the optical surveillance system for the lunar research station, we propose the overarching goals of the ILRS optical surveillance system, which are summarized as system perception, collaborative cooperation, and resource optimization. Moreover, the specific requirements of the ILRS optical surveillance system are proposed as comprehensive functionality, network intelligence, lightweight and reliable, and upgradable iterations. Finally, a preliminary concept for the ILRS optical surveillance system is constructed, and on this basis, key technologies that require significant breakthroughs are identified, such as network architecture optimization, multi-optical module technology, intelligent image processing, lightweight carrying technology, and reliability analysis techniques.Conclusions and ProspectsBy analyzing the composition of the optical surveillance system network and features of various optical camera imaging systems at the front end, a general construction concept for the system, the outlines of the technology tree, and key technologies that need to be tackled are proposed. There is an urgent need to combine the overall plan of the ILRS with the top-level design of the surveillance system and to tackle the key technologies, conducting timely onboard test verifications as necessary. The purpose of our analyses and organization is to call upon experts and scholars in the field of space optics and surveillance, both domestically and internationally, to actively participate and contribute their knowledge and strength to the construction of the ILRS.
Sep. 25, 2024Vol. 44 Issue 18 1811001 (2024)
Xiaoyu Gu, Xiaojing Gu, Jie Ding, and Xingsheng Gu
ObjectiveOptical gas imaging (OGI) technology represents a non-contact method for detecting gases based on the distinctive infrared absorption characteristics. Compared to traditional contact gas detection methods such as catalytic combustion, electrochemical sensors, and semiconductor gas sensors, OGI offers advantages including a broad monitoring range, rapid response, high safety, and operational flexibility and efficiency. Over the past decade, it has been widely used in gas leak detection. Despite its success in detecting gas leaks, OGI technology encounters challenges in achieving high-precision gas flow rate measurements. Recent studies have attempted to address this issue by integrating optical flow algorithms with OGI technology to measure gas flow rates. These approaches estimate the optical flow of the leaking gas image using conventional optical flow algorithms and then calculate the gas velocity based on the ratio of pixels to physical length. However, the accuracy of this method remains limited in complex dynamic scenarios. With advancements in neural networks, scholars have explored the use of optical flow neural networks for gas flow estimation. However, existing optical flow neural networks are primarily designed for rigid body optical flow, and thus require significant modifications to address the unique physical and motion characteristics of gases. This necessitates meticulous adjustments and optimizations at each stage, from dataset construction to network design, to accommodate the special scenario of gas optical flow estimation.MethodsWe introduce a method for constructing a dataset of gas leakage optical flow using physics-based simulation software. Initially, the raw methane motion data are generated using the fire dynamics simulator (FDS). Subsequently, the three-dimensional gas data are projected to obtain the column concentration and optical flow labels via a ray marching technique. Gas infrared imaging is simulated based on radiative transfer principles, with data augmentation and background superimposition applied to enhance dataset complexity and diversity. This approach not only ensures the authenticity of the data but also provides an accurate foundation for the training and validation of subsequent deep learning models. Furthermore, we enhance the loss function in response to the unique characteristics of gas motion. Considering the blurriness of gas edges and the minor internal motion variations, a gradient-based loss function is designed. The discrepancy between the estimated optical flow gradient and the true optical flow gradient is employed as the loss function. This adjustment aims to improve the network’s sensitivity to flow variations between adjacent pixels, enhancing the detection of subtle movements within the gas regions. Simultaneously, since the optical flow gradient at the gas edges is prone to abrupt changes, the optical flow network’s focus on gas contours is further improved. Lastly, we adopt a theoretical model for calculating gas flow rate, by computing the gas leak rate using the column concentration and velocity at various points on the gas plume cross-section. In solving for gas velocity, the optical flow algorithm is first used to estimate the optical flow of the gas image sequence. Then, the gas flow velocity is calculated based on the gas optical flow, time, and conversion coefficient.Results and DiscussionsWe evaluate four classic optical flow networks-FlowNet2, PWC-Net, RAFT, and GMA-by fine-tuning and testing the gas optical flow dataset, and comparing their performance with traditional optical flow algorithms. All optical flow networks fine-tuned using the methods described in this paper show a significant decrease in average endpoint error (AEPE) and average angular error (AAE) on the gas optical flow dataset, with the fine-tuned FlowNet2 exhibiting the best performance. Traditional optical flow estimation algorithms tend to underestimate the gas motion regions, but the estimated gas optical flow’s direction and magnitude are relatively accurate. Optical flow networks without fine-tuning on the gas optical flow dataset can only estimate the general direction of gas movement, but there is still a large discrepancy in the motion region of the gas, and in some scenarios, they fail to discern the gas motion region and direction. Optical flow networks fine-tuned using the methods proposed in this paper are more accurate in estimating both the direction and region of gas motion, with primary errors concentrated at the edges of the gas movement and within the subtle variation areas inside. We have also tested the estimation of gas optical flow in multiple real-world scenarios, and our method has proven to be relatively effective. The accuracy of gas velocity estimation on synthetic images, using the cross-section one-third above the gas source as a reference, shows that the fine-tuned FlowNet2 achieves an accuracy of 81.66%, representing 22 percentage points improvement over the original FlowNet2.ConclusionsOur study presents a novel method for gas velocity detection method based on infrared gas optical flow estimation. To address the distinctions between gases and rigid bodies, the dataset and network design have been reconfigured and adjusted. Initially, a gas optical flow dataset is constructed using physical simulation, with the FDS tool employed to generate raw methane gas data. The column concentration and corresponding optical flow are obtained through projection by the ray marching method, followed by the simulation of the infrared imaging process of methane gas based on the radiative transfer model. The dataset’s diversity is further enhanced through background superimposition and data augmentation techniques. Subsequently, a gradient loss function tailored to the characteristics of gas motion is devised, significantly reinforcing the optical flow network’s sensitivity to the edges and minute internal movements of the gas. Finally, a sectional gas flow calculation model is utilized to quantitatively analyze the accuracy of the proposed method’s gas velocity estimation. Experimental results on synthetic datasets and actual infrared images demonstrate that all optical flow networks fine-tuned with the gas optical flow dataset exhibit improved performance in the task of gas optical flow estimation. Additionally, the method proves effective in predicting gas optical flow in real-world scenarios, with 22 percentage points increase in accuracy for synthetic gas velocity measurements. Ablation studies indicate that background superimposition and data augmentation improve dataset quality, and the gradient loss function significantly enhances the network’s ability to estimate gas contours and internal minute movements.
Sep. 25, 2024Vol. 44 Issue 18 1812001 (2024)
Kenan Wu, Jiadong Hu, Haiyun Xia, Tianwen Wei, and Jiawei Qiu
ObjectiveCoherent Doppler wind lidar (CDWL) requires real-time signal processing with high computational complexity, which hinders the development of portable systems with high spatiotemporal resolution and long detection ranges. Despite successful implementations in various fields, high sampling rate analog-to-digital converters (ADCs) and real-time signal processing with digital signal processing (DSP) or graphics cards pose challenges for subsequent data storage and processing.MethodsWe propose a Doppler shift estimation method using a real-time radio frequency (RF) discriminator in CDWL. Inspired by the direct detection Doppler wind lidar (DDWL), this method converts the returned laser signal into easily processed electrical signals through a balanced detector. Subsequently, a low-complexity frequency extraction is achieved using an RF edge discriminator.Results and DiscussionsIn the demonstration experiment, the comparison results between the proposed CDWL and the conventional CDWL show good consistency under both weak and strong wind conditions. Specifically, under strong wind conditions, a radial wind velocity difference of less than ±1 m/s is achieved within a range of 2 km, with a spatiotemporal resolution of 30 m and 0.1 s.ConclusionsBy combining the advantages of CDWL and the edge technology DDWL, we propose and demonstrate a real-time data processing CDWL based on an RF edge discriminator. The results of the comparative experiments verify the feasibility and effectiveness of the new method.
Sep. 25, 2024Vol. 44 Issue 18 1836001 (2024)
Meng Zhang, Yang Liu, Xunchao Sheng, Yumei Tang, and Yuan Hu
ObjectiveReliable gas detection is essential for industrial control, health, and environmental protection. Gas detection based on the infrared absorption principle offers high selectivity but faces challenges in precision and stability. Non-dispersive infrared (NDIR) and gas filter correlation (GFC) analyzer are pivotal for precise gas detection among various measurement devices. In recent years, infrared technology has rapidly advanced due to efforts from major research institutions, companies, and universities. This study establishes a model to describe the relationship between the infrared light source, wavelength, GFC wheel, center wavelength, filter bandwidth, the optical path length of the air chamber, gas volume fraction, and the measurement/reference signals. This model provides insights for amplifier circuit design. We analyze the measurement accuracy and the influence of temperature variations on the system using the response function of the analyzer. Our design proposal enhances primary design stages, guiding the development of NDIR and GFC analyzer and demonstrating the practical application of our approach.MethodsThe NDIR and GFC analyzer comprises six main components: infrared light source, GFC wheel, filter, air chamber, detector, and main circuit system (Fig. 1). To optimize and evaluate our design proposal, we develop a model to describe their relationships with measurement and reference signals. Firstly, we model the infrared light source, GFC wheel, center wavelength, filter bandwidth, the optical path length of the air chamber, and gas volume fraction, deriving expressions for measurement and reference signals. MATLAB simulations based on the HITRAN spectra database are employed to simulate NDIR absorption under varying gas volume fraction, temperature, pressure, and other conditions (Fig. 3), providing insights for amplifier circuit design. We further optimize our design proposal by analyzing the system’s measurement accuracy through the response function (Fig. 4). Simulations also assess gas absorption under different temperatures, quantifying errors in CO2 volume fraction retrieval due to system temperature variations (Fig. 6 and Table 1). This underscores the necessity of ±0.1 ℃ air chamber temperature control to ensure analyzer performance. Practical experiments confirm the effectiveness of our method in guiding the practical design of NDIR and GFC analyzers.Results and DiscussionsThe response function, representing the ratio of measurement and reference signals, is calculated for varied gas volume fraction under specific conditions (Fig. 3), affirming the suitability of selected parameters for circuit system design. System measurement accuracy is confirmed to be within 1×10⁻⁶ through analysis of the response function (Fig. 4). Temperature variations of 10 ℃ result in up to 9×10⁻⁶ error in retrieved CO2 volume fraction (Table 1), underscoring the critical need for air chamber temperature control to maintain analyzer performance. Theoretical simulations demonstrate detection limits below 0.075×10⁻⁶, indication errors of 0.19%, and precision of 0.11%, with zero and span drifts below 0.033% and 0.3% of the full scale, respectively (Table 2). Theoretical simulations demonstrate detection limits below 0.075×10⁻⁶, indication errors of 0.19%, and precision of 0.11%, with zero and span drifts below 0.033% and 0.3% of the full scale, respectively (Table 2).ConclusionsWe build a model describing the relationship between optical components, wavelength, filter bandwidth, and gas volume fraction with measurement and reference signals, which is crucial for amplifier circuit design. The error in retrieved CO2 volume fraction can reach up to 9×10⁻⁶ due to an external temperature variation of 10 ℃ in the system. Therefore, a temperature control system for the air chamber is necessary to ensure the performance of the system.With the help of theoretical simulation, detection limits, indication errors, and relative standard errors of the practically designed gas analyzer can be achieved better than 0.075×10⁻⁶, 0.19%, and 0.11% can be realized, respectively. Zero and span drifts are no more than 0.033% and 0.3% of the full scale. The volume fraction of CO2 is well correlated between NDIR with the laser measurement technology, with a correlation coefficient (R2) of 0.94. Using this simulation method, we guide the practical design of NDIR and GFC analyzer for CO2 detection and prove the application value of the simulation method.
Sep. 25, 2024Vol. 44 Issue 18 1822001 (2024)
Baoze Guo, Entao Shi, Yongmei Wang, Jiu Liu, Jun Zhu, and Shun Yao
ObjectiveHyperspectral imaging is an imaging method to acquire spatial and spectral information of a scene. The satellite-based spectrometer can monitor moving targets in real time and is suitable for disaster emergency and target monitoring. In recent years, microsatellite spectrometers have caught increasing attention. Compact optical systems with small size, light weight, and high imaging quality should be designed to improve spatial resolution and reduce production costs. By comparing the characteristics of refractive imaging systems and reflective imaging systems, we find that reflective optical systems are easier to realize compact structures. The reflective imaging system has coaxial and off-axis types. The coaxial layout can fold the optical path, but the central obscuration blocks energy transfer. Meanwhile, the off-axis aberration correction is hard, but it can make full use of energy in off-axis systems. The determination of the initial optical structure is a challenge. A good initial structure greatly determines the efficiency and potential of subsequent optimizations, which will greatly reduce the optimization time and dependence on design experience. Nowadays, based on the generalized flowsheet, the general design of a reflective freeform system is to select a suitable system from a proprietary or existing structure as the starting point and then conduct optimization design in optical software. As special configurations are increasingly being employed, specific design structures are commonly limited for viable starting points. Zhang proposed to design an unobscured initial structure with a reflective freeform imaging system, in which a special algorithm is demonstrated to calculate the data points on the unknown freeform surfaces using the rays from multiple fields and different pupil coordinates, and thus construct multiple freeform surfaces in an imaging system. However, the above method is only suitable for the design of internal systems with less than three mirrors, but the stray light is difficult to suppress for the three-mirror system. Especially, it’s complicated for reflective imaging systems with several mirrors. There is still a gap in the initial structure of the reflective spectrometer design method.MethodsA novel method of reflective spectrometer structure design is proposed. It is an automatic design method for an off-axis, five-mirror spectrometer based on the Seidel aberration theory. Firstly, if the pitch of mirrors and the mirror curvature of the optical system are known, we can get the heights and paraxial angles on each surface by tracing the characteristic rays in the reflective system. In our study, the height, the angle on each surface, and the mirror curvature are three parameters for reflective optical systems. The optical system of the volumes can be calculated according to three parameters. Meanwhile, based on the aberration theory, we can characterize the primary Seidel aberration terms of the reflective spectrometer system by three parameters. This means that the volume and system aberration are represented by the same three parameters, with the relationship between the volume and the aberration established. Secondly, we consider the characteristics of the spectral system, in which the influence of the grating during light transmission in the system is considered, to ensure that the system meets the imaging conditions of different wavelengths. Then, we derive the mathematical relationships of the relevant parameters of the reflective system. Additionally, the evaluation criteria system is developed to narrow down the structure parameter ranges, thus obtaining the initial compensating optical system aberration under limited volume. Finally, we can import the initial structure into optical design software, which is the off-axis initial system with dispersive elements. As a result, optical systems of UV-visible imaging micro-spectrometers can be quickly optimized. The proposed scheme can satisfy the design requirements, including spectral resolution and spatial resolution.Results and DiscussionsTo verify the feasibility of the method, we design a compact off-axis aspheric reflectance imaging spectrometer by this method. The working spectrum is 320-500 nm, and then the initial off-axis structure can be obtained. Then, freeform surfaces can further improve the imaging quality and expand the field of view. The design results show that the modulation transfer function of each wavelength at Nyquist frequency (12 lp/mm) is greater than 0.8 and the root mean square is better than 10 μm (Fig. 11). The Keystone and Smile are smaller than one pixel in the system (Fig. 12), with the spectral resolution of 0.5 nm in Fig. 13. The system has high resolution and sound imaging quality, thus providing a new idea and method for the design of relevant off-axis reflective structures.ConclusionsTo meet the development trend of miniaturization of spaceborne spectrometers, we propose a design idea and method suitable for the automation of spectrometers structures under the volume requirement, which shortens the time to find the initial structure and provides a more appropriate initial structure design for reflective structure spectrometers. Given the system design parameters and indicators, an appropriate initial optical system can be generated to accelerate the optimization design in the later stage and greatly reduce the growth compared to traditional optical structure design. Finally, a compact off-axis optical system is obtained with meeting specifications, configurations, and the element number.
Sep. 25, 2024Vol. 44 Issue 18 1822002 (2024)
Run Wang, and Zhouping Su
ObjectiveLiDAR plays a crucial role in vehicle-assisted and autonomous driving by detecting the surrounding environment and aiding in obstacle avoidance. Micro-electro-mechanical system (MEMS)-based LiDARs offer rapid scanning speed, high resolution, and cost-effectiveness, which makes them widely used commercially. A MEMS-based LiDAR with a 360° field of view can comprehensively scan the scene around a vehicle, which offers significant practical value. However, conventional optical systems struggle to achieve consistent outgoing beam divergence angles in both horizontal and vertical directions due to their asymmetric fields of view when attempting 360° scanning. To tackle this challenge, we present a panoramic LiDAR optical system based on MEMS scanning. It enables 360° horizontal scanning of the environment using a torus lens, anamorphic prism, and MEMS mirror. Simulation results demonstrate that our design maintains outgoing beam divergence angles at approximately 0.32° horizontally and 0.13° vertically across different MEMS placement configurations.MethodsThe MEMS-based scanning LiDAR system comprises two modules: the transmitting module and the receiving module. The transmitting module includes laser LA, anamorphic prism P1, MEMS, and torus lens L, while the receiving module consists of anamorphic prism P2 and detector D. In the transmitting module, the laser beam emitted by LA undergoes refraction through the special spherical surface S1 on top of anamorphic prism P1. This beam converges after passing through surface S1 and then enters MEMS through the lower surface S2 of anamorphic prism P1. After reflection by MEMS, the beam passes through region A of prism P1 where total internal reflection occurs. The beam then moves into region B where it undergoes refraction before being output. The beam exiting region B is further collimated by toroidal lens L and finally output with a small divergence angle in the horizontal direction. By rotating the MEMS mirror 360° around the Z-axis, the LiDAR achieves a scanning field of view of 360°. The emitted beam strikes an obstacle object, causing diffuse reflection on its surface which scatters light in random directions. Only scattered beams with direction angles closely matching the output beam can enter refraction region B of prism P2. The beams entering region B are redirected towards total reflection region A in prism P2. The reflected beams from region A of prism P2 pass through the bottom surface S2 of prism P2 and ultimately converge onto detector D. Several crucial considerations must be taken into account for the design of anamorphic prism P1. It is imperative to achieve total internal reflection within region A, which enables ray reflection and manipulation without relying on high anti-reflection film coatings. This necessitates precise control over the angle between the total reflecting surface A and the vertical direction. Another point to note is that surface S1 of anamorphic prism P1 should have a certain converging effect on the beam, but not collimation. The curvature of surfaces A and B in anamorphic prism P1 differs in the horizontal and vertical directions, which leads to a marked difference in divergence angle between the horizontal and vertical directions as the beam passes through these surfaces. In the design and optimization process, the priority is to ensure good collimation in the horizontal direction. Therefore, a torus lens L is added outside anamorphic prism P1. The torus lens has minimal effect on horizontal divergence but significantly improves vertical collimation. The design concept of anamorphic prism P2 is similar to anamorphic prism P1.Results and DiscussionsThe design of a panoramic LiDAR optical system based on MEMS scanning enables 360° horizontal scanning of the surrounding environment. Moreover, the vertical field of view can be extended up to 6.7°. An anamorphic prism effectively reduces the divergence angle of the output beam to 0.32° horizontally. After passing through the torus lens, it reduces the vertical divergence angle to 0.13°. Simulation results demonstrate that consistent outgoing beam divergence angles of approximately 0.32° horizontally and 0.13° vertically are maintained across different MEMS positions within this system configuration. Transmitting and receiving modules are positioned on either side of the MEMS. Calculation results indicate a maximum detection distance of approximately 200 m. Furthermore, calculations reveal that the ambient light noise reflected by the environment is approximately 0.01 times lower in intensity compared to the useful signal light.ConclusionsWe design a MEMS-based LiDAR system capable of achieving 360° horizontal field of view ring scanning. The system comprises a transmitting module and a receiving module positioned on opposite sides of the MEMS device. The receiving module comprises a specially-shaped prism P2 and a detector D. The top surface of prism P2 is aligned in the same plane as the special-shaped prism P1 of the transmitting module, which maintains a consistent structure throughout. The system achieves high resolution in both horizontal (0.32°) and vertical (0.13°) directions, utilizing minimal components and featuring a compact structure. Moreover, the optical components are symmetrically oriented, which results in manageable processing complexity and immense commercial potential for this system. Future research will focus on analyzing the influence of manufacturing tolerances and equipment variations on resolution.
Sep. 25, 2024Vol. 44 Issue 18 1822003 (2024)
Yunfan Yi, Canyang Zheng, Liye Xiao, Xin Dai, and Fei Chen
ObjectiveThe compound parabolic concentrator (CPC) with asymmetric structures has the advantages of eliminating the shading phenomenon of array arrangement, reducing the center of gravity of the integrated system, and having small application site constraints. Additionally, the elimination of vacuum tube gap light leakage can recycle the light that should have escaped from the vacuum interlayer gap and improve the optical efficiency of the concentrator. Based on the existing no light escape CPCs (N-CPCs) with symmetric structures, we design a N-CPC with asymmetric structures, which further improves the optical efficiency of the shell-shaped CPC (SS-CPC) and eliminates the light leakage from its vacuum tube gap. However, the curved concentrating surface of the CPC results in uneven distribution of energy flow density on the heat-absorbing surface and thus a decrease in the efficiency of the photothermal/photovoltaic system, and is not conducive to long-term stable operation of the system. Meanwhile, the curved concentrating surface is expensive and difficult to transport and store, which is not favorable for realizing a wide range of applications. Thus, the construction of a concentrating surface composed of multiple planar mirrors can improve the inhomogeneous energy flow density distribution on the heat-absorbing surface, increase the operating time of the CPC, reduce the manufacturing cost of the concentrating surface, and improve the industrial application potential.MethodsBased on the research results of the existing N-CPCs, we adopt the Monte Carlo ray tracing method and the principle of fringe ray, the geometric calculation method to derive the surface formula, and the design of the reflective surface to eliminate the light escape, and ultimately the mapping software to fit a novel N-CPC with asymmetric structures. Additionally, the 3D model of the concentrator is built to verify the existence of light escape via the optical simulation software. The no light escape multi-section CPC (NM-CPC) is constructed by screening the rotation angle with the smallest N-CPC isotropic planarization error based on program calculations, and the NM-CPC solid face shape is printed by a 3D printer. The reflective film and scale are pasted, and the solar rays are simulated by a laser to verify the reliability of the NM-CPC face structure and the correctness of the theoretical model. Meanwhile, the optical simulation software is employed to calculate the optical efficiency of the NM-CPC, and a program is written to calculate the energy flow density on the heat-absorbing surface and the amount of radiant energy collected in a typical meteorological year.Results and DiscussionsInspired by the existing N-CPCs, we design an asymmetric N-CPC [Fig. 1(b)], which is simulated and verified to reflect the light escaping from the vacuum tube to the heat-absorbing surface to improve the optical efficiency of the concentrator system [Fig. 2(a)]. The NM-CPC heat-absorbing surface has more uniform energy flow density distribution and lower peak energy flow density ( Figs. 6 and 7), and superior radiant energy collection in Spring and Autumn (Fig. 8). Additionally, 4.73 mm increase in optical port width within the maximum acceptance angle (Fig. 9), and reflective surface consumables almost similar to SS-CPC, but at 1/4 of the cost (Fig. 10) are presented.ConclusionsFor N-CPCs with symmetric structures, we establish a N-CPC, and then construct a novel NM-CPC by isotropic planarization of curved reflective surfaces from the perspective of practical application engineering. Meanwhile, the solar vacuum tube is employed as the absorber, and the optical performance and energy concentration characteristics are analyzed and discussed by experiments and simulations. Finally, the following conclusions are drawn compared with the SS-CPC of the same specification. The simulation verifies the feasibility of N-CPCs to realize no light escape and provides references for the design of N-CPCs with asymmetric structures. The optical efficiency of NM-CPCs changes more gently at the maximum acceptance angle. The distribution of the energy flow density on the heat-absorbing surface is more uniform, and the peak energy flow density can be reduced by up to 39.1 kW/m2. Additionally, a better amount of radiant energy collection is shown in Spring and Autumn. The reflective surface of NM-CPCs not only saves 75% of the energy flow density but also reduces the energy flow density of the heat-absorbing surface. While saving 75.5% of the manufacturing cost, this surface features lower transportation and maintenance difficulties, and good engineering practicability.
Sep. 25, 2024Vol. 44 Issue 18 1823001 (2024)
Yong Liu, Haitao Guo, Jun Lu, Xiangyun Liu, Lei Ding, Kun Zhu, and Donghang Yu
ObjectiveWith the continuous growth of the population and the rapid development of the global economy, increasing human activities are driving land-cover utilization changes. Timely and accurate understanding of these changes is crucial for national economic construction, social development, and ecological protection. The use of multi-temporal remote sensing images to detect land cover changes, continuously update national land survey results, and maintain the accuracy and current status of basic geographic information is essential for intelligent change detection methods. However, existing land cover change detection is susceptible to the influence of light and seasonal variations, leading to pseudo-changes and misdetection or omission in change detection results. To address this, we design a remote sensing image change detection method based on adaptive boundary sensing. Convolutional neural networks (CNNs) excel at extracting local features, while Transformer is more advantageous in global feature extraction. Our method adopts a hybrid CNN and Transformer structure for feature extraction, combining edge information to enhance change detection sensitivity, providing more accurate results and improving the model resistance to external conditions such as light and seasonal interference.MethodsDuring the encoding stage, res2net is employed as an encoder to extract multiscale features and enhance variation features through a difference enhancement module, reducing redundant feature interference. In the decoding stage, a boundary extractor using deformable convolution obtains precise semantic boundary features. These edge features guide the Transformer for contextual information aggregation. Finally, a multi-scale fusion output strategy integrates different scale feature maps, adding multiple connections between decoders of varying levels to fuse low-level spatial information with high-level semantic information, achieving contextual information aggregation, generating the predicted change map, and completing the change detection task.Results and DiscussionsTo validate our method’s effectiveness, experiments are conducted on two public datasets: ① the CLCD dataset, comprising 600 cropland change sample image pairs collected by Gaofen-2 satellites over Guangdong Province in 2017 and 2019, with resolutions ranging from 0.5 to 2 m; ② the RSCD dataset is publicly from the 2022 Aerospace Hongtu Cup Remote Sensing Image Intelligent Processing Algorithm Competition, consisting of 3000 image pairs from Gaofen-1 and Gaofen-2 with 0.8 m to 2 m resolution. On these two datasets, our method achieves F1 scores of 72.82% and 58.96%, respectively. Meanwhile, visualization results also indicate better performance in recognizing both small and large area changes, with continuous boundaries and complete detection areas. Our method’s change maps closely match actual outcomes, accurately detecting changing areas’ spatial locations. This demonstrates that the edge-guided context aggregation proposed herein enhances the interaction between local detail and global semantic features during Transformer coding and decoding, improving detection efficacy. Compared with seven classical change detection methods on two datasets, our method outperforms the selected comparison methods. Ablation studies on the CLCD dataset further confirm the effectiveness of each module in enhancing overall performance.ConclusionsAddressing boundary discontinuity and misdetection issues in land cover change detection of high-resolution remote sensing images, we design an adaptive boundary sensing method, which adopts a hybrid structure of CNN and Transformer. Selecting res2net as the encoder for multiscale feature extraction and differential enhancement, and leveraging edge features to guide Transformer for contextual information aggregation, we adopt a multi-scale output fusion strategy to combine global semantic and local detail features across layers. This approach yields more precise change detection results compared to other traditional methods, enhancing the model’s resilience to external condition interferences.
Sep. 25, 2024Vol. 44 Issue 18 1828001 (2024)
Multi‐Channel Infrared Medium Long Wave Chip and Dual‐Lens Integrated Component Packaging Technology
Haiyong Zhu, Peng Ji, Zhijiang Zeng, Qinfei Xu, Junlin Chen, Jinglin Zhang, Lin Xu, and Xue Li
ObjectiveWith the rapid development of infrared detection technology, it has been widely employed in medical, environmental, climate and meteorological monitoring, and space remote sensing. In comparison to traditional detection technology, infrared technology can be applied to complex and dynamic scenarios. For instance, it can be adopted to detect the complex marine environment and climate via ocean water color observation satellites. However, data acquired by infrared remote sensing satellites can be affected by factors like atmosphere and terrain to result in the inclusion of non-target imaging information and ultimately influence the accuracy of detection results. Meanwhile, satellites are being developed with hyperspectral, high spatial resolution, and high sensitivity capabilities to ensure high-precision observation in space remote sensing technology. The integration of multi-band and multi-channel infrared detection technology has emerged as a development trend to improve the retrieval accuracy of remote sensing satellite images. The packaging of multi-band infrared focal plane technology is crucial for the practical application of multi-band and multi-channel infrared detection technology. Additionally, the lens is often integrated with the infrared focal plane package in the same airtight component to minimize the size of the optical system and optimize the utilization of refrigeration resources, which puts forward higher packaging requirements. Therefore, we present a novel technology for the integrated packaging of multi-band and dual-lens components.MethodsWe focus on a multi-band mid-long wave infrared module employed in an aerospace project. Firstly, the pixel arrangement of the detector and the optical registration control technology of different focal planes are introduced (Fig. 1). The structural design of the multi-band and dual-lens integrated package components is then explained (Fig. 2). Meanwhile, we explore the low-deformation filter support design (Fig. 3) and filter bonding process to minimize low-temperature deformation. Spectral crosstalk and spectral response of the components are calculated using tested spectral curves (Fig. 4). The lens deformation under force and heat is analyzed separately (Fig. 5), and a method for controlling the lens deformation is proposed (Fig. 6). Additionally, the influence of lens deformation on the imaging quality of the optical system is compared under three different cases (Tables 1 and 2), with the analysis of stray light from the component background radiation is conducted (Fig. 7). Finally, the packaging techniques lead to a package component with exceptional performance (Fig. 8 and Table 4).Results and DiscussionsBased on the above analysis, our innovation can be categorized into three main aspects. Firstly, we focus on different focal plane splicing technology and optical registration. By utilizing fine-tuning technology for different focal planes of multi-channel infrared detectors and adjusting the coaxial lens, the accuracy deviation of the three-band detector with different focal planes and filters is improved to within ±5 μm, while the registration of the lens and detector is within ±15 μm. The results demonstrate that the spectral crosstalk is better than 6%, the spectral response is greater than 99%, and the electrical performance indicates a crosstalk lower than 5%. Secondly, we present a low-deformation filter bracket design and bonding process. Typically, the filter bracket and filter are bonded using adhesive, which inevitably leads to contact between the coating area near the edge of the filter and the glue, and thus forms a bonding surface. Additionally, the thermal properties of the filter substrate differ from those of the filter support material, causing the filter film layer to experience thermal stress when operating at low temperatures. Experimental results indicate that thermal mismatch-induced stress can alter the spectral characteristics of the filter, resulting in spectrum deformation. To mitigate low-temperature deformation of the filter bracket, we employ an alloy material with a low expansion coefficient for the filter bracket and add an isolation slot at the edge of the filter. Furthermore, the filter is fixed at both ends of the filter support frame using low-temperature resistant glue, with strict control over the applied amount of glue. These measures significantly improve the low-temperature deformation of the filter bracket. Finally, a technique for adjusting the image quality of an optical system is investigated by studying the deformation of the lens at low temperature under different inflation pressures. The assembled system is degassed using a vacuum and filled with N2 protective gas. The results reveal that by adjusting the pressure of N2, it is possible to improve the deformation of the lens center and the optical imaging quality for a small field of view. Our study introduces a novel approach to adjusting the imaging quality of optical systems.ConclusionsAn infrared package module integrating a multi-channel infrared detector and lens is designed and developed. The module focuses on key technologies such as multi-band splicing of different focal planes, control of optical lens profile and coaxial registration, low deformation control of the filter bracket, and suppression of anti-light string and stray light background radiation. The splicing accuracy of the three-band focal plane detector is better than ±5 μm, while the optical registration accuracy deviation between the focal plane detector and the filter and lens is better than ±8 and ±15 μm respectively. The deformation of the filter bracket and lens is improved at low temperatures, and the effect of lens deformation on optical imaging quality can be disregarded. Optical crosstalk is kept below 6%, and the crosstalk itself is less than 5%. Our study successfully tackles the challenges of achieving high precision registration for multi-band and dual-lens integrated infrared detector assembly, low deformation control of the filter bracket, lens surface profile control, and the miniaturization and high performance of the crosstalk detector package.
Sep. 25, 2024Vol. 44 Issue 18 1828002 (2024)
Jun Zheng, Xiaohong Zhang, Bei Chu, Yiqiu Zhang, and Yongchao Zheng
ObjectiveThe time synchronization system of optical remote sensing satellites generally consists of a timing system and a timekeeping system. Its accuracy is determined by both the timing and the timekeeping accuracy: the timing accuracy is determined by the accuracy of the pulse per second signal output from the global navigation satellite system, while the timekeeping accuracy is determined by the imaging time calibration accuracy of the optical remote sensing camera during operation. As a timekeeping device, the time scale accuracy of the on-board optical remote sensing camera is an important technical indicator that directly affects the geometric positioning accuracy of remote sensing images. With the increasing demand for high temporal and spatial resolution satellite remote sensing data, optical remote sensing satellites require higher accuracy in their whole time synchronization systems. We discuss the design and verification of a high-accuracy time scale system based on the imaging mechanism and process of optical remote sensing cameras and analyze the influence of time scale accuracy and image positioning accuracy, demonstrating that the time scale accuracy of optical remote sensing cameras ensures the geometric positioning accuracy of in-orbit images.MethodsWe first analyze the influence of the time scale accuracy of optical remote sensing cameras on the geometric positioning accuracy of remote sensing images. The calibration accuracy of the imaging time directly affects the orbit and attitude accuracy through the satellite orbit parameters and satellite attitude parameters in the image auxiliary data, which affects the geometric positioning accuracy of remote sensing images. To achieve high-accuracy time scale performance for linear array remote sensing cameras, these cameras utilize high-accuracy local clocks and counting homology design, along with an image auxiliary data embedding scheme based on high-accuracy pulse-per-second signals from satellites combined with corresponding satellite integer second time data. This allows the calculation of the corresponding imaging time for each line of remote sensing images. Upon activation, the camera uses a local fixed high-accuracy clock frequency for counting, with the counter width sufficient to prevent overflow throughout the entire operating period. Counting starts on the falling edge of the pulse per second and the rising edge of the image line synchronization, with these counter values latched separately. These values are then used as parameters for calculating the imaging time data. Based on the count value in the image auxiliary data, the imaging time TH of this image line can be determined. Using error theory and data calculation processing, an analysis formula for the calibration accuracy of the imaging time is derived. According to the design specifications, the calibration accuracy of this camera is calculated to be less than ±32 μs. The imaging time (integer second time code + imaging relative time Δt) calculated from the image auxiliary data deviates from the actual imaging time of this image line. The deviation time is shown in Fig. 5, including hardware delay td of the pulse per second signal reaching the camera imaging circuit; relative time deviation value Δt' of the current imaging time. Among these, the relative imaging time deviation is the most influential factor.Results and DiscussionsAccording to the analysis, the hardware delay is a fixed delay in the hardware link of the signal, which is an accurate and measurable fixed value. Hardware delay includes three types: intra-board wiring delay, inter-board transmission delay, and device transmission delay. Analysis shows that the total hardware delay is less than 1 μs. By comparing the oscilloscope timing test values with the image auxiliary data calculation values, the calibration accuracy error Δt' relative to the imaging time can be obtained, as shown in Eq. 17. To obtain the maximum calibration accuracy error for each image line of a spatial optical remote sensing camera, several image line synchronization signal positions (TH) must be selected several times far away from the pulse per second signal, including the farthest end, as shown in Fig. 8. In addition, to ensure completeness and calculate the maximum error, multiple data sets of data with different integration times need to be tested. To verify the calibration accuracy testing method proposed in this article, an example verification is performed on a satellite camera subsystem. According to Eq. 18, the imaging time calibration accuracy of this optical remote sensing camera is 2.8558 μs. Furthermore, based on the camera design and analysis of this test method, its time scale accuracy test error is less than ±2 μs. Combined with the principle analysis of time delay integration push-scanning imaging. Under the premise that the accuracy of satellite orbit and satellite attitude data meets the requirements, it is proved that the time scale accuracy of the optical remote sensing camera can ensure the accuracy of geometric positioning of in-orbit remote sensing images, with sufficient margin.ConclusionsThe optical remote sensing camera incorporates a high-accuracy time scaling function using a hardware-based second pulse that combines the satellite integer second time with the camera’s local clock count for precise calibration of the camera’s imaging time. The system achieves high-accuracy time synchronization performance through a count design from the same source and a high-accuracy local clock scheme. Theoretical analysis and practical tests verify the high-accuracy implementation of the camera’s time scale system. From the perspective of time synchronization accuracy of remote sensing satellites, the high accuracy of the optical remote sensing time scale is shown to meet the accuracy requirements for the geometric positioning of remote sensing images. The hardware delay of the time scale system of the camera subsystem ensures that the imaging time obtained through the calculation of remote sensing image auxiliary data closely matches the actual imaging time of the satellite in orbit.
Sep. 25, 2024Vol. 44 Issue 18 1828003 (2024)
Yali Ren, Yufeng Wang, Qing Guo, Zeping Sun, Jiamin Du, Huige Di, Yuehui Song, and Dengxin Hua
ObjectiveCurrently, there is a pressing for high temporal and spatial resolution atmospheric observation data in meteorological forecasting, meteorological services, climate change, atmospheric environment, and others. However, during daytime lidar detection, the solar background light is the most important interference noise, and the strong sky background light and ground radiance will pollute or even flood the lidar returns, and thus directly affects and greatly restricts the effective detection distance and detection accuracy. Mitigating the influence of strong solar background light remains the foremost challenge in achieving all-day lidar detection.MethodsDrawing upon the diffraction theory of photon sieves and leveraging the optical field properties of vortex lasers, we propose a photon sieve-based all-day lidar detection technique aimed at filtering out solar background light. Initially, using vector diffraction theory, we conduct numerical simulations to analyze the diffraction patterns of photon sieves under various incident beams including Gaussian, parallel, and vortex beams. Subsequently, based on the numerical simulation, we develop a photon sieve-based solar background light filtering technique for filtering solar background light and design an optical system dedicated to this purpose. This system facilitates absolute spatial separation between the atmospheric lidar returns and the solar background light in two independent channels. In addition, the signal-to-noise ratio curves of lidar are simulated under clear and cloudy weather conditions, to demonstrate the all-day performance of a photon sieve-based lidar system.Results and DiscussionsThe numerical simulations of the photon sieve present significant differences in the shape and position of focused spots for Gaussian, parallel, and vortex beams. While parallel and Gaussian beams exhibit similar focused spot shapes but differ in size (Fig. 2), vortex beams produce focused spots characterized by a dark center and a bright ring whose radius increases with the topological charge L (Fig. 3). Investigation into the diffraction patterns of mixed light (parallel and vortex) passing through the photon sieve shows that vortex and parallel beams with a topological charge of L=7 are focused o bright rings and centers with radii of 35 and 18 μm, respectively, and the absolute spatial separation of the parallel beam and the vortex light can be obtained theoretically (Fig. 4). Additionally, we present the design of a photon sieve-based solar background light filtering optical system featuring a core configuration of photon sieves and a plane reflector with a hole, enabling the extraction of pure lidar returns in the reflection channel (Fig. 6).ConclusionsTaking atmospheric water vapor as an example, we simulate the signal-to-noise ratio of water vapor detection under clear and cloudy weather conditions. The simulation results show that the photon sieve-based lidar system achieves a water vapor detection range that can reach up to 4 km during the daytime. By comparison, the detection range is less than 2 km due to the effect of the solar background light for the traditional lidar system. These findings validate the feasibility of the photon sieve-based all-day lidar detection technique and underscore its significant advantages in this regard. Our study provides a robust theoretical foundation and technical framework for advancing all-day lidar technology.
Sep. 25, 2024Vol. 44 Issue 18 1828004 (2024)
Zhipeng Xue, Jinquan Liu, Lei Zhang, Shanshan Cong, Chang Liu, Jianing Wang, and Shunfa Chen
ObjectiveThe internal orientation elements of a spaceborne camera are a key factor affecting the remote sensing accuracy, and precise calibration is required before the launch into orbit. During the imaging of a spaceborne camera in orbit, due to disturbances such as satellite temperature changes, deformation of optomechanical structures such as mirrors can occur to result in changes in internal orientation elements. However, there is currently little research on the analysis and testing techniques for on-orbit changes of orientation elements within spaceborne cameras. The optomechanical integration simulation technology has been widely applied to the performance analysis of spaceborne cameras, and some scholars have already applied it to the stability analysis of internal elements in cameras. Meanwhile, there is no research on the variation of internal orientation elements caused by temperature changes in camera calibration on the ground. Therefore, we study the change mechanism of internal orientation elements caused by optical component deformation, and provide optomechanical integration analysis and ground testing methods for evaluating the stability of internal orientation elements in orbit. Additionally, the accuracy of the proposed method by comparing simulation and experimental results is further demonstrated.MethodsWe propose a method for evaluating the stability of spaceborne cameras’ interior orientation elements, which includes integrated analysis and experiments. The finite element method is often adopted for thermal elastic analysis of optomechanical systems. The deformation of the finite element node after thermal elastic deformation will include both rigid displacement of the optical element and surface high-order deformation. The high-order deformation affects the surface shape accuracy of the mirror, while the rigid displacement will affect the line of sight. Firstly, based on the principle of the changes in the cameras’ internal orientation elements caused by the rigid body displacement of the mirrors, a mathematical model is built for the relationship between rigid body displacement and internal orientation elements. Then, the thermal elasticity analysis of the spaceborne camera is carried out by adopting the optomechanical thermal integrated analysis method, and the rigid body displacement under elastic deformation is extracted based on the best-fit method. Finally, in response to the testing requirements of internal orientation calibration under different temperatures, an experimental platform is established and the internal orientation elements are calibrated at different camera temperatures.Results and DiscussionsThe spaceborne camera undergoes thermal elastic deformation when the temperature rises by 3 ℃ (Fig. 4). Based on the best-fit method, the rigid body displacement of various optical surfaces caused by thermal elastic deformation is further extracted (Tables 1 and 2). The variation in internal orientation elements after rigid body displacement of optical components is obtained by optomechanical integration simulation analysis (Table 3). In the ground experiments, internal orientation element calibration on the spaceborne camera is performed at temperatures of 20, 23, and 26 ℃ respectively (Fig. 6), with the results of internal orientation elements recorded in Table 4 and statistical analysis of changes in internal orientation elements caused by temperature differences of 3 ℃ shown in Table 5. Results show that the error between the simulation and experimental results of the camera’s internal orientation elements at different temperatures is within 0.1 pixel (Tables 3 and 5), which verifies the proposed integrated analysis method and experimental technology. The change in internal orientation elements of the camera under a temperature change of 3 ℃ is less than 0.3 pixel, further demonstrating the camera’s sound stability.ConclusionsThe proposed simulation and experimental analysis methods can effectively evaluate the stability of the camera’s internal orientation elements in temperature conditions, thereby fully verifying the stability of the camera’s internal orientation elements during the design and ground testing stages. The analysis of the internal orientation elements in traditional cameras mainly relies on software analysis, and only simulates and tests the stability of the internal orientation elements, with a lack of ground test verification methods and verification of simulation accuracy. Our study is based on the mechanism of temperature-induced changes in internal orientation elements. It builds not only an integrated simulation platform, but also a calibration testing platform for the cameras’ internal orientation elements including camera temperature control. On the one hand, it provides a systematic verification method for subsequent scholars to carry out related studies via simulation and ground testing. On the other hand, the calculation accuracy of simulation compared to calibration experiments is obtained to provide support for simulation analysis technology. After simulation and experimentation, the stability of the internal orientation elements of the spaceborne camera in a uniform temperature field of 3 ℃ is within 0.3 pixel, indicating sound thermal stability. Additionally, the simulation and experimental results of optomechanical integration show that the calculation error of the variation in internal orientation elements is within 0.1 pixel, which proves that the proposed simulation and experimental method has sound analysis and measurement accuracy.
Sep. 25, 2024Vol. 44 Issue 18 1828005 (2024)
Yanqing Wang, Weifeng Du, Xunjiang Zheng, Xinpeng Li, He Jin, and Shuai Dong
ObjectiveAlthough large star sensors, both domestically and internationally, are capable of meeting the accuracy and reliability standards for measuring satellite platform attitude and orbit control, their mass, size, and cost far surpass the predetermined limits set for satellite missions. Conversely, micro star sensors at home and abroad fulfill the lightweight design requirements in terms of mass and size for satellite platforms, but they lack the necessary accuracy and reliability for precise attitude and orbit control measurements. With the constraints of cost and volume imposed by commercial satellites, coupled with the evolution of space technology and increasingly complex space missions, there is a growing emphasis on achieving higher accuracy, miniaturization, and cost-effectiveness in satellite platform systems. The future trajectory of start sensor development is oriented toward achieving both high precision and miniaturization. However, existing domestic and foreign star sensors fail to satisfy the demands for lightweight and high precision in satellite platform attitude control. Therefore, there arises a necessity for the development of star sensors that offer high accuracy, compact size, low cost, and reliable performance. The demand for high-precision terrain mapping and centimeter-level surface deformation detection necessitates that the resolution of the next generation of commercial remote sensing satellites surpasses 0.5 m. Nevertheless, due to budget and volume limitations, there exists a delicate balance between ensuring detection capability and minimizing volume size in the optical system’s aperture. While advancements have been made in enhancing the accuracy of microstar sensors, conventional methods employed for large star sensors are not directly applicable. Augmenting the aperture can enhance the luminous flux, with common approaches including narrowing the field of view, improving pixel angular resolution, and regulating the focal plane temperature of the refrigerator to mitigate detection noise. Therefore, it holds significant practical engineering value to identify the key characteristics influencing the star sensor accuracy, devise a rational optical detection system, optimize key detection parameters, improve software algorithms, and employ other methodologies to bolster accuracy.MethodsTo address the technical challenges outlined in the abovementioned engineering context, we initially present a comprehensive overview of the key parameter logic diagram that influences the accuracy of star sensors. The precision of star sensors primarily hinges on three main factors: the accuracy of single star positioning, the quantity of fixed attitude stars, and the significance of star points. Specifically, the precision of single star positioning is intricately linked to the calibration accuracy of angle measurement and detector parameters. Factors impacting angle measurement accuracy include pixel resolution and pixel subdivision precision, while calibration accuracy is influenced by optical system distortion, optical calibration procedures, calibration algorithms, and instrument precision. Detector parameters include exposure time, analog gain, digital gain, correlated double sampling value, and digital offset. The number of fixed attitude stars is correlated with the star library with key factors affecting the star library including the star catalog, sensitivity, field of view, optical system color temperature, wavelength, and quantum rate.We primarily focus on enhancing the accuracy of single star centroid positioning through detector parameter optimization. By carefully calibrating and fine-tuning key parameters such as exposure time, gain, correlated double sampling value, and offset, the detector’s responsiveness can be optimized, noise reduced, correlation double sampling improved, and fixed pattern noise (FPN) minimized. This leads to the elimination of pixel fragments in black, enhancing the imaging quality of star targets, and consequently elevating the accuracy of single star centroid extraction. The ultimate objective is to enhance single star measurement accuracy. Identifying the optimal register for each parameter and amalgamating them into a set of optimal parameters establishes a default parameter configuration for micro star sensors. Due to variances among detectors in batches, the detection parameters of each star sensor can be individually calibrated during subsequent development and production phases. Secondly, we delve into optimizing the selection of fixed attitude stars and attitude calculation based on the weighting of star points. Weight calculation for each star is contingent upon the magnitude of error in the star vector. During attitude calculation, fixed attitude stars are selected based on their respective weights, and they contribute to the optimal attitude solution. The QUEST algorithm is employed to evaluate the optimal state of spacecraft attitude calculation, effectively enhancing attitude accuracy in the backend attitude calculation process. Finally, the efficacy of the aforementioned methodology in enhancing the accuracy of the micro star sensor is validated through testing, involving adjustments to detector parameters and the dynamic weight algorithm.Results and DiscussionsWe undertake design and validation research on high-precision micro star sensors, aligning with the demands for higher precision and miniaturization put forth by the commercial aerospace sector. In accordance with the requirements for detection capability while considering constraints in both quality and sizes, sensitivity and aperture analyses are conducted. By carefully adjusting key parameters of the detector, such as analog gain, digital gain, exposure time, offset, and correlated double sampling, the accuracy of extracting the centroid of a single constant star point is enhanced, consequently improving the overall attitude solution accuracy of the star sensor. Following the optimization of detection parameters, the accuracy of the X-direction centroid positioning of the star sensor sees an improvement of 19.35%, while the accuracy of the Y-direction centroid positioning witnesses a remarkable improvement of 48.52%. To address the diverse errors inherent in various constant star vectors within the star sensor imaging model, a method involving the assignment of dynamic weights to each star vector is employed to improve the accuracy of star sensor attitude calculation. Following optimization utilizing the dynamic weight algorithm, the instantaneous error observed in ground observation experiments increases by 40.68% in the X direction and 25.76% in the Y direction. Moreover, the noise equivalent angle exhibits an increase of 46.27% in the X direction and 52.17% in the Y direction. Nevertheless, the total accuracy error of the star sensor witnesses an improvement, decreasing from 2.01″ on the X-axis and 2.07″ on the Y-axis to 1.08″ on the X-axis and 0.99″ on the Y-axis.ConclusionsThe logical guidance diagram for the key parameters of star sensor accuracy serves not only to enhance the accuracy design of micro star sensors but also to offer logical guidance and theoretical analysis for the accuracy design of space situational awareness sensors. In terms of the methods for analyzing detection capability, optimizing detection parameters, devising attitude solving algorithms, and conducting testing and validation to enhance the accuracy of star sensors, substantial improvements have been achieved compared to current domestic and foreign micro star sensors. These enhancements adequately fulfill the requirements of commercial satellites for high-resolution observation of star sensor attitude measurement accuracy. Furthermore, future advancements in star sensors and other space situational awareness sensors can be achieved by optimizing their detection capabilities, employing more advanced detectors, aligning corresponding optical systems and parameter configurations, and optimizing traditional star map recognition and attitude calculation methods. In addition, leveraging artificial intelligence algorithms on high-performance processing platforms can expedite the acquisition of attitude information, rendering it more precise and efficient.
Sep. 25, 2024Vol. 44 Issue 18 1828006 (2024)
Fan Feng, Yongsheng Zhang, Jin Zhang, Bing Liu, and Ying Yu
ObjectiveHyperspectral images record the reflectance of ground objects in hundreds of narrow bands, forming a unified three-dimensional data cube. Accurate hyperspectral image classification results exhibit a detailed distribution of ground objects, making it the cornerstone of many remote sensing applications. Recently, hyperspectral images with high spatial resolution have promoted the application of hyperspectral technology in various fine-grained tasks. Since hyperspectral images feature high nonlinearity, feature extraction serves as a key to accurate classification. Learning robust spatial-spectral features in real-world complex scenes with insufficient labeled samples has been a long-standing problem. We propose a self-supervised feature learning method for hyperspectral images based on mixed convolutional networks and contrastive learning. This method can make full use of abundant spatial-spectral information in hyperspectral images and automatically learn to extract features suitable for classification tasks in a self-supervised manner. We hope that our findings can help the study of small sample hyperspectral classification, and promote the generalization and practicability of deep learning methods in complex hyperspectral scenes.MethodsWe propose a self-supervised mixed feature fusion network, which is based on mixed convolutional networks and contrastive learning. Firstly, the dimensionality of hyperspectral images is reduced by a factor analysis (FA) algorithm, and the neighborhood information of image pixels is extracted to form image patches. Positive and negative sample pairs are then generated through random spatial and spectral augmentation. Secondly, an efficient cascade feature fusion encoder is constructed by 3D convolution layers and 2D depth-separable convolutional layers. Multi-scale spatial-spectral features are extracted and fine-grained embeddings are calculated by a second-order pooling (SOP) layer. By calculating the contrastive loss on the extracted features for positive and negative sample pairs, the encoder can be trained in a self-supervised manner. Finally, the trained encoder will be fine-tuned using few labeled samples, producing the classification results of hyperspectral images.Results and DiscussionsTo validate the proposed method, extensive experiments are conducted on four hyperspectral datasets with distinct spatial-spectral features, namely Indian Pines, Houston, Longkou, and Hanchuan. Indian Pines and Houston are conventional hyperspectral datasets for algorithm verification. Longkou and Hanchuan are recently released datasets that feature extremely high spatial resolution. The contrast methods include attention-based methods, transformer-based methods, and the contrastive learning method that have been proposed recently. Only five supervised samples from each type of ground object are utilized for fine-tuning, and the overall accuracy of the proposed method stands at 79.46%, 84.32%, 92.97%, and 82.31%, respectively, which outperform the above contrast methods (Tables 2-5). The classification maps of the four datasets also demonstrate fewer misclassifications of this method (Figs. 3-6). Targeted ablation experiments are carried out with the results confirming the efficacy of FA, SOP, and contrastive learning method designed in this paper (Table 6). Further experiments on contrastive learning-related settings reveal three key points. First, spatial and spectral enhancement is indispensable. Second, the batch normalization (BN) layer in the projection head plays a crucial role in contrastive learning. Third, the full-finetune approach is more suitable than the linear probe method in hyperspectral image classification tasks (Table 7). Additionally, operational efficiency has been considered and the proposed method can realize the balance between classification accuracy and operation efficiency (Table 8).ConclusionsWe propose a self-supervised classification framework for hyperspectral image classification based on mixed convolutional networks and contrastive learning. Our method combines self-supervised pretext task design and encoder design. The abundant spatial-spectral information of hyperspectral images can be systematically investigated and the features suitable for classification tasks can be extracted in a self-supervised manner. Firstly, spatial and spectral enhancement is used to add random perturbations to hyperspectral image patches, forming positive and negative sample pairs. Then, a mixed convolutional network-based encoder is utilized to extract multi-scale features. The mixed convolutional network consists of a cascade feature fusion structure and a SOP layer, which can extract robust fine-grained spatial-spectral features from disturbed sample pairs. Lastly, the contrastive loss is calculated using the extracted features, enabling the encoder parameters to be optimized in a self-supervised way. Experiments are carried out on four hyperspectral datasets with distinct differences in spatial-spectral features. The classification accuracy of the proposed method is superior to those of contrast methods, and the ablation experimental results show the effectiveness of FA, SOP, and the proposed contrastive learning method. In addition, this method is designed to reduce parameter redundancy and improve parameter utilization efficiency for a balance between operating efficiency and classification accuracy. We explore the combination of model design and self-supervised learning. In the future, we hope that the proposed method will be used in various hyperspectral datasets and it will be further improved for greater generalization ability.
Sep. 25, 2024Vol. 44 Issue 18 1828007 (2024)
Jianmin Xu, Feng Lu, lei Yang, Xiaohu Zhang, Yun Cao, Qisong Zhang, and Jian Shang
SignificanceGeosynchronous meteorological satellites, operating at an altitude of 35800 km above the equator, frequently capture images of the Earth disk. The successive image derives atmospheric motion vectors. They have been monitoring various weather systems continuously and are indispensable tools for precise weather forecasting. Our study shows image navigation and atmospheric motion vector algorithms for FY geosynchronous meteorological satellites.ProgressThe geosynchronous satellite takes Earth observation pixel by pixel. The observation pixels are assembled to form images. The image assembling contains two major components: image registration and image navigation. Image registration refers to the process of ensuring that each pixel within an image is correctly aligned with its nominal Earth location within a specified accuracy, which measures pointing stability. Image navigation involves determining the location of each pixel within an image in terms of Earth latitude and longitude, which measures absolute pointing accuracy. Both image registration and navigation are critical steps in image assembling, impacting all subsequent data processing procedures and product quality. Due to the satellite’s considerable distance from Earth, the accuracy of attitude determination significantly affects image navigation quality. Precise image navigation requires accurate measurement of the position and the attitude of the satellite at any observation time. The FY-2 satellite has a spin-stabilized attitude. The Earth position within the image is used to determine the attitude of the satellite. The time series of the satellite orientation relative to the centerline of the Earth disk provides information on the attitude parameter in the north-south direction. The angle between the sun and the Earth serves as a reference for aligning the Earth observation pixels position in the scan line together with the attitude parameter in the east-west direction. The solution to the image navigation model requires the parameters to be well-defined, measured, transformed, and applied within appropriate coordinate systems while maintaining correct astronomical relationships. The FY-4 satellite, on the other hand, is three-axis stabilized. The additional moving equipment causes uneven shifts of the satellite. Moreover, the satellite is heated at the side facing the sun which makes uneven temperature distribution in the spacecraft with diurnal variation. Both factors affect the orientation of the observation vectors. Thus, the operation of the image registration and navigation for FY-4 rely on the interactions between the satellite and the ground system more closely. The star positions are used to determine the attitude of the satellite. Using previous observation, the ground system estimates future positions of the stars and possible observation vector orientation errors caused by uneven heating. Those parameters are transmitted to the satellite, which then adjusts its attitude to maintain stability and compensate for observation vector deviations. Tracing clouds and other features in the successive images provides an estimation of the scene’s displacements, which represent atmospheric motion vectors. The height of the wind vector is determined with a physical method. For opaque clouds, the infrared window brightness temperature reflects the upwelling radiation energy from the cloud. The cloud level is identified at the height where the feature brightness temperature fits the forecast model temperature. For semi-transparent clouds, a part of the energy is from the cloud, the other part is from the background under the cloud. Since the semi-transparent status is only related to cloud density, not related to the observation wavelengths. In the cloudy region, there is a linear relationship between observations from the window and absorption channels. By using observations from both the window and absorption channels, the portions of upwelling radiation energy from the cloud and from the background are well estimated. This approach needs the locations of both the cloudy and the cloud-free pixels, and the upwelling energy from those locations. Based on the moving status of the pixels during the feature tracing stage, the cloudy and the cloud-free pixels are well separated. The upwelling radiation energy from the under cloud background is estimated with data from the nearest cloud-free pixels. This algorithm provides a more accurate estimation of semi-transparent cloud heights.Conclusions and ProspectsBy using algorithms introduced in our study achieve more accurate observation, navigation, and wind derivation. For both FY-2 and FY-4, all the parameters are produced automatically and routinely without any manual operation. The accuracy of image navigation reaches pixel level. The image navigation accuracy approaches pixel level. The accuracy and distribution of the atmospheric vectors are also improved. Meteorological satellite data processing involves a long chain including many steps simulating the radiation transmission process from the observation objective to the sensor. A deep understanding and the precise expression of the real situation in the data processing algorithm ensure better product quality.
Sep. 25, 2024Vol. 44 Issue 18 1800001 (2024)
Jun Li, Jing Zheng, Min Min, Bo Li, Yunheng Xue, Yayu Ma, Han Lin, Suling Ren, Ning Niu, Ling Gao, Yan’an Liu, Lizhi Wang, and Zechun Li
SignificanceSevere local storms, hail, squall lines, and tornadoes significantly affect daily life, social activities, and economic development. Despite their importance, understanding the mechanisms of severe storms and improving their forecasts remains a challenging task. Nowcasting focuses on high-impact weather (HIW) events that develop rapidly and have short durations. After half a century of development, Fengyun meteorological satellites have become a crucial component of the global observation network. They provide essential data for monitoring severe weather, generating early warnings, and contributing to numerical weather forecasting, climate projections, environmental assessments, and predictive analyses. Notably, in the past decade, the advent of the new generation of Fengyun satellites has brought quantitative products to the forefront of operational use. We review the latest advances in the applications of Fengyun meteorological satellites in short-term weather nowcasting and highlight the principal scientific and technical challenges that future research endeavors need to address.ProgressChina has actively utilized the new generation Fengyun meteorological satellite data to improve near real-time (NRT) forecasting and nowcasting capabilities. The China Meteorological Administration (CMA) assimilates these observation data into numerical weather prediction (NWP) models to enhance short-range and middle-range weather forecasts. In addition, the National Satellite Meteorological Center (NSMC) of the CMA processes these data to produce and distribute quantitative information on the atmosphere, clouds, and precipitation. These quantitative products, delivered to users on time through advanced communication and data distribution technologies, are crucial for NRT nowcasting applications and have played a significant role in monitoring and early warning of HIW events. Besides operational Fengyun satellite products, progress has been made in developing new products and prediction models for 0-6 h forecasts, particularly using data from the Fengyun-4 series.1 New Products and Applications1) Radar composite reflectivity estimation (RCRE). Ground-based weather radar observations are commonly used to track convective storms; however, the radar network’s coverage is limited, especially in mountainous and marine areas. Fengyun-4 satellites provide extensive coverage and NRT observations, compensating for radar’s limitations. Since the physical properties of clouds can be reflected in both ground-based radar and satellite observations, a connection exists between the two. Using deep learning methods, Yang et al. developed the radar composite reflectivity estimation (RCRE) using Fengyun-4A AGRI observations. Independent validation indicates that RCRE accurately reproduces radar echoes’ position, shape, and intensity. This RCRE product is operationally used by the National Meteorological Center (NMC) and provides synthetic radar data for nowcasting applications where ground-based radar is unavailable.2) Automatic recognition of convection clouds. Monitoring convective clouds from satellites is vital for nowcasting. Traditional techniques rely on thresholds, such as using the 240-258 K range to identify convective clouds from 11 μm brightness temperature images. For rapidly changing convective systems, these methods are often regional, seasonal, and weather-dependent. To address this, the K-means clustering method is used to analyze cloud types over China from AGRI infrared band brightness temperature measurements. This method enables users to select regions of interest and automatically identify convective systems and other cloud types in NRT, improving quantitative precipitation estimation (QPE) from satellite IR data. For instance, this product can enhance convective cloud precipitation estimation and provide valuable information on convection coverage and intensity, especially in areas without radar observations. Figure 1 shows the automatic identification of convective clouds based on Fengyun-4A on July 30, 2023. Due to the northward influence of the typhoon’s peripheral cloud system, the northern and central parts of Shanxi, Hebei, Beijing, and Tianjin are completely covered by large areas of convective clouds, with maximum hourly precipitation exceeding 40 mm/h. The convective clouds correspond well with the radar observations [Fig. 1(b)].3) Cloud-base height. The cloud top height (CTH) product is well-established and widely used, while cloud base height (CBH) is challenging to obtain due to weak signals in passive remote sensing observations. However, CBH is crucial for understanding vertical atmospheric motion, aviation safety, and weather analysis. The physical method for retrieving CBH involves converting cloud optical thickness into physical thickness and subtracting it from CTH. The uncertainty of optical thickness is the main error source for CBH retrieval using the physical method. To overcome this limitation, a machine learning model trained on satellite-based lidar (CALIOP from CALIPSO satellite) observations, which has good accuracy but limited coverage, has been used to derive CBH by combining NWP products and Fengyun-4 AGRI observations as input. This algorithm provides a CBH product with the same coverage as CTH (AGRI full disk). Independent validation shows an overall root mean square error (RMSE) of 1.87 km. This CBH product, along with the traditional CTH product, offers valuable information on cloud structure and physical thickness, enhancing nowcasting applications.2 Prediction Models Using Fengyun - 4 Data for Nowcasting1) Storm-warning in pre-convection environment. Severe local storms typically have three stages: pre-convection, initiation, and development. Identifying the pre-convection environment is crucial for nowcasting and providing warnings before radar observations. By integrating high spatiotemporal resolution AGRI observations from the Fengyun-4 series with CMA NWP products, key factors in the pre-convection environment can be analyzed. Li et al. developed the storm warning in the pre-convection environment version 2.0 (SWIPE2.0) model for China and surrounding areas using machine learning techniques. This model identifies potential convective systems and classifies cloud clusters into strong, medium, or weak convection. SWIPE2.0 predicts storm occurrence and intensity 0-2 h ahead of radar observations and is used in NRT applications by the NMC/CMA. For example, the SWIPE2.0 model issued a severe convective warning for a cloud mass located in the western part of Gansu province at 14:30 on July 10, 2023 (Beijing time). At that time, the ground-based radar reflectivity of about 20 dBz or lower is mainly near the provincial boundary, while the satellite warning signals did not correspond to ground-based radar signals, indicating that precipitation had not yet occurred. At 14:34, the red severe convective warning signal still existed, and its range expanded slightly to the southeast. As the cloud developed and moved towards the southeast, it produced precipitation greater than 1 mm/h between 15:00 and 16:00, with some local areas experiencing rainfall exceeding 5 mm/h. SWIPE2.0 provides early warnings for local convection before ground-based radar observations.2) Satellite image extrapolation. Similar to radar extrapolation, satellite image extrapolation is essential for short-term forecasting and applications such as solar photovoltaic power generation. The rapid advancement of artificial intelligence has led to the adoption of data-driven machine learning methods in satellite image extrapolation. Xia et al. developed an hourly cloud cover prediction algorithm using high spatiotemporal resolution geostationary satellite images. This model predicts cloud images for the next 0-4 h and estimates cloud cover over photovoltaic stations. Independent validation shows reliable and stable performance in the first two hours, with an average correlation coefficient of nearly 0.9 between predicted and observed cloud cover. Compared to previous methods of only being able to perform 10-30 min of extrapolation, the new approach greatly improves accuracy and forecasting time, making it valuable for regional short-term warnings.Conclusions and ProspectsAs a key member of the global observing system, the Fengyun meteorological satellite system has significantly enhanced observation capabilities, short-term monitoring, and early warning. However, challenges remain in applying Fengyun satellite data for nowcasting, particularly in achieving low latency and high-quality products with high spatiotemporal resolution. With ongoing advancements in Fengyun satellite technology, quantitative nowcasting applications are entering a new era. The future direction involves combining Fengyun satellite quantitative products, NWP products, ground-based measurements including radar, and other multi-source data with artificial intelligence to improve the identification, monitoring, and early warning of severe weather events.
Sep. 25, 2024Vol. 44 Issue 18 1800002 (2024)
Chao Liu, Jing Li, Bo Li, Yuxin Song, Ran Xu, Shiweng Teng, Zhonghui Tan, and Xiuqing Hu
SignificanceAs the main sensor of China’s Fengyun series meteorological satellites, spectral imagers are indispensable for observing the characteristics of atmosphere, surface and ocean, and play an important role in weather prediction and climate research due to their high sensitivity and high spatio-temporal resolution. Meanwhile, as a major participant in the energy budget and water cycle of the earth-air system, the cloud is closely related to radiation transmission, weather processes, and climate change. Since its retrieval results are significant for weather analysis, numerical prediction, and disaster warning, the cloud is a main spectral imager detection target. Meanwhile, Fengyun series meteorological satellites are in the rapid development stage. We show the main spectral sensors, the number of channels, and the spatial resolution (Table 1). The spectral response functions of AGRI, MERSI-II, and VIRR cloud sensitive channels in the wavelength range of 0.2‒1.8 μm and 2‒13 μm are presented (Figs. 1 and 2).ProgressThe main cloud characteristics include cloud detection, cloud thermodynamic phase, cloud top parameters (cloud top pressure, cloud top height, and cloud top temperature), cloud optical thickness, cloud effective particle radius, and cloud water path. The flow chart of the above cloud products generated by the satellite is given in Fig. 3. As the basis of cloud detection is that clouds have high reflectance and low brightness temperature in the visible and near infrared bands, classifying the radiation received by the passive sensor can help identify whether the pixels are cloudy or clear. Chinese scholars have proposed various threshold-based cloud detection algorithms for different sensors, geographical locations, and underlying surface types of Fengyun series satellites. With the improvement of cloud detection accuracy requirements, algorithms have gradually developed from fixed threshold to dynamic threshold, multi-feature combination threshold, and multi-spectral combination threshold. FY-4/AGRI employs observation of 0.65, 1.65, 3.78, 11.8, and 12 µm channels and various auxiliary data to obtain cloud detection products according to different spectral and spatial characteristics of clouds and clear sky conditions. Compared with MODIS cloud detection products, the accuracy of FY-4/AGRI operational cloud detection products is more than 88%. Cloud thermodynamic phase is generally divided into four categories, i.e., ice, liquid, mixed, and uncertain types. Cloud particles have different radiation characteristics for specific wavelength electromagnetic waves. The universal bispectral cloud thermodynamic phase retrieval algorithm is based on the brightness temperature of 11 μm channel and the brightness temperature difference between 8.5 and 11 μm channels. The FY-4/AGRI cloud thermodynamic phase retrieval algorithm constructs the cloud effective absorption optical thickness ratio (β ratio) based on the different radiation characteristics of water cloud and ice cloud at the infrared band. The β ratio of 8.5 and 11 μm channels is not affected by the observed radiation, cloud height, and cloud optical thickness, and the algorithm has the advantage of retrieving cloud thermodynamic phase. The cloud thermodynamic phase products of FY-4A/AGRI, FY-4B/AGRI, and Himawari-9/AHI at 05:00 UTC on January 1, 2024 are shown. The cloud thermodynamic phase of the three is generally consistent in spatial distribution, but there are some differences in cloud coverage (Fig. 5). The cloud top pressure, height, and temperature can be retrieved according to the different radiation characteristics of clouds with various heights at different channels. At present, the operational cloud top parameter retrieval algorithms mostly employ infrared split-window channels or CO2 slicing channels. The FY-4/AGRI retrieval algorithm adopts two infrared window channels (10.8 and 12 µm) and one CO2 absorption channel (13.3 µm). Additionally, the advantages of the infrared window channel sensitive to cloud microphysical characteristics and the CO2 absorption channel sensitive to cloud height are combined. By conducting an iterative calculation of optimal estimation, the cloud top characteristics are obtained. Cloud top height and cloud top temperature products from FY-4A/AGRI, FY-4B/AGRI and Himawari-9/AHI are displayed, all of which show consistent spatial distribution characteristics, but the retrieval results of AGRI in some regions are invalid (Figs. 6 and 7). Given the current situation of Fengyun’s cloud optical thickness and effective particle radius retrieval, we conduct model development, database establishment, and system optimization for the cloud optical thickness and effective particle radius retrieval of FY-4/AGRI based on the classical double reflection channel algorithm. The algorithm employs a non-absorption channel sensitive to cloud optical thickness (0.87 μm) and an absorption channel sensitive to both cloud optical thickness and effective particle radius (2.25 μm). Meanwhile, it can simultaneously retrieve the daytime cloud optical thickness and effective particle radius. Rigorous forward radiative transfer in retrieval algorithms requires a large amount of calculation. To meet the requirements of satellite operational application, the algorithm pre-constructs a double-channel reflectivity lookup table to simplify the calculation of radiative transfer and adopts the optimal estimation method to realize the retrieval on the premise of ensuring accuracy. The retrieval results of AGRI and the operational Himawari-8/AHI cloud products are shown. Generally, the spatial distributions of the cloud optical thickness and effective particle radius are consistent. There are systematic differences in the cloud optical thickness and effective particle radius results between AGRI and AHI, and the possible reasons are the differences in calibration accuracy, observation geometry, and retrieval algorithms (Fig. 9). We are optimizing the algorithm for FY-4 and making targeted improvements to the MERSI on FY-3.Conclusions and ProspectsWe review the recent progress in cloud detection, cloud thermodynamic phase, and cloud top parameter retrieval by passive spectral imagers of Fengyun satellite, and introduce the retrieval algorithms of cloud optical thickness and effective particle radius developed by our research group. In general, with the continuous improvement of the spatio-temporal resolution of spectral imagers and the calibration accuracy of Fengyun satellites, more advanced and reliable cloud characteristic retrieval algorithms are needed to meet the requirements of weather monitoring and climate change research.
Sep. 25, 2024Vol. 44 Issue 18 1800003 (2024)
Songhua Wu, Guangyao Dai, Wenrui Long, Kangwen Sun, Xiaochun Zhai, Na Xu, Jian Shang, Xiuqing Hu, and Peng Zhang
SignificanceAccurately measuring wind field is crucial for understanding the atmospheric dynamics, as well as the exchange and balance of heat, momentum, and matter in the atmosphere. According to the World Meteorological Organization (WMO), global observation of the three-dimensional (3D) wind field is pivotal for enhancing numerical prediction accuracy. Due to the absence of aeronautical data, meteorological observation and forecasting capabilities are notably deficient in sparsely populated areas, the southern hemisphere, polar regions, and vast oceans. Spaceborne wind measurement lidar technology has emerged as a promising solution endorsed by the WMO, offering continuous, high-accuracy vertical profile observations of the global wind field. Numerous countries are actively engaged in demonstrating and developing spaceborne lidar technology. In 2018, the European Space Agency launched the Aeolus. The data analysis and numerical weather prediction assimilation assessment of the Doppler wind measurement lidar in orbit for four years and eight months showed that the technological maturity of wind measurement lidar and prospective capacity for model application reach the best expectations. This has garnered extensive attention in the fields of meteorology and remote sensing worldwide. Spaceborne Doppler wind lidar has become an important instrument for observing the vertical profile of the global wind field, with the successful operation of Aeolus. Despite the success of Aeolus, projects by NASA, JAXA, and other agencies have faced challenges, limiting progress to simulation demonstrations or airborne tests due to technical complexities and financial constraints. As part of China’s next-generation polar-orbiting meteorological satellite plan, FY-5 lists active wind measurement lidar as one of the new payloads to be developed on a priority basis. This technological programme will effectively promote the high-quality development of China’s meteorological services and is of great significance for strengthening global monitoring, global forecasting, and global service system building. As a precision active optical remote sensing payload, spaceborne Doppler lidar is a complex system with a lengthy research and development cycle, a substantial amount of engineering work, and a significant investment. Therefore, developing institutional demonstration models and performance simulations for spaceborne Doppler lidar is crucial to meet the stringent accuracy and resolution demands of numerical weather prediction.ProgressThe spaceborne hybrid wind lidar integrates direct and coherent detection techniques, to achieve high-resolution global wind field observations. Direct detection, suitable for the middle to upper troposphere and lower stratosphere, utilizes molecular scattering, while coherent detection targets the lower troposphere and atmospheric boundary layer. The incoherent detection module operates at 355 nm and uses the dual-edge detection technique based on Fabry-Perot etalon. The coherent detection module uses a heterodyne detection technique operating at 1064 nm. We present a simulation model for wind measurement lidar that realizes gridded atmospheric parameters, scanning observation, and forward-inversion simulation. A method for detecting horizontal wind fields based on dual-beam observation is developed to ensure the response of the lidar for wind speed detection in both longitudinal and latitudinal directions. Our simulation analyses highlight that in the atmospheric boundary layer with high aerosol concentrations, wind speed observation errors are less than 0.8 m/s, whereas in clear skies with thin aerosol layers, errors are approximately 1.5 m/s. The single-satellite dual-beam scanning mode effectively meets satellite observation requirements for global wind vector detection by combining coherent and direct detection methods.Conclusions and ProspectsThe spaceborne hybrid wind lidar leverages dual-beam detection to maximize observational benefits, achieving high-resolution global wind field detection and single-star wind vector capability. We offer parameter recommendations based on current domestic space payload trends and technical maturity, aiming to meet the spatial and temporal resolution requirements essential for assimilating numerical weather prediction data. The complex system design and error analysis underscore the importance of payload performance, atmospheric characteristics, satellite parameters, orbit settings, and scanning methodologies in on-orbit observations. Future simulation experiments will further enhance scientific exploration mission objectives, enabling comprehensive studies of the spaceborne wind measurement lidar’s global observational capabilities.
Sep. 25, 2024Vol. 44 Issue 18 1800004 (2024)
Xiaobing Zheng, Xin Li, Xiuqing Hu, Wei Wei, Ling Sun, Dong Huang, Na Xu, Fuxiang Guo, Quan Zhang, and Enchao Liu
SignificanceRadiometric calibration plays a key role in quantifying the responsivity of remote sensors, correcting on-orbit response decay, and verifying the accuracy of data products for Fengyun meteorological satellites. An independent and complete technical system of calibration consists of laboratory calibration before the launch, on-board calibration, and site calibration during on-orbit operation. Pre-launch laboratory calibration coefficients are generally not suitable for operational data processing due to sensor on-orbit degradation. On-board calibration and site calibration are the main data quantification methods during on-orbit operation. On-board calibration requires the co-design of software and hardware of calibrators and remote sensors, which requires the support of valuable on-board resources, and the technical iteration is relatively cautious. Before solving the problem of space radiation benchmarks traceable to the international unit (SI), the performance decay of the on-board calibrator mainly limits the accuracy and stability. Site vicarious calibration realizes system-level calibration under the on-orbit operation of remote sensors. Meanwhile, its technical upgrade does not affect the operation of the remote sensors, and the calibration facilities can obtain the calibration support of the metrology laboratory. Site calibration has maintained technical evolution for more than 20 years and provides the most reliable calibration results at present. The site calibration implementation significantly depends on the measurement ability of spectral radiation characteristics of the atmosphere, surfaces, and surrounding environment. Additionally, the performance of site calibration instruments directly affects the application effect of site calibration. Before 2015, site calibration was implemented by manually performing instruments in field measurements. To obtain at least three rounds of qualified data in suitable weather and satellite overview conditions, site calibration generally needs to last for 10-30 days. Generally, manual calibration can only be implemented once a year in summer and autumn, and the update frequency of the calibration coefficient is difficult to reflect the actual state of the on-orbit sensors in time. Site calibration via large-scale manual observation can no longer meet the development requirement of multi-satellite constellation, high-efficiency observation, and long-term stable data accuracy of meteorological satellites. The development and applications of the ground calibration platform with automatic operation and site calibration networks, as well as real-time sharing of calibration data, are urgent requirements for improving calibration frequency to correct the sensor decay in time and ensure the data quality.ProgressIn the past ten years, many institutions in China have independently developed visible thermal infrared field calibration instruments, established laboratory testing and calibration facilities for the instruments, and obtained CNAS and CMA certifications. These field instruments significantly improve the high-precision traceability, reliability, and long-term stability in the solar reflection band. Compared with the R&D and application capabilities of the instrument in the early stage, the progress in site calibration instruments in the past 10 years is mainly reflected in the following aspects: 1) manual operation is upgraded to unattended automatic operation to improve data repeatability; 2) multi-channel and hyperspectral observation capabilities are equipped to improve the completeness of on-orbit fine spectral calibration parameters; 3) key weather-resistance technology is developed to adapt to complex working environments in the field to improve the long-term stability and reliability of data; 4) site self-calibration integration is realized to achieve timely SI traceability and decay correction to maintain long-time observation accuracy; 5) software and hardware are collaboratively developed to achieve more convenient data processing, analysis and sharing. On-orbit degradation of the remote sensors is continuous. Practical site calibration experiences in the past 20 years show that a few calibration sites are insufficient to monitor and correct on-orbit decay or update calibration coefficients in time. Technically, calibration sites and instruments are not the only calibration data sources. Upgrading and maintaining a large number of sites equipped with high-performance observation instruments is hardly sustainable for long-term operation. A moderate number of equipped sites can be employed as benchmark sites, with focusing on continuous upgrading of high-precision instruments and maintaining reliable traceability to national metrology standards. With the continuous performance improvement in satellite sensors and calibration capability of the benchmark sites, satellite sensors calibrated by the benchmark sites can continuously obtain quantitative and high-quality observation data of the global surface and atmosphere. Mining the data will screen and massively increase the number of global calibration sites. Exploitation and applications of calibration data sources mark important progress in site calibration technology in the past decade. According to the calibration site requirements, a screening algorithm is developed to select hundreds of calibration sites around the world suitable for on-orbit radiometric calibration. Meanwhile, a calibration site network with different geographical locations, altitudes, spectral characteristics, and radiation dynamic ranges is constructed. The global calibration site network is integrated into the radiometric calibration software, which mainly includes the site database and automatic planning module of calibration tasks. Site databases manage site basic information, surfaces and atmospheric characteristics, and satellite sensor information. Additionally, data is evaluated, graded, and updated according to the application effect to continuously improve quantity, quality, timeliness, and reliability. Based on remote sensor orbits, imaging mechanisms, bands, and spatial and spectral resolutions, the calibration task module automatically selects and quickly matches the site type, geographical location, spatial uniformity, satellite observation and sunlight illumination angle, dynamic range, site scale, and atmospheric conditions, and determines the best calibration time according to the real-time meteorological data. The global calibration site network realizes the long-time series absolute radiometric calibration of sensors such as FY-3B, and quantifies the continuous on-orbit response changes. High-frequency calibration significantly reduces data diversity by only one site. The annual average change rate of the calibration coefficient obtained by linear fitting reveals the degradation trend of the remote sensor more accurately, which provides credible basic data for diagnosing the working state and correcting the decay of satellite sensors. Global calibration sites provide a wide dynamic range of surface reflectivity and facilitate nonlinearity characterization of remote sensors. For example, FY-3C MERSI nonlinear response correction significantly reduces the influence of nonlinearity on data accuracy. Historical data of FY-3A/B/C MERSI is recalibrated by employing the global calibration sites. Inconsistency correction of each remote sensor generates long-term data series obtained by the three remote sensors at a common radiometric scale.Conclusions and ProgressThe most significant progress in site calibration technology in the past decade is reflected in the following two aspects. The R&D and applications of automated site instruments have solved key techniques such as site calibration, field weather resistance, and remote wireless measurement and control, and have the calibration ability with high timeliness and long-term sequences. Site calibration frequency has been increased from about once a year to more than once a week, only limited by weather conditions. Automatic operation of instruments greatly reduces the manual measurement workload and systematic error introduced by the operation level difference of different personnel and significantly reduces the operation cost. The exploitation and in-depth applications of calibration data sources have increased hundreds of calibration sites with favorable natural conditions and annual stability around the world, with a wide range of geographical distribution, surface radiation characteristics, and atmospheric transmission characteristics. The global calibration site network has increased the calibration data amount by magnitude, which has improved the data traceability of site calibration and made it possible to recalibrate historical data. The merging of equipped benchmark sites and the global digital site network can meet the needs of high-precision absolute calibration and high-frequency decay correction, which embodies a new technological approach of “integration of calibration means and calibration objects, and unification of observation and calibration processes”. The benchmark sites, digital global site network, space radiation benchmark, and new technologies such as high-altitude calibration sites, nighttime calibration, big data and machine learning calibration technology, and space radiometric benchmarks, are expected to build a new generation of calibration technology system for meteorological satellites to meet the requirements of continuously improving the accuracy and stability of data products.
Sep. 25, 2024Vol. 44 Issue 18 1800005 (2024)
Chuyao Luo, Xu Huang, Jiazheng Li, Xutao Li, and Yunming Ye
SignificanceThe field of meteorological satellite data processing is advancing rapidly, propelled by substantial developments in remote sensing technologies and the enhanced capabilities of modern satellites. The Fengyun satellite series, initiated by China in 1977, exemplifies this progress. Four generations of Fengyun satellites are operational, comprising two polar-orbiting satellites (Fengyun-1 and Fengyun-3) and two geostationary satellites (Fengyun-2 and Fengyun-4). These satellites demonstrate substantial technological advancements and offer comprehensive observational capabilities through sophisticated satellite networking.Fengyun satellites have various optical remote sensing instruments that capture data across multiple spectral bands, ranging from ultraviolet to infrared. Instruments like the moderate resolution spectral imager-II on Fengyun-3D provide enhanced infrared detection capabilities with multiple channels, facilitating detailed surface cover classification, landform feature identification, and observing atmospheric, surface, and ocean characteristics. Consequently, these satellites deliver invaluable data for weather prediction, climate research, vegetation monitoring, land use classification, and atmospheric studies.However, the exponential growth in data volume presents substantial challenges to traditional data processing methods. Increased number of satellite, enhanced sensor capabilities, and improved temporal and spatial resolution drive this data explosion. From the launch of Fengyun-1A in 1988 to Fengyun-3F in 2023, the series has generated a vast amount of historical and real-time data, necessitating the development of efficient and accurate analysis methods.ProgressArtificial intelligence (AI) methods have become increasingly prominent in addressing the challenges of processing large-scale satellite datasets. Traditional data processing techniques typically involve complex workflows and rely heavily on expert knowledge, making them unsuitable for managing the vast amounts of data modern satellites generate. In contrast, AI methods utilize sophisticated algorithms and computational models for efficient and precise data analysis. Among the AI technologies, machine learning and deep learning techniques have shown immense potential in various satellite data processing tasks.AI technology has demonstrated remarkable advantages in intelligent self-calibration, particularly in radiometric correction. Conventional radiometric correction methods often require intricate models and manual intervention. However, deep learning-based intelligent self-calibration methods can automatically learn the radiometric discrepancies between sensors and platforms. By leveraging extensive training data, these models can identify and correct radiometric biases in satellite sensors, resulting in consistent and reliable remote sensing data, as evidenced by the results shown in Table 1. This enhancement improves data quality and reduces dependency on manual operations, providing a solid foundation for subsequent remote sensing applications.Traditional methods for cloud detection often rely on spectral features and threshold techniques, which frequently show limitations under complex cloud structures and surface conditions. Deep learning models, particularly those specifically trained to distinguish between cloud and non-cloud regions, as illustrated in Fig. 5, offer a precise interpretation of satellite imagery, substantially enhancing the cloud detection accuracy. This advancement is crucial for weather prediction, climate change research, and other cloud-related applications.For cloud motion extrapolation, AI methods leverage recurrent neural networks and long short-term memory networks to predict future cloud movements based on historical data. Generative adversarial networks have also demonstrated strong performance in cloud motion studies, as shown in Fig. 6. Compared with traditional approaches, deep learning models more effectively capture the spatiotemporal patterns of cloud motion, improving the accuracy of cloud image predictions and offering reliable support for short-term weather predictions and severe convective weather warnings.In precipitation inversion, the integration of physical and data-driven models, has driven substantial advancements in the field. Convolutional neural networks and vision transformer (ViT) excel at enhancing inversion accuracy, as shown in Fig. 8. They adeptly handle complex precipitation patterns and provide crucial data support for meteorological research and environmental monitoring. This integration improves the precision of precipitation distribution predictions.AI models also show excellent potential in sea ice detection. By integrating multi-source data, deep learning models enhance the accuracy and reliability of sea ice detection, as illustrated in Table 4. These models can identify the presence of sea ice and estimate its thickness and coverage area, providing critical data support for climate research and marine environmental monitoring.The advantages of AI methods include end-to-end processing, reduced reliance on expert knowledge, and enhanced generalization capabilities. Using vast historical datasets and advanced computational power, AI models autonomously learn latent patterns within the data, enabling accurate predictions and analyses.Conclusions and ProspectsIntegrating AI technologies into satellite big data mining is ushering in a new era of efficient and accurate data processing. As AI methods continue to evolve, they will play an increasingly crucial role in satellite applications, enhancing the extraction of meaningful insights from the vast datasets. The future of satellite data processing lies in developing real-time, globally shared systems that fully leverage AI’s potential.Despite these advancements, various challenges remain in the widespread adoption of AI in satellite remote sensing. Model interpretability, data quality, and computational demands must be addressed to ensure reliable and practical application of AI. Additionally, interdisciplinary collaboration among remote sensing experts, computer scientists, and domain specialists is essential for developing robust AI models tailored to specific satellite applications.As AI technologies advance, they promise to revolutionize satellite data processing and enable more accurate and timely insights into our planet’s complex systems and phenomena.
Sep. 25, 2024Vol. 44 Issue 18 1800006 (2024)
Xin Ye, Wei Fang, Xiuqing Hu, Yachao Zhang, Xiaolong Yi, Bo Li, Nan Xu, Jia Quan, De Sun, Ling Wang, Hongzhao Tang, and Lijia Gui
SignificanceUp to now, dozens of series of satellites, such as China’s Fengyun Meteorological Satellites, Europe’s Geostationary Operational Environmental Satellites (GOES), and the USA’s European Meteorological Satellite (METEOSAT), have been launched to provide real-time remote sensing data globally. Often, it is necessary to utilize remote sensing data from various sensors on multiple satellite platforms to study long-term change trends due to the limited functionality and lifespan of a single satellite. Therefore, enhancing the on-orbit radiometric calibration accuracy of remote sensing devices is crucial for facilitating mutual comparison of measurement data from different sensors. It is essential to trace the radiometric scale of remote sensors back to the international system of units (SI) and maintain long-term stability. The radiometric calibration of multispectral or hyperspectral remote sensing payloads still relies on lamp-board or solar diffuser, which cannot be traced to SI on-orbit due to the influence of the launch process and long-term attenuation. The Moderate Resolution Imaging Spectrometer (MODIS), multi-angle imaging spectrometer (MISR) and ocean wide field scanner (SeaWiFS) have made significant efforts in on-orbit radiometric calibration. However, MODIS achieves a reflectance uncertainty of 2%, which is the minimum among them. Moreover, there is no comparability of observation data from different countries, different series within the same country, and even different satellites within the same series, since the satellite payload radiometric calibration system cannot trace to the radiometric benchmark on orbit. For example, there is a 10% deviation between the radiometric remote sensing data of MODIS and MISR. Currently, there is a 0.3% deviation among the total solar irradiance observed by multiple payloads, making it difficult to describe the periodic solar change of 0.1% over a decade, which highlights the technical challenge of high-precision space absolute radiation measurement.ProgressThe establishment of a space radiation measurement benchmark traceable to the SI is one of the hot issues in international research. Currently, scientists from China, Europe, and the United States are making efforts to establish the benchmark of space radiation measurement. However, there exists a huge technical challenge to apply ground metrology means to space since cutting-edge technologies such as the Cryogenic Absolute Radiometer and phase-change blackbody will make the calibration system cost more than the payload itself. Therefore, it is not economically feasible to equip an expensive calibration system for each payload. In 2006, a Chinese expert group on earth observation and navigation with the National High-Tech R&D Program proposed the concept of Chinese Space-based Radiometric Benchmark (CSRB). The CSRB project has been under development since 2014. The goal of the CSRB project is to launch a radiometric benchmark satellite to completely solve the radiometric traceability problem of remote sensing satellites by adopting a new in-orbit calibration system instead of using solar diffusers, standard lamps, vicarious calibration methods, and ground-based calibration techniques. The National Physical Laboratory (NPL) proposed the Traceable Radiometry Underpinning Terrestrial-and Helio-Studies (TRUTHS) project in 2003, serving as an “international standard laboratory” in space. This project conducts absolute radiation measurement of the 0.4-2.35 μm solar reflected waveband and takes the measurement value as the reference standard to establish a radiometric calibration system traced back to SI, providing a reference benchmark for the space optical remote sensing instruments of other satellite platforms. The National Aeronautics and Space Administration (NASA) proposed the Climate Absolute Radiation and Refraction Observation Platform (CLARREO) project in 2007 to develop solar and Earth radiation measurement instruments in three phases. The CSRB coincides with the TRUTHS proposed by Europe and the CLARREO proposed by the United States to solve the radiometric observation traceability problem of remote sensing satellites thoroughly. The space cryogenic absolute radiometer is an electric alternative radiometer working in the 20 K temperature zone, mainly used for high-precision measurement of in-orbit optical power. Currently, the development of the core detector of the space cryogenic absolute radiometer has been completed, measuring an absorption ratio of 0.999981. At the three angles of 0°, 90°, and 180°, the standard deviation of the absorption ratio of the black cavity in ±2 mm is less than 0.0003%, and the maximum deviation is less than 0.001% (Fig. 3). The space cryogenic solar radiation monitor is developed based on space cryogenic radiation measurement technology, planned to be carried on the Fengyun-3 meteorological satellite-10 star, aimed at verifying the feasibility of the in-orbit application of the space cryogenic absolute radiation meter. At present, the principle prototype has been developed, and the performance test and optimization have been preliminarily completed. The results show that the measurement repeatability of 5 mW laser power is better than 0.01%. The measurement repeatability of 0.5 mW radiation power is better than 0.03%, and the relative deviation from the standard trap detector measurement results provided by the China Institute of Metrology is less than 0.01%. The Earth-Moon imaging spectrometer is primarily used for measuring Earth reflection radiance and lunar irradiance. The imaging spectrometer consists of an off-axis triple reverse front view system, a visible-near infrared spectrometer, and a short-wave infrared spectrometer. The front system adopts a double Barbinet principle to reduce polarization sensitivity; the spectrometer uses an Offner structure with a convex grating as the spectral element. According to the design parameters, the signal-to-noise ratio of the imaging spectrometer in the working band is better than 300 (Fig. 8). The main function of the satellite reference transfer link is to realize the in-orbit traceability of the Earth-Moon imaging spectrometer to SI, mainly composed of the transfer radiometer, solar monochromator, and uniform light integral sphere. At present, the optical design of the solar monochromator and transfer radiometer has been completed. The working band range of the solar monochromator is 350-2400 nm, with a spectral resolution better than 8 nm (Table 2). The uncertainty component of the reference load in the solar reflection spectrum mainly includes the measurement uncertainty of the space cryogenic absolute radiometer, which is 0.03%, the uncertainty of the reference transfer link, which is 0.47%, and the inaccurate measurement introduced by the imaging spectrometer, which is 0.48%. Hence, the on-orbit traceability uncertainty of the imaging spectrometer is estimated to be 0.68%, enabling the measurement uncertainty of Earth reflected radiance to be better than 0.8% (Table 5).Conclusions and ProspectsThe research results of our paper provide a theoretical and experimental basis for the development of the reference load of the solar reflection spectrum segment. The reference payload will significantly improve the accuracy and long-term stability of spectral remote sensing data and offer high-precision remote sensing data for climate change studies. In addition, the radiation scale of the reference load can be transmitted to other space optical remote sensing devices through cross-marking, unifying the on-star radiation scale of different remote sensing payloads.
Sep. 25, 2024Vol. 44 Issue 18 1800007 (2024)
Bin Han, Yutao Feng, Jingsong Wang, Xiuqing Hu, Weiguo Zong, Na Xu, Cong Huang, Tian Mao, Xiongbo Hao, and Yong Li
SignificanceThe wind field is an important parameter characterizing the dynamic characteristics of the Earth’s mid-upper atmosphere system. It is also necessary basic data for operational work and scientific research in the fields of meteorological forecasting, space weather, and climatology. Passive optical remote sensing based on optical interferometer satellite payloads is a main technical method of obtaining wind field data in the middle and upper atmosphere.Space-borne interferometer payloads have been developed internationally for the detection of wind fields in the middle and upper atmosphere for more than half a century. There have been in-depth studies on the detection mechanism of wind fields in the middle and upper atmosphere, the physical characteristics of detection sources, the principles and data inversion of various wind measurement interferometers, satellite observation modes, atmospheric scattering, and radiation transmission. A complete theoretical system has been formed. Through the accumulation of global wind field observation data from payloads such as HRDI, WINDII, and MIGHTI, considerable basic observation data have been obtained for horizontal atmospheric wind field models and atmospheric temperature models, and the study of the dynamics and thermodynamic properties of the Earth’s atmosphere has been promoted. Many research results have been produced in the fields of space weather forecasting, atmospheric dynamics, atmospheric composition changes, and momentum and energy transport between the upper and lower atmosphere.However, the World Meteorological Organization clearly states that global wind field detection is the key to the detection of Earth’s atmosphere. The lack of direct global wind field measurement data remains one of the main shortcomings of the global observation system. The detection capability of wind fields in the middle and upper atmosphere is insufficient, and detection data are scarce, which do not satisfy the current requirements of atmospheric dynamics research, medium-term and long-term weather forecasting, space weather warning, and climatology research. China’s research on wind measurement interferometer technology started late and particularly lacked systematic theoretical research on space-borne interferometers for wind field detection. Since the 1970s, five generations of space-borne interferometer payloads for wind measurements have been launched internationally; however, China still lacks a global satellite remote sensing payload for measuring wind fields in the middle and upper atmosphere.To promote the optical technologies of space-borne passive remote sensing for atmospheric wind fields measurement, it is necessary to summarize and discuss the progress made in existing research and future development trends to provide a reference for the development of future optical interferometer payloads for atmospheric wind field measurement.ProgressThis paper summarizes the research status and progress of the satellite-borne wind interferometer payloads that have been successfully launched internationally, including three technical systems: the Fabry-Pérot interferometer (FPI), wide-angle Michelson interferometer, and Doppler asymmetric spatial heterodyne interferometer. The technical principles of wind field detection, the overall technical scheme of the payload, and the application of observation data output are introduced.In the order of launch time, the FPI payloads on OGO-6 and the DE-2, HRDI, TIDI, WNIDII, and MIGHTI payloads are introduced. The research goal of the FPI on OGO-6 is to retrieve the temperature of the mesospheric atmosphere by measuring the line shape and line width of the 630-nm airglow emission spectrum of the red oxygen atomic line. The instrument uses a limb observation mode to observe the 630-nm spectrum of the red oxygen atomic line at a height of 250 km in the emission layer. The atmospheric temperature within the height range of 200-300 km is retrieved from the line width of the spectrum, with a measurement error of 15 K. No wind field data have been reported so far.DE-2 uses a highly stable single-standard FPI to observe the atmosphere with a limb observation mode and utilizes spectral and spatial scanning data to measure the temperature, tangential wind field, and metastable atomic O(1S), O(1D), O+(2P) concentration data in the middle atmosphere. Through the measurement of multiple airglow emission lines in the visible and near-infrared bands, considerable global wind field data are directly obtained, which are compared and validated with the observation results of ground-based equipment and thermal atmospheric environment models. The DE-2 FPI offers important contributions to the study of thermal atmospheric characteristics.The HRDI measures the wind field, temperature, and volume emission rate in the mesosphere and lower thermosphere, as well as the cloud top height, effective albedo, aerosol phase function, and scattering coefficient in the stratosphere. The HRDI is an FPI consisting of three series of planar etalons, which can be adjusted for specific wavelengths by changing the spacing between two etalons using piezoelectric ceramics. During its on-orbit operation, the HRDI measures the wind field vectors in the stratosphere at 10-40 km, the mesosphere and lower thermosphere at 50-120 km during the day, and the lower thermosphere at 95 km during the night. The peak accuracy of wind speed measurement in the mesosphere is up to 5 m/s, but there are limited public data below 60 km in altitude.The TIDI is the first instrument to simultaneously detect wind fields in four directions, with a speed direction of ±45° and ±135° relative to the satellite. It uses a circular line imaging optical system (CLIO) and charge-coupled device (CCD) for detection and can operate during daytime, nighttime, and aurora conditions. Through data inversion, it can obtain global wind field vectors and temperature fields, as well as dynamic and thermodynamic parameters such as gravity waves, composition density, airglow, and aurora emissivity. The instrument design achieves a peak accuracy of 3 m/s for mesospheric wind speeds under optimal observation conditions, and a measurement accuracy of 15 m/s for thermospheric wind speeds.WINDII detects the wind speed, temperature, pressure, and airglow emissivity in the middle and upper atmosphere (80-300 km) to study the physical motion processes of the stratosphere, mesosphere, and lower thermosphere and to study atmospheric tides, large planetary-scale structures, and enhanced wind fields generated by aurora. WINDII operated in orbit for 12 years and ceased operation in October 2003, obtaining more than 23 million images and providing rich data for global atmospheric research.MIGHTI employs the limb observation mode to measure the global distribution of atmospheric wind fields and temperatures. It measures the green and red oxygen atomic lines at 557.7 nm and 630 nm, respectively, as the target spectral lines to retrieve wind speeds, and the oxygen A-band near 762 nm as the target spectral line to retrieve atmospheric temperatures. The results are in good agreement with ground-based FPI and meteor radar wind field detection data, thus providing dynamic and thermodynamic basic observation data for the study of strong disturbances in the ionosphere, energy and momentum transfer between the lower atmosphere and outer space, and the effects of solar wind and magnetic fields on the interaction mechanism of atmospheric space systems.A detailed parameter comparison is presented in Table 2.Conclusions and ProspectsIn general, the capability of space-borne atmospheric wind field detection based on passive optical remote sensing still has problems such as discontinuous altitude profile coverage, incomplete local coverage of wind fields in the middle and upper atmosphere, and limited spatial resolution of wind field data in the upper atmosphere. This paper discussed the future development trends of optical interferometer payloads for middle- and upper-atmosphere wind field detection, providing a reference for the development and planning of atmospheric dynamic characteristic detection payloads in China’s new generation of the FY meteorological satellite system.
Sep. 25, 2024Vol. 44 Issue 18 1800008 (2024)
Decang Bi, Jiqiao Liu, Ziyu Bi, Jian Shang, Yong Yang, Fengxin Xin, Pengfei Zhang, Haofei Wang, Zhiqiang Bian, Weibiao Chen, and Xiuqing Hu
ObjectiveClouds are a crucial factor in numerical weather forecasting (NWF), significantly influencing weather-related disasters such as hail, storms, and other extreme conditions. Accurate global measurements of horizontal and vertical distributions of clouds and aerosols, as well as their optical and micro-physical properties, are necessary to assess their influence on human health, the environment, and regional climate and precipitation. The China Meteorological Administration (CMA) and the World Meteorological Organization (WMO) have outlined specific requirements for cloud phase, cloud top height, aerosol extinction coefficient, and measurement error limits. Previous payloads such as CALIPSO (NASA, operational for 17 years) and ACDL (SIOM, operational for over 2 years) have demonstrated partial cloud measurement capabilities. The EarthCARE payload, including the 355 nm HSRL scheme developed by ESA, was launched on May 29, 2024. However, there remains a gap in providing certain-swath, multi-wavelength, multi-scheme, high-precision lidar measurement data.MethodsTo quantify the influences of clouds on precipitation, regional climate, and the global environment, we propose the concept of a multi-wavelength, multi-function, multi-beam cloud lidar (M3CL) based on a polar orbit satellite. The M3CL design incorporates high spectral resolution lidar (HSRL), polarization detection, and backscattering detection schemes, with four wavelengths (355, 532, 1064, and 1625 nm) and nine beams in a push-broom configuration, as shown in Fig. 1. Fabry-Perot etalons and iodine cells are used as high spectral resolution filters for 355 and 532 nm channels, respectively. The 355 and 532 nm channels utilize polarization detection, while the remaining eight 532 nm beams are symmetrically arranged on either side of the central beam, forming a 20 km swath. We derive theoretical upper bounds for cloud and aerosol detection errors based on HSRL equations and system calibration constants. Using the parameters set in Table 1, the atmosphere/cloud mode database, and lidar equations, we simulate the SNR distribution for an 820 km polar satellite orbit.Results and DiscussionsWe present simulation results for the relative errors upper limits of cloud and aerosol detection in Figs. 2 and 3. The backscattering coefficient relative error is below 17.6% with an SNR higher than 20, and within 31.2% with an SNR higher than 10. Sensitivity simulations for different detection wavelengths in Fig. 4 show that the M3CL can semi-quantitatively determine particle radii ranging from 0.2 to 2 μm. Figs. 5 and 6 indicate that the SNR exceeds 20 under thin cloud and weak scattering conditions, while Figs. 7 and 8 demonstrate that SNR remains above 20 under 2 km thick cloud, intense scattering conditions. Figs. 9 and 10 indicate that aerosol detection SNR is about 10. The SNR distribution figures reveal that cloud detection SNR exceeds 20 at a 2.5 km horizontal resolution and a 200 m vertical resolution, resulting in a relative detection error within 20%. The penetration depths for thick and thin clouds are over 300 and 1000 m, respectively.ConclusionsWe present the concept of the M3CL payload with system parameters based on a new generation polar satellite, featuring three detection schemes, four wavelengths, and nine beams. The M3CL is capable of push-broom measurements with a 20 km swath, 2.5 km horizontal resolution, and 200 m vertical resolution. We provide theoretical upper limits for particle backscattering coefficient detection errors based on HSRL theory, serving as a reference for evaluating HSRL detection errors. Simulation results indicate that the M3CL can achieve a cloud backscattering coefficient detection relative error within 20%, calculate particle radii from 0.2 to 2 μm, and penetrate thick and thin clouds to depths exceeding 300 and 1000 m, respectively. These capabilities meet the cloud detection requirements of meteorological satellites.
Sep. 25, 2024Vol. 44 Issue 18 1800009 (2024)
Xinhua Hong, Chengxin Zhang, Xuesuo Zhang, and Wenqing Liu
ObjectiveSatellite remote sensing offers several advantages, including contactless measurements, wide observation range, high sampling frequency, excellent spatiotemporal continuity, and low cost per measurement. Satellite-based observations of atmospheric carbon dioxide (CO2) are crucial for China’s major strategic goals of “carbon neutrality and carbon peaking,” and they also support the current global “carbon inventory” task. Several foreign carbon-monitoring satellites, such as Japan’s Greenhouse Gases Observing Satellite (GOSAT)-1/2 and the American Orbiting Carbon Observatory (OCO)-2/3, have achieved operational high-precision detection of atmospheric CO2 and provide internationally recognized data products. Since the launch of China’s first domestic carbon-monitoring satellite, TanSat, in December 2016, retrieving global atmospheric CO2 concentrations with high precision from TanSat Level 1B (L1B) data has been a major research focus. However, the instability of its spectral performance-due to factors such as cosmic radiation exposure, launch vibrations, and changes in environmental temperature and pressure-has significantly affected the retrieval success rate and hindered accuracy improvements. High-quality spectra are essential for accurate CO2 retrieval, but many previous studies have overlooked this requirement. In this study, we quantify and correct wavelength and radiance inaccuracies in TanSat’s spectra to enhance spectral quality, aiming for more accurate and reliable CO2 detection compared to existing studies.MethodsAs the key original calibration parameters measured in the ground laboratory seem unsuitable for TanSat’s on-orbit measurements, we continually adjust the wavelength shift and squeeze until we obtain an optimal solution between TanSat’s direct solar spectra and the high-resolution, high-reliability Kurucz solar spectrum. Then, we quantify the wavelength shift and correct it with high time frequency. After that, we choose the region of 15°N-20°N and 0°W-15°W, which is located in the Sahara Desert and has a similar surface albedo, and perform simulation experiments of radiative transfer (Fig. 3). Under the low-cloud and aerosol scenario, we construct a simulated optical environment by using the parameters of aerosol optical density, albedo, volume fraction of CO2, atmospheric profiles, and geometric angle of satellite observations provided by multisource data. We use the libRadtran model to simulate the spectra that should be obtained by observing TanSat from the Earth’s surface. Then, we derive radiometric calibration coefficients from the simulated and measured spectra, which serve as a basis for evaluating and correcting radiance distortions, optical structure, and other issues. As shown in Fig. 4, we develop a scheme to invert O2 and CO2 vertical column density synchronously for TanSat XCO2 retrieval based on the iterative maximum a posteriori differential optical absorption spectroscopy (IMAP)-DOAS algorithm, a forward model developed specifically for inverting near-infrared absorbing gases, characterized by direct nonlinear iterative fitting of the optical density spectrum. Moreover, we optimize the configuration of the retrieval algorithm by reconstructing the solar irradiance spectrum, constructing a priori reference spectral database with high spatiotemporal resolution, updating the slit function, and building air mass factor lookup lists. Finally, we evaluate the accuracy of our retrieved XCO2 data by verifying our results against global ground-based TCCON sites. In addition, to quantify the difference between our results and other similar satellite products, we implement a cross-comparison among TanSat, GOSAT, and OCO-2.Results and DiscussionsOur on-orbit recalibrations reveal that TanSat’s L1B spectra in the O2A, WCO2, and SCO2 channels experience significant wavelength shifts since launch. As shown in Fig. 5, the wavelength shifts across the nine footprints (FPs) exhibit similar trends over time. Initially, the wavelength shift in the O2A and WCO2 channels reaches approximately 10% and 30% of the resolution, respectively. After June 2018, the shifts increase rapidly, causing notable spectral instability. The wavelength shift in the SCO2 band is particularly severe, reaching up to about 3.75 times the spectral resolution. On-orbit radiometric recalibrations identify inherent optical structure and radiance biases due to variations in instrument performance. For the O2A band, radiometric deviations are within ±5% initially, whereas significant instability is observed between November 2017 and January 2018, with deviations exceeding 5% for most FPs (Fig. 6). The WCO2 channel shows more intense radiance deviations, reaching ±10% at most wavelengths (Fig. 7). Deviations at the wavelength edges of FPs are even greater with some exceeding 15%, and worsening over 20% as instrument performance deteriorates. Sensitivity experiments demonstrate that correcting orbital wavelength and radiance can significantly improve inversion results, optimizing the success rate, root mean square (RMS) of fitting, and uncertainty by 24%, 15%, and 30%, respectively (Fig. 8). Using the recalibrated spectra and our retrieval algorithm, we obtain TanSat XCO2 results for approximately one and a half years (March 2017 to September 2018). Validation with TCCON data confirms a global detection accuracy of 1.24×10⁶, with an average bias of only 5×10⁻⁸ (Fig. 9). TanSat’s detection accuracy is better than 2×10⁻⁶, and the average bias is within ±1×10⁻⁶ near most global TCCON sites (Table 3). Cross-comparison with GOSAT and OCO-2 show that TanSat’s XCO2 product reliability is comparable to current international standards (Fig. 10).ConclusionsOur study reveals that the long-term instability in TanSat’s on-orbit spectral performance is a crucial factor affecting retrieval success and accuracy. On-orbit recalibration significantly improves retrieval quality, with the optimized retrieval algorithm achieving accuracy better than 1.3×10⁻⁶. In the future, TanSat-2, China’s new-generation carbon-monitoring satellite, is expected to improve instrument performance and hardware parameters, including larger orbit widths, shorter revisit periods, and higher spatial coverage, potentially improving CO2 detection accuracy to within 1×10⁻⁶. However, TanSat-2 will be placed in large elliptical orbits, resulting in substantial distance variations from the receiving station and significant signal amplitude fluctuations. Maintaining the optimal instrument conditions and achieving high spectral quality will be key challenges. The spectral correction and inversion scheme developed in our study provides a new solution for addressing similar issues that TanSat-2 might encounter.
Aug. 25, 2024Vol. 44 Issue 18 1800010 (2024)
Yuchang Yan, Xiaosa Chen, Linyang Xue, Guilin Chen, and Changpei Han
ObjectiveThe Fengyun-4 microwave detection satellite, positioned in a geostationary orbit, undergoes thermal deformation of its microwave antenna due to solar heat radiation. This deformation compromises the antenna’s surface accuracy, consequently affecting the performance of payloads like the microwave imager. To achieve adaptive adjustment of the microwave antenna for optimal payload operation, a real-time, high-precision measurement system and method for the antenna surface are essential. The frequency scanning interferometry (FSI) laser ranging system, also known as the frequency modulated continuous wave (FMCW) laser ranging system, offers high-precision absolute distance measurements for non-cooperative targets at short to medium ranges. It exhibits robust interference resistance, making it suitable for on-orbit surface measurement of satellite antennas. Despite existing research and commercial products, the demanding on-orbit environment necessitates advanced FSI laser ranging system designs. We introduce a system design that integrates miniaturization, modularity, and high reliability into the FSI laser ranging system, making it suitable for spacecraft deployment. This system meets the antenna surface measurement needs of the Fengyun-4 microwave detection satellite for both on-orbit and terrestrial applications. It also shows potential for broader automotive, aerospace manufacturing, and large-scale equipment production.MethodsA mathematical and physical model of a typical FSI laser ranging system (Fig. 1) is developed based on the light interference formula. This model facilitates the derivation of distance measurement principles and calculation formulas under ideal conditions. Further, the nonlinear error in laser frequency sweeping is analyzed, with the simulation results shown in Fig. 2. An enhancement to the standard FSI ranging system is proposed, incorporating a reference optical path (Fig. 3). This path provides a reference beat frequency signal for resampling the measurement signal at equal optical frequency intervals, thereby eliminating measurement errors caused by nonlinearities in laser frequency sweeping. Analysis of Doppler frequency shift errors was conducted through formulaic analysis, with corresponding simulation results presented in Fig.4. The paper proceeds with a design scheme for an FSI laser ranging system featuring dual-laser synchronized reverse modulation and symmetrical optical paths (Fig. 5). Utilizing the established mathematical and physical model, formulaic derivations are conducted methods to correct Doppler frequency shift errors are outlined, and simulation analysis results are shown in Fig. 6. Additionally, an analysis of system measurement errors induced by environmental factors such as temperature fluctuations and vibrations in optical fibers is performed, followed by specific countermeasure suggestions. Subsequently, based on the design proposals from Sections 2.3 and 2.4, a modular FSI laser ranging system is conceptualized (Fig. 7), and an engineering prototype is assembled for ranging experiments (Fig. 8). The target is placed on a high-precision displacement platform 2.5 m away, and continuously move the target within a ±5 mm range with a step size of 500 μm. The calibrated FSI ranging system engineering prototype is utilized to measure the target and perform error correction and analysis on the measurement results.Results and DiscussionsWe present a mathematical and physical model to analyze the principles and errors associated with the FSI laser ranging system. The research addresses and reduces errors from laser frequency sweeping nonlinear and Doppler frequency shift. The proposed design integrates an internally modulated laser source with an all-fiber optic path and passive optical components, enhancing system reliability and modularity. An experimental prototype developed following this design demonstrated high precision in measuring distances to a target approximately 2.5 m away. Subsequent calibration and correction for Doppler frequency shift errors, as depicted in Fig.9 and Fig.10, reduced repeatability standard deviation from 271.5 μm and 270.26 μm to 15.32 μm and decreased the system measurement linearity error to 16.92 μm. These findings indicate that the system design fulfills the antenna surface measurement requirements for the Fengyun-4 microwave detection satellite in both on-orbit and ground-based applications.ConclusionsThe FSI laser ranging system design utilizes equidistant optical frequency, resampling, dual-laser synchronized reverse modulation, and dual-path symmetrical interferometric measurements. It eliminates errors introduced by laser frequency nonlinearities and corrects Doppler frequency shift errors caused by various factors. The engineering prototype, built based on the proposed system design, demonstrated precise measurements for a target approximately 2.5 m away, with measurement linearity superior to 2.14×10⁻⁶ and a repeat measurement standard deviation better than 17.00 μm. The all-fiber optic and passive device internal optical path allows for a fully solid-state, compact, and modular design, meeting the high-reliability requirements of the system. It also effectively reduces measurement errors caused by air disturbances and mechanical vibrations, making it suitable for real-time high-precision measurement applications of satellite antenna surfaces in space and on the ground.
Sep. 25, 2024Vol. 44 Issue 18 1800011 (2024)
Shuangshuang Li, Changjin Hu, Feihu Cheng, Weixiong Zhao, Bo Fang, Yang Chen, Nana Yang, Nana Wei, Weijun Zhang, and Lunhua Deng
ObjectiveFormaldehyde is the most abundant aldehyde in the troposphere and a primary indoor pollutant, classified as a human carcinogen. High-sensitivity on-line measurement of formaldehyde is critical for monitoring atmospheric environments and indoor pollution. High-resolution and accurate formaldehyde spectrum are essential for developing high-sensitivity detection instruments and improving spectral inversion accuracy. Therefore, it is of great significance to obtain a high-quality formaldehyde spectrum for formaldehyde research. Fourier transform infrared (FTIR) spectroscopy is a commonly used infrared spectral technique. However, the traditional FTIR spectrometer with an incoherent thermal light source suffers from low sensitivity and requires long averaging time to improve sensitivity. The optical frequency comb is essentially a pulsed laser with the advantages of wide spectrum, high brightness, and good collimation. It can replace the thermal light source in traditional FTIR spectrometer and improve the detection sensitivity by combining a multi-pass cell or an optical resonant cavity. Therefore, we built a Fourier transform spectrometer based on an optical frequency comb to measure the broadband spectrum of formaldehyde and have a quantitative analysis, including measurements in the presence of water interference.MethodsLeveraging the advantages of the optical frequency comb and the FTIR in detecting wide-range molecular absorption spectra, an FC-FTIR spectrometer is built to measure the formaldehyde spectrum near 3.5 μm. The comb source used is FC1500-250-WG and mid-IR optical frequency comb, generating an infrared laser with a center wavelength of 3200 nm by difference frequency conversion. The laser is collimated into the Herriott-type optical multi-pass cell. The optical base length of the cell is only 1.2 m, and an effective absorption path of 60 m can be obtained after multiple reflections. The comb beam exiting the cell is then focused into the FTIR spectrometer for formaldehyde spectrum detection.Results and DiscussionsThe constructed FC-FTIR spectrometer successfully measures the broadband infrared spectrum of formaldehyde in the 2730-2970 cm-1 band (Fig. 3). The sensitivity of the instrument reaches 3×10⁻⁸ cm-1·Hz-1/2 (Fig. 4), and the detection limit of formaldehyde is 414×10-9. The wavenumber accuracy is better than 150 MHz, allowing for precise quantitative analysis of formaldehyde concentration with an uncertainty of approximately 9%-11% (Fig. 5). At the same time, the absorption spectra of formaldehyde in the presence of a large amount of water are measured (Fig. 6), confirming that the device’s spectral range and resolution are adequate for detecting various species.ConclusionsIn this paper, an FC-FTIR spectrometer is built. The broadband spectra of formaldehyde in the 3.5 μm spectral range are obtained at low pressure and room temperature. The sensitivity of the system is 3×10⁻⁸ cm-1·Hz-1/2, corresponding to the formaldehyde detection sensitivity of 414×10-9. At the same time, the formaldehyde absorption spectrum under water signal interference is measured with prominent band characteristics, and the concentration of formaldehyde can be accurately obtained. The mid-infrared FC-FTIR device can not only detect formaldehyde but also detect greenhouse gases and pollution gases in the atmosphere, which is expected to take an advantage in the field of multi-species dynamic concentration monitoring. This device combines the high-resolution, wide-spectrum measurement and quantitative analysis benefits of traditional FTIR spectrometer with enhanced system sensitivity, reduced response time, and improved frequency accuracy and precision. In addition, the sharp spectral bands of the molecular species obtained by the measurement make it possible to use all the peaks with complete shapes for multi-line fitting in data processing. With its capability for fast acquisition and high-sensitivity broadband spectral data in molecular fingerprint regions, the mid-infrared FC-FTIR spectrometer is expected to gradually replace traditional FTIR spectrometer in molecular spectroscopy.
Sep. 25, 2024Vol. 44 Issue 18 1830001 (2024)
Huayuan Shi, Simin Xue, Jin Qin, Tingting An, Lizhen Yuan, and Fan Zhang
ObjectiveLightning is a discharge phenomenon that involves high currents and strong electromagnetic radiation. The peak temperature of the discharge channel can reach up to 30000 K due to the high current of the return stroke process. The channel’s air becomes ionized, generating free electrons and ions and creating a plasma channel. Lightning activity in the Qinghai-Tibet Plateau has increased due to global warming. The strong currents in the lightning discharge channel can cause significant damage to buildings, humans, and livestock on the ground. Therefore, lightning hazards and protection have been of key concern. Spectroscopic diagnosis of lightning plasma has become an essential tool for measuring the lightning discharge process due to the further study of its physical properties. The quantitative analysis of the spectra enables the calculation of the basic parameters of the lightning channel’s physical characteristics. Currently, there are studies available on the evolution of temperature and electron density along the lightning return stroke channel, but fewer studies on the spatial evolution characteristics of the temperatures and electron densities of the core channel and the peripheral corona sheath channel. The spatial evolutions of temperatures and electron densities in the core and peripheral corona sheath channels are closely related to the distribution of lightning discharge energy and the transmission characteristics of the discharge current. We use a slitless spectrograph to obtain the spectral information from the first return strokes of four lightning. The temperatures and electron densities of the core channel and the peripheral corona sheath channel are calculated and investigated to characterize the variation of the temperature and electron density along the discharge channel. Furthermore, we explore the relationship between the core channel temperature and the relative intensity ratio of the nitrogen ion line. The study is expected to provide some clues and implications for the exploration of the energy and current transport characteristics of lightning discharge plasma.MethodsWe report on the use of a slitless spectrograph, consisting of a transmission grating and an M310 high-speed camera, to obtain spectral data of the first return strokes of four cloud-to-ground lightning during a field experiment in the Qinghai-Tibet Plateau. The structural characteristics of the return stroke spectra were analyzed. The temperatures of the core channel and the peripheral corona sheath channel were calculated using the multiple-line method combined with plasma theory. Additionally, the electron densities of the core channel and the peripheral channel were obtained using the Stark broadening method for the NII ion line and the OI atomic line, respectively. The study investigates the evolution characteristics of temperatures and electron densities of the core channel and peripheral corona sheath channel. Moreover, the relationship between the core channel temperature and the relative intensity ratio of the nitrogen ion line was investigated.Results and DiscussionsThe results indicated that during the first return strokes of the four lightning flashes, the temperature and electron density of the core channel exhibited three trends along the channel height: decrease, slight increase, and little change (Fig. 6). The lightning with stronger discharge showed a faster decrease of current along the return stroke channel, and the values of temperature and electron density in the core channel were higher than those in the peripheral corona sheath channel (Fig. 6). The temperature of the corona sheath channel remained relatively constant, at around 20000 K, as the channel height increased. The electron density exhibited trends of slight decrease and little change along the channel, with a slower decrease rate than that of the core channel (Fig. 7). Furthermore, a significant correlation existed between the relative intensity ratio of the NII 500.5 nm and 568.0 nm spectral lines in the return stroke spectra and the core-channel temperature (Fig. 5). Generally, a higher temperature of the core channel during the lightning return stroke corresponded to a larger ratio of the relative intensities of the 500.5 and 568.0 nm spectral lines on the return stroke spectrum.ConclusionsThe study analyses the spatial evolution characteristics of temperatures and electron densities of the core channel and peripheral corona sheath channel during the return strokes of lightning, based on the four first return stroke spectra obtained by a slitless spectrograph. Additionally, the study explores the relationship between the core channel temperature and the relative intensity ratio of the nitrogen ion line. The results indicated a strong correlation between the relative intensity ratio of the NII 500.5 nm and 568.0 nm spectral lines on the return stroke spectra and the core-channel temperature. This provides a simpler analytical method for further study of the channel temperature change. The temperature and electron density of the core channel exhibited similar variations along the channel, with trends of decrease, slight increase, and little change. The temperature and electron density values in the core channel were higher than those in the peripheral corona sheath channel, suggesting that most of the ionic and neutral atomic lines originate from radiation in different regions of the channel. The temperature of the peripheral corona sheath channel did not change significantly and the electron density showed trends of decrease and little change along the channel. The changes in temperature and electron density in the corona sheath channel were smoother than those in the core channel.
Sep. 25, 2024Vol. 44 Issue 18 1830002 (2024)
© Copyright 2018-2021 | Chinese Laser Press.
All Rights Reserved 沪ICP备15018463号-20