


 View fulltext

2023
Volume: 52 Issue 12
22 Article(s)

Huan LIU, Yutao FENG, Di FU, Hengxiang ZHAO, Liang KONG, Xiongbo HAO, Chenguang CHANG, Bin HAN, and Sufeng WANG
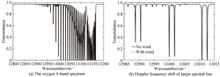
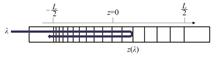
Real-time and high-precision wind field data play an important role in improving the accuracy of weather forecasts, ensuring the safety of spacecraft take-off and landing, tracking atmospheric pollutants, and radio sound detection. In the visible light and near-infrared bands, there are three absorption bands formed by the absorption of oxygen molecules, namely the oxygen γ band, the oxygen B band and the oxygen A band. The absorption intensity of the A band is greater than that of the γ band and the B band, and without interference from other gases, it is an ideal atmospheric detection source for tropospheric wind speed. The Doppler asymmetric spatial heterodyne wind measurement technology is a technology based on the Fourier transform of the interferogram to realize the Doppler frequency shift detection of the wind, the tropospheric wind velocity can be retrieved by detecting the Doppler shift of the oxygen A-band absorption line. This paper explores the technical feasibility of using Doppler asymmetric spatial heterodyne to detect the tropospheric atmospheric wind field based on the oxygen A-band absorption line. Based on the ideal instrument model and the 1976 American standard profile, the solar zenith angle is taken as 40°, without considering the influence of clouds, rain, aerosol, and surface reflection. Through the analysis of the integral limb radiation characteristics of the absorption spectrum line observed in the single instantaneous field of view at the entrance pupil of the instrument, the paper simulates the forward simulation interference curve of a single space altitude layer, establishes a mathematical model of the instrument response function from the atmospheric absorption spectral line entrance pupil limb radiation to the interference curve, and two harmonics with the same spatial frequency as the interference curve are used for phase demodulation and wind speed inversion of line-of-sight wind. This method does not require Fourier transform, and can directly process the interferogram data to obtain the phase difference of the interferogram before and after the wind speed is applied, so as to solve the wind speed. At the same time, the algorithm only needs to perform a multiplication calculation, and can quickly realize the wind speed inversion. Based on the absorption line wind measurement theory, the measurement accuracy of tropospheric wind field detection using Doppler asymmetric spatial heterodyne is mainly affected by the interferometer optical parameters, filtering parameters, system noise, instrument stability and etalon off-axis effect. Through the simulation analysis of the influence of various instrument parameters on the results of line-of-sight wind speed retrieval, the optimal value range of the optical system parameters is determined. The results show that for the oxygen absorption line with the center wavelength at 769 nm, when the interferometer asymmetry value is 6.5~6.7 mm, the spectral resolution value is 0.49~0.51 cm-1, the value of the etalon spacing is 0.8~1.4 mm, the fineness coefficient is 30~100, the off-axis angle of the etalon is less than 0.2°, and the transmission peak deviation of the etalon is less than 0.018 cm-1, the signal-to-noise ratio of the interferogram is greater than 40 times, the wind speed retrieval accuracy is better than 8 m/s. The research results can provide a theoretical reference for passive tropospheric wind field detection and related instrument design.
Dec. 25, 2023Vol. 52 Issue 12 1201001 (2023)
Chuan ZHANG, Jun WANG, Hao ZHOU, Chenyu YANG, Ke LEI, Jingjing LIU, and Dengxin HUA
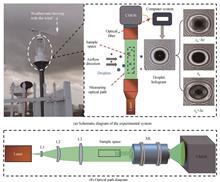
Clouds cover two-thirds of the Earth's surface and have an important impact on the global radiation balance, global climate change, hydrological cycle, and artificial weather modification. Meanwhile, the cloud in the atmosphere remains one of the biggest uncertainties in weather and climate changes. As cloud microphysical parameters, number concentration, median volume diameter and liquid water content are important parameters to investigate cloud microphysical processes and weather prediction. In the current observation technology of cloud microphysical parameters, remote sensing method exploits the power spectrum data of satellites and radars to invert cloud microphysical parameters. However, in the progress of data inversion, properties of cloud droplets need to be assumed. Therefore, realistic droplet spectrum and cloud microphysical parameters cannot be obtained, and their measurement accuracy needs to be further verified. Airborne instrument requires strict airspace application, and its observation time, spatial continuity and sampling frequency are limited. The measurement method of existing foreign droplet spectrometer based on light scattering will destroy the original cloud droplets field distribution. In view of the above bottleneck problems, an orographic cloud observation method based on digital holographic theory is proposed. This observation method combines the active wind direction follow-up system and the nanosecond pulsed laser modulation technique based on complex programmable logic device, and utilizes global digital image fusion and local tenengrad variance algorithm. The digital holographic experimental system based on this method uses a nanosecond pulsed laser light as the light source. It can eliminate the multiple ghosting phenomenon of high-speed moving particles and obtain accurate holographic images during the recording process of holograms. In the reproduction process of holograms, global digital image fusion and local tenengrad variance algorithm can determine the focus position of particles in the measurement space to obtain more accurate three-dimensional coordinate and size of particles. For traditional fog monitor based on the light scattering theory, its sampling method is inspiratory, which causes the loss of particles during the sampling process of particles. However, the sampling method of the digital holographic experimental system is open. The active wind direction follow-up system can avoid particles loss to obtain the more realistic droplet spectrum. In the Liupan Mountain Orographic Cloud Field Science Experimental Base, long-term continuous observation is conducted to obtain cloud microphysical parameters. These observation data are compared and analyzed with the observation data of a light scattering-based fog monitor and forward scatter visibility instrument. In three comparative experiments, for particles of 2~4 μm, the measurement results of the fog monitor are 61.54%, 30.24% and 18.39% of the digital holographic system, respectively. For particles of 7~50 μm, the measurement results of the fog monitor are 26.90%, 16.79% and 28.57% of digital holographic system, respectively. The above results show that the digital holographic method measures more droplets in the interval of 2~4 μm and 7~50 μm. In recent years, many researchers have found that FM120 has particle loss during measurement, which is consistent with the findings of this paper. This method can lay data support for improving the theoretical understanding of the physical process of cloud precipitation and the development of parametric schemes. It can also provide important technical support for research in the fields of weather, climate, artificial weather modification and atmospheric chemistry.
Dec. 25, 2023Vol. 52 Issue 12 1201002 (2023)
Guangwei QIN, Wenke XIE, Xingjian ZOU, Tao YU, and Qiao XIE
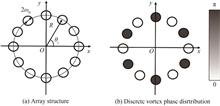
In the atmospheric transmission, due to the effect of atmospheric turbulence, the Coherent Synthetic Vortex (CSV) beam will undergo wavefront distortion and lead to intensity profile aberration and Orbital Angular Momentum (OAM) mode expansion, making the CSV beam quality unable to meet the practical application requirements. In order to mitigate the wavefront phase distortion brought by turbulence, the phase correction technology based on adaptive optics is particularly important. The SPGD algorithm is widely used in adaptive optical systems without wavefront sensing because of its fast convergence speed and high convergence accuracy. However, the performance of the Stochastic Parallel Gradient Descent (SPGD) algorithm depends on the accuracy of metric function.Given the uniqueness of the CSV beam, it is necessary to develop a new metric function by evaluating the light field features of the CSV beam. By theoretical analysis, it is known that the intensity of the CSV beam is distributed periodically in the angular direction. Since the periodic variation feature is independent of transmission distance and array structure parameters, the angular fringe contrast, which evaluates energy concentration in the bright fringe and prevents energy accumulation in the dark fringe, is an appropriate metric function.Whenthe angular fringe contrast is used as the metric function, the chosen bright and dark fringe angle width α will affect the SPGD algorithm performance. To establish the selection criteria of angular fringe contrastmetric function, the SPGD correction experiment is performed when the value of α is changed in steps of 1.41°, which shows that a smaller value of α can result in higher convergence accuracy and the faster convergence speed for the SPGD algorithm. On the basis of this, the wavefront distortion of CSV beam is corrected by SPGD algorithm with the angular fringe contrast as the metric function. In order to verify the validity of the angular fringe contrast as metric function, comparative experiment is carried out to verify the effectiveness with different metric function: OAM mode energy ratio, intensity correlation coefficient and angular fringe contrast. The experimental results show that the SPGD algorithm with the angular fringe contrast has higher convergence accuracy and faster convergence speed, compared with the intensity correlation coefficient and OAM mode energy ratio. In the result of single-loop structure CSV beam SPGD wavefront correction usingthe angular fringe contrast, the angular fringe contrast is improved from 0.575 to 0.877, and the mode energy ratio is improved from 0.167 to 0.229. Compared with OAM mode energy ratio and intensity correlation coefficient, the convergence speed of SPGD algorithm is improved by 12.7 times and 3.4 times, respectively.What's more, a dual-ring fiber array is developed to achieve higher output power and improved SPGD correction accuracy. In addition, to ensure a high proportion of the expected OAM mode in CCV beam, the waist radius of the sub-beam in inner and outer rings needs to be proportional to the inner and outer ring array radius. We used the above light source structure and performed SPGD correction, the simulation experiment results show that the SPGD algorithm with the angular fringe contrast as the metric function can also effectively improve the beam quality of CSV beam with complex dual-ring array structure.In summary, the metric function's angular fringe contrast' proposed in this paper can satisfy the needs of quality evaluation of CSV beam and its practical long-range transmission applications.
Dec. 25, 2023Vol. 52 Issue 12 1201003 (2023)
Yalong ZHANG, Yongan LIU, Ruili ZHANG, Xianghui YANG, Zhe LIU, and Lizhi SHENG
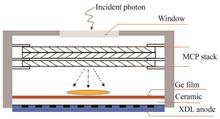
A useful technique for detecting very faint light is photon counting technology, which has numerous potential applications in high-energy physics, astronomical detection, quantum key distribution systems, and high-resolution spectral measurement. The micro-channel plate based single-photon counting detector benefits from being small and compact in design. While counting photons, it can precisely record the arrival time and location information by combining with the position-sensitive anode. The detector based on microchannel plate and position-sensitive anode has high sensitivity and time and space discrimination ability, and has been widely used in various fields.Firstly, we investigated position-sensitive anodes for imaging, there are many position-sensitive anodes for imaging. Among which the spatial resolution of WSA anodes decreases gradually with the increase of detection area; the electronics design of MAMA anodes becomes more complex as the detection area increases; each strip of XS anode requires an independent readout electronics, resulting in higher circuit power consumption; the spatial resolution of delay line anodes is much better than that of other kinds of position-sensitive anodes because it is not impacted by the detecting area. Therefore, a novel two-dimensional cross delay line anode based on a printed circuit board was proposed after the delay line anode single photon detector's operating principle was examined. The anode adopts a multi-layer structure design, from top to bottom including an upper collection unit, a reference ground, a lower collection unit, a reference ground, a collection unit and a delay unit through the via connection to achieve signal transmission. Compared to traditional anode designs, this design places the delay unit on the back of the collection unit, making it more miniaturized.Secondly, the high resistance sensor layer was replaced of an anode to capture electrons based on the charge induction readout technology. Due to the characteristics of high resistance of sensor layer, when the electron cloud reaches the charge induction layer, it takes a certain time to diffuse to the ground, so an equal amount of induced charge is generated on the other side, and the position-sensitive anode senses the induced charge and performs analytical imaging on it. Compared with the traditional direct collection method, the direct collection is easy to cause the redistribution of secondary electrons on the anode, resulting in the instability of the output image. Charge induction technology effectively avoids these problems and eliminates the influence of non-uniform electron field on electron motion, it provides convenience for the development of vacuum package detector, which not only reduces the difficulty of device manufacturing, but also facilitates testing.Finally, a set of experimental system is used to test the delay line anode, the developed signal readout circuit mainly includes time digital conversion circuit and photon arrival timing circuit, and imaging is realized by signal discrimination and photon arrival timing circuit. According to the test results, the detector's ideal spatial resolution is 107 μm and its ideal dark count is 0.23 count/(cm2·s). The innovative cross delay line anode has created the groundwork for single photon image detection in large area arrays, it provides theoretical guidance for further performance improvement.
Dec. 25, 2023Vol. 52 Issue 12 1204001 (2023)
Hangdong HUANG, Jiaxing LIU, Jianqiang WANG, Yi XU, and Guijun JI
In ultra-high-speed large-capacity optical fiber communications and high-power ultra-fast fiber laser systems, chirped fiber gratings are widely used to compensate and manage dispersion. The dispersion coefficient matching degree directly determines the output quality and application range of the optical pulse signal. Compared with other dispersion compensation technologies, the fiber grating preparation process is simple, has good repeatability, and can be flexibly designed according to actual needs, which has great advantages. However, previous fiber grating dispersion analysis usually only considers the influence of second-order linear dispersion and ignores issues such as pulse distortion caused by high-order nonlinear dispersion mismatch, resulting in unsatisfactory actual use results. Different from the traditional coupling mode theory and transmission matrix analysis method, this paper establishes a new set of dispersion analysis mathematical models for nonlinear chirped fiber grating based on the group dispersion delay principle of optical fiber. The numerical relationship between the Bragg reflection wavelength, the dispersion parameter and the dispersion slope is deduced, which greatly reduces the complexity of the previous calculation process and has strong practicality. In practical application scenarios, as long as the specific dispersion parameters that need to be compensated in the fiber laser system are understood, this numerical relationship can be used to calculate the corresponding chirped fiber grating period distribution, thereby achieving the best system output. Based on this mathematical model and the current common femtosecond fiber laser product specifications on the market, we used UV scanning exposure technology combined with the phase mask method to design and prepare two nonlinear chirped fibers for high-power femtosecond fiber laser pulse broadening. The grating can respectively stecher the incident seed pulse in the 1 030 nm band to more than 150 ps or 1 ns, while meeting the third-order dispersion matching requirements in the optical system. In addition, based on the classic Michelson interference principle, we built a set of spectral interference dispersion measurement devices and conducted actual dispersion tests on the two nonlinear chirped fiber gratings we produced. Compared with other measurement methods, this device has simple principle, low cost, high measurement accuracy, wide range and strong practicability. It is very suitable for dispersion measurement of special optical fibers such as fiber gratings and photonic crystal fibers. Experimental results show that the reflection bandwidths of the two nonlinear chirped fiber gratings have reached 17 nm and 11 nm respectively, the dispersion parameters are -10.3 ps/nm and -107 ps/nm respectively, the dispersion slopes are -0.013 ps/nm2 and -0.087 ps/nm2 respectively, and the reflectivity reaches more than 60%, which basically meets the requirements of practical applications. Taking into account the processing accuracy of fiber gratings and phase masks, as well as the systematic errors introduced by the dispersion measurement device and the approximation of theoretical calculations, the experimental results are basically consistent with the design parameters, proving the correctness and feasibility of this mathematical model. The research results can provide new solutions and references for the design, analysis and production testing of nonlinear chirped fiber gratings. It is foreseeable that the model established can be extended to chirped volume gratings and other composite gratings with the same structure.
Dec. 25, 2023Vol. 52 Issue 12 1205001 (2023)
Guobin SUN, Jin ZHANG, Xuesong JI, Chi HU, Shilei JIANG, and Yanyan LIU
The polarization beam splitter is one of the essential devices in a polarized optics system, which can change the polarization characteristics of light quickly and effectively. Conventional polarizing beam splitters are expensive, bulky, structurally unstable, and sensitive to the angle of incidence, thus limiting their application in optical systems. In recent years, with the realization of micro-nanostructures on the surface of optical elements, special functions such as polarization, anti-reflection, narrow-band filtering, and diffraction enhancement of optoelectronic devices can be achieved by fabricating micro-nano-grating structures on the surface of the device's substrate material. However, most of these structures working wavelength range, incident angle tolerance, and extinction ratio are essential factors restricting their wide development and application. Therefore, to obtain a polarization beam splitter with a simple structure, easy processing, and suitable for the polarization beam splitting requirement of high extinction ratio at wide incidence angles for AR display components, this paper designs a metal polarization beam splitter grating with high extinction ratio to work in a wide range of incidence angles of visible light bands to address this problem. The metal polarization beam splitting grating principle is qualitatively analyzed using equivalent medium theory, and then effects of the period, height, beam wavelength, and incident angle on the polarization characteristics of the Al grating are numerically simulated by using rigorous coupled wave analysis theory and finite difference time domain method. The results show that when the Al grating duty cycle ratio is 1∶1, the period is 0.15 μm, the ridge height is 0.15 μm, in the 0.40~0.70 μm band and 45°±10° incident angle range, the metal polarization grating has a high transmission to TM wave and high reflection to TE wave at the 0 order diffraction order, the transmission extinction ratio is 35 dB on average, the reflection extinction ratio is 12 dB on average. Finally, the extinction ratio of the fabricated metal polarization grating is measured, which verifies the correctness of the design results. The test results show that with the change of wavelength in the range of 0.4~0.7 μm, the extinction ratio data obtained from the test are closer to the trend of the FDTD simulation data, but there is a specific difference in the size of the value. The reflective extinction ratio test result data and curve trend are consistent with the simulation results, and the transmittance extinction ratio test result curve trend is consistent with the simulation results, but the test data value is smaller than the simulation results. In short, the test results and simulation results are consistent with the curve trend, but the test results in the numerical value of the existence of certain deviations, which is mainly due to the precision of the optical power meter and the polarization extinction ratio of the polarizer, as well as the production of the grating in the structure of the existence of some defects and so on. The results are helpful for the design and produce of polarization beam splitters with high diffraction efficiency, high extinction ratio, and a wide range of incident angles in a wide band.
Dec. 25, 2023Vol. 52 Issue 12 1205002 (2023)

Lihao DING, Zhishan GAO, Dan ZHU, Qun YUAN, and Zhenyan GUO
With the emergence of Optical Coherence Tomography (OCT) technology and the rapid development of computer hardware, researchers have been attempting to utilize computer-aided to identify breast tissue OCT images. This study proposes a Convolutional Neural Network (CNN) model based on residual network enhancement for auxiliary diagnosis of OCT breast tissue images. The proposed method employs ResNet-18 framework as the basis to prevent gradient disappearance or explosion. In addition, to enhance the efficiency and regularization of the model, the original 7×7 convolutional layer was substituted with a series of three cascading layers, each having a dimension of 3×3. This design choice allows for a nonlinear decomposition of the original 7×7 layer while preserving the same receptive field size. As a result, it accomplishes two advantages: a reduction in computational cost associated with model parameters and acting as an implicit regularization technique. Subsequently, a Convolutional Block Attention Module (CBAM) was introduced after each set of cascaded small convolutional layers and the final convolutional layer. This module integrates a spatial attention module, which focuses on capturing spatial dependencies, and a channel attention module, which emphasizes informative channels, thereby serving as the initial stage of filtering and enhancing the discriminative capabilities of the network. At the same time, Octave Convolution (OctConv) is employed to substitute the 3×3 convolutional layers in the original model. The convolutional kernel of OctConv has the capability to partition the input image sample data into four parts based on the low-frequency dimension ratio parameter within its structure. This functionality allows the network to dynamically balance high and low-frequency components during the process of extracting image features as the secondary filtering stage. After this, the Global Average Pooling (GAP) layer is used instead of the fully connected layer to reduce the computation of network parameters, and the structure of the network is regularized to prevent overfitting of the models. Ultimately, a residual network model “Double Filtering” ResNet (DF-ResNet) is constructed. The “double filtering” structure can not only reduce the overall parameter computation of the model, but also focus on high-frequency components with rich structural information during feature extraction. By decreasing the ratio of low-frequency constituents, the reduction of informative duplication is attained, resulting in an enhancement of the model's proficiency towards categorization and identification of images manifesting proportional configurations. The proposed DF-ResNet model is employed to train and classify the OCT image dataset of three breast tissue types. It conducts multiple tuning tests and optimization techniques such as data augmentation and batch normalization, achieving an overall classification accuracy of 96.88%. After conducting three comparative experiments, the performance of the DF-ResNet model has been validated. In the first experiment, the DF-ResNet model was compared with the ResNet-28 model with an equivalent number of layers. The experimental results showed that the replacement of some convolutional layers with OctConv allows the model to focus on high-frequency components during the image feature extraction process. This led to an improvement in the model's ability to classify and recognize images with similar structures and ultimately culminating in an overall increase in classification accuracy. Additionally, it is important to note that the use of OctConv did not negatively impact the overall convergence speed of the model. In the second experiment, the DF-ResNet model was compared with the Oct~~ResNet-28 model, which incorporated OctConv as a modification to improve its performance. The experimental results validated that the DF-ResNet model effectively filtered out low-frequency information. In the third experiment, the performance of the DF-ResNet model was assessed against established CNN models such as DenseNet-169 and VGG-19. The DF-ResNet model not only boasts a reduced parameter count but also demonstrated superior classification accuracy compared to several traditional CNN models. For the classification of OCT images of breast tissue, the DF-ResNet model displayed exceptional performance, robustness, and real-time processing capabilities. As a result, it is well-suited for providing technical support for real-time margin diagnosis in the clinical applications of breast cancer.
Dec. 25, 2023Vol. 52 Issue 12 1210001 (2023)
Feifei WANG, Huijie ZHAO, Na LI, Siyuan LI, and Yu CAI
Hyperspectral image classification is a research hotspot in the field of hyperspectral image processing and application. Classification models predict the class of each pixel by analyzing the spectral and spatial information of each pixel and compare it to the actual features. In the hyperspectral classification task, the spatial context information of the data can be used to improve the classification accuracy, so this paper uses the powerful learning ability of 3D-CNN to extract effective spectral and spatial features into hyperspectral images, and then fuses the extracted spectra and spatial features to enhance the flow between different levels of the network, thereby improving the classification efficiency. Although CNN operations can mine deeper feature information as the network deepens, CNN is ineffective in modeling long-distance dependencies, so consider combining CNN with attention mechanisms. This combination can focus on the local position of the given information, assign corresponding weights to it, emphasize the key features in the feature map, adjust the global information of the attention statistics image through weight re-annotation, retain the features that are more conducive to the classification task, and improve the representation ability of extracted features. But the common attention mechanism is to calculate the average globally, that is, the pixel values of the entire image block, inevitably introducing information from different categories of pixels around it, which is not needed in classification tasks. Another spectral attention mechanism based on the center pixel provides weight values that ignore the effects of surrounding pixels in the same category. Therefore, a simple spectral attention mechanism in the central region is proposed, in which the central region is selected with the central pixel as the reference and the surrounding 3×3 range as the central region, on the one hand, the range contains certain spectral information of the same category, and on the other hand, the interference of different categories of pixels is reduced as much as possible. The spectral attention mechanism in the central region can minimize the influence of interfering pixels on spectral features while extracting as many effective spectral features as possible. Based on the spectral attention mechanism of the central region, this paper proposes a spectral spatial attention residual network for hyperspectral classification, which mainly includes spectral feature learning, spatial feature learning and classifier. The network first selects appropriately sized image blocks from hyperspectral images and then classifies them. Starting from balancing computing resources and overall accuracy, experimental comparison shows that the size of the image patch is uniformly 13×13. The spectral feature learning part includes 1 frequency spectral attention module and 1 spectral residual network module. The spectral attention module adopts the central spectral attention mechanism, which can effectively suppress redundant bands and increase the weight of important bands. The spectral features after the attention mechanism will be extracted by the spectral residual network module, and more spectral features can be extracted. Convolution kernels of 1×1×n do not affect the spatial structure when extracting spectral features while maintaining spatial correlation. The spatial feature learning component includes 1 spatial attention module and 2 spatial residual network modules. The spatial attention module can obtain the important spatial information of the pixels to be classified, and use the spatial residual network to extract its spatial information. Add a hop connection between each module in the network to connect the presentation layer of the hierarchical features into a continuous residual block to mitigate the loss of accuracy. Finally, these rich spectral and spatial features are sent to the classifier to obtain the final classification result. The proposed algorithm is compared with the latest algorithm on four public datasets. Indicators and visualization results verify the superiority of the proposed algorithm.
Dec. 25, 2023Vol. 52 Issue 12 1210002 (2023)
Mengyu SUN, Peng WANG, Junqi XU, Xiaoyan LI, Hui GAO, and Ruohai DI
While there is less information contained in the infrared image, it still has problems with image blur and noise. It caused many difficulties in infrared visual target tracking. The discriminative correlation filter is a reliable method for tracking objects that can be trained online on an embedded hardware platform. But the variable scale of the object cannot be efficiently solved. We proposed an adaptive information selection for infrared object tracking with a variable scale correlation filter to solve the problem mentioned earlier. The proposed algorithm is divided into three parts, one for feature extractor, one for location filter, and one for scale filter. Three features are extracted by the feature extractor to represent the object. The insensitive feature and the histogram of gradient are chosen as the based features. The insensitive feature represents the intensity of the object at its current position in the infrared image. The information extracted from the gradient histogram, which contains more information about the shape of the target, represents the regions with sudden changes in the infrared image such as the edge and corner of the target. To enhance the object's representation, we generate a new histogram of gradients based on the insensitive feature, which has various representations of the object. After that, the position filter will receive the sample frame feature information. We train three position filters depend on three types of feature, respectively. In the training phase of the position filter, temporal regularization, spatial regularization and spatial information selection are added during optimization. The temporal regularization is used to enforce correlation filter more similarity to the last coefficients, which makes correlation filter more fit on the variation of the object. The spatial regularization is limited the correlation filter concentrate on the region of the object when training. For reducing redundancy of the object's information and speeding up the training process, we set different thresholds for coefficients. When the coefficients are lower than the threshold, we set it to zero to reduce the number of coefficients. The spatial coefficient of each channel is treated individually. Then, the position filter will be convolved with the feature of the current frame. We compute three response maps according to the different features. The response map corresponding to various features will be weighted and sum together to find the max value position which is the estimated object position. The weights of the various features are set to the hyparameter. The weight of the new feature is set smaller than the other base features, because of the larger receptive field. For better representation of the object's scale change, we extract the variable scale sample from the estimated object position. The ratio of the height and width of the variable scale sample is different. We flatten the features of all variable scale samples and concatenate them together along with the spatial dimension as the scale training features. The corresponding scale factor is obtained by convolution according to the obtained scale filter coefficient, so as to determine the boundary ratio and obtain the boundary of the object. We choose LSOTB-TIR dataset and PTB-TIR dataset as the test dataset. The proposed algorithm can reach 34.85 frames per seconds on the central processing unit platform. On the LSOTB-TIR data set, the accuracy and success rate of the proposed algorithm reached 71.3% and 59.4% on the LSOTB-TIR dataset, and 80.4% and 61.1% on the PTB-TIR dataset, respectively. We analysis each component in our algorithm and find the spatial selection contributes more for precision. We also visualize the result of our method, which demonstrates our method can track the object consistently and can adapt the change of boundary ratio.
Dec. 25, 2023Vol. 52 Issue 12 1210003 (2023)
Shuai HAO, Jiahao LI, Xu MA, Tian HE, Siyan SUN, and Tong LI
Aiming at the problems of insufficient texture details, low contrast and loss of target information in the infrared and visible fusion image, an image fusion algorithm based on feature optimization and a generative adversarial network is proposed. Firstly, considering the impact of original image quality on the fusion results, an adaptive feature optimization module, which is guided by an objective function and based on the chameleon swarm algorithm, is designed, which can enhance the texture details of visible image and the contrast of infrared image. Then, in order to preserve more multi-modal information in the fused image, the generative adversarial network is introduced into the fusion framework. In the generator model, considering the difference in imaging mechanisms between infrared and visible images, a dual branch feature extraction network is constructed. At the same time, in order to solve the problem of insufficient feature extraction caused by single scale convolutional layer, a multi-scale dense connection module is designed to increase the range of network receptive field feature extraction, so as to comprehensively extract the deep semantic features and shallow texture features of images. To reduce the loss of important target feature information during the fusion process, a parallel attention model based on space and channel is designed in the feature fusion layer. By feeding the infrared and visible image feature information into the spatial and channel attention models, the correlation and dependency between different modal features are captured, and the expression ability of the network is improved, so as to better focus the thermal salient targets of infrared images and the texture details of visible images. In the discriminator model, to preserve the feature information of both infrared and visible images in the fusion results, a dual discriminator network structure for infrared and visible images is constructed, which can enable the fused image to retain as much rich information as possible from the original image in adversarial learning. Moreover, in the network training stage, in order to train a good model and enhance its robustness, 32 sets of images selected from the TNO image fusion data set are cropped and expanded to obtain 24 200 sets of infrared and visible image pairs. Finally, to verify the advantages of the proposed algorithm, subjective and objective results are compared with six classic fusion algorithms, such as DenseFuse, FusionGAN, ResNet-ZCA, MDLatLRR, PMGI and RFN-Nest. The experimental results show that the proposed algorithm has significant advantages in both subjective and objective evaluations. The fused images have richer texture details, clearer edges and targets, and better contrast. In the objective evaluation indexes, the entropy, spatial frequency, joint entropy, visual information fidelity, and gradient-based fusion performance obtain the optimal values, which are improved by 16.11%, 65.46%, 7.96%, 42.67%, and 33.24%, respectively, compared with the DenseFuse algorithm. In addition, to verify the effectiveness of the feature optimization module, multi-scale dense connection module and attention fusion module, ablation experiments are conducted on 21 sets of images and six evaluation indexes, all of which use the same parameter settings. The results of the ablation experiment indicate that compared with the original fusion network (i.e. none of the three modules is added), the six objective evaluation indexes are increased after the introduction of the three designed modules, which verifies the effectiveness of each module of the proposed algorithm.
Dec. 25, 2023Vol. 52 Issue 12 1210004 (2023)
Hui WANG, Qiuling WEN, Hui HUANG, Guoqin HUANG, Feng JIANG, Jing LU, and Xian WU
Diamond has a wide range of applications in the field of precision and ultra-precision machining of hard materials, high frequency and high voltage electronic devices, chip thermal management, and precision optics due to its extremely high hardness, excellent thermal conductivity, extremely high electron mobility, and wide-band optical transparency. Furthermore, it has been demonstrated that the preparation of microstructures on diamonds can significantly enhance the performance of diamond-based devices. However, it is difficult to efficiently prepare microstructures on diamond surfaces using conventional mechanical or chemical methods. Laser processing has become an advanced method to fabricate diamond microstructures due to its low cost, simple process, non-contact machining, high flexibility and high efficiency. Currently, most studies are focused on the optimization of processing parameters and the preparation of diamond microstructures. However, little attention has been paid to the effect of laser parameters on the micro/nano-structures in the laser-ablated area, and the material removal mechanism of the femtosecond laser processing diamond is not clear. Here, in this work, the effects of laser processing parameters such as laser fluence, scanning speed, and number of scans on the microscopic morphology of diamond microgrooves were investigated. The ablation threshold, ablation rate, and material removal rate of diamond processed by femtosecond laser were further obtained. Then the phase transformation of the diamond under femtosecond laser irradiation was analyzed through Raman detection. The effect of laser fluence on the Raman spectra which was detected at the central region of the diamond microgroove was further investigated. The residual stresses in the center of the diamond microgrooves under different laser fluences were calculated based on the wave number shift of the diamond peak. Finally, the temperature field of femtosecond laser-irradiated diamond was simulated using ANSYS finite element software, and the removal mechanism of diamond material was analyzed. It was found that femtosecond laser ablation of diamond microgrooves resulted in a clean surface and debris-free edges, but micro-cracks along the 110 crystal orientation appeared in the laser-machined area. Periodic nano-ripples were formed within the microgrooves. The topographies of nano-ripples were closely dependent on the laser processing parameters. As the laser fluence increases, the order and uniformity of the nano-ripples in the microgroove first become better and then gradually become worse. With the increasing laser scanning speed, the periodicity of nano-ripples in the center of the microgroove becomes larger, and the nano-ripples at the edge of the microgroove become discontinuous and uneven. As the number of laser scans increases, nano-ripples with a periodicity close to half-wavelength appear in the center of the microgroove. However, with the continuous increase in the number of scans, a large amount of heat accumulation is imposed, leading to irregularities in the nano-ripples at the center of the microgrooves and poor uniformity of the nanoripples at the edges of the microgrooves. The ablation threshold of CVD single-crystal diamond was experimentally calculated to be 3.20 J/cm2. When the laser fluence was increased to 24.34 J/cm2, the ablation rate of diamond was 44.8 nm/pulse, the material removal rate was 4.34×10⁻¹⁰ g/pulse, and the residual tensile stress was increased to 1 389 MPa. The Raman detection revealed a very thin graphite layer at the bottom of the microgroove, and the thickness of the graphite layer was theoretically calculated to be 11.1 nm. Finally, Simulation results illustrate that the temperature at the center of the femtosecond laser beam has far exceeded the temperature of diamond sublimation. In addition, the femtosecond laser energy irradiated on the diamond is mainly distributed on the diamond surface, while it conducted to the inside of the diamond is very little. The thickness of the graphite layer obtained from the simulation is very close to the theoretical calculation.
Dec. 25, 2023Vol. 52 Issue 12 1214001 (2023)
Min DENG, Manping YE, and Xin JIANG
The traditional detection method of water content testing, Karl Fischer titration, cannot be widely implemented due to the inconvenience of requiring professional instruments and operators. Carbon dots are photoluminescent zero-dimensional carbon nanomaterials with sizes between 1 and 10 nm. Since the luminescence of carbon dots is easily affected by solvents, researchers have used the fluorescence intensity, emission peak position, and visible color changes to the naked eye of the carbon dots to quantify the water content within the organic solvent, but often the detection range is narrow and sometimes segmented fitting is required. These shortcomings mean that the experiments need to be further optimized. The green fluorescent carbon dots herein were prepared by hydrothermal method using citric acid and urea as precursors, and characterized and analyzed by transmission electron microscopy, UV-vis absorption spectroscopy, fluorescence spectroscopy and time-resolved fluorescence spectroscopy. The particle size of carbon dots is 6.5 nm, and there are absorption peaks at 252 nm, 273 nm, and 410 nm. The optimal excitation and emission wavelengths are 400 nm and 517 nm, respectively. It is presumed that the fluorescence of carbon dots mainly originates from the green fluorescent molecule 4-hydroxy-1H-pyrrolo [3,4-c] pyridine-1,3,6 (2H, 5H)-trione according to previous studies. Carbon dots were dissolved in seven solvents of water, methanol, ethanol, ethylene glycol, dimethylformamide, ethyl acetate and dichloromethane and found to have different luminescence properties including fluorescence intensity, emission peak position and fluorescence lifetime. Based on this principle, the carbon dots were used as fluorescent probes to detect the water content in the proton solvent ethanol and the non-proton solvent dimethylformamide. With the increase of water content, the fluorescence intensity of carbon dots in the ethanol-water mixture decreased, the emission peak position was red-shifted from 509 nm to 518 nm, and the fluorescence lifetime was shortened from 10.70 ns to 5.11 ns; the fluorescence intensity of carbon dots in the dimethylformamide-water mixture decreased, the emission peak position was red-shifted from 495 nm to 519 nm, and the fluorescence lifetime was shortened from 12.89 ns to 5.24 ns. The experimental results show that there is a linear response between the fluorescence intensity, emission peak position and fluorescence lifetime of carbon dots and the water content, and the detection range is as wide as 0~100%. It is speculated that these phenomena are caused by the change of polarity of the solution and the formation of hydrogen bonds between the carbon dots and the solvent. With the increase of water content in the organic solvent-water mixed solution, the hydrogen bond formed between carbon dots and water gradually replaces the hydrogen bond formed between carbon dots and organic solvent. In addition, since water has the highest polarity in the solvent, the polarity of the mixed solution increases with the increase of water content, and these affect the surface groups of the carbon dots leading to the solvation effect of carbon dots. In order to verify the universality of the method, the carbon dots were dissolved in methanol-water and ethylene glycol-water mixed solutions with gradient concentration of water content. The results showed that the fluorescence intensities, emission peak positions and fluorescence lifetimes of the carbon dots also responded linearly to the water content of the system, and the method was universally applicable. The linear response between fluorescence lifetime and water content is rarely seen in other studies related to the detection of water content in organic solutions, providing a new detection pathway for the determination of water content. The linear response between fluorescence intensity, emission peak position and fluorescence lifetime and water content all indicate that the carbon dots are potential probes to achieve rapid and sensitive detection of water content in organic solvents.
Dec. 25, 2023Vol. 52 Issue 12 1216001 (2023)
Longjian XU, Changjun LIU, Xiuyou HAN, Shuanglin FU, Yiying GU, and Mingshan ZHAO
The rapid development of wireless communication technology has made the non-regeneratable Radio Frequency (RF) spectrum resources extremely scarce. The In-band Full-duplex (IBFD) wireless communication scheme utilizes the same frequency to transmit and receive signals at the same time slot, overcoming the shortcomings of traditional half-duplex communication schemes that can only transmit and receive signals in different frequency carriers or different time slots, and doubling the utilization rate of the RF spectrum. However, RF self-interference is the primary problem that must be resolved for the application of IBFD scheme. Microwave photonic RF Self-interference Cancellation (SIC) technology is attracting more and more attention by virtue of the advantages of the large signal processing bandwidth and high amplitude and time regulation accuracy. In this paper, considering the influence of environmental variation on the RF SIC performance, we focus on the control algorithm for the microwave photonic RF SCI system.Firstly, a theoretical model of microwave photonic RF SIC link is established, and the expressions of RF SIC value for the single-frequency signal and the signal with a certain bandwidth are derived. Then, the parameters that affect the RF SIC performance are analyzed, including the amplitude mismatch and delay mismatch. The analysis results provide a basic reference for the design of the microwave photonic RF SIC scheme, the optimization of the regulation units in optical domain and the construction of the experimental system.Secondly, an adaptive feedback control system for microwave photonic RF SIC system is designed and constructed, which is composed of the optical domain regulation units, RF signal down conversion units, data acquisition units and data processing units. The Field Programmable Gate Array (FPGA) is applied for digital signal processing, adaptive algorithm iteration and control instruction output to the regulation units in optical domain via serial communication unit. Also the clock conversion is conducted in FPGA to provide different clock for different digital unit.Thirdly, an adaptive algorithm for microwave photonic RF SIC system in FPGA is implemented. The algorithm is divided into two steps. One step is a cross-correlation algorithm to obtain the amplitude and delay mismatch between the interference signal and the reference signal, which provides the initial value for the other step of Particle Swarm Optimization (PSO) algorithm. The PSO algorithm realizes a further RF SIC through the circle of the acquisition of the residual self-interference power by Analog-to-digital Converter (ADC), the optimization iteration for control instruction to the regulation units in optical domain. During the circle, the tuning accuracy of regulation units in optical domain and the sampling accuracy of ADC are considered comprehensively to optimize the iteration logic loop, which are applicable for the really established system.Finally, a microwave photonic RF SIC system with direct modulation is established, for which the feedback control algorithm based on FPGA is demonstrated. The cancellation depth of 35 dB for the 2.4 GHz center frequency and 40 MHz bandwidth is realized by the microwave photonic RF SIC system. The measured results verify the feasibility and efficiency of the FPGA based control algorithm.
Dec. 25, 2023Vol. 52 Issue 12 1206001 (2023)
Han YANG, Kang XIE, Tingkuo CHEN, Qianfa LIN, Yibin ZHU, Ruiqi LI, and Hongyan XIA
Humidity is one of the important parameters in the field of sensing, and the monitoring and control of humidity is used in many applications, such as agriculture, cultural relics protection, environmental safety, and pharmaceutical engineering. Since traditional electronic humidity sensors are mainly based on capacitance or resistivity measurements, which are more susceptible to electromagnetic interference. Moreover, under high humidity environment, water vapor will corrode the circuit board, which is a great test for the long-term stability of electronic humidity sensors. Compared with traditional humidity sensors, fiber optic humidity sensors have the advantages of corrosion resistance, light weight, can be operated remotely, not subject to electromagnetic interference, etc., and have been widely studied in recent years. Among them, U-shaped microfiber has the advantages of small size, low fabrication cost, high sensitivity, etc., which has a broad prospect in the field of humidity measurement. In this paper, a U-shaped microfiber humidity sensor based on Polyvinyl alcohol (PVA) coating is proposed, and the single-mode optical fiber is pulled into micron-sized microfiber by fiber optic melting and cone pulling machine, and the microfiber with different diameters can be prepared by changing the flame temperature and cone pulling speed, etc. PVA is a strong hydrophilic material, and its refractive index changes with the humidity of the surrounding environment. Due to the high adherence of PVA on the surface of silica, it can be used for the measurement of humidity in a wide range of applications. PVA has high adhesion on the surface of silica, so it can be easily coated on the surface of optical fiber. Because of these special properties of PVA, combining PVA with ultrafine optical fiber can be used to measure humidity. Using the drop coating method, the PVA solution is uniformly coated on the surface of the optical fiber, and the coated ultrafine optical fiber is passed through a homemade mold, which is made of three capillary glass tubes, and the ultrafine optical fiber is fixed into a U-shape by means of UV photoresist and ultraviolet lamp. The paper prepared three humidity sensors, which were used to study the effect of coating thickness on the humidity of the sensors. It was found that the humidity sensitivity of the U-shaped sensors was extremely low when they were not coated with PVA; after coating with PVA, the sensitivity of the sensors increased with the increase of the coating thickness. At the same time, the thicker the coating the greater the loss of the sensor, and it will lead to a longer fabrication time of the sensor, which will cause the PVA droplets on the dropper to evaporate, thus affecting the uniformity of the coating. Therefore, there is a need to select a suitable coating thickness. In order to investigate the effect of the diameter of the waist zone on the humidity of the sensor, two different diameters of the sensor are prepared in this paper. The experimental results found that the smaller the diameter of the waist region, the higher the sensitivity of the sensor, which is due to the fact that the smaller the waist diameter of the ultrafine optical fiber coupled with the external environment the stronger the swift field, which strengthens the interaction between them. The experimental results show that the sensor prepared in this paper has a high humidity sensitivity of 146.1 pm/%RH in the detection range of 34%RH~90%RH. In the humidity measurement experiments, the fluctuation of the temperature will have a certain effect on the experimental results. This is because temperature changes the physicochemical properties of PVA film and U-shaped microfiber, such as changes in refractive index and expansion. Therefore, it is an important work to explore the effect of temperature on the crosstalk of the sensor. Temperature experiments show that the temperature sensitivity of the sensor is 15.8/℃ in the range of 40 ℃~80 ℃, and its crosstalk sensitivity is 0.108%RH/℃, which is much lower than the humidity sensitivity, so the temperature has less effect on this sensor. The sensor designed in this paper has a simple preparation process, high sensitivity, easy to carry, low cost, less influence of temperature crosstalk, which has a wide range of applications in the field of humidity detection.
Dec. 25, 2023Vol. 52 Issue 12 1206002 (2023)
Yan WANG, Junliang WANG, Wei ZHU, Haoyu XU, and Chao JIANG
Different human posture may express different current states and needs of human body. At present, human posture recognition can be roughly divided into visual technology and sensor technology. However, the image extracted by the camera is susceptible to illumination and background interference, and the recognition accuracy and robustness are not ideal under complex conditions. Traditional sensors (capacitive, voltage, etc.) are vulnerable to electromagnetic interference, so they are not suitable for human posture recognition applications. In recent years, Fiber Bragg Grating (FBG) sensors have been widely used in structural monitoring because of their light weight, anti-electromagnetic interference, wavelength division multiplexing and other advantages. In order to further improve the recognition accuracy of human posture in bio-medicine and kinematics, this paper designs a smart insole based on FBG sensor for human posture recognition, and combines K-fold cross-validation support vector regression algorithm to improve the recognition accuracy. COMSOL simulation software is used to analyze the force on the sole of the foot, and the four main force parts of the big toe, the first metatarsal bone, the third metatarsal bone and the heel are determined. Using the method of wavelength division multiplexing, four FBG sensors with different center wavelengths are arranged in these four positions, and PDMS material packaging is used to design smart insoles. And each FBG sensor is need to be calibrated, the experimental results show that the FBG sensor can maintain a stable measurement performance during the pressure process at constant room temperature, and the fitting linear relationship indicates that the change of its center wavelength is proportional to the load, and verifies that the wavelength offset of FBG has a high linearity and sensitivity to the pressure. In this work, a total of 25 participants are recruited to accomplish eight human postures, including standing, sitting, standing on one foot, folding forward, leaning forward, leaning back, half squat and full squat, respectively. The changes in the center wavelength of the string FBG sensor are recorded. In order to reduce errors, each posture is repeated twice and the average value of its center wavelength offset is taken to construct the data set. The K-fold cross-validation Support Vector Regression (KCV-SVR) model is introduced for data processing, meanwhile, the K value is set to 5, wavelength offset is taken as input, and different postures are taken as output. After K-fold cross-validation, the optimal value of SVR penalty factor and radial basis function parameter are obtained automatically, which are 0.5 and 8 respectively. The experimental results show that the Root Mean Square Error (RMSE) of SVR regression model is 0.510 6, the Mean Absolute Error (MAE) is 0.132 3, and the coefficient of determination R2 is 0.967 7. RMSE, MAE and R2 of KCV-SVR regression model decreased by 0.460 4, 66.3% and 3.3%, respectively. By comparing the prediction error of SVR and KCV-SVR regression model, the maximum error of SVR is 0.309 6, the minimum error is 0.012, and the average error is 0.088 4. However, the maximum error of KCV-SVR is 0.301 6, the minimum error is 0.001 5, and the average error is 0.057 6. It can be seen that the prediction result of KCV-SVR regression model is better than that of SVR regression model. KCV-SVR regression model basically realizes the effective recognition of human postures, and provides a new idea for the recognition of human postures based on flexible FBG sensor.
Dec. 25, 2023Vol. 52 Issue 12 1206003 (2023)
Wei DENG, Pan DAI, Feng WANG, Hantian GE, and Xiangfei CHEN
With the rapid development of optical fiber communication and optical fiber sensing, the Fiber Bragg Grating (FBG) sensor has become one of the fastest growing and most widely used optical fiber sensors. Owing to the FBG sensor has many advantages in terms of compact size, low cost, wavelength-encoded, anti-electromagnetic interference, easy multiplexing and so on, it has attracted great interests in the field of sensing and been widely used in medical healthcare, pressure detection, battery safety condition and building structural health monitoring. FBG sensors demodulate parameters such as strain, vibration and temperature by detecting the changes of FBG reflection wavelength, with the aid of core technology of laser source and demodulation method. However, the current Tunable Distributed Feedback (DFB) lasers for optical communication applications often have narrow tuning range and low tuning speed, and require additional auxiliary wavelength reference when directly used for FBG sensor demodulation system, which makes the system complex and affects its practicability. Therefore, there is still no tunable laser source with simple structure and low cost that is specifically suitable for FBG sensing systems.In this paper, a wavelength correction-free FBG sensing system was proposed to identify the wavelength changes and demodulate the temperature changes of the FBG sensor without wavelength correction of the wavelength-swept DFB laser based on Reconstruction Equivalent Chirp (REC) technique. As one of the most significant wavelength tunable laser sources, the DFB semiconductor laser has the characteristics of high reliability, low noise, fast response, high output power, good repeatability, and simple tuning scheme. Compared with many other tunable lasers with different realization schemes, the fabrication process of DFB laser is the best choice for both cost and applicability. The DFB laser used in this paper was designed and fabricated using a special process method-REC technique. By sampling the seed grating with uniform period, the low-cost submicron holographic exposure technique of laser chip fabrication can achieve the same wavelength accuracy as the high-cost nanometer electron beam lithography technique while retaining its intrinsic characteristics. When a tunable DFB laser is selected as the laser source for an FBG temperature sensing system, the temperature information can be demodulated by reading the voltage signal of the optical signal reflected by the FBG through the Photodetector (PD). In the wavelength-swept-based FBG sensing demodulation system, the only data that can be obtained directly from the Oscilloscope (OSC) is the optical intensity of the FBG reflection spectra and the corresponding time in the sweeping cycle of the DFB laser. In order to accurately analyze the external environment changes measured by the FBG sensor from these data, it is necessary to calibrate the relationship between wavelength and time during the wavelength-swept process of DFB laser in advance. Firstly, the instantaneous wavelength is calibrated by the calibration method based on Mach-Zehnder Interferometer (MZI), and the relationship between wavelength and time is obtained. Then in the FBG temperature sensing system based on tunable laser, the FBG sensor is placed in the thermostatic bath with a constant temperature accuracy of 0.1 ℃. In the experiment, the tunable REC-DFB semiconductor laser was used as the wavelength-swept laser source. After the optical signal passed through the circulator, it acted on the FBG sensor for temperature sensing, and then the FBG reflected optical signal was received by the PD and recorded by the OSC. By using the characteristic that the reflected optical signal reaches maximum when the laser wavelength coincides with the reflection central wavelength of the measured FBG, and then using the relationship between wavelength and time in the laser sweeping cycle that has been calibrated, the wavelength corresponding to the maximum output signal of the FBG demodulation system is extracted. Finally, by detecting the wavelength offset of the reflected FBG, the measured changes of external temperature can be linearly demodulated even when the laser wavelength changes are nonlinear.Experimental results show that the proposed wavelength-correction-free FBG sensing system can perform accurate temperature detection in the range of 200 ℃, and the coefficient of determination (R2) of linear fitting relationship between wavelength and temperature is 0.995 6. The linearity of the measured wavelength and temperature is good, with the 1-R2 of only 0.004 4. The laser source of sensing system can be tuned up to 2.5 nm with 1 kHz sawtooth wave modulation, and no additional wavelength correction device is required for the measurement process.
Dec. 25, 2023Vol. 52 Issue 12 1206004 (2023)
Han HUANG, Zhoumiao SHI, Yushu SHI, Shu ZHANG, and Jiacheng HU
Steel ball is a key assembly part of bearing, and its surface defect is one of the main causes of bearing failure. At present, the domestic inspection of the surface quality of steel balls is still using the artificial visual inspection method with low detection efficiency and high false detection rate. This paper proposes a detection method for steel ball surface defects based on optical dark field line scanning technology, and constructs a surface defect detection system for high reflectivity steel ball by dark field line scanning.As the surface of the bearing steel ball is close to the mirror reflection, the traditional light source will cause the surface of the halo, resulting in local overexposure of the camera, and the image of the surrounding object will be reflected into the surface of the steel ball, and part of the defect information will be submerged. In addition, because the normal direction of the steel ball changes everywhere, the lighting source used in the traditional detection method is difficult to construct an optical dark field for the sphere. Given the above two cases, this paper uses line laser scanning to construct the spherical optical dark field, and simulates the reflected light direction under different incidence angles and line widths, and finally solves the detection blind area caused by overexposure and environmental image reflection on the surface of the steel ball, and realizes the construction of the broadband dark field area on the surface of the steel ball and the acquisition of images.The spherical geometry of the steel ball makes it impossible for all surface defects to be presented coherently without distortion on the same two-dimensional image. That results in missed or false detection due to incomplete defect shooting. Therefore, this paper stitches multiple spherical and ring images to cover the whole sphere, studies its distortion correction algorithm, filters the image noise through median filtering and threshold segmentation, extracts defect features, establishes the spatial geometric relationship among the points of the image, and develops the three-dimensional reconstruction algorithm of the sphere surface feature points. The surface defects of different spherical images are reconstructed on the same three-dimensional spherical surface. The discrete defect point cloud on the three-dimensional spherical surface is divided into different classes by clustering segmentation. The point cloud class above the set threshold is screened by triangulation algorithm. The three-dimensional continuous detection of surface defects of bearing steel ball is realized, which opens up a new idea for the detection method of surface defects of steel ball.The light and dark field defect detection comparative experiment was carried out on the bearing steel ball with a diameter of 6 mm and a precision of G20. The result shows that the dark field had obvious technical advantages compared with the bright field. The repeatability of the proposed method is 0.14% for non-destructive balls with intact surfaces and 0.11% for wear balls with surface defects. The designed system can realize three-dimensional reconstruction and detection of small defects on the surface of steel balls.
Dec. 25, 2023Vol. 52 Issue 12 1212001 (2023)
Jiaqing SHI, Bing YU, Junwei CHU, Jihong FAN, Youbo HU, and Jianjun LI
The high-precision self-calibration radiation reference source is currently the research focus of satellite remote sensing calibration. In order to meet the requirements of quantitative applications such as climate monitoring, low-light radiation metering and single photon source radiance measurement, in view of the application requirements and technical requirements of visible to near infrared low-light radiometer, a compact three-channel low-light radiance meter based on correlated photon self-calibration is designed. This design method can improve the measurement accuracy of low light irradiance by using objective physical effect instead of physical standard, reducing the cumulative error caused by standard transfer chain. The absolute calibration of the detector responsivity can be achieved by the spontaneous parameter down-conversion effect, and the absolute radiation observation can be achieved without relying on the external reference. Based on this study, combined with the special application requirements of radiance meter, a numerical model of spectral rate and geometric transmission characteristics of wide spectrum correlated photons is established, and two basic operating modes of self-calibration and radiation observation are determined. The interaction between 355 nm pump source and nonlinear medium generates three-wave mixing, and the correlated photons are generated by class I non-collinear spontaneous parametric downconversion, the combined effect of monochromatic pump photon flow and quantum vacuum noise on non-centrosymmetric nonlinear crystal makes each incident photon spontaneously split into two photons with lower energy with a certain probability, called signal photons and idle photons respectively, they have a wide sptrum distribution from pump wave frequency to lattice resonance frequency. Correlated photon source has the technical characteristics of time and space correlation, natural wide spectrum and absolute reproducibility, so it has high absolute accuracy. Integrated design of self-calibration and radiation observation can monitor and correct changes in response characteristics in real time, maintain long-term stability of response characteristics, and improve traceability and accuracy of observation data. This design method solve the key technologies such as preparation and value transfer of correlated photon sources, suppression of pump stray light, high precision and high efficiency coupling of correlated photons, UV radiation resistance of space single-photon detectors, packaging reinforcement technology of space single-photon detectors,self-calibration and integrated design of radiation observation. The spectral measurement range of the low-light radiance meter is from 460 nm to 1 550 nm, the measurement range of radiance is 1×10⁻⁹~1×10⁻⁶ W/(cm2·sr·nm). In the design, the integration, miniaturization and modularization of the whole system are considered, and the eight spectral bands are integrated into a three-channel structure, solving the preparation of wide spectrum dependent photon source, optical multiplexing of calibration optical path, radiation measurement, high precision coincidence measurement and full optical path calibration of radiance meter, and achieving high precision radiation observation from visible to near infrared and periodic self-calibration research targets. In the self-calibration mode, the multiplex optical path module periodically introduces the spontaneous parametric down-conversion correlated photons, and the photon counting and coincidence detection module are used to calibrate the absolute quantum efficiency of the three channels. In the radiation observation mode, the multiplex optical path module introduces the low-light level target radiation and obtains the absolute spectral radiance of the observation target in the band of 460~1 550 nm at the same time. The calibration coefficient obtained by the self-calibration mode is used to correct the observation results. The effects of link error limited by radiation reference value transfer, optical decay of optical path and electronic decay of optical path on the measurement accuracy of microradiance are fundamentally solved. The visible near-infrared band adopts free space coupling mode and the short-wave infrared band adopts multi-mode fiber coupling mode. Through design optimization analysis, the focusing spots of the first and second channels meet the 300 μm pixel requirement of Si single photon detector, and the focusing spot of the third channel meets the 62.5 μm core diameter and 0.22 numerical aperture requirement of multi-mode fiber, all of them can be received by the detector photosensitive surface, meeting the design objectives. The method based on correlated photon calibration does not need to trace the high-precision primary standard in the laboratory and the lengthy standard transfer chain. By using the correlated photon generated in the process of parametric down-conversion, the calibration source of time, space and polarization can be obtained, and the high-precision observation of the low-light spectrum radiance from visible to near infrared band can be realized. The solution to the scientific problem of low-light observation instrument in space platform measurement can obtain higher calibration accuracy, and play an important role in climate monitoring, low-light radiation metrology, single-photon source radiance measurement and so on.
Dec. 25, 2023Vol. 52 Issue 12 1212002 (2023)
Lu YE, Xiangchao ZHANG, Junhua WANG, Min XU, and Liehua ZHENG
With the increasing requirements of complex shapes and high resolution of optical systems, the precision measurement of optical mirrors is of great challenge. In the grinding stage, a coordinate measurement machine is generally adopted, which is realized by contact measurement, but it suffers from long measurement time and low accuracy. In the polishing stage, laser interferometry is generally adopted. Due to its limited measurement range, a specially designed compensator is required for measuring an aspheric surface. Usually, it is impossible to achieve full aperture interferometric measurement of a surface with deep asphericity, especially when it has a large form deviation.Fortunately, the Phase Measuring Deflectometry (PMD) can overcome this problem, which has the advantages of fast measurement speed, low cost, high dynamic range and high flexibility. However, it also has limitations. First, the accuracy of system calibration directly affects the measurement accuracy. The camera is usually regarded as a pinhole camera. The internal and external parameters of the camera are obtained through complicated calibration. Images of a calibration plate are taken at different positions and poses, and the coordinates of each camera pixel are obtained accordingly. The traditional calibration method has a complicated process and it is greatly affected by the quality of the calibration plate. Moreover, camera calibration and geometric calibration are generally obtained separately, and there will be error coupling and propagation in the conversion of coordinate systems. Second, most industrial camera lenses adopt a symmetrical structure in order to eliminate aberrations. The aperture stop is located in the middle of the lens group. In order to directly specify the position of the camera stop, an external stop can be set at the front of the lens, which will greatly affect the camera's field angle and bring inconvenience to measurement. Third, a theoretical model is needed for the surface under test to estimate the position of measured points to solve the height slope ambiguity problem. Generally, a plane model or spherical model can be used as the initial guess, but large errors can be yielded when there exists severe deviations and the measurement accuracy is affected in turn.As a consequence, a pinhole camera lens is designed with external stop, which can be measured easily. The camera lens consists of four pieces, one of them is glued, and the lens has good image quality. The size of the standard spot diagram is much smaller than the size of Airy disk, and the distortion is 0.707%, which is superior to most commercial lenses. It eliminates the need for complicated camera calibration. Combined with the calibration of reflected light, the camera coordinates can be obtained quickly and accurately. The screen pixel coordinates can be conveniently converted to the workpiece coordinates by pre-calibration. In this paper, at least three non-collinear markers made of aluminum blocks are applied. The spatial position relationship between camera, screen and workpiece can be obtained by external devices such as a coordinate measurement machine, and the coordinate system is henceforth unified. The phase shift algorithm is used to establish the correspondences between camera and screen pixels. The coordinates of the intersection points between the reflected light and the off-axis aspheric surface were deduced by the formula. Finally, surface reconstruction can be achieved using the above data at one time, without the need for iterative calculation.An aluminum parabolic mirror with a diameter of 110 mm and a vertex curvature radius of 800 mm is used as the surface under test. Surface measurement is carried out by using the designed pinhole camera with an external stop and the calculating method of measured points. The experimental results show that the accuracy of the reconstruction results is of the same order of magnitude with the profilometer and laser interferometer, and the distribution of the obtained form deviations is consistent. In addition, low-order aberrations including power, coma and astigmatism can be accurately measured by deflectometry, which indicates that the geometric calibration accuracy is very high. The reconstruction results of deflectometry are subtracted pixel by pixel with the results by LuphoScan and interferometry, and the relative errors are 27 nm RMS and 20 nm RMS, respectively.Firstly, the material of tested mirror is aluminum, which is fabricated by a single point diamond turning machine. The central area is steep, and the entire surface can be captured by one spiral scan by LuphoScan, and the final surface datas are obtained by numerical interpolation. There will be a small deviation in some steepness areas due to sample size. Secondly, the profile data collected by the laser interferometer may not be of full aperture, and there may be data missing in the area with a large sphericity deviation at the edge. These two reasons can lead to the possibility of position dislocation in the surface alignment, and it is reasonable to believe that the actual measurement error should be less than 20 nm. This implies that the accuracy can meet the measurement requirements of optical mirrors from grinding to polishing stage.Deflectometry combines the advantages of coordinates measurement machines and interferometry, with high measurement accuracy, fast measurement speed, and a large dynamic range. It provides a reliable, economical and efficient tool for surface assessment in optical machining shop, and henceforth, and has a wide application prospect.
Dec. 25, 2023Vol. 52 Issue 12 1212003 (2023)
Jingfa LEI, Yin SUN, Miao ZHANG, Yongling LI, Ruhai ZHAO, and Hong SUN
During the measurement of surface topography on objects with high-reflective surface by numerical grating projection three-dimensional measurement technology, the acquired images may exhibit local overexposure or underexposure, which consequently disrupts the projected grating pattern and ultimately leads to a decline in measurement accuracy.In order to accurately measure the three-dimensional shape of objects with high-reflective surface, an improved automatic multiple exposure image fusion technique was proposed. Firstly, the appropriate measurement grayscale range was determined by fitting the grayscale response curve of the system, which further led to the determination of the exposure time range. Within the exposure time range, the exposure time was gradually increased with certain step size, and the camera synchronously captured and saved images at each exposure time. The number of points within the determined grayscale value range was statistically calculated by traversing the images. The image with the highest number of points within this range was selected as the datum exposure image, and its corresponding exposure time was considered the datum exposure time, while the point in the image with the smallest pixel grayscale value within this range was identified as the datum point. Secondly, the camera response function was fitted based on the transformation of the pixel grayscale value of the datum point with exposure time. According to the camera response function, the surface illumination value range of the measured object can be calculated, and the required exposure time and frequency for the current object can be determined based on the idea that different exposure times correspond to different illumination value ranges. Subsequently, a CCD camera was utilized to capture pure white images and grating pattern images projected onto the target object under various exposure durations. The images obtained from the pure white projection were utilized to generate masks, which were sequentially multiplied with their corresponding grating pattern images. The obtained images were superimposed after linear transformation to ensure that no additional highlights are generated near the original highlight area. Following this, a logarithmic transformation was applied to adjust the contrast of the images, resulting in an elevation of grayscale values in previously dim areas, thereby yielding a set of High Dynamic Range (HDR) grating pattern images. Finally, the three-dimensional point cloud data of the measured object was obtained by performing phase calculations and parameter calibration. Results showed that this method can accurately calculate exposure time and frequency, and the fused raster images were clearer and more complete.For standard blocks, water pump pressure plate sleeves, and return disks with high-reflective surface, the point cloud reconstruction rates were 99.80%, 99.20%, and 99.40%, respectively, improving the measurement accuracy of the surface morphology of objects with high-reflective surface. In order to further verify the measurement accuracy of the proposed method, three standard blocks with different lengths, consistent width, and a height of 9 mm were stacked to form a standard step block. The height difference between two adjacent planes of the standard step block was measured using the proposed methodology, yielding a measured height difference of 9.099 7 mm. The relative error of the height difference was calculated to be +1.108%, indicating that the proposed methodology demonstrates a considerable level of measurement accuracy.
Dec. 25, 2023Vol. 52 Issue 12 1212004 (2023)
Haoxiang LI, Wenjiang SHEN, and Huijun YU
In recent years, with the concept of Metaverse getting great attention, under the promotion of the development of Augmented Reality (AR), Virtual Reality (VR) and Mixed Reality (MR) technologies, the Laser Beam Scanning (LBS) including micro-mirrors of MEMS has been widely used in the field of micro-displays. The LBS technology enables high-resolution, high-brightness micro-displays. MEMS mirrors are important optical devices in LBS due to their compact structure, small size, and fast response speed. Of all the methods available for driving mirrors, piezoelectric driving has a high driving efficiency and response speed, and can be driven in microseconds. At the same time, piezoelectric materials are invertible, so they can be driven repeatedly without too much energy. These properties make piezoelectric materials suitable for fabrication of miniaturized display piezoelectric mirrors. Common piezoelectric thin film materials used in MEMS mirrors include AlN, AlScN, and piezoelectric ceramics (PZT). In the fabrication of piezoelectric mirrors, AlN and AlScN are compatible with semiconductor processes with fine linearity, high stability and low thermal drift. However, AlN and AlScN have lower piezoelectric coefficient, smaller driving forces, and require higher voltages, which are not suitable for large angle mirrors. PZT is a commonly used piezoelectric material. Although not compatible with semiconductor processes, its high electrical response, high piezoelectric coefficient, and high stability make it suitable for fabrication of miniaturized display piezoelectric mirrors.To meet the requirements of laser micro display applications, a MEMS piezoelectric mirror with diameter of 1.1 mm, optical angle of 40° and frequency of 31.11 kHz is designed and fabricated, which is suitable for high-speed scanning and small size application scenarios. The large angle piezoelectric MEMS mirror is designed, in which the torsion beam thickness is 40 μm, the length is 1.1 mm, the width is 200 μm. The results are validated by theoretical calculations and simulation analyses. By using inverse piezoelectric effect, the static angle of PZT multi-layer composite beam with one end fixed and one end free boundary condition under applied voltage is calculated. At the same time, the angle of resonance is calculated by solving the second-order equation of the mass-damped spring. After the calculation, the result is essentially as required. The simulation results show that the required mode of the device is torsion mode, which is well separated from other modes and does not have coupling, and when the target angle is 40° and the frequency is 31.08 kHz, the maximum von Mises stress of the mirror does not exceed the fracture limit of silicon, thus proving the reliability of the design.In the experiment, the electrical properties of 2 μm PZT thin film material were first tested. It was found to have an intrinsic piezoelectric coefficient d33 of 192.2 pm/V and a capacitance of 2.06 nF, meeting the requirements of large-angle driving forces. The complete device was successfully fabricated by multi-step lithography. The test voltage-angle curve shows that under the excitation of 32 V and 31.11 kHz, the mirror can reach an angle of 40.66°, and the thin film does not break down and the structure is not damaged. Tests on the frequency response curves show a quality factor of 1 155. At the same time, resonant frequency drifts are observed at different voltages due to the nonlinearity of the MEMS mechanics. In addition to these tests on device performance under different conditions such as voltage polarity and temperature changes, this study also tested voltage curves applied under different polarities to verify the impact of PZT thin film ferroelectricity on device performance and reminded that in future work, voltage direction should always be consistent (such as using a biased square wave signal) to avoid polarization reversal caused by changes in voltage direction leading to a decrease in angle. Also, we take the curve of device performance as a function of temperature. Within the working range of 0 ℃~100 ℃, the angle change does not exceed 1°. In the simulation experiment of the designed micro-mirror, the experimental results are compared with the theoretical calculation results, and it is found that the three fit well, indicating that the designed micro-mirror has a high controllability and stability, and provides strong support for the realization of high-precision scanning.In further research, the present study plans to introduce piezoresistive or piezoelectric angular feedback modules and implement closed-loop control to improve the performance of such devices. This will provide higher accuracy and stability for piezoelectric MEMS mirror applications and useful references for the development of micro display technologies.
Dec. 25, 2023Vol. 52 Issue 12 1223001 (2023)
Yulong GUAN, Xiaobing ZHENG, and Wenchao ZHAI
In the field of optical engineering, microscopic imaging measurement is an important means of optical installation and adjustment. To realize correlated photon imaging measurement and auxiliary monitoring in the process of correlated photon radiation reference source optical path system installation and adjustment, it is necessary to establish a microscopic imaging system with a broad spectrum spanning of 360~1 000 nm. Some scholars at home and abroad have designed a series of finite conjugate or infinite corrected objective lenses with high numerical aperture, large field of view, broad spectrum coverage, high magnification, et al. There are also a variety of commercial microscopic objective lenses, but the correlated photons band to be measured is beyond the applicable band range of current commercial microscopic objective lenses. A broadband plan-apochromatic microscope objective was designed in this study. The design of broadband microscope objective needs to consider the problem of apochromatism firstly. The apochromatism of refractive microscope objective is mainly realized by the diffractive optical elements or the combination of different glass materials, the diffractive optical elements are not suitable for precision optical systems, so the glass combination method is used for the design of apochromatic microscope objective. Based on the basic apochromatic theory, the model of compact three-piece lenses was selected, then was realized through a program script with MATLAB? software. The glass material chooses domestic CDGM glass library. Firstly, according to the range of wavelength, glass production frequency, price, and other indicators of the glass library for initial screening, the original glass library has a total of 304 kinds of glass, the final remaining 25 kinds of glass after the initial screening. Then, the least square method is used to calculate the optimal focal power allocation of each glass combination, and the glass combination is selected by the sum of the absolute focal power and the corresponding minimum residual chromatic aberration. In the end, the glass combination with better secondary spectral correction effect is obtained. In addition, the influence of a commonly used special optical material, CaF2, on secondary spectral correction was also studied. It is found that the introduction of CaF2 will improve the total imaging quality. Although the color focal shift will be larger, the color focal shift can still meet the requirements. Finally, the combination of CaF2, H-FK95N, H-LaF50B and H-LaF52 glasses was selected. By selecting an existing patent as the initial structure, an infinite-corrected and plan-apochromatic microscope objective and broad spectrum coverage with magnification of 20×, numerical aperture of 0.3, working distance of 10 mm, parfocal length of 60 mm, field of view of 0.66 mm and spectrum coverage of 360~1 000 nm was designed, without any aspheric sphere. The MTF curve, color focal shift, ray aberration, astigmatic field curves and distortion curves, longitudinal spherical aberration, RMS wavefront error and diffraction encircled energy distribution diagrams of the optical system were analyzed. The results showed that the MTF curve of the system was close to the diffraction limit at 80 lp/mm, the astigmatic field correction meet the international standard of flat field, and the other imaging indicators were also close to the diffraction limit. By sensitivity analysis in ZEMAX? software, the element tolerance, material tolerance and assembly tolerance of the microscope objective are reasonably allocated. The geometric MTF value at 80 lp/mm was selected as the evaluation indicator. After Monte Carlo analysis, the nominal MTF value of the microscope objective at 80 lp/mm was 0.887 9. In fact, there is an 80% probability that the MTF exceeds the value of 0.839 1, which means that the microscope objective can meet the requirements of image quality and manufacture. The design in this paper can provide technical reference for the design of the plan-apochromatic microscope objective, especially for the broadband apochromatic design.
Dec. 25, 2023Vol. 52 Issue 12 1223002 (2023)
© Copyright 2018-2021 | Chinese Laser Press.
All Rights Reserved 沪ICP备15018463号-20