


Please enter the answer below before you can view the full text.


2025
Volume: 52 Issue 2
33 Article(s)

Xiang Li, Qiang Zhao, Lei Guo, and Ying Li
ObjectiveIn optical fiber communication, the collimator is a fundamental component with substantial market demand. However, its manufacturing process has long been mired in manual or semiautomatic stages, resulting in low efficiency, high costs, and poor product consistency. Existing semiautomatic systems employ closed-loop feedback control based on the deviation of production data from predefined targets for global optimization, which leads to issues such as high computational burden, lengthy processing time, and sensitivity to production parameters. This study proposes a methodology that combines classical Gaussian beam propagation theory with nonlinear fitting, to swiftly achieve the target spot diameter during collimator fabrication.MethodsClassical Gaussian beam propagation theory was employed to perform nonlinear fitting on production process data. The independent variable was the distance between the optical fiber and lens, and the dependent variable was the detected collimator output spot diameter at the measurement position. Parameters such as lens length (L), fiber mode field radius (ω0), lens curvature radius (R), and lens refractive index (n) of the collimator were determined through fitting, deriving the distance between the optical fiber and lens corresponding to the target spot diameter in a single step. The nonlinear fitting of production data utilized the Levenberg?Marquardt algorithm. Considering the adaptability issues of different collimator models and the difficulty of obtaining ideal target values in practice, this study incorporates the actual measured spot diameters into subsequent rounds of nonlinear fitting to progressively approach the target, thereby enhancing the adaptability and efficiency of the algorithm.Results and DiscussionsClassical Gaussian beam propagation theory was employed for the nonlinear fitting of the production process data. Comparative testing with commercial systems, as depicted in Fig. 3, shows that the rolling fitting LM system optimizes within 1?2 steps on average to achieve the target spot diameter size, except for the fixed search points, thereby reducing the number of optimization steps by an average of 57% compared to commercial systems. As shown in Fig. 4, when faced with different collimator parameters, the rolling fitting LM system stabilizes the production of fiber collimators at an average of 18.3 s after switching the fiber parameters, with a standard error of 1.2 s, reducing the production time by 43.7% compared to commercial systems. The average spot diameter error is -0.14%, for a spot diameter reduction error of 1.0%. As illustrated in Fig. 5, even with changes in detection distance z, the algorithm maintains stable production time of 18?19 s, with the average accuracy of optimized spot diameter fluctuating within ±0.3% and the overall error fluctuation not exceeding ±2%. These results demonstrate the robustness and high consistency of the algorithm, indicating its strong resilience and minimal error susceptibility to product nonuniformity.ConclusionsIn this study, a system of nonlinear equations was established based on classical Gaussian beam formulas and actual measurement data, thereby formulating an objective function using the least-squares method and introducing a rolling optimization feedback mechanism to enhance the traditional LM algorithm. This allows the system to rapidly converge while intelligently searching for the target spot diameter, which differs significantly from traditional methods in imparting clear physical significance rather than a simple point-by-point search or abstract mathematical polynomial approximations, thereby significantly reducing the production time of the fiber collimators. The rolling fitting LM system required an average of five optimization steps with an average production time of 18.3 s per collimator. The average accuracy of optimized spot diameter was -0.2%, with an error fluctuation of ±1.1%. Compared to commercial systems, the spot diameter error range was reduced by 1.0%, ensuring higher quality assurance for fiber collimators. More importantly, the rolling fitting LM system reduced the production time for fiber collimators by over 43.7% compared to commercial systems, significantly enhancing automation efficiency. The system demonstrated robustness in consistently optimizing the steps, optimization time, and spot diameter error rates across different parameter configurations of fiber collimators, providing a method of significant reference value for optimization in fiber collimator industry.
Jan. 15, 2025Vol. 52 Issue 2 0205001 (2025)
Yi Yu, Youlong Yu, Peiming Wang, Qinzhi Zhou, and Qianchun Yu
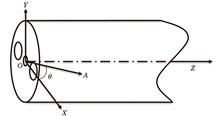
ObjectiveFiber lasers have provided many advantages over other lasers since their inception. In terms of structure, the optical fiber has a large surface-area-to-volume ratio; therefore, there is usually no need to add a large heat dissipation device, making the fiber laser more compact. This provides significant advantages over traditional solid-state lasers. In addition, fiber lasers are less sensitive to microscopic contaminants and exhibit excellent optical transmission characteristics. In terms of optical transmission, as excellent optical waveguide devices, optical fibers can effectively constrain light beams without the need for cumbersome alignment procedures, thus greatly simplifying actual operations. Practical applications often have certain requirements for the polarization of light, and the laser output is usually natural or linearly polarized light. Therefore, adjustment of the polarization state of the laser output has attracted much attention. Among the currently reported methods for controlling the laser polarization state, adjustment based on linear cavity structures is prone to standing waves and hole-burning phenomena, thereby affecting the gain, whereas special optical devices (such as liquid-crystal light valves, metasurface materials, and semi-circular materials) are used outside the cavity. Wave plates regulate the polarization state of the output. Although their flexibility is high, the beam quality is low. In addition, the devices in the adjustment optical path are connected through a spatial optical path, which requires high collimation of the system. Therefore, this study reports a new all-fiber ring-cavity laser output device that introduces a side-hole fiber (SHF) into the cavity to obtain laser output in different polarization states by twisting the SHF. The proposed structure is simple and easy to operate and provides new ideas for polarization-based sensing and measurement technology.MethodsIn this study, the ellipticity and azimuth angle were used to characterize the polarization state of the laser. First, the polarization direction of the polarizer in the ring cavity, X-axis of the SHF, and polarization direction of the analyzer, were designed to coincide. After twisting the SHF, the analyzer was rotated, and the minimum and maximum values of the output laser energy were observed using a power meter. The ratio of these values represents the size of the ellipticity. Concurrently, the angle of rotation of the analyzer was determined as the output laser energy was being observed. The azimuthal angle was obtained. A laser polarization-adjustment device was also used to measure the torsion angle, which can be obtained by monitoring the change in the azimuth angle. The SHF and fiber grating (FBG) were connected in series and then embedded into the cavity of the ring laser. The changes in the output laser wavelength and energy were monitored by a spectrometer for the simultaneous measurement of torsion angle and strain.Results and DiscussionsWhen the twist angle θ was 2°, 53°, 91°, 160° and 180°, the output of laser was linearly polarized light. When θ was 0° and 90°, the ellipticity tan γ did not achieve the minimum value as expected. This is mainly because when the light emitted from the SHF is transmitted to the analyzer through a long ordinary optical fiber, local microbending causes the polarization state to change. In addition, measurement errors have an impact on the results. When θ was 53° and 160°, the output laser was also linearly polarized light, because φ is located near kπ (k is an integer) at this time, so tan γ is close to 0. When θ was 91°?124° and 124°?160°, the maximum variation range of tan γ was 0.02?0.48 (Fig. 4). When θ was 124°?160°, the fitting degree R2 between tan γ and θ exceeded 0.98 (Table 1). When θ was 5°?97°, the azimuth angle decreased with increasing θ; when θ was 97°?180°, it increased with θ (Fig. 5). When θ was 5°?97°, the fitting degree of the azimuth angle and θ exceeded 0.98 (Table 2). The laser polarization adjustment effect was improved by changing the angle between the polarization direction of the incident light and the X-axis of the SHF when the twist angle was 0° (Fig. 6). A polarization adjustment device was used to measure the torsion angle. In the range of 5° to 97°, the sensing sensitivity of the torsion angle was -1.0757 (Fig. 7). After the SHF and FBG were connected in series and embedded in the cavity of the ring laser, the output laser intensity was 0.0489 mW; the optical signal-to-noise ratio was approximately 64 dB; and the corresponding 3 dB bandwidth was approximately 0.015 nm (Fig. 8). Within the range of 0°?220°, the output laser energy twist angle first increased and then decreased, and the output laser wavelength remained unchanged with the twist angle; within the range of 0?1533×10-6, the output laser energy changed periodically with strain, and the output laser wavelength changed linearly with strain (Figs. 9 and 10).ConclusionsBased on the experimental results, when θ is 124°?160°, the maximum variation range of the output laser tan γ is0.02?0.48, and when θ is 5°?97°, the output laser azimuth angle can both be effectively adjusted by twisting the SHF. A polarization adjustment device was used for torsion angle sensing in the range of 5°?97 °. Embedding SHF and FBG in the ring laser cavity in series, provides the advantages of high signal-to-noise ratio and high measurement accuracy compared to traditional sensors that measure the torsion angle and strain. From the experimental results, the sensitivity coefficients of SHF and FBG to torsion angle changes and strain changes can also be obtained. After monitoring the output laser wavelength change Δλ and energy change ΔP through a spectrometer, these two parameters can be measured simultaneously by substituting the torsion angle and strain matrix.
Jan. 20, 2025Vol. 52 Issue 2 0206001 (2025)
Luwei Shuai, Lei Ye, Xuan Li, Zhaoyong Wang, Kan Gao, and Qing Ye
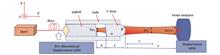
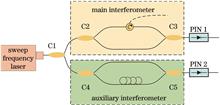
ObjectiveAs an advanced fiber-optic sensing technology, optical frequency domain reflection (OFDR) has attracted increasing attention from researchers since its first proposal in the 1980s, owing to its advantages of high spatial resolution, high sensitivity, and high precision range. However, as the detection accuracy improves, errors and noise in some signal-processing processes can affect OFDR detection. Harmonic noise is common in analog signal processing and analog-to-digital converters. Operational amplifiers, transistors, and analog-to-digital converter chips, which are commonly used in analog signal processing, introduce harmonic noise. Because harmonic noise is generally separated from the measured signal in the frequency domain, traditional filters can eliminate it. However, this does not apply to OFDR signals. When harmonic noise appears in a signal’s frequency domain, it may interfere with the OFDR detection or sensing results, causing sensing errors or erroneous judgment results.In this study, we design a real-time short-term frequency variable-coefficient finite-length impulse response (STF-VCFIR) filter system. We use a field-programmable gate array (FPGA) as the real-time processing unit of the system and design a real-time computing method based on the pipeline characteristics of FPGA processing.MethodsIn this study, we analyzed the impact of harmonic noise on the OFDR and theoretically calculated the location of harmonic-noise occurrences. Through analysis, we know that the position of harmonics in the spectrum changes with the number of harmonics and may not necessarily be greater than the signal position. However, when the harmonic frequency is lower than the signal frequency, the harmonics overlap with the signal and are difficult to remove. This implies that harmonic signals must be filtered out before resampling. We drew a time-frequency graph of the OFDR signal and compared it with those of traditional filters. Thus, we know that the fixed cut-off frequency of traditional filters cannot completely eliminate harmonic noise.In summary, we proposed an ideal filter model that can filter harmonic noise. A real-time short-term frequency variable-coefficient finite-length impulse response (STF-VCFIR) filter system was designed based on an ideal filter model. The system used an FPGA as the real-time processing platform and obtained the short-term frequency by zero-crossing counting the auxiliary interferometer signal. It then selected filter coefficients based on the short-term frequency to obtain a dynamic cut-off frequency and avoid excessive storage-space consumption.Results and DiscussionsTo verify the effectiveness and performance of the STF-VCFIR filtering system in practical applications, we construct an OFDR experimental platform. The TSL-710 frequency-scanning laser has a scanning range of 1549.5?1550.5 nm (specific range is 1 nm), a scanning speed of 40 nm/s, and a theoretical spatial resolution of about 0.8 mm. The Newport 1811 photodetector has a conversion bandwidth of 0?125 MHz. The arm-length difference of the auxiliary interferometer is 150.0001 m and the maximum theoretical detection distance is 75 m.Data are collected, analyzed and processed separately using filtering-free, fixed-coefficient filtering and STF-VCFIR filtering. The fixed-coefficient FIR filter adopts a 63rd-order FIR filter with a 6 MHz cut-off frequency. The Hamming-window function-design method is used. The processing clock is synchronized with the sampling clock. The STF-VCFIR filter adopts a 63rd-order FIR filter with a segmentation coefficient of 32 segments and a cut-off frequancy range of 0.1 MHz?6 MHz, and all designs adopt Hamming-window functions.Both filter types are implemented in the FPGA using fixed-point calculations. A single coefficient has a bit width of 16 bits and a total bit width of 512 bits (16×64/2). The coefficient-pool address has a bit width of 5 bits, occupying 2 kB of space. Owing to the use of FPGA calculations, the operation time of the filtering system is synchronized with the sampling time, with a difference of only three clock beats, enabling real-time processing.In the experiment, we compare the complete waveform and detailed images processed using the three algorithms. By observing the complete waveform, we know that the filtering algorithm has a minimal impact on the signal within the passband and the relative maximum error of the test results is 0.025%. By observing the details, we know that the traditional fixed-coefficient FIR filter can reduce the harmonic peaks; however, its effect is limited. The STF-VCFIR filtering algorithm can significantly suppress harmonic noise.ConclusionsThe experimental results show that the system can eliminate harmonic noise in real time with a maximum elimination ability of over 8 dB. At this point, the intensity of the harmonic noise is smaller than the noise fluctuation range, thus reducing the probability of a sensing error or misjudging the harmonic noise as a reflection point.However, this study still has fundamental limitations. The measurement of the short-term frequency lags behind the frequency of the measured signal because the zero-crossing counter outputs the previous cycle, which can lead to an error between the cut-off and current frequencies. However, because the OFDR frequency signal does not exhibit sudden changes, a fixed-frequency offset can be used to solve the problem. In addition, directly replacing the filter coefficients in this study to achieve a dynamic cut-off frequency can smooth the filter transition and further approximate an ideal filter. These points will be further discussed in the future.
Jan. 20, 2025Vol. 52 Issue 2 0206002 (2025)
Point Cloud Shadow Channel Model and Its Application in Indoor Visible‐Light Fingerprint Positioning
Xiaoli Hu, Qian Wang, Ling Qin, Fengying Wang, and Jianyong Yu
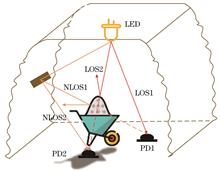
ObjectiveThe impenetrable nature of optical signal propagation renders visible-light communication (VLC) a widely adopted communication method for confidential-information transmission. Moreover, the advantages of green environmental protection, no electromagnetic interference, and the ability to alleviate the shortage of spectrum resources allow the applications of VLC to expand from indoors to hospitals, mines, underwater, etc. However, the limitations of light propagation result in visible light being adversely affected by obstacles. The collision of beams with obstacles creates varying degrees of optical-power loss. Additionally, the visible-light positioning (VLP) performance achieved by relying on the received signal strength (RSS) deteriorates. In recent years, numerous studies pertaining to visible light have been performed under obstacle environments; however, most of them consider the human body as the main research object and simulate it as a three-dimensional or planar shape as a general model of obstacles, which is not adequately precise to express the characteristics of different obstacle types. Therefore, this study extracts the digital features of obstacles based on point cloud technology to realize the generalized expression of obstacles and proposes a quantitative analysis method for point cloud shadows, based on which a visible-light shadow channel model with high applicability is established. In this study, an experimental site was established to validate the point cloud shading analysis method and the reliability of the point cloud channel model. Simultaneously, the proposed model was used to simulate and analyze the shading of optical signals and power loss under different link propagations. A two-layer BP neural network optimized using a genetic algorithm (GA-BP) was applied to realize fingerprint positioning, and the effect of obstacles on the VLP performance as well as possible solutions were analyzed.MethodsFirst, a depth camera was used to scan obstacles from different angles to obtain a multi-slice point cloud, and a complete obstacle point cloud model was generated using iterative closest point (ICP) algorithm registration. To reduce the time cost and the complexity of the algorithm, the complete obstacle point cloud must be downsampled. To avoid destroying the structural features of the obstacle, we adopted the voxel downsampling method. After performing the two steps above, the point cloud data were preprocessed completely and obstacles were placed in the conventional channel space via a coordinate-system conversion to complete the quantitative analysis of shadows. The core idea of point cloud shadow quantization is to calculate the intersection point of the light link passing through obstacles and falling on the receiving plane in space based on the principle of light propagation along a straight line, which is the shadow point. Subsequently, the convex hull of this shadow point set, which is a rough shadow area, is obtained. The surfaces of some obstacles in the actual environment are not completely closed; therefore, after the convex hull is obtained, one must determine whether the distance between the receiver coordinate point and the nearest neighbor in the set of shadowed points satisfies the spacing requirements. When the receiver coordinate point is located inside the convex packet and fulfills the conditions of spacing judgment, the optical link is obstructed by obstacles and the optical signal cannot reach the receiver. Thus, the shadowing coefficient is set to 0; otherwise, it is set to 1. A point cloud shadow channel model can be established by combining this coefficient with the channel DC-gain formula. In this study, a 2.6 m×2.6 m×2 m experimental site was established to verify the reliability of the shadow channel model developed based on the point cloud shadow-quantization method. The signal-power value of the experimental ground was measured, the simulated power value of the experimental environment was calculated based on the proposed model, and the power-distribution maps of the two environments were obtained for comparison. Finally, an application analysis of the proposed model was performed by predicting the positioning results using the GA-BP network in the simulation space.Results and DiscussionsBased on the experimental-site measurements and simulation calculations, the shaded regions in the power-distribution maps are highly identical (Fig. 4). Meanwhile, the results of error calculation show that the average error of the normalized power values in the two shaded regions is only 0.0277, whereas the maximum error is 0.1671 (Fig. 5). The experimental results indicate that the point cloud quantization analysis method is effective; therefore, we simulated the power distribution with a higher density of receiving points in a 2.6 m×2.6 m×3 m simulation space based on the point cloud shadow channel model. The results show that owing to obstacles, the average total received power in the shadow area decreases from 6.52×10⁻⁶ to 3.88×10⁻⁶ W, the average contribution ratio of direct power decreases to 23.92%, and the power decreases to 0 W in most areas. Although the primary reflected power is similarly reduced (with a minimum value of 1.51×10⁻⁶ W), the average contribution ratio increases to 76.08%, which mitigates the substantial power loss (Table 3). In the fingerprint positioning application based on the proposed model, the root-mean-square error (RMSE) reaches 20.82 cm when the direct power is used as a feature, and the maximum error is 2.67 m (Table 5). Despite the increase in data, the prediction effect of the target points in the shaded area still exhibits significant errors. By contrast, when combining the reflected power for zonal positioning, the RMSE reduced to 1.58 cm, and the maximum error is only 13.58 cm, which improved the positioning performance considerably.ConclusionsIn this study, we focused on the effect of obstacles, which is a typical feature in complex environments, on visible-light signal propagation using point cloud technology. Based on point cloud simulation of obstacles to obtain their specific three-dimensional coordinates in the channel space as well as the principle of light propagation, a point cloud shadow quantization analysis method was proposed. Additionally, based on the conventional indoor VLC channel model fully integrated with obstacles to achieve light obstruction, we deduced the channel-gain formula. The effectiveness of the point cloud shadow-analysis method was verified on a 2.6 m×2.6 m×2 m experimental platform. Differences in the shadow areas formed by optical signals propagating in different links as well as the degrees of direct and reflected power losses were analyzed via a simulation based on the proposed model. Through the model application of visible-light fingerprint positioning, the adverse effect of obstacles on the positioning performance was analyzed. The RMSE was 20.82 cm when only direct power was used, whereas it was 1.58 cm when the partitioned positioning method combined with reflected power, as proposed herein, was adopted. The point cloud channel model established in this study provides an effective method for communication and positioning research in an environment with obstacles, and its application value is significant.
Jan. 20, 2025Vol. 52 Issue 2 0206003 (2025)
Zhixi Yao, Yu Wang, Zhijie Sun, Qing Bai, Xuan Wang, Xin Liu, and Baoquan Jin
ObjectiveThe conventional single-pulse-based Brillouin optical time-domain reflectometer (BOTDR) had a low signal-to-noise ratio (SNR) in long-distance detection, limiting the sensing distance. Increasing the pulse width or peak power of a single pulse to enhance the SNR could decrease spatial resolution or induce nonlinear effects in the sensing fiber, reducing the measurement accuracy of the Brillouin frequency shift (BFS). Therefore, an effective method to extend the sensing distance without compromising spatial resolution was needed.MethodsIn this study, a random-sequence-based pulse code modulation scheme was adopted. The optical energy detection of BOTDR was enhanced by injecting randomly encoded pulses with varying arrays into the system. The encoding parameters were optimized to avoid nonlinear effects and extend the sensing distance. First, the time-domain distribution and self-correlation properties of random pulse sequence signals were analyzed, and the decoding principle of random pulse detection BOTDR was explained. Then, the influences of coding length and the number of coding groups on the side-lobe noise of the self-correlation function and the accuracy of the decoding results were studied by simulation. Next, a long-distance BOTDR sensor was built, and experiments were conducted using a set of random pulse codes with a peak power of 30 mW, a coding length of 640 bit, and 20 coding groups.Results and DiscussionsSimulations showed that increasing the coding length (L) or the number of coding groups (M) raised the peak-to-side lobe ratio (PSLR). As L and M increased, the PSLR improvement rate slowed. By optimizing the PSLR to achieve low side-lobe characteristics, a high-performance random sequence-coded BOTDR was achieved. Both L and M affected the self-correlation characteristics and sensor performance. Specifically, with a fixed M, increasing L caused the decoding curve to approach the single-pulse simulation curve, reducing the mean absolute error (MAE). When L<640 bit, the MAE decreased rapidly, but beyond 640 bit, the reduction rate slowed (Fig. 6). With a fixed L, increasing M also improved accuracy, and the MAE decreased rapidly when M≤20. Beyond this, the reduction rate slowed (Fig. 7). In experimental studies, considering nonlinear effects (Figs. 11, 12) and BFS, root-mean-square-error (RMSE), and distance distribution (Fig. 13), a coding length of about 640 bit achieved optimal energy distribution and sensing distance. As M increased, the BFS measurement accuracy improved, and RMSE decreased. When M≥20, RMSE stabilized at 3 MHz. However, increasing M also increased sensor measurement and demodulation time (Fig. 15). Considering the trade-off between measurement speed and sensor performance, the optimal scheme used a coding length of 640 bit and 20 coding groups, achieving a spatial resolution of 2 m and an effective sensing distance of 81.23 km.ConclusionsThis study applied a random-sequence-based pulse-code modulation technique to long-distance BOTDR sensors, optimizing accuracy and sensing distance while maintaining spatial resolution. Experimental results demonstrated that using 20 coding groups of 640 bit random pulse coding with 2000 times accumulation averaging achieved an effective sensing distance of 81.23 km, a spatial resolution of 2 m, and an RMSE of ≤3 MHz. The proposed coding scheme significantly enhanced BOTDR detection distance and had broad applications in monitoring large-scale infrastructures like long-distance cables, submarine cables, and oil or gas pipelines.
Jan. 20, 2025Vol. 52 Issue 2 0206004 (2025)
Xinyuan Du, Qi Liu, Longsheng Wang, Yuanyuan Guo, Anbang Wang, and Yuncai Wang
ObjectiveEnhancing the security of chaotic secure optical communication is a key focus of current research. Efforts are being devoted to eliminating the time-delay signatures of chaotic carriers to prevent eavesdroppers from acquiring critical parameters, such as the external cavity length. Additional efforts are being made to expand the hardware parameter space of the chaotic transceiver to increase the difficulty of brute force attacks by the eavesdropper. The premise for the eavesdropper to successfully decrypt a chaotic encrypted signal lies in the ability of the eavesdropper to reconstruct the chaotic carrier synchronized with legitimate users. However, current chaotic secure optical communication has not yet verified the eavesdropping reconstruction of chaos synchronization. To address this issue, this study conducts theoretical and experimental research on the eavesdropping reconstruction of chaos synchronization. The results indicate that the quality of eavesdropped chaos synchronization is inferior to that of legitimate chaos synchronization. The aforementioned findings provide a foundation for the security analysis and enhancement of secure optical communication based on chaos synchronization.MethodsThe drive signal (drive) is split into two beams. One beam is injected into a local response laser (RLA) while the other beam passes through an optical fiber and is amplified by an erbium-doped fiber amplifier (EDFA) prior to its injection into another response laser (RLB). This setup achieves common signal-induced chaos synchronization between legitimate users. An eavesdropper located near the drive source intercepts a portion of the drive signal and amplifies it, and then injects the amplified drive signal into a laser to reconstruct the chaos synchronization. To investigate the capability of the eavesdropper to reconstruct the chaos synchronization, we utilize the VPI optical transmission line laser model to construct the simulation system. Moreover, a proof-of-concept experiment on the reconstruction of the chaos synchronization by an eavesdropper is carried out. The noise figures of the erbium-doped fiber amplifiers (EDFAs) used in the simulation and experiment are both 4.5 dB.Results and DiscussionsFirst, typical theoretical results of chaos synchronization with a synchronization coefficient of 0.982 for the legitimate users (Fig. 2) and 0.924 for the eavesdropper (Fig. 3) are presented. The synchronization quality reconstructed by the eavesdropper is inferior to that achieved by the legitimate users because the high-gain optical amplification introduces significant spontaneous emission noise and reduces the signal-to-noise ratio of the drive signal obtained by the eavesdropper. Next, the effects of the optical amplification gain, internal laser parameter mismatch, and fiber transmission distance on the eavesdropping reconstruction of the chaos synchronization are investigated theoretically. Spontaneous emission noise is further accumulated with increasing the gain of optical amplification, which results in a gradual decrease in the eavesdropping synchronization coefficient (Fig. 4). Under high-gain optical amplification, the eavesdropping synchronization quality is highly sensitive to laser parameter mismatch, which contributes to the maintenance of the advantage of chaos synchronization for the legitimate users (Fig. 5). As the distance increases, the synchronization coefficient for the legitimate users decreases gradually, whereas that of the eavesdropper remains unchanged. When the transmission distance is less than 162.5 km, the legitimate users maintain a chaos synchronization advantage over the eavesdropper (Fig. 6). Finally, a proof-of-concept experiment demonstrating the chaos synchronization advantage is conducted (Figs. 7?9), and synchronization coefficients of 0.966 and 0.876 are achieved by the legitimate users and eavesdropper, respectively.ConclusionsIn this study, validation experiments on the eavesdropping reconstruction of common signal-induced chaos synchronization are conducted. Theoretical and experimental results confirm that legitimate users have an advantage in chaos synchronization over the eavesdropper. This is primarily owing to the introduction of significant spontaneous emission noise by the high-gain optical amplifier, which degrades the chaos synchronization quality for the eavesdropper. The effects of the optical amplification gain, internal laser parameter mismatch, and fiber transmission distance on the eavesdropping reconstruction of chaos synchronization are explored. Hence, the results of this research enrich the study of security analysis in chaotic secure optical communication and provide a foundation upon which to enhance its security.
Jan. 20, 2025Vol. 52 Issue 2 0206005 (2025)
Zhen Liu, Yongke Zhang, Qihao Shen, Xingkai He, Liangyou Duan, Siyin Liu, and Dingfu Zhou
ObjectiveCoherent Doppler wind radars are widely used in aviation safety, climate modeling, and wind-farm-project optimization. As the demand for the radar detection range increases, the requirement for higher single-pulse energy in single-frequency lasers increases accordingly. However, in single-frequency fiber-pulsed amplifiers, energy improvement is significantly hindered by thermal effects and nonlinear effects in the fiber, such as stimulated Brillouin scattering. Using coherent beam-combining (CBC) technology, several fiber lasers can be combined to increase the output energy exponentially while maintaining the line width, beam quality, and polarization degree, as well as overcome the limited output energy of single-frequency fiber amplifiers. In CBC systems, achieving multibeam phase locking requires high-speed and precise phase control. In an active CBC system, the output-light phase of the combined beam is detected and a closed-loop feedback forms to correct the phase error, thus achieving phase locking for each sub-beam. Single-detector electronic frequency is an active phase-control technology that uses orthogonal demodulation to obtain the error signal. The error signal, which is proportional to the phase difference between the measured beam and other beams, provides excellent phase-error correction for multibeam and high-power coherent combination systems. For the locking of optical coherence by single-detector electronic-frequency tagging (LOCSET) CBC system, parameter optimization is crucial for enhancing active phase control.MethodsIn this study, the principle of a single-detector electronic-frequency algorithm for achieving CBC was analyzed; subsequently, two optical-fiber CBC systems were constructed. The selection criteria for the single-detector electronic-frequency algorithm parameters were investigated experimentally. In the experiments, five parameters?integration time, modulating signal amplitude, modulating signal frequency, feedback coefficient, and control loop delay?were varied. The criteria for selecting the parameters of the single-detector electronic-frequency algorithm were summarized.Results and DiscussionsThe longer the integration time τ, the smaller is the error caused by the non-integral modulation signal period. To minimize the effect of non-integral integration time on the synthesis effect, the integration time should be more than 10 times the modulation signal period T (Fig. 3). Increasing the modulating signal amplitude β can reduce the error caused by τ being a non-integer multiple of T. However, higher β values introduce phase noise, which worsens the phase-locking effect. To satisfy the coherent synthesis output target, β should be set within a specific range in the LOCSET system (Fig. 4). The phase error ?? between the demodulated and marked signals must be less than 90° owing to the delay in the control loop. As the modulation frequency increases, greater precision is required for loop-delay error compensation (Fig. 6). The control bandwidth increases with the modulation frequency. Under the system inherent delay of 5 ms, a 100 kHz modulation frequency minimally affects the iteration time and slightly changes the control bandwidth. In practical applications, optimizing the modulation frequency while considering the phase noise, inherent delay, and control circuit costs can improve both the control bandwidth and iteration rate of the coherent synthesis system (Table 1). As the feedback coefficient increases, the effective control bandwidth increases. An appropriate feedback coefficient should be selected that balances between the control bandwidth and phase control accuracy. For the system, the optimal value is λ/20 (Figs. 5 and 9).ConclusionsIn this study, two all-fiber CBC systems were constructed based on the LOCSET algorithm. Additionally, the effects of integration time, modulating signal amplitude, modulating signal frequency, feedback coefficient, and control loop delay on active phase control were investigated experimentally. The experimental results show that to mitigate the effects of the non-integral integration time on the combining effect, the integration time should be approximately 10 times the modulation signal period. The modulation signal amplitude should be within a specific range to achieve the target combining efficiency; as the integration time increases, the lower limit of the required amplitude decreases. Higher modulation signal frequencies require greater precision in loop-delay error compensation and a broader system control bandwidth. The feedback coefficient should be selected based on the array size and phase noise level to balance between the control bandwidth and phase-control accuracy. Additionally, the delay between the quadrature demodulation signal and modulated signal should be less than 90° to prevent lock loss in the control system. This study serves as a basis for parameter selection in the LOCSET algorithm and provides a direction for optimizing CBC technology to enhance the energy of coherent-laser wind radar light sources.
Jan. 16, 2025Vol. 52 Issue 2 0206006 (2025)
Huanlin Liu, Yuxin Xie, Yong Chen, Xiaonan Gong, Haonan Chen, Wenjie Song, and Bo Liu
ObjectiveVisible light communication (VLC) can provide an ultra-large bandwidth of 400 THz without spectrum authorization while offering high energy efficiency and green energy conservation, thereby making it an important candidate communication technology for sixth-generation mobile communication networks. D2D communication can directly establish a data transmission link between devices, and such links do not require passage through a base station. The VLC-D2D communication pattern can solve the communication connection problems of blind spot devices caused by VLCs line-of-sight link blockage and short communication distances.MethodsA device-relay incentive mechanism using simultaneous lightweight information and power transfer (DRIM-SLP) was proposed for indoor visible light communication (VLC) to meet the communication requirements of large-scale device access and blind devices in the six-generation mobile communication networks. A network resource bidding allocation mechanism was introduced, and individual, reasonable, and incentive-compatible blind spot device payments were adopted. Then, VLC AP system revenue, payment rules for relay device incentives, utility functions of relay devices, VLC APs, VLC-D2D system utility functions, and social utility evaluation methods were designed to prevent malicious devices from disrupting the relay bidding. Then, the Lagrangian duality method was used to optimize the power allocation and bidding prices of the VLC APs and relay devices to improve the utility value of the relay devices and VLC APs as well as maintain a favorable environment for VLC-D2D resource bidding and auctions.Results and DiscussionsWe use the Monte Carlo method to verify the performance of the proposed DRIM-SLP in an indoor environment of 10 m×10 m×3 m by comparing it with the random selection mechanism (RSM), HAMCG, SGMPT, and SGMPS (Table 1). Sixteen VLC APs are uniformly distributed on the indoor ceiling at a distance of 2.5 m apart. One RF AP is placed at the center of the ceiling, and |J|=3 DRs are randomly located in the area where the light is obstructed and cannot access the VLC network.ConclusionsIn response to the D2D communication demand for VLC communication coverage blind spots, by considering the selfish behavior of candidate VLC relay devices, owing to their own energy limitations or external benefits damage, a SLIPT-assisted indoor VLC-D2D relay utility incentive mechanism is proposed in this study. We design a utility function that can encourage devices to adopt reasonable bidding prices to create a favorable bidding resource environment and realize the maximum utility of the VLC AP while balancing the increase in relay equipment utility with the improvement in social utility. With the development of the six-generation mobile communication applications, by fully considering the interests of communication equipment and operators as well as incentivizing more terminal devices to share and unload VLC AP tasks, D2D can achieve a communication method with a larger communication range coverage, which is of great significance for improving indoor communication quality.1) As the proportion of selfish devices in the system increases, the blind spot device access success ratios of DRIM-SLP, SGMPS, SGMPT, and HAMCG with incentive mechanisms begin to decrease, whereas the proposed DRIM-SLP decreases slowly and reached its highest value with a proportion of selfish devices (Fig. 2).2) As the number of devices increases, both the normalized device utility and the VLC AP utility slowly increase. For a given number of devices, the proposed DRIM-SLP achieves the highest normalized utility value. When the number of devices is 24, the proposed DRIM-SLP mechanism can improve the normalized utility of the VLC AP and relay device by 22.87% and 1.2%, respectively (Fig. 3).3) When the unit price of information transmission provided by blind-spot devices increases, both the mean social utility value and the mean utility value of DRIM-SLP increase (Fig. 4). When the preference coefficient for energy collection increases, the mean social utility value, VLC AP utility value, and relay device utility obtained by the DRIM-SLP increase simultaneously (Fig. 5).
Jan. 16, 2025Vol. 52 Issue 2 0206007 (2025)
Tingyu Zhang, Xin Gao, Xunbo Yu, Xudong Wen, Jinhong He, Zhaohe Zhang, Binbin Yan, and Xinzhu Sang
ObjectiveAs technology progresses, especially with the maturation of virtual reality, three-dimensional (3D) light field display (LFD) emerges as a focal point in both scientific research and industry. This technology enables users to view lifelike 3D scenes without any external devices, offering a unique immersive visual experience. In 3D-LFD, the parameters such as viewing angle, spatial resolution, and viewpoint density are essential in assessing the 3D image quality. Moreover, viewpoint density, indicative of the density in constructing 3D scenes, is a critical metric for evaluating the fidelity of 3D-LFD, directly influencing the realism and accuracy of the reconstructed scenes. Recently, our research group has been dedicated to enhancing viewpoint density and a method based on spatial multiplexing for increasing viewpoint density has been proposed, utilizing 64 projectors to capture information of 3D objects from different angles, and then reproducing the spatial information of these objects through a holographic screen in front of the projectors. This method successfully creates a large-scale, true-color, real-time 3D display system with a viewpoint density of 1.42/(°). However, existing methods often face a common challenge: an increase in the total volume of information. In traditional 3D-LFD systems, enhancing viewpoint density typically requires more data transmission and processing, leading to increased system complexity and higher demands on computational and bandwidth resources. Furthermore, traditional 3D display technologies have an inherent contradiction: under a fixed volume of information, there is a trade-off among viewing angle, viewpoint density, and spatial resolution. In other words, simply increasing viewpoint density might reduce the viewing angle or spatial resolution. We hope that our strategy and work will be helpful for the design of large-angle 3D-LFDs and the optimization of viewpoint density.MethodsFirstly, the impact of viewpoint density on the image quality of 3D-LFD is analyzed. Black and white striped patterns with identical spatial frequencies are used as test images, and computational simulations are employed to reconstruct them on the same depth plane, determining the central and peripheral viewpoint densities and fitting the relationship curve between viewing angle and viewpoint density. Subsequently, a novel lens is designed to realize the optical path distribution outlined in the relationship curve. Unlike traditional single lenses, the designed lens structure needs to be able to modulate the light emitted from pixels non-uniformly and also meet the distribution requirements of viewpoint density. This design must satisfy three conditions: 1) a viewing angle of 100° with a lens period of 1.12 mm; 2) the root mean square radius of the optical diffuse spot on the liquid crystal display (LCD) surface should be less than the size of its sub-pixels (62.5 μm); 3) the main light density distribution of the pixels after modulation by the lens should be consistent with the required viewpoint density curve distribution. Finally, to reconstruct a natural and smooth 3D scene, multi-view information of the scene must be collected and recorded. Using a virtual camera array with off-axis pickup, digital sampling of the direction and intensity of the target virtual 3D object is conducted. By deriving the formula for the propagation of light rays in the 3D-LFD system, the mathematical mapping relationship between the sub-pixels and the designed viewpoints can be calculated. This allows for determining the sub-pixel positions in the synthesized image loaded on the LCD corresponding to the parallax image seen by an observer at a certain position, thereby calculating the arrangement of sub-pixels in the lens unit.Results and DiscussionsTo validate the feasibility of the proposed method, related simulations and optical experiments are conducted. The display system is composed of an LCD panel and the designed compound lens array with gradual main light density (GDLA). The LCD is used to load encoded images containing 3D information, and after modulation by the GDLA, 3D images are constructed in space, forming the viewpoint distribution that is dense in the center and gradually sparser towards the edges (Fig. 12). With a viewing angle of 100° and an off-screen depth of 300 mm, the simulation results of the 3D light field are compared between traditional and proposed methods (Fig. 13). The proposed GDLA, while suppressing aberrations, also achieves a distribution of viewpoint density that is dense in the middle and gradually sparser towards the edges. Therefore, the structural similarity (SSIM) value of the edge viewing area 3D image is lower than that of the traditional viewpoint density uniformity (TVDU). But because GDLA achieves a higher viewpoint density in the central region, the SSIM value of 3D image in the central viewing area is 0.954, which is higher than that of the traditional method. The GDLA optimizes the viewpoint density, effectively enhancing the density in critical areas and improving the quality of 3D images (Fig. 14). Further, an experimental optical display system is set up, achieving a high-definition 3D-LFD with a display size of 65 inches (1 inch≈2.54 cm), a viewing angle of 100°, and a display depth of 300 mm with a gradual viewpoint density (Fig. 15). This system holds significant potential for applications in medical education and auxiliary medical diagnosis.ConclusionsConsidering the inherent trade-offs among the number of viewpoints, viewing angle, and depth range, we propose a large-angle 3D-LFD with gradual viewpoint density. The primary objective of this system is to increase the viewing angle and optimize the viewpoint distribution. It is capable of displaying clear 3D images with smooth parallax and correct geometric occlusions across the entire visible range of 100°. The core optical control structure, GDLA, plays a pivotal role. It optimizes the distribution of viewpoints, ensuring a concentration of more effective viewpoint information in the middle of the viewing area. Additionally, to suppress aberrations and further improve image quality, the lens is designed with a specific composite structure. Compared with traditional 3D displays, this system is characterized by a dense distribution of viewpoint information in the middle of the viewing area and a gradually decreasing viewpoint density towards the sides. This design not only significantly enhances the clear maximum off-screen depth in the middle of the viewing area but also increases the viewing angle of the system. In experimental verification, the high-performance 3D-LDF system is obtained with the viewing angle of 100°. The 3D scene captured at a 0° viewing angle has a clear focus depth of up to 300 mm. From a commercial perspective, this prototype has the potential for mass production and exhibits good stability in most situations. We firmly believe that this 3D-LFD system has a broad application prospect in the future, especially in fields such as aviation simulation, industrial design, architectural design, and multimedia educational presentations.
Jan. 20, 2025Vol. 52 Issue 2 0209001 (2025)
Meng Zou, Qiang Lu, Xiangpeng Xiao, Yuze Dai, Kai Shen, Qizhen Sun, and Zhijun Yan
ObjectiveDistributed feedback (DFB) fiber lasers (DFB-FLs) are the seed source of high-power narrow linewidth fiber lasers, which are widely employed in LIDAR, gravitational wave detection, beam combination, and other applications. Phase-shifted fiber gratings (PS-FBG) are the key devices of DFB-FLs, whose coupling strength has a direct impact on the output performance of DFB-FLs. Therefore, it is essential to study the coupling strength of the PS-FBG to obtain the best DFB-FL output performance.MethodsUsing the transmission matrix theory and the energy level rate equation, a transmission model of the DFB-FL was established, and the output characteristics of the DFB-FL were analyzed by simulation. Experimentally, PS-FBGs with varying coupling coefficients and grating lengths were fabricated using the light scanning method of a phase mask. Based on PS-FBGs, DFB-FLs were constructed and tested. Finally, to introduce additional birefringence in the PS-FBG phase-shift region, a stress point was applied during the packaging process. This approach was aimed at suppressing dual-polarization states and enhancing the polarization extinction ratio of the laser.Results and DiscussionsThe simulation results indicate that the transmission slit bandwidth of the PS-FBG decreases with an increase in the coupling strength. The pumping efficiency of the DFB-FL first increases and then decreases with an increase in the PS-FBG coupling strength. The output polarization state of the DFB-FL is influenced by the coupling strength of the PS-FBG and birefringence within the fiber. Thus, reducing the coupling strength of the PS-FBG or increasing the internal birefringence of the PS-FBG is advantageous for achieving the single polarization state output of the DFB-FL. The relaxation oscillation frequency of the DFB-FL increases as the PS-FBG coupling strength increases while the relative intensity noise (RIN) decreases. The experimental results show that the output performance of DFB-FL is closely related to PS-FBG coupling strength κL. First, the output laser linewidth of DFB-FL exponentially reduces with the increase of PS-FBG coupling strength κL. When κL<5, the output laser linewidth of DFB-FL narrows rapidly with the increase in κL; when κL>5, the laser linewidth decreases slowly; when κL=6.65, the linewidth reaches the minimum of 2.2 kHz (Fig. 6); at κL=4.84, the pumping efficiency of DFB-FL reaches the maximum of 0.16% (Fig. 7). However, further increase in coupling coefficient leads to a faster decline in pumping efficiency after the maximum pumping efficiency. Under the same coupling strength, long grating length and small coupling coefficient are more conducive to obtaining laser output with high pumping efficiency. When κL<5, the DFB-FL operates in a single polarization mode, the polarization extinction ratio achieving 20 dB (Table 1). With increasing κL, the polarization extinction ratio decreases, and DFB-FL gradually transitions to dual-polarization operation (Fig. 8). When κL=6.65, the relaxation oscillation frequency of the laser is 1.59 MHz, and the lowest RIN peak is -120.6 dB/Hz (Fig. 9). Therefore, achieving a single-polarization laser output with a narrow linewidth, high pumping efficiency, and low-intensity noise is challenging when relying solely on the PS-FBG coupling strength design. Finally, by optimizing the package structure design, a narrow linewidth fiber laser with output laser linewidth of 4.1 kHz, peak RIN <-120 dB/Hz, polarization extinction ratio of 23 dB, and pumping efficiency of 0.17% is achieved (Fig. 11).ConclusionsThe effect of PS-FBG coupling strength on the output performance of the DFB-FL is investigated theoretically and experimentally. The results show that the output laser linewidth of DFB-FL decreases with the increase of PS-FBG coupling strength κL. The relaxation oscillation frequency shifts to a higher value and the RIN peak value decreases. Simultaneously, the polarization extinction ratio decreases and the phenomenon of dual-polarization output gradually appears. In addition, with an increase in the PS-FBG coupling strength, the pumping efficiency initially increases and then decreases. In the experiment, when κL=4.84, the pumping efficiency of DFB-FL reaches the maximum value of 0.16%. Depending on the design of the PS-FBG coupling strength, obtaining a single-polarization laser output with a narrow linewidth, high pumping efficiency, and low-intensity noise is challenging. Finally, the DFB-FL is constructed using a PS-FBG with a grating length of 40 mm and a coupling coefficient of 120.9 m-1. By applying a stress point in the package area of PS-FBG, DFB-FL with a linewidth of 4.1 kHz, RIN peak value <-120 dB/Hz, polarization extinction ratio of 23 dB, pumping efficiency of 0.17%, and maximum output power of 750 μW is obtained.
Jan. 20, 2025Vol. 52 Issue 2 0201001 (2025)
Lingyu Liu, Zhixiang Zhang, Li Wang, Feng Pan, Qiang Liu, Jing Xie, and Panzheng Zhang
ObjectiveLaser-driven inertial confinement fusion (ICF) is an important approach in confinement research. All prevailing ICF laser facilities, such as the National Ignition Facility (NIF) in the United States, the Laser Mega Joule (LMJ) in France, and the ShenGuang laser facility in China, use a pulsed xenon flashlamp as the pump source. As an important optical component of a large high-power laser amplifier, a high-power pulsed xenon lamp can convert electrical energy into light energy in an energy-storage system to pump Nd∶glass, thus affecting the stability of the laser output. In this study, a scheme is proposed to effectively improve the peak trigger voltage of a xenon flashlamp at a constant operating voltage. The experimental results show that the peak trigger voltage of the xenon flashlamp increases by 7.1 kV, i.e., an increment of 26.4%, thus effectively improving the discharge reliability of the xenon flashlamp.MethodsThe operating voltage of the xenon flashlamp, which determines the energy released by the energy-storage capacitor to the flashlamp, is one of the main physical parameters in amplifier design. It must satisfy the pump-energy requirement of the amplifier but cannot be overly high to avoid decreasing the spectral efficiency of the pump light or increasing the explosion coefficient of the xenon flashlamp. The peak trigger voltage significantly affects the reliable breakdown of xenon flashlamps. The higher the peak voltage, the greater is the discharge reliability of the xenon flashlamp, the more reliable is the amplifier, and the less susceptible it is to output energy fluctuations caused by the discharge failure of the xenon flashlamp. Historical data pertaining to amplifier operation were calculated. The data show that the discharge failure of a xenon flashlamp with a shorter leading-cable length is greater. Increasing the operating voltage of the xenon flashlamp can improve the peak trigger voltage, thereby effectively improving the discharge success rate. To improve the discharge reliability of the xenon flashlamp under a fixed operating voltage, the peak trigger voltage was increased by extending the length of the leading cable and connecting suitable resistors and capacitors in parallel in the discharge circuit. The peak trigger voltages under different circuit configurations were measured, and the discharge success rate after increasing the peak trigger voltage was calculated.Results and DiscussionsThe variation in the peak trigger voltage was measured as the operating voltage was increased under leading-cable lengths of 10 m and 20 m, as shown in the inset of Fig. 6. When the operating voltage is 14 kV, an increase in the leading-cable length increases the peak trigger voltage by 2.2 kV, i.e., an increment of 8.1%. The experimental results show that a longer leading-cable length facilitates an increase in the peak trigger voltage. The variation in the peak trigger voltage was measured as the operating voltage was increased under shunt resistances of 1 kΩ and 20 kΩ, as shown in the inset of Fig. 7. At an operating voltage of 14 kV, an increase in the leading-cable length increases the peak trigger voltage by 3.1 kV, i.e., an increment of 11.5%. The experimental results show that the peak trigger voltage can be effectively increased by increasing the shunt resistance. Additionally, the ignition after the peak trigger voltage increases was calculated. The experimental results show that the threshold operating voltage required to achieve discharge from the xenon flashlamp is successfully reduced, and that the discharge success rate of the xenon flashlamp can be effectively improved by optimizing the peak trigger voltage. The peak trigger voltage was measured when the leading-cable length, parallel resistance, and capacitance were increased simultaneously, as shown in the inset of Fig. 10. When the operating voltage is 14 kV, the peak trigger voltage increases by 7.1 kV, i.e., an increment of 26.4%.ConclusionsHerein, a method for improving the discharge reliability of a xenon flashlamp by increasing the peak trigger voltage without affecting the operating voltage of the amplifier was investigated experimentally. The results show that the peak trigger voltage can be effectively increased by increasing the leading-cable length, paralleling the resistor at the inductor in the discharge loop, and paralleling the small capacitor at the two poles of the xenon flashlamp without changing the operating voltage, thus improving the discharge reliability of the xenon flashlamp. Additionally, three optimization methods were adopted, and the peak trigger voltage corresponding to the 14 kV operating voltage of the amplifier increases from 26.9 kV before optimization to 34 kV after optimization, i.e., a relative increase of 26.4%; meanwhile, the discharge success rate of the xenon flashlamp can reach 100%. This method has been applied to a high-power laser facility, which effectively improved the discharge reliability of xenon flashlamps and ensured the stable operation of the amplifier.
Jan. 20, 2025Vol. 52 Issue 2 0201002 (2025)
Genyu Bi, Bowen Liu, Chenming Yu, Yuxi Chu, Jintao Fan, and Minglie Hu
ObjectiveThis study aims to develop a high-power green femtosecond laser system with a high beam quality by integrating rod-type photonic crystal fiber amplifiers and coherent beam-combining technology. Continuous advancements in laser technology have focused on realizing femtosecond lasers with high average power, high single-pulse energy, and superior beam quality. This study is significant because high-power green femtosecond lasers are crucial for various applications, including micromachining of wide-bandgap materials, high-quality photonic device processing, extreme ultraviolet generation, pumping optical parametric oscillators, and biomedical imaging. The system design and methodology ensure that the laser maintains high performance and stability, making it a valuable tool for cutting-edge research and technological development.MethodsThe system employs rod-type photonic crystal fiber amplifiers and coherent beam combining techniques, along with a lithium triborate (LBO) crystal for nonlinear frequency conversion. To ensure near-diffraction-limited beam quality at this power level, both the thermal management of the amplifier and coupling of the seed light were optimized. The thermal management of the amplifier involved the use of a low water-cooling temperature to mitigate the thermal effects that could degrade the beam quality. Two amplifiers were coherently combined with an efficiency of 95.2%, achieving stable output across different power levels. The coherent beam-combining technique utilizes active phase control to maintain the phase coherence between the beams from the two amplifiers. This involves the use of piezoelectric mirrors and feedback systems to correct the phase errors dynamically, ensuring that the power of the combined beam is stable near its maximum value. Moreover, the use of piezoelectric deflection mirrors ensures automatic alignment of the two beams. Fundamental light was compressed using a transmission diffraction grating compressor. By adjusting the grating angle and spacing and finely adjusting the second-, third-, and fourth-order dispersion parameters of the tunable chirped fiber Bragg grating (T-CFBG), the coherently combined pulses were compressed near the transform limit. The optimized fundamental light was then frequency-doubled in a 2-mm thick LBO crystal. The frequency-doubling process involves optimizing the spot size of the fundamental beam and precisely aligning the LBO crystal to realize efficient second harmonic generation.Results and DiscussionsThe single-channel fiber amplifier realizes a high average power of 130 W with near-diffraction-limited beam quality. This performance is ensured by optimizing the thermal management of the amplifier and the coupling of the seed light. The spectral evolution of the amplifier stages [Fig.2(a)] shows a gradual narrowing of the spectrum, which is a common phenomenon in chirped pulse amplification (CPA) systems. The output power curves of the two rod-type fiber amplifiers [Fig.2(b)] demonstrate their consistent performance. The coherent beam combining the two amplifiers reaches an efficiency of 95.2%, resulting in 238 W fundamental light output. This efficiency is maintained across different output power levels, indicating the stability and reliability of the system [Fig.3(b)]. The residual phase difference of the synthesized light is calculated using λ/30, demonstrating the effectiveness of the phase-locked system [Fig.3(c)]. This indicates that the phase-locked system can effectively suppress the drift in the optical path and phase due to factors such as temperature and air disturbances, thereby maintaining a stable high-power output. After compression with the Treacy compressor, the power corresponds to 210 W and pulse width corresponds to 230 fs. The compressed pulse is close to the transform limit, demonstrating good time-domain quality of the pulse (Fig.4). Frequency doubling in the LBO crystal results in 128 W green laser light with a pulse width of 216 fs and second-harmonic generation efficiency of 61%. The green light power and conversion efficiency versus the fundamental power [Fig.6(a)] demonstrate the effectiveness of the frequency-doubling process. The beam quality of the green light is close to the diffraction limit [Fig.6(b)]. The variations in the intensity noise at each stage of the laser system are investigated. The results indicate that the relative intensity noise of the frequency-doubled light is higher than that of the fundamental-frequency light, and a 13-kHz modulation peak is transmitted during the frequency-doubling process (Fig.8). These results indicate that coherent beam combination significantly enhances the power and energy output of femtosecond lasers. The high efficiency and stable performance of this system make it suitable for various scientific and industrial applications.ConclusionsThe developed high-power green femtosecond laser system combines the advantages of rod-type photonic crystal fiber amplifiers and coherent beam combination technology. By optimizing thermal management and seed light coupling, the system maintains near-diffraction-limited beam quality at high power levels without transverse mode instability (TMI). The coherent combining of the two amplifiers realizes 95.2% efficiency, producing 238 W near-infrared femtosecond laser light at a repetition rate of 1 MHz. The compressed pulses are frequency-doubled in an LBO crystal, yielding 128 W green femtosecond laser output with a pulse width of 216 fs and a peak power of 0.6 GW. This study highlights the potential of coherent beam combination to enhance the output power and energy of femtosecond lasers, with promising applications in research and industry. Future studies can further increase the system output power by improving the single-amplifier performance or adding more amplifier channels, benefiting various applications in both scientific and industrial fields.
Jan. 20, 2025Vol. 52 Issue 2 0201003 (2025)
Yushuo Bao, Xiangkun Ma, Chunxiang Zhang, Zhenhong Wang, Rui Ma, Jun Liu, Shixiang Xu, and Dianyuan Fan
ObjectiveMid-infrared cylindrical vector beams have important applications in laser material processing, particle trapping, microscopy, and information storage. Common methods for the direct generation of these cylindrical vector beams in a solid-state laser are mainly based on the thermal birefringence effect of the gain medium, off-axis pumping regime, and polarization mode conversion element of the Q-plate. However, these typical generation methods have many intrinsic disadvantages, including poor stability, low lasing efficiency, and low output power. In contrast, a mid-infrared S-waveplate, which is a self-organized nanostructured grating that is inscribed in fused silica glass using a femtosecond laser, is an efficient mode-conversion element that can handle high power densities. We achieve high-power and stable mid-infrared cylindrical vector beams by incorporating this advantageous component into a mid-infrared Er∶YAP laser. In this study, highly efficient mid-infrared cylindrical vector beams are directly generated based on an S-waveplate acting as an intra-cavity polarization mode conversion device in an all-solid-state Er∶YAP laser. Radially and azimuthally polarized lasers can be easily fabricated and switched. In the continuous-wave operation mode, maximum average output powers of 136 mW and 133 mW are obtained for the radially and azimuthally polarized laser beams, respectively. Using an optical chopper, Q-switched pulsed cylindrical vector laser beams are also achieved, with the shortest pulse width being 124.73 ns and the single pulse energy being 13.84 μJ. These results provide insight into the structural design and experimental realization of mid-infrared structured lasers.MethodsThe experimental schematic of the mid-infrared all-solid-state cylindrical vector laser is shown in Fig. 1. The pump source was a fiber-coupled laser diode with a maximum pump power of 27 W. The center wavelength was locked at 976 nm with a spectral linewidth of less than 0.7 nm. The core diameter and its numerical aperture of the pig-tailed fiber were 105 μm and 0.22, respectively. A pair of coupling lenses was used to reimage the pump beam into the gain medium. A b-cut 5% (atomic fraction) Er∶YAP crystal with dimensions of 2 mm×2 mm×10 mm was selected as the gain medium. The Er∶YAP crystal was closely packed in a water-cooled heat sink at 16 °C to avoid thermal damage to the laser crystal. The linear resonator was composed of plane mirrors consisting of an input mirror (IM) and an output coupling mirror (OC). The IM had a high transmittance at 976 nm and high reflectivity at 2700?3000 nm, whereas the OC was coated with 5% reflectivity at 2700?3000 nm. An optical chopper was used as the active Q-switch. The total number of slits was 100, and the duty cycle was 50%. The rotation speed was continuously switched from 2 r/s to 100 r/s, corresponding to a modulating frequency range of 200 Hz to 10 kHz. A femtosecond-laser-inscribed self-organized nanostructured grating (S wave plate) was used as the intra-cavity polarization mode conversion device.Results and DiscussionsWhen the cylindrical vector laser is operated in the continuous wave regime, maximum output powers of 136 mW and 133 mW are obtained at an absorbed pump power of 14.07 W for the radially and azimuthally polarized laser emissions, respectively (Fig. 2). The doughnut-like intensity distributions of the radially and azimuthally polarized beams are shown in Fig. 3. After the optical chopper was inserted, the Q-switched pulse characteristics of the cylindrical vector laser output are studied. At a repetition rate of 5.20 kHz, maximum average output powers of 72 mW and 73 mW are achieved for the radially and azimuthally polarized beams, respectively, under a maximum absorbed pump power of 14.07 W (Fig. 4). The corresponding shortest pulse width and the peak power are 124.73 ns and 111 W, respectively, for the azimuthally polarized mode. Under a moderate pump power of 12 W, the pulse width increases from 176.47 ns to 244.16 ns when the repetition rate ranges from 5.2 kHz to 10 kHz, with the corresponding peak power varying from 37.05 kW to 17.61 kW (Fig. 5). The output wavelengths are centered at 2.73 μm in both continuous-wave and Q-switched operation regimes (Figs. 2 and 4). The output intensity profiles of the Q-switched cylindrical vector beams and their corresponding intensity distributions after passing through the polarizer are shown in Fig. 6, which indicates the generation of high-purity mid-infrared cylindrical vector beams.ConclusionsWe demonstrate the direct generation of mid-infrared cylindrical vector beams using an all-solid-state Er∶YAP laser. Radially and azimuthally polarized modes can be easily achieved and switched. The evolution of the intra-cavity polarization states is evaluated in terms of the Jones matrix, which satisfies the self-consistent transformation. In the continuous-wave mode, the radially and azimuthally polarized beams have output powers of 136 mW and 133 mW, respectively. Furthermore, by using an optical chopper as a Q-switch, we achieve pulsed cylindrical vector beams with the shortest pulse width being 124.73 ns at a repetition rate of 5.20 kHz. Moreover, the corresponding single pulse energy reaches 13.84 μJ. The output wavelength is centered at 2.73 μm in the continuous and Q-switched operation modes. The laser structure proposed in this study provides a simple and cost-effective scheme for the realization of nanosecond-level mid-infrared structured light fields in all-solid-state lasers.
Jan. 15, 2025Vol. 52 Issue 2 0201004 (2025)
Compact, Efficient and High‐Beam‐Quality Nd∶ YAG MOPA Laser System Operating at 1 kHz Repetition Rate
Jing Chi, Kai Zhong, Fangjie Li, Hongzhan Qiao, Yue Sun, Yizhe Zheng, Yuxin Liu, Degang Xu, and Jianquan Yao
ObjectiveLaser-diode (LD)-pumped solid-state lasers operating in the electro-optic (EO) Q-switching mode have broad application prospects in various fields, including ranging, imaging LIDAR, laser processing, remote sensing, and pumping nonlinear optical frequency converters. High repetition rate, short pulse width, high peak power, and high beam quality are the basic requirements for most of these applications to improve signal-to-noise ratio (SNR), measurement capability, ranging accuracy, and conversion efficiency. A compact size is also essential, especially for air-, space-, and rocket-borne systems. The diode-end-pumped electro-optically Q-switched laser has good beam quality and a compact structure; however, the pulse energy is quite limited because of the small mode size in the cavity. Thus, master oscillator power amplifier (MOPA) technology is necessary. In this study, a compact electro-optically Q-switched Nd∶YAG MOPA system based on split pumping and self-compensated spherical aberration is proposed to provide an effective technical approach for miniaturized high-repetition-rate lidar sources.MethodsThe electro-optically Q-switched Nd∶YAG MOPA system operating at 1 kHz is shown in Fig. 1. To maintain a compact size and reduce cost and complexity, the laser oscillator and amplifier shared an LD pump source with maximum peak power of 170 W. The pump beam was separated by a beam splitter into two parts, 30% (10.6 mJ) and 70% (24.28 mJ), which were incident onto the oscillator and amplifier, respectively. This structure does not require additional pulse synchronization electronics; therefore, it is simple, compact, and stable. The oscillator produces a high-quality seeding beam with considerable pulse energy, which then proceeds to a specially designed double-pass amplifier for power amplification. By placing a 1064-nm reflector (M6) at the focus of the thermal lens in the amplification stage, the thermally induced spherical aberration by the gain medium during the first pass undergoes a sign reversal at M6. Upon passing through the gain medium for the second time, the thermally induced spherical aberration is compensated such that the phase distortion of the wavefront is eliminated and an acceptable beam quality is guaranteed. This structure is similar to that of a 2f imaging system, and ensures good mode matching between the forward and backward laser beams. The double-pass amplifier not only alleviates the thermal effects and improves beam quality but also enhances conversion efficiency.Results and DiscussionsThe pump energy ratio of 3∶7 for the oscillator and amplifier was mostly dependent on seeder performance; that is, the pulse energy, pulse width, and beam quality should be optimized before optical damage occurs. Using a T=50% output coupler, the maximum output energy of the laser oscillator was 2.68 mJ, and the pulse width was 4.4 ns (Fig. 2). The beam quality factors in the two orthogonal directions were Mx2=1.28 and My2=1.23, respectively [Fig. 5(a)]. The double-pass end-pumped Nd∶YAG amplifier boosted the pulse energy to 9.37 mJ, corresponding to an energy amplification factor of 3.5 times and optical-to-optical conversion efficiency of 26.86% [Fig. 3 (b)]. The peak power was 2.02 MW. Benefiting from the self-compensation of the spherical aberration, the beam quality of the double-pass amplifier was found to be well-controlled compared with that of a single-pass amplifier. The beam quality factors were Mx2=1.49 and My2=1.61 in two orthogonal directions at the maximum output [Fig. 5(b)]. A single pulse energy of 4.98 mJ at 532 nm was achieved by a type-I phase-matched LBO crystal, with a pulse width reduced from 4.63 ns to 3.5 ns. The root mean square (RMS) power instabilities of the oscillator, double-pass amplifier, and frequency-doubled laser within 1 h were 0.223%, 0.094%, and 0.488%, respectively [Fig. 6 (a)].ConclusionsIn summary, an electro-optically Q-switched Nd∶YAG MOPA system based on split pumping was demonstrated, producing high-energy, high-stability, and high-beam-quality nanosecond laser pulses in a compact structure. The oscillator enabled a single-pulse energy of 2.682 mJ and a pulse width of 4.4 ns at a repetition rate of 1 kHz. An end-pumped double-pass Nd∶YAG laser amplifier with self-compensated spherical aberration was utilized, which amplified the single pulse energy to 9.37 mJ with a pulse width of 4.63 ns, corresponding to a peak power of 2.02 MW and optical-to-optical conversion efficiency of 26.86%. The RMS power instability reached 0.094% within 1 h. Using an LBO crystal for frequency doubling, the single-pulse energy at 532 nm was 4.98 mJ, and the pulse width was 3.5 ns. This MOPA laser system is believed to be ideal for high-precision ranging and high-resolution LIDAR applications.
Jan. 20, 2025Vol. 52 Issue 2 0201005 (2025)
Jiayu Yi, Juntao Wang, Tangjian Zhou, Jianli Shang, Haixia Cao, Bo Tu, and Qingsong Gao
ObjectiveSolid-state lasers represent a class of compact and efficient high-power laser sources, which are attractive for a broad range of medical, commercial, scientific, and military applications. However, due to the risk of serious thermal optical aberration and fracture of the gain medium, thermal effects become the primary limiting factors in further increasing the output power and beam quality of the laser. To meet the requirements of various practical applications, a compact high-power system with efficient thermal management needs to be developed. Direct-liquid-cooled configuration lasers (DLCLs) have become highly attractive in the high-power laser field due to their excellent heat dissipation capabilities. Multiple disk pieces, arranged as an array, are integrated into a single gain module (GM), leading to a low heat density in each gain disk by dispersing the heat across the entire gain disk array. The circulating liquid flows over the largest surface of the disk, efficiently carrying away the heat. Thanks to easier laser output, DLCL resonators have been extensively studied. However, due to the repetitive superposition of complex wavefront aberrations in DLCL resonators—caused by the coolant flow and gain medium—the laser beam quality is compromised. To overcome the challenge of achieving both high power and good beam quality, new DLCL configurations must be explored. This study demonstrates a new DLCL scheme with high performance (high power, high beam quality, and high efficiency) referred to as the thermal-dispersed reflectivity-type Nd∶YAG disk array MOPA (master oscillator power-amplifier) laser.MethodsThis study employs a research method that combines configuration proposal, parameter design, and experimental integration verification. A novel high-power direct-liquid-cooled distributed-reflective-type laser is designed, featuring a distributed gain system composed of tens of Nd∶YAG disks densely stacked. A specialized laser cooling liquid flows through planar micro-channels between the gain media disks. Additionally, a Zig-Zag-like laser path is designed within the gain system to achieve high power output. This laser configuration merges the advantages of direct-liquid cooling and the Zig-Zag path. The laser’s configuration is optimized. The key factors of the gain media disks, the laser gain of the laser system, temperature distribution, and wavefront aberration are simulated theoretically. Furthermore, an experimental verification platform based on the direct-liquid-cooled distributed-reflective-type MOPA laser was constructed. The laser characteristics, including output power, optical-optical (O-O) efficiency, and far-field distribution, have been obtained.Results and DiscussionsIn the MOPA system, a QCW Nd∶YAG rod oscillator was used as the seed, providing an average output power of 0.5 kW with a repetition frequency of 500 Hz and a pulse width of 220 μs. The temporal profile of the output laser is shown in Fig. 16. As depicted in Fig. 15, a maximum average output power of 21.2 kW was obtained from the entire amplifier chain, corresponding to a peak power of 192.7 kW and a single-pulse energy of 42.4 J, achieved under an average pump power of 56 kW. An O-O conversion efficiency of 36.9% was achieved with an output of 21.2 kW. Attention is drawn to the extracted power and efficiency of the direct-liquid-cooled laser GMs, as shown in Fig. 17. Notably, the extracted power and O-O efficiency of GM1# were lower than those of GM2#. Specifically, GM1# achieved an extracted power of 9.3 kW with an O-O efficiency of 33.5%, while GM2# achieved an extracted power of 11.2 kW with an O-O efficiency of 40%. Two identical gain modules with opposite flow directions were placed in the MOPA to self-compensate for tilt aberration. Figure 18 shows the wavefront and far-field distribution of the amplified output beam. The beam quality, denoted by the diffraction limit multiplier, was measured using a beam analyzer. The analyzer images the beam into the far-field distribution, which is then compared to the ideal far-field distribution to determine the beam quality parameter. The peak-to-valley (PV) and root-mean-square (RMS) values of the output beam were 1.1 μm and 0.23 μm, respectively. After defocus and tilt aberration compensation, the wavefront consisted of high-order aberrations. The corresponding beam quality was measured at 4.8 times the diffraction limit.ConclusionA 20 kW-class direct-liquid-cooled MOPA for a direct-liquid-cooled distributed-reflective-type Nd∶YAG disk array laser is designed, representing a new scheme with the potential for high laser performance. An average output power of 21.2 kW with an O-O efficiency of 36.9% is realized in the amplifier chain, with corresponding beam quality measured at 4.6 times the diffraction limit. Due to the high injected peak power density, the extraction efficiency of GM2# reached 40%. The experimental results demonstrate the validity and feasibility of this novel configuration for high-power operation, particularly in terms of distributed gain and distributed cooling. To our knowledge, the output power demonstrated in this study is the highest reported for a YAG direct-liquid-cooled multi-disk MOPA laser. Furthermore, the direct-liquid-cooled distributed-reflective-type laser shows potential for achieving high beam quality, high efficiency, and high power output in compact solid-state lasers.
Jan. 20, 2025Vol. 52 Issue 2 0201006 (2025)
Xueyan Dong, Haozhu Wang, Kai Liu, Yang Kou, Xingwei Yan, Zilei Liu, Xinlei Li, Peijiang Yang, Yan Xu, Fengtu Yang, and Chenggong Zhang
ObjectiveHigh peak power and high repetition rate nanosecond lasers are widely applicable and exhibit high market prospect in laser welding, laser cutting, laser cleaning, and other fields owing to their high peak power and low processing thermal effect, which can effectively solve the issues related to the precision and mechanical properties of conventional processing methods. Under high-average-power pumping, a thermal lens effect is generated, as the pump light is tightly concentrated on the laser gain medium. The processing method and quality are limited by the peak power and beam quality. To improve the peak power and beam quality of the laser, a pump-coupling structure with an adjustable pump angle and a hybrid cooling-slab module realized via a new welding process were designed in this study. A slab laser amplifier based on an angle gating structure is proposed, which offers the advantages of high peak power, high beam quality, and high conversion efficiency.MethodsIn this study, a high peak power and high repetition rate nanosecond-laser slab amplifier was investigated theoretically and experimentally. The hybrid cooling module was designed, and a new type of fusion welding technology was adopted, which effectively reduces the thermal lens effect and thermal distortion in the thickness direction of the slab crystal, realizes uniform heat dissipation, and improves the laser output power. To achieve a high power output, through efficient image transmission and by adopting aperture-filtering technology, we effectively corrected the optical aberration and reduced the free transmission of the beam, thereby improving the spot uniformity and maintaining a high beam quality. Additionally, an L-shaped optical-path pump-coupling structure with an adjustable pump light angle was designed. By designing an aspheric mirror and a trapezoidal waveguide, the pump light is uniformly pumped onto the large surface of the slab crystal, which effectively improves the pump coupling efficiency. The design of an adjustable 45° reflector frame can realize an adjustable pitch swing. This optimizes the angle and position of the pump light entering the crystal through the 45° reflector, thereby improving the beam quality. More importantly, the L-shaped optical-path pump-coupling design fully leverages the longitudinal space of the system and effectively compresses the transverse distance via the L-shaped optical-path layout, which features a short optical path, a small occupied space, and easy integration of the laser.Results and DiscussionsIn this study, a nanosecond-laser slab-amplifier device with a high peak power and high repetition rate was designed. The device primarily comprises a seed source, shaping system, and slab amplifier (Fig. 5). When the pump power is 15950 W, the amplifier output power reaches 4580 W, and the change is less than ±1% within 480 min. The laser amplifier exhibits high power stability. Because the theoretical simulation does not consider the thermal effect of the laser, both the theoretical output power and growth rate are high. When the pump power is less than 11000 W, the experimental results agree well with the theoretical values, and the thermal effect is insignificant. When the pump power exceeds 11000 W, the thermal effect is improved significantly, thus resulting in an increase in the difference between the experimental and theoretical values, and the experimental output power decelerates. However, as the pump power increases, the output power does not saturate, and its center wavelength is 1064.5 nm (Fig. 7). The repetition rate of the laser is 20 kHz, the pulse width is 66.7 ns (Fig. 8), and the output pulse of the slab laser amplifier is stable without frequency drifts. The inconsistency of the pulse intensity is primarily attributed to the stability of the laser diode (LD)pump power and the thermal deformation inside the slab. Additionally, the far-field beam-intensity distribution of the laser was tested (Fig. 9). The pulse laser approximates a Gaussian beam, and the beam parameter product (BPP) is calculated to be 10 mm·mrad.ConclusionsIn this study, a nanosecond-laser slab amplifier with a high peak power and high repetition rate was designed. By adopting a hybrid-cooling module achieved via a new welding process and an L-shaped pump coupling structure with an adjustable pump light angle, the temperature gradient inside the crystal is effectively reduced, thereby suppressing the thermal lens effect. Additionally, the designed amplifier facilitates the integration and miniaturization of subsequent equipment. The amplifier was constructed based on the angle gating structure, and its energy-extraction efficiency was improved by establishing a three-way amplification rate equation to simulate the output characteristics. Meanwhile, the optical aberration was optimized by combining high-efficiency image transmission and aperture-filtering technology, thereby enhancing the spot uniformity. Finally, the average output power of the amplifier is 4580 W, the peak power is 3.4 MW, the pulse width is 66.7 ns, the optical-to-optical conversion efficiency is 28.7%, and the BPP is 10 mm·mrad. The amplifier exhibits application potential in steel-plate cleaning. We shall further optimize the welding technology and cooling structure, reduce the thermal effect, and improve the pump coupling efficiency to achieve higher power levels for the nanosecond-pulse laser output. Based on the requirements of different application scenarios, the pump power and shaping system can be used to adjust the power density to satisfy the application requirements of different scenarios. Additionally, the high-power pulsed laser can be extended through fiber coupling to expand its application in laser cutting and the steel-plate laser cleaning of ships.
Jan. 20, 2025Vol. 52 Issue 2 0201007 (2025)
Yuhong Lin, Wenchao Ji, Mingyi Zhu, Bowei Wang, Yang Zhang, Peijun Feng, Xiangpei Liu, Hanning Dai, and Xiao Jiang
ObjectiveLasers plays a crucial role in various scientific experiments in fields such as quantum communication, high-resolution atomic spectroscopy, cold-atom physics, and optical clocks. The stability of laser power significantly influences experimental results. For instance, in strontium atomic optical lattice clocks, stabilizing the power of more than a dozen laser beams is required to achieve a clock frequency with fractional stability on the order of 10-18. High-frequency fluctuations in laser power can reduce the signal-to-noise ratio, thereby compromising the stability of frequency standards, whereas low-frequency fluctuations can impact the long-term stability of atomic clocks. Consequently, reliable laser power stabilization technology is indispensable. Furthermore, the portable or space-based applications of cutting-edge experimental devices, such as optical clocks, increase the demand for higher integration, flexibility, and response speed in laser power stabilization. In this study, we leverage the high-speed and low-amplitude noise characteristics of a previously developed high-bandwidth direct digital synthesizer (DDS) circuit and construct a proportional-integral controller in a field-programmable gate array (FPGA) to directly modify the output amplitude of the DDS for laser power feedback control. This approach eliminates the need for an external voltage-controlled attenuator, thereby improving integration and minimizing high-frequency noise interference.MethodsMainstream methods for laser power stabilization can be classified into two types: internal loop control and external loop control. This study selected the latter, using an acousto-optic modulator (AOM) that enables flexible control of output power without affecting the laser output frequency. A portion of the laser beam was split and directed onto a photodiode for power detection. The photodiode output was digitized using a 16-bit analog-to-digital converter (ADC) and compared to a target value to generate an error signal, which was then processed using an incremental digital proportional-integral (PI) controller. Based on the PI output, the amplitude of the output signal from the DDS was directly adjusted in reverse and applied to the AOM, achieving feedback control of laser power without the need for an additional digital-to-analog converter (DAC) or voltage-controlled attenuator. To prevent excessive ringing caused by loop delay during the laser startup from a fully off state, an output offset is preset to the target value with a specific delay before enabling PI feedback. The closed-loop system was tested by measuring the output radio frequency (RF) signal from the DDS using an RF power detector, simulating the photodiode's function and evaluating electronic noise in a closed-loop configuration without optics.Results and DiscussionsA 160-minute test evaluated the long-term performance of the closed-loop laser power stabilization in the time domain. The peak-to-peak values of relative laser power drift were found to be 7.1% and 0.0076% in the open- and closed-loop states, respectively (Fig.6). This result shows a significant improvement in laser power stability. Frequency domain measurements indicated that the relative intensity noise power spectral density at 1 Hz was suppressed from -60.1 dBc/Hz in the open loop to -111.2 dBc/Hz in the closed loop, approaching electronic noise levels up to 10 kHz (Fig.5). Regarding the transition from a fully off state to a stabilized laser power, the method of presetting the output offset and delaying the PI controller’s activation achieved a rise time of approximately 3 μs. In contrast, the traditional PI controller required approximately 7 μs under the same conditions (Fig. 7).ConclusionsThis study presents a laser power stabilization method based on high-bandwidth DDS, which directly adjusts the DDS output signal amplitude to control the AOM driving power, thereby eliminating the need for a voltage-controlled attenuator or DAC. Compared to traditional laser power stabilization methods, our method leverages the high-speed response and low-amplitude noise characteristics of the high-bandwidth DDS, while optimizing the FPGA-based digital PI controller to shorten the turn-on time of the laser. Using an 813-nm laser system, we achieved a suppression of the relative intensity noise power spectral density to below -111.2 dBc/Hz between 1 Hz and 10 kHz, with long-term drift reduced to approximately 0.0076% over a 160-minute period. The technique of presetting the output offset and delaying the activation of the PI controller enables the laser to turn on and reach a stabilized power level within approximately 3 μs. This method demonstrates high integration, rapid response, and low noise, fulfilling the laser power stabilization requirements for a wide range of experimental configurations, including space-based or portable atomic optical clocks. Moreover, this approach significantly simplifies the feedback loop, making it more suitable for complex experimental environments.
Jan. 17, 2025Vol. 52 Issue 2 0201008 (2025)
Jiaqi Zhang, Liang He, Renjiang Zhu, Tao Wang, Lidan Jiang, Maohua Jiang, Cunzhu Tong, Yanrong Song, and Peng Zhang
ObjectiveA vertical-external-cavity surface-emitting laser (VECSEL) offers unique advantages such as high power, good beam quality, and designable emitting wavelength. Additionally, the external-cavity structure allows for the convenient insertion of other optical components, thus enabling the VECSEL to operate in mode-locking, single-frequency running, or wavelength-tuning mode. These characteristics render the VESCEL a desirable candidate for various applications not realizable by conventional lasers (e.g., solid-state lasers, gas lasers, fiber lasers, or laser diodes). In particular, the peak power pulses generated by a mode-locked VECSEL can be used in diverse fields such as multiphoton imaging, high-resolution time-domain terahertz spectroscopy, and supercontinuum generation. However, obtaining high peak-power pulses from a mode-locked VECSEL is not trivial. To increase the peak power of mode-locked pulses, one can increase the average output power of the laser, reduce the pulse time width, or reduce the pulse repetition rate. However, these three methods are mutually restrictive; thus, the pulse peak power in a mode-locked VECSEL can only be improved to a certain extent. In particular, the carrier lifetime of the semiconductor gain media used in a VECSEL is short, i.e., in the nanosecond level, which significantly limits the further reduction of the repetition rate of mode-locked laser pulses. Consequently, the increase in the peak power of pulses generated from the mode-locked VECSEL is restricted considerably.MethodsIn this study, a custom-designed saturable Bragg reflector (SBR) was used as a saturable absorber, where a moderate saturation fluence can effectively balance between the cycling power and multi-pulse generation in the resonant cavity, thereby maintaining a sufficiently high average output power at low repetition rates and significantly improving the peak power of the mode-locked laser pulses. The epitaxial structure of the gain chip used in the experiment (Fig. 1) is a reverse-order structure of the active region, followed by a distributed Bragg reflector (DBR). First, an Al0.86GaAs etching stop layer was deposited on the GaAs substrate. Subsequently, a GaAs protective layer, a high-barrier Al0.6GaAl window layer, an active region, and a DBR were deposited. Finally, the entire structure was terminated with an oxygen-resistant GaAs layer. Unlike gain chips achieved via reverse growth, the SBR exhibits an epitaxial structure (Fig. 1) that is consistent with the normal order of a DBR followed by an absorption region. The saturable absorber is a single InGaAs quantum well located in the final quarter-wavelength layer of the DBR, with a thickness of 10 nm. The quantum well is intentionally set at the peak position away from the laser standing wave to obtain a large saturation fluence. Additionally, because the saturation fluence of the SBR should not be excessively high, we implemented a single quantum well with a commonly used thickness of 10 nm. The laser resonant cavity used in the experiment (Fig. 2) comprises six mirror cavities, including a DBR each at the bottom of both the gain chip and SBR. Except for the output coupler, which presents a certain transmittance at the laser wavelength, all other mirrors demonstrate high reflectivity at the laser wavelength.Results and DiscussionsBased on the experimental result, the temporal waveform of the pulses exhibits double or triple pulses connected to each other (Fig. 3). We believe that this may be due to the low intensity of the intra-cavity pulses (corresponding to a relatively high saturation fluence of the SBR) and the inadequateness of one pulse in fully saturating the SBR. Therefore, before the SBR is fully recovered, absorption continues to occur on one or two following pulses, thus resulting in double or triple pulses. Stable continuous-wave (CW) fundamental mode-locked pulse trains, steady second-harmonic mode-locked pulses, and higher-order unstable harmonic mode-locked pulses are obtained (Fig. 5). In our opinion, the high-order harmonics occurred because as the pump power increases, the pulse intensity inside the cavity increases, thus resulting in a low saturation fluence of the SBR. After a pulse saturates the SBR, owing to the long resonant cavity length, the SBR has sufficient time to recover. Therefore, one or more subsequent pulses can saturate the SBR again, thus resulting in multiple pulses in the cavity, which eventually evolve into higher-order harmonic mode locking. The interconnected double or triple pulses mentioned above, as well as the occurrence of high-order harmonic mode locking can be described by numerically solving the delay differential equations for passive mode locking, and the evolution of intra-cavity pulses over time can be obtained (Fig. 4). The measured fundamental CW mode-locked pulse has a period of approximately 14.92 ns, a repetition rate of 67 MHz, and a pulse width of 2.08 ps (Fig. 6). When the absorbed pump power increases to 18.9 W, an output power of 0.325 W can be obtained. When the absorbed pump power exceeds 21.7 W, the maximum output power of the second harmonic mode locking is 0.836 W. The maximum output power of the fourth-harmonic mode locking is 0.683 W (Fig. 7). Under fundamental, second- and fourth-harmonic mode locking, the maximum peak powers of the pulses are 2.33, 3.00, and 1.23 kW, respectively.ConclusionsThe short carrier lifetime (of nanosecond level) of a VECSEL significantly limits the further reduction of the pulse repetition rate under passive mode locking, thereby limiting the improvement to the pulse peak power. For saturable absorbers used to commence mode locking, a relatively high saturation fluence may generate interconnected double or triple pulses, whereas a relatively low saturation fluence may result in multiple pulses in the resonant cavity. This study utilizes a custom-designed SBR with a moderate saturation fluence to achieve both low repetition rates and high average output power levels in a passive mode-locked VECSEL. We experimentally achieved a repetition rate of 67 MHz. In the case of fundamental, second- and fourth-harmonic mode locking, the corresponding peak powers of the pulses are 2.33, 3.00, and 1.23 kW, respectively, which demonstrate a passive mode-locked VECSEL with a repetition rate below 100 MHz and a peak power above 1 kW simultaneously.
Jan. 20, 2025Vol. 52 Issue 2 0201009 (2025)
Si Chen, Haiyang Zhang, Fahong Jin, Lin Wang, and Changming Zhao
ObjectiveThe pulse detection method obtains distance and speed information by measuring the round-trip time delay of pulsed electromagnetic waves. A balance must be reached between range and velocity resolution for pulse detection. Otherwise, a longer bandwidth pulse is required to overcome the aforementioned limitations of a single pulse. The double-pulse waveform markedly increases the time?bandwidth product (TBP) and has a higher energy than a single pulse with the same ranging ability, which is beneficial for detecting weak signals. The double-pulse system does not require time-frequency domain conversion, which reduces computation time to some extent. Therefore, the double-pulse waveform can also be applied to vibration measurement instruments, three-dimensional coherent imaging, and detection of hard and aerosol targets using Doppler radar. We propose a double-pulse coherent detection system to prevent interference from background light. By establishing theoretical models and conducting experiments, the ranging and velocity measurements in a double-pulse coherent system were optimized. This study is expected to provide a new direction for LIDAR detection and lays a foundation for improving detection accuracy of double-pulse systems.MethodsTheoretical models for ranging and velocity measurements were established to study the effects of pulse interval, width, and period on the performance of double-pulse LIDAR. The low- and high-speed targets can be measured by controlling the time interval between the front and rear pulses of a pulse pair, in theory and simulations. A mathematical model of the relationship between the parameters of the double-pulse system and characteristics of the detected target was constructed through noise analysis. Based on the above parameters, the experiment on the ranging and velocity measurements of the targets in a double-pulse coherent system was optimized by demodulating the phase information of the detected double-pulse signal using the Hilbert transform and Python software.Results and DiscussionsThe influence of micromotion velocity and pulse interval on the double-pulse phase was considered (Fig. 4). The detection of the targets at different speeds corresponds to different pulse intervals. Simulation results show that the pulse interval of double pulse system used for detecting low- and high-speed moving targets is on the order of μs. The positive and negative polarities of the obtained phase differences were identical (Fig. 5). Assuming an object with an angular frequency greater than 500 Hz, the pulse interval of the dual-pulse system for detecting such moving targets would be on the order of ms (Figs. 6, 7). The faster the micromotion speed of the target, the higher the pulse interval of the double-pulse system (Table 1). Theoretically, it has been proven that low- and high-speed targets can be measured by controlling the time interval between the front and back pulses in a pulse pair, which demonstrates the velocity measurement capability of a double-pulse coherent system over a wide speed range. Noise analysis indicates that the variance hardly changes with CNR (carrier-to-noise ratio) at a small value of N (average number of independent waveforms). In general, a continuous-wave seed source with a CNR within the range of 0?5 dB, can provide good measurement accuracy (Fig. 8). When ΔT is in the range of 0.2Tc?1.2Tc, the system has good detection accuracy (Fig. 9). Because of the special principle of double-pulse coherent detection, the signal processing method differs from that of single-pulse and continuous light detection. The time required for signal acquisition varies depending on the loop-length and target speed. The optimized experimental system exhibits high-precision ranging and velocity measurement capabilities. The inversion of the distance and velocity is achieved through the Hilbert transform (Table 2, Table 3). Compared to the double-pulse ranging system at the same distance, the error in the velocity measurement is larger. Overall, the errors in the above experiments are all less than 0.25%, which demonstrates double-pulse coherent detection system owning the good capacity in high-precision ranging and velocity measurements.ConclusionsIn this study, a theoretical model was constructed for ranging and velocity measurements, and noise analysis was conducted for a double-pulse detection system. The effects of the interval between front and rear pulses, pulse period, and width on detection distance and micromotion speed were theoretically determined. The control of detection parameters can be realized by simulations. The experiment focused on the high-precision ranging and velocity measurements of targets in a double-pulse coherent system. The Hilbert transform was used to accurately extract phase information. The experimental and simulation results were in good agreement. The above research not only proves the capability of long-range and high-speed target measurement for a double-pulse system but also demonstrates its feasibility in wide-range high-precision detection.
Jan. 16, 2025Vol. 52 Issue 2 0204001 (2025)
Wenbo Ge, Yanqiang Guo, Fading Lin, Xinxuan Cui, and Xiaomin Guo
ObjectiveIn the measurement of high-order photon correlation in light fields, high-precision time-to-digital converters (TDCs) are required to accurately measure the photon arrival time. The purpose of this study is to develop a multichannel high-precision TDC acquisition system that can accurately measure the photon arrival time using a field-programmable gate array (FPGA) hardware platform to support the high-order coherence of the light field, which can be accurately obtained via high-order photon correlation measurements of the light field.MethodsIn this study, a multichannel photon-arrival-time measurement design was implemented using XC7A100TFGG484 of the Artix-7 series. By combining “coarse counting” and “fine measurement” and developing the CARRY4 two-tap (CO0, CO3) structure, we constructed a tap delay chain for fine measurement, which improves the resolution of the TDC while overcoming the limitations of overfeeding. The dead time of the TDC was reduced to one system clock cycle using a switching input stage and dual-mode single-counter coding. The nonlinear delay of the delay cell was calibrated using the code-density calibration method, and the data were transmitted over gigabit ethernet. Subsequently, a test platform was constructed to continue implementing testing and data analysis for the TDC. Finally, the TDC device was verified using a time-correlated single-photon counting measurement system.Results and DiscussionsAccuracy was tested using a signal generator to generate a set of fixed time intervals from small to large to obtain the variation in the accuracy with the time interval. The maximum and minimum accuracies are approximately 25.6 and 20.1 ps, respectively (Fig. 10). The accuracy of the system was tested and counted for each of the eight channels, and the accuracy of the system was obtained as 26.3 ps (Fig. 11). The accuracy at different temperatures was measured at a time interval of 90.91 ns, and the variation in the accuracy error over the temperature range was 2.6 ps (Fig. 12). The results clearly indicate the low temperature sensitivity of the TDC designed in this study. The dead time was reduced to 5 ns in one system clock cycle by adding a switching input stage structure. The CARRY4 two-tap (CO0, CO3) structure was used to construct the tap delay chain, and a resolution of 34.7 ps was achieved. The differential nonlinearity (DNL) and integral nonlinearity (INL) of the system were obtained via code-density tests. For the 1-mode, the DNL and INL ranges are (-0.75tLSB, 1.5tLSB) and (-2tLSB, 2.8tLSB) , respectively. For the 0-mode, the DNL and INL ranges are (-0.76tLSB, 1.32tLSB) and (-1.2tLSB, 1.9tLSB), respectively (Fig. 13).ConclusionsIn this study, a TDC system for multichannel photon-arrival-time measurement was implemented based on an FPGA. The over-advanced feed of the delay unit and the issue of its nonlinear time delay being affected by temperature and voltage were addressed by performing calibration using a single CARRY4 two-tap (CO0, CO3) structure and the code-density calibration method, which in fact resulted in fine counting. An 8-bit 200 MHz system clock was used for coarse counting, and a combination of coarse and fine counting was performed to achieve high-precision measurements. The experimental results show that the developed eight-channel TDC system exhibits an average resolution of 34.7 ps, a timing accuracy of 26.3 ps, a dead time of 5 ns, as well as DNL and INL ranges of (-0.75tLSB, 1.5tLSB) and (-2tLSB, 2.8tLSB) for the 1-mode, respectively. For the 0-mode, the DNL and INL ranges are (-0.76tLSB, 1.32tLSB) and (-1.2tLSB, 1.9tLSB) , respectively. The TDC system implemented in this study combines the advantages of multichannel, high accuracy, and short dead time. Experimental validation was performed via time-correlated single-photon counting measurements, which indicated the practical requirement for higher-order photon-correlation measurements of the light field.
Jan. 20, 2025Vol. 52 Issue 2 0204002 (2025)
Renfang Geng, Zhibo Wu, Yong Huang, Wendong Meng, Kai Tang, Haifeng Zhang, Tong Liu, Wenbin Wang, and Zhongping Zhang
ObjectiveIn recent years, atomic clocks have made spectacular progress, with ground-based optical lattice atomic clocks reaching stabilities of less than 10-18 and accuracies of 1×10-18. High-performance atomic-clock satellite-satellite, satellite-ground, and ground-ground interconnections can be achieved by establishing time-frequency transfer links. This advancement provides insights into various critical technological and scientific domains, including global satellite navigation systems, deep space exploration, verification of general relativity, measurement of gravitational waves, gravity field assessment of the earth, and fundamental physical constant measurements. This year, the Chinese Academy of Sciences plans to launch a lunar orbiting spacecraft equipped with a laser time-frequency transfer payload to assess the performance of onboard hydrogen atomic clocks and to conduct a comparison of clocks in remote observatories. For high-precision time-frequency transfer data processing, establishing a computational model that meets the requirements of the mission within the framework of general relativity is necessary.MethodsBased on the existing relativistic theory for time and frequency transfer, in this study, we derived a relativistic model of one- and two-way satellite-ground laser time-frequency transfer on a distant retrograde orbit (DRO), which can be directly used in the data processing of the DRO laser time-frequency transfer. Using the simulated DRO orbit, we analyzed the magnitudes and distribution patterns of various error correction terms in the laser time-frequency transfer. These terms include light-time correction, atmospheric refraction, relativistic rate shifts, and position correction between the detector and reflector. In addition, Monte Carlo methods were employed to simulate and compute the uncertainties of link corrections, considering the DRO orbit and attitude determinations and the probe payload calibration parameters. The effects of these uncertainties on the stability and accuracy of the time-frequency transfer measurements were investigated for both one- and two-way satellite-ground modes and for one-way laser time-frequency transfer in the common-view mode.Results and DiscussionsIn the two-way mode, the dependence on the satellite orbit accuracy is relatively weak. With a radial distance error in orbit determination of 10 m, we anticipate that the accuracy of link error correction will exceed 1.5 ps, with corresponding link stability (modified Allan deviation) of better than 2×10-17@10000 s. However, the comparative performance of the one-way mode is highly dependent on the accuracy of the satellite orbit determination. The measurement clock error is coupled with the orbit errors. In scenario 1, the link correction accuracy is expected to be within 38 ns, with corresponding link stabilities of approximately 8×10-15@1000 s and 7×10-14@10000 s. This may affect the assessment of the long-term stability of onboard hydrogen clocks.Correction of the detector–reflector positioning relationship is a major factor that affects the laser time-frequency transfer in low-earth-orbit satellites. In lunar laser time-frequency transfer, assuming ground measurement errors of 1 cm and attitude measurement errors of 360 arcsec, the correction uncertainty is approximately 1×10-13. Both one- and two-way modes require correction for atmospheric refraction, with the one-way mode possibly requiring more accurate meteorological parameters than the two-way mode.When two observation stations each use one-way mode to conduct measurements on a DRO probe and achieve one-way laser time-frequency transfer in the common-view mode, the link is expected to achieve an accuracy of better than 1.7 ns and a stability of 1×10-14@1000 s.ConclusionsThe computational model developed in this research enables high-precision processing of one-way and two-way laser time-frequency transfer measurement data between the earth and the moon, thereby providing a theoretical foundation for the performance evaluation of atomic clocks and time synchronization in deep space exploration missions.
Jan. 20, 2025Vol. 52 Issue 2 0204003 (2025)
Lin Li, Peng Wang, Yue Li, Haotian Wang, Luhua Fu, and Changku Sun
ObjectiveThe combined optical measurement approach of vision and structured light has become a prevalent non-contact measurement technique given its advantages of simple hardware configuration, high measurement accuracy, and strong adaptability to complex materials and geometries. Compared to fringe projection profilometry, speckle projection profilometry can obtain three-dimensional information of a target by projecting a single frame image. Therefore, the binocular measurement method based on laser speckle projection has become a mainstream approach for real-time acquisition of three-dimensional motion information. However, due to the randomness, disorderliness, high-frequency noise, and lack of significant feature points in speckle patterns, traditional feature extraction algorithms, which mainly rely on prominent features such as corners and edges, struggle to detect stable and repeatable feature points from speckle patterns, resulting in suboptimal feature matching. In contrast, deep learning-based methods offer the advantages of autonomously learning and extracting relevant features directly from the input data, providing higher measurement accuracy, faster measurement speed, and greater robustness. Nevertheless, existing deep learning-based algorithms rely entirely on manually labeled datasets for training, leading to prohibitively high training costs. Therefore, to address these issues, this study proposes a self-supervised convolutional neural network with sub-pixel accuracy, employing a deep learning-based method to extract speckle feature information and overcome the shortcomings of traditional speckle projection measurement methods, such as slow measurement speed, low measurement accuracy, and poor robustness. Additionally, transfer learning and self-supervised training strategies are adopted to mitigate the network’s reliance on manually labeled datasets.MethodsThe network architecture proposed in this study primarily comprises a shared encoder and two parallel branches. This architecture not only reduces the number of parameters required for learning but also enhances the model’s ability to share computations and representations between tasks. To improve the network’s operation speed and enhance its feature extraction capabilities, a dynamic depth separable convolution module is proposed for the backbone. This module reduces the computational load and network parameters through depth separable convolutions while enhancing the feature extraction capabilities via dynamic convolutions. To improve the accuracy of speckle point extraction and matching, coordinate refinement modules and fine-grained matching modules are designed in the network’s feature detection and feature matching branches, respectively, thus elevating the speckle feature point matching to sub-pixel accuracy and enabling end-to-end training. To mitigate the network’s dependency on labeled datasets, a synthetic dataset named the synthetic speckle dataset is first created to guide the model’s learning. In this dataset, we model the feature points by mimicking the distribution patterns of speckles, thereby eliminating label ambiguity and learning bias. Subsequently, the model trained on this synthetic dataset is used to annotate the real dataset, replacing manual annotation. Finally, the pre-trained model is transferred to the real dataset for further training, employing data augmentation techniques during training to enhance the model’s generalization and feature representation capabilities.Results and DiscussionsFor network training, we create a synthetic dataset called the synthetic speckle dataset (Fig. 7) to guide the model’s learning. Subsequently, we utilize a binocular measurement system based on a laser speckle projector (Fig. 9) to capture speckle images projected onto a helmet (Fig. 8) under various ambient light intensities. By employing a high-precision turntable, we simulate the translational and rotational movements of the helmet to mimic the movements of a pilot’s head. The proposed method’s efficacy is validated through experiments (Fig. 11), demonstrating the effectiveness of the combined self-supervised training and transfer learning approach (Table 1). We visualize the training process (Fig. 10). Comparative experiments on real speckle datasets are conducted against traditional algorithms and four advanced deep learning-based networks (Fig. 12), proving that the proposed method significantly outperforms others in terms of the number of speckle matches, matching accuracy, and robustness across different ambient light intensities, helmet angles, and texture richness. The matching time of 46 ms is second only to that of DISK, with an accuracy of 92.84% (Table 2). The results of three-dimensional reconstruction experiments (Figs. 13?16) demonstrate that the proposed measurement method can accurately and clearly restore the three-dimensional morphological features of objects with varying materials, sizes, and shapes, showcasing excellent robustness. Finally, ablation experiments validate the superiority of the designed dynamic depth separable convolution module and the fine-grained matching module (Table 3). We provide an explanation of the advantages of the provided dynamic depth separable convolution module (Fig. 17).ConclusionsIn this paper, we propose a lightweight and efficient self-supervised convolutional neural network based on speckle projection for sub-pixel level image matching of pilot helmets. To address the challenges posed by the reliance of the existing deep learning-based algorithms on manually labeled datasets for training, we introduce a novel approach that combines transfer learning, self-supervised training, and data augmentation techniques. This method mitigates the dependency on manually labeled datasets, enabling the network to comprehensively learn various features and information from abundant data, thereby enhancing its generalization and feature representation capabilities. Additionally, to improve the network’s operation speed and feature extraction capabilities, we propose a dynamic depth separable convolution module for the backbone. To enhance the accuracy of speckle point extraction and matching, we employ coordinate refinement and fine-grained matching modules at the network’s head, achieving sub-pixel level precision. For the feasibility of the experimental system and methods, we create both a synthetic dataset and a real speckle dataset to train the model and conduct comparative experiments. The experimental results demonstrate the proposed method's significant advantages in the number of speckle feature point matching, matching accuracy, matching speed, and robustness. In summary, this research lays a crucial foundation for the rapid and accurate measurement of pilot helmet poses.
Jan. 20, 2025Vol. 52 Issue 2 0204004 (2025)
Jiaming Chen, Kun He, Feiyang Sun, Jing Zhang, Xingyu Chen, Kangning Jia, Li Fan, Liping Cheng, Xuejun Yan, Xiaodong Xu, and Shuyi Zhang
ObjectiveIn the service process, the key components of various mechanical components such as bearings, gears, and cylindrical inner walls are affected by various factors such as static load, impact, fatigue, corrosion, and radiation. Their surface areas are prone to damage defects such as cracks, delamination, and fractures, which adversely affect the performance and structural integrity of the components. Surface defects can be divided into surface defects, which are directly exposed to air, and subsurface defects, which are buried beneath the surface. In contrast to surface defects, subsurface defects cannot be detected using traditional optical and other methods; therefore, an effective non-destructive testing method is urgently required. In addition, additive manufacturing (AM), an emerging manufacturing technology, has the advantages of integrated molding, a short processing cycle, and environmental protection compared to traditional subtractive manufacturing technology, and has broad development prospects in aerospace, nuclear power, medicine, and other fields. However, because of rapid heating and cooling during AM processing, defects such as bubbles, nonfusion, spheroidization, and cracks inevitably occur inside the module, which is a key factor limiting the further application of metal AM technology. Because of the layer-by-layer stacking characteristics of the AM process, a nondestructive testing method that can be applied to a high-temperature environment with high-electromagnetic interference and effectively detect surface and sub-surface defects can improve the yield rate of additive manufactured components and the economic benefits of additive manufactured production. To address the limitations of traditional optical and other methods in detecting subsurface defects and that of ultrasound in detecting additive manufactured components , this paper proposes a laser ultrasound method to detect additive manufactured samples containing subsurface defects.MethodsA finite element model is first established to simulate the interaction between laser-induced ultrasound and subsurface defects and to illustrate the mechanism of scattering Rayleigh (SR) waves in characterizing defect widths. The propagation properties of surface acoustic waves and the ultrasonic mode transformation characteristics caused by the defects are analyzed. Experimental verification is performed on an AlSi10Mg alloy fabricated through selective laser melting (SLM) with subsurface through defects. Subsequently, a purely optical, completely noncontact laser ultrasonic scanning system is established and used to excite the ultrasonic waves in the AM sample. The wavelengths of the ultrasonic laser surface waves are modulated by adjusting the laser spot. Subsequently, a synthetic aperture focusing technique (SAFT) is constructed using the scattering characteristics between the surface acoustic waves and subsurface defects. Finally, the improved SAFT is used to image the two subsurface rectangular defects (the burial depth of the two defects is 0.4 mm, and the sizes are 0.3 mm and 0.5 mm ) in the additive manufactured sample.Results and DiscussionsThe simulation results [Fig. 2(a)] show that when the surface wave encounters a subsurface defect within the penetration depth, it interacts with the defect to produce an SR wave that propagates in the opposite direction. Figure 2(b) shows the ultrasonic field when the surface wave separates from the defect and continues to propagate backward. Spectral analysis of the laser ultrasonic signals obtained in the experiment (Fig. 6) shows that the wavelength of the excited ultrasonic surface wave is approximately 1.5 mm, and the subsurface defects in this range interact with the laser ultrasonic surface wave. After processing the signals using sliding time window filtering, the final results (Figs. 7?8) show that the size of the defect obtained by SAFT is consistent with its calibrated size, and the detection error is approximately 5%, with a rapid imaging speed realized based on the b scan data. The feasibility of the laser-ultrasound-based SAFT for AM detection and the potential application prospects of laser ultrasonic technology in AM online quality analysis are demonstrated.ConclusionsLaser ultrasonic testing is a non-contact and highly precise method that can be used to detect complex environments such as high temperature, high pressure, and strong radiation, and has broad application prospects in industrial non-destructive testing. In this study, a nanosecond pulse laser is used to generate ultrasonic surface waves with a certain penetration depth, and the scattered ultrasonic surface waves interacting with subsurface defects are used to image the subsurface defects in additive manufactured samples in combination with the synthetic aperture focusing technique. Theoretical and experimental results show that the delay effect of burial depth on surface wave scattering can be ignored for subsurface defects, SAFT imaging results can be used to accurately locate subsurface defects and judge their size, and the detection system has certain industrial application prospects for the detection of subsurface defects in additive manufactured samples.
Jan. 20, 2025Vol. 52 Issue 2 0204005 (2025)
Da Teng, Rongrong Hu, Mingya Cheng, Yongzhi Hao, Zhe Zhang, Yanyan Chen, Hongyang Nie, Tianshun Wang, and Zigang Shen
ObjectivePlasmonic waveguides can compress light into regions significantly smaller than the diffraction limit and have emerged as a promising candidate for achieving nanoscale field confinement. To date, various types of plasmonic waveguides have been proposed and widely used for the development of integrated optical devices, including nanolasers, modulators, splitters, and resonators. However, the strong optical-field-confinement ability of noble metal-based plasmonic devices is typically accompanied by their inherent Ohmic loss, which severely hinders their applications at the nanoscale. Recent studies show that alkali metal sodium presents lower loss than metal silver, and that the free-electron relaxation time of sodium is approximately double that of silver. The utilization of alkali metals can potentially decrease the optical loss of plasmons significantly, thus facilitating investigations into light-matter interactions at the nanoscale. In this study, we propose a hybrid surface plasmon waveguide structure comprising triangular-shaped sodium and silicon nanowires, which effectively confines light fields in the low-refractive-index spacer and at long transmission distances (>40 μm). In particular, owing to its low modal loss and excellent optical-field confinement ability, the proposed hybrid plasmon waveguide demonstrates an extremely low gain threshold and a large Purcell factor. Additionally, the effect of lateral-position deviation on modal and lasing properties is investigated, and the results show robustness against position deviations. Hence, the proposed structure is feasible as building blocks for subwavelength photonic devices, such as nanolasers and modulators.MethodsThe proposed hybrid plasmonic waveguide structure (Fig. 1) comprises a triangular-shaped sodium nanowire separated from a triangular-shaped silicon nanowire by a gap distance (g). The waveguide and lasing performances were investigated using the finite-element method (FEM) and characterized using the effective mode index [neff=Re(Neff)], propagation length (LP), normalized mode area (AN), figure-of-merit (FM), confinement factor (Γ), gain threshold (Gth), and Purcell factor (FP). The eigenvalue solver was used to obtain the complex effective mode index (Neff) and effective mode area (Aeff). The dielectric constants of silicon and silica are 12.08 and 2.09, respectively. For the metal Na, a Drude-Lorentz model was employed to calculate the dielectric permittivity, and εNa=-44.8325+0.6452i when the wavelength λ is1550 nm. The calculation domain measures 6λ×6λ, with a minimum mesh size of 1 nm, and a perfectly matched layer (PML) was applied around the geometry to avoid the influence of reflection. Additionally, convergence analysis was performed to ensure that the numerical boundaries and meshes do not interfere with the solutions.Results and DiscussionsThe proposed waveguide exhibits strong confined modal fields with linewidths of electric-field distributions determined primarily by g. The modal-transmission properties depend significantly on g and W. When g decreases, the modal area decreases and the FM increases (Fig. 3). Moreover, as the width W increases, the gain threshold Gth decreases until the lowest threshold of approximately 0.141 μm-1 (Fig. 4). The Purcell factor remains consistently above 35.9. The apex angles of the sodium (α) and silicon (θ) nanowires significantly affect the modal properties. When α=π/6, the fundamental mode exhibits the strongest field-confinement ability, thus resulting in a minimum normalized mode area AN of 6.782×10⁻⁵. Additionally, the FM remains consistently above 3131. Compared with the cases for α=π/6 and π/2, the mode loss is lower when α=π/3 (LP reaches 44 μm, Fig. 5). In general, the gain threshold is less than 0.2 μm-1 and reaches the lowest threshold of approximately 0.118 μm-1 (Fig. 6) when α=π/3 and θ=π/6, which is significantly lower than the gain thresholds of conventional silver-based plasmonic waveguides, as shown in Table 1. Moreover, the Purcell factor ranges from 220 to 964, which indicates significant improvement. Finally, we investigate the effects of lateral manufacturing deviation on the waveguiding and lasing performances. The result shows that LP increases by 7% when the position deviation ranges from 0 nm to 10 nm (Fig. 7). Simultaneously, Gth increases from 0.118 μm-1 to 0.129 μm-1, which is an increment of 9% (Fig. 8). These results indicate that the proposed device is robust against position deviations.ConclusionsWe proposed and investigated a hybrid plasmonic waveguide structure comprising triangular-shaped sodium and silicon nanowires using the FEM at a wavelength of 1550 nm. The mode characteristics depend significantly on the shapes of the sodium and silicon nanowires, and the linewidths of electric-field distributions are determined primarily by g. When α=π/6 and θ=π/2, we achieved a normalized mode area of merely 6.782×10⁻⁵ and a high FM exceeding 3131. Further investigations show that the low loss in the Na plasmon mode is key in reducing the gain threshold. Owing to the low modal loss when α=π/3 and the excellent optical-field-confinement ability, the gain threshold can reach a minimum value of 0.118 μm-1 when θ=π/6. Additionally, we obtained Purcell factors exceeding 220. The lasing performances are relatively robust even under lateral-position deviations. This study facilitates future applications of plasmonic waveguides in nanolasers and may promote the application of alkali metal plasmons in nanophotonics.
Jan. 20, 2025Vol. 52 Issue 2 0213001 (2025)
Xiazhuo Jiao, Mailikeguli Aihemaiti, Yuxia Zhou, Subinuer Yakufu, Jianqiang Ye, and Xining Yang
ObjectiveThe 1.5 μm waveband laser has attracted remarkable attention in various fields, including radar, remote sensing, laser vibration measurement, and material microprocessing, because of its low atmospheric-transmission loss and safety for human eyes. The 3?5 μm waveband laser has a typical “atmospheric infrared window” and fingerprint band, and it can be used for molecular-content detection, environmental detection, imaging, telemetry, and biomedicine. Owing to its high spectral purity, long coherence length, and low phase noise, a narrow-linewidth, high-beam-quality infrared laser can be better applied in gravitational-wave detection, cold atomic physics, coherent optical communication, and optical-precision detection. An optical parametric oscillator (OPO) is an effective device for frequency conversion and can directly convert the wavelength of a solid-state laser into near- and mid-infrared wavelengths. Compared to the femtosecond OPO, the picosecond OPO not only has a high average power output but also exhibits a good balance between the pulse width and narrow spectral bandwidth.MethodsA schematic of the synchronous-pumping picosecond KTiOAsO4 (KTA)-OPO, used for high-power, high-beam-quality, narrow-bandwidth laser generation in the near- and mid-infrared wavelengths, is presented in Figure 1. The pump source is an all-solid-state picosecond laser based on a diode-pumped Nd∶YVO4 crystal, which provides up to 18.5 W of maximum output power at 1064 nm in 15 ps pulses at a 120 MHz repetition frequency. A half-wave plate was used to rotate the polarization of the pump beam to excellently match the phase in the KTA crystal. Using a plano-concave lens with a focal length of 100 mm, the output of the pump beam was focused to ~63 mm at the center of the nonlinear crystal. The cavity parameters and spacing were theoretically estimated using LASCAD software.To achieve the best mode coupling of the pump and signal beams in the nonlinear crystal, the signal beam had a spot radius of 64 μm at the center of the KTA. The 90°-cut KTA crystal (5 mm×5 mm×30 mm) was selected as the nonlinear-gain medium, and the two end surfaces were antireflection coated for the pump (1.064 μm), signal (1.535 μm), and idler (3.468 μm) beams. To achieve synchronous pumping, the OPO was configured into a signal-resonant Z-shaped standing-wave cavity using five reflective mirrors. Reflector M1 is a plane. Mirrors M2 and M3 are plane-concave mirrors with a 150 mm radius of curvature; the distance between them is 167 mm. Reflector M4 is a concave mirror with a 500 mm radius of curvature. The output coupling mirror M5 is a concave mirror with a 1000 mm radius of curvature.M1?M4 are highly reflective (99.9%) to the signal beam and highly transmissive to the pump and idler beams. The output coupling mirror (OC) M5 has a 20% transmittance and 80% reflection to the signal beam. This design not only ensures a single-resonance signal but also enables the signal and idler beam to simultaneously be stably output from the cavity.Results and DiscussionsBy adjusting various cavity parameters, a standing-wave cavity with high stability is established, successfully achieving high-beam-quality, high-power, narrow-linewidth, and highly stable signal and idler outputs. The spatial-profile distributions of the signal and idler beams are near-Gaussian modes (Fig. 2). The beam quality factors (M2) of the output beam are measured using the knife-edge method. The M2 values of the signal beam in the two orthogonal directions are 1.11 and 1.12 [Fig. 3(a)], whereas those of the idler beam are 1.16 and 1.17 [Fig. 3(b)]. At the maximum pump energy of 18.5 W, 3.55 W of signal and 1.75 W of idler beams are output, with conversion efficiencies of 27.8% and 13.6% (Fig. 4), respectively. The extracted signal and idler beams exhibit passive power stabilities of better than 1.6% (RMS) and 1.5% (RMS) over 6 h (Fig. 5), respectively. The full width at half maximum (FWHM) of the signal and idler outputs are measured to be Δλs=0.27 nm and Δλi=0.75 nm (Fig. 6), respectively.ConclusionsThis study demonstrates the generation of high-beam-quality, narrow-linewidth, high-stability, and high-power ultrafast lasers in the near- and mid-infrared wavelengths by building a single-resonant signal KTA-OPO that is synchronously pumped by a 1 μm picosecond pulsed laser. At a maximum pump energy of 18.5 W, a signal output in the near-infrared region and an idler output in the mid-infrared region are obtained, corresponding to slope efficiencies of 27.8% and 13.6%, respectively. By combining the excellent nonlinear characteristics of the KTA crystal and the stable resonant cavity, M2 values of 1.12 and 1.17 are achieved for the signal and idle outputs, respectively. The signal and idler beams exhibit high power stability over 6 h.
Jan. 15, 2025Vol. 52 Issue 2 0208001 (2025)
Kai Wang, Tianyu Mao, Rongshi Chen, Fei Han, Nanxiang Zhao, Xinyuan Zhang, Qingli Ma, Shilong Xu, and Yihua Hu
ObjectiveThe position-momentum (EPR) entanglement of two particles is of special importance for fundamental research in quantum physics and quantum information processing. The existing methods for preparing position-momentum entanglement are mainly based on nonlinear crystal and atomic systems. Devices in atomic systems are complex and difficult to adjust, and the efficiency of entangled photons generated by β-BaB2O4 (BBO) crystals is low. In this study, we first use ghost imaging and ghost interference techniques to achieve efficient generation of position-momentum entangled photons in the periodically polarized potassium titanium phosphate (PPKTP) crystal optical path, and verify the entanglement properties. The sampling time for a single pixel is 10 s, and the experimental setup design is relatively simple. The entangled photon source analyzed in this study can provide assistance for quantum imaging and preparation of super-entangled states. It also demonstrates broad application potential in fields such as quantum information processing and quantum communication protocols.The preparation of EPR entanglement is mainly based on nonlinear effects of the medium. The atoms in crystals and cold atomic clusters are almost stationary, making them ideal media for generating position and momentum entangled photons, given that the mass of photon entanglement does not decrease owing to atomic motion. The existing EPR entanglement preparation methods are mainly based on nonlinear crystal and atomic systems, including spontaneous parametric down-conversion (SPDC) effects based on BBO crystals, spontaneous four-wave mixing (SFWM) effects based on cold atomic systems, and spontaneous Raman scattering (SRS) effects. Experiments have found that high-quality entanglement sources can also be prepared based on the SFWM and SRS effects of thermal atomic systems. The characterization of EPR entanglement can be achieved through ghost imaging and ghost interference. The positional uncertainty can be calculated using ghost imaging data whereas the uncertainty of the displacement can be calculated using ghost interference data. Whether the EPR entanglement inequality is met or not must be verified to evaluate the entanglement degree. The EPR preparation scheme based on atomic systems has a narrow bandwidth of entangled photons at the order of 1 MHz. However, the experimental setup is relatively complex. Among such atomic systems, cold atom systems require multiple lasers for atomic cooling, while the power, frequency, timing, and other parameters of the cooling laser have strict requirements. Thermal atomic systems require a heating device to accurately control the temperature, and the SFWM and SRS effects based on atomic systems require a pump beam and a coupling beam, which have inconsistent wavelengths and high requirements for spatial optical path calibration. Therefore, atomic systems feature a large volume, multiple devices, and complex operations. Nonlinear crystals can operate at room temperature, but the SPDC process of BBO crystals has a lower efficiency in generating entangled photons, which requires a higher pump power, usually exceeding 30 mW. Collecting entangled photons requires a long time to accumulate. The efficiency of PPKTP crystals at room temperature exceeds 10 times that of BBO, requiring low pump power, and making it a better choice for preparing entanglement sources. This study is based on the spontaneous parametric down-conversion effect of PPKTP crystals to prepare an efficient EPR entanglement source. The experimental results show that the uncertainty of the position and momentum of the entangled photon pairs calculated through ghost imaging and ghost interference images satisfies the entanglement paradox inequality, thereby verifying the entanglement characteristics.MethodsThe preparation and characterization of EPR entanglement based on the SPDC effect of PPKTP crystals include the following processes. First, the SPDC effect of the pump light source in the PPKTP crystal is exploited to generate entangled photon pairs. Then, the entangled photon pairs along the path are separated, the imaging object with the signal photon is irradiated, a signal photon is collected using a multimode fiber, and a single photon detector is employed for photon detection. Subsequently, the idle photon is divided into two paths, the power of each path is adjusted using a half-wave plate and a polarizing beam splitter prism, and either imaging or interferometric measurements are taken. After passing through a slit installed on a translation platform, the idle photon enters the fiber coupling head and undergoes position scanning. Photons are collected using a single photon counter and measured in accordance with the signal photons for ghost imaging. The other possibility for the idle photon is to collect photons using a short focal length lens and perform position scanning for ghost interference and measurement in accordance with the signal photon. Finally, the positional and momentum uncertainties are calculated using ghost imaging and ghost interference data, respectively, to verify whether they meet the EPR entanglement inequality and perform entanglement characterization.Results and DiscussionsThe experimental results of ghost imaging and ghost interference are shown in Fig. 3. We established the calibrated theoretical models by fitting the data. Regarding ghost imaging, we fitted the data by performing a convolution of the double slit with a Gaussian function that takes into account the finite size. We compared the resulting fitting curve with the real transfer function of the metal bar to evaluate Δx. For ghost interference, we first fitted the experimental data by applying a Fourier transformation to the double slits and a tunable parameter for visibility, and compared the fitted curve with the Fourier transformation of the real double slits, thereby obtaining Δp. The values obtained from experimental measurements are listed in Table 1. We obtained the uncertainties of position and momentum by fitting the ghost images and ghost interference and compared them with the ideal curves, thereby verifying the EPR paradox inequality. The data exhibit clearly both ghost imaging and ghost interference and satisfy the EPR paradox inequality.ConclusionsIn this study, we implement a two-photon position-momentum entanglement preparation based on the spontaneous parametric down-conversion effect of PPKTP crystals, and use ghost imaging and ghost interference methods for entanglement characterization. By fitting experimental data with theory, we demonstrate that the prepared EPR entangled photon pairs satisfy the entanglement inequality. The principle of this method is reliable, achieving efficient preparation and characterization at room temperature. Only one pump light is needed for preparation, and the device is simple and easy to implement. It can effectively reduce interference from factors such as random jitter of optical components, and has low energy consumption. Our EPR entanglement source may have potential application in fields such as quantum imaging, quantum teleportation based on continuous variable entanglement, quantum key distribution, and quantum detection. This efficient method for preparing entangled sources provides a new approach for future applications. In this regard, the Gaussian characteristics of pump light sources may be changed and modulated to further improve the entanglement quality.
Jan. 25, 2025Vol. 52 Issue 2 0212002 (2025)
Jianchao Zhang, Xiaomin Guo, Jiahui Hou, Jie Zhao, and Yanqiang Guo
ObjectiveQuantum weak measurement is a measurement technique based on minimal intrusion and the weak value amplification (WVA) effect, which significantly expands the capability of quantum precision measurement. Quantum weak measurements have been applied to tiny-phase measurements and have yielded a series of results. Previous standard weak measurements primarily used spectral or CCD pointers to achieve precise measurements of tiny phases under a single weak interaction (SWI). However, a trade-off between enhancing the amplification factor (known as the anomalous weak value) and the post-selection probability is encountered in SWIs. Because of the difficulty in enhancing both simultaneously, the extraction of the anomalous weak value and the measurement precision are limited. This issue is typically alleviated using quantum resources. However, difficulties in preparing quantum resources restrict their practical applications. Hence, practical quantum weak measurement systems must be further investigated to overcome these limitations.MethodsIn this study, an enhanced phase weak measurement method based on multiple weak interactions (MWIs) is proposed and demonstrated. The evolution of the intensity pointer was analyzed theoretically and a formulation for enhanced WVA was derived. A system for enhanced phase weak measurements based on MWIs was constructed using continuous coherent light as the incident source. This setup employs double weak interactions with two sets of half-wave plates (HWPs) as well as an avalanche photodiode (APD) as the intensity pointer. The post-selection angle was fixed, and the HWP was tilted to introduce a weak phase delay for the measurement. Meanwhile, the phase delay was detected precisely by recording changes in the light intensity. By maintaining a constant phase delay and adjusting the post-selection angle, anomalously weak values were extracted with a high signal-to-noise ratio (SNR).Results and DiscussionsOwing to the double weak interactions, the intensity shift is greater than that resulted under the SWI (Fig. 4). The symmetrical post-selection intensity contrast ratios exceed those under the SWI by approximately two folds (Fig. 5), thus indicating that the double-weak-interaction scheme offers a higher measurement sensitivity. At three post-selection angles of 0.002, 0.004, and 0.007 rad, the intensity uncertainties of the double weak interactions are 0.006, 0.015, and 0.040 mV, respectively (Fig. 6), and the phase precisions are 6.00×10⁻⁷, 7.76×10⁻⁷, and 9.46×10⁻⁷ rad, respectively. Compared with the SWI, the double weak interactions improved the phase precision by approximately an order of magnitude. Under the double weak interactions, an anomalously weak value of 239 is obtained with a high SNR of 18.2 dB for a post-selection angle of 0.0084 rad. Decreasing the post-selection angle to 0.002 rad while the SNR remains at 9.8 dB results in a higher anomalous weak value of 993 (Fig. 7).ConclusionsIn this study, based on the amplification effect of anomalous weak values on the interaction parameters, an enhanced WVA scheme based on MWIs was theoretically and experimentally demonstrated and applied to ultraprecise phase measurements. Experimentally, coherent light with a linewidth of 400 kHz was used as the incident light source and an APD was utilized as the intensity pointer, which is different from previous spectral detection schemes. By developing the MWI theory and experimental scheme as well as realizing double weak interaction (N=2) measurements, the experimental results show that the phase measurement sensitivity is significantly better than that achieved under SWIs. In particular, an optimal measurement precision of 6.0×10⁻⁷ rad is achieved at a post-selection angle of 0.002 rad, which is approximately an order of magnitude higher than that achieved under an SWI. Additionally, based on a high SNR of 9.8 dB at a post-selection angle of 0.002 rad, an enhanced anomalous weak value of 993 is measured, which is approximately an order of magnitude greater than the standard weak measurement. The enhanced WVA scheme based on MWIs was validated via phase measurements, whereas the relationship between the phase and other physical quantities, such as displacement, temperature, and magnetic induction strength, can be established in optical experiments; thus, the scheme provides important technical support for practical enhanced quantum precision sensing.
Jan. 16, 2025Vol. 52 Issue 2 0212003 (2025)
Dingyuan Fu, An Ye, Yutong Tang, Xiaolin Li, Yueping Niu, and Shangqing Gong
ObjectiveVery low frequency (VLF) refers to radio frequencies within the range of 3 to 30 kHz, characterized by long wavelengths and strong penetration capabilities. These VLF waves can propagate effectively between the surface of the Earth and the ionosphere, enabling intercontinental communication. Moreover, their ability to penetrate through obstacles like seawater and rock makes them ideal for communication in underwater and underground environments. Traditional VLF communication systems utilize large, ground-based receiving antennas, which are often bulky and impractical in modern airborne and satellite-based observation systems. Consequently, an increasing demand existed for miniaturized, portable antennas. Various compact antennas have been developed to meet this need, including electrically small antennas such as loop, ferrite rod, whip, and magnetoelectric (ME) antennas. Nitrogen-vacancy (NV) centers in diamond, recognized for their high sensitivity in magnetic sensing, exhibit significant potential as VLF receivers. These NV centers offer key advantages, such as directional sensitivity to magnetic fields and wide-frequency bandwidth, making them suitable candidates for antenna applications. These properties make NV centers particularly suitable for use as antennas. This study investigates the integration of NV centers in diamond for communication modulation signal reception in the VLF range, aiming to create a miniaturized vector communication receiving antenna. Unlike superconducting quantum interference devices (SQUIDs) or atomic magnetometers, which rely on magnetic sensing but require specific thermal conditions (either high or low temperatures) to maintain high sensitivity, NV centers can operate effectively without such conditions. This unique characteristic highlights their immense potential for a wide array of applications, including VLF signal detection and quantum magnetometry.MethodsThis study developed a diamond NV center vector magnetometer comprising three main components: (1) an optical system for laser emission and fluorescence collection from the NV centers, paired with a data processing system; (2) a microwave system to provide modulated microwaves required for demodulation; and (3) an emission system for transmitting test signals. Using this configuration, the vector magnetometer detected fluorescence signals from the NV centers excited by a 532 nm laser in conjunction with continuous wave microwave modulation, enabling the detection of 10 kHz VLF radio waves.The magnetometer was used to receive and decode minimum shift keying (MSK) modulated signals in the VLF band to validate the demodulation capability of typical VLF signals. The original binary signals were recovered through a series of steps, including mixing, low-pass filtering, and sampled quantizer encoding. To further analyze the vector characteristics of the antenna, a coil emitting the test signal was rotated around the diamond NV center. This approach enabled the measurement of the response of the antenna to the vector information of the VLF signals and facilitated the plotting of the radiation patterns of the antenna.Results and DiscussionsThe signals received by the diamond NV center magnetometer are successfully demodulated and decoded into their original binary form using a process that involves mixing, low-pass filtering, and sampled quantizer encoding (Fig. 4). Experimental results reveal that when the amplitude of the alternating magnetic field coupled to the NV center exceeds 17 μT, the bit error rate (BER) remains below 1%. When the amplitude reaches 30 μT or higher, the system demonstrates the ability to receive communication signals continuously without errors (Fig. 5).The performance of the antenna can be characterized by its noise power spectral density and dynamic range. At 10 kHz, the noise power spectral densities for the four NV axes (NV1, NV2, NV3, and NV4) are 14.35, 26.50, 16.03, and 24.80 nT/Hz1/2, respectively. The dynamic range for NV3 is measured at 35.68 μT (Fig. 6). Furthermore, based on the vector characteristics of the four NV axes, the radiation patterns of the antenna are plotted, and the angular sensitivity is quantified. The calculated angular resolution is 0.2°, with an equivalent angular noise power spectral density of 19.01×10⁻³ (°)/Hz1/2 (Fig. 8).ConclusionsIn this study, we designed an NV center magnetometer with a significantly reduced antenna volume compared to traditional coils. Under 532 nm laser irradiation, the VLF vector antenna, composed of a diamond with a volume of 4.5 mm3, detected radio waves at a frequency of 10 kHz, achieving an optimal sensitivity of 14.35 nT/Hz1/2. This antenna successfully received the magnetic component of VLF radio waves using this magnetometer as a sensor and demodulated real-time VLF MSK-modulated signals at the μT level with a low bit error rate, confirming its potential as a low-frequency communication signal receiver. Leveraging the vector characteristics of the diamond NV center, the four NV axes, fixed at specific angles to each other, are employed to plot the radiation patterns of the four axes under specific calibration and measurement field conditions. This setup verified the ability of the antenna to detect the direction of the communication signal source. The resulting angular resolution is 0.2°, with an equivalent angular noise power spectral density of 19.01×10⁻³ (°)/Hz1/2.
Jan. 17, 2025Vol. 52 Issue 2 0212004 (2025)
Jiangming Xu, Junhong He, Jun Ye, Yanzhao Ke, Yidong Guo, Xiaoya Ma, Yang Zhang, Junrui Liang, Wenwen Cheng, Lei Du, Jinyong Leng, and Pu Zhou
Jan. 20, 2025Vol. 52 Issue 2 0216001 (2025)
Botao Lü, Ning An, Yanning Zheng, Zequn Lü, and Xingwei Han
ObjectiveSky background noise represents a significant source of error in satellite laser ranging (SLR), its intensity and distribution directly influence the accuracy of SLR measurements. During the same observation process, fluctuations in sky background noise can vary by up to two orders of magnitude, adversely affecting both the precision and stability of the SLR-ranging results. Due to technological constraints, current SLR detection systems cannot measure the sky background noise concurrently with target observations. Consequently, a key research focus in this field is developing methods to accurately estimate the sky background noise in each observation area using readily available atmospheric parameters. Presently, there is no software on the market capable of directly calculating the sky background noise received by SLR systems. Most atmospheric radiation transmission softwares only provide simulations of atmospheric transmittance or sky background radiation intensity, which limits their ability to comprehensively analyze sky background noise. Additionally, because these tools do not account for the structural parameters of the SLR system, they cannot directly calculate the number of background noise photons, which limits their utility in optimizing and applying the SLR system.MethodsThis study utilizes the optical radiation transfer equation and the SLR system noise calculation equation in conjunction with the relationship between the distribution of atmospheric particles and meteorological parameters such as visibility and relative humidity near the surface. Key parameters, including optical thickness, scattering phase function, single scattering albedo, and scattering angle, are comprehensively considered. A satellite laser ranging atmospheric radiation transfer simulation software (SLRART) was developed using the C++ programming language. This platform was employed to estimate and analyze the sky background noise distribution as received by the 60 cm SLR system at Changchun Station. The reliability of this software was validated through experimental measurements of daytime background noise.Results and DiscussionsThe experimental results demonstrate that the output from SLRART closely aligns with the actual measurement results. The average relative error for the first-level data product (atmospheric transmittance) is only 5% (Tables 1, 2), while the second-level data product (sky background noise received by the SLR system) shows an average relative error of approximately 10%, with the maximum error rate not exceeding 15% (Table 3). The above results indicate the accuracy and applicability of the SLRART software. Furthermore, the influence of different solar positions on the sky background noise received during SLR observation has been analyzed. The results indicate that the trend in the software simulation corresponds closely to the measured results, with the intensity of sky background noise generally decreasing as the solar angle increases (Table 4, Fig. 7). Finally, the impact of meteorological parameters on the detection performance of the SLR system has been examined. It has been found that, compared to visibility and relative humidity, the solar position is the primary factor driving changes in the false alarm rate of the SLR system: variations in the false alarm rate due to solar position can reach approximately 60%, significantly affecting the detection of echo signals. In contrast, the effect of seasonal meteorological factors on false alarm rates is relatively minor, with the maximum variation not exceeding 16% (Fig. 8).ConclusionsThis study employs the single scattering transmission equation for solar radiation, in combination with atmospheric transmittance slant transmission correction theory, to simulate the distribution of sky background noise in the SLR system. The developed SLRART software, which holds independent intellectual property rights, provides a platform for numerically calculating sky background noise using input parameters from the system and real-time meteorological data. Based on the above results, the numerical calculation of sky background noise in the SLR system has been achieved by inputting system parameters and real-time meteorological parameters. Compared with the measured results, the average relative error rate of SLRART in calculating the sky background noise of the SLR system is only about 10%, and the maximum error rate does not exceed 15%. In addition, SLR daytime background noise experiments and false alarm rate experiments have been conducted, and the experimental results are found to be in consistent with the software simulation results. The results indicate that the noise intensity decreases as the angle between the telescope and the sun increases. The developed SLRART software significantly extends the application of atmospheric transmission numerical simulation technology, addressing limitations in the theoretical calculation of sky background noise in SLR systems.
Jan. 16, 2025Vol. 52 Issue 2 0210001 (2025)
Huanming Shan, Zenghui Wang, Runhua Li, and Yuqi Chen
ObjectiveOwing to the development of modern industries, environmental water-pollution issues have become increasingly prominent. In industrial production, waste water containing heavy metals such as Pb and Cr is discharged into rivers and lakes, which threatens human health. Therefore, the development of highly sensitive detection technologies for harmful heavy metals in water is necessary. Laser-induced breakdown spectroscopy (LIBS) has been widely acknowledged for its advantages, such as the non-requirement for sample pretreatment, full elemental-analysis capability, and non-contact operation. It has been widely applied in fields such as environmental monitoring, alloy analysis, coal and metallurgy, biomedical research, and space exploration. However, owing to the effects of liquid splashing and the quenching effect of water molecules on atomic radiation in plasma, LIBS presents a lower sensitivity and stability in the direct analysis of aqueous samples. The accuracy of LIBS in analyzing aqueous solutions can be improved by converting liquid-phase samples into solid-phase samples. Compared with the direct LIBS analysis of liquid-phase samples, surface-enhanced LIBS (SELIBS) requires only the deposition of a minute amount of sample on the surface of a solid substrate (such as aluminum, magnesium, or silicon) and solvent evaporation. The interaction between the laser pulse and metal substrate can effectively enhance the sample signal strength, thereby improving the detection sensitivity of the elements in the liquid sample. In this study, a small high-repetition-rate microchip laser was used to process the substrate surface to obtain the microstructures prior to SELIBS. Periodic dot-array microstructures were fabricated on brass-substrate surfaces. The effect of the periodic surface microstructure on the plasma temperature and electron density was investigated via SELIBS. The effect of the microstructure on the spectral intensities of Cr and Pb in aqueous solutions was investigated via LIBS analysis.MethodsA microchip laser with a wavelength of 1064 nm, a pulse width of 750 ps, and a pulse repetition rate of 1 kHz was used to prepare periodic microstructures on the surface of a copper plate. The trigger of the microchip laser was synchronously controlled using a waveform generator. Different periodic surface microstructures were obtained by adjusting waveform-generator parameters. The horizontal and vertical distances of the lattice microstructures on the metal substrate surface were obtained by synchronously setting the movement speed of the two-dimensional platform and the cycle period of the waveform generator. The desired depth of the periodic microstructures was achieved by adjusting the cumulative number of laser pulses at the same position. An electro-optically Q-switched Nd∶YAG laser with a pulse repetition rate of 2 Hz and a wavelength of 1064 nm was used as excitation sources for SELIBS analysis. For the evaluation, a compact fiber-optic spectrometer coupled with an intensified charge-coupled device was used to record the spectra.Results and DiscussionsThe signal intensity of plasma emitted from the brass substrate with a periodic microstructure enhanced significantly. Compared with using a smooth brass substrate, the abovementioned substrate copper shows higher atomic emission intensities at 510.47, 515.20, and 521.68 nm by 8.07, 9.09, and 7.71 times, respectively (Fig. 4). The effect of the depth of the periodic microstructure on the atomic emission intensities was investigated experimentally. When the depth of the periodic microstructure increases continuously, the spectral signal-enhancement factor of the substrate-material element changes accordingly (Fig. 5). To clarify the signal-enhancement mechanism of SELIBS based on a periodic microstructure, the plasma-temperature variations in SELIBS with and without a periodic microstructure were determined based on Boltzmann plots using various copper atomic lines. The plasma temperatures are 8914 K and 9840 K for SELIBS without and with the periodic microstructure, respectively (Fig 7), which correspond to a temperature increase by 926 K. The average electron density in SELIBS without a microstructure and with a periodic microstructure was evaluated based on the Stark broadening of the selected atomic emission line. The results show that compared with the case using a smooth substrate, the electron density in SELIBS with a periodic microstructure is significantly higher (Fig. 8). Calibration curves of Cr and Pb in aqueous solutions were generated using SELIBS with an optimized periodic microstructure. By adopting Cr I 425.38 nm and Pb I 405.74 nm analytical lines, the detection limits of Cr and Pb in aqueous solution were determined to be 106.3 ng/mL and 49.2 ng/mL, respectively (Fig. 10).ConclusionsA low-cost and highly efficient method for the fabrication of periodic microstructures based on a microchip laser was proposed. This method is suitable for other applications that require the fabrication of micrometer-scale surface microstructures. The interaction surface area between the metal substrate and laser is significantly higher in SELIBS with a periodic microstructure. The signal enhancement is primarily due to an increase in the plasma temperature and the collision mechanism. The energy-utilization efficiency of ablation laser in SELIBS is higher than that in conventional SELIBS without a microstructure when the ablation laser is focused on the surface of the periodic-microstructure substrate. Owing to the periodic microstructure substrate, collisional processes during plasma interaction promote the ionization of species, thus affording significant signal enhancement. This technique significantly improves the signal intensity of SELIBS, as well as provides scientific significance for further improving the analytical sensitivity of SELIBS and achieving better analytical results. It is promising for sensitive and rapid elemental analyses under different water environments.
Jan. 20, 2025Vol. 52 Issue 2 0211001 (2025)
Shenzhan Hong, Lu Huang, Ning Wang, Hang Wang, Chi Zhong, Yikun Bu, and Zhengqian Luo
ObjectiveIn space environments, the performance and lifespan of active optical fibers are significantly compromised by high-energy particles and radiation rays primarily due to radiation-induced darkening (RD). Consequently, the capabilities of fiber lasers and amplifiers in space environments are undermined. This issue is generally attributed to radiation-induced impacts on the color centers within the active fibers. Numerous types of active irradiation suppression technologies are currently available for enhancing the performance of active optical fibers, and their radiation-resistant effects have been validated. The most commonly used passive irradiation suppression technique is shielding with metallic materials. Although effective, this approach is neither lightweight nor flexible, typically requiring significant mass and space, and cannot conform to the circumference of the fiber. Consequently, this study aimed to explore a lightweight, flexible, and directly wearable passive radiation-resistant film that can be applied to the circumference of optical fibers.MethodsThis study proposes a multilayer radiation-resistant composite film fabricated using advanced optical precision deposition techniques, boasting the advantages of being lightweight, flexible for wearable applications, and cost-effective. It can be directly applied to the circumference of optical fibers and employed in conjunction with other radiation protection methods for fibers, such as metal shielding and fiber doping, to provide point-to-point protection for fiber components that are more susceptible to radiation, thereby enhancing the overall radiation resistance of the optical fibers. This study employed electron beam evaporation combined with ion-assisted deposition technology to fabricate an Al+ITO+Kapton composite multilayer radiation-resistant film, the specific structure of which is shown in Fig. 1. After exposure to approximately 85 kGy of radiation in a laboratory setting, the Yb3+ doped optical fiber without radiation-resistant film (fiber A), along with three other groups of Yb3+ doped fibers (fibers B, C, and D) subjected to different protective measures, was tested and compared across various performance aspects. The grouping of the fiber samples into the four experimental groups is presented in Table 3. Fluorescence, loss, and laser tests were conducted to ascertain the efficacy of the radiation-resistant film in aiding the active fibers in withstanding radiation.Results and DiscussionsThe absorption spectra of the four groups of radiation-resistant optical fiber samples are shown in Fig. 3(a), with all fibers having a length of 1 m. All four groups of fibers exhibit strong absorption in the range of 890?1000 nm, which is due to the two characteristic absorption peaks of Yb3+-doped fibers at 915 nm and 975 nm. In the range 1000?1450 nm, fiber A showed the most substantial absorption, followed by fibers B and C, while fiber D had the least absorption. The radiation-induced attenuation (RIA) spectra before and after irradiation were calculated using equation (1), and the results are shown in Fig. 3(b). In the figure, it is evident that fiber A experiences the highest radiation dosage, resulting in a substantial increase in absorption loss of nearly 4 dB, compared to fiber D. Although fibers B and C also exhibit increased absorption losses, the increments are approximately 1.5 dB and 0.7 dB, respectively, which are markedly lower than those observed for fiber A. The findings reveal that the incorporation of a radiation-resistant coating notably mitigates radiation-induced absorption losses, significantly reinforcing the radiation resilience of active optical fibers. Consequently, this underscores the efficacy of the radiation-resistant coating in shielding the fibers against radiation. The emission spectra of the four groups of PM-YSF fibers, all with lengths of 1 m, are shown in Fig. 4. It can be observed that all four groups of fibers exhibit strong fluorescence emission at 1030 nm, which is due to the emission peak of Yb3+ at this wavelength; subsequently, as the wavelength shifts towards longer wavelengths, the intensity of the emission spectra gradually decreases. In terms of the pattern, compared to fiber D, fiber A exhibited a decrease in emission intensity by 3.5 dBm. For fibers B and C, the reductions were 2 dBm and 1.4 dBm, respectively. This indicates that the fibers with protective measures received significantly lower radiation doses than those without protection, further confirming the effectiveness of the radiation-resistant film in enhancing the radiation resistance of the active fibers. A continuous-wave, fully polarization-maintaining fiber laser with a central wavelength of 1064 nm was designed. The experimental setup is illustrated in Fig. 5. The output power of the fully polarization-maintaining 1064 nm laser using the four groups of active fiber samples as gain media is shown in Fig. 6. The slope efficiency of the control group, the laser with fiber D , was 7% with a laser oscillation threshold of 44.78 mW, whereas that of the laser with fiber A was only 1.8% with an oscillation threshold of 120.6 mW, indicating a significant decline. For the lasers with fibers B and C, however, their slope efficiencies are 4.5% and 4.6%, respectively, with oscillation thresholds of 65.2 mW and 58.4 mW. Compared to the unshielded bare fibers, these fibers showed a nearly 1.5-fold increase in slope efficiency and halving of the laser oscillation threshold power. This illustrates the outstanding protective capability of the radiation-resistant films when exposed to a radiation environment.ConclusionsThis study conducted comparative experiments on four groups of PM-YSF fiber samples with different protective treatments, evaluating their performance from three aspects: absorption spectra, emission spectra, and laser power curves, thereby preliminarily verifying the radiation resistance capability of the radiation-resistant film. The findings reveal that compared to unprotected fibers, the application of the radiation-resistant film on active fibers reduces radiation-induced attenuation (RIA) by 2.5 dB, enhances the fluorescence spectrum intensity by 1.5 dBm, and increases the slope efficiency of the laser by nearly 1.5 times, while reducing the oscillation threshold by approximately half, indicating that the radiation-resistant film effectively mitigates the radiation dose and its impact on active fibers. Adding a layer of heavy metal armor as secondary protection on top of the radiation-resistant film resulted in a slight improvement in the radiation resistance of the fiber. Thus, the multilayered radiation-resistant film developed in this study serves a primary protective role.In summary, this study proposes a flexible radiation-resistant film with a three-layer structure designed using optical thin-film preparation technology. Wrapping it around the surface of the active optical fibers can effectively enhance the radiation resistance of the active optical fibers. Unlike conventional large metal protective shells, this radiation-resistant film features excellent ductility and flexibility, and it is lightweight, which can cater to the miniaturization requirements of fiber lasers or amplifiers. Additionally, this radiation-resistant film can be used in conjunction with other radiation protection measures (such as the combination of radiation-resistant thin films and metallic materials utilized in this study) to provide point-to-point protection for core components, further enhancing the radiation resistance of optical fibers.
Jan. 16, 2025Vol. 52 Issue 2 0203101 (2025)
Jing Zhang, Guiping Liu, Xiuhua Fu, Zhaowen Lin, Yonggang Pan, Ben Wang, and Fei Yang
ObjectiveIn a laser guidance system, filter devices extract specific laser signals from targets or lasers, suppress interference from background light, control the energy transmitted by the laser signals, and protect the detectors from contamination or damage. Therefore, the performance of light-filter devices has an important impact on the hit rate and anti-interference ability of laser-guided missiles. In recent years, in-depth research has been conducted on the central wavelength, transmittance, and bandwidth of filter devices at home and abroad, significantly improving their spectral performance. However, there have been few reports on the precise control of the energy of transmitted filter devices with thin films deposition. Consequently, a 1064 nm energy attenuation narrow band filter device was developed according to the filter requirements of the laser guidance system.MethodsBased on the design theory of Fabry-Perot (F-P) filter films, Ta2O5 was selected as the high-refractive-index material, and SiO2 was selected as the low-refractive-index material. A narrowband filter film and broadband interference cut-off film were designed and prepared on both sides of the quartz substrate using electron beams and ion-assisted deposition techniques. Cr was selected as the material for energy attenuation. Subsequently, the refractive index and extinction coefficient values corresponding to Cr with different thicknesses were determined through numerous experiments. Cr films of different thicknesses were deposited on samples with similar initial transmittances, and the relationship between the Cr film thickness and transmittance of the narrow-band light filter device was obtained, thus realizing precise attenuation of the transmission energy of the narrow-band light filter device.Results and DiscussionsDuring the preparation of the narrowband filter films, because of the large error in controlling the thickness of the film layers using the quartz crystal method, the transmittance of the prepared narrowband filter films decreased [Fig. 8(a)]. Through inversion analysis, the error compensation coefficients of quartz crystal method for Ta2O5 and SiO2 were calculated as 1.15 and 1.21, respectively. After adjusting the error compensation coefficients, a narrowband filter film was prepared, and the final sample satisfied the design requirements (Fig. 9). When the transmission energy was the same, software analysis was used to deposit different metal films, among which Cr had the lowest reflectivity and the least impact on the receiving optical system (Fig. 7). Using an elliptical polarization instrument, the refractive index and extinction coefficient values corresponding to different thicknesses of Cr metal films were obtained (Fig. 10). The theoretical and actual transmittance values of Cr films with different thicknesses were deposited on narrowband filter devices with similar transmittance (Table 3), and the relationship between the actual transmittance and Cr film thickness was fitted (Fig. 12).ConclusionsAn energy attenuation narrowband filter device was developed for a laser guidance system. By adjusting the crystal control error coefficients, a high-transmittance narrowband filter with a transmittance of 99.034% at 1064 nm, an average cutoff depth of OD4, and a half-bandwidth of 8 nm was prepared. By depositing metal Cr films with different thicknesses on broadband cut-off films for energy attenuation, accurate control of the transmission energy of 1064 nm narrowband filter devices was achieved, reducing the decay from 99% to 10%?30%, with a control error of ±1%.
Jan. 20, 2025Vol. 52 Issue 2 0203102 (2025)
© Copyright 2018-2021 | Chinese Laser Press.
All Rights Reserved 沪ICP备15018463号-20