


Please enter the answer below before you can view the full text.

2024
Volume: 51 Issue 15
21 Article(s)

Weiye Song, Zhengkai Yao, Fuwang Wu, Kaixuan Hu, and Xianchun Jiang
SignificanceOptical coherence tomography (OCT) technology was proposed in 1991. Based on the principle of low-coherence light interference, OCT features high resolution and a high signal-to-noise ratio; it is also non-invasive, non-destructive, and capable of three-dimensional imaging. It enables the imaging of microstructures within biological tissues, with significant application potential in fields such as biology, medicine, and materials. Consequently, it stands as one of the focal points in modern optical imaging research.The resolution plays a crucial role in the assessment of OCT because it directly impacts the image quality, thereby influencing the accuracy of disease diagnosis and condition assessment by medical professionals. Therefore, the pursuit of high resolution has been one of the primary directions in the development of OCT technology. Vis-OCT, which utilizes visible light with shorter wavelengths for imaging, offers higher lateral and axial resolution, enabling a finer depiction of microstructures within biological tissues.In comparison to NIR-OCT, which is commonly used in hospitals, Vis-OCT not only provides higher image resolution but also yields images with higher contrast, thereby revealing more information about biological tissues. The high resolution and contrast of Vis-OCT make it promising for widespread applications in fields such as ophthalmology and dermatology. By providing doctors with more detailed and precise image information, it facilitates more accurate observations and diagnoses of pathological tissues. Additionally, Vis-OCT can quantify sO2 through spectral analysis, providing a powerful tool for assessing retinal blood circulation and oxygen metabolism. Lastly, because the wavelength of visible light falls within the sensing spectrum of the retina, there may be a more direct relationship between the structure and function of the retina that can be observed by Vis-OCT, making these advantages worthy of further research.In practical applications, researchers have already conducted studies using Vis-OCT for various diseases. They have validated its ability to diagnose diseases such as glaucoma, macular lesions, and diabetic retinopathy and have identified some early biomarkers of diseases. This facilitates early intervention and treatment by medical professionals, thus providing better treatment outcomes and vision protection for patients.This paper provides an overview of Vis-OCT, introducing its technical characteristics and current applications and discussing future development trends. This will allow readers to better understand its advantages in medical imaging and recognize its value and significance in medical practice.ProgressThis paper reviews the progress of Vis-OCT research in the areas of system structure optimization, functional imaging research, animal imaging research, and clinical applications.In terms of system structure and functional imaging research, the article discusses the advantages and disadvantages of spatial coupling and couplers, along with related work. Additionally, in spectral analyzer optimization, the introduction of prisms achieves K-domain linearization, reducing errors in data processing, and the use of dual spectrometers improves the signal-to-noise ratio of the system. Furthermore, modulating the reference light path doubles the total imaging depth range and corrects the retinal curvature of wide-field imaging. This article also introduces the principles of DOCT, OCTA, and sO2 detection.Regarding mouse retinal imaging, this article describes the use of Vis-OCT for sO2 detection in mouse retinas and the quantification of the mouse retinal oxygen metabolism rate. Additionally, this paper shows how researchers use Vis-OCT to observe the effects of prematurity on mouse retinal lesions, dexamethasone-induced high intraocular pressure, damage to RGC axon bundles, optic nerve transection, and aging on mouse retinas.In terms of clinical applications, the article reviews research related to the use of Vis-OCT for retinal diseases such as glaucoma, retinal occlusive disease, diabetic retinopathy, and sickle cell retinopathy. At the same time, the article compares Vis-OCT with NIR-OCT in human retinal imaging, demonstrating the advantages and disadvantages of Vis-OCT.Conclusions and ProspectsVis-OCT technology can achieve submicron-level retinal imaging resolution, which significantly improves image quality. Moreover, it quantifies sO2 through spectral analysis and, combined with blood flow measurements, provides a new means of evaluating retinal circulation and oxygen metabolism. The match between visible light and the retinal sensing spectrum allows Vis-OCT to more directly reflect the relationship between the retinal structure and function.However, Vis-OCT also has some limitations. Its comfort level is relatively low, which limits its clinical application. Additionally, noise from super-continuum spectral sources reduces its signal-to-noise ratio. Furthermore, Vis-OCT has a limited imaging depth, which makes it challenging to observe deep tissues.Nevertheless, the future of Vis-OCT is promising. The imaging speed and quality can be improved by optimizing the system structures and image algorithms, which will provide ophthalmologists with more accurate diagnostic criteria. After improving the technology and expanding the applications, Vis-OCT is expected to play a significant role in screening and diagnosing retinal diseases as well as evaluating their treatment outcomes.In conclusion, Vis-OCT exhibits significant value in retinal disease research and clinical practice because of its unique advantages. The ongoing technological advancements should lead to further innovations and breakthroughs in ophthalmology.
Jul. 16, 2024Vol. 51 Issue 15 1507101 (2024)
Siyu Zhou, Yunhe Luo, Yiqi Zeng, Yicheng Yang, Yongbo Yu, and Changfeng Wu
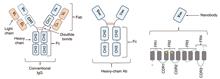
SignificanceAntibodies have potential for use in clinical diagnostics, therapeutics, and biomedical research. Since the approval of the first monoclonal antibody-associated drug by the United States Food and Drug Administration (FDA) in 1986, monoclonal antibodies have been considered the most promising targeted agents against diseases. Over the past four decades, an increasing number of monoclonal antibodies have been used in clinical settings and preclinical trials. Examples include daratumumab, which targets CD38 in multiple myeloma cells, and nivolumab, which reactivates T-cell recognition ability by inhibiting the PD-1/PD-L1 pathway and preventing cancer progression. However, large molecular monoclonal antibodies (molecular mass of ~150 kDa) have complex structures and physicochemical properties, which lead to in vivo limitations such as low tissue penetration, extended circulation, and slow clearance. In addition, high-price production and potential immunogenicity issues imped the development and application of monoclonal antibody-based imaging and therapeutic agents.A single domain antibody is a small antibody fragment first discovered in Camelidae, which can effectively recognize antigens of interest. Compared with conventional monoclonal antibodies, single domain antibodies exhibit superior properties, such as small size (~15 kDa), high affinity, high stability, low immunogenicity, and ease of tissue penetration, making them promising candidates for targeted imaging and drug delivery in research and clinical applications. This review systematically introduces progress in the research and application of single domain antibody-based probes in live-cell imaging, super-resolution imaging, in vivo fluorescence, and nuclear imaging. This review also discusses the future opportunities and challenges for single-domain antibodies in biomedicine.ProgressThe applications of single domain antibodies in cell imaging, including live-cell imaging and super-resolution imaging, were first introduced. Rothbauer et al. first investigated the construction of a chromobody in 2006 by fusing the gene sequences of a single domain antibody and a fluorescent protein, enabling its expression in live cells and binding to antigens of interest (Fig. 2). Subsequently, various chromobodies that target finer subcellular structures, such as organelle membrane actin, nuclear actin, and vimentin, have been developed. To improve the controllability and applicability of single domain antibodies in complex cellular environments, O'shea et al. developed a photocaged probe (Fig. 3). For super-resolution imaging, single-domain antibodies can be used to label subcellular structures with high densities and minimal linkage errors. The single domain antibody probes and labeling strategies for single molecule localization microscopy (SMLM), stochastic optical reconstruction microscopy (STORM), stimulated emission depletion microscopy (STED), and expansion microscopy (ExM) are summarized in the second section (Figs. 4 and 5). Jungmann et al. introduced a DNA barcoding method called resolution enhancement by sequential imaging (RESI), which improves the resolution of fluorescence microscopy to the Ångström scale using single domain antibodies (Fig. 6).In the third section, the bioimaging applications of single domain antibody probes are presented to demonstrate their advantages, including short circulation time, high affinity, deep tissue penetration, and rapid enrichment. Single domain antibodies conjugated with near-infrared fluorescent dyes have become effective for tumor imaging and image-guided surgery (Fig. 7). When combined with short half-life nuclides, such as 68Ga, 18F, and 64Cu, single domain antibody-based tracers demonstrate high specificity and low radiation risk in immunoPET and immunoSPECT imaging, which are better than the traditional 18F-FDG (Fig. 8).Conclusions and ProspectsThe advantages of single domain antibodies, including their small size, high stability, deep penetration, renal clearance, and low immunogenicity, are promising for biomedical applications. In cell imaging, single domain antibodies can be effectively modified using various tags, dyes, and adapters, making them versatile tools for live-cell and super-resolution imaging. At the organismal level, single domain antibodies exhibit a short circulation time, rapid clearance, and low risk of toxicity and immunogenicity, which facilitate real-time and highly specific in vivo imaging. Current preclinical data indicate that single domain antibody-associated probes have a tremendous translational potential. The first radiolabeled single domain antibody probe, 2Rs15d (HER2-targeting), labeled with either 68Ga or 131I, has entered clinical phase I trials.Numerous studies have been conducted on the design and screening of single domain antibodies that target various antigens. However, it is crucial to develop novel and effective biomarkers and screen for the corresponding high-specific single domain antibodies for the diagnosis and treatment of complex diseases, particularly heterogeneous tumors. The key to designing single domain antibody probes is exploring stable, universal, and controllable strategies for modification using dyes, chelators, and other labels. Because of the small size and limited active sites of single domain antibodies, the effects of conjugation sites, labeling methods, and properties of tags on single domain antibodies are significantly more pronounced than those on monoclonal antibodies. Although random labeling methods that rely on endogenous cysteine or lysine residues in proteins are simple and widely used, they may form heterogeneous products with variable functionalization ratios, and sometimes lead to a loss of targeting ability. Enzymes, including sortase-and microbial transglutaminase-mediated strategies and click chemistry, may be effective and promising approaches for constructing single domain antibody-based probes and their clinical translation. However, challenges remain regarding their application and improvement. In addition, advancements in chelators, isotopes, fluorescent dyes, imaging techniques, and other fields will continue to promote the development and translation of single domain antibody probes.
Aug. 10, 2024Vol. 51 Issue 15 1507102 (2024)
Junchao Fan, MiaoYunyun, XiuLi Bi, Bin Xiao, and Xiaoshuai Huang
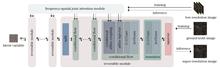
ObjectiveExisting deep learning-based methods for fluorescence image super-resolution can be broadly classified into two categories: those guided by peak signal-to-noise ratio (PSNR) and those guided by perceptual considerations. The former tends to produce excessively smoothed prediction results while the latter mitigates the over smoothing issue considerably; however, both categories overlook the ill-posed nature of the super-resolution task. This study proposes a fluorescence image super-resolution method based on flow models capable of reconstructing multiple realistic super-resolution images that align with the ill-posed nature of super-resolution tasks. Moreover, microscopy imaging is conducted in continuous time sequences naturally containing temporal information. However, current methods often focus solely on individual image frames for super-resolution reconstruction, completely disregarding the temporal information between adjacent frames. Additionally, structures in similar biological samples exhibit a certain degree of similarity, and fluorescence images collected possess internal self-similarity in the spatial domain. To fully leverage the temporal and spatial information present in fluorescence images, this study proposes a frequency- and spatial-domain joint attention module. This module aims to focus on features that significantly contribute to the prediction results, obtaining more accurate reconstruction outcomes.Similar to most supervised learning methods, our approach has a limitation in that it requires labeled paired image sets for training the network model. Generalization performance may significantly decline when applying the model to a test set with a distribution different from the training set. Acquiring labeled paired training data is not always feasible in practical applications. Therefore, future work may need to address the challenge of cross-dataset super-resolution reconstruction, considering optimization strategies and network improvements from a domain adaptation perspective.MethodsThis study introduces a flow-model-based multi-frame dual-domain attention flow network. Given a low-resolution image, the network learns the distribution of super-resolution images using flow models, enabling the reconstruction of multiple realistic super-resolution images to address the underdetermined nature of super-resolution tasks. Additionally, as the imaging process is typically continuous, the acquired raw data from a microscope has temporal relationships with adjacent frames. However, existing deep learning-based fluorescence image super-resolution methods often neglect the temporal priors present in multiple input frames over time. Moreover, biological sample structures exhibit internal self-similarity. Therefore, by constructing a frequency-domain and spatial-domain joint attention module, the network is guided to focus extensively on features that contribute significantly to the prediction results, further enhancing the network’s performance. The proposed flow-model-based multi-frame dual-domain attention flow network consists of a flow model and a frequency-domain and spatial-domain joint attention module. The flow model, composed of multiple reversible modules, facilitates a reversible mapping between the target and latent space distribution. The frequency-domain and spatial-domain joint attention module achieves conditional feature extraction and includes a set of frequency- and spatial-domain attention blocks. These blocks comprise Fourier channel attention blocks, spatial attention blocks, and convolutional layers, serving to extract temporal, spatial, and aggregated features from the fluorescence image, respectively. Furthermore, the study employs skip connections to enable feature reuse and prevent gradient vanishing.Results and DiscussionsThis study demonstrates the importance of temporal information by comparing the proposed method, a multi-frame dual-domain attention flow network (MDAFN), with a single-frame dual-domain attention flow network (SDAFN). Quantitative evaluation metrics include PSNR and learned perceptual image patch similarity (LPIPS). Experimental results indicate that the MDAFN outperforms the SDAFN, and the indexes of PSNR and LPIPS on the three data sets are shown in Table 1. Moreover, visually, the images reconstructed using the MDAFN exhibit improvement over those generated using the SDAFN (Figs. 7?9). Finally, a comparison between the proposed method and state-of-the-art super-resolution reconstruction methods is presented. The results indicate that when the standard deviation of hyperparameters is set to zero, the PSNR of the super-resolved images obtained using the proposed method is comparable or even superior to that obtained using other methods. For LPIPS, the proposed method outperforms other methods. When the standard deviation is greater than zero, the LPIPS obtained using the proposed method is further decreased across the three datasets (Table 2). The reconstructed results using the proposed method visually resemble the ground-truth images more closely. In contrast, other methods generate over-smoothed, signal-depleted, or artificially enhanced reconstructions with poorer subjective quality (Figs. 10?13).ConclusionsThis study proposes an MDAFN for high-quality super-resolution reconstruction of fluorescence images. Unlike conventional neural networks that directly learn deterministic mapping functions, our approach can predict various possible super-resolution images for a given low-resolution wide-field image, addressing the underdetermined nature of the one-to-many relationship in super-resolution tasks. Additionally, considering the high internal self-similarity of structures in similar live cell samples in both temporal and spatial dimensions of fluorescence images, we further introduce a frequency- and spatial-domain joint attention module based on multi-temporal input. This module aims to focus more on features contributing significantly to the prediction results, yielding more accurate predictions. Experimental results demonstrate that the proposed method outperforms other methods in terms of super-resolution image quality.
Aug. 10, 2024Vol. 51 Issue 15 1507103 (2024)
Hao He, Jun Li, Jinsong Zou, Shaoyun Yin, and Jinyu Wang
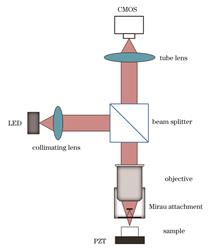
ObjectiveFull-field optical coherence tomography (FFOCT) is a contactless, high-resolution, real-time imaging method based on OCT technology. It utilizes the backscattering ability of the internal structure of the tissue to obtain a light signal with structural information about the tissue through the detector and then restores the real internal structure through a computer. With the introduction of the Linnik interferometer structure with two identical large numerical aperture microscope objectives into the FFOCT system, the imaging resolution of the system has been improved to the submicron level. Therefore, scholars have begun to conduct further research on aspects such as system effectiveness, stability, practicality, cost, and efficiency. Because the reference and sample arms use two identical microscope objectives, their alignment accuracy is at the micron level, which cannot meet the imaging conditions by the constraints of the mechanical structure. The presence of these two microscope objectives also increases the cost of the system. For different application scenarios, both objectives should be replaced and recalibrated simultaneously, which is a cumbersome process. In this study, we built an FFOCT system based on a Mirau interference structure, integrated the reference arm in the original structure into a self-made Mirau attachment, and assembled it between the objective lens of the sample arm and the sample. This makes the system more compact and stable and reduces costs. The microscope objective at different magnifications can be replaced according to requirements, and different media can be used for index matching.MethodsBased on the imaging principle of the FFOCT system, we first simulated the Mirau interference structure using the optical simulation software VirtualLab Fusion. In the preliminary verification stage, only the Mirau-attachment structure was designed; thus, the microscope objective was simplified to an ideal lens that satisfied the software parameters. The feasibility of the solution was verified through light-field tracing and imaging experiments on the test surfaces at different positions. Based on the parameters obtained from the simulation, we designed and processed the mechanical structure, which included two pieces of glass with reflective and beam-splitting functions as well as a structure for the adjustment and filling of the medium. The obtained structure was assembled into a system for imaging experiments, and a USAF standard-resolution target and plane mirror were imaged to measure the lateral and axial resolutions of the system, respectively. Using PCB, onions, and plant leaves as imaging objects, a four-step phase-shift method was employed as the solution method. The imaging results were used to verify the tomographic capabilities of the system.Results and DiscussionsThe feasibility of this principle is verified through simulations. The light-field tracing diagram conforms to the imaging principle, and the interference fringe pattern obtained by imaging the test surface at different positions is also in line with expectations (Fig. 2). To meet the actual conditions, we attached the reflector to a piece of glass with the same material and thickness as the beam splitter, adjusted the parameters, and performed simulations again. The results obtained still meet expectations (Fig. 3). A Mirau attachment was designed and fabricated (Fig. 4). Based on optical principles, the theoretical lateral and axial resolutions are calculated to be 1.73 and 7.56 μm, respectively. By imaging the USAF standard-resolution test target, the actual measured value of the lateral resolution is determined to be 2.19 μm (Fig. 5). An interference fringe intensity distribution diagram is obtained by imaging the plane mirror. Based on the resulting diagram, the actual measured value of the axial resolution is calculated to be 9.1 μm (Fig. 6). A certain position on the PCB contains two structures with different heights. The height difference is greater than the coherence length of the light source. When interference fringes appear on one side, no interference fringes appear on the other. Therefore, the calculated image contains only one side of the structural information, reflecting the tomographic capability of the system (Fig. 7). When imaging biological samples, their internal structures are restored. As the depth increases, the structural morphology changes and tomographic features are observed (Figs. 8?9).ConclusionsAn FFOCT system based on the Mirau interferometer is developed. This structure is more compact and stable than an FFOCT system based on a Linnik interferometer. The previous cross structure was changed to the current T-shaped structure, and the system complexity was reduced. The previously used FFOCT system uses two identical water-immersion objectives; however, this system requires only one microscope objective and does not require a water-immersion objective, which reduces system costs. Using a self-made Mirau interference objective structure, the parameters can be adjusted according to different requirements, and the microscope objective magnification and filling medium can be changed according to the imaging object. The tomographic capabilities of the system are verified by imaging abiotic and biological samples, and imaging with cell-level resolution is achieved. However, the resolution and imaging quality of the system are affected by the presence of environmental noise and noise generated by the operation of the system itself. For the four-step phase-shift method used in this system, mechanical vibrations cause a deviation between the actual phase shift and the set value, resulting in insufficient signal demodulation, thus retaining some interference fringes in the resulting image and affecting the imaging effect. Moreover, because the microscope objective is a commercial version and cannot be directly simplified into a lens, the self-made Mirau interference objective structure causes certain aberrations that affect the imaging quality and depth.
Jul. 29, 2024Vol. 51 Issue 15 1507104 (2024)
Yanzhao Hu, and Wanrong Gao
ObjectivePolarization-sensitive optical coherence tomography (PSOCT) can noninvasively obtain depth-resolved optical tomographic images of biological tissue samples. PSOCT is based on OCT with the additional function of detecting changes in the polarization states of light backscattered from different depths after polarized light is incident on the sample. It can provide polarization-related information about a sample, such as the Stokes parameter, Jones and Mueller matrix, phase delay, and depolarization, and it can distinguish structural specificities that OCT contrast cannot. PSOCT can be applied to detect changes in the function, structure, and activity of human tissues, which has major application prospects in medical diagnosis. In conventional PSOCT, the interference signals from the interferometer output are measured using horizontal and vertical polarization channels, thus requiring two separate spectrometer cameras. This increases the size of the system, adds additional costs, and requires strict triggering of hardware and software to avoid any time delay between the signal acquisition of the two cameras under the phase-based PSOCT algorithm. It also requires high response consistency of the charge-coupled device (CCD). Accordingly, PSOCT technology that utilizes a single spectrometer is currently under development. Some existing PSOCT systems based on a single camera can achieve only time-sharing or real-time detection. In this work, a PS and intensity dual-channel OCT measurement method is presented that can realize both time-sharing and real-time detection, thus providing a new method for laboratories in the analysis of the polarization information of samples.MethodsIn this study, a theoretical model of a PSOCT system with dual reference arms for a single camera is first established. Based on the traditional spectral-domain OCT (SDOCT) system, an additional reference arm is introduced, where the function of the two reference arms is to provide a pair of orthogonally polarized lights. A neutral filter is added to the other two reference arms to attenuate the light intensity and to ensure that the intensity of the light returned by the reference arm does not exceed the CCD acquisition threshold. A linear polarizer is added to the light source exit module, and four manual polarization controllers are added to the optical path. The system can realize the conversion between SDOCT and PSOCT imaging. A dual-reference arm detection system based on a single-mode fiber and polarization controller is then constructed. The quarter-wave plate in the existing SDOCT system is replaced with a single-mode fiber and polarization controller. The polarization module function is then expanded, and micron longitudinal high-resolution imaging performance is achieved using a broadband light source. The signals from the horizontal and vertical channels are collected using a single camera in real time. A Jones matrix model of the system is established, and the obtained tomography images are processed by combining the Stokes parameters. Relative reflectance, phase delay, and depolarization information are obtained to reconstruct the intensity, phase delay, and depolarization maps of the in vitro biological tissues, further verifying the feasibility of the proposed PS and intensity dual-channel OCT method as well as the imaging capabilities of the established system.Results and DiscussionsAn OCT system is established to realize the conversion of PSOCT and SDOCT as well as the functions of single-channel time-sharing detection and dual-channel real-time detection (Fig.1). A polarization characteristic model of the system is developed, and the calculation method for the sample polarization parameters is analyzed. Results show that a cross-sectional strength diagram of the sample tissue is obtained by processing the signals detected from the two orthogonal channels. The collected signal strength is then solved along the depth direction, and the defect polarization information is extracted using the Jones matrix and Stokes operation. The birefringence and depolarization parameters of the biological tissue as well as images of the polarization parameters of the biological tissue samples are obtained. The strength, phase delay, and depolarization of the sample beef (Fig.2) and chicken (Fig.4) tendons are reconstructed using time-sharing and real-time detection methods, demonstrating the feasibility of the system scheme and verifying its dual-channel detection capabilities.ConclusionsThe polarization characteristics of biological tissues can reveal the unique characteristics of biological tissues that cannot be described by isotropic properties, including tissue birefringence and depolarization. Depth-resolved isotropic intensity images and anisotropic polarization parameter images of biological tissue samples can be reconstructed noninvasively using a micron-resolution spectral domain PSOCT system. In this study, a dual-channel PSOCT system is proposed. The system is based on an optical fiber and single camera and has an imaging rate of 104 frame/s. An ultra-wideband light source, large numerical aperture objective lens, and common optical path structure are used to achieve horizontal and vertical resolutions at the micron level, ensuring the detection of tiny structures in tissue samples. The signals of the two channels can be collected at different moments such that horizontally and vertically polarized light can be incident on the same spectrometer at adjacent time to realize time-sharing detection. The interference signals of the two orthogonal channels can be collected simultaneously to achieve real-time detection. The images of the two channels are separated on both sides of the CCD, and the CCD can simultaneously contain the spectral interferograms formed by the horizontal and vertically polarized beam components. The proposed polarization imaging system provides a new method for the practical application of PSOCT and SDOCT in clinical diagnosis.
Jul. 24, 2024Vol. 51 Issue 15 1507105 (2024)
Zhaofei Sun, Jinghu Yu, Xingfei Zhu, Yu Lu, Bufan Zhang, and Qimeng Wang
ObjectiveOwing to the increasing prevalence of oral diseases, the societal demand for oral medical diagnosis has augmented steadily. This has increased the workload for oral health professionals, thus imposing higher requirements on their expertise and diagnostic efficiency. The interpretation of oral panoramic films is crucial in evaluating the oral health of patients. However, professional dentists are scarce in China, and a large number of film readings can take up too much of the doctor’s diagnostic time. The advent of artificial intelligence technology has expanded its application in the medical field, particularly in medical image analysis, and has yielded favorable results. Currently, most studies focus on individual tooth diseases. However, patients typically present multiple oral lesions simultaneously, including dental caries, apical periodontitis, furcation involvement, and impacted teeth. Owing to the complexity of these diseases, the existing technologies cannot satisfy actual clinical requirements. This study aims to leverage deep learning to recognize image features by employing a deep-learning network model to promptly and accurately identify diseased areas in oral panoramic films. The goal is to provide comprehensive results regarding conditions such as caries, periodontal disease, impacted teeth, and missing teeth. This approach aims to facilitate doctors in promptly and accurately diagnosing conditions, thereby alleviating diagnostic pressure stemming from inadequate medical resources.MethodsIn this study, we propose an efficient disease-recognition network named YOLO-Teeth (You only look once-teeth), which is based on YOLOv5s, to identify caries, impacted teeth, periapical periodontitis, and bifurcated root lesions. To enhance the feature-extraction capability of the backbone network, the Triplet attention mechanism is introduced such that the network recognizes the symptoms more accurately. A BiFPN module is used in the neck region to achieve a complete integration of deep and shallow features, thus ensuring that the network can process complex information in the panorama more effectively. The CIoU loss function is replaced by the MPDIoU loss function to improve the positioning accuracy of the network.Results and DiscussionsBased on the data presented in Table 1 and Fig. 6, the Triplet attentional-mechanism module outperforms the other 5 attentional mechanisms when the dimensionality reduction method is used in the oral disease recognition model. YOLOv5s, which employs the Triplet attention mechanism, demonstrates the most stable detection performance across various disease targets, with minimal fluctuations in the recognition performance of four diseases. Additionally, the accuracy rate (P), recall rate (R), and mean average precision (PmAP) of the model increase to 79.9%, 79.6%, and 85.9%, respectively, thus demonstrating the best comprehensive evaluation effect. Table 2 shows that, compared with the YOLOv5s network, YOLO-Teeth shows higher values in terms of the P, R, and PmAP by 5.0%, 3.2%, and 4.1%, respectively. Furthermore, YOLO-Teeth exhibits clear advantages over other mainstream detection networks, as shown in Table 3.ConclusionsThe YOLO-Teeth network proposed in this study is an efficient disease-recognition network based on YOLOv5s. Its feature-extraction capability is enhanced by introducing the Triplet attention module, whereas the integration of deep and shallow feature layers is improved using the BiFPN module. The CIoU loss function is replaced by the MPDIoU loss function, thereby enhancing the accuracy of disease-location identification. Ablation and comparison experiments are conducted using an oral panoramic-disease dataset. Experimental results show that compared with the YOLOv5s network, YOLO-Teeth shows higher values in terms of the P, R, and PmAP by 5.0%, 3.2%, and 4.1%, respectively. YOLO-Teeth is clearly advantageous compared with other mainstream detection networks. Therefore, YOLO-Teeth is suitable for disease recognition in oral panoramic films. The current research disparity in obtaining comprehensive disease-recognition results is addressed in this study. The findings obtained enable doctors to diagnose diseases promptly and accurately, thereby alleviating diagnostic pressure.
Aug. 10, 2024Vol. 51 Issue 15 1507106 (2024)
Zhenzhen Wan, Yuwei Liu, Ning Shi, Haocheng Li, and Fang Liu
ObjectiveNeuroblastoma (NB) is a type of peripheral neuroblastic tumor commonly found in children and characterized by obvious heterogeneity in biological behavior and rapid development. Determining the differentiation type is helpful in assessing the prognosis of neuroblastoma for making early judgments regarding postoperative treatment options. Whole-slide images (WSIs) of the NB have ultrahigh resolution and contain rich information, facilitating clinical interpretation. However, early diagnosis is time-consuming and poses significant challenges. Considering the complex cellular environment and heterogeneity of NB, this study proposes a novel network, CSA-U-Net, for cell segmentation and classification of NB WSI. Additionally, a cross-pseudo-supervised (CPS) approach, combining different proportions of labeled and unlabeled data, is used for training, which improves the robustness and generalization ability of the model, thereby assisting pathologists in clinical diagnosis, reducing their workload, and decreasing the misdiagnosis rate.MethodsTo address the cell-level data labeling problem, this study adopt a deep learning method based on CPS, fully utilizing the distributional characteristics of unlabeled data and combining a small amount of labeled data, to improve the model’s generalization ability by having the two branches supervise each other. To address the complex cellular environment and heterogeneity of NB, channel and spatial attention modules are added to the bottleneck layer of U-Net network. The proposed novel network, CSA-U-Net, is served as the base network for the CPS model, effectively improving model accuracy. Finally, the K-means algorithm is used to classify and count poorly differentiated and differentiated NB cells in the pathology slide images. The percentage of differentiated NB to the total number of tumor cells is calculated, to assist pathologists in determining histopathological typing.Results and DiscussionsThe CPS approach for NB WSI segmentation is shown in Fig. 1, with CSA-U-Net as the underlying network for the two branches (Fig. 5). The CSA-U-Net network was compared with U-Net, DeepLabv3+, PSPNet, HrNet, SA-U-Net, HoVer-Net, and MEDIAR. The results showed that the CSA-U-Net outperforms the other methods in all indicators. The F1 score was 79.05% in poorly differentiated cells and 62.21% in differentiated cells, and the accuracy was 96.78%, which is an improvement compared with that of the traditional U-Net (Table 1). In the prediction result graph, the prediction results of CSA-U-Net exhibit more accuracy, clearer boundaries, and less noise in the image, relative to other networks. A lower error rate is observed in the regions prone to erroneous segmentation (Fig. 8). Next, the performance difference of the CPS method with CSA-U-Net as the base network, was explored for labeled to unlabeled data ratios of 1∶1, 1∶2, 1∶3, and 1∶4. The results show that the segmentation accuracy of the model gradually increases with an increase in the amount of unlabeled data, and the F1 score of the model improves faster before the ratio of labeled to unlabeled data reaches 1∶3. After the ratio reaches 1∶4, the model enhancement is slower, and the speed of accuracy enhancement decreases significantly (Table 2). Subsequently, the CPS method was compared with other semi-supervised methods, at a 1∶3 ratio of labeled to unlabeled data. The CPS method showed the best detection performance, with F1 score of 80.99% in poorly differentiated cells, 65.40% in differentiated cells, and 97.99% accuracy (Table 3). Finally, the different types of cells in the prediction results were counted using the k-means method and compared with the gold standard of physicians (Fig. 9). The average accuracy of the counting results of poorly differentiated and differentiated NB cells was 94.00% and 89.89%, respectively (Table 4). This result indicates that the method in this study excels in the counting accuracy of poorly differentiated and differentiated cells and operates stably in images of any size, further validating the reliability of the method.ConclusionsTo address the problem of large amounts of cellular data and heavy labeling in NB images, this study adopted a CPS approach for model training. By introducing unlabeled data during training, the model can better capture the features of poorly differentiated and differentiated cells, thereby more accurately extracting and categorizing these cells from tissue backgrounds and displaying better adaptation to the variability and complexity of different samples. The CPS approach ensures the consistency of the two branches in terms of network structure while making them differ in parameter space through different initializations and independent training, which drives the model to learn a more robust and comprehensive feature representation. Meanwhile, for the features of NB pathology slide images, this study proposes a CSA-U-Net network model, incorporating an attention mechanism based on the original U-Net network, which further improves the accuracies of the segmentation and classification results. This study is based on the CSA-U-Net network and effectively integrates labeled and unlabeled data using a CPS semi-supervised model. The experimental results show that the CSA-U-Net network exhibits better performance on the NB dataset than existing control methods, with the segmentation accuracy of the model gradually improving as the amount of unlabeled data increases, which further validates the effectiveness of the CPS method. Finally, the K-means method was used to count the different types of cells in the model prediction results for pathological staging. The method proposed in this study effectively reduced the workload of pathologists, improved diagnostic efficiency, and is of great significance in determining the prognosis of NB.
Aug. 10, 2024Vol. 51 Issue 15 1507107 (2024)
Chuanwei Mao, Shanshan Yang, Xiao Liang, Ling Wang, and Ming en Xu
ObjectiveThree-dimensional (3D) tumor organoids, serving as in vitro models that replicate the critical structural and functional features of organs and tumor tissues, have demonstrated their unique value in disease modeling, personalized medicine, and drug screening. Patient-derived organoids (PDOs) not only recapitulate the morphological characteristics and physiological functions of their original tissues but also maintain the genetic and heterogeneity of tumors, rendering them invaluable resources for cancer research and treatment. However, current methods for analyzing organoid growth and drug effects have limitations, particularly in the absence of 3D high-throughput and label-free monitoring tools, hampering the more effective assessment of organoid growth and drug actions. To address this challenge, this study is dedicated to developing a comprehensive evaluation method based on optical coherence tomography (OCT) and machine learning algorithms. The aim is to establish a novel, non-invasive, label-free tool for the morphological characterization of organoids, enabling longitudinal evaluation of their responses to drug treatments. This approach holds significant potential for the application of PDOs in personalized cancer therapy, particularly for intrahepatic cholangiocarcinoma (iCCA), for which treatment options are limited.MethodsIn this study, we propose a method that combines OCT imaging with machine learning to perform longitudinal, accurate, label-free, and parallel morphological characterization of a large number of individual organoids within organoid clusters. Through 3D OCT imaging and organoid segmentation technology, we achieved 3D imaging and morphological analysis of individual organoids, including parameters such as organoid volume, organoid surface area, and organoid cavity volume. Subsequently, based on undersampling, we conducted a cluster analysis on multiple organoids within the organoid clusters to obtain statistical information on multi-dimensional morphological parameters for different categories. Feature selection and principal component analysis (PCA) were then applied to construct a comprehensive evaluation scoring function that combines the factor scores of each principal component and weights according to their variance contribution rates. Furthermore, we characterized the relative growth value of organoid clusters by calculating the difference in the comprehensive evaluation scores of the growth levels between two time points. Alternatively, the growth rate of the organoid clusters was represented by the slope of linear fitting based on the comprehensive evaluation scores from multiple time points. Ultimately, we validated the effectiveness of the comprehensive evaluation model of the growth levels based on the organoid clusters and PCA using adenosine triphosphate (ATP) testing results.Results and DiscussionsOur study results highlight the significant advantages of OCT imaging and machine learning in characterizing organoid growth and drug responses. A notable correlation is observed between organoid morphological changes and drug treatments, such as the transition of cystic organoids to solid organoids under the influence of medication (Fig. 3). The comprehensive evaluation model that we constructed shows an 82.9% consistency with traditional ATP biochemistry testing, which is a widely recognized indicator of cellular activity and proliferation (Table 5). More importantly, the correlation between the relative growth values derived from our comprehensive evaluation model and ATP measurements reaches an impressive 90.4%. This high degree of consistency confirms that our model can serve as a reliable proxy for assessing organoid growth and drug sensitivity. Additionally, the study results underscore the potential of our method to reveal morphological changes in organoids, which may be significant indicators of drug response and may provide new insights into the complexity of tumor-drug interactions.ConclusionsThis study marks significant progress in the field of organoid research and its implications for cancer treatment. By integrating OCT with machine learning, we have developed a robust and comprehensive evaluation model that is capable of accurately assessing organoid growth levels and responses to drugs. This method stands poised to revolutionize traditional approaches to drug efficacy screening and sensitivity testing, particularly for PDOs. The high consistency observed between our evaluation model and traditional ATP testing underscores its potential as a reliable and non-invasive tool in cancer research. As we transition into the era of personalized medicine, the precise measurement and prediction of individual organoid drug responses are becoming increasingly crucial. The methodology outlined in this study not only reveals the morphological changes of organoids under the influence of drugs but also lays the groundwork for a new technological platform for cancer drug screening and clinical drug sensitivity testing based on PDOs. Its aim is twofold: to deepen our understanding of tumor biology and to advance the development of more precise and effective cancer treatment strategies.
Jun. 28, 2024Vol. 51 Issue 15 1507108 (2024)
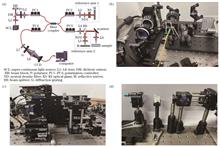
Kexuan Miao, Tao Hu, Qingqian Guo, Xiaoyu Feng, Yin Zhang, Yan Chang, and Xiaodong Yang
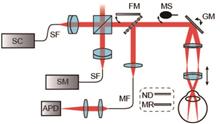
ObjectiveWith advancements in quantum manipulation and optoelectronic detection technologies, the atomic magnetometer, a novel quantum extremely-weak magnetic sensor, has experienced rapid development. Operating in the spin exchange relaxation free (SERF) state, atomic magnetometers offer numerous advantages, including non-cryogenic operation, compact structure, low maintenance costs, and high sensitivity, making them widely applicable in various fields. However, the phenomenon of optical frequency shift, induced by off-resonant circularly polarized pumping light, critically affects the orthogonality of measurement and output response in SERF atomic magnetometers. This study proposes a method for suppressing optical frequency shift based on the analysis of the non-sensitive axis response using a self-made compact single-beam SERF 87Rb atomic magnetometer. The curve of optical frequency shift, combined with the curve of light absorption, is precisely plotted and analyzed to determine the central resonant frequency of the SERF atomic magnetometer. The analysis indicates that employing this suppression method significantly reduces coupling crosstalk between the measurement axes of the magnetometer, thereby enhancing the orthogonality and output response of the sensitive axis. Experimental results validate the effectiveness of this suppression method. Further comparison reveals that the performance of the self-made compact SERF atomic magnetometer is enhanced by suppressing optical frequency shift, resulting in a sensitivity of 13 fT/Hz within a bandwidth of 140 Hz and a dynamic range of approximately ±3 nT.MethodsThe optical frequency shift direction is regarded as the photon spin direction, which is equivalent to the existence of an equivalent virtual magnetic field in the direction of the pumping light (x-axis). Due to this fictitious magnetic field, the sensitive axis (z-axis) of the SERF atomic magnetometer reacts to signals from the non-sensitive axis (y-axis). Applying a weak oscillating magnetic field at 40 Hz to the y-axis and a direct current compensation magnetic field to the x-axis reveals a trend where the response of the y-axis varies with the compensation magnetic field along the x-axis. When the response of the y-axis reaches its minimum value, it indicates completion of compensation for the fictitious magnetic field.Results and DiscussionsAs a result of the suppression method, the response of the 40 Hz signal from the y-axis notably decreases (Fig.2) after compensating for the magnetic field along the x-axis. The variation curve of the compensation magnetic field applied along the x-axis with the laser frequency (Fig.3) indicates that the magnetic field along the x-axis mainly consists of the fictitious magnetic field of optical frequency shift due to the constant residual magnetic field. After analyzing and compensating for the residual magnetic field along the x-axis, approximately 0.2 nT, based on the principle of optical frequency shift, the optical frequency shift curve [Fig.4(a)] is plotted, confirming its existence. Coupled with the light absorption curve [Fig.4(b)], the resonant frequency of 87Rb atoms is determined to be 377109.23 GHz. By optical frequency shift suppression, the measured coupling coefficient is about 4.5%, which can be used to evaluate more accurately the orthogonality between the measured axes and the response of the sensitive axis(Fig.5). With potential coupling crosstalk between the y and z axes accurately eliminated, the response of the z-axis significantly improves after optical frequency shift suppression (Fig.6). As a result of this operation, the self-made compact fiber-coupled SERF atomic magnetometer achieves high sensitivity of 13 fT/Hz within a -3 dB bandwidth of 140 Hz, and its dynamic range is approximately ±3 nT.ConclusionsThis study proposes a method for suppressing optical frequency shift based on analyzing the response of the non-sensitive axis using a self-made single-beam compact SERF Rb atomic magnetometer. By utilizing the proposed suppression method, the phenomenon of optical frequency shift and the existence of its equivalent fictitious magnetic field are verified. The central resonant frequency of the SERF atomic magnetometer is determined from the plotted curves of optical frequency shift and light absorption. Moreover, suppressing optical frequency shift significantly enhances the orthogonality between measurement axes, reduces crosstalk, and improves the response of the sensitive axis of the SERF atomic magnetometer, thus demonstrating the efficacy of the suppression method. The study results indicate that after suppressing optical frequency shift, the bandwidth, sensitivity, dynamic range, and other performance indicators of the self-made SERF atomic magnetometer improve. Its sensitivity can maintain a level of 13 fT/Hz within a bandwidth of 140 Hz, with a dynamic range of approximately ±3 nT.
Aug. 10, 2024Vol. 51 Issue 15 1507401 (2024)
Mo Yang, Shangjun Lin, Jie Chen, and Fangrong Hu
ObjectiveThe early and accurate diagnosis of colorectal cancer is difficult to perform owing to its long incubation period and slow development. MicroRNA (miRNA) in exosomes is a non-coding RNA containing 18?22 nucleotides that participate in transcriptional inhibition and post-transcriptional regulation. Thus, it is closely related to the proliferation and migration of tumor cells. Therefore, colorectal cancer can be diagnosed early by detecting the concentration of miRNA in extracellular vesicles.MethodsWe propose a highly sensitive method for detecting miRNA-92a concentrations using terahertz metasurface sensors as detection elements and a mixed-chain reaction (HCR) signal-amplification strategy. In our experiment, we first modified nanogold and a capture probe H0 on a metasurface sensor. Next, we deposited tested miRNAs onto the sensor. Subsequently, we deposited hybrid chains H1 and H2. Finally, we washed uncaptured miRNAs and hybrid chains using PBS buffer.Results and DiscussionsIn this study, a method for detecting the miRNA-92a biomarker in colorectal cancer is devised and verified. This method utilizes the capture probe H0 to bind AuNPs and modify them on a terahertz metasurface sensor. As H0 is designed for miRNA-92a, the modified sensor exhibits good specificity for miRNA-92a. As shown in Figures 7 and 8, the sensor surface is modified using hybrid chains to trigger the HCR reaction, thus forming a DNA long-chain structure and causing a significant shift in the resonant frequency of the sensor.ConclusionsThe experimental results show that the shift in the resonant frequency of the metasurface sensor correlates linearly with the miRNA-92a concentration, and that the maximum detection sensitivity achieved is 6.26 GHz/lgCmiRNA-92a.This method offers the advantages of rapid detection, low detection limit, and high sensitivity, thus rendering it suitable for the rapid detection of cancer-related extracellular vesicle concentrations and the early diagnosis of diseases.
Jul. 16, 2024Vol. 51 Issue 15 1507402 (2024)
Yinzheng Zhang, Hongjiang Liu, Runlin Zhu, Yifei Liu, and Fuxing Gu
ObjectiveIn the microscopic world, laser trapping is an effective method for the precise manipulation of micro-/nano-objects. Conventional optical tweezers are based on the principle of photon momentum exchange, which generates optical forces on the order of piconewtons (~10-12 N). However, overcoming the motion resistance of micro-/nano-objects at solid interfaces is challenging as it typically requires forces on the order of micronewtons (~10-6 N). Owing to their limitations, conventional optical tweezers are typically used in fluid environments, such as vacuum/air and liquids. Trapping and manipulating objects on solid interfaces can be challenging. Scholars have attempted to actuate micro-/nano-objects using pulsed lasers based on the principle of surface elastic waves to manipulate objects in direct adsorption contact with dry solid surfaces (solid-gas interfaces). However, this technique has yet to result in the stable trapping of objects. For techniques that do not offer trapping, a random misalignment between an object’s center of mass and the spot center introduces uncertainty in the direction of motion. This uncertainty hinders the precise, continuous, and arbitrary control of the object’s motion. Photothermal-Shock tweezers enable the laser trapping and manipulation of metallic nanomaterials on dry solid interfaces via the photothermal shock effect. Hence, their application is wide ranging. Additionally, the utilization and maintenance of laser-trapping methods typically necessitate the use of intricate equipment and specialized debugging techniques, which imposes numerous limitations on the operating environment and the personnel operating the equipment. This goal of this study is to design a micro-/nano-object control system based on deep learning. The system will enable the high-precision laser trapping and intelligent motion control of objects at dry solid interfaces via a photothermal-shock tweezer platform.MethodsThis paper presents a micro-/nano-object control system comprising three components: a photothermal-shock tweezer platform, an integrated control module, and an image-feedback module. The composition of the control module and the method of operating the photothermal-shock tweezer platform, including the hardware-structure construction and the corresponding control program design, are analyzed. The resolution and control range of the control module are analyzed via calculation and testing. The image-feedback module of the system is designed to detect the position of micro-/nano-objects in microscopic images and to provide dynamic feedback. The image-feedback module uses the YOLOv8 model for object detection and the OpenCV algorithm for center-of-mass localization. The models mentioned above are trained using a customized dataset created from microscopic images. Subsequently, they are tested on various sample images, and the detection resolution and error are analyzed. Finally, an experimental setup is constructed, as shown in Fig. 1, and motion-control experiments are conducted on multiple samples to evaluate the overall system performance.Results and DiscussionsThe trained YOLOv8 model and OpenCV algorithm are used by the image-feedback module to locate the center of mass in various types of microscopically acquired images (Fig. 5). The average detection error of the module is 116.1 nm. Motion-control experiments are conducted using the overall system. In the experiments, Pd nanosheets measuring approximately 10 μm are used, and a transparent silicon-dioxide sheet is used as the substrate. The system controls the laser to trap the nanosheet sample and actuate it along a predetermined path (Fig. 7). The average control error of the spot is 71.8 nm, whereas that of the sample is 108.9 nm. The data shown in Table 1 indicate that the control system successfully realizes the nanoscale closed-loop control of micro-/nano-objects on dry solid interfaces with a high degree of control freedom and a small control error. Additionally, the sample is tested at varying speeds (Fig. 8), and the system’s control errors at different speeds are obtained experimentally (Table. 2). As the sample’s movement speed increases, the control accuracy of the system decreases. If the sample propagates extremely rapidly owing to the system setting, then it will not satisfy the response time required for the laser spot to re-trap the sample. Consequently, the sample will be outside the trapping range of the laser spot, thus causing the system to lose control of the sample. Within certain limits, the rate at which the sample is re-trapped can be increased by increasing the pulse frequency of the laser (Fig. 9). Thus, the micro-/nano-objects can be guaranteed to remain in the trap at higher laser-spot motion speeds. In addition, the use of higher-quality laser spots, flat-surface substrates, and smaller nanosheets allows objects to be trapped more rapidly and stably. For the control system designed in this study, the samples can be stabilized via numerous experimental trials when the system is specified to propagate at a speed of 5 μm/s or less.ConclusionsA control system for micro-/nano-objects is proposed in this study. Combining this system with image feedback based on deep learning, high-precision laser trapping and the intelligent control of micro-/nano-objects on dry solid interfaces are realized by integrating the control of a photothermal-shock tweezer experimental platform. The system can realize the laser trapping and path control of objects based on the parameter input as well as identify and locate objects in microscopic images via the YOLOv8 and OpenCV algorithms. This method provides dynamic feedback regarding the trapping state of the system, thus enabling the intelligent control of objects. Additionally, the modularized design of the system and the gesture-control method endow the system with a certain level of compatibility and flexibility that facilitates the expansion of functions in different application scenarios as well as the operation and use of personnel in different fields.
Jul. 23, 2024Vol. 51 Issue 15 1507403 (2024)
Zhuanping Qin, Xinlin Liu, Guangda Lu, Wei Zhang, Dongyuan Liu, and Feng Gao
ObjectiveWith the vast expansion and increasing demand for the application domain of brain-computer interface (BCI) technology, stringent requirements have been imposed for the precision, stability, and convenience of the instruments and algorithms employed in implementing BCI technology. The adoption of BCI based on functional near-infrared spectroscopy (fNIRS) has successfully attained equilibrium among assorted factors such as acquisition modality, signal efficacy, deployment complexity, and resilience to interference, thereby making it a pivotal component of BCI research. In this investigation, portable fNIRS devices are used to achieve highly precise motion decision recognition within a single cycle, as indicated in the display of classification outcomes. The results of this study serve as a pivotal resource, offering invaluable tools and methodological references for the pragmatic application of BCI in motion decision recognition.MethodsNeural activation data are acquired from a cohort of three individuals during motion execution, and an optimization strategy based on statistical parameter attributes is subsequently devised. This study aims to achieve instantaneous classification of distinct motion tasks encompassed within a single cycle. Primarily, the acquired measurement data are carefully refined using sophisticated algorithms such as cubic spline interpolation and fusion filtering techniques such as Savitzky Golay. These methodologies effectively identify and rectify any undesired effects caused by movement-related artifacts. Subsequently, the optimized statistical attributes pertaining to brain activation are input into a classification model, to categorize precisely, three distinct motion decisions: the grasping movement of the left and right hands, finger tapping of the left and right hands, and the resting state.Results and DiscussionsThe accuracy (A), precision (P), recall (R), and F1-score (F1) are employed as performance evaluation metrics for model training. In contrast to the direct T-test optimization, the model trained using the statistically optimized feature set displays enhanced R and elevated A. Notably, finger-tapping movements exhibit superior discernibility compared with grasping movements. Specifically, the research findings indicate that task groups situated farther from the baseline exhibit higher distinguishability, with tapping tasks demonstrating greater classification sensitivity towards right-handedness.ConclusionsThis work utilizes portable fNIRS devices to acquire neural activation data during various motor execution paradigms. By employing advanced statistical optimization algorithms, significant combinations of features were derived to effectively classify three distinct action modes: bilateral hand-grasping movements, bilateral hand-finger tapping, and the resting state. More specifically, this study develops an interactive fNIRS-based BCI analysis interface by employing the aforementioned analytical framework, enabling the real-time classification of online single-cycle tasks. By harnessing the widespread applicability of fNIRS technology in daily settings, this study offers a valuable methodological and practical toolkit for research and application of fNIRS-BCI in motion decision recognition.
Aug. 10, 2024Vol. 51 Issue 15 1507301 (2024)
Jie Zhang, Yonghui Pan, Chunxu He, Yuan Wang, Xiaofei Miao, Hui Zhao, Quli Fan, and Wenbo Hu
SignificancePhotodynamic therapy (PDT) is a clinically approved novel treatment modality with the advantages of non-invasive characteristics, excellent spatiotemporal precision, and negligible multidrug resistance. The cornerstone of PDT is the use of a photosensitizer that generates cytotoxic reactive oxygen species (ROS) upon activation by the appropriate light to kill tumor cells. Photosensitizers are classified based on the ROS they produce—Type I photosensitizers generate oxygen radicals, whereas Type II photosensitizers yield singlet oxygen. The efficacy of Type II PDT is notably constrained by its reliance on molecular oxygen, which limits the treatment of hypoxic tumors. In contrast, Type I PDT exhibits a significant advantage under hypoxic conditions because it can effectively produce oxygen radicals even in hypoxic environments, thereby holding considerable promise for the treatment of hypoxic tumors. However, the development of Type I PDT has been hindered by the scarcity of Type I organic photosensitizers and the absence of reliable design strategies. Therefore, addressing these challenges is crucial for the advancement of Type I PDT. The development of new Type I photosensitizers, understanding their structure‒property relationships, and overcoming the challenges in designing these molecules are pivotal steps toward realizing their potential in clinical settings. This review comprehensively summarizes the progress in existing Type I organic photosensitizers for PDT, along with an exhaustive analysis of the structure‒property relationships and discussion of the ongoing challenges in this field. We hope that the knowledge and insights presented in this review will serve as a catalyst for further innovation in the field, ultimately contributing to the advancement of Type I organic photosensitizers in clinical settings.ProgressType I photosensitizers are particularly promising due to their inherent ability to generate ROS, such as superoxide anion (O2-•) and hydroxyl radicals (·OH), without substantial reliance on oxygen. Organic photosensitizers are preferred over their inorganic counterparts for clinical use because of their good biosafety and tunable optical properties. Therefore, recent efforts in PDT have predominantly focused on the development of Type I organic photosensitizers. The spectrum of available Type I organic photosensitizers is broad, encompassing a variety of classes, including porphyrins, phenothiazine derivatives, BODIPYs, naphthalene imine derivatives, fluorescein derivatives, aggregation-induced emission (AIE) materials, and secondary near-infrared (NIR-II) materials. Despite this diversity, the availability of effective Type I organic photosensitizers remains limited, highlighting the critical need for more focused research and development in this area. Several seminal examples that have catalyzed the development of Type I organic photosensitizers have been emphasized. For example, porphyrin-based photosensitizers, such as verteporfin and 5-aminolevulinic acid, have been approved by the US Food and Drug Administration; however, they predominantly function as Type II photosensitizers. Notably, these Type II porphyrin photosensitizers can be transformed into Type I photosensitizers via biotinylation. Biotin acts as an electron-rich substrate to promote electron uptake and subsequently enhance O2-• production efficiency. This transformation represents an innovative strategy for repurposing and augmenting the efficacy of existing photosensitizers. Further research has revealed that the incorporation of side chains containing electron-donating atoms into porphyrin structures can achieve a transition between Type I/II, exhibiting noteworthy Type I PDT efficiency. Interestingly, analogous results were observed for AIE-type photosensitizers synthesized through a cationic approach and supramolecular photosensitizers constructed through a host-guest strategy. A similar feature in these systems is electron redistribution, which promotes electron dissociation, thereby enhancing ISC efficiency and fostering the Type I mechanism. Additionally, rational design on α, β-linked BODIPY has been shown to prolong the lifetime of the triplet state and lower its energy level, thereby diminishing the Type II process and enhancing O2-• production. Similarly, NIR-II materials with inherently low triplet energy levels exhibit enormous potential for Type I processes. As anticipated, optimizing the triplet energy levels in NIR-II materials, such as by adjusting the chalcogenide elements, fosters the preferential generation of Type I ROS by inhibiting Type II progress. In addition, the modification on phenothiazine derivatives creates O2-• generators with precise targeting abilities, yielding more pronounced antitumor efficiency. Despite notable progress and innovative approaches in this field, the advancement of Type I organic photosensitizers faces significant obstacles, primarily owing to the lack of a reliable and comprehensive design strategy. Therefore, there is an urgent need to formulate a comprehensive framework that addresses the design strategy and photophysical manipulation of Type I organic photosensitizers.Conclusions and ProspectsThis review provides a timely summary of the progress in Type I organic photosensitizers for PDT. We aim to provide a foundational framework that can guide the development of more effective and clinically viable Type I organic photosensitizers by thoroughly examining how structural variations influence the photophysical and photochemical properties. This is crucial for both new researchers entering the field and established scientists looking to update their knowledge base or pivot their research focus. Another key component of this review is the identification and discussion of the ongoing challenges in this field. This review seeks to inform and inspire ongoing and future research efforts by understanding both current limitations and future possibilities, ultimately accelerating the translation of research findings into tangible clinical benefits.
Jul. 16, 2024Vol. 51 Issue 15 1507201 (2024)
Research Advances in Disease Biomolecular Markers Revealed by Stimulated Raman Scattering Microscopy
Shuo Zhang, Tinghe Fang, and Shuhua Yue
SignificanceIn the field of medical research, the identification and detection of biomolecular markers are essential for the accurate diagnosis and treatment of diseases. Although fluorescence microscopy is applied commonly for single-cell analysis, many small biological molecules cannot be specifically labeled, since bulky fluorescent probes often undesirably interfere with the biological activities of biomolecules. In addition, mass spectroscopy has low spatial resolution and can also destroy tissues and cells during the detection process, rendering it unsuitable for the in situ monitoring of the temporal and spatial dynamics of biological small molecules in live cells. These limitations seriously impede the in-depth exploration of the biomolecular markers of diseases, thus emphasizing the significance of developing a powerful chemical imaging platform for the in situ research of molecules. The imaging contrast of Raman spectroscopy, which results from inelastic optical scattering based on the characteristic vibration of chemical bonds, enables it to identify chemical substances without exogenous labels. However, the low efficiency of spontaneous Raman scattering results in weak signals and time-consuming data acquisition, rendering it unsuitable in dynamic living systems. In comparison, stimulated Raman scattering (SRS) addresses the aforementioned limitations with the advantages of label free detection, high sensitivity, high chemical specificity, high-speed imaging, and high spatial resolution. It enables real-time quantitative detection of the chemical distribution and metabolic transformation of significant biological small molecules (such as lipids, amino acids, glucose, nucleic acids, collagen fibers, and monosodium urate) in live cells. The emerging technique shows broad application prospects in the field of biomedical research. This review article mainly focuses on the applications in the identification and detection of biomolecular markers of diseases, discusses the potential of advanced SRS microscopy techniques and data analysis methods to provide new pathways for precise disease diagnosis and treatment, and proposes further development trends in this research field.ProgressSRS microscopy is an advanced label-free chemical analysis tool based on nonlinear optical processes. It has attracted considerable attention in the biomedical field. In the past few decades, in-depth studies have been conducted to improve the imaging quality of SRS microscopy, which has been widely applied to explore molecular markers. Based on the literature survey, this review introduces the latest technical advances in SRS microscopy, such as the development of various forms of hyperspectral and multiplexed SRS microscopy to improve the chemical specificity, and various bio-orthogonal small-volume Raman probes to enhance the sensitivity and specificity. With the technical progress in SRS microscopy, it has been widely used in the imaging and quantitative analysis of the molecular markers of numerous diseases, providing new insights into elucidating the pathogenesis of diseases, and showing broad prospects in disease diagnosis, process monitoring, intraoperative auxiliary detection, and subsequent treatment. This review primarily focuses on the specific biological applications of SRS microscopy in exploring the abnormal state of the biomolecular markers of atherosclerosis, gout, fatty liver and liver fibrosis, neurodegenerative diseases, infectious diseases, and cancer. Finally, this article highlights the prospects for future development in SRS microscopy.Conclusions and ProspectsSRS microscopy is a revolutionary imaging technique offering numerous advantages for exploring the molecular markers of diseases at the single-cell level. Owing to its advantages of being label-free, and having high speed, high sensitivity, high spatiotemporal resolution, and high chemical specificity, SRS microscopy has emerged as an ideal and promising platform for the identification and detection of biomolecular markers in diseases. We anticipate three promising directions for the SRS technique in the future. First, although the overcrowded high-wavenumber C—H stretching region (2800-3200 cm-1) contains rich chemical information, its analysis is not comprehensive. Hence more efficient and detailed data analysis methods are required to discover molecular markers that are applicable in biomedical fields. Recent developments such as the A-PoD and penalized reference matching algorithms for SRS image processing, and the relative entropy method for Raman spectrum analysis developed by the Shi Lingyan team show broad prospects in extracting biological information and identifying molecular markers. Another limitation of SRS microscopy is its relatively low sensitivity compared with that of fluorescence microscopy; addressing this limitation can significantly promote its applications in investigating disease molecular markers. Finally, the further integration of label-free SRS imaging with multi-omics approaches is expected to provide comprehensive and accurate information about diseases. This integration enables in-depth studies on the mechanism of molecular markers in disease development, and guides disease diagnosis and treatment in clinical practice.
Aug. 10, 2024Vol. 51 Issue 15 1507202 (2024)
Zhijun Guo, Miaoli Ma, Sichao Lu, Qianjin Guo, and Qiang Yang
SignificanceThe cornea is the outermost tissue of the eye, and it is crucial for maintaining the structure and vision of the eye. However, everyday activities can expose the cornea to trauma-associated injuries and infections that may compromise vision. Common corneal detection techniques, such as slit lamp imaging, optical coherence tomography, and confocal microscopy, are based on a morphological structural analysis of the physiological status of the corneal tissue. However, they cannot provide information on tissue composition. Raman spectroscopy can obtain biomolecular information without damaging the tissue structure and has important application value in the detection of corneal tissue composition.ProgressAnalysis of the hydration state of the cornea using Raman spectroscopy can be used to evaluate tissue function and vitality. In 1995, Siew et al. characterized the degree of corneal hydration using the ratio of the intensity integral of the O—H of water to the intensity integral of the C—H of the protein in the Raman spectrum, IOH/ICH. In 1998, Bauer et al. determined a positive correlation between the degree of hydration and distance from the corneal stroma to the tear film. Bauer et al. and Erckens et al. observed that the value of IOH/ICH decreased as the cornea was treated with dehydrating agent drugs in subsequent research studies. In 2003, Fisher et al. determined that IOH/ICH of a bovine cornea treated with lamellar keratectomy decreased faster than that of a manually debrided cornea when the cornea was subjected to forced flow drying.The distribution and content of biomolecules in the cornea change during corneal development, aging, decellularization, and corneal cross-linking (CXL) processes. In 2012, Pang et al. analyzed the changes in the vibrational patterns of proteins, amino acids (tyrosine, proline, phenylalanine, and valine), and protein secondary structures (amide I and amide II) in embryonic chicken corneas over 18 days of development. In 2010, Yamamoto et al. determined that solar radiation causes fragmentation of type IV collagen in the cornea, thereby increasing the Raman spectral background. The effects of the osmotic pressure regulator, decellularization method, and CXL on collagen molecules and the secondary structure of collagen were also demonstrated via Raman spectroscopy. Other applications of Raman spectroscopy to reveal changes in tissue composition due to corneal calcification and infection with protozoa and microorganisms demonstrated its potential for pathological analysis. In 2016, Kim et al. showed that for hereditary corneal diseases, such as corneal dystrophy, Raman spectroscopy can not only be used to reveal pathological tissue composition abnormalities, but also to detect disease-related gene point mutations. Raman spectroscopy and the establishment of machine learning models to classify corneal diseases have become new diagnostic methods. In 2021, Guan et al. classified the Raman spectra of normal and diabetic keratopathy mouse corneas using a PLS-DA model. In 2023, Han et al. used the PCA-KNN model to classify the degree of myopia.Raman spectroscopy provides a new method for studying ocular pharmacokinetics. In 1999, Bauer et al. examined the changes in drug-specific Raman signals of the corneal epithelium of living rabbit eyes after topical application of Truspot with varying drug concentration and time. They found that Raman spectroscopy has sufficient sensitivity and reproducibility to reveal these variations. Subsequent studies demonstrated the application of Raman spectroscopy in the pharmacokinetic analysis of drugs such as besifloxacin, hybrid peptide VR18, hybrid peptide VR18, and steroids. Raman spectroscopy can also be combined with imaging techniques, such as TPAF, SHG, and TSFG, to obtain multidimensional information about samples. In 2012, Mortati et al. examined the collagen production process of living human corneal fibroblasts and mesenchymal stem cells cultured in a fibrin hydrogel 3D scaffold by combining CARS and SHG microscopic imaging technology. Subsequently, CARS combined with TPAF, SHG, and TSFG techniques was used to image corneal cells and biomolecules, and SERS was used for the plasma membrane bimolecular imaging of corneal endothelial cells.Conclusions and ProspectsRaman spectroscopy technology has yielded significant results in the field of corneal tissue composition detection. However, its clinical application still faces certain problems. First, owing to the weak relative power of Raman scattering light to incident light, indicating changes in the biochemical composition of the cornea remains a challenge for spectral sensitivity below the safe threshold of incident laser power. Second, the disease diagnosis and model generalization abilities of Raman spectroscopy combined with machine learning must be further improved for clinical applications. In response to these two issues, the following strategies are proposed. First, for the detection of different tissue components, using incident light wavelengths with a higher signal-to-noise ratio and incident light with a power density of the Bessel distribution may be a potential method for improving the sensitivity of Raman spectroscopy. Additionally, designing and manufacturing eye probes that are safe to use and have low optical power loss for focusing and collecting Raman-scattered light also shows great potential for improving the detection sensitivity. Second, with the development and maturity of optoelectronic devices, miniaturized and low-cost Raman spectroscopy devices are expected to be increasingly applied in clinical research, and more sample data can become a driving force for improving the performance of artificial intelligence models. In summary, Raman spectroscopy technology still has great potential for development in the analysis of corneal tissue composition and even in the research and clinical application of ophthalmology, and it is expected to lead to new changes in biomedical detection.
Jul. 16, 2024Vol. 51 Issue 15 1507203 (2024)
Cheng Wang, Changxing Yang, Jiayi Yang, Qianqian Ge, Wenqiang Cai, Yuling Yan, Huazhong Xiang, Dawei Zhang, and Xiaoqing Zhao
ObjectiveCutaneous squamous cell carcinoma (cSCC), also known as skin squamous cancer, is one of the three primary types of malignant skin tumors in China. The diagnosis of cSCC is primarily based on clinical features. Biopsy, excision, and histological confirmation should be performed for all clinically suspicious lesions to facilitate the prognostic classification and correct management of cSCC. This process often relies on prolonged microscopic examination by experienced pathologists. However, traditional microscopic imaging techniques, which primarily rely on RGB images, have a limited ability to provide additional dimensional information and demand high levels of expertise from physicians. Moreover, inconsistencies in staining standards across different laboratories may lead to uneven staining or overstaining, which could affect the uniformity of diagnostic outcomes. To improve the diagnostic accuracy of cSCC and reduce the labor intensity of pathologists, multispectral imaging (MSI) technology was used to analyze pathological slices from both cSCC and normal skin tissues.MethodsMultispectral imaging (MSI) technology offers both spatial morphology and spectral information across various bands, captures more useful components or markers, and provides physicians with a richer diagnostic basis. In this study, we developed an automated multispectral microscopic imaging system based on narrowband LED illumination. The core of the system is composed of 13 narrow-band LED lighting units that cover a spectral range of 420?680 nm, which provides more diagnostic information than do traditional RGB imaging techniques. The system is equipped with a precision motorized translation stage that facilitates the automated and systematic scanning of tissue samples as well as the capture of clear images with a high-resolution CMOS camera. A software interface developed using the Qt framework offers an intuitive operational environment that allows adjustments to be made to the wavelength selection and exposure settings and also allows for real-time image modifications to ensure optimal image quality and diagnostic accuracy. The captured grayscale images span 13 spectral bands covering each lesion area. The image capture and processing stages include dark current and radiation correction as well as the use of an adaptive two-dimensional gamma function method to effectively correct uneven illumination, which thereby improves the image quality and contrast. The multispectral imaging system was applied to cSCC and normal skin tissue slices from Shanghai Ruijin Hospital, using scale-invariant feature transform (SIFT) technology for image stitching and segmentation. In the 600 nm band, an adaptive threshold algorithm was employed to segment large lipid droplets in normal tissues and keratin pearls and squamous eddies in cancerous tissues. In the 630 nm band, a random forest algorithm was used for the segmentation of cell nuclei. Furthermore, the segmented images underwent pseudocolor processing, and a sliding window technique with a 200×200 pixel window was used to calculate the nuclear-cytoplasmic ratio within the window.Results and DiscussionsThe results indicate that the visualization of pathological structures is significantly enhanced by the pseudocolor processing of multispectral pathological images, which is crucial for distinguishing between cSCC and normal skin tissues. Additionally, by establishing a 200×200 pixel window for quantitative analysis, the nuclear-cytoplasmic ratio within the window can be calculated. A statistically significant difference in the nuclear-cytoplasmic ratio between normal skin tissues and cSCC tissues is revealed (P<0.001). The ROC curve for the quantification of the nuclear-cytoplasmic ratio demonstrates the sensitivity and specificity of the system. Using a qualitative analysis and quantitative statistics, a method is developed to reduce the subjective judgment in diagnostics and thereby offering insights into the detection of cSCC.ConclusionsIn this study, an automated multispectral microscopy imaging system is designed and established based on the results of a previous study. The system is equipped with a human-computer interaction interface that was designed using the Qt framework to achieve image acquisition and control functions. Compared with traditional visual inspection methods, this system captures images across multiple spectral bands and provides richer information on tissue states. Based on the results of the qualitative and quantitative analyses, the tremendous potential of multispectral imaging technology for distinguishing between normal and cancerous tissues is demonstrated. The system will not only reduce costs and manpower requirements but also address diagnostic inconsistencies caused by staining differences. This research will bring new perspectives and methods to the fields of skin pathology and cancer diagnosis, as it demonstrates the potential to achieve more efficient and high-quality diagnostics at lower costs. Future studies should focus on collecting more clinical data to validate the broad applicability of this technology.
Jul. 29, 2024Vol. 51 Issue 15 1507204 (2024)
Qingxia Wu, Bainan Li, Ziyang Hui, Zihan Wang, Yunhong Li, Linwei Shang, and Jianhua Yin
ObjectiveBreast cancer is among the most common malignant tumors and a serious threat to women’s health. Therefore, rapid and efficient screening for breast cancer is increasingly important. Currently, imaging and pathological examinations are the two main methods used for breast cancer diagnosis. Imaging examinations typically have shortcomings such as long examination time and radioactivity. Pathological examination, which is the gold standard for cancer diagnosis, has the disadvantages of complicated preparation and time-consuming processes. Therefore, a new intelligent method must be developed for breast cancer diagnosis to reduce the reliance on traditional techniques. Microscopic imaging and fluorescence spectroscopy are crucial tools for studying the characteristics of cancerous breast tissues and for effectively capturing changes in tissue morphology and biochemical composition. In this study, a self-designed and processed inverted fluorescence microscope was employed to simultaneously collect microscopic images and fluorescence spectra from breast tissues of patients.MethodsFirst, the samples used in this study were obtained from patients with invasive breast cancer. The fresh tissue samples were cut into tissue blocks of approximately 3 mm×3 mm×2 mm size, quickly frozen within liquid nitrogen, and then cut into tissue sections with a thickness of 15 μm. The entire process did not require staining of tissue sections. Next, microscopic images and spectra were collected. The collection equipment was designed and customized based on an inverted fluorescence microscope (IX51, Olympus). Bright field and fluorescence imaging modes of different wavelengths were achieved by switching excitation filters and dichroic mirrors and adjusting the light source. A total of 69 sets of multimodal microscopic images and 46 sets of spectral data (divided into purple and blue light excitation) were obtained from the tissue sections of 23 patients. The spectral data were preprocessed using baseline correction and third-order polynomial 30-point Savitzky?Golay smoothing. Finally, a neural network model was constructed based on multimodal microscopic images and fluorescence spectra that included image feature extraction, spectral feature extraction, and spectral feature fusion. For image feature extraction, multimodal images were stacked into a three-dimensional (3D) matrix, and joint feature extraction was performed with the help of 3D convolutional layers and residual modules. For spectral feature extraction, the fluorescence spectra excited by excitation light of different wavelengths (purple and blue) were first stacked in parallel into a two-dimensional (2D) matrix, and joint feature extraction was achieved with the help of a 2D convolution layer and residual module. The extracted image and spectral features were then combined, and the spectrum?image fusion features were further explored with the help of a fully connected neural network, ultimately achieving an intelligent diagnosis of breast cancer.Results and DiscussionsThe first step is a multimodal microscopic image analysis. Under purple light excitation, bright field images, blue fluorescence images, and their fusion images show that the extracellular matrix of normal breast tissue has a more uniform fluorescence distribution than that of cancerous breast tissue (Fig. 3). Under blue light excitation, bright field images, green fluorescence images, and their fusion images show that the cancerous breast tissue has a strong green fluorescence signal (Fig. 4). The fluorescence spectrum analysis shows that the average spectral intensity of normal breast tissue under purple light excitation is significantly stronger than that of cancerous breast tissue, and the fluorescence intensity of cancerous breast tissue under blue light excitation is slightly higher than that of normal tissue (Fig. 5). A Gaussian function was used to fit and analyze the spectra excited by purple light. The analysis results show that the area ratios (A520/A470 and A635/A470) of the fluorescence spectrum peaks at the central wavelengths of 520 nm and 635 nm to that at 470 nm in cancerous breast tissues increase by 0.65 and 1.07 times, respectively, compared to those of normal breast tissues (Table 2). Finally, during intelligent diagnostic analysis, the training and prediction results of the spectrum?image fusion neural network show that the risk of model over-fitting is extremely low. The calculated area under the curve (AUC) is 0.95, indicating that the model has good classification performance. Further calculations of the test set data show that the average accuracy is 86.38% (Fig. 7). At the same time, this study further lists the training results of five types of image and spectral data used alone for breast cancer diagnosis for comparison with the diagnostic results of spectrum?image fusion data. The results indicate that the spectrum?image fusion neural network can achieve a significantly higher prediction accuracy than each single-modality model (Table 3).ConclusionsIn this study, dual-modal microscopic imaging and multiwavelength microfluorescence spectroscopy are combined to diagnose breast cancer to obtain more comprehensive information on compositional changes in breast tissue during canceration. The Gaussian fitting model is used to perform peak splitting analysis on the spectral data. Changes in endogenous fluorophore content during cancerization are discussed, and the peak area ratio is proposed as a potential criterion to diagnose breast cancer. In addition, this study introduces deep learning to construct a spectrum?image fusion neural network model based on fluorescence microscopic images and microscopic spectra, achieving an AUC score of 0.95 and an accuracy of 86.38% that are significantly higher than those of each single-modality model. This provides a feasible method for the intelligent diagnosis of breast cancer with the advantages of convenience, speed, and clinical significance.
Aug. 10, 2024Vol. 51 Issue 15 1507205 (2024)
Yu Xiao, Zelong Zhang, Menghua Jian, and Wei Dong
ObjectiveLaser ablation, owing to its advantages of high precision, strong controllability, and minimal invasiveness, is utilized widely for cancer treatment. However, this technology is affected by the elevated surface temperatures of biological tissues and the potential of irreversible thermal damage to adjacent normal tissues in clinical applications. To mitigate surface overheating in biological tissues, researchers have proposed employing forced convection cooling, implementing periodic heating patterns, and integrating laser-energy-modulation techniques to regulate laser-energy delivery. To address irreversible thermal damage to normal tissues, a prevalent strategy is the intratumoral injection of gold nanoparticles to significantly enhance laser-light absorption. Researchers have investigated various types of gold nanoparticles as near-infrared laser absorbers as well as the effects of parameters, such as laser settings, irradiation duration, and gold-nanoparticle volume fraction, on the efficacy of laser ablation. Nevertheless, previous studies have rarely focused on the optimization of laser-irradiation parameters using optimization algorithms without relying on external agents such as gold nanoparticles or other photosensitizers to ensure the complete eradication of tumor tissues while minimizing irreversible thermal harm to normal tissues.MethodsIn this study, we devise a method to rapidly predict and optimize laser-ablation effects via a cyclic heating mode. Initially, we simulate the heat distribution from laser photons in biological tissues using the Monte Carlo method. Subsequently, we employ the Pennes biological heat-transfer model and the Arrhenius model in simulations to obtain the temperature distribution and thermal-damage profiles of the biological tissues. To validate the accuracy of our established numerical simulation method for solving biological heat transfer and thermal damage, we construct an experimental platform for the laser irradiation of isolated porcine liver tissue (Fig.7). Subsequently, we conduct Latin hypercube sampling within the design variable space of the laser-ablation irradiation parameters. Next, we perform a numerical simulation to solve for the parameters related to the laser-ablation effect, including the irreversible thermal-damage volume of normal tissues, the total irreversible thermal damage volume, and the average surface temperature of tumor tissues. We utilize a radial-basis-function neural network to model the relationship between the irradiation and laser-ablation effect parameters, thus facilitating the rapid and accurate prediction of the laser-ablation effect. Finally, we employ a genetic algorithm to address the single-objective optimization problem. By optimizing the laser power, heating-area radius, heating and cooling times, and number of cycles, we propose an optimal design for the laser-ablation effect, which can minimize irreversible thermal damage to normal tissues while ensuring the complete eradication of tumor tissues and maintaining an acceptable surface temperature in biological tissues.Results and DiscussionsIn this study, we validated the accuracy of a numerical simulation method for biological heat transfer and thermal damage by performing experiments involving the laser irradiation of isolated pig liver tissues. A comparative analysis of the numerical simulation and experimental results of temperature at the central point of the porcine liver-tissue surface under varying irradiation times revealed relative errors within 5%, with a maximum relative error of 3.07% (Fig.8). Similarly, the examination of the simulation and experimental results pertaining to the thermal damage volume of pig liver tissues across different laser irradiation times indicated the most significant deviation at 200 s, with a maximum error of 0.06 cm3 (Fig.9). Furthermore, we developed an agent model based on a radial-basis-function neural network, which enables the rapid and accurate prediction of laser-ablation effects. Laser-ablation effects were predicted based on 100 test samples under different irradiation design parameters within 4 s on a single thread of an Intel (R) Core (TM) i7-8700K central processing unit (CPU) operating at a main frequency of 3.70 GHz, with each test sample requiring only approximately 0.04 s. This computation time was significantly shorter than that required by conventional numerical-simulation methods, i.e., 5?15 min per test sample. Additionally, a strong correlation between the actual and predicted values of the test samples was observed, with correlation coefficients exceeding 99.9% and root mean square errors below 0.01% (Fig.10), thus underscoring the exceptional fitting efficacy of the established proxy model in predicting temperature and thermal damage in biological tissues. This method is promising for optimizing laser-ablation effects using genetic algorithms. By adopting a genetic algorithm to optimize irradiation design parameters in laser ablation, we obtained parameters that ensured the complete ablation of tumor tissues while maintaining the tumor-tissue surface temperature below 70 ℃. The irreversible thermal damage volume of normal tissues was minimized to 7.046×10⁻⁵ cm3, which constitutes only 0.053% of the total irreversible thermal damage volume (Figs.11 and 12). Under the optimal irradiation design parameters, the laser power was 4.35 W, the radius of the laser irradiation area was 5.11 mm, the heating time per cycle was 47.90 s, the cooling time per cycle was 62.45 s, and the number of cycles was 10.ConclusionsIn this study, a numerical simulation method for solving biological heat transfer and thermal damage in laser ablation was established, and the accuracy of the simulation method was verified experimentally. A method for predicting the laser-ablation effect was developed based on a radial-basis-function neural network that can rapidly and accurately evaluate the irreversible thermal damage volume of normal tissues, the total irreversible thermal damage volume, and the average temperature of the surface of tumor tissues. Additionally, a genetic algorithm was employed to conduct a single-objective optimal design of the laser-ablation technique. The optimized design minimized the irreversible thermal damage volume of normal tissues to 0.053% of the total irreversible thermal damage volume while ensuring the complete ablation of tumor tissues and maintaining the average temperature of the tumor-tissue surface below 70 ℃.
Jul. 23, 2024Vol. 51 Issue 15 1507206 (2024)
Yanfu Li, Haiyue Lan, Jingfan Xue, Jinlin Guo, Ruijie Huang, and Jiangping Zhu
ObjectiveDental caries is a common oral disease affecting the hard tissues of teeth, typically resulting from bacterial infections. This in turn leads to chronic damage. It is prevalent during childhood with symptoms such as the discoloration, deformation, and structural deterioration of teeth. According to Chinas fourth epidemiological survey, 71.9% of five-year-olds experience dental caries in deciduous teeth, and 34.5% of 12-year-olds experience it in permanent teeth. Hence, it is a widespread oral disease among children. Challenges, such as the lack of cooperation from children during tooth brushing and oral examinations, a scarcity of pediatric dentists, and low awareness among parents and pediatricians, often result in the delayed diagnosis and treatment at early stages. Furthermore, variability in diagnostic skills among doctors can result in different diagnoses for the same patient. Therefore, aiding in the identification of dental caries and enhancing diagnostic accuracy are essential for effective clinical diagnosis. Although deep learning-based object detection algorithms have made some progress in detecting dental diseases, they still do not adequately meet the needs for accuracy and speed in diagnosis and identification. Additionally, since detection typically relies on professional medical imaging, it prevents patients from performing self-checks using more accessible devices such as smartphones.MethodsTo address these issues, in this study, a dataset comprising oral images acquired using mobile devices, such as smartphones, was created. Compared to the uniform features of oral images captured with professional equipment, these images inevitably varied in aspects such as lighting intensity and shooting angle, making it challenging for the target detection model to fit during training. To overcome these difficulties, in this study, a caries detection algorithm was proposed based on multiscale path aggregation and robust data augmentation methods were proposed. First, architecture of a path aggregation network (PANet) was adopted in the network to enhance the models ability to extract and integrate semantic information at different levels of the image. Second, a feature extraction module that combines cross-stage partial connections and residual connections was used to effectively strengthen the models feature extraction capabilities. Subsequently, a single-stage detection head was employed to predict the detection box information directly from feature maps of different scales, which maintained multiscale target detection capabilities while improving the models detection speed. Finally, during the training process, data augmentation methods, such as cropping, stitching, affine transformations, and random flipping, were used to minimize the impact of image differences on the performance of the model.Results and DiscussionsThe results of CR-PANet on the caries dataset validation set indicate that CR-PANet realizes an mAP@50 of 88.2%, mAP@50-LQ of 84.6%, and FPS of 169, meeting the requirements for precise real-time detection. Compared to other commonly used single-stage target detection models, CR-PANet is slightly weaker in terms of computational speed and parameter quantity. However, it shows improvement in precision, recall, and mAP@50. Given the multiscale path aggregation architecture of the CR-PANet model, it maintains sensitivity to targets of different sizes while reducing the number of parameters and computational load, outperforming dual-stage target detection models in performance (Table 1). The CR-PANet can determine the positions of detection boxes with very low bias and identify target categories with high confidence. Moreover, even on low-quality images with issues such as overexposure, darkness, blurriness, or occlusion, CR-PANet still realizes excellent detection results with higher accuracy than that obtained by the other comparative models (Fig. 8?9). The ablation experiments were conducted in four groups. The first group used PANet as the baseline model, with an mAP@50 of 73.4%, a precision of 79.5%, and a recall of 69.2%. The second group replaced CSPBlock in the baseline network with CRBlock, which increased the mAP@50 by 5.8 percentage points. The third group replaced the dual-stage detection head used in the baseline model with the new detection head, resulting in a 1.4 percentage points increase in mAP@50. The fourth group applied new data-augmentation methods to the training data, significantly improving all four indicators (Table 2). After incorporating the feature extraction module CRBlock, CR-PANet converged faster, and the training process became more stable. With the addition of the detection head, and data augmentation strategies, the detection performance of the model is further enhanced (Fig. 10). By comparing the detection results of CR-PANet on the three test images with real annotations and Grad-CAM, it is evident that CR-PANet can detect almost all dental disease areas and accurately determine their positions and ranges, demonstrating its excellent ability to extract semantic information and retain positional information (Fig. 11).ConclusionsIn this study, CR-PANet target detection model is proposed. The model is designed for the automatic detection of dental disease areas in oral images acquired via mobile devices, such as smartphones. Initially, the model incorporates the multiscale path aggregation architecture of PANet, enhancing its ability to detect targets of varying sizes and positions. Subsequently, cross-level and residual connection structures are combined to propose the feature extraction module CRBlock and detection head. This integration not only reduces the number of parameters and computational load but also improves the feature extraction capabilities. Furthermore, it stabilizes the gradient flow during training. Finally, various data augmentation strategies are employed to diversify the dataset images, thereby improving the generalization ability and robustness of the model. The experimental results show that CR-PANet realizes an mAP@50 of 88.2% on the validation set, with precision and recall rate of 98.9% and 89.0%, respectively. Even on a low-quality dataset, mAP@50 realizes 84.6% accuracy, which is a significant improvement over other target detection models. Additionally, ablation experiments reveal that both CRBlock and detection head significantly enhance the feature extraction capabilities of the model, and data augmentation strategies further improve its generalization ability. In summary, the CR-PANet algorithm enhances the detection of dental disease areas in oral images captured via mobile devices, meeting the requirements for real-time detection. Their accuracy and speed are sufficient for the patients to conduct self-checks. Future research should focus on expanding the dataset, refining the granularity of the dental disease types, and detecting a broader range of dental diseases.
Jul. 16, 2024Vol. 51 Issue 15 1507207 (2024)
Linyi Miao, and Feng Li
ObjectiveVarious eye diseases and systemic conditions, such as macular degeneration, glaucoma, diabetes, and hypertension, can lead to visual impairment or permanent blindness. These conditions often result in changes in the retinal vascular structure during their onset and development. Ophthalmologists frequently observe abnormalities in retinal blood vessels through fundus imaging. Nevertheless, manual delimitation of retinal vessels in fundus images based solely on expertise and experience is time-consuming, labor-intensive, and subjective, particularly for small/subtle blood vessels. Accordingly, it is important to develop a rapid, accurate, and automated method for retinal blood vessel segmentation using computer vision technology for ophthalmic clinical research. While numerous deep learning methods for retinal blood vessel segmentation have improved the segmentation performance to a certain extent, most of them do not fully consider the complex blood vessel structural features. There remains room for improvement in extracting multi-scale vessel patterns, utilizing global contextual semantic information, and achieving high precision in segmenting small/tiny blood vessels. Therefore, we develop a novel dynamic feature graph convolutional network (DF-Net).MethodsThe proposed DF-Net, as an end-to-end retinal blood vessel segmentation network, used U-Net as the backbone and consisted of three main parts: an encoder embedding a double dilated convolution block (DDCB), a dynamic feature graph convolution module (DFGCM), and a decoder, as illustrated in Fig.1. The DDCB expanded the receptive field of the model without increasing the number of model parameters, which could better capture global semantic information and improve the model's ability to obtain global structural information on retinal blood vessels. DFGCM captured topological dependencies across feature channels, aggregated effective feature information among channels, and enriched the feature details of the retinal blood vessels. Retinal fundus images were first fed into an encoder integrating DDCB, where the scale of feature maps was reduced by half, and the number of channels was doubled when experiencing each down-sampling operation. Subsequently, the high-level feature maps generated by the encoder were incorporated into the DFGCM. The integration mapped the feature map channels into the topological space, extracting topological correlations among different channels from the topological maps, and aggregating effective features among channels, thereby improving channel utilization. Furthermore, the high-level features output by the DFGCM were fed into the decoder to reconstruct them to the same size as the input image, yielding segmentation results. In the decoder, the scales increased by half and the number of channels was reduced by half when implementing each upsampling operation on the feature maps. The resulting feature maps were then concatenated with the corresponding level maps from the encoder, followed by convolutional operations on these feature maps to extract rich vessel structural information.Results and DiscussionsTwo publicly available high-resolution datasets, Fives and HRF, and three widely used low-resolution datasets, DRIVE, STARE, and CHASE~~DB1, were used to validate the proposed DF-Net. The comparison results (Tables 1 and 2) demonstrate that our DF-Net outperforms the existing state-of-the-art retinal vessel segmentation models on the two high-resolution Fives and HRF datasets. For the Fives dataset, our model achieves an accuracy of 0.9876, sensitivity of 0.9088, specificity of 0.99360, AUC of 0.9950, F1-score of 0.9125, and MCC of 0.9059. For the HRF dataset, the model achieves an accuracy of 0.9733, sensitivity of 0.8322, specificity of 0.9837, AUC of 0.9856, F1-score of 0.8318, and MCC of 0.8202. Specifically, compared to U-Net, our model demonstrates improvements of 0.30%, 2.60%, 0.28%, 2.65%, and 2.83% in accuracy, sensitivity, AUC, F1-score, and MCC on the Fives dataset, respectively. Similarly, compared to G-CASCADE, our model achieves improvements of 0.07%, 1.16%, 0.18%, 1.13%, and 1.07%, respectively, on the same dataset. For the HRF dataset, our model achieves performance gains of 0.53%, 1.62%, 0.05%, 0.32%, 1.60%, and 1.40% for all the evaluation indices compared with G-CASCADE. The comparison results (see Tables 3, 4, and 5) on the three low-resolution DRIVE, STARE, and CHASE~~DB1 datasets reveal that our model is relatively more robust and has better generalization capability than other cutting-edge segmentation methods. On the DRIVE dataset, our model achieved the highest scores in terms of accuracy, specificity, and AUC. However, the F1-score, sensitivity, and MCC were 0.83%, 2.12%, and 1.16% lower, respectively, than the corresponding highest scores. In the STARE dataset, the gaps in these three indicators are further narrowed, being only 0.50%, 0.59%, and 0.55% lower than the corresponding best scores. Our model achieved the highest sensitivity, AUC, F1-score, and MCC for the CHASE~~DB1 dataset. The perfect segmentation performance of the developed DF-Net may be attributed to our DDCB for enlarging the receptive field of the model to extract global structural information of retinal blood vessels, as well as DFGCM for establishing dynamic topology relationship among channels to enrich their local characteristics. In addition, the effectiveness of the components of the proposed DF-Net, including DDCB and DFGCM, was justified on the Fives dataset.ConclusionsIn the present study, a novel DF-Net for high-resolution fundus images is developed to segment retinal blood vessels. It enlarges the receptive field through the DDCB to capture the global structural information of the retinal blood vessels. Additionally, the feature channels are mapped into the topological space using the constructed DFGCM, in which the dynamic topological correlations across channels are deeply extracted, effectively merging the feature information among the channels and refining their local details. Quantitative and qualitative experiments are conducted on two high-resolution fundus image datasets, HRF and Fives, together with three widely used low-resolution datasets: DRIVE, STARE, and CHASE~~DB1. The results indicated that the proposed DF-Net outperforms the current advanced retinal blood vessel segmentation methods in most evaluation indicators and exhibits good robustness and generalization capacity. As illustrated in Figs.4 and 5, even in confusing regions where other methods are prone to errors, the proposed model can still correctly identify small/tiny blood vessels in these areas while maintaining the anatomical structures, which are nearly consistent with the ground truths. Thus, we believe that the proposed method can be easily adapted to address other medical image segmentation challenges with diverse appearances and anatomical structures.
Jul. 16, 2024Vol. 51 Issue 15 1507208 (2024)
Jiayi Zhang, Bo Ren, Can Li, Hongxiang Chang, Zhenqiang Tang, Tao Wang, Kun Guo, Gehui Xie, Jinyong Leng, Lei Si, Wenxue Li, and Pu Zhou
Aug. 02, 2024Vol. 51 Issue 15 1516001 (2024)
© Copyright 2018-2021 | Chinese Laser Press.
All Rights Reserved 沪ICP备15018463号-20