


Please enter the answer below before you can view the full text.


2025
Volume: 40 Issue 1
13 Article(s)

Shuaihao ZHANG, and Zhigang PAN
Deep learning has significantly advanced remote sensing image processing technology, demonstrating notable improvements in both accuracy and speed. However, deep learning models typically require large amounts of manually labeled training samples in practical applications, and their generalization performance is relatively weak. In recent years, the development of visual foundation models and large language models has introduced a new paradigm for research on large models in remote sensing image processing. Remote sensing large models, also known as remote sensing foundation models, have garnered attention for their outstanding transfer performance in downstream tasks. These models are first pretrained on large datasets unrelated to specific tasks and are then fine-tuned to adapt to various downstream applications. Foundation models have already been widely applied in language, vision, and other fields, and their potential in the field of remote sensing is increasingly gaining attention from the academic community. However, there is still a lack of comprehensive surveys and performance comparisons of these models in remote sensing tasks. Due to the inherent differences between natural images and remote sensing images, these differences limit the direct application of foundation models. Against this backdrop, this paper provides a comprehensive review of common foundation models and large models specifically designed for the field of remote sensing from multiple perspectives. It outlines the latest advancements, highlights the challenges faced, and explores potential future directions for development.
Feb. 28, 2025Vol. 40 Issue 1 1 (2025)
Wei CHEN, Hao LI, Qihua ZHANG, Yanlan HE, and Shengli WANG
Rapid and accurate acquisition of cultivated land change information is of great significance to food security management. This paper aims at the problem that remote sensing semantic segmentation method has many errors and omissions due to insufficient model applicability in large-scale and high-resolution image cultivated land non-agricultural detection. Multiscale Scene Classification-Xception (MSC-Xception), a multi-scale scene classification method for high-resolution cultivated land images based on Xception, is proposed. The convolutional attention module CBAM is embedded into the output layer of the lightweight scene classification network Xception, which has outstanding performance in cultivated land scene classification, to enhance the model's ability to extract channel and spatial features. At the same time, the problem of low separation degree and rough details of mixed scenes existing in the single-scale scene-level classification in large-scale cultivated land extraction is also overcome. Firstly, a feature fusion method of multi-scale cultivated land scene is introduced to improve the separation degree of mixed scene, and then the boundary constraint of multi-scale segmentation vector is used to achieve the boundary refinement of scene-level classification. Compared with the typical Unet, PSPNet and DeeplabV3+ semantic segmentation methods, this method can better reduce the missed detection of large map spots, and the recall rate and F1 score in the cultivated land extraction experiment of GF-2 images in Qixia District in April 2018 increased by at least 15.1 percentage points and 8.8 percentage points respectively. In the non-agricultural detection of cultivated land in Qixia District from 2018 to 2022, the recall rate of suspicious spots increased by at least 7.16 percentage points.
Feb. 28, 2025Vol. 40 Issue 1 25 (2025)
Chaoqun MA, Jingyi YANG, Xiaofeng WANG, Xuefeng YUN, and Zhaoxia REN
The basic carrier of grain production is farmland. The rapid and accurate acquisition of non-agricultural information of farmland is of great significance to the management of farmland resources and the implementation of related policies. In order to explore the non-agricultural changes of farmland in Shangnan County in recent 10 years, Google Earth Engine (GEE) was used as the platform, random forest method was used for classification, and temporal and spatial distribution information of farmland in Shangnan County in 2010, 2015 and 2020 was obtained based on multi-temporal Landsat remote sensing images. By means of land transfer matrix, geographic detector technique and grid element method, the important characteristics and driving factors of non-agricultural farmland in Shangnan County were analyzed. The results showed that: (1)The random forest method based on GEE platform could effectively obtain farmland information in Shangnan County, the overall accuracy of land use classification was higher than 88%, and the Kappa coefficient was greater than 0.85. (2) The spatial distribution of farmland in Shangnan County is uneven, mostly distributed in the central and southeastern regions, the farmland area is decreasing continuously, and the non-agricultural development is showing a trend of increasing. The non-agricultural type of farmland is mainly garden land, and the conversion land is mainly concentrated in the central and southeastern areas of Shangnan County. (3) Natural and social factors have a common driving effect on the non-agricultural conversion of farmland, and natural factors are the prerequisite for the non-agricultural conversion of farmland, and the influence of human activities on the non-agricultural conversion of farmland under the limitation of natural factors can be reflected by social factors. The main natural driving factor of farmland non-agricultural transformation in Shangnan County is soil type, and the social factor from road distance has the greatest influence on the transformation of farmland non-agricultural transformation, indicating that the suitable soil type and rapid economic development have a greater impact on the farmland non-agricultural transformation in Shangnan County.
Feb. 28, 2025Vol. 40 Issue 1 47 (2025)
Yiyang XUE, Xia JING, Qixing YE, Kaiqi Du, and Bingyu Li
In order to improve the overfitting problem of small sample data and improve the generalization ability and prediction accuracy of the wheat stripe rust remote sensing monitoring model, this paper uses the Solar Induced Chlorophyll Fluorescence (SIF) in the canopy obtained by the Chinese Academy of Agricultural Sciences Experimental Station in 2018 as the data source, The Cost Complexity Pruning (CCP) algorithm is used to prune the Random Forest Regression (RFR) method, and the Bayesian Optimization (BO) algorithm is used to select hyperparameter for random forest regression, and a prediction model of wheat stripe rust severity based on the constrained random forest regression (CO-RFR) algorithm is Constructed, And compare the accuracy of the remote sensing monitoring model for wheat stripe rust with the Classification And Regression Tree (CART) algorithm, traditional RFR algorithm, and Multiple Linear Regression (MLR) method. The results indicate that: (1) The CO-RFR model has the highest estimation accuracy and is more suitable for monitoring the severity of wheat stripe rust under small sample data. Among them, in the validation dataset, the average RMSE between the Severity Level (SL) predicted by the CO-RFR model and the measured SL was reduced by 43%, 50%, and 40%, respectively, compared to the RFR, CART, and MLR models, and the average R2 was increased by 56%, 47%, and 40%, respectively. (2) Adding constraints can effectively improve the overfitting phenomenon of the model and enhance its generalization ability. Among them, the average RMSE between the predicted SL value and the measured SL value in the RFR model training set decreased by 62% compared to the validation set, indicating that the accuracy of the model training set was much higher than that of the validation set, and the model showed overfitting. However, the average RMSE between the predicted SL value and the measured SL value in the CO-RFR model training set decreased by 8% compared to the validation set, indicating that the model fitting effect was good and the overfitting phenomenon was significantly improved. eat stripe rust disease under small sample data, and also provides application reference for stress monitoring of other crops.
Feb. 28, 2025Vol. 40 Issue 1 69 (2025)
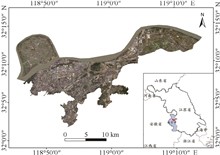
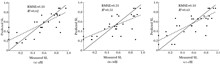
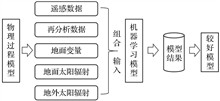
Tongliang WANG, Shaoxiu MA, Yang GAO, Yulai GONG, Weiqi LIU, and Quangang YOU
The solar radiation data plays an important role in land surface energy balance assessment such as sensible heat, latent heat, solar energy assessment etc. However, Radiation data is missing from observed meteorological data by meteorological bureau. Hence, it is imperative to predict solar radiation in a large area with accessible data sources. This research uses the widely accessible data such as (Reanalysis data MERRA 2, remote sensing data MODIS and extra-terrestrial radiation) to drive the commonly used machine learning models for estimating daily solar radiation. The results show that the reanalysis data can replace ground variables and achieve the similar level of precision prediction(difference value 0.14 MJ/m2(MAE)、0.22 MJ/m2(RMSE)、1.13 %(NRMSE)). Particularly, the machine learning models reach the best prediction accuracy(MAE 3.42 MJ/m2,RMSE 4.86 MJ/m2,NRMSE 26.87 %) when driven by re-analysis, remote sensing data and extra-terrestrial radiation together. Meanwhile we also noticed the ensemble of the multiple machine learning model also have a better performance for using any single model. This study highlights that a satisfied radiation data can be generated with widely accessible multi-resource data as well as a couple of the machine learning models.
Feb. 28, 2025Vol. 40 Issue 1 77 (2025)
Xiaolin SANG, Rui JIN, and Minghu ZHANG
The monitoring of river runoff is of great significance to the management and utilization of water resources, but how to obtain river runoff flexibly and accurately is still a difficult problem. Due to the limited resolution of satellite remote sensing, it is difficult to accurately invert the runoff of small and medium-sized rivers. The traditional river flow monitoring technology is complex and expensive, and its application is limited in the areas without data and in the emergency monitoring of sudden disasters. Therefore, this study takes advantage of the fast and flexible characteristics of UAVs and the advantages of LiDAR to obtain terrain information with high accuracy. Based on the 3D model of UAVs LiDAR point cloud data, combined with the Particle Tracking Velocity (PTV) method, This paper presents a method of runoff monitoring for small and medium-sized rivers. In this method, the boundary line between water body and land is extracted by using the strong absorption characteristics of the near infrared band of LiDAR, and the cross section is obtained by matching and merging with the original profile of the river. Based on low-altitude UAV optical remote sensing images, the particle tracking velocity measurement method is used to calculate the river velocity, and then the river runoff is estimated by the velocity area method. After 24 UAV runoff monitoring experiments in the reach of Liancheng Hydrology Station, the following conclusions are reached: The average relative Error between the flow monitored by LiDAR and the measured flow is 8.67%, the minimum relative error is 0.46%, and the Root Mean Squared Error (RMSE) is 0.09 m3/s. MPE (Mean Percentage Error) is 0.02, Pbias (Percent bias) is 1.95%, the Nash-Sutcliffe efficiency coefficient (NSE) was 0.94, which could meet the monitoring accuracy requirements of small and medium-sized rivers in areas without data. By comparison, the monitoring accuracy of runoff using this method is significantly higher than that of Manning formula runoff estimation (RMSE, NSE). This study demonstrates the feasibility and reliability of the unmanned aerial vehicle Lidar point cloud data runoff monitoring, and provides a new idea for the emergency monitoring of sudden disasters in areas without data and the runoff monitoring of small and medium-sized rivers.
Feb. 28, 2025Vol. 40 Issue 1 98 (2025)
Pingping YE, Adan WU, Xiaowen ZHU, and Minghu ZHANG
The Arctic, as one of Earth's “Three Poles”, is abundant in resources and serves as a key focus in global change research. Changes in sea ice within this region are highly significant for the opening of navigational routes and the preservation of ecological systems. However, existing 3D GIS systems lack the capability to directly visualize irregular grid data, thereby restricting their capacity to support Arctic passage information services. To address this technical challenge, this study proposes a method to automatically transform irregular grid data into regular grid data. Additionally, a Cesium-based three-dimensional visualization system for sea ice data has been developed, enabling the automatic loading and visualization of long-term irregular grid sea ice data within a 3D virtual Earth environment. Performance evaluations demonstrate that the proposed method achieves high levels of accuracy and efficiency, and the developed system effectively and intuitively depicts Arctic sea ice changes, providing critical ice condition information to support ship navigation planning.
Feb. 28, 2025Vol. 40 Issue 1 122 (2025)
Yunchen WANG, Xiao ZHOU, Penglong WANG, Boyan LI, Weixiao HAN, and Jinliang HOU
Land use/cover change is an essential part of the frontier of global climate change and sustainable development. In this paper, based on Google Earth Engine (GEE) platform, we used Landsat remote sensing images of 1990, 2000, 2010, and 2020, combined with Random Forest (RF) algorithm and field survey to sequentially decode the four phases of land use/cover data in the order of build-up area, water, vegetation, farmland, and unused land and tracked the spatial and temporal patterns of land use/cover changes in the Triangle of Central China. The results show that ① In 2020, the Triangle of Central China will mainly be composed of farmland and vegetation, accounting for more than 86% of the area, with farmland and vegetation mainly distributed around the urban agglomeration, build-up area in a spatial pattern of scattered clusters mosaic; ②Over the past 30 years, the quantitative structure of land use and land-use transfer in the study area have varied, with the land use structure showing an increased continuously in build-up area and farmland, a fluctuating increase trend of vegetation and unused land, and a weak increase trend of water; and ③ The results of the analysis of the evolution of spatial clustering of land use focusing on build-up area and farmland show that the hotter and hot spots of land use degree are increasing. In general, the extreme hot spot area is gradually decreasing, while the hotter sites are on the contrary, and the hot spots are growing in trend, and all of them located in and around Wuhan city circle. The study results lay the foundation for the research on the conservation and sustainable use of land resources in ecological urban agglomeration.
Feb. 28, 2025Vol. 40 Issue 1 132 (2025)
Yao ZHENG, Shuwen YANG, Jinsha WU, Yukai FU, and Ruixiong KOU
This paper introduces a heterogeneous image registration algorithm called Extended Phase Consistency Spatial Relationship Constraints (EPC-SRC). The objective is to address challenges related to a high mismatching rate and low registration accuracy encountered in registering heterogeneous images. Initially, we present a chunked Harris feature detection method based on an adaptive weighted moment map. This method aims to identify stable, uniformly distributed, and repeatable key feature points. Subsequently, a multiscale weighted maximum index map (MSW-MIM), combined with an enhanced GLOH histogram-like (GLOH-like) approach, is employed to construct descriptors. This strategy enhances the distinguishability of descriptors, contributing to improved accuracy. Finally, the Marginalizing Sample Consensus (MAGSAC) method is utilized to establish corresponding points. This facilitates precise feature point matching by incorporating spatial relationship constraints. An iterative approach is employed to solve the homography matrix, resulting in high-precision image registration. A comparative analysis involving ten experiments on aligning heterogeneous remote sensing images demonstrates that our proposed method significantly outperforms other algorithms. Notably, our approach attains superior results in terms of matching accuracy.
Feb. 28, 2025Vol. 40 Issue 1 144 (2025)
Qinyao SUN, Xiumei ZHONG, Jinlian MA, Yan WANG, Xiaowei XU, Songhan WU, and Qian WANG
The rural buildings are the most important disaster recipient in the earthquake disaster, it has significant meaning in the fields of earthquake resistance and hazardous reduction to obtain the information like the type and distribution of it. Based on GF-2 high-resolution remote sensing data, the ESP (Estimation of Scale Parameter) algorithm and Seath(Seperability and thresholds) algorithm are used to determine the optimal image segmentation scale and construct the optimal feature learning space. The decision tree classification method and random forest machine learning classification method were chosen to extract and classify rural building structures in Xiangnan Town, Gansu Province,in early May 2021. Unmanned aerial survey and on-site investigation data were used to verify and refine the accuracy of the classification results. The results show that: ①Both methods can better identify brick-concrete buildings with uniform spatial distribution, large area and bright color, but for civil buildings with chaotic distribution and relatively concentrated, gray color and small area (brick-wood buildings) are difficult to effectively identify their boundary contours and accurately classify them. ② The accuracy and Kappa coefficient of the two methods for building classification in the study area are 84.42%, 86.82% and 0.701 5, 0.759 1, respectively, and the random forest-based method has less misclassification and missing phenomenon when extracting building information. Therefore, the random forest method is more suitable for rural building classification.
Feb. 28, 2025Vol. 40 Issue 1 192 (2025)
Huajun LIANG, Qiang BIE, Ying SHI, Xinru DENG, and Xinzhang LI
The next-generation satellite LiDAR systems, including the Ice, Cloud, and land Elevation Satellite-2 (ICESat-2) and the Global Ecosystem Dynamics Investigation (GEDI), offer unique advantages in estimating forest canopy height. The fusion of these two LiDAR datasets not only increases the sample size for canopy height retrieval but also allows for spatial complementarity between different datasets. First, the Random Forest-Recursive Feature Elimination (RF-RFE) method was used to select photon feature parameters. Subsequently, five fusion models—Stepwise Linear Regression (SLR), Random Forest (RF), Light Gradient Boosting Machine (LightGBM), Random Forest with Stepwise Linear Regression (RF-SLR), and Particle Swarm Optimization Random Forest (PSO-RF)—were analyzed for their applicability. The optimal model was selected to construct a point-scale canopy height dataset, which was then combined with multi-source remote sensing imagery to map the canopy height in Qilian Mountain National Park. Finally, the retrieval results were compared with existing canopy height products using GEDI footprint data and field survey data. The results showed that: (1) the Particle Swarm Optimization Random Forest (PSO-RF) model provided the best fusion performance (R2 = 0.71; RMSE = 3.15 m; MAE = 2.66 m); (2) the retrieval model based on PSO-RF fusion of point-scale canopy height data achieved the highest accuracy (R2 = 0.56; RMSE = 3.02 m; MAE = 2.38 m); (3) compared to existing canopy height products, the retrieval results demonstrated higher accuracy (based on GEDI footprint data: R2 = 0.43; RMSE = 4.50 m; MAE = 3.59 m), and the errors were smaller when compared to field survey data (R2 = 0.36; RMSE = 3.15 m; MAE = 2.56 m). The findings reflect the spatial distribution pattern of vegetation in Qilian Mountain National Park and provide scientific support for forest resource management, carbon sequestration estimation, and ecological resource conservation.
Feb. 28, 2025Vol. 40 Issue 1 202 (2025)
Wenhao AI, and Xinghua LI
High resolution optical images are susceptible to imaging conditions and changes in ground features, resulting in geometric and radiative distortions which are difficult to ignore. Traditional registration methods are difficult to ensure accuracy and stability. Therefore, this study fully utilizes the advantages of phase congruency in the geometric structure expression of images, proposes a registration algorithm based on multi-directional phase congruency, uses Log-Gabor filter to calculate the phase congruency and minimum moments of images in different directions, further extracts image corners through multi threshold constraints, and constructs descriptors that are weakly sensitive to radiation and rotation to achieve complex radiation Matching homonymous features in geometric distortion scenarios, and finally using matching features to solve local registration models. Multiple experiments based on GF-1/2/6/7 images have demonstrated that the proposed algorithm can achieve high-precision registration and is suitable for domestic high-resolution optical image registration tasks from different sources, scenes, and resolutions.
Feb. 28, 2025Vol. 40 Issue 1 226 (2025)
Daytime Sea Fog Recognition based on Multi-scale Feature Fusion Generation under Attention Mechanism
Yanhui HUANG, Randi FU, Xuyuan FANG, Caoqian YIN, Gang LI, and Wei JIN
To improve the accuracy of sea fog recognition, a daytime sea fog recognition method is proposed by using a generative adversarial network with multi-scale feature fusion under the attention mechanism. The method first generated cloud images for the mid-infrared channel using a conditional generation adversarial network to eliminate the solar radiation effects of the original daytime mid-infrared channel cloud images, allowing the visible, far-infrared, and mid-infrared channel cloud images to be comprehensively utilized for sea fog monitoring. On these grounds, the pyramid split attention mechanism was introduced into the UNet network to improve the performance of data feature extraction for the three input channels. At the same time, multi-scale atrous spatial pyramid pooling was used in the transition layer of the codec to enhance the generalization ability of sea fog recognition at different scales by multi-scale feature fusion of multiple paths. Finally, the discriminant network was introduced to supervise the generation network to achieve an accurate definition of the edge of sea fog. The experimental results show that the accuracy of sea fog detection in this method is improved compared with the traditional method, the Probability Of Detection (POD) reaches 94.16 %, the False Alarm Ratio (FAR) is 11.61 %, and the Critical Success Index (CSI) is 83.59 %, which provides a new idea for daytime sea fog recognition.
Feb. 28, 2025Vol. 40 Issue 1 258 (2025)
© Copyright 2018-2021 | Chinese Laser Press.
All Rights Reserved 沪ICP备15018463号-20