


Please enter the answer below before you can view the full text.


2025
Volume: 40 Issue 4
20 Article(s)
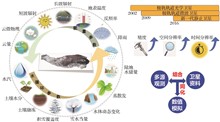
Satellite Remote Sensing Observation Research on Energy and Water Cycle on the Qinghai-Tibet Plateau
Jiancheng SHI, Lingmei JIANG, Jie CHENG, Tianjie ZHAO, Huizhen CUI, Jinmei PAN, yonghui LEI, Chaolei ZHENG, Luyan JI, Dabin JI, Yongqian WANG, Chuan XIONG, Tianxing WANG, Wei FENG, Yongqiang ZHANG, Xuanze ZHANG, Dongqin YOU, and Letu HUSI
The terrain of the “Asian Water Tower” area centered on the Qinghai-Tibet Plateau is complex and the weather is changeable. Especially in the alpine areas, ground observations are scarce. The existing remote sensing observation energy and water cycle elements lack a comprehensive systematic framework, and the accuracy is not high, making it difficult to obtain the understanding of the temporal and spatial distribution and variation characteristics of water balance in the Asian Water Tower area. Relying on the special project of “The Second Comprehensive Scientific Expedition to the Qinghai-Tibet Plateau”, systematic satellite remote sensing observation research on energy and water cycle in the Qinghai-Tibet Plateau was carried out. The development and sharing of satellite remote sensing datasets for 15 key elements of energy and water cycle were completed. The retrieval methods and technologies for each element were improved and developed. A satellite networking observation system for key elements of regional energy balance (6 types) and water cycle (9 types) in the Asian Water tower has been formed (including cloud, surface temperature, emissivity, radiation, albedo, Precipitation- Evapotranspiration, atmospheric water vapor, soil moisture, soil freeze-thaw, snow cover and snow depth, surface water change and terrestrial water storage, etc.), and a systematic remote sensing dataset of energy and water cycle elements with high precision, spatiotemporal continuity and high spatiotemporal resolution has been produced. The systematic analysis based on this dataset indicates that the multi-year average spatial distribution pattern of surface evapotranspiration on the Qinghai-Tibet Plateau is controlled by the precipitation distribution and shows a decreasing trend from southeast to northwest. Evapotranspiration is mainly controlled by moisture conditions in most areas (arid and semi-arid regions), and is dominated by radiation factors only in a few humid areas. The energy parameters that affect the evapotranspiration of the plateau and other factors of the water cycle, such as the downward long-wave radiation on the surface, show an increasing trend, while the surface reflectivity shows a decreasing trend, which has a significant correlation with the decreasing trend of snow coverage. In addition, key parameters of the water cycle such as atmospheric water vapor, soil moisture, lake area and land water storage all show a significant increasing trend, while snow coverage and the annual freezing days of the surface show a decreasing trend. Overall, since 2000, the Qinghai-Tibet Plateau has generally shown a trend of warming and humidification. The dataset provided in this paper is conducive to supporting the combination of remote sensing and models, and promoting the verification and improvement of models for regional climate-land surface and multi-sphere hydrology.
Aug. 20, 2025Vol. 40 Issue 4 761 (2025)
Peijun DU, Hong FANG, Shanchuan GUO, Chenghan YANG, and Pengfei TANG
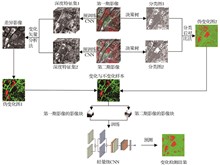
Change detection refers to the technology of extracting land cover changes by comparing and analyzing multi-temporal remote sensing images acquired at different periods covering the same area. With the advancements in satellite and sensor technologies, there has been a significant increase in Earth observation data. Change detection plays an important role in various fields, including geoinformation survey and ecological environment protection. In recent years, deep learning technology has become an advanced method for change detection due to its powerful feature mining ability. This paper provides a comprehensive overview of deep learning-based change detection methods from three aspects: pixel-level, object-level, and scene-level. Furthermore, this paper discusses the practical implementation of deep learning in change detection through three research examples. Finally, the study concludes by outlining future development trends in deep learning-based change detection.
Aug. 20, 2025Vol. 40 Issue 4 783 (2025)
Daojing LI, Anjing Cui, Huifeng SUN, and Yanchu YANG
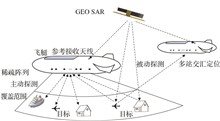
Airshipborne radars can continuously detect targets on land, sea and in the air, it can also carry out remote sensing of the earth by the synthetic aperture radar imaging mode under the moving state. Due to the limited power supply capacity of airships, large-size antennas are required to realize long-distance target detection and remote sensing, and the weight capacity limitation of the platform also puts forward high requirements for lightweight antennas. An aireshipborne active-passive combined target detection system concept based on a sparse array is proposed especially for the low and medium altitude airship platform, which detects passively with the geo-synchronous earth orbit synthetic aperture radar being the external radiation source, the system performance under different working modes is analyzed, the method of installing the subarray antennas on the hull is presented,and the prototype manufacture and integrated installation on the hull of the lightweight antenna array are introduced.
Aug. 20, 2025Vol. 40 Issue 4 795 (2025)
Hongliang FANG
Over the past two decades, studies about the spectral invariant theory have been developed rapidly in vegetation remote sensing. The theory has been widely used in vegetation parameter measurement, canopy reflectance modeling, and biophysical parameters retrieval. A review paper titled "Photon recollision probability and the spectral invariant theory: Principles, methods, and applications" was published by the author in “Remote Sensing of Environment” in 2023 (DOI: 10.1016/j.rse.2023.113859). The current paper provides a comprehensive overview of the background of spectral invariant theory, general principles of the theory, determination and applications of spectral invariants. Recent progresses of the theory are summarized and potential future developments are discussed. A special section is dedicated to the researches made by Chinese scholars. The goal is to provide a synthetic overview of the theory. Some new thoughts about the theory are also given in the paper.(1) The spectral invariant theory evolves from the successive orders of scattering approximation method of the multiple scattering process of photons in vegetation canopy. The theory faciliates the conversion of spectral parameters between different spectral bands and different scales (mainly between leaves and canopy) and provides new means for calculating the directional reflectance, albedo, and fluorescence escape probability.(2) Spectral invariants can be obtained through empirical methods, spectral methods, and structural methods. The spectral method is divided into single scale spectral method and spectral scaling method, and the structural method is divided into the Silhouette to Total Area Ratio (STAR) method, clumping index method, Stenberg method, and approximation method. Different methods can be cross-validated.(3) The spectral invariant theory has been applied in a number of canopy reflectance models. Based on these models, researchers have carried out a large number of inversion studies for vegetation structural parameters and physiological parameters. The principles, methods and applications of the theory can be further explored in the future.(4) New approximation methods for the spectral invariants are proposed and new formulae for the visible sunlit leaf area index and the hemispherical directional area scattering factor are summarized. Chinese researchers have made significant contribution to the development of the theory, especially in calculating the escape probability of the solar induced fluorescence using the theory.
Aug. 20, 2025Vol. 40 Issue 4 802 (2025)
Qian WANG, Peng ZHANG, Na XU, Lin CHEN, Yanmeng BI, Ronghua WU, Jianguo LIU, and Fuqi SI
The application of atmospheric composition data obtained from spaceborne remote sensors in climate and atmospheric environment research has promoted the rapid development of atmospheric composition remote sensing from visible, shortwave infrared to ultraviolet band, and from channel sensing to hyperspectral detection technology. The requirement for quantitative application of hyperspectral data is accurate spectral and radiometric calibration. Compared with the relatively mature calibration technology for visible and shortwave infrared remote sensors, calibration in ultraviolet band is significantly affected by the stability of the on-orbit calibration device, and atmospheric ozone absorption. Thus on-orbit calibration technology for ultraviolet hyperspectral remote sensing data is a challenging issue that urgently needs breakthrough. This paper presents the review made in on-orbit calibration methods for ultraviolet satellite remote sensors. It highlights the development of on-orbit spectral and radiometric calibration techniques, as well as alternative calibration approaches. The paper also compares the advantages and shortcomings of various calibration methods used in visible band remote sensing satellites, and analyzes the applicabilities and challenges of calibration in ultraviolet band. In light of the development of new-generation atmospheric composition remote sensors, the paper proposes major challenges that need to be solved for on-orbit calibration, with a focus on hyperspectral ultraviolet atmospheric composition remote sensing, which have important guidance for the improvement of ultraviolet spaceborne remote sensors and the enhancement of the calibration accuracy of ultraviolet remote sensors.
Aug. 20, 2025Vol. 40 Issue 4 835 (2025)
Shangrong LIN, Yuan TAO, Yi ZHENG, and Xing LI
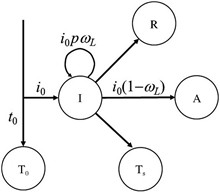
Terrestrial Gross Primary Production (GPP) is the total amount of organic carbon fixed by plant photosynthesis, and it is also the start of terrestrial carbon cycles. The remote sensing data-driven GPP models can accurately monitor the spatio-temporal pattern of GPP at the regional scale. The remote sensing data-driven GPP products support the studies of terrestrial carbon cycles, ecosystem responses to climate change and ecosystem service. However, large discrepancies in absolute magnitude, spatial distribution, and interannual variability in remote sensing data-driven GPP models lead to a large uncertainty in the estimation of global GPP. The uncertainty mainly stems from the fact that different researchers have adopted different modeling frameworks and assumptions, different remote sensing data sources, and different research periods, and thus researchers have come up with diverse conclusions. For this reason, it is necessary to summarize the results of existing representative studies to form a knowledge base and understanding of the remote sensing data-driven GPP models and their applications at the macro-scale level. Meanwhile, this study also discusses the common problems in current remote sensing data-driven GPP models and provides an outlook for future model developments.
Aug. 20, 2025Vol. 40 Issue 4 851 (2025)
Qingwang WANG, Junlin OUYANG, Pengcheng JIN, and Tao SHEN
This study proposes a novel method to joint utilization of visible and thermal infrared images from UAV perspectives. The method involves the development of a multimodal semantic segmentation model, termed CDFNet, which is designed based on cross-modal feature decoupling and attention refocusing. A cross-modal feature decoupling module is introduced to explicitly disentangle and enhance complementary discriminative features from different modalities, thereby improving the representational capacity of fused features in complex urban scenes. Furthermore, a focalizing attention decoder is incorporated to dynamically refine the attention scope towards small-scale objects during decoding, thereby effectively mitigating the interference from noisy backgrounds. Extensive experimentation on the Kust4K dataset demonstrates that CDFNet achieves mIoU improvements of 6.3% and 3.1% over the baseline and the current state-of-the-art multimodal method Sigma, respectively. Feature visualization and modality robustness evaluations further confirm that CDFNet yields more robust feature representations under low signal-to-noise conditions and significantly enhances segmentation accuracy for small targets in challenging urban road scenes from UAV perspectives.
Aug. 20, 2025Vol. 40 Issue 4 864 (2025)
Shiwei LIU, Kaishan SONG, Chunlan XIONG, Ge LIU, Hui TAO, Yingxin SHANG, and Zhidan WEN
Since the Industrial Revolution, both natural and anthropogenic factors have contributed to the increase in greenhouse gas emissions, resulting in a series of environmental issues such as global warming.The global oceans have been confirmed as the primary sink for atmospheric CO2, capable of absorbing approximately one-fourth of anthropogenic CO2 emissions. In contrast, inland water bodies, acting as a source of atmospheric CO2, emit greenhouse gases equivalent to nearly 20% of global fossil fuel CO2 emissions.The accurate estimation of surface water CO2 partial pressure (pCO2) is a prerequisite for studying the carbon flux and source-sink patterns in various water bodies. Since the 1990s, researchers have accumulated a substantial amount of measured pCO2 values. This solid dataset has laid the foundation for a deeper understanding of the influencing mechanisms of water body pCO2 and the development of estimation models.Remote sensing, with its capability for large-scale and long-term observations, is currently the mainstream method for estimating water body pCO2. This involves inferring pCO2 through the remote sensing retrieval of relevant environmental variables. This paper begins by elucidating the environmental variables and relevant physicochemical processes that influence water body pCO2, providing the theoretical foundation for parameterizing pCO2. Subsequently, it summarizes remote sensing retrieval algorithms for pCO2 in different types of water bodies. While these algorithms have matured in studies over the open oceans and developed a series of empirical or semi-analytical models for nearshore waters, there is relatively less research on remote sensing retrieval algorithms for inland water bodies. This scarcity can be attributed to the complex optical properties and spatiotemporal variability of pCO2 in inland water bodies. Given the significance of inland water bodies in the global carbon cycle, researchers should pay greater attention to remote sensing estimation studies of pCO2 in these inland water systems.
Aug. 20, 2025Vol. 40 Issue 4 875 (2025)
Sining QIANG, Yingxin SHANG, Zhidan WEN, Ge LIU, and Kaishan SONG
Colored Dissolved Organic Matter (CDOM) exhibits unique optical properties and significant advantages in remote sensing monitoring. However, notable differences exist in the optical characteristics of different CDOM types. This study systematically summarizes CDOM features in global water bodies and various lake types through literature review. This study demonstrates that models established based on aquatic optical properties under different natural geographical zones can more accurately identify the key factors for CDOM variation patterns. This research provides theoretical foundations for regional CDOM monitoring and water quality assessment through remote sensing techniques.
Aug. 20, 2025Vol. 40 Issue 4 886 (2025)
Haoming QIN, Kaishan SONG, Ge LIU, Zhuoshi LI, and Chong FANG
In the past few decades, water bodies around the world have continued to suffer from systemic pollution and severe water quality deterioration. Total phosphorus is one of the important indicators for water quality evaluation and an important factor affecting water eutrophication and cyanobacteria bloom outbreaks. This paper discusses the relationship between total phosphorus and other optical water quality parameters, the remote sensing inversion of total phosphorus concentration in different water body types, the remote sensing algorithm of total phosphorus concentration, and the remote sensing inversion of total phosphorus concentration on different remote sensing platforms. Since the 1990s, there have been more than 300 documents on total phosphorus concentration inversion. In recent years, research hot spots have gradually focused on topics such as “remote sensing technology” and “machine learning”. For the study of inland lake water bodies, Landsat/TM and MODIS images are mainly used. Among them, the accuracy of models using the combination of green band, near-infrared band and mid-infrared band is generally higher. Observing the total phosphorus concentration of global lakes through satellite image data, it was found that the total phosphorus content of global lakes is generally on the rise, with the highest phosphorus content in Asian lakes, followed by South America, Africa and Europe. No significant increasing trend was found in Oceania. With the development of computer technology, machine learning algorithms have gradually become a current hot topic. Compared with traditional algorithms, models built using machine learning algorithms are more accurate. The random forest algorithm is widely used because the model it builds has higher accuracy than other machine learning algorithms. With the continuous development of research, the construction of a total phosphorus concentration model suitable for different water types is the general trend in the future, and the development of sensors with high spatial resolution and high temporal resolution is even more urgent.
Aug. 20, 2025Vol. 40 Issue 4 900 (2025)
Zhenghua CHEN, Sixiang LAN, Jinshui ZHANG, Wei ZHANG, Huade LI, and Lifang ZHAO
Black and odorous water is an extreme water pollution phenomenon that is a common problem in many cities, seriously affecting the well-being and satisfaction of residents. Therefore, addressing the issue of urban black and odorous water is urgent. Scientifically monitoring the urban black and odorous condition of water is the first step in the remediation of black and odorous water, providing accurate targets for subsequent assessment. Compared to traditional ground-based monitoring methods, remote sensing is a more effective way to discover black and odorous water, allowing for a wider and more rapid identification of black and odorous water areas and timely comprehensive representation of the spatiotemporal evolution of black and odorous water. This paper reviews the main research advances in remote sensing monitoring of urban black and odorous water. First, it briefly introduces the overview of black and odorous water, summarizes the remote sensing feature, and common data sources for urban black and odorous water. Second, it discusses in detail the methods for remote sensing identification and classification of urban black and odorous water and compares the applicability and advantages and disadvantages of each method. Finally, it summarizes the current status of remote sensing research on urban black and odorous water and its shortcomings and looks forward to future development directions. The aim is to provide reference and thinking for related research and better decision support for the long-term management of black and odorous water.
Aug. 20, 2025Vol. 40 Issue 4 909 (2025)
Jing YANG, Hui ZHAO, Yaohua LUO, and Jundi WANG
The classification of wetlands with high-resolution images is one of the research hotspots of remote sensing classification. Aiming at the complex mottling of high-resolution image wetlands and wetland hydrological boundaries fluctuate seasonally, the traditional classification of high-resolution image wetlands adopts the manual extraction feature interpretation method, which is time-consuming, laborious and has low accuracy. Therefore, how to achieve automatic and efficient interpretation of wetlands is an urgent problem to be solved. In recent years, with the rapid development of artificial intelligence technology, the use of deep learning to achieve high-resolution image wetland classification has become a new research direction. In order to promote the development of high-resolution image wetland classification technology, the latest research results of deep learning models commonly used in high-resolution image wetland classification, including deep neural networks, convolutional neural networks, and generative adversarial networks, are summarized, and the application and innovation of various deep learning models in high-resolution image wetland classification were analyzed and discussed, such as the application of ensemble learning and the construction of semi-supervised models. Finally, from the aspects of samples and models, the problems of deep learning in the classification of wetlands with high-resolution images and the possible research trends in the future are prospected.
Aug. 20, 2025Vol. 40 Issue 4 923 (2025)
Jingwei SONG, Changhua LIU, Pengfei ZHAN, and Chunqiao SONG
As the main surface water resource carrier, lakes play an important role in regulating river water volume and meeting water demand for life, production and ecology. Similarly, artificial lakes (reservoirs) also play a key role in water supply, irrigation, power generation and ecological protection. In recent years, affected by climate change and human activities, the water volume and quality of lakes and reservoirs (referred to as "lakes and reservoirs") have changed greatly. Long-term remote sensing monitoring can more objectively and accurately understand the temporal and spatial changes. The study combined multi-source remote sensing image data and satellite altimetry data to extract the area and water level of China's key monitored lakes (83) and reservoirs (118) from 2013 to 2022, estimated the changes in the water volume of lakes and reservoirs, and sorted out the monitoring data of key lakes and reservoirs through the monthly water quality reports issued by relevant national departments, analyzed the changes in their eutrophication levels, and finally conducted a comprehensive analysis of the two. The results show that: in terms of water volume, the water volume of China's key lakes and reservoirs showed an overall increasing trend during 2013~2022, with the water volume of lakes increasing by 10.65 km³ and the water volume of reservoirs increasing by 2.50 km³; in terms of water quality, the water quality of most monitored lakes was poor, ranging from mesotrophic to mildly eutrophic, and the number of lakes with mesotrophic to mildly eutrophic levels generally increased year by year; the water quality of reservoirs was relatively good, but the water quality of some reservoirs showed a trend of deterioration. The combined analysis of water volume and water quality change information found that the water volume of lakes and reservoirs changed greatly when they were at the mesotrophic level, and there were different correlations between water volume and water quality. Among them, the water volume and water quality changes of 33 lakes showed a negative correlation, especially Chengxi Lake and Shijiu Lake in the eastern plains, with correlation coefficients of -0.67 and -0.90, respectively. In addition, the water volume and water quality changes of nearly half of the reservoirs showed a positive correlation. By combining the water quantity and water quality monitoring data of lakes and reservoirs and exploring the relationship between the two, we can provide an important scientific basis for the comprehensive water resources management and ecological protection of lakes and reservoirs.
Aug. 20, 2025Vol. 40 Issue 4 936 (2025)
Mengjie REN, and Hanqiu XU
The Tasseled Cap Transformation (TCT) is a widely used remote sensing image processing technique. For Landsat 8 satellite imagery, three TCT algorithms have been proposed by Baig et al., Zhai et al., and Liu et al., respectively. However, the consistency among these three algorithms remains unclear, leaving users uncertain about which one to choose. Additionally, while Zhai et al. provided an algorithm based on Surface Reflectance (SR) data, the other two algorithms are only applicable to Top of Atmosphere (TOA) reflectance data. It is thus essential to verify whether the TOA-based algorithms can be applied to SR data. To address these issues, three Landsat 8 images with different land cover types were selected, and three TCT algorithms were applied. The inversion results were quantitatively compared to identify differences among the algorithms. The results show that the Baig and Zhai algorithms exhibit the highest consistency, with an average R² of 0.974 4 and an average RMSE of 0.025 for the three components. In contrast, the inversion results of the Liu algorithm exhibit significant differences compared to those of the Baig and Zhai algorithms. The average R² values between Liu and Baig, and between Liu and Zhai, are 0.803 1 and 0.865 2, respectively, while the average RMSE values are 0.077 6 and 0.065 5, respectively. Therefore, the inversion results of Baig and Zhai are more comparable. Furthermore, applying the TOA-based TCT algorithms of Baig and Liu to SR data reveals substantial differences between the components derived from SR and TOA reflectance, with RMSE reaching 0.053 5 and an average |PC| of 146.07%. Thus, it is not recommended to use the TOA-based algorithms of Baig and Liu for TCT on SR data. In conclusion, the algorithm proposed by Zhai et al., which is applicable to both TOA and SR reflectance data, is recommended for Landsat 8 TCT applications.
Aug. 20, 2025Vol. 40 Issue 4 956 (2025)
Chengquan ZOU, Jiangcheng HUANG, Zhengbao SUN, and Yutong YANG
The super-resolution reconstruction of remote sensing images is a type of method that uses image analysis methods to reconstruct high-resolution images from one or more low resolution images, in order to restore high-frequency details lost during sensor imaging, storage, and transmission, and improve the quality of remote sensing image data. The core lies in constructing a mapping relationship between high- and low- resolution images. This paper reviews the mainstream methods and representative research works in image super-resolution reconstruction and focuses on analyzing the recent advances in traditional methods and deep learning methods in the field of remote sensing image super-resolution reconstruction. The results indicates that: (1) Methods based on deep learning frameworks are the main focus and frontier of research in remote sensing image super-resolution reconstruction methods; (2) Model lightweighting and real-time performance are the main challenges faced by super-resolution reconstruction methods for multispectral remote sensing images in complex scenes; (3) There is an urgent need to construct public datasets for research on remote sensing image super-resolution reconstruction methods and to improve the evaluation index system. In addition, this paper also discusses the effects of methods based on bicubic interpolation, CNNs, GANs, and DPMs frameworks on remote sensing image super-resolution reconstruction in complex scenes through experiments.
Aug. 20, 2025Vol. 40 Issue 4 969 (2025)
Yanguo FAN, Yuan LI, Sijia LI, and Hongliang FANG
The forest canopy structure parameters play a crucial role in global ecological assessments and are important factors influencing the redistribution of solar radiation. LAI-NOS is an automatic observation system for Leaf Area Index (LAI) based on digital hemispherical photography. To test the applicability of LAI-NOS to different forest types and further explore its capability in estimating other canopy structure parameters, this research focused on typical forest types at the Qianyanzhou Subtropical Forest Ecosystem Research Station of the Chinese Academy of Sciences. Continuous observation data of vegetation canopy structure parameters throughout a complete vegetation growth cycle were obtained. Canopy structure parameters such as gap fraction, leaf area index, and clumping index were calculated based on the digital hemispherical photography. The results showed that the parameter estimation results were generally consistent with the growth patterns of the four forest types. The study demonstrated that continuous automatic observation of forest canopy structure parameters based on LAI-NOS is a feasible and effective method, which can provide important data support for forest ecosystem research and management.
Aug. 20, 2025Vol. 40 Issue 4 990 (2025)
Junying SONG, Xiufang ZHU, Mingxiu TANG, and Rui GUO
Real time and accurate monitoring of forest disturbance plays an important role in maintaining a healthy and stable cycle of forest ecosystem. Constructing and selecting the optimal feature variables is an important step in forest disturbance monitoring.This study focused on three typical types of forest disturbance: forest fires,deforestation, and forest geological disasters. Based on Sentinel-1 and Sentinel-2 data,116 features of four categories were calculated, including spectral features,texture features, index features,and scattering features.The JM(Jeffries-Matusita) distances were used to evaluate the separability of each feature between disturbed and non-disturbed samples. Features were ranked in descending order of JM distance and sequentially added to a One-class Support Vector Machine(One-class SVM) classifier for disturbance classification and accuracy evaluation. By integrating JM distance and classification accuracy, the best features for monitoring each type of forest disturbance were analyzed, and Principal Component Analysis(PCA) was applied to compress features, constructing optimal features simultaneously applicable to all three disturbance types.The research results indicated that spectral features,texture features,and index features had higher contributions compared to scattering features in the three types of forest disturbance.With the increase of the number of features, the monitoring accuracy tended to stabilize or even decrease after significant improvement. After feature compression, the optimal features simultaneously applicable to all three disturbance types were the first principal component of Band6, Band7, Band8, Band8A, and Band9, the first principal component of mean texture features of Band6, Band7, Band8,Band8A,and Band9, and DVI. The recall rates of samples of forest fire,deforestation,and forest geological disaster based on the compressed optimal features were 90.57%,75.74%,and 79.07%,respectively,with corresponding F1 scores of 0.927, 0.855, and 0.694. This study provide a theoretical basis and methodological reference for feature selection in forest disturbance monitoring, significantly improving monitoring accuracy and efficiency. It holds important practical significance for the protection and management of forest ecosystems.
Aug. 20, 2025Vol. 40 Issue 4 1002 (2025)
Guoqi CHAI, Yanchen YANG, Lei WANG, Yong MA, and Xin TIAN
Automatic crown segmentation, rapid and accurate extraction of diameter at breast height, tree height, crown width and crown area are the basis for high-precision estimation of forest productivity and carbon stocks. Near-ground remote sensing technology allow rapid and efficient acquisition of high-resolution data from multiple views, which have the potential for high-precision acquisition of forest parameters. Summary of domestic and international forest fine survey using ground and manned /unmanned aircraft remote sensing technology. Comprehensive description of the current status of research on fine acquisition of forest parameters based on near-ground remote sensing. Discussions focus on the algorithms for acquiring forest parameters based on near-ground remote sensing platform multispectral and LiDAR data, and compare their application scenarios and advantages and disadvantages. Near-ground remote sensing technology possesses the capability to acquire detailed forest parameters with low costs and high efficiency, providing crucial technical support for forest management, cultivation, operational decision-making, and accelerating the advancement of building a Beautiful China.
Aug. 20, 2025Vol. 40 Issue 4 1015 (2025)
Yudi YANG, Ying GUO, Xin TIAN, Qingwang LIU, Guoqi CHAI, Jianwen HUANG, Xin LUO, Shuxin CHEN, and Haiyi WANG
Forest ecosystems play a crucial role in regulating climate, maintaining water and soil, and balancing carbon. However, in recent years, this system has been increasingly disturbed by climate change and human activities, making precise and timely forest change monitoring urgently needed. Remote sensing technology, with its advantage of multi-temporal resolution data and automated processing capabilities, has become a key means for forest change detection. This paper focuses on multi-temporal resolution remote sensing change detection methods, systematically reviews and compares two types of technologies: bi-temporal and time series remote sensing. Bi-temporal change detection includes manual visual interpretation, traditional machine learning, and deep learning techniques; time series include research on temporal trend analysis, dynamic change monitoring, and multi-algorithm integration. By summarizing the related problems of deep learning and multi-modal time series data in practical applications, relevant solutions are proposed, providing references for improving the accuracy of forest change detection.
Aug. 20, 2025Vol. 40 Issue 4 1026 (2025)
Ming SHI, Yang SHI, Fei LIN, Xia JING, Yimin HU, and Bingyu LI
Soil Organic Matter (SOM), a vital component of the soil solid phase, provides essential nutrients for plant growth and serves as a key indicator of soil fertility. Recent advancements in remote sensing technology have introduced novel approaches for efficient SOM estimation and mapping, yet challenges persist due to environmental interference and data complexity. This review systematically examines the applications of multispectral and hyperspectral data in SOM inversion and mapping, alongside critical data processing methodologies. Comparative analyses demonstrate that laboratory-acquired spectral data under controlled conditions exhibit significantly higher model accuracy and robustness compared to field-collected data, attributed to stable measurement environments. Feature selection and extraction, particularly for hyperspectral datasets, enhance inversion precision by mitigating data dimensionality and multicollinearity. Ensemble modeling frameworks integrating machine learning and deep learning outperform single-model approaches by effectively characterizing the nonlinear complexity of soil systems. Multi-temporal datasets further improve predictive capabilities by incorporating seasonal vegetation dynamics and temporal evolutionary patterns. However, optical data remain susceptible to atmospheric disturbances, especially in cloud-prone regions such as southern China, while microwave remote sensing emerges as a complementary solution for its all-weather operability and topographic adaptability. Future research should prioritize multi-source synergy strategies, including optical-SAR synergies, multi-sensor platform integration, and physics-informed machine learning to address confounding factors like crop residue cover and soil moisture. Advanced preprocessing techniques, such as wavelet analysis and blind source separation, are essential for isolating soil-specific spectral signatures. Spatiotemporal modeling frameworks that integrate soil types, agronomic practices, and climatic variables will enhance prediction generalizability. Concurrently, developing interpretable artificial intelligence models and geographically adaptive spatial interpolation methods is crucial to ensure scientific rigor and global scalability. This study provides theoretical and practical insights for leveraging multi-source remote sensing in precision agriculture and sustainable land management.
Aug. 20, 2025Vol. 40 Issue 4 1052 (2025)
© Copyright 2018-2021 | Chinese Laser Press.
All Rights Reserved 沪ICP备15018463号-20