


Please enter the answer below before you can view the full text.


2024
Volume: 44 Issue 16
38 Article(s)

Guocong Lou, Candong Liu, and Yinghui Zheng
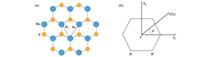
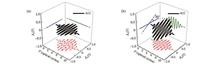
ObjectiveIn recent years, with the development of mid-infrared laser technology, experimental measurements of solid-state high-order harmonics have been conducted in various materials, such as crystalline materials, two-dimensional materials, and topological materials. Compared to gases, solid-state high-order harmonics exhibit unique properties, including even-order harmonic generation, linear cutoff law, anomalous ellipticity dependence, and multi-plateau structures. Among these materials, monolayer MoS2 as a direct bandgap two-dimensional material possesses large exciton binding energy and strong spin-orbit coupling effects. Due to the breaking of inversion symmetry, its Brillouin zone contains two inequivalent energy valleys of K and K'. The rich characteristics of monolayer MoS2 have brought extensive research in recent years. Therefore, we employ tight-binding approximation and the density matrix equation under the velocity gauge to theoretically calculate the high-order harmonics generated in monolayer MoS2 under a bichromatic field. By adjusting the bichromatic field delay, we observe the intensity of the generated high-order harmonics as a function of the delay. We find that under different driving field polarization directions, the oscillation period of the high-order harmonics varies. Additionally, we propose an intuitive model to explain this phenomenon. Furthermore, we extract the amplitude and phase information of even-order harmonic oscillations parallel and perpendicular to the polarization direction of the driving field. We discover that the intensity ratio of the second harmonic with respect to the fundamental field exerts different effects on the phase of the even-order harmonic in parallel and perpendicular directions. Our theoretical calculations indicate that adopting a bichromatic field as the driving field for interacting with monolayer MoS2 not only introduces the competition between the incident field and the medium’s inversion symmetry but also encompasses the contribution of Berry curvature in the perpendicular direction to the even-order harmonic. Finally, this approach aids in further understanding the dynamic processes in solid materials.MethodsThe atomic structure of monolayer MoS2 in a top-down view is depicted in Fig. 1(a), where Mo atoms and S atoms are arranged alternately in a two-dimensional hexagonal honeycomb lattice structure. Fig. 1(b) illustrates the first Brillouin zone of monolayer MoS2, which contains two high-symmetry points K and K'. The band structure of monolayer MoS2 is obtained from a three-band tight-binding model that includes third-nearest-neighbor Mo-Mo hopping, as shown in Fig. 2. This model fits the band structure calculated throughout the Brillouin zone using the local density approximation (LDA) and generalized gradient approximation (GGA) methods. Under the independent-particle approximation, we utilize the density matrix equation in the velocity gauge to simulate the process of monolayer MoS2 interacting with a bichromatic field to generate high-order harmonics.Results and DiscussionsFig. 3 depicts the high-order harmonic spectra of the fundamental and second harmonics along the Γ—K direction with different intensity ratios of the second harmonic and fundamental fields. The intensities of each harmonic are normalized, and the delay between the second harmonic and fundamental fields is given in units of the fundamental field period. Additionally, we observe oscillations of each harmonic along the parallel and perpendicular directions with the delay between the second harmonic and fundamental fields oscillating four times within one fundamental field period. This can be explained by an intuitive model. As shown in Fig. 4, the fundamental and second harmonic fields propagate together in monolayer MoS2. Since both are polarized along the Γ—K direction in monolayer MoS2, which possesses inversion symmetry in the Γ—K direction, the coherent combination field reaches its maximum either upward or downward a quarter of the fundamental field period after a change in delay between the two, which results in four oscillations within each fundamental field period. By employing a least squares fitting, we can obtain the amplitudes and phases of the oscillations of even-order harmonics, as shown in Fig. 5. Fig. 5(c) indicates that in the parallel direction, the intensity ratio changes of the second harmonic to the fundamental field (increasing from 0.001 to 0.01) alter the dominant phase of the even-order harmonic oscillations. This is because when the second harmonic and fundamental fields are polarized parallelly and along the Γ—K direction, the even-order harmonics in the parallel direction are generated due to the breaking of the inversion symmetry of the driving field by the competitive relationship between the second harmonic and fundamental fields. Thus, as the intensity ratio of the second harmonic to the fundamental field increases, the disturbance of the fundamental field by the second harmonic becomes stronger, thus changing the dominant phase of the even-order harmonic oscillations. As shown in Fig. 5(d), we can observe that in the perpendicular direction, the dominant phase is ?2. The intensity ratio variation of the second harmonic to the fundamental field only causes minor changes in the oscillation of ?2 with the harmonic order, which is different from the parallel direction. This is because when the second harmonic and fundamental fields are polarized parallelly and along the Γ—K direction, the even-order harmonics in the perpendicular direction are generated by the anomalous currents. The anomalous current is equal to the product of the net Berry curvature and the electric field intensity, where the Berry curvature determines the dominant phase in the even-order harmonic oscillations. As the intensity ratio of the second harmonic to the fundamental fields rises, the net Berry curvature remains unchanged, and the dominant phase in the even-order harmonic oscillations consistently remains at ?2. Fig. 6 depicts the high-order harmonic spectra in the parallel direction of the fundamental and second harmonic fields with polarization along the Γ—M direction under different intensity ratios of the second harmonic and fundamental fields. As shown in Fig. 6(a), when the intensity ratio is small (0.0001, 0.001), the even-order harmonics oscillate four times within one fundamental field period. However, Fig. 6(b) reveals that when the intensity ratio increases (0.01, 0.05), the even-order harmonics oscillate twice within one fundamental field period, which indicates that the intensity ratio change can alter the oscillation period of the even-order harmonics. When the intensity ratio is small (0.0001, 0.001), we can still explain this by adopting the intuitive model in Fig. 4. The fundamental and second harmonic fields propagate together in monolayer MoS2. Due to the polarization of both along the Γ—M direction, and the lack of inversion symmetry in the Γ—M direction of the monolayer MoS2, the interaction between the fundamental field and the medium itself has generated an asymmetric electric field. We can consider this as a competition between two broken inversion symmetries (the medium and the electric field), or a coherent effect generated by the asymmetric electric field and the incident second harmonic field. Fig. 4 demonstrates that since the amplitude of the asymmetric electric field in the upward direction is greater than that in the downward direction, the maximum field strength of the coherent combined field can only be achieved by delaying the second harmonic by half of the fundamental laser period. Therefore, after half of the fundamental field period, the coherent combined field reaches its maximum in the upward direction, resulting in two times of oscillation within each fundamental field period. When the intensity ratio increases to 0.01 and 0.05, the model in Fig. 4 is no longer applicable. To explore the reasons behind this, we calculate the contribution of the second harmonic to the harmonic generation rate at different intensity ratios by considering only the second harmonic, as shown in Fig. 7. In the case of a single-color field (only the second harmonic), it can be observed that the intensity of even-order harmonics is much lower than that of the bichromatic field (with an intensity ratio of 0.001). By taking the sixth harmonic as an example, we find its intensity in the single-color field is five orders of magnitude lower than that in the bichromatic field, as shown in Fig. 7(a). However, when the intensity ratio is 0.01, the contribution of the second harmonic field to the even-order harmonics in the bichromatic field increases. For the sixth harmonic, its intensity in the single-color field is only three orders of magnitude lower than that in the bichromatic field, as shown in Fig. 7(b). Therefore, as the intensity ratio increases from 0.001 to 0.01, the role of the second harmonic in even-order harmonics increases to change the oscillation period of even-order harmonics from two times of oscillation within one fundamental frequency field period to four times of oscillation. Finally, we extract the amplitudes and phases of the even-order harmonics in parallel directions as shown in Fig. 8. It can be observed that in the parallel direction, the change in the intensity ratio of the second harmonic to the fundamental field (from 0.001 to 0.01) leads to a shift in the dominant phase of the even-order harmonic oscillations from ?1 to ?2. This is because when the second harmonic and fundamental fields are polarized in parallel directions along the Γ—M direction, the even-order harmonics in the parallel direction are generated due to the breaking of inversion symmetry of the driving field, which brings a competitive relationship between the second harmonic and fundamental fields. Therefore, as the intensity ratio of the second harmonic to the fundamental field increases, the disturbance of the fundamental field by the second harmonic becomes stronger, leading to a shift in the dominant phase of the even-order harmonic oscillations.ConclusionsWe explore the influence of a bichromatic field on the high-order harmonic generation in monolayer MoS2 through theoretical calculations. We find that the oscillation period of high-order harmonics is related to the polarization direction of the bichromatic driving field (the Γ—K or the Γ—M directions), which is also associated with the inversion symmetry of the material itself. Specifically, when the driving field is polarized along the Γ—M direction, the oscillation period of the generated high-order harmonics is affected by the intensity ratio of the second harmonic and fundamental fields to shift from two times of oscillation within one fundamental field period to four times of oscillation. This is due to the enhancement of the second harmonic, which shifts from disturbing the fundamental field to becoming a controlling factor in the harmonic generation. Additionally, we investigate the phase of the even-order harmonics oscillating in parallel and perpendicular directions to the polarization of the driving field, and find that the phase of these two directions of even-order harmonics is differently affected by the intensity ratio of the second harmonic and fundamental fields, which is related to their generation mechanisms. Therefore, we not only contribute to understanding the structural information related to the inversion symmetry breaking in materials, but also deepens the understanding of the strong-field interaction mechanisms in solid materials. Finally, a new approach is provided for utilizing bichromatic fields to control ultra-fast electron dynamics in solids.
Aug. 25, 2024Vol. 44 Issue 16 1602001 (2024)
Mingchen Zhong, Wenqin Wan, Liangwen Pi, and Weichao Jiang
ObjectiveThe interaction between strong laser fields and matter has emerged as a prominent tool for probing the internal structure of atoms and molecules and field-induced ultrafast electron dynamics. During the multiphoton ionization of atoms and molecules by intense laser pulses, ionized electron wave packets from different paths interfere, resulting in complex interference patterns in the photoelectron momentum distributions (PMDs). Over the past decades, a prominent interference structure known as strong-field photoelectron holography (SFPH) has been observed. In molecule fields, researchers use holographic structures to probe molecular structure and orientation dynamics information, but no relevant literature has been found in the atomic field. By numerically simulating the interaction between the excited state 2pz of a hydrogen atom and linearly polarized laser pulses with different polarization directions, we can extract the structural information of atomic orbitals from the PMDs. In addition, we also discuss a feasible pump-probe scheme for experimental validation.MethodsTo simulate atomic ionization in a linearly polarized laser field, we numerically solve the three-dimensional time-dependent Schrödinger equation (TDSE) in the velocity gauge with dipole approximation. We use the finite-element discrete variable representation (FE-DVR) method to discretize the radial part of the wave function. For the time evolution of the wave function, we use the split-Lanczos method. After the laser pulse concludes, the ionization probability is extracted from the final wave function by projecting it onto the scattering state.Results and DiscussionsThe configuration of the present laser-atom interaction is illustrated in Fig. 1. The quantization axis of the state 2pz is along the z-axis. Two polarization directions of the laser pulse, Θ=0 [Fig. 1(a)] and π/6 [Fig. 1(b)], are presented. The wavelength, pulse duration, and peak intensity of the laser pulse are fixed to be 2000 nm, 10 optical cycles, and 1013 W/cm2, respectively. The PMDs at different angles Θ are given in Fig. 2. Different angles indeed give rise to different PMDs. We can observe the PMDs are symmetrical with respect to the laser polarization at Θ=0 and π/2 [Figs. 2(a) and 2(d)], while such symmetry is broken at Θ=π/6 and π/3 [Figs. 2(b) and 2(c)]. In the tunneling ionization regime, the symmetry of the distribution of the initial transverse momentum of electrons depends on the Fourier transform of the initial wave function. Based on adiabatic approximation theory, we found that the symmetry of both holographic and fan-shaped interference structures closely depends on the initial transverse momentum distribution of the direct electrons. Next, we investigate how tunneling filters with spherically symmetric and non-spherically symmetric orbits affect the initial transverse momentum distribution of electrons (Fig. 3). For the 2pz orbital, the transverse momentum k⊥|ψ2p is symmetric only when k‖=0 and is asymmetric for other values [Fig. 3(d)]. Clearly, the asymmetrical PMDs exactly mimic the asymmetrical momentum distribution of the initial orbital. To quantitatively study the correlation between the initial orbital and the PMDs, we define a parameter ΔY to describe the asymmetry. The research found that the asymmetry of the initial orbital, denoted as ΔY2p, qualitatively describes the changing trend of the ionized electron distribution ΔY with Θ increasing (Fig. 4). Therefore, the asymmetry parameter of the final electron reflects the information of atomic orbital structure. We extend our discussion to the multi-photon ionization and transition ionization regime in Fig. 5(a), the asymmetry parameter ΔY2p still well reproduces the Θ-dependence of the photoelectron asymmetry ΔY after extending the ionization from the tunneling to the multi-photon and transition regime. Therefore, we can generally conclude that the asymmetry in photoelectron distribution correlates with the asymmetry of the initial-state momentum distribution. We show the dependence of the asymmetry parameter ∆Y on the Keldysh parameter γ at a specific angle Θ=π/4 in Fig. 5(b). In the tunneling regime γ<1, the asymmetry parameter ∆Y is around 0.3 with slight fluctuations. However, the fluctuations become significant in the transition and multi-photon ionization regime γ>1. This is because in the transition and multiphoton ionization regions, there are multiple resonant ionization channels, making it difficult to maintain consistency between the PMDs and the initial transverse momentum distribution. Experimental verification of the present theoretical predictions requires a pump-probe scheme, as the excited state 2pz is not naturally largely populated. We should use a pump laser pulse to prepare the excited state 2pz before it interacts with the probe pulse. The configuration of the pump and probe laser pulses is illustrated in Fig. 6(a). The PMDs in the pump-probe scheme are shown in Fig. 6(b). We observe that the result is highly consistent with that in Fig. 2(c). To better understand the potential impact of the pump-probe method on extracting ionization electron asymmetry, we further investigated the influence of pump duration and the time delay between the two laser pulses on the extraction of asymmetry parameters in Figs. 6(c) and 6(d). We present a theoretical approach to probe atomic orbital structure information and investigate the correlation between atomic orbits and final state momentum distributions under different ionization mechanisms. Finally, we consider implementing feasible pump-probe detection schemes to validate its predictions.ConclusionsWe have theoretically investigated the photoionization of the excited state 2pz of hydrogen atoms by linearly polarized laser pulses. We identified asymmetrical PMDs with respect to the laser polarization direction. In the tunneling ionization regime, this asymmetry arises from the asymmetrical distribution of the initial orbital with respect to the polarization direction, resulting in an unequal transverse momentum distribution of the initial electrons. In both tunneling and multi-photon ionization regimes, the asymmetry parameter ∆Y of the PMDs as a function of the laser polarization direction Θ is qualitatively reproduced by the asymmetry parameter ΔY2p of the initial orbital. Our theoretical prediction could be experimentally verified in a pump-probe scheme. Our calculation indicates that the asymmetry parameter ∆Y of the PMDs can be well extracted even if the population of the excited state 2pz after the pump pulse ends is not large.
Aug. 25, 2024Vol. 44 Issue 16 1602002 (2024)
Haidong Zhang, Chengqiang Zhao, Yibin Zhang, Hongchao Cao, Yunxia Jin, Shijie Liu, and Jianda Shao
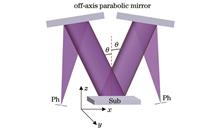
ObjectiveAs the core instrument for developing ultra-strong and ultrashort laser devices, the load capacity of the holographic grating entirely depends on the effective aperture of the pulse-width compression grating and the anti-laser damage threshold. Large-aperture holographic gratings are currently only available to the United States and Europe, with China facing an embargo. Domestic and international methods such as beam scanning exposure, static interference field transmission exposure, exposure splicing, and mechanical scribing have not been able to manufacture bidirectional meter-level gratings. Recently, researchers have applied large-aperture off-axis reflective collimators to the double-beam exposure system, overcoming the aperture limitations of large-aperture collimating lenses and offering convenient periodic adjustment advantages. Our study paves a new way for fabricating large-aperture diffraction gratings and lays a technical foundation for developing bidirectional meter-level pulse compression gratings required for hundred-petawatt-level high-power laser devices. However, the off-axis reflective exposure system presents an uneven exposure dose issue. Traditional methods address this by employing Gaussian spot center interception to achieve a highly uniform light field, which results in low energy utilization and increased exposure time. The increase in exposure time not only increases the stability requirements of the exposure system but also reduces the efficiency of the production grating. The rise of beam shapers has seen widespread use of schemes that convert Gaussian beams into flat-top beams in Lloyd’s mirror exposure systems. However, after shaping by the beam shaper, the Gaussian beam can no longer filter out stray light and high-order mode interference in the optical path using a spatial filter, affecting grating manufacturing quality. In this study, we propose a novel beam scanning homogenization method based on the existing large-aperture off-axis reflection exposure system. Post-scanning interference lithography allows for an evenly distributed light field intensity, equivalent to uniform exposure dose distribution.MethodsCombining the principle of light homogenization of new beam scanning, we numerically simulate the influence of different scanning parameters on the uniformity distribution of light field. A moving mirror mounted on an air-flotation translation stage achieves the two-dimensional scanning movement of the beam at the substrate position. Using a complementary metal oxide semiconductor (CMOS) sensor, we capture the light field distribution at the substrate position after beam scanning. Based on the new beam scanning interferometric exposure system, we conduct scanning homogenization experiments under various beam radii. We introduce reference light to lock fringe drift and analyze the regularity variation of fringe drift at different positions from time and frequency domain perspectives.Results and DiscussionsOur simulations indicate that when the ratio of the scanning beam radius to the step distance is less than or equal to 1.2, the uniformity of the light field after scanning stitching exceeds 99.50% (Fig. 3). With beam radius of 5 mm, 8 mm, and 15 mm corresponding to ratios of 1.1, 1.2, and 1.3, respectively, pattern data processing yields light intensity distribution curves (Figs. 6-7). The superimposed beam scanning quantitatively describes the uniformity of the light field’s intensity distribution, showing a uniformity better than 99.3% when the ratio of scanning beam radius to the step distance is less than or equal to 1.2 (Table 1). Excluding environmental factors, experimental and simulation results are generally consistent. Under identical proportional-integral-derivative (PID) parameters, fringe drift within a 150 mm×75 mm area is controlled at ±0.02λ(3σ), with a phase change less than ±0.02 interference fringe period namely (Fig. 8). Spectral analysis reveals that the introduction of closed-loop control effectively suppresses the 50 Hz low-frequency error at different positions (Fig. 8). Time-domain analysis of fringe drift shows that with an optimized exposure system, the phase change across a ϕ200 mm range is less than ±0.015 interference fringe periods (Fig. 9). Closed-loop control effectively suppresses the 20 Hz low-frequency error causing fringe drift (Fig. 9). Introducing reference light for fringe drift-locking significantly reduces environmental error impact during beam scanning.ConclusionsWe introduce a novel beam scanning homogenization method that controls the beam’s two-dimensional scanning motion via two one-dimensional mirrors mounted on an air-floating translation stage. The beam passes through the optical path system, which carries out the scanning superposition movement of the large spot on the substrate. This approach offers advantages such as reduced load and noise compared to moving large substrates, especially meter-sized ones. To verify the method’s feasibility, we conduct the homogenization experiment of beam scanning and the locking experiment of fringe drift. Results show that when the beam radius to the step distance is less than or equal to 1.2, the intensity uniformity of the light field surpasses 99%, indicating that the method can achieve a high uniform distribution of light intensity while making full use of the laser energy. Under identical PID control, the amount of fringe drift at different positions within a ϕ200 mm range is confined to ±0.015λ(3σ), effectively mitigating low-frequency errors caused by fringe drift. Enhancing the uniform distribution of the light field significantly improves the large-aperture off-axis reflection exposure system’s applicability, addressing uneven exposure dose and elevating grating manufacturing quality.
Aug. 25, 2024Vol. 44 Issue 16 1605001 (2024)
Haokun Yang, Shuang Wang, Kun Liu, Xueping Li, Zhiyuan Li, Junfeng Jiang, and Tiegen Liu
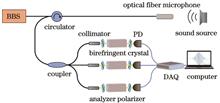
ObjectiveOptical fiber microphones hold significant practical value in applications like mine safety monitoring and disaster relief, where they must maintain stable performance despite external environmental interference. Many researchers have proposed diverse design schemes for optical fiber microphones, significantly enhancing their sensitivity, minimum detectable sound pressure, and directional recognition capabilities. However, there is still a lack of comprehensive research on the accuracy of continuous speech detection and the robustness of optical fiber microphone systems. These performance metrics are particularly critical in fields such as mine safety and disaster response. In environments like mines or disaster zones, not only must microphones be highly sensitive to capture low frequency or faint sounds, but also maintain stable performance amidst temperature fluctuations and other environmental factors. Moreover, speech signals in these scenarios are often complex and varied, demanding microphone systems with advanced signal processing capabilities to accurately discern key speech information. Therefore, it is essential to conduct robustness research on optical fiber microphones.MethodsIn this paper, we propose a highly stable optical fiber microphone sensing system based on polarization low coherence interferometry. The microphone designed for voice detection comprises a polyphenylene sulfide sensitive diaphragm and an optical fiber end face, forming a cross-correlation sensing system with a birefringent crystal based on polarization low coherence interferometry. By extracting the DC component of the interference signal through a birefringent crystal of known length, we effectively compensate for external environmental factors, thereby achieving high stability.Results and DiscussionsTo evaluate the frequency response characteristics of the experimental scheme, we test the optical fiber microphone across a frequency range of 0.02 to 20.00 kHz. The results, depicted in Fig. 2, demonstrate that the optical fiber microphone system effectively detects sound signals within this range, maintaining a signal-to-noise ratio (SNR) consistently above 50 dB across all frequencies. To assess its capability in detecting speech signals, we test continuous distress voice signals from both female and male subjects, as shown in Fig. 3. These findings highlight the system’s accurate capture and reproduction of voice signals over a wide frequency spectrum. Long speech signals are also compared with those captured by a reference microphone. Furthermore, the system’s performance under initial cavity length drift conditions is examined, with the outcomes presented in Fig. 6. These experiments illustrate the optical fiber microphone’s robust adaptability and stability in scenarios involving output light source attenuation and initial cavity length drift.ConclusionsWe introduce a highly stable optical fiber microphone sensing system based on polarization low coherence interferometry in this paper. The microphone includes a sensitive diaphragm made of polyphenylene sulfide material and an optical fiber end face, along with a cross-correlated sensing system formed by custom birefringent crystals on three paths at the rear end. By extracting the direct current component of the interference signal through a birefringent crystal of known length, the system effectively compensates for external environmental factors and other irrelevant interferences, thereby strengthening system stability. Experimental results demonstrate a signal-to-noise ratio of over 50 dB across the 0.02 to 20.00 kHz frequency range for this optical fiber microphone sensing system. Further detection and analysis of voice signals from different genders are conducted, followed by comparative analysis with a standard microphone. The system is also simulated under conditions of external environmental interference, where the initial cavity length of the sensor drifted by 1.631 μm and the system input power attenuated by 60%. Compared to unchanged conditions, the cumulative distances of the system’s output voice signals are 0.29073 and 0.28154, respectively, showcasing the voice detection stability of this optical fiber microphone. Given these characteristics, the proposed optical fiber microphone sensing system holds significant application potential in disaster warning, rescue operations, and other scenarios requiring highly stable voice detection. It accurately captures crucial voice information in complex and dynamic environments, providing essential technical support for safety monitoring and emergency response in critical areas.
Aug. 25, 2024Vol. 44 Issue 16 1606001 (2024)
Lijuan Zhao, Zhi Liang, and Zhiniu Xu
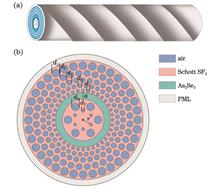
ObjectiveOrbital angular momentum (OAM) theoretically has an infinite number of topological charges and can take an infinite number of mutually orthogonal modes, making it a high-capacity information carrier. Mode division multiplexing (MDM) is a crucial application of OAM, where each OAM mode acts as an independent channel to transmit optical signals, significantly improving the channel capacity of optical fiber communication. Increasing the number of OAM modes that an optical fiber can support is particularly important. In recent years, helical structures have been applied to optical fibers. Spirally twisted photonic crystal fibers (PCFs) further enhance the flexibility of design, offering greater potential for applications in OAM generation. However, existing helical twisted fibers cannot support enough OAM modes, the number of OAM modes generated by a single structure is not high enough, and their optical characteristics have not been comprehensively analyzed, hindering the effective transmission of high-order OAM modes. To address this issue, we design a twisted PCF OAM generator. Through simulation analysis, the maximum topological charge of 17 can be achieved, allowing stable transmission of 66 OAM modes. This generator exhibits excellent optical performance, enhancing the transmission and application in modular division multiplexing. This twisted PCF can stably transmit OAM modes and is suitable for long-distance transmission, providing a possibility to improve the capacity of optical communication systems.MethodsThe design of the fiber structure plays a crucial role in the generation of OAM and its optical properties. Accurate transmission of the OAM mode in the fiber can be achieved when the refractive index distribution and the mode field distribution of the OAM mode are both annular and the effective mode refractive index difference between the mixed modes exceeds 10-4. To meet these requirements and improve optical properties, we design a novel spiral twisted PCF. The fiber’s spiral distortion rate is 7391.983 rad/m. The twisted PCF features multiple layers of circular air holes arranged in a ring structure. The circular air holes, with varying radii, form concentric rings filled with highly nonlinear As2Se3, divided into inner and outer layers with a refractive index of 2.808. The rest of the fiber is composed of Schott SF2. We employ COMSOL Multiphysics software to study the characteristics of the twisted optical fibers. However, constructing a three-dimensional model of twisted PCFs is complex and challenging. To address this, we utilize a two-dimensional modeling approach to simulate the twisted PCF. This simulation is achieved by converting between the spiral coordinate system and the rectangular Cartesian coordinate system, leveraging the translational invariance along the fiber axis. Using the finite element method, we obtain the eigenmode of the proposed PCF, allowing us to observe and calculate the supported OAM mode.Results and DiscussionsThe simulation results demonstrate that the twisted PCF can support 66 OAM modes, surpassing current twisted fiber OAM generators. Figures 4-9 illustrate the optical properties of the twisted PCF. Within the C-band, the mode of the twisted PCF surpasses 10-4, mitigating coupling during all vector mode transmission. This underscores the fiber’s effectiveness in transmitting the OAM mode within the C-band reliably. The purity of all modes exceeds 99.4%, indicating high-quality OAM mode conditions, which are conducive to signal coding and multiplexing in optical communication systems. In addition, the effective mode field area of all modes measures less than 48 μm2, suggesting concentrated light field energy within the ring core region, facilitating stable transmission of the OAM mode. Furthermore, the nonlinear coefficients of all modes are below 36 W-1·km-1, indicating reduced nonlinear effects. Consequently, the designed twisted PCF exhibits improved transmission performance in optical communication and is conducive to the application of MDM for enhancing the capacity of optical fiber communication systems. The dispersion coefficients of different modes are all less than 35 ps/(km·nm), indicating favorable dispersion characteristics of the OAM generator for stable transmission of all supported modes. The limiting loss value remains consistently within the order of 10-10-10-9 dB/m, suggesting minimal loss during optical signal transmission, enhancing the effective long-distance transmission of OAM.ConclusionsIn this paper, we propose an OAM generator based on twisted PCF. The generator exhibits a topological load of up to 17, allowing for the stable transmission of 66 OAM modes. Within the C-band, the effective refractive index difference between the two modes of the same order OAM mode of the twisted PCF exceeds 10-4, preventing coupled crosstalk. Within all modes boasting purity levels higher than 99.4%, the OAM generator facilitates signal coding and multiplexing in optical communication systems. Moreover, the effective mode-field areas and nonlinear coefficients of all modes are sufficiently small, enhancing transmission performance and supporting MDM application. In addition, the OAM generator demonstrates low stationary dispersion characteristics, ensuring stable transmission for all supported modes. The excellent optical properties of the twisted PCF meet the requirements for long-distance transmission of OAM mode, offering a promising avenue for enhancing the capacity of optical communication systems.
Aug. 25, 2024Vol. 44 Issue 16 1606002 (2024)
Zhanqiang Hui, Zelin Li, Dongdong Han, and Tiantian Li
ObjectiveMulticore photonic crystal fibers (PCFs) have attracted considerable attention. The cladding and core of PCFs typically contain air holes of different sizes and pitches that run the entire length of the fiber, allowing light waves to be confined to the core area. By adjusting the structure, size, and arrangement of these air holes, PCFs can achieve unique light-guiding characteristics that traditional fibers cannot, such as a large mode field area, high nonlinearity, endless single mode, high birefringence, and tailored dispersion. Compared with other types of MUX/DMUXs, PCF-based MUX/DMUXs generally offer a large number of mode multiplexes, a wide operating bandwidth, and low insertion loss. They can be easily integrated into existing optical-fiber communication systems and utilized in various engineering applications. Additionally, with the development of the mobile Internet across different vertical application fields, there is a need to further enhance the transmission rate of optical-fiber communication systems in backbone networks. With the emergence of MDM systems, the communication capacity of a single fiber has greatly improved. As a key component of the MDM system, the PCF-based MUX/DMUX has an inherent advantage in compatibility with existing single-mode optical-fiber systems. However, to date, PCF-based MUX/DMUX systems with satisfactory performance have been rarely reported. Therefore, developing a PCF-based MUX/DMUX with ultra-low insertion loss, ultra-wide bandwidth, and multiple multiplexing modes for ultra-large-capacity, ultra-high-speed, and ultra-long-distance MDM systems is highly desirable.MethodsFirst, we design a five-core PCF-based structure MUX/DMUX. We then conduct numerical analysis on the main kernel of the proposed five-core PCF-type MUX/DMUX using the eigenmode finite difference (FDE) method, verifying that the main kernel can simultaneously transmit five modes without crosstalk. Next, using the control variable method, we study the fundamental mode characteristics in the side core by optimizing the radius of the side core pores, the distance between the side core pores, and the pores at the connection between the side core and the main core to obtain the optimal structure. Finally, the key performance parameters of the five-core PCF mode division multiplexer are analyzed using the eigenmode expansion (EME) method, including mode coupling efficiency, insertion loss, crosstalk, and process tolerance.Results and DiscussionsOn the basis of previous research, our paper proposes an MUX/DMUX based on five-core PCF using silica as the substrate. We use FDE and EME methods to simulate and analyze its structure and performance. By adjusting the size and arrangement of the cladding air holes of the side core, we match the effective refractive index of the basic modes in the side core with the effective refractive index of the corresponding higher-order modes in the main core, achieving effective mode coupling. The results indicate that when the main core parameters are r0=0.5 μm and Λ1=5 μm, and the side core structural parameters are r1=0.65 μm, d1=0.37 μm, Λ2=6 μm, r2=0.95 μm, d2=0.48 μm, r3=1.68 μm, d3=0.45 μm, r4=1.96 μm and d4=0.53 μm, the device achieves optimal performance. At the center wavelength of 1.55 μm, the device has a mode coupling efficiency of 96.7% [Fig. 8(a)], an ultra-wide bandwidth of 620 nm [Fig. 8(b)], a low insertion loss of 0.15 dB [Fig. 9(a)], and a maximum crosstalk of -11.34 dB [Fig. 9(b)]. We also investigate the effect of structural parameter deviations on device performance. When the device size changes by ±0.5%, the device bandwidth is reduced to 490 nm and 470 nm, respectively, which is still within a reasonable range. This provides an important reference for future multi-core PCF type MUX/DMUX with ultra-high bandwidth and ultra-low loss.ConclusionsIn this study, we propose a novel mode-division MUX/DMUX with an ultra-large bandwidth and an ultra-low IL based on a five-core PCF. The device consists of a main core (supporting fundamental mode and higher-order mode transmission) and four side cores (supporting only fundamental mode transmission). By optimizing the geometrical structures based on the FDE method, we couple the LP01 modes from the four side cores at the input port to the main core, converting them to the LP11, LP21, LP31, and LP12 modes. Multiplexing of the LP01, LP11, LP21, LP31, and LP12 modes is realized in the main core. Conversely, if the output port of the device is used as the input port, mode division demultiplexing of the five modes from the main core can be realized. The proposed MUX/DMUX improves the number of mode-division multiplexing and mode coupling efficiency, greatly reduces the insertion loss, and shortens the device length. It can operate efficiently over a bandwidth of 620 nm (1.33-1.95 μm, covering the E-, S-, C-, L-, and U-bands) with an insertion loss of 0.15 dB and a crosstalk of -11.34 dB over a length of 1.84mm. Compared to previous schemes, the proposed MUX/DMUX offers the advantages of ultra-large bandwidth, ultra-low insertion loss, and short device length, with extensive application potential in future large-capacity MDM systems.
Aug. 25, 2024Vol. 44 Issue 16 1606003 (2024)
Fei Rui, Yixian Ge, Rui Su, and Haibin Ni
ObjectiveFiber optic strain sensors, with their immunity to electromagnetic interference, small size, light weight, and high stability in harsh environments, offer potential applications in numerous fields such as aerospace, biomedicine, and frozen soil monitoring. Recent research has demonstrated various fabrication techniques for these sensors, including fiber Bragg grating (FBG), long period fiber grating (LPFG), Fabry-Perot interferometer (FPI), tapered fiber, and diverse fiber optic interferometers. Some researchers have developed fiber optic sensors utilizing FP cavities and Mach-Zehnder interferometer (MZI) cascaded, achieving a strain sensitivity of 4.80 pm/με over a 0 to 600 με range, indicating low sensitivity. Others have introduced a novel parallel structure of fiber FPIs leveraging the cursor effect, comprising an open cavity FPI with a single-mode optical fiber (SMF)-SMF-SMF structure and a closed cavity FPI with an SMF-hollow core optical fiber (HCST)-SMF structure in parallel. This enhances the strain sensitivity of the sensor to -43.20 pm/με, which is 4.6 times higher than that of a single open chamber. However, despite its high strain sensitivity, this sensor is not widely adopted due to its large dislocation amplitude, manufacturing challenges, and low repeatability. In this study, we propose and prepare a vernier-sensitized fiber Fabry-Perot strain sensor to achieve high-sensitivity strain measurements.MethodsIn the high-sensitivity vernier sensitizer fiber Fabry-Perot strain sensor, both the sensor cavity and reference cavity employ an SMF-HCF-SMF structure for FPI. By adjusting the cavity lengths of both FPIs, two similar yet distinct free spectrum ranges (FSRs) are achieved, generating a vernier effect. As the external strain on the sensor cavity changes incrementally, the reflection spectrum of the sensor shifts, allowing for the measurement of the sensor’s strain sensitivity. Subsequently, the strain sensitivity of the single sensing cavity is compared with that of the two samples in parallel, resulting in a significant enhancement in sensitivity.Results and DiscussionsWithin the strain range of 0-900 με, the strain sensitivity of a single sensor cavity is 1.31 pm/με. After parallel connection, the strain sensitivity of the sensor reaches -11.50 pm/με and -12.76 pm/με, respectively, amplifying the sensitivity by 8.70 times and 9.74 times and significantly improving the sensor’s strain sensitivity.ConclusionsIn this paper, we fabricate a vernier sensitized fiber Fabry-Perot strain sensor and improve the sensitivity of strain measurement by keeping the sensing cavity unchanged and altering the length of the reference cavity. The sensor consists of two FPIs with an SMF-HCF-SMF structure connected in parallel by 3 dB couplers. During preparation, the length of the hollow core fiber is controlled as closely as possible so that the sensing and reference cavities have similar FSRs, enabling the superimposed spectrum to produce a vernier effect. The experimental results show that within a strain range of 0-900 με, the sensitivity of a single sensing cavity is 1.31 pm/με, the length of the sensing cavity remains unchanged, and the length of the reference cavity is changed by changing the amplification factor of the strain sensitivity. The strain sensitivity of the sensor can be improved to -11.50 pm/με and -12.76 pm/με by using the cursor effect demodulation in parallel. This method yields a strain sensitivity 8.70 and 9.74 times higher than that of a single sensing cavity FPI, significantly enhancing strain sensitivity. Producing two samples for strain testing with different strain sensitivity amplifications can expand the sensor’s measurement range in the future, improving measurement precision and accuracy to meet various strain conditions. The sensor also offers advantages such as low production cost, simple operation, and high sensitivity, making it applicable in fields like aerospace, frozen soil monitoring, and biomedicine.
Aug. 25, 2024Vol. 44 Issue 16 1606004 (2024)
Ke Zhang, Xiuhui Sun, Zihan Cai, Lü Yongmo, Jianjun Chen, and Shaoyun Yin
ObjectiveHolographic display technology can fully capture and reproduce the wavefront information of 3D light fields, making it the most promising 3D display technology. With the advancement of spatial light modulators (SLMs), they have become integral to holographic display systems, typically used to load phase-only holograms for modulating incident light. Holographic display technology based on SLMs digitizes recorded objects to generate holograms, simulating the propagation of object light. This allows reproduction not only of real objects but also virtual ones, unconstrained by the physical form of the object. However, current SLM structures limit the size of holographic reconstruction images, often failing to meet the demands of large field-of-view holographic displays. This paper proposes a method for achieving large field-of-view holographic displays. It involves placing a short focal length convex lens in front of the SLM. By utilizing the lens’s property of focusing and then diverging light, a three-step Fresnel diffraction process is implemented. Adjusting the position of the convex lens plane, its focal plane, and the observation plane expands the display range of the observation plane. Furthermore, to mitigate aliasing errors caused by undersampling in traditional Fresnel diffraction algorithms, a novel three-step non-aliasing sampling Fresnel diffraction algorithm is introduced. This approach ultimately enables large field-of-view holographic displays with high quality.MethodsThe holographic display system comprises an SLM and a short focal length convex lens. Leveraging the convex lens’s property of focusing light before diffusing it, and considering the size relationship between objects and images in the Fresnel diffraction algorithm based on a single fast Fourier transform (FFT), we adjust the positions of the convex lens plane, its focal plane, and the observation plane to enlarge the reconstructed image. Next, we propose a three-step non-aliasing sampling Fresnel diffraction algorithm tailored to this setup. Different optimizations are applied to each diffraction calculation step to mitigate sampling errors inherent in traditional Fresnel diffraction methods. Finally, we employ the Gerchberg-Saxton (GS) algorithm for iterative optimization to generate accurate phase-only holograms.Results and DiscussionsThe generated hologram is utilized for simulation and optical experiments, comparing it with traditional methods. Simulation results demonstrate that the proposed approach significantly enlarges the field-of-view of the reconstructed holographic image and eliminates aliasing interference, thereby improving the reconstruction quality (Fig. 5). Experimental results corroborate the simulation findings (Fig. 7). The proposed method effectively mitigates the zero-order background noise originating from the SLM, which is focused at the focal plane of the convex lens and subsequently diffused over increased diffraction distances. However, the periodic pixel structure of the SLM still induces higher-order diffraction images on the observation plane. Additionally, pixel interactions on the SLM induce fringe field effects, causing unintended phase variations among neighboring pixels. This can result in image artifacts, reduced modulation fidelity, and inaccurate wavefront manipulation.ConclusionsIn this paper, we propose a method for large field-of-view holographic display. The holographic display system consists of an SLM and a short focal length convex lens. It utilizes a three-step Fresnel diffraction process, leveraging the optical properties where light passes through the convex lens to focus and then disperse. By modulating the positions of the convex lens plane, focal plane, and observation plane, the field-of-view at the observation plane is effectively enlarged. Building upon this framework, we introduce a three-step non-aliasing sampling Fresnel diffraction algorithm to mitigate aliasing issues inherent in traditional methods, thereby enhancing calculation accuracy. Finally, a phase-only hologram is generated using the GS algorithm. Experimental results in optics align closely with numerical simulations. Compared to alternative methods, this approach is characterized by simplicity and efficiency, requiring minimal additional optical components. It holds promise for applications such as large field-of-view holographic projection, beam shaping for expansive patterns, and other related fields.
Aug. 25, 2024Vol. 44 Issue 16 1609001 (2024)
Xuan Liu, Bingzhen Li, Li Li, Weiqi Jin, and Hongchang Cheng
ObjectiveElectron bombarded active pixel sensor (EBAPS) is a kind of high-performance low-light video imaging device with vacuum-solid mixture. Since the domestic EBAPS is still in the early stage of research, various noises are unavoidable during the imaging process. However, the classical denoising algorithms, such as total variation, wavelet, and various edge-preserving filters, are aimed at additive white Gaussian noise (AWGN) with constant standard deviation, and the noise variance level should be known. Since the noise of EBAPS is a mixture of dark noise, shot noise, and fixed pattern noise, with unknown noise level, the denoising algorithms designed for AWGN are not effective for EBAPS images. Therefore, we first analyze the noise characteristics of EBAPS, including AWGN independent of signal strength, Poisson noise varying with signal strength, and fixed noise. Then, we propose a noise estimation method for a single frame image by employing dark pixel structure characteristics of EBAPS. Finally, the traditional wavelet threshold denoising is improved according to the estimated noise intensity, and an adaptive variable threshold is put forward according to the noise intensity of the single frame image. We hope that our denoising method can improve the low-light image quality of EBAPS with lower computation and less frames.MethodsThe proposed algorithm includes noise estimation and wavelet denoising. The noise estimation includes the following steps. First, the properties of the solid-state imaging device and vacuum imaging device are combined to infer the noise source of EBAPS, and the relationship between EBAPS noise and signal intensity is obtained by experiments using the photo transfer curve (PTC) method. Then, based on the dark pixel structure of EBAPS, we infer the unified noise intensity model using a single frame image. The wavelet denoising decomposes the image into multiple sub-bands at different resolutions and scales, the image subject information exits in the low-frequency sub-band, and the noise and detail information exits in the high-frequency sub-band. By setting a threshold on the coefficients of high-frequency sub-bands, the noise can be almost removed. Finally, the denoised image is restored by inverse wavelet transform. The performance of wavelet threshold denoising depends on the threshold. A larger threshold will shrink the signal features to result in image over-smoothing and create blur and artifacts, while a smaller threshold will leave more noise information. Since the images of EBAPS have low signal-to-noise ratio and complex noise sources, the classical thresholds such as UT threshold, Rigrsure threshold, and Min-max threshold are not effective. Thus, based on wavelet threshold denoising, according to image noise intensity estimation in the previous step, adaptive wavelet threshold denoising based on pixel dark noise of EBAPS (AWT-PDN) is designed.Results and DiscussionsThe unified noise intensity model [Eq. (2)] can be divided into three stages. In the first stage, when the signal intensity of the light pixel region is less than that of the dark pixel region, the noise is mainly AWGN and basically remains constant. In the second stage, the signal intensity of the light pixel region increases and the noise intensity rises gradually, which follows the Poisson distribution. In the third stage, when the signal intensity of the light pixel region increases to a certain value, according to the histogram distribution shape and Poisson distribution theorem, the noise at this time is close to the Gaussian distribution, with the intensity remaining constant. On the other hand, the image processing results under different illuminance of wavelet threshold denoising with different thresholds are shown in Figs. 11 and 12. Subjectively, the noise of images under all illuminance is suppressed by selected methods and the image noise of our AWT-PDN method is less in the bright area of the image. For a more intuitive observation of the detail of images, a line crossing the black-white edge in the image is emphasized in pixel value (Fig. 11). In 1×10⁻² lx and 5×10⁻³ lx illuminance conditions, the line edge processed by our AWT-PDN method is clearer and smoother, but that processed by other selected thresholds has more burrs. Objectively, PSNR [Eq. (18)], SSIM [Eq. (19)], and AFD [Eq. (20)] are employed to evaluate the proposed method. As shown in Table 2, the proposed AWT-PDN method has better performance than others and can preserve edges.ConclusionsThe noise sources of EBAPS are analyzed, including Gaussian noise independent of signal strength, Poisson noise varying with signal strength, and fixed pattern noise, and the relationship between EBAPS noise and signal intensity is obtained by experiments using the PTC method. Then, based on the dark pixel structure of EBAPS, we propose an adaptive wavelet threshold denoising method AWT-PDN for EBAPS images based on pixel dark noise. According to the noise intensity distribution of the EBAPS single frame image, an adaptive variable threshold wavelet threshold denoising method is obtained. Experiments show that the proposed AWT-PDN method can reduce the EBAPS imaging noise, and yield a better noise reduction effect than traditional threshold methods in 5×10⁻³ lx illuminance conditions.
Aug. 25, 2024Vol. 44 Issue 16 1610001 (2024)
Haocheng Liang, Lü Jia, Mingkai Yu, and Xin Chen
ObjectivePneumonia is one of the most common and fatal diseases during childhood. Accurate segmentation of lung CT images is crucial for early detection. However, manually outlining infected lung regions is labor-intensive for radiologists. Automatic segmentation technology holds significant promise in alleviating the strain on medical resources. In childhood pneumonia CT images, infected areas are often fragmented across different lung lobes. Therefore, precise global contextual information is essential for accurate segmentation. While purely transformer-based segmentation networks have demonstrated strong learning capabilities in this regard, they often struggle with producing high-quality local details due to limited patch size and insufficient local prior knowledge. Moreover, lung tissues such as the hilum and mediastinal areas closely resemble infected regions in childhood pneumonia, which demands robust network performance to minimize interference. To address these challenges, we propose a prior graph convolution and transformer fusion network based on U-Net (GTU-Net).MethodsThe core concept of GTU-Net involves integrating graph convolutional network (GCN) and Transformer to mutually enhance each other’s strengths. It utilizes GCN to establish pixel relationships within each patch, and then leverages the Transformer to capture global information between patches. In addition, a novel method called prior graph learning (PGL) is introduced within GCN to mitigate interference from irrelevant regions. GTU-Net comprises three main modules: PGL, graph convolution mixed transformer (GCT), and the encoder-decoder structure of U-Net, as illustrated in Fig. 2. Upon receiving features extracted by the encoder, these are first processed using coordinate-aware projection (Fig. 3) to form graph nodes and adjacency matrices. Subsequently, the adjacency matrices undergo further refinement through the PGL module (Fig. 4), which uses a supervised approach to incorporate category priors and localization information from labels. The data is then divided into non-overlapping subgraphs. With PGL’s assistance, the local reasoning capabilities of GCN are significantly enhanced, enabling precise descriptions of intra-class and inter-class feature relationships. This design is referred to as a prior graph convolutional network (PriorGCN). Next, the divided graph data are fed into the GCT module, which consists of PriorGCN and Vision Transformer (ViT). GCT aims to sequentially establish intra-patch localization and inter-patch globalization, thereby addressing challenges posed by complex local structures and scattered infection regions in childhood pneumonia. Finally, the decoder performs upsampling to produce the final segmentation result.Results and DiscussionsOne private childhood pneumonia dataset (Child-P) and two publicly available COVID-19 CT datasets (COVID and MosMed) are used to validate the proposed GTU-Net. The ablation results indicate that each proposed module noticeably boosts segmentation performance (Table 2). Specifically, PriorGCN contributes the most, with improvements of 4.44 percentage points in DSC, 6.82 percentage points in JI, 6.31 percentage points in SE, 4.41 percentage points in MCC, and a reduction of 0.1615 pixel in ASD compared to the baseline. In comparative experiments, GTU-Net achieves the best performance across all metrics on the Child-P dataset (Table 4), particularly excelling in JI and MCC metrics with improvements of 2.91 percentage points and 1.85 percentage points, respectively, compared to the second-best network. Moreover, GTU-Net demonstrates superior sensitivity in segmenting fragmented and tiny lesions, resulting in more comprehensive segmentation outcomes in these regions compared to other networks (Fig. 10). Similarly, GTU-Net shows the best performance on the COVID dataset (Table 5), particularly notable in the improvement of the SE metric, highlighting the excellent feature discrimination capability of the PGL module. GTU-Net also outperforms other networks in DSC, JI, and MCC metrics on the MosMed dataset, achieving improvements of 1.70 percentage points,1.77 percentage points, and 1.93 percentage points, respectively, compared to the second-best network (Table 4). Visualization results from the two COVID-19 datasets reveal that GTU-Net effectively addresses issues such as under-segmentation or over-segmentation (Fig. 11). Additionally, GTU-Net exhibits superior local segmentation results, avoiding the checkerboard artifact often seen in transformer-based networks (Fig. 12). Importantly, GTU-Net maintains its superior performance even when it is trained on small datasets without pre-training on larger datasets (Fig. 13).ConclusionsWe select childhood pneumonia as our research focus, an area relatively underexplored in existing studies. We propose a novel GTU-Net to address the segmentation challenges presented by childhood pneumonia CT images, which are characterized by high noise interference, the presence of tiny lesions, and fragmented distribution. GTU-Net incorporates a GCT module to systematically capture local-global information. Additionally, a PGL module is introduced to construct a high-quality graph adjacency matrix for GCN, enhancing the network’s ability to discriminate between inter-class and intra-class features. Unlike most existing transformer-based segmentation networks, GTU-Net does not rely on pre-training, which strengthens its clinical applicability. Experimental results on a private childhood pneumonia CT dataset demonstrate that GTU-Net outperforms state-of-the-art transformer networks. Furthermore, it exhibits strong performance on two publicly available COVID-19 CT datasets, verifying its generalizability.
Aug. 25, 2024Vol. 44 Issue 16 1610002 (2024)
Jiale Zuo, Mengmeng Zhang, Ju Tang, Jiawei Zhang, Zhenbo Ren, Jianglei Di, and Jianlin Zhao
ObjectiveDigital holography is an optical imaging technique that records and reconstructs the complete wavefront information of an object field. In-line holography, known for its broader spatial bandwidth and simpler imaging system, has gained widespread attention and application. However, traditional in-line holography suffers from interference by zero-order and twin images during object field reconstruction, affecting the observation and measurement of the object field’s complex amplitude. In addition, traditional phase recovery algorithms can produce significant errors, especially under high-resolution and large field-of-view imaging requirements, where reconstruction quality can be compromised. Inaccurate initial estimates or incomplete prior information may cause the algorithm to fail to converge or produce incorrect results due to the strong reliance of phase retrieval methods on initial estimates and prior information. Data-driven neural network methods are limited by dataset collection and quality and lack interpretability. Physics-driven neural networks combine neural networks with models that adhere to physical laws, mitigating the drawbacks of data-driven neural networks. However, physically motivated neural networks require certain constraints on data acquisition when only a single hologram is provided as input. Consequently, the final reconstruction results are susceptible to the influence of secondary interference fringes, leading to uneven backgrounds in the recovered results. In response to these issues, a method for reconstructing holographic images using a dual-input physics-driven neural network with amplitude constraint (DPNNA) is proposed.MethodsFirstly, the DPNNA method is constructed. Two holograms captured at diffraction distances d1 and d2 are used as inputs to the neural network. A physical model is employed to compute the estimated hologram and phase corresponding to diffraction distance d1 based on the neural network’s estimated phase. Subsequently, combining the estimated phase at d1 with the true amplitude, the physical model generates the estimated hologram corresponding to diffraction distance d2. The loss function is computed using the estimated and true holograms, and network parameters are optimized to achieve phase or amplitude imaging. Then, in-line holograms of phase and amplitude resolution targets, as well as phase objects with irregular phase variations, are simulated to validate the feasibility of DPNNA method. The peak signal-to-noise ratio (PSNR) and structural similarity (SSIM) among the reconstruction results of traditional Gerchberg-Saxton (G-S) method, the single-input physics-driven neural network method PhysenNet, and the proposed DPNNA method, and the ground truth are calculated. Finally, a lensless imaging optical setup is constructed to record in-line holograms containing information on different objects. The DPNNA method is employed for reconstruction and compared with other in-line holographic reconstruction methods.Results and DiscussionsThe DPNNA method is utilized to simulate the reconstruction of pure phase objects with different phase distributions and is then compared with the reconstruction results obtained using the G-S algorithm and PhysenNet (Figs. 5-7). Overall, when compared to the traditional G-S method and PhysenNet, the proposed DPNNA method demonstrated significant advantages in the high-quality recovery of object amplitude and phase information. This is particularly notable in lensless imaging, where it achieves the highest evaluation metrics. Subsequently, numerical reconstruction of holographic images is performed using in-line holograms of phase and amplitude resolution targets recorded in experiments (Figs. 8 and 10). The results show that using the DPNNA method for holographic image reconstruction far outperforms other algorithms, with the weakest background noise in the reconstructed images. The DPNNA method not only effectively removes twin images but also demonstrates the robustness for different diffraction distances and noise levels (Tables 3 and 4).ConclusionsWe propose a DPNNA method. By combining the dual-input physics-driven neural network with the G-S reconstruction algorithm, accurate phase or amplitude reconstruction can be achieved without requiring a large amount of training data, ensuring stability and accuracy. Compared to the traditional G-S algorithm, the DPNNA method performs better in handling edge information and exhibits weaker background noise. The DPNNA method demonstrates good reconstruction accuracy for both amplitude-type and various phase-type objects, with stronger generalization ability and interpretability compared to data-driven neural network methods. The proposed method provides a low-cost, high-precision solution for phase imaging, overcoming dependencies on initial estimates and prior information, as well as issues such as high-cost dataset construction and uneven backgrounds. Combining a dual-input physics-driven neural network with amplitude constraint leads to more accurate in-line holographic imaging. This advancement holds significant application value in the field of computational imaging.
Aug. 25, 2024Vol. 44 Issue 16 1611001 (2024)
Dawei Gan, Zhiqiang Liu, Wenbin Feng, Jiayi Wang, and Mao Ye
ObjectiveTraditional microscopes have limitations such as large size and restricted field of view, necessitating comprehensive scanning for complete imaging of large-scale samples. In contrast, microlens array imaging systems feature a larger imaging range and simpler setup, thus becoming a research hotspot. Each sub-lens within a microlens array possesses a unique optical axis, and their optical performances are similar under identical parameters. Integration of these unit structures forms a unified optical axis within the microlens array. Compared to traditional single lenses, microlens arrays exhibit exceptionally high parallelism, and thus each sub-lens can independently transmit optical signals without interference, essentially forming numerous two-dimensional parallel optical paths. This characteristic enables each sub-lens to perform functions such as transmitting, transforming, and conducting imaging on optical information, thereby facilitating large-area imaging. The variable focusing feature of liquid crystal microlens arrays further promotes the miniaturization of imaging systems and can be utilized to address chromatic aberrations during imaging. Unlike traditional microscopes that require lens movement to adjust the focal plane, variable focusing liquid crystal microlens arrays can alter the focal plane without moving the lens to enhance the flexibility and portability of imaging systems.MethodsWe develop a high-performance liquid crystal microlens array. Each microlens unit within the proposed array consists of multiple vertical electrodes, allowing precise wavefront distribution control. Leveraging the advantages of electrically controlled focusing in the liquid crystal microlens arrays, we achieve clear imaging of different spectral bands without physically moving optical components. Meanwhile, the imaging results are processed by adopting an image synthesis algorithm to mitigate interference from non-central wavelength light filtered by the CMOS red-green-blue filters. Subsequently, a reconstruction algorithm is applied to the processed results for image stitching. During image restoration with the stitching algorithm, we first calibrate the imaging positions of each microlens, invert the imaging results at the calibration points, and then translate these images to form a complete image. Additionally, weighting is applied to different regions of the stitched image to reduce the impact of overlap on lens imaging after translation. The final output is a comprehensive image characterized by a large field of view and high definition.Results and DiscussionsThe performance testing results of the proposed array indicate that the lens focal length varies linearly with the voltage difference when the center voltage and apex voltage range from 1.6Vrms to 2.5Vrms, which suggests that the lens operates within the linear voltage region of the liquid crystal material. Imaging results show that during focusing with white light, only the green light band is in focus, while the red and blue light bands are out of focus. By comparing the contrast of the in-focus and out-of-focus segments of the red light band under the red channel and blue light band under the blue channel, the blue calibration point in Fig. 10 shows that the contrast of stripes in Figs. 10(a) and (b) is 0.125 and 0.101 respectively, while the contrast of stripes in Figs. 10(i) and (h) is 0.129 and 0.104 respectively. This indicates an increase in contrast of 23.8% and 24% for Figs. 10(a) and (b) respectively after improving the defocusing phenomenon caused by dispersion. Image reconstruction is presented in Fig. 12, from which the modulation transfer function (MTF) is obtained as shown in Fig. 13. Figure 13 reveals that compared to white light imaging, direct image synthesis focusing on the red, green, and blue bands improves overall image quality by approximately 1.01%. After synthesizing the images, the overall image quality is enhanced by approximately 16.9% compared to white light imaging, with a more significant improvement in the mid-frequency range. For the low-frequency range where stripe intervals are larger, the impact of defocusing at stripe edges on contrast is minimal. In contrast, for the high-frequency range with smaller stripe intervals, the defocusing phenomenon of other bands in the high-frequency range is not significant due to the dispersion of single-band light itself, resulting in a smaller stripe contrast change. Finally, the imaging system achieves a spatial frequency resolution limit of approximately 100 lp/mm, corresponding to a resolvable line width of 5 μm.ConclusionsWe propose a liquid crystal microlens array with higher electrode density and provide a detailed derivation of the driving method for this array. By utilizing theoretical results to drive the liquid crystal microlens array for imaging of a resolution target, we adjust the driving voltage to focus different spectral bands of light transmitted through the resolution target, aiming to reduce imaging dispersion. Employing an image synthesis algorithm, we remove some of the non-central wavelength light contamination from the CMOS filters and then restore the image of the resolution target using an image reconstruction algorithm. The results indicate that compared to direct imaging with white light, the processed image exhibits an overall contrast enhancement of 16.9%, and the minimum resolvable width reaches 5 μm.
Aug. 25, 2024Vol. 44 Issue 16 1611002 (2024)
Xiaoying Hu, Xinyi Jing, Hao Li, Shuang Liu, and Weiguo Liu
ObjectiveTraditional imaging captures only light intensity and position information visible to the human eye, leaving out other details. Polarization imaging extends this by revealing spatial polarization characteristics alongside traditional data, enriching information acquisition with higher resolution, wider field of view, and reduced environmental sensitivity in optical imaging. Grating, a crucial optical element known for diffraction and the Talbot effect, holds promising applications across various fields. In the spectral domain, analyzing grating systems provides intuitive insights: distinct frequency components convey unique information, with higher frequencies offering finer object details. By changing parameters like grating frequency, imaging environment, and light source, changes in spectral components enrich the original data, enhancing high-frequency detail, and image resolution. Against this backdrop, we design a polarization system for a grating illuminated by partially coherent light. Given the static nature of the target object, a time-division polarization imaging system is employed to explore object-image relationships, analyze them in the spectral domain, and monitor changes in spectral components crucial for enhancing imaging resolution and target detection.MethodsWe investigate a polarization system for a grating illuminated by partially coherent light based on unified polarization theory. A physical model is built for the relationship between partially coherent light-illuminated gratings and polarization systems. The model is simulated to derive theoretical outcomes followed by the design and construction of an experimental platform. Experimental data is gathered, processed, and compared with theoretical results to validate conclusions. A simplified optical path diagram and mathematical model for the partially coherent light-illuminated grating polarization system are devised. By employing unified polarization and coherence theories, we introduce generalized Stokes parameters, extending the mutual intensity relationship of the object and image from a scalar system to a polarization vector system. This approach establishes the spatial and spectral domain relationships between object and image in this system. The mathematical model of the object-image relationship for the partially coherent light-illuminated grating polarization system is simulated using MATLAB. Based on the transfer cross coefficient within the established relationship, we simulate models for apparent transfer functions of first and second harmonic components. In addition, spatial domain models of object-image for partially coherent light-illuminated sinusoidal amplitude grating polarization system are simulated to obtain one-dimensional Stokes intensity distribution diagrams under three different coherence conditions. Simulation results demonstrate that spatial domain Stokes intensity distribution correlates with grating intrinsic frequency and coherence. Experimental studies are conducted using a time-division polarization imaging system on a partially coherent light-illuminated grating polarization system. Experimental schemes are designed, utilizing a sinusoidal amplitude grating with a line density of 50 line/mm, and an experimental platform is established. We analyze and process experimental data using MATLAB software.Results and DiscussionsUnder various coherence conditions, we obtain curve graphs of apparent transfer functions for the first and second harmonic components. These graphs clearly illustrate that under nearly incoherent light sources, the apparent transfer function exhibits linear changes. As coherence increases, deviations from linear relationships become more pronounced for both first and second harmonic components. Spatial domain simulation results are present under different coherence conditions alongside several sets of spectral domain simulation results. Results indicate that with higher normalized intrinsic grating frequencies, higher-order spectral components diminish, influenced also by coherence (Figs. 2-3).ConclusionsLeveraging coherent polarization unified theory, we establish a mathematical model for a partially coherent light-illuminated grating polarization system. Simulation results for apparent transfer functions of first and second harmonics show linear variation under incoherent light, i.e., when s=0, increased coherence leads to deviations from linearity. Spatial domain object-image models for partially coherent light-illuminated sinusoidal amplitude grating polarization system indicate that spatial domain Stokes intensity distributions correlate with grating intrinsic frequency and coherence. Spectral-domain object-image relationships demonstrate that as grating intrinsic frequency T(fx0)=0.8, and parameter s change from 1.0 to 0.5 while coherence increases, the first harmonic disappears. Experimental verification using a 50 line/mm sinusoidal amplitude grating confirms that as grating intrinsic frequency T(fx0)=0.8, and parameter s value decreases from 1.0 to 0.5, only zero-frequency components remain, aligning experimental results closely with theoretical expectations
Aug. 25, 2024Vol. 44 Issue 16 1611003 (2024)
Miao Li, Lingqiang Zhang, Xi Wang, Chenyan Wang, Chaorui Chen, Zhaohui Guo, and Xueyin Zhao
ObjectiveSingle-pixel imaging technology, as a novel computational imaging technique, features high sensitivity and interference resistance. By combining compressive sensing theory with single-pixel imaging technology, sampling time and storage resource consumption can be effectively reduced. However, in current research on FPGA-based single-pixel imaging reconstruction algorithms, researchers often struggle to achieve both algorithmic reconstruction quality and reconstruction speed. We introduce the alternating direction method of multipliers based on plug-and-play (PnP-ADMM) into FPGA-based single-pixel imaging systems to enhance both image reconstruction quality and speed. The numerical simulations and experiments demonstrate that the established PnP-ADMM system on chip (SOC) single-pixel imaging system can accurately reconstruct target scenes and preserve image details, with strong noise suppression capacity.MethodsBy incorporating the PnP-ADMM algorithm into a single-pixel imaging system, we break down the original large-scale optimization problem into multiple sub-problems to increase expedited computation speed. The algorithm also adopts a plug-and-play framework to introduce denoising operators to denoise reconstructed signals during algorithm iterations. Furthermore, we design a hardware structure for the PnP-ADMM algorithm, leveraging FPGA platforms to accelerate calculation processing. Additionally, based on block-based compressive sensing, we process target images in blocks, further speeding up calculation processing while effectively conserving hardware resource consumption.Results and DiscussionsThe numerical simulation results demonstrate that the established PnP-ADMM algorithm achieves a PSNR of 24.82 dB and 29.64 dB for reconstructed images at sampling rates of 12.50% and 25.00%, respectively, while the SSIM reaches 0.75 and 0.88, respectively (Fig. 5). The test result of the designed hardware structure for the PnP-ADMM algorithm reveals that at a sampling rate of 25.00%, the duration of reconstructing a 256 pixel×256 pixel image by PnP-ADMM SOC using proximity operator, soft thresholding operator, and total variation operator is 0.369 s, 0.303 s, and 0.681 s, respectively (Table 2). This represents an improvement of 141.9 times, 172.1 times, and 80.3 times respectively compared to using only an ARM processor (Table 2). Furthermore, the imaging experiments for validation are completed by constructing a single-pixel experimental platform. The experimental results confirm that under the imaging conditions at a distance of 300 cm, the PnP-ADMM SOC single-pixel imaging system achieves a resolution of 0.445-0.500 lp/mm for images with 256 pixel×256 pixel resolution (Fig. 9).ConclusionsWe apply the PnP-ADMM algorithm to FPGA-based single-pixel imaging systems to enhance both image reconstruction quality and speed on the FPGA platform. Numerical simulation results demonstrate that the image quality reconstructed using the proposed PnP-ADMM inversion reconstruction algorithm surpasses that of the WQR-OMP algorithm and TVAL3 algorithm. The test results of the designed hardware acceleration structure for the PnP-ADMM algorithm show that this structure effectively accelerates the algorithm’s computation processing. Furthermore, the establishment of a single-pixel experimental platform confirms that the PnP-ADMM SOC single-pixel imaging system can accurately reconstruct target scenes and preserve target details, with strong noise suppression capability.
Aug. 25, 2024Vol. 44 Issue 16 1611004 (2024)
Mengxi Fu, Xiaoyu Zhu, Liang Zhang, and Chuanlong Xu
ObjectiveLight field particle image velocimetry (PIV) is a single-camera three-dimensional flow field measurement method and has unique advantages under complex flow field measurement scenarios in narrow channels. The PIV technique consists of three parts: light field image acquisition, tracer particle spatial distribution reconstruction, and interrelated velocity field calculation. Among them, the reconstruction quality of the particle field will directly affect the accuracy and resolution of the velocity field measurement, which is the key link of light field PIV. Traditional particle field reconstruction methods for light field PIV, such as the joint algebraic reconstruction method, have low reconstruction efficiency, large computer memory requirement, and stretching effect of reconstructed particles. Optimization methods for traditional algorithms cannot completely solve the existing problems. Therefore, we introduce deep learning and propose a particle-reconstructed convolutional neural network (PRCNN) model based on deep residual neural networks to improve the quality and reconstruction efficiency of light field PIV particle field reconstruction.MethodsBased on the geometric optics theory, we build an optical field imaging model and extract the optical field sub-aperture image containing information of multiple viewing angles from the original image of the optical field according to the optical field imaging characteristics. Meanwhile, the “three-dimensional spatial distribution of particles-optical field sub-aperture image” dataset is constructed by numerical simulations. A deep residual neural network model is built, and a weighted MAE coupled reconstruction quality factor loss function is customized for training, with specific task objectives and data distribution characteristics taken into account. Further, the reconstruction quality and accuracy of the prediction model are evaluated by adopting numerical reconstruction methods, and the reconstruction efficiency is compared with that of the traditional SART algorithm. Finally, the measurement accuracy of the proposed method is analyzed in comparison with the traditional SART reconstruction algorithm by cylindrical bypass flow field measurement experiments.Results and DiscussionsThe numerical reconstruction results show that in the tracer particle concentration range of 0.2-1.1, the reconstruction results of the proposed PRCNN model are all better than those of the SART algorithm, which improves the reconstruction quality factor by 153.83% (Fig. 11). Additionally, this model not only accurately reconstructs the true position of the particles, but also virtually eliminates the depth-direction stretching effect of the reconstructed particles (Fig. 12), improving the accuracy of particle position determination. Meanwhile, the proposed reconstruction method yields a reconstruction efficiency acceleration ratio of 3976.53 compared to the SART algorithm (Table 2), which can be employed for real-time particle field reconstruction. In the experimental evaluation results, by combining the 3D mutual correlation algorithm to calculate the 3D velocity field of the cylindrical winding flow field, the PRCNN model acquires the backflow behind the cylinder and demonstrates the staggered vortex structure (Fig. 15). At the central cross section of the pipe, the velocity results obtained by the PRCNN and SART algorithms are compared with the planar PIV measurements, and the velocity distribution results are basically the same (Fig. 16). After quantitatively comparing the velocity measurements at this plane, the average relative deviations of PRCNN and SART algorithms are 12.92% and 14.56% respectively, indicating that PRCNN can reconstruct a relatively accurate velocity field, with the computational error smaller than that of the SART algorithm. Finally, the practicality of the proposed method is verified.ConclusionsTo improve the optical field PIV 3D particle field reconstruction resolution and reconstruction efficiency, we propose a particle 3D distribution reconstruction method based on PRNCC, evaluate the reconstruction accuracy and efficiency of PRCNN by numerical simulations, and carry out an experimental evaluation study of cylindrical bypass flow field measurement. The results show that compared with the traditional SART algorithm, the reconstruction quality factor of the particle field of PRCNN is improved by 153.83% and the reconstruction time of a single light field image is only 0.025% of the SART algorithm. Additionally, the acceleration ratio reaches 3976.53, which proves that the proposed reconstruction method has high reconstruction quality and reconstruction efficiency. The reconstruction accuracy and efficiency of the cylindrical flow field measured by PRCNN and the traditional SART algorithm are evaluated by numerical simulations. The three-dimensional flow field of cylindrical flow measured by PRCNN and traditional SART algorithms is consistent, and the velocity distribution in the central cross section of the pipe (Z/D=0) is basically the same as that measured by planar PIV. Meanwhile, the average relative errors of PRCNN and SART measurements are 12.92% and 14.56% respectively, which indicates that the PRCNN method can be utilized for accurate three-dimensional flow field measurements by the light-field PIV technique, thus realizing accurate 3D flow field measurements.
Aug. 25, 2024Vol. 44 Issue 16 1612001 (2024)
Zhaorui Xu, Dong Liu, Shaojing Peng, Xinming Li, Tianliang Yan, Jian Bai, Yibing Shen, Lan Wu, and Chong Liu
ObjectiveInertial confinement fusion (ICF) is a promising fusion energy research technique that involves subjecting a tiny fuel target, typically a pellet containing a mixture of deuterium and tritium, to extreme temperatures and pressures, causing the fuel to undergo nuclear fusion. Achieving uniformity in the fuel layer within the target is critical for a successful fusion reaction, necessitating precise measurement and control of various parameters such as refractive index, thickness, and surface roughness. Any deviation from the ideal uniformity can lead to instability during the implosion process, significantly reducing fusion reaction efficiency. Recent advancements in ICF research have introduced various methods for characterizing the fuel layer, including X-ray imaging for density measurements, liquid refractive index matching for optical profiling, and confocal microscopy for surface analysis. Despite these innovations, challenges remain, particularly in adapting these methods in a vacuum environment and achieving the precision necessary for accurate characterization. To address these challenges and provide comprehensive guidance for the ICF target fabrication process, there is an urgent need to develop a characterization system capable of in situ synchronous detection of the roughness and refractive index of the target’s ice layer within a vacuum chamber.MethodsWe establish a characterization model for optical path difference and light deflection based on Mach-Zehnder (M-Z) interferometry and backlight shadow imaging techniques. By integrating interferometric detection and backlight shadow technology, a synchronous measurement method for refractive index and thickness is applied, allowing precise iteration to obtain the average thickness and refractive index of the ICF target’s ice layer. Utilizing an optical projection tomography approach, a mirror-scanning synchronous characterization system for the target is constructed, which synchronously measures the average thickness and refractive index of the target’s ice layer under a single angle. Edge recognition, polar coordinate transformation, and feature extraction algorithms are employed to extract the fringe radius from interferometric detection images, facilitating inference of the average refractive index of the ice layer. During multi-angle scanning, piezoelectric ceramics control the mechanical phase shift of the reflecting mirror in the M-Z interferometric optical path, enabling the determination of the two-dimensional refractive index distribution of each projected plane. Subsequently, an algebraic reconstruction algorithm is used to perform a three-dimensional refractive index reconstruction of the target’s ice layer. Additionally, edge extraction, Hough transformation, and least square fitting are used to analyze backlight shadow images, enabling extraction of the ice layer’s contour for accurate thickness correction when combined with the refractive index distribution obtained through interferometry. The result is a detailed map of the target ice layer’s contour roughness and power spectral density derived from average thickness measurements.Results and DiscussionsA significant contribution of our work is the innovative reconstruction of the target ice layer’s contour roughness and three-dimensional refractive index distribution. The experimental outcomes demonstrate that the relative error in characterizing the contour roughness is less than 2.2%, as shown in Fig. 8 and Fig. 9. Using algebraic reconstruction and light deflection algorithms, in conjunction with a light tracing model, we reconstruct the three-dimensional refractive index distribution of the target shell and ice layer within the mirror scanning area. Simulation results indicate that the average relative error of the three-dimensional refractive index reconstruction results for single-layer shells and double-layer targets is less than 0.16%, with peak-to-valley value and root mean square value relative deviations of less than 2.88% and 0.21%, respectively. The algorithm reconstruction time is better than 86 seconds. The results are shown in Fig. 6, Fig. 7, Table 2, and Table 3.ConclusionsWe comprehensively examine the ICF target uniformity characterization technology, covering fundamental principles, detailed algorithmic procedures, extensive simulations, system design, and experimental validation. The thorough analysis confirms the reliability of the proposed technology and its potential to bolster the fabrication process of fusion targets significantly. By addressing the need for high-precision measurements and offering a solution adaptable to vacuum environments, our study contributes to the ongoing efforts to achieve the goal of efficient and controlled fusion energy production.
Aug. 25, 2024Vol. 44 Issue 16 1612002 (2024)
Xinxin Zhang, Tianlei Ning, Lihui Liu, and Yanqiu Li
ObjectivePolarimeters, as powerful tools for characterizing the polarization characteristics of light and various samples, have important applications in low signal-to-noise ratio detection fields such as remote sensing and lithography. Traditional polarimeters excel in accuracy, speed, and compactness in strong light fields. However, their measurement accuracy becomes unreliable in low light fields due to strong background noise and interference from complex systems. Recently, the spatially modulated polarimeter based on the vortex wave plate achieves a single measurement of polarization information with a simple optical path. This method, combined with a specific denoising method, measures the full polarization component at low light fields. However, existing research ignores the influence of the size and spatial variation characteristics of the spatially modulated model parameters, which significantly affects the measurement accuracy of the Stokes parameters. Based on keeping the fast axis angle of the polarizer at a level, we theoretically derive and experimentally verify the influence of the fast axis angle of the quarter-wave plate on the measurement accuracy of the Stokes vector at strong light fields and determine the optimal angle using the instrument matrix condition number optimization method. Our work provides a theoretical and experimental basis for high-accuracy polarization measurement in low light fields.MethodsThrough simulation and experiment, we compare the measurement accuracy under different fast axis angles of the wave plate and select the angle with the highest accuracy and stability using the instrument matrix condition number optimization method. Firstly, the theoretical model of the spatially modulated polarimeter based on the vortex quarter-wave plate is established, and the influence of the fast axis angle of the wave plate on the modulation parameters in the spatially modulated analyzer is quantitatively deduced. The distribution characteristics of modulation parameters are measured by maximum, minimum, mean, and variance. Meanwhile, the polarization information corresponding to the simulated spatially modulated image is solved using a direct enumeration algorithm. We then equate spatially modulated measurement by multiple time-division measurements under different conditions and establish the corresponding instrument matrix. According to the theory of instrument matrix condition number, the optimal angle is determined. Finally, multiple spatial modulated images are measured under different fast axis angles of the wave plate, and the polarization information is solved from simulation and experiment. To verify stability, three repetitive measurements are performed under different experimental environments by changing the output current of the LED.Results and DiscussionsThe influence of the fast axis angle on the characteristics of the model parameters is measured by the maximum, minimum, mean, and variance. From Fig. 2(a) and (b), it is found that the maximum value of m01 is stable at 0.5, and the minimum value oscillates sinusoidally between 0 and -0.5. The maximum value of m02 varies between 0.25 and 0.5, oscillating around 0.5 at most angles, while the minimum value changes between -0.25 and -0.5, showing a compound sinusoidal trend. The maximum and minimum values of m03 change in a sinusoidal trend with a period of 90°, ranging from 0 to ±0.5, reaching the maximum value at 0°, with a mean value of 0. Fig. 2(c) and (d) shows the mean and variance of the model parameters. The mean values of m01 and m02 change periodically in a sinusoidal trend, the mean value of m03 is 0, and the variance of the three parameters changes periodically at 90°. The variance of m01 and m02 reaches the maximum at 0°, and the minimum value of m03 at 0°. After processing the simulation data, it can be seen from Table 1 that the error of the S3 component reaches its maximum when the azimuth is ±45°, corresponding to the characteristics of the model parameters. The error of the S1 and S2 components reaches its maximum at the azimuth of ±30°, but it is two orders of magnitude less than the maximum error of S3. Considering the accuracy limitation of the enumeration algorithm, the S1 and S2 components show high accuracy under different fast axis azimuths. We find that when the fast axis angle of Q2 is 0°, the minimum condition number of the instrument matrix is 3.6158. From 0° to ±45°, it shows an upward trend and reaches infinity at ±45° as determined by the instrument matrix optimization method. For the experimental data processing, the model parameters under different fast axis angles are shown (Figs. 3-6). The spatially modulated image corresponding to the horizontally polarized light under different fast axis azimuth angles is shown (Fig. 7). Combining three repetitive tests and processing, the measurement accuracy is highest and the stability is the best when the fast axis azimuth is 0° (Tables 2-4). The simulation and experimental results verify the influence of the fast axis angle on the measurement accuracy, which is consistent with our theoretical derivation and optimization results.ConclusionsIn spatially modulated polarization measurement, the setting of the fast axis azimuth of the wave plate in the spatially modulated analyzer system affects the measurement accuracy. We determine the optimal angle by optimizing the condition number of the instrument matrix. Through theoretical analysis, it is found that the azimuth angle has the greatest influence on the S3 component. We conduct simulations and experiments to verify the influence of different azimuth angles on measurement accuracy. The experimental results show that the measurement accuracy and stability are optimal when the azimuth angle is 0°. At 45°, the average error of the S3 parameter reaches its maximum, which is also consistent with theory. Through theoretical derivation and experimental verification, the influence of different fast axis azimuth angles of wave plates on the accuracy of spatially modulated polarization measurement is quantitatively analyzed, providing a theoretical and experimental basis for high-accuracy polarization measurement at low light fields.
Aug. 25, 2024Vol. 44 Issue 16 1612003 (2024)
Shuyan Zheng, Jiarui Lin, Mingxin Teng, Rao Zhang, and Jigui Zhu
ObjectiveLarge scale measurement plays a pivotal role in the manufacturing and assembly process of substantial equipment such as ships and airplanes. The distributed multi-base station measurement systems, represented by workshop measurement and positioning systems (wMPSs), have been widely used in large-scale measurement due to their characteristics of real-time, multiple objectives and tasks, high precision, and high efficiency. wMPS is made up of numerous transmitters and photoelectric receivers that are spread throughout space, and each transmitter emits two fan-shaped laser beams that rotate and scan the entire space. The model parameters used to fit the spatial surface shape of the scanning light are referred to as internal parameters. The initial observation of the instrument refers to how long it takes for the scanning light to reach the photoelectric receiver. By converting the scanning time into spatial azimuth, single station scanning angle measurement can be accomplished. Furthermore, employing an internal parameter model facilitates the achievement of multi-station spatial rendezvous, enabling the calculation of three-dimensional coordinates. The accurate description of the scanning light spatial surface by the internal reference model is crucial for ensuring the measurement precision of the instrument. The scanning laser used in wMPS disperses the point light source emitted by the semiconductor laser into a linear laser through a cylindrical mirror, thereby forming a light plane in space. Previous research has shown that optical non-uniformity, geometric errors, and assembly errors of cylindrical mirrors in lasers can induce small deformations of the optical surface in various shapes and directions when deviating from the ideal plane within large spatial domains. Therefore, the spatial surface depicted by the traditional in-plane parametric model, which assumes the scanning light surface to be an ideal plane, may not fully correspond to the actual surface, leading to systematic errors in the measurement outcomes. During the laser production process, the machining quality and assembly error of cylindrical mirrors exhibit a certain degree of randomness, rendering the optical surface deformation intricate and challenging to anticipate. Hence, devising an accurate assessment method for evaluating scanning optical surfaces and establishing a more precise internal parameter model based on the evaluation outcomes hold paramount significance for enhancing the measurement accuracy of wMPS.MethodsWe propose a novel approach for evaluating the scanning light surface shape. By fixing the wMPS transmitter on a turntable and using the turntable to drive the elevation angle of the transmitter to rotate instead of the photoelectric receiver rotating around the transmitter, it achieves subdivision sampling of different positions on the scanning light surface. On this basis, a mapping relationship between surface deformation information and the scanning time of the instrument’s original observation is established, and the scanning light surface is accurately evaluated by the difference between the ideal scanning time and the measurement time. Building upon these evaluations, a partition plane parameter model is proposed, which divides the space into multiple sub-regions based on the elevation angle. The positions for region segmentation are determined using a differential evolution algorithm, which improves the fitting effect of the parameter model and reduces instrument system errors. At the same time, it overcomes the drawbacks of low computational efficiency and high model complexity of folded and curved models. Finally, the effectiveness of the proposed research method is validated by comparing the fitting performance and coordinate measurement accuracy of the new and old internal reference models on the scanning light surface, verifying the effectiveness of the research method.Results and DiscussionsWe validate the proposed theory using the wMPS transmitter, which is fixed on a turntable with precision tooling (Fig. 4). The transmitter’s elevation angle is systematically altered at fixed intervals, and the scanning time of the two received scanning light surfaces by the photoelectric receiver is recorded. After normalizing the obtained data, a comparison is made with the ideal scanning time when the light surface is an ideal plane. The deformation of each scanning light surface relative to the ideal plane is obtained, and multiple experiments are repeated at different calibration distances. The experimental results reveal a consistent relationship between the deformation of the light surface and the distance (Fig. 5). Based on the evaluation results of the scanned light surface, the region segmentation angle of the partition plane model was determined using the differential evolution algorithm. Subsequently, the model parameters were calibrated using a high-precision coordinate field (Fig. 8, Table 1). By fitting the residuals, comparisons are made with the ideal plane model and the folded plane model (Fig. 9). For surface 1, the partition plane model, the residuals exhibit a 40% and 26% reduction in residuals on average compared to the ideal plane model and the folded plane model, respectively. For surface 2, these reductions are 10% and 6%, indicating a correlation between the improvement of the partition plane model’s fitting effect and the magnitude of surface deformation. Furthermore, a wMPS measurement network is constructed and the coordinate measurement accuracy of different models is compared. The results (Fig. 10) show that compared to the ideal plane model and the folded plane model, the partition plane model can reduce coordinate measurement errors by about 35% and 22% on average, respectively, thus establishing it as a parameter model with enhanced accuracy.ConclusionsThe inaccurate evaluation of the scanning light surface shape and poor fitting performance of the parameter model in the workshop measurement and positioning system lead to systematic measurement errors. We propose a method for evaluating the surface shape by establishing a mapping relationship between the surface deformation information and the scanning time of the instrument’s original observation. By analyzing error influencing factors, more accurate scanning of light surface shape data can be obtained. On this basis, it is proposed to use a differential evolution algorithm to calculate the optimal segmentation angle and divide the measurement space into multiple sub-regions of the partition plane parameter model, effectively improving the fitting effect of the parameter model while also considering the computational efficiency.
Aug. 25, 2024Vol. 44 Issue 16 1612004 (2024)
Qing Lin, Naifei Ren, Kaibo Xia, and Xinnian Guo
ObjectiveAt the nanoscale, it is often difficult to achieve absolute flatness and certain curvature on the deposited substrate surface. An Ag/SiO2 core/shell nanostructure model deposited on a curved substrate has been designed to address the near-field enhancement of nanoparticles under femtosecond laser action. The electromagnetic field, two-temperature model, and plasma physical field are coupled, with femtosecond laser breakdown mediated by this nanostructure carried out.MethodsWe employ the radio-frequency module, electromagnetic wave module, and frequency domain interface of COMSOL. COMSOL is multiphysics simulation software that enables the modeling and simulation of coupled physical phenomena. The electromagnetic wave propagation in different media and structures is modeled by the electromagnetic waves module, and Maxwell's equations involved in this module are solved. The two-temperature model is adopted to simulate the evolution of lattice temperature within nanoparticles. This model likely considers the separate temperatures of the electrons and the lattice, accounting for heat diffusion and energy transfer processes during femtosecond laser pulse irradiation. Meanwhile, the two-temperature model is coupled with the electromagnetic model to account for resistive losses during the interaction of the femtosecond laser pulse with nanostructures. Plasma rate equations derived from the Keldysh theory are solved to describe multiphoton ionization, avalanche ionization, diffusion, and recombination losses. These equations likely capture the complex dynamics of the plasma formed around nanoparticles due to the laser irradiation. Additionally, we calculate the dynamics of free-electron plasma density around nanoparticles by solving the plasma rate equations, which provide insights into the behavior of the plasma, including its formation, expansion, and recombination processes. The plasma dynamics model is coupled with the electromagnetic model by considering parameters such as the electric field value and changes in the dielectric function of water due to free-electron plasma formation. This ensures that the effects of plasma on electromagnetic wave propagation are accurately incorporated into the simulation. The gridded model is shown in Fig. 1, where the outer shell coating layer and deposition substrate of silver nanoparticles are silica, surrounded by water. A free tetrahedral mesh is used in the silver nanospheres, deposited substrates, and their neighborhoods, where the maximum mesh size of the silver nanospheres is 1/10 of their diameter, and the maximum mesh size of the deposited substrates and their neighborhoods is 1/20 of the laser incident wavelength. The ideal matching layer (PML) adopted for solving electromagnetic physical fields is a swept grid. We integrate multiple models and computational techniques to comprehensively analyze the interaction of femtosecond laser pulses with nanostructures, with both electromagnetic and thermal effects, and the formation and dynamics of plasma considered. Finally, this approach provides a detailed understanding of the complex physical processes involved in these interactions.Results and DiscussionsParametric scanning calculations are performed for deposition substrates with different curvatures, and the maximum relative electric field enhancement of the silver nanoparticles trimer is 12.7 times when R=140 nm and θ=20° (Fig. 7). Meanwhile, under R=190 nm and θ=20°, the maximum relative electric field enhancement of silver nanoparticles trimer is 4.37 times (Fig. 8), which shows that when θ remains unchanged, the electric field decreases when the curvature radius increases. The maximum relative electric field enhancement of silver nanoparticles trimer is 5.01 times when R=140 nm and θ=25° (Fig. 9), and it is 5.01 times when R=140 nm and θ=25°. The electric field enhancement is 3.59 times (Fig. 10), which can be observed by comparing with Figs. 7 and 8 respectively, where the electric field decreases with the increasing θ. Considering the influence of the angle θ on the near-field enhancement separately (Fig. 12), the maximum relative electric field enhancement at θ=15° is 8.25 times, and the maximum electric field position is located at the nanoparticle edge. The relative electric field enhancement at θ=20° is shown in Fig. 13, and the maximum relative electric field enhancement is 4.17 times. The relative electric field enhancement at θ=25° is presented in Fig. 14, and the maximum relative electric field enhancement is 3.5 times. As the angle θ between the nanoparticles increases, the maximum relative electric field enhancement decreases rapidly, which is caused by the distance increase between nanoparticles. When the angle θ rises from 15° to 25°, the strong mutual coupling between silver nanoparticles weakens, and the strong electric field regions shown in red evolve from overlapping each other in Fig. 12 to Fig. 13 and move away from each other in Fig. 14. In particular, this trend becomes more obvious as the spacing between nanoparticles increases. For comparison, the relative electric field enhancement is calculated when the substrate changes to a planar substrate, which means R=200 nm remains unchanged, the center distance of two adjacent nanoparticles is 53.59 nm, and its maximum relative electric field enhancement is 7.2 times (Fig. 10). Compared with Fig. 12 where the base is curved, the maximum relative electric field enhancement is weakened. Further analysis indicates that the center distance of two adjacent nanoparticles in Fig. 12, or the center arc length of two adjacent nanoparticles is 52.36 nm, which is slightly smaller than 53.59 nm in Fig. 15. The results demonstrate that the distance between nanoparticles determines the intensity of electric field enhancement, and the magnitude of relative electric field enhancement is highly sensitive to the distance between nanoparticles.ConclusionsThe results show that the near-field enhancement effect is highly sensitive to the spatial (planar/curved surface) distance between silver nanoparticles. The closer distance leads to a stronger near-field enhancement effect. Meanwhile, the bending curvature of the silver nanoparticle substrate has a greater influence on near-field enhancement, which in turn affects the breakdown energy of the femtosecond laser to the medium. Under the mediation of this new nanostructure, when the environmental medium water is ionized and broken down, the core of the silver nanoparticles does not reach the melting point and can theoretically remain intact. Finally, great significance is provided for the reuse of silver nanoparticles in practice.
Aug. 25, 2024Vol. 44 Issue 16 1614001 (2024)
Zheng Xing, Zhongru Mu, Tianyu Sun, and Baoshun Zhang
ObjectiveHigh-efficiency and low-noise 1550 nm semiconductor lasers are essential for analog optical links to maximize the system spurious free dynamic range (SFDR), which is a key feature for numerous applications such as microwave photonics systems, signal distribution in broadband analog communications as cable TV (CATV), fiber-optic sensors, high-resolution spectroscopy as well as light detection and ranging devices (LiDARs). The buried heterostructure (BH) laser has proven to be effective at reducing the relative intensity noise (RIN) and the threshold current through tight confinement of charge carriers and photons within the device active region as defined by a lateral current-blocking structure. However, the BH laser requires an additional regrowth process, which greatly increases the process complexity and cost, and highly reduces the device reliability. By conducting dual-channel H+ ion implantation to restrict the current transverse diffusion, we design and fabricate a 1550 nm high-efficiency and low RIN fundamental transverse mode DFB laser, and study the RIN and linewidth characterizations.MethodsWe adopt the AlGalnAs material that exhibits sound temperature characteristics and high differential gain as a quantum well and waveguide layer to achieve high slope efficiency and high power. Additionally, an asymmetrical cladding is employed to reduce internal loss by lowering the optical overlap between the optical eigenmode and the p-doped layers. The dual-channel laser ridge-waveguide, 11 μm/2.5 μm/11 μm wide, is formed by inductively coupled plasma (ICP) etching (Fig. 2). Lateral current spreading is suppressed by proton implantation of 350 keV with doses of 1.0×1015 cm-2 adjacent to the ridge (Fig. 1). In continuous-wave operation at room temperature, the RIN (Fig. 5), linewidth (Fig. 6), slope efficiency, and threshold current (Fig. 3) are analyzed.Results and DiscussionsIn continuous-wave operation at room temperature, the threshold current of the designed H+ ion-implanted DFB laser is less than 40 mA (Fig. 3). With injection current of 200 mA, the output power is greater than 60 mW, the slope efficiency is greater than 0.35 mW/mA (Fig. 3), the RIN is less than -160 dB/Hz (Fig. 5), and the Lorentz linewidth is less than 200 kHz (Fig. 6). In comparison, the threshold current of the non-implanted DFB laser with the same epitaxial structure is above 50 mA (Fig. 4). With injection current of 200 mA, the slope efficiency is about 0.3 mW/mA (Fig. 4), the RIN is less than -145 dB/Hz (Fig. 5), and the Lorentz linewidth is about 350 kHz (Fig. 6). At the lasing threshold, the increase in series resistance from 2.0 to 2.5 Ω caused by H+ ion implantation decreases the slope efficiency from 0.6 to 0.48 mW/mA. With the increasing injection current, the current lateral spreading predominates to improve slope efficiency and RIN via H+ ion implantation.ConclusionsBy conducting dual-channel H+ ion implantation to restrict the current transverse diffusion, we design and fabricate a 1550 nm high-efficiency and low RIN fundamental transverse mode DFB laser based on AlGaInAs material. In continuous-wave operation at room temperature, the laser yields a threshold current of less than 40 mA. With an injection current of 200 mA, the output power is greater than 60 mW, the slope efficiency is greater than 0.35 mW/mA, the RIN is less than -160 dB/Hz, and the Lorentz linewidth is less than 200 kHz. The results show that H+ ion implantation limits the current lateral spreading, improves the slope efficiency, reduces the RIN, and narrows the linewidth. Finally, a simple and highly manufacturable method of creating a low RIN and high-efficiency DFB laser is created and demonstrated.
Aug. 25, 2024Vol. 44 Issue 16 1614002 (2024)
Rui Zhou, Zhen Fang, Xinhu Zhou, Chen Jiang, and Zuxing Zhang
ObjectiveUltrafast fiber lasers have a large spectral bandwidth, very high peak power, and ultrashort pulse duration, which makes them more widely employed in many fields such as optical communications, medicine, and sensing. Ultrashort pulses are mainly generated by both Q-switching and mode-locking, where Q-switching is a technique that modulates the quality factor of the laser cavity to form a pulse under the high-quality factor in the laser cavity. Meanwhile, the energy is released in the form of laser light, leading to microsecond to nanosecond pulses. On the other hand, mode-locked pulses are formed by inducing a fixed phase relationship between the oscillating modes of the laser cavity, and their repetition frequency is determined by the round-trip time of the light in the cavity, which is typically at the mHz level. The passive mode-locking technique commonly adopted for intracavity soliton generation is a comprehensive balance of dispersion, nonlinearity, gain, and loss in the cavity. Actually, despite the growing number of studies on the implementation of Q-switched and mode-locked techniques in various lasers, there is a lack of concrete experiments on the implementation of Q-switched and mode-locked continuous switching in these systems, and even less is known about the state evolution and switching transient dynamics of the two types of pulses. Peng et al. reported the establishment process of dissipative solitons in mode-locked fiber lasers, measured the corresponding spectral dynamics using the time-stretch dispersive Fourier transform (TS-DFT) technique, and found that mode-locking was accompanied by multi-pulse generation due to modulation instability before mode-locking. Liu et al. discovered a new mode of soliton formation, or the evolutionary formation dynamics of mode-locked pulses that transition from the Q-switched phase, after observing the entire establishment process of soliton molecules in mode-locked lasers. Although all the above studies involve both Q-switched and mode-locked pulse states, they are invariably unmanipulated transient kinetic processes observed at specific pump powers. Till now, the pulse dynamics of the continuous switching between Q-switching and mode-locking have not been investigated in detail, and the continuous switching of such pulse states can be manipulated by modulating the pump. The Q-switched and mode-locked continuously switchable fiber lasers based on the nonlinear polarization rotation effect can periodically switch between Q-switched and mode-locked states under the effect of pump intensity modulation, and the switching dynamics are investigated by the real-time Fourier transform spectral detection technique.MethodsThe fiber laser consists of a 976 nm semiconductor laser (LD), a signal generator (SG; RIGOL, DG1022U), a wavelength division multiplexer (WDM), an erbium-doped fiber (EDF), a 70∶30 optocoupler (OC), a polarization-dependent grating (PDG), two polarization controllers (PCs), and a polarization-independent isolator (PI-ISO). The gain fiber (EDF) is 2 m long and is connected to the pump light source via 980/1550 nm wavelength division multiplexing (WDM), and the rest of the fiber components of the cavity are single-mode fibers (SMF-28E) with a dispersion of -22.8 ps²/km. The full cavity length is 6.17 m and corresponds to a repetition frequency of 33.529 MHz, and the net dispersion in the cavity is 0.0272 ps². The LD characteristics, such as output waveform and power, are controlled by the SG, and a PI-ISO is utilized to ensure the directionality of the light inside the cavity. The PDG, which is inscribed on a polarization-maintaining fiber (PMF) using a CO2 laser, has a high polarization-dependent loss (PDL) and low insertion loss and is integrated with two PCs, which are equivalent to saturable absorbers for enabling nonlinear polarization rotation (NPR) mode locking. Meanwhile, a 70∶30 fiber coupler is employed to extract 30% of the optical power from the cavity for testing, and the output pulse is split into two beams by a 50∶50 OC, where one beam is connected to a spectrometer (OSA; YOKOGAEA, and AQ6370D) for spectroscopic measurements, and the other is stretched and broadened by an 8 km dispersion-compensated fiber (DCF) through an 18 GHz high-speed photodetector. Additionally, the optical signals are converted to electrical signals by an 18 GHz high-speed photodetector (PD; HSPD4018), and then connected to an oscilloscope (OSC; LeCroy, SDA 11000) with a bandwidth of 11 GHz to record the real-time spectra.Results and DiscussionsFirst, the pump modulation frequency is set to 2 kHz, and the Q-switched and mode-locked states are periodically switched over a time scale of 1 ms. During a modulation cycle, the first thing that happens at low levels is the buildup of the Q-switched laser from noise. With the switching between low and high levels, the laser first enters into chirp oscillations and subsequently achieves stable mode-locking after an unstable mode-locked phase. With the switching from low to high levels, the Q-switched phase ends at a cycle number of about 6500, the energy of the ultrashort pulses in the cavity rises with the relaxation oscillations, and the pulse spectrum is subsequently broadened under the effect of self-phase modulation. However, the critical pulse energy required to achieve stable mode-locking is subsequently reduced due to the gain bandwidth limitation. In the next stage of the evolution (after 7880 cycles), mode-locking begins. As the modulation level switches to a low level, the decrease in pump power reduces the laser cavity energy, with a gradual decrease in soliton energy, while the spectrum begins to shrink toward shorter wavelengths. Until after 250 cycles, the soliton in the cavity is annihilated. After 710 cycles, the energy density level in the cavity is restored and the Q-switched pulse is re-established after 18.5 µs. Without changing other experimental conditions, the pump modulation frequency is adjusted to 5 and 10 kHz respectively. Meanwhile, more frequent intracavity energy fluctuations at 5 kHz than those at 2 kHz cause the chaotic state before mode-locking to produce multi-soliton competition. Figs. 5(c) and (d) compare the pulses of the two states at 5 kHz and 10 kHz modulation frequencies. The period and shape of the pulses of the two states basically remain stable at different modulation frequencies. This indicates that the modulation frequency change has little effect on the Q-switched and mode-locked pulses under the steady state. Without changing other experimental conditions, the pump modulation frequencies are adjusted to 5 and 10 kHz respectively.ConclusionsIn summary, an ultrafast laser capable of continuously switching between Q-switched and mode-locked states is proposed and investigated, and its state-switching dynamics under the effect of modulated pumping are investigated by the TS-DFT technique. At a low level, the laser outputs Q-switched pulses, and a stable mode-locked pulse can be established in the cavity when the modulation level is switched to a high level. A rise in the pump modulation frequency accelerates the establishment time of both pulses, but exceeding a certain upper-frequency limit causes the annihilation of both states. This continuous switching mechanism of laser output pulses breaks through the limitation of single and uncontrollable laser output pulse types in the past and provides a new idea for the design and optimization of ultrafast fiber lasers.
Aug. 25, 2024Vol. 44 Issue 16 1614003 (2024)
Wei Wang, Youling Chen, Ke Yang, Mengwei Sheng, Yuede Yang, Jinlong Xiao, and Yongzhen Huang
ObjectiveDue to the limitations on data transmission between memory and processing units, as well as RC latency associated with integrated circuits, traditional electronic computers face bottlenecks in power consumption, heat dissipation, and computing speed. All-optical signal processing and all-optical networks have attracted increasing research attention as alternatives to conventional electronic integrated circuits, given their advantages of high-speed parallel processing, low power consumption, high bandwidth, and low crosstalk. Efforts have been made in integrated photonic computing chips for optical computing and optical neural networks. All-optical logic gates provide basic units for all-optical computing, switching, and signal processing. Various all-optical logic gates with functions such as subtractors, differential equation solvers, storage elements, and other computational techniques have been reported. Microcavity lasers like VCSELs and DFBs are well-suited for realizing on-chip all-optical logic gates due to their small size and low power consumption. Here, we design a two-dimensional 2×4 semiconductor laser array of square microcavities with four waveguide ports, consisting of an upper row and a lower row. Integrated electrodes are designed at both rows to ensure that the same current is applied to each microcavity in the same row, simplifying experimental operations. The simple fabrication processes, flexible integration methods, easy on-chip integration, and multi-port light emission of the laser array facilitate its application in all-optical signal processing links. Larger scale on-chip integration can be achieved using high-density integration techniques. Additionally, the platform offers the possibility of wavelength multiplexing for parallel computing. This system thus sheds light on the next generation of all-optical computing systems.MethodsSimulation and AlGaInAs/InP epitaxial wafer are employed in our study. First, we study the magnetic field pattern, frequency, longitudinal modes interval, and quality factor (Q) of the square microcavity with four waveguide ports and the 2×4 microcavity array using two-dimensional finite element method (FEM). Then, we fabricate the 2×4 semiconductor laser array of square microcavities using AlGaInAs/InP epitaxial wafer with a photoluminance wavelength of about 1517 nm. The active region with six compressively strained 6-nm-thick quantum wells and seven 9-nm-thick barrier layers is grown on the InP substrate by metal-organic chemical vapor deposition. Contact photolithography and ICP etching are used to fabricate the array of square microcavities. The microcavity is laterally confined by a BCB layer for planarization. Afterward, a Ti/Pt/Au p-electrode is deposited by e-beam evaporation followed by a lift-off process, and an Au/Ge/Ni metallization layer is deposited by magnetron sputtering as the n-electrode. Then, the output power and lasing spectra are coupled to multi-mode fiber (MMF), and the V-I curve is tested at 293 K versus continuous injection current in the upper row. The wavelengths of these eight microcavity units have been identified by the spectra at different ports. Furthermore, the mode characteristics versus continuous injection current in the upper row with a fixed injection current in the lower row are studied.Results and DiscussionsThere are 16 fundamental modes found within the range of 1531.6 nm to 1531.7 nm, with Q factors ranging from 3966 to 10012. These modes exhibit different mode field distributions in different units. The mode field distribution for the highest-Q mode and the square microcavity unit are shown (Fig. 1). The threshold current is 26 mA, with a threshold current density of 1.28 kA/cm2. The maximum coupled power is 8.9 μW at a continuous current of 57 mA. The emission spectra are measured from ports 1, 2, 3, and 4 at an injection current of 30 mA applied solely to the upper row. Four peaks are located at 1532.11, 1534.13, 1535.37, and 1539.39 nm, corresponding to the square microcavities in the upper row at ports 3, 1, 2, and 4, respectively (Fig. 2). When an injection current of 30 mA is applied solely to the lower row, the MMF is positioned at port 2 to ensure that the intensities of the four wavelengths are almost consistent. The four peaks are located at 1532.22, 1533.22, 1535.70, and 1537.78 nm, corresponding to the square microcavities at ports 2, 3, 4, and 1 of the lower row (Fig. 3). As the injection current of the upper row increases while the injection current of the lower row is fixed at 30 mA, the four wavelengths of the lower row disappear one by one.ConclusionsIn our study, a 2×4 waveguide-connected square microcavity laser array has been fabricated, and the wavelengths of these eight microcavity units have been identified by the spectra at different ports. Differences in resonance wavelengths may result from variations in the dimensions of the square cavities during the fabrication process. From these differences in wavelengths, it can be inferred that variations in the sizes of square microcavities are within the range of 9.7-71.2 nm. This laser array enables the in-plane integration of multiple light sources, and larger-scale on-chip integration of laser arrays can be expected using high-density integration techniques. The system can be used for all-optical signal processing links in applications such as complex logic calculations. Moreover, this laser array is capable of producing multiple coherent light sources simultaneously that overlap spatially due to the multiple waveguides.
Aug. 25, 2024Vol. 44 Issue 16 1614004 (2024)
Kenan Wu, Jiadong Hu, Haiyun Xia, Jiawei Qiu, Jinlong Yuan, and Tianwen Wei
ObjectiveAerosols play an important role in the formation of cloud and precipitation. Various lidar systems, distinguished by their high temporal and spatial resolution, are employed to investigate atmospheric properties. The raw data from traditional coherent Doppler wind lidar (CDWL) used in atmospheric detection is difficult to store due to its large volume, leading to the inversion of atmospheric parameters based on the coherently integrated power spectrum rather than raw data. However, the power spectrum loses information compared to the raw data. To make the sampled raw data easier to store, we need to reduce its size without significantly decreasing the CDWL performance.MethodsWe propose a one-bit sampling CDWL for atmospheric detection, reducing the resolution of the analog-to-digital converter (ADC) to the limit of one-bit, significantly reducing the size of sampling raw data volume and simplifying data storage. We employ comparators and a time-interleaved sampling structure to construct a one-bit sampling ADC with reduced computational complexity and power consumption.Results and DiscussionsThe experimental results of continuous observations from both the 1 bit and 14 bit sampling channels are shown in Fig. 3. One-bit sampling is capable of detecting rapid changes in the atmospheric wind field and demonstrates excellent consistency in spectrum width and skewness, both aligning well with the simulated results. The differences in CNR and radial wind velocity are shown in Fig. 4. Influenced by turbulence, CNR exhibits significant enhancement, while radial wind velocity fluctuates. In the near field, the mean CNR difference is 3.28 dB with a standard deviation of 0.26 dB, whereas in the far field, it is 1.35 dB with a standard deviation of 0.78 dB. The one-bit sampling CDWL shows a slight CNR loss in the near field, but it does not affect atmospheric detection. The mean differences in radial wind velocity in the near and far fields are -0.08 m/s and -0.07 m/s, with standard deviations of 0.57 m/s and 0.86 m/s, respectively.ConclusionsWe propose a new one-bit sampling CDWL, demonstrating its advantages through simulation and comparison with a 14 bit sampling CDWL. This new one-bit sampling CDWL reduces the raw data volume to 1/16 and the power consumption of the sampling circuit to 2/9. Moreover, even under low CNR conditions, the returned signals can still be accurately distinguished. These findings reveal that the one-bit sampling can maintain the performance of CDWL, while effectively reducing the raw data volume, showcasing its potential for CDWL applications.
Aug. 25, 2024Vol. 44 Issue 16 1636001 (2024)
Bo Liu, Tingting Wang, and Jie Liu
ObjectiveMobile phone glass covers are crucial components of display screens, influencing optical display performance and user experience. Mass production necessitates rigorous defect detection due to inevitable defects like scratches and dirt. Current methods like manual inspection and traditional machine vision fall short of meeting high-volume, high accuracy demands. Addressing these challenges, we propose an improved BiSeNet V2-based semantic segmentation method for accurate and efficient surface defect detection of mobile phone covers with diverse defect types, complex shapes, and challenging background distinctions.MethodsWe introduce an improved BiSeNet V2 semantic segmentation method tailored for detecting defects on mobile phone covers. Initially, we enhance defect features using a fusion weighted image difference method to aid network model extraction, addressing unclear detect imaging and low background discrimination issues. Building upon BiSeNet V2, enhancements include a detailed branch network using grouped dilated convolution and residual structures to enhance multi-scale defect feature extraction and preserve shallow feature details. A channel attention mechanism adaptively calibrates feature channel importance, bolstering defect recognition. A multi-scale feature fusion method in the decoding network restores lost local detail, enhancing defect segmentation accuracy and precision.Results and DiscussionsIn response to various surface defects in mobile phone cover plates, such as multiple types of defects, small affected areas, a wide range of size variations, unclear defect features, and challenges in distinguishing them from the background. We adopt a lightweight semantic segmentation network based on BiSeNet V2 for defect detection. The network model is enhanced and optimized from four key aspects: improving defect feature representation, incorporating group dilation convolution, integrating attention mechanisms, and fusing multi-scale features. These enhancements effectively boost the accuracy of segmenting small and slender defect targets, enabling the classification and detection of multiple defect types. The refined model strikes a good balance between detection accuracy and detection speed. Eight samples of defect images from mobile phone cover plates are selected for detailed analysis and comparison (Fig. 14). Results demonstrate that the improved network model excels in extracting defect features and recovering shallow details, achieving notably comprehensive segmentation results for slender scratch defects, surface dust, and foreign objects. Significant improvements are observed in detecting small point-shaped targets and in distinguishing similar defects, enabling overall detection efficacy across different defect types on mobile phone cover surfaces. In practical production processes, defect detection on mobile phone cover plates prioritizes metrics such as defect sample detection, missed detections, and false detections of normal samples. We quantitatively analyze the defect detection performance on mobile phone cover plates. Utilizing the improved BiSeNet V2 network model, 354 defect samples and 100 normal samples are examined, and the detection outcomes for various defect types in image samples are statistically analyzed. Experimental results (Table 5) indicate that the proposed method achieves a defect detection accuracy of 91.27%, a misclassification rate of 5.02%, a defect detection rate of 96.29%, a leakage detection rate is 3.71%, and a normal sample misdetection rate of 1.00%. Thus, the improved network model significantly enhances defect detection capabilities across diverse surface defects of mobile phone covers.ConclusionsWe propose an improved BiSeNet V2 semantic segmentation network for detecting surface defects on mobile phone cover plates. Initially, defect image features are enhanced through weighted image difference processing, enhancing contrast between defects and background to facilitate comprehensive defect feature extraction. Subsequently, employing group dilation convolution and squeeze-and-excitation (SE) attention mechanism enhances bilateral feature extraction, accommodating defect features at diverse scales while minimizing loss of feature detail and channel-wise feature map calibration for adaptive response. Lastly, a multi-scale feature fusion method in the upsampling decoding network restores lost detail information, enhancing segmentation accuracy across various defect types and reducing missed detection rates. Experimental results demonstrate superior detection performance of the improved BiSeNet V2 network model compared to alternative semantic segmentation networks for diverse defect types on mobile phone cover plates.
Aug. 25, 2024Vol. 44 Issue 16 1615001 (2024)
Siwei Qian, Junzhe Liang, and Jin Liang
ObjectiveAs a non-contact visual measurement method, the digital image correlation (DIC) method has been widely used in the field of material deformation measurement. This method utilizes speckle matching of images before and after deformation captured by a pair of binocular cameras to measure the material’s deformation field. However, ensuring synchronization between the two cameras in high-speed vision measurement scenarios poses challenges. These scenarios often impose size limitations on the measurement device, rendering conventional binocular stereo DIC measurement systems impractical. Consequently, some studies have introduced the single-camera stereo reconstruction method into 3D DIC, where a single camera simulates multiple cameras through specialized optical devices to achieve pseudo-multi-camera measurement and complete stereo reconstruction. Nonetheless, most research focuses on utilizing single-camera stereo reconstruction technology combined with 3D DIC to measure deformation in various materials, with little attention given to designing the structural parameters for monocular stereo DIC systems. In this study, we propose an optimal design method for the structural parameters of a single-camera stereo DIC system, aiming to develop a compact system for accurate and efficient measurements. We hope that this method will contribute to the structural optimization of single-camera stereo DIC measurements.MethodsTo optimize the design of the single-camera stereo DIC system, we first analyze the structure of the four-mirror adapter in the system and derive the mathematical relationship based on the optical path of imaging. We formulate the optimization model for structural minimization as the objective function, establish constraint equations considering measurement distance, field of view, accuracy, and other conditions, and solve the optimization model using the branch-and-bound method. In addition, we provide theoretical derivations for an alternative optical path that diffuses outwardly and compare the advantages and disadvantages of the two optical paths. Furthermore, we analyze the influence of the camera’s intrinsic parameters on the structural parameters of the single-camera stereo DIC system through numerical simulations. Finally, to validate the effectiveness of the method, we conduct several experiments.Results and DiscussionsNumerical simulation results indicate that the distance between the inner and outer mirrors of the four-mirror adapter decreases with an increase in the camera’s field of view, leading to a more compact structure (Fig. 3). However, as the field of view angle increases, the measurement distance also increases while the measurement accuracy decreases (Fig. 4). Hence, there is a need to balance the compactness and measurement accuracy of the structure. The structural parameter verification experiment demonstrates that the actual measured structural parameters closely align with the theoretically calculated parameters, with a relative error of about 1% (Table 5). Point distance reconstruction experiments show a reconstruction error of 0.02 mm for both the single-camera stereo DIC method and the conventional binocular DIC method, indicating comparable reconstruction accuracy (Table 6). Translation and rotation deformation measurement experiments show minimal displacement measurement errors for the single-camera stereo DIC method, with an average relative error of 0.7% in the translation experiment (Table 7), and consistent displacement trends observed in the rotation experiment (Fig. 11).ConclusionsWe build an optimal design model for a monocular stereo DIC system based on a four-mirror adapter and solve the optimization model using a nonlinear optimization method. This approach enables the calculation of optimal structural parameters that meet specified conditions based on actual test scenarios. In addition, we analyze the influence of the camera’s intrinsic parameters on the design of structural parameters, providing insights for camera and lens selection. Experimental results indicate a relative error of about 1% between the predicted structural parameters and those measured in experiments. Furthermore, a comparison of the point distance reconstruction accuracy between the single-camera stereo DIC system and the conventional binocular DIC system shows similar accuracy levels, with a reconstruction error of about 0.02 mm for both systems. Translation and rotation experiments demonstrate minimal relative errors in measured results, and the displacement trends observed in rotation experiments align with expected results. Our method holds promising prospects for applications in measurement scenarios with narrow observation windows.
Aug. 25, 2024Vol. 44 Issue 16 1615002 (2024)
Yongjiang Xu, Yang Li, Xiaohua Deng, and Yun Shen
ObjectiveTerahertz waves have emerged as a focal point in contemporary scientific research due to their unique physical properties. The distinctive region of the waveband exhibits characteristics such as low energy and easy absorption by the atmospheric environment, posing considerable technical challenges to terahertz detection technology—a core technology in this domain. Particularly at room temperature, there are numerous constraints related to photosensitive materials for detection, device sensitivity, response speed, and technical cost. This paper focuses on the study of topological semimetal materials and performs calculations on the electronic structure and nonlinear optical properties of the Weyl semimetal NbIrTe4. The research indicates that based on the gapless topological band structure, Weyl semimetals can not only detect terahertz radiation but also generate photocurrents, thus holding promise for efficient terahertz detection at room temperature. This study aims to predict the terahertz detection potential of NbIrTe4 through systematic research and analysis, providing a scientific foundation for exploring efficient terahertz photosensitive materials, thereby advancing innovation in terahertz detection technology and fostering its broad application across various practical fields.MethodsThis study initially employs the finite displacement method to analyze the phonon spectrum of NbIrTe4, confirming its dynamical stability. Subsequently, the complex topological band structure of this Type Ⅱ Weyl semimetal NbIrTe4 is meticulously examined using first-principle calculations, revealing special surface states and Fermi arc states on the (001) plane with the aid of the surface Green’s function method. Finally, by investigating the bulk photovoltaic effect at low frequencies via the method of maximally localized Wannier functions, the photovoltaic response of the material is elucidated through an analysis of the conductivity tensor of displacement current allowed by symmetry, with a particular emphasis on its optical response in the terahertz frequency range.Results and DiscussionsIn analyzing the surface state calculation results for NbIrTe4, we unveil the strong dependence of its peculiar topological surface states and the connectivity of the surface Fermi arcs on the type of surface termination (Fig. 4). In studying its nonlinear optical properties, we precisely calculate the conductivity tensor of displacement current for its bulk photovoltaic effect—a result yet to be achieved in density functional theory calculations. Our findings demonstrate that at specific frequencies, the conductivity tensor of displacement current of NbIrTe4 is significantly pronounced, with several independent components allowed by symmetry reaching peak values in the terahertz frequency range (Fig. 6), exceeding those of typical materials by more than an order of magnitude and comparable to the response of Type I Weyl semimetals. This suggests that the enhancement of the displacement current is intimately linked to the properties of the Weyl points.ConclusionsThrough first-principles calculations, this study comprehensively resolves the unique energy-band structure of the Type Ⅱ Weyl semimetal NbIrTe4, identifying it as a highly stable Weyl semimetal phase. The surface characteristics of the material display distinctive surface Fermi arcs, and we reveal that the connectivity of its surface Fermi arcs is influenced by the type of surface termination. When examining the bulk photovoltaic effect of the non-centrosymmetric material NbIrTe4, an exceptional photoelectric response in the terahertz domain is discovered. Owing to the material’s anisotropy and symmetry influences, different photoelectric response of the conductivity tensor of displacement current emerges. Near terahertz frequencies, the peak value of the conductivity tensor component of displacement current reaches up to 407.32 μA/V2, benefiting from the novel topological states of carriers around the Weyl points. These significant findings provide scientific evidence for the immense potential of employing NbIrTe4 as an efficient terahertz photo-detection material and provide robust theoretical support and guidance for the development of future high-performance terahertz photosensitive materials.
Aug. 25, 2024Vol. 44 Issue 16 1616001 (2024)
Jiachen Gao, Sheng Zhong, Qiong Xie, Yating Yuan, and Huangjian Yi
ObjectiveFluorescence molecular tomography (FMT) is a non-invasive technique that enables quantitative analysis of pathological processes at the cellular and molecular levels in vivo. The reconstruction of FMT is an ill-posed inverse problem, making it challenging to achieve fast and accurate reconstruction. Regularization methods, such as Tikhonov regularization and sparsity regularization, are typically used to address this issue. Given that tumors are small and sparse compared to the entire imaging domain, sparsity regularization is usually beneficial. The fast iterative shrinkage thresholding algorithm (FISTA) is proposed for theL1-norm regularization problem and has shown good performance. Classical FISTA employs a linearly increasing search strategy to determine the Lipschitz constant. However, if the proximal gradient condition is satisfied during the initial stages of algorithm iteration, the Lipschitz constant remains unchanged, hindering the convergence of the algorithm. To address this issue, we propose a step-size search method based on a restart strategy, which can provide appropriate Lipschitz constants during the iterations to accelerate the convergence speed of FISTA.MethodsIn this study, an adaptive Lipschitz constant is provided at each iteration. The Lipschitz constant is increased by a growth factor containing gradient information. When the Lipschitz constant remains unchanged between two iterations, it may be too large, resulting in a small step size and slow convergence. Therefore, a truncation restart strategy is employed. The initial Lipschitz constant is selected as the current Lipschitz constant. We call this method restart fast iterative shrinkage thresholding algorithm (R-FISTA).Results and DiscussionsTo test the performance of R-FISTA, numerical simulation experiments and in vivo experiments are conducted with both classical FISTA and R-FISTA. In the simulation experiments with different numbers of excitation points, R-FISTA takes less time compared to FISTA (Table 2 and Fig. 2). In addition, different levels (5%, 10%, 15%, 20%, 25%) of noises are considered to test the stability of the method. We find that R-FISTA provides better results according to location error (LE) compared to FISTA (Fig. 3 and Fig. 4). Notably, R-FISTA consumes less reconstruction time compared to FISTA. The real mouse experiment further shows that R-FISTA has a faster convergence speed compared to FISTA, consistent with the simulations (Fig. 2 and Fig. 4). These results demonstrate that R-FISTA accelerates the convergence speed of FISTA.ConclusionsIn this study, we propose a fast reconstruction algorithm for FMT based on FISTA, named R-FISTA. A restart strategy is proposed to search for the step size, providing appropriate Lipschitz constants during the iterations, thereby accelerating the convergence speed of FISTA. Numerical simulation experiments and in vivo experiments have shown that compared with classical FISTA, the R-FISTA algorithm effectively accelerates the reconstruction speed while ensuring high accuracy of FMT reconstruction. This fast reconstruction algorithm makes real-time 3D reconstruction possible. Deep learning has been a hot topic in recent years and has been applied to FMT, such as 3D deep encoder-decoder networks and stacked autoencoder neural networks. However, the explanation and generalization of deep learning methods need further study. Our future work will focus on combining the model with the network to solve the ill-posedness of FMT.
Aug. 25, 2024Vol. 44 Issue 16 1617001 (2024)
Ziran Chen, Bo Li, Yuhong Zhang, Yuan Li, Xudong He, and Liping Zhang
ObjectiveThird-order nonlinear optical (NLO) materials possess unique conjugated π-electron systems in their molecular structure, enabling nonlinear optical conversion processes like optical frequency doubling and frequency tripling. Organic conjugated pigment molecules, representing this category, offer significant advantages such as large nonlinear optical coefficient, low direct-current permittivity, substantial mechanical strength, good chemical stability, and processability. The π-electron conjugated structure of these molecules enhances the third-order nonlinear polarizability χ3. Azo aromatic organic compounds containing NN double bonds demonstrate excellent charge transport channels, thus exhibiting promising nonlinear optical properties. The molecule benzo [b] naphtho [2', 3':5,6][1, 4] dithiino [2, 3-i] thianthrene-5, 7, 9, 14, 16, 18-hexanone (PA) features a rigid conjugated plane with significant delocalization, it is connected to the electron-donating group (phenyl) through the conjugate bridge chain NN, and the large π-conjugated parent structure is connected to the electron-donating azo group. This enhances the delocalization of electrons, allowing for the design of organic molecular transport materials with D-π-A-π-D structural molecules. PA exhibits remarkable rigidity in its conjugated plane and delocalization properties, especially due to its extensive π-conjugated core structure linked with electron-donating azobenzene groups, resulting in significant third-order nonlinear polarization responses under intense laser conditions. Therefore, the molecular structure, transition dipole moment, molecular charge distribution, electrostatic potential (ESP) distribution, electronic spectra, and third-order nonlinear optical properties of PA and its 36 derivatives containing azobenzene are theoretically calculated to investigate the effects of introducing azobenzene into the 1, 10-position, 1, 11-position, 1, 12-position, 1, 13-position, 2, 11-position, 2, 12-position, and 2, 13-position of the PA molecules, respectively. Furthermore, the effects of introducing different electron-donating groups such as —NH2, —NHCH3, —N(CH3)2, —NPh3, and —KZ (N-phenylcarbazole) in the para-position of the azobenzene ring on the third-order nonlinear optical properties are further explored. Based on the trend of these changes, this investigation provides theoretical bases for the design and synthesis of diazobenzene PA-containing third-order nonlinear optical materials with excellent properties.MethodsDensity functional theory (DFT) with B3LYP and CAM-B3LYP methods, coupled with the 6-311++g(d,p) basis set, is employed to conduct comprehensive structural and vibrational calculations of PA and its 36 derivatives containing azobenzene moieties. In addition, a natural orbital charge distribution analysis is conducted. Transition dipole moments, electrostatic potential (ESP) distributions, frontier molecular orbitals, and electron absorption spectra of molecules f1-f6 are computed based on TD-B3LYP/6-311++g(d,p) theory. Subsequently, Multiwfn 3.8 software is utilized for results of in-depth processing of CAM-B3LYP and finite field method to investigate the third-order nonlinear optical properties of all 37 molecules.Results and DiscussionsResults reveal that the six molecules f1-f6 adopt D-π-A-π-D structures (Fig. 5 and Table 2) with energy gap values ranging from 1.33 to 2.03 eV (Fig. 6), characteristic of organic semiconductor materials. Transition dipole moments of azobenzene-containing groups [—N(CH3)2, —NPh3, and —KZ (N-phenylcarbazole)] are calculated at different positions (1, 10; 1, 11; 1, 12; 1, 13; 2, 11; 2, 12) under B3LYP/6-311++g(d, p) and CAM-B3LYP/6-311++g(d, p) levels. While numerical differences exist between the two methods, the trends remain consistent (Fig. 5). Notably, the introduction of these groups results in maximum transition dipole moment values for f-series molecules. Analysis indicates that the transition dipole moment μ01 primarily influences the third-order NLO coefficient γ, with larger μ01 values correlating with improved NLO performance. It is noteworthy that the significant enhancement in the third-order NLO performance observed when these groups are introduced at 2, 12 sites (i.e., f-series). The electrostatic potential (ESP) distributions for molecules f1-f6 reveal negative charges predominantly congregating near the six ketone groups (Fig. 5), while positive charges mainly distribute along the molecular chains. The strongest absorption peaks and lowest energy absorption peaks occur in the order f1→f2→f3→f4→f6→f5 (Table 3 and Fig. 7), with charge transfer spectra (CTS) analysis (Table 4) revealing corresponding increases in the third-order NLO coefficient γ with increasing charge transfer amounts. Introducing azobenzene-containing groups at different positions (1, 10; 1, 11; 1, 12; 1, 13; 2, 11; and 2, 12) of PA resulted in varying third-order NLO coefficient γ, with relatively smaller values observed for introductions at 1, 10 and 1, 13 positions, ranging from 4.508×10⁵ to 51.565×10⁵ a. u., and larger coefficients observed for introductions at 2, 11 and 2, 12 positions, particularly with the latter yielding maximum third-order NLO coefficient γ ranging from 10.443×10⁵ to 73.815×10⁵ a.u., nearly an order of magnitude larger than reported diazo derivatives (3.10×10⁵ to 7.50×10⁵ a.u.) (Table 3 and Fig. 5). Across the six series, introducing —NH2, —NHCH3, —N(CH3)2, —KZ (N-phenylcarbazole), and —NPh3 groups sequentially increases the third-order NLO coefficient γ, with significant enhancements observed particularly with —N(CH3)2, —KZ (n-phenylcarbazole), and —NPh3 groups.ConclusionsThe electronic absorption spectra and third-order nonlinear optical properties of PA derivative molecules have been studied based on the density-functional theory B3LYP and long-range effect positive CAM-B3LYP methods. The results show that 36 molecules of the six series a-f exhibit a D-π-A-π-D structure. Particularly, molecules in the f series, where azobenzene-containing groups are introduced at positions 2,12 of the parent PA molecule, exhibit notably enhanced transition dipole moments. The third-order nonlinear optical coefficient γ of these molecules reaches 107 orders of magnitude atomic units (10-33 esu), indicating good third-order nonlinear optical properties and optimal substitution positions. In comparison to the PA molecule, molecules f4-f6, featuring azobenzene terminated with strong electron-donating groups such as —N(CH3)2, —KZ (N-phenylcarbazole), and —NPh3 at the 2, 12 position, exhibited significantly heightened absorption peak wavelengths. Moreover, the third-order nonlinear optical coefficient γ of these molecules increased by 2.6 to 6.3 times, indicating the efficacy of introducing azobenzene with strong electron-donating groups at the 2, 12 position of the PA molecule in enhancing system’s third-order optical properties. This suggests that introducing azobenzene containing strong electron donor groups at the 2, 12 position of the PA molecule enhances the third-order nonlinear optical properties of the system, thus facilitating the development of superior third-order nonlinear optical materials.
Aug. 25, 2024Vol. 44 Issue 16 1619001 (2024)
Lifu Zhang, Tao Zhang, Mengyan Li, Heming Deng, Fengguang Luo, and Liu Yang
ObjectiveCoherent optical communication is a main research focus in fiber optic communication and is suitable for modern communication networks due to its large bandwidth and long transmission distance. For long-distance fiber optic communication systems, increasing the launch power can improve the transmission distance and system capacity, but it will also result in the enhancement of nonlinear effects. With the rising transmission distance and communication rate of today’s communication systems, increasing the launch power not only improves the system capacity but also causes more obvious nonlinear effects. The digital back propagation (DBP) algorithm can compensate for the noise in optical fibers, but its high complexity limits its applications in coherent optical communication. Therefore, we propose a design method for the step size of the DBP algorithm for power equalization and introduce an independent power compensation factor for each step. The results show that both the step length design method and the introduced power compensation factor improve the ability of the DBP algorithm to compensate for nonlinear effects.MethodsWe focus on the nonlinear effects in optical fibers and investigate methods to compensate for them. Firstly, we investigate the DBP algorithm, which utilizes DSP technology to programmatically construct a virtual link in the digital domain with the same length as the real transmission fiber link but with opposite transmission parameters (loss, dispersion, and nonlinear coefficients), thus realizing the damage compensation in the optical fiber. Then the iterative process of the DBP algorithm is studied, the existing step-size design algorithms are derived, and numerical simulations are carried out in accordance with the formulas to analyze the power fitting of different step-size design algorithms in carrying out the iterations, with a step-size design method considering the power fitting being proposed. For the proposed power equalization step, an independent power compensation factor is also introduced for each step and optimized by adopting a genetic algorithm. Finally, the algorithms using different step sizes are simulated to verify the compensation performance difference of various algorithms.Results and DiscussionsThe proposed equal power step DBP (EP-DBP) has better nonlinear compensation performance than the existing DBP algorithms. Under the same transmission power, the Q factor of logarithmic step DBP (LS-DBP) and equal power step EP-DBP are higher than that of constant step DBP (CS-DBP), and the optimal transmission power is improved, which indicates that the optimized step size is effective in improving the compensation performance. Under different modulation formats, the Q factor of EP-DBP is improved by 0.37 dB, 0.50 dB, and 0.57 dB over CS-DBP, and that of EP-DBP is improved by 0.21 dB, 0.18 dB, and 0.29 dB over LS-DBP, respectively.ConclusionsWe propose a nonlinear coefficient optimization method based on equal power DBP, which includes a step design method based on equal power and a power compensation coefficient optimization method based on genetic algorithms. Meanwhile, a remote fiber optic communication system is established, and various DSP algorithms are employed to compensate for the receiver end respectively, with the performance of different algorithms compared. The results show that DBP outperforms EDC in nonlinear compensation, and EP-DBP outperforms CS-DBP and LS-DBP in nonlinear compensation, with Q factor improvements ranging from 0.37 dB to 0.53 dB and 0.18 dB to 0.29 dB respectively. Additionally, EP-DBP also reduces the complexity by about 50% without performance loss, and under larger step sizes, its compensation is more favorable. The improved power compensation factor optimization method based on power iso-distribution can effectively lower the complexity of the DBP algorithm and improve the nonlinear compensation effect.
Aug. 25, 2024Vol. 44 Issue 16 1619002 (2024)
Zhao Xue, Baodong Yang, Keru Zang, and Haitao Zhou
ObjectiveAtomic optical filters are widely utilized in free-space optical communication, laser frequency stabilization, and other fields due to their narrow bandwidth, high transmission, and excellent noise suppression capabilities. Several methods are commonly employed to achieve these filters. The Faraday anomalous dispersion optical filter (FADOF) and Voigt anomalous dispersion optical filter (VADOF) use magnetic fields to induce birefringence in atomic vapor, resulting in the rotation of the polarization plane of the signal light. These methods have been extensively researched. While magneto-optical rotation filters have narrow bandwidths, they are typically on the order of GHz. Another type, the induced-dichroism atomic optical filter (IDAOF), utilizes circularly polarized laser light to polarize the atomic medium and induce polarization plane rotation without needing a magnetic field, achieving narrower bandwidths on the order of MHz. Thus, developing ultra-narrow bandwidth and high transmission atomic optical filters at various wavelengths and with different atoms is a significant research focus.MethodsWe realize an ultra-narrow bandwidth nonlinear optical filter at an operating wavelength of 852 nm based on the 133Cs atom 6S1/2→6P3/2 hyperfine transitions. The filter is achieved by leveraging circular dichroism, the saturated absorption effect, and the Faraday effect. The experimental setup (Fig. 2) divides the 852 nm laser provided by the extended cavity diode laser into two parts: one beam serves as high-power pump light and is circularly polarized by adjusting the optical axis direction of a λ/4 wave plate, while the other beam, with lower power, acts as the signal light and passes through a 133Cs atomic vapor cell (5 cm length, no buffer gas). A pair of Glan-Taylor prisms with an extinction ratio up to 105∶1 and perpendicular polarization directions is placed on both sides of the 133Cs vapor cell. The temperature of the 133Cs vapor cell can be adjusted from room temperature to 150 ℃ with an accuracy of less than 1 ℃. The temperature-controlled 133Cs vapor cell is placed in a custom-made axial magnetic field generating device, where the magnitude of the axial magnetic field, parallel to the light propagation direction, is conveniently controlled by adjusting the number of magnetic columns within the range of 0-0.1 T. The linearly polarized signal light and circularly polarized pump light are overlapped in the 133Cs vapor cell, with the beam diameter of the pump laser being larger than that of the signal light for better spatial overlap. The transmitted signal light after the filter enters the photodetector and is recorded by the digital storage oscilloscope.Results and DiscussionsIn the experiment, we measure in detail the dependencies of the nonlinear optical filter on various experimental parameters, including the power of the 852 nm circularly polarized pump laser and linearly polarized signal light, the temperature of the 133Cs vapor cell, and the magnitude of the axial magnetic field. The typical results are shown in Fig. 3: under the weak axial magnetic field of 5.5×10⁻⁴ T, the transmission of the nonlinear optical filter is significantly improved compared to the IDAOF alone, when the frequency of the 852 nm laser is scanned over the 6S1/2(F=4)→6P3/2 and 6S1/2(F=3)→6P3/2 transitions, respectively. With the increasing power of the circularly polarized pump laser, the transmission of the nonlinear optical filter also increases and then tends to saturate, as shown in Fig. 4. On the one hand, the intensive pump laser enhances the circular dichroism effect, causing the polarization plane of the linearly polarized signal light to rotate by a larger angle, thus improving the transmission of the optical filter. On the other hand, the strong pump laser excites more atoms from the ground state 6S1/2 to the excited state 6P3/2, resulting in weaker absorption of the signal light by the atomic medium, known as the saturation effect, further improving the transmission of the optical filter. When the temperature of the 133Cs vapor cell varies between 30 ℃ and 55 ℃, the transmission of the filter first increases and then decreases. As the temperature rises, the number of atoms interacting with the light fields increases, thus improving the transmission of the optical filter. However, too high a temperature leads to increased absorption of the signal light, and the transmission of the optical filter decreases accordingly, as shown in Fig. 5, with the optimized temperature being 40 ℃. To achieve an ultra-narrow bandwidth nonlinear filter, we use a weak axial magnetic field, which improves the transmission of the optical filter while ensuring a narrow bandwidth. Under most experimental conditions, the bandwidth of the filter is less than 60 MHz, as shown in Fig. 4-6. Finally, we explore the influence of signal light power on the performance of the optical filter. When the power changes from 50 µW to 400 µW, the peak transmission and bandwidth of the nonlinear filter show a slow increasing trend (Fig. 7).ConclusionsWe comprehensively utilize circular dichroism, the saturation effect, and the Faraday effect to realize a resonant ultra-narrow-bandwidth nonlinear optical filter at 852 nm based on the 133Cs 6S1/2→6P3/2 transitions. Compared with the previous FADOF of the 133Cs atom at 852 nm with a bandwidth ~GHz, the bandwidth of this nonlinear optical filter is reduced by two orders of magnitude. With the optimized experimental parameters, we find that the peak transmission of the filter can reach 30% and the bandwidth is less than 60 MHz when the temperature of the 133Cs vapor cell is 40 ℃ near room temperature and the weak axial magnetic field intensity is 5.5×10⁻⁴ T. This resonant ultra-narrow bandwidth optical filter may be suitable for optical systems such as frequency-stabilized lasers and atomic clocks.
Aug. 25, 2024Vol. 44 Issue 16 1619003 (2024)
Chen Mao, Bo Xiao, Chunyang Wang, Yifan Bai, Siling Huang, and Dasen Wang
ObjectiveRing-pendulum double-sided polishing, a novel type of double-sided polishing process, enables simultaneous processing on the upper and lower surfaces of the components, reducing polishing parallelism errors and enhancing processing efficiency. However, currently, the processing primarily relies on technicians using trial-and-error methods, to accumulate experience for selecting appropriate process parameters. This approach lacks controllability and repeatability, mainly because the prediction of the surface pre-processing is based on the relative speed between the abrasive grain and the component surface, and the number of scribes to calculate the distribution of material removal. This method overlooks the influence of contact surface pressure on the material removal. As a result, discrepancies arise between predicted outcomes and the actual distribution of polished material removal, failing to provide an effective guide for the decision-making on process parameters.MethodsWe analyze the working principle of the ring-pendulum double-sided polishing equipment, carry out a kinematic analysis of abrasive particles, and obtain the instantaneous relative velocity field distribution between the polishing disc and the component surface. We examine the influence of polishing pressure on the component’s processing surface, establish a finite element model of the pressurized cylinder, component, and polishing disc, set constraints according to the pressure loading situation during actual processing, and conduct finite element simulation analysis. Our analysis yields the pressure distribution law on the component surface under both self-weight and pressurized conditions of the upper polishing disc. The data are fitted using the least squares method to construct a pressure distribution model of the contact surface between the ring-pendulum double-sided polishing element and polishing disc. By coupling the instantaneous relative velocity field model of the element and the polishing disc with the pressure model of the contact surface, we derive the instantaneous removal at each point on the component surface according to Preston’s equation. The summation of instantaneous removal constructs the prediction model for material removal in ring-pendulum double-sided polishing.Results and DiscussionsIn this study, we select 430 mm×430 mm×10 mm fused silica elements for practical process experiments. Three components with different initial face types are chosen for processing. The accuracy of the material removal prediction model is verified through three comparative experiments. We investigate the effects of processing pressure and upper disc size on the distribution and uniformity of material removal. Experimental results indicate that larger diameters of the upper polishing disc and lower machining pressures contribute to better uniformity in material removal.ConclusionsGuided by the removal distribution prediction model, we apply the derived principles to actual processing. Fused silica samples with an initial surface profile peak-valley (PV) value of 2.09λλ=632.8 nm and a root mean square (RMS) value of 0.464λ are selected. Through the material removal prediction model (Fig. 25), we obtain optimal solutions for process parameters. After processing, the surface PV of the component is reduced to 0.85λ, and the RMS value decreases to 0.137λ (Fig. 26). The time required to reduce the component surface PV below λ is cut to 50% of the original duration, achieving rapid convergence of the component surface profile.
Aug. 25, 2024Vol. 44 Issue 16 1622001 (2024)
Chengming Ren, Qi Chen, and Qingyu Meng
ObjectiveFeaturing the ability to eliminate all primary aberrations and achieve large apertures, achromaticity, and sound environmental adaptability, off-axis three-mirror anastigmat (TMA) optical systems are increasingly being adopted in space optics. To obtain target images with a larger spatial range and more spatial details, off-axis TMA optical systems are continuously evolving toward a large field of view (FoV) while pursuing high image quality. However, when it comes to the final realizability of these high-performance optical systems, the optimization design solution is only the start, and error sensitivity is a critical factor that determines whether an optical system can yield excellent as-built performance. According to the aberration theory, optical aberrations increase exponentially with the FoV, leading to dramatically increasing error sensitivity as the FoV expands. Therefore, simultaneously achieving high performance, large FoV, and low error sensitivity is of significance for the design and implementation of high-performance imaging in large FoV off-axis TMA optical systems.MethodsBased on previous research, we modify the error sensitivity evaluation function with curvature control, and make it more concise. Meanwhile, a low error sensitivity design method that runs through the entire optical system design is proposed. By utilizing the image quality evaluation function and error sensitivity evaluation function, a non-dominated sorting genetic algorithm (NSGA-II) is employed to select the initial structure within the specified parameter ranges. This process aims to select reasonable initial structures that yield both high image quality and low error sensitivity. Subsequently, the initial structure undergoes FoV expansion and error sensitivity optimization based on specific design criteria. By integrating the FoV expansion process with error sensitivity optimization at each step, we can gradually approach the ideal balance of error sensitivity and FoV. Finally, an off-axis TMA optical system with a large FoV and low error sensitivity is achieved.Results and DiscussionsBy taking the example of designing an off-axis TMA optical system with a focal length of 100 mm, an F number of 6.7, and an FoV of 40°×4°, we validate the effectiveness of the proposed method. Firstly, the NSGA-II algorithm is employed to generate the Pareto front (Fig. 4). Since there is no significant difference in image quality among the generated 500 optical systems, we uniformly select ten optical systems from the three sets of solutions. Thirty system layouts and sensitivities are shown in Fig. 5, with system II-10 corresponding to the lowest optical system error sensitivity and having a reasonable structural layout. By employing system II-10 as the initial structure, three rounds of FoV expansion are conducted, and error sensitivity is optimized during the expansion. The error sensitivity evaluation function is controlled to be below 0.0092. Characterized by large FoV and low error sensitivity, the off-axis TMA optical system that meets the requirements is named system 3 (Fig. 6). To demonstrate the necessity of error sensitivity optimization, we set up a control group. The control group still adopts system II-8 as the initial structure and undergoes the same three rounds of the FoV expansion process, thus generating system 4 (Fig. 7). The difference between system 3 and system 4 is whether the error sensitivity is optimized, and system 4 has a 46.85% lower error sensitivity than system 3 (Fig. 8), which demonstrates that both a good initial structure and subsequent error sensitivity optimization are indispensable during the optical design. Without optimizing the error sensitivity, optical designers may design a system with better performance than system 3 when expanding the FoV, or they may end up with a system that has poorer error sensitivity than system 4. Therefore, it is difficult to determine whether the final design result has low error sensitivity. The proposed method precisely provides a clear design direction for reducing error sensitivity from the beginning, thereby improving the design efficiency of the off-axis TMA optical systems with a large FoV and a low error sensitivity.ConclusionsOptical systems with low error sensitivity have a strong capability to resist error interference, leading to minimal degradation in image quality caused by errors and yielding better as-built performance. We propose a method for designing an off-axis TMA optical system with a large FoV and low error sensitivity by combining initial structure selection with error sensitivity optimization. The proposed method is based on the curvature control evaluation function and the NSGA-II algorithm. Sensitivity reduction design spans the entire process from the initial structure selection to the final design result. By controlling error sensitivity at each round of FoV expansion, an off-axis TMA optical system with a large FoV, a low error sensitivity, a focal length of 100 mm, an F number of 6.7, and an FoV of 40°×4° is ultimately designed. By comparing two optical systems designed from the same low error sensitivity initial structure, error sensitivity optimization during FoV expansion can reduce error sensitivity significantly. The results indicate that a sound initial structure alone cannot determine whether the final design has low error sensitivity. In designing off-axis TMA optical systems with a large FoV and a low error sensitivity, both a good initial structure and subsequent error sensitivity optimization are indispensable. Our method combines the two aspects, thereby making it more comprehensive and practical.
Aug. 25, 2024Vol. 44 Issue 16 1622002 (2024)
Huijie Zhao, Shujing Sun, Shijie Wang, and Qi Guo
ObjectiveAn acousto-optic tunable filter (AOTF) possesses significant advantages, including rapid wavelength switching, continuous tuning of the central wavelength, and flexible operation, making them widely utilized in spectral spectroscopic detection. Current commercial AOTF products employ tellurium dioxide crystals as the acousto-optic medium, with an operational spectral range limited to 4.5 μm due to the crystal’s transparency range. In contrast, mercurous bromide crystals exhibit a higher transmission rate across the visible to the far-infrared spectrum (0.5-30 μm) and possess excellent acousto-optic performance. Therefore, researching the acoustic and optical field modeling within mercurous bromide crystals is of significant importance. Both tellurium dioxide and mercurous bromide crystals exhibit strong acoustic and optical anisotropy. While theoretical analysis of the impact of optical anisotropy on diffraction efficiency in acousto-optic devices has been progressively refined, the influence of acoustic anisotropy has been largely confined to considerations of the deviation in sound energy direction. Changes in sound field intensity and phase distribution caused by acoustic anisotropy have a non-negligible effect on diffraction efficiency that cannot be ignored. This paper proposes a method for acoustic field modeling using the angular spectrum approach, followed by the calculation of optical diffraction efficiency under the sound field distribution with the coupled wave method. The results provide acoustic field data for the computation of acousto-optic interactions in mercurous bromide crystals across the mid-long wave spectral region.MethodsWe utilize the angular spectrum method to construct an analytical model of the sound field, building a calculation model applicable to mercurous bromide and tellurium dioxide crystals, considering their acoustic anisotropy. This method achieves the distribution of the sound field within the mercurous bromide crystal and numerically iterates the diffracted light energy at any position in the sound field. Ultimately, it obtains the distribution of diffraction efficiency at different positions on the AOTF passband. The simulation results are compared and verified with actual measurements, thereby validating the accuracy of the simulation model.Results and DiscussionsThe acousto-optic interaction surface intensity distribution at a driving frequency of 10 MHz is compared between mercurous bromide and tellurium dioxide [Figs. 5(a) and 5(c)]. The length of the Fresnel region in mercurous bromide’s intensity distribution is greater than that of tellurium dioxide. The phase distribution of the acousto-optic interaction surface is also compared between tellurium dioxide and mercurous bromide [Figs. 5(b) and (d)]. As the sound propagation distance increases, the curved shape of equal phase lines in mercurous bromide reduces the diffraction efficiency. In contrast, the phase distribution of tellurium dioxide is closer to that of a plane wave, but its phase divergence is more severe than that of mercurous bromide. The simulated values are consistent with the measured values (Table 1). The main reasons for the deviation are threefold: the angle of the incident light in the test optical path deviates from the theoretical angle; the acoustic field energy is enhanced by the reflected waves at the crystal boundary, causing a large difference in energy along the direction of sound propagation; the acoustic field model does not consider sound energy conversion, resulting in the actual measured values being slightly less than the simulated data values.ConclusionsWe introduce a method for acoustic field modeling that is applicable to simulating the acoustic field within mercurous bromide crystals. Its effectiveness has been proven through experimental verification on a tellurium dioxide acousto-optic device. The simulation results show that within anisotropic acousto-optic crystals, the intensity and phase distributions of the acoustic field are uneven. A comparison of the acoustic field distribution in the two crystals under the same conditions reveals that the phase non-uniformity of mercurous bromide crystals is more pronounced in the acousto-optic tunable filter (AOTF). This finding highlights the importance of considering the acoustic field distribution when analyzing the diffraction efficiency of devices. The effect of the acoustic field distribution on the diffraction efficiency of the incident light was determined through the analysis of the coupled-wave model and numerical calculation methods. The experimental data also shows a downward trend in diffraction efficiency with an increase in the propagation length of the acoustic field and a significant reduction in diffraction efficiency at the boundaries of the transducer. These findings indicate that selecting an appropriate AOTF optical window is necessary, and the simulation results have been validated through actual measurement data. Therefore, this acoustic field simulation model can provide a theoretical basis for the selection of optical windows and system calibration in designing new mid-wave AOTF devices for mercurous bromide crystals.
Aug. 25, 2024Vol. 44 Issue 16 1623001 (2024)
Wenjun Sun, Jingli Wang, Liang Yin, Hongdan Wan, Heming Chen, and Kai Zhong
ObjectiveTerahertz vortex beams are a type of optical beam with a helical optical phase structure and frequencies in the range of 0.1-10 THz. Meanwhile, they have potential applications in emerging fields such as high-resolution terahertz imaging, electron acceleration, and manipulation of quantum states. The terahertz coding phase gradient metasurface serves as an important device for modulating terahertz waves, featuring simple structure, small size, low cost, low loss, and high efficiency. By introducing phase gradients in the super-unit-cell, the coding elements are formed to enable more flexible control of electromagnetic waves by altering the coding elements and coding sequences. Currently, the generation of multibeam multi-modal terahertz vortex waves is generally achieved by adopting the coding metasurface. However, this approach requires a large number of coding metasurface units, resulting in high computational complexity and a complex design process with large dimensions. To generate multibeam multi-modal terahertz vortex waves more flexibly and simply, we propose a transmissive coding phase gradient metasurface. By utilizing Fourier convolution operations and the phase superposition principle, the generation of multibeam multi-modal terahertz vortex waves is realized. This technology holds potential application significance in fields such as wireless communication and high-resolution imaging.MethodsFirst, we design the transmission metasurface units based on the Pancharatnam-Berry (PB) geometric phase principle. Next, the designed metasurface units are employed to form the 6×6 super-unit-cell, in which phase gradients are introduced to create coding elements. Then, three coding phase gradient metasurfaces are designed to produce double beams and generate single beams of l=-1 and l=-2 vortex waves. Additionally, Fourier convolution of the double beams coding sequences is performed with the vortex wave coding sequences of different modalities, with the coding phase gradient metasurface for generating single-mode double beams vortex waves acquired. The phase distribution of the coding phase gradient metasurface which generates double vortex beams with l=-2 is matrix inversion and then combined with the phase distribution of the coding phase gradient metasurface which generates double vortex beams with l=-1 using the phase superposition principle, thus preventing the overlapping of spiral waves generating different modes. By arranging the coding elements, this process leads to the coding phase gradient metasurface capable of generating multibeam multi-modal terahertz vortex beams.Results and DiscussionsWhen 2.0 THz x- and y-polarized waves are vertically incident on the metasurface units (Fig. 1), the amplitudes of the co-polarized transmission for both polarizations are approximately 0.9, and their co-polarized transmission phase differences are close to 180°, which meets the requirements of the PB geometric phase principle (Fig. 2). Then, phase gradients are introduced in the super-unit-cell and 2-bit coding elements are designed (Fig. 4). Based on the Fourier convolution operation (Fig. 9) and phase superposition principle, the coding phase gradient metasurface is designed (Fig. 12). The far-field scattering of the coding phase gradient metasurface is simulated by CST Microwave Studio. The results show that under the vertical incidence of 2.0 THz linear polarization (LP) waves, it is possible to simultaneously generate two vortex beams of l=-1, two vortex beams of l=-2, two vortex beams of l=+1, and two vortex beams of l=+2 [Fig. 13(a)]. Additionally, these eight vortex waves do not overlap and do not interfere with each other. The elevation angle θ and azimuth angle φ of each beam can also be obtained [Figs. 13(b) and (c)]. In the x-direction, there are two vortex beams of l=-1 with an azimuth angle of 270° and elevation angles of 58° and 78° respectively. In the +y direction, there are two vortex beams of l=+2 with azimuth angles of 25.5° and 333.5° and an elevation angle of 65°. In the +x direction, there are two vortex beams of l=+1 with an azimuth angle of 90° and elevation angles of 55° and 80° respectively. In the -y direction, there are two vortex beams of l=-2 with azimuth angles of 153° and 207° and an elevation angle of 46°.ConclusionsWe propose a coding phase gradient metasurface working at a frequency of 2.0 THz based on the PB geometric phase principle, Fourier convolution operation, and phase superposition principle. Under the vertical incident of the LP wave, a newly coding phase gradient metasurface can generate eight vortex waves in total, with mode orders of l=±1 and l=±2 respectively. Compared to the reported metasurfaces for generating multibeam multi-modal terahertz vortex waves, this metasurface features small dimensions, relatively simple principles, few unit elements, easy material acquisition, and the ability to design different modes of vortex waves. This enables more flexible and diverse control of terahertz beam steering. Finally, potential applications are presented in wireless communication, radar, high-resolution imaging, energy transfer, and stealth technology.
Aug. 25, 2024Vol. 44 Issue 16 1624001 (2024)
Zhefei Wang, Chao Li, Fayu Wan, Qingsheng Zeng, Jiahui Fu, Qun Wu, and Mingxin Song
ObjectiveA frequency-selective surface (FSS), an artificial electromagnetic metamaterial, is a planar periodic structure extensively studied in various fields such as filters, absorbers, and polarization converters. However, most metasurfaces focus solely on single-function realization and cannot switch between harmonic functions. With the development of multifunction and intelligent devices, the static nature and narrow bandwidth of single-function FSS are inadequate for complex operational scenarios. Recently, attention has turned towards multifunctional switching FSS capable of dynamically altering their states. However, these FSSs can only switch between transmission and shielding, lacking the capability to regulate electromagnetic polarization characteristics and achieve independent polarization control. Therefore, we propose a multifunctional, reconfigurable wideband FSS. Compared to traditional frequency-selective surface structures, this design enables switching between second-order filtering and polarization rotation functions while independently controlling transverse electric (TE) and transverse magnetic (TM) waves polarization. These features render the technology promising for applications such as multi-mode radomes requiring high transmittance and broadband, and for meeting specific polarization signal requirements during antenna transmission and reception.MethodsWe introduce an electromagnetic metasurface capable of independent polarization control, enabling the switching between second-order filtering and polarization rotation. Based on the traditional FSS model, the structure employs mutually orthogonal feeding designs on its top and bottom layers, with a PIN diode constructing the conversion layer in the middle. When the top and bottom layer diodes align in the same direction and the middle layer diode is activated, the FSS structure generates C-L-C resonance to achieve second-order filtering. To enhance structural understanding, an equivalent circuit model based on the FSS structure validates the design’s accuracy. By configuring the top and bottom diodes in opposite directions and deactivating the middle layer diode, the structure forms a Fabry-Perot (FP) cavity, facilitating polarization conversion. Detailed analysis of the electromagnetic wave propagation path within the structure using the FP cavity model elucidates changes in electromagnetic wave polarization.Results and DiscussionsThe structure effectively adjusts electromagnetic wave polarization, achieving second-order filtering and polarization conversion functions. It exhibits excellent shielding properties for one polarized wave while modulating another. Control over PIN diode activation and deactivation provides four independent operational modes (Fig. 1), meeting modern communication requirements for functionality and adaptability. Each structural function demonstrates superior electromagnetic properties with high transmission efficiency, wide operating frequency bands (Fig. 6), and robust angular stability. These attributes position, the proposed structure favorably for applications in spatial filtering, radomes, and other related fields.ConclusionsIn this paper, we propose a multifunctional, reconfigurable wideband FSS capable of switching between second-order filtering and polarization rotation functions while independently controlling TE and TM waves. Utilizing an equivalent circuit model, the design achieves wideband second-order filtering through a three-layer metal surface, employing PIN diodes to control TE and TM polarized wave transmission and shielding for independent polarization control. Building upon the second-order filter structure, a conversion layer in the middle layer facilitates polarization rotation based on FP cavity principles. Under second-order filtering, the structure achieves passband transmission from 2.29-4.21 GHz with a 59.1% relative bandwidth. For polarization rotation, linear to cross-polarization conversion spans 1.87-4.48 GHz, achieving an 82.2% relative bandwidth with polarization conversion rates exceeding 90%. These capabilities highlight the technology’s potential for multi-mode radomes with high transmittance and broadband needs, catering to specific polarized signal requirements during the antenna transmission and reception.
Aug. 25, 2024Vol. 44 Issue 16 1624002 (2024)
Tianbao Ma, Lingzhen Qi, Shu Peng, Jiaming Li, Xulian Guo, and Kui Liu
ObjectiveThe high-order transverse mode optical field with a special spatial structure utilizes the spatial dimension resources of photons, providing a novel method to address the capacity crisis in optical communication and facilitate the sustainable development and expansion of high-speed, high-capacity optical communication. As a fundamental high-order transverse mode optical field, the Hermite-Gauss beam is widely used in space quantum measurement in addition to optical communication. Moreover, the Hermite-Gauss beam is also employed in achieving super-resolution imaging. However, due to the lack of an effective Hermite-Gauss mode separation device, it is challenging to surpass the Cramér-Rao measurement lower bound in experiments. Therefore, the generation and mode separation of high-quality higher-order Hermite-Gauss modes play a crucial role in spatial quantum measurement. Hermite-Gauss beams can be generated using phase-plates, specially designed lasers, spatial light modulators, and mode cleaners. However, most of these methods suffer from low conversion efficiency. In 2014, CAILabs in France pioneered multi-plane light conversion (MPLC) technology. The mode division multiplexer based on MPLC solves the problem of low conversion efficiency, enabling the preparation of high-purity high-order mode beams and achieving spatial mode division multiplexing. Subsequently, MPLC has significantly influenced optical communication, quantum cryptography, and quantum computing. Currently, domestic research on MPLC mainly focuses on the modular division multiplexing of linear polarization (LP) mode and orbital angular momentum (OAM) mode, while the preparation and mode decomposition of Hermite-Gauss mode based on MPLC are rarely reported.MethodsThe laser output infrared light with a wavelength of 1080 nm is coupled into a single-mode fiber after passing through a line polarizer, and the beam is ejected from the optical fiber coupler to be incident into MPLC as a plane wave. Five reflections between the liquid crystal surface and the cavity mirror are achieved to perform continuous phase modulation and optical transformation of Hermite-Gauss beams, resulting in a high-purity, high-order Hermite-Gauss beam. Subsequently, based on the experimental results of beam shaping, we experimentally study Hermite-Gauss mode decomposition. In the experiments, we simulate the superposition light field of high-order Hermite-Gauss modes by shifting the Hermite-Gauss beam, which is used as the input light field to the MPLC. After the multimode light field passes through the MPLC, each mode is decomposed into six spatially separated channels, with each mode separated into a distinct beam.Results and DiscussionsThe conversion efficiency of high-order Hermite-Gauss beams generated by phase-plates, specially designed lasers, spatial light modulators, and mode cleaners is generally low. The MPLC-based mode division multiplexer solves the problem of low conversion efficiency and can generate high-order mode light fields with high purity. Using MPLC, we obtain high-order Hermite-Gauss beams with mode purity levels of HG1,0,HG2,0,HG3,0,HG4,0, and HG5,0 being 93.9%, 96.8%, 76.6%, 88.1%, and 85.3% respectively (Fig. 4), and the best conversion efficiency is 71.3%. The technology for generating and separating high-order Hermite-Gauss modes is crucial in spatial quantum measurement. Currently, there are few reports on the preparation and mode separation of Hermite-Gauss modes based on MPLC in China. In this paper, we build an MPLC to realize 6-channel mode separation of the offset incident Hermite-Gauss beam (Fig. 8), with a maximum crosstalk of -11.9 dB (Fig. 9).ConclusionsIn our experiments, we develop a mode division multiplexer based on multi-plane light conversion technology that can generate high-order Hermite-Gauss beams with high purity and achieve mode separation of complex light fields. Using the 5-plane transformation, we obtain a high-order Hermite-Gauss light field with mode purity levels of HG1,0,HG2,0,HG3,0,HG4,0 and HG5,0 being 93.9%, 96.8%, 76.6%, 88.1%, and 85.3%, respectively. Subsequently, we realize a 6-channel mode separation of the offset incident Hermite-Gauss beam using MPLC, with a maximum crosstalk of -11.9 dB. The mode division multiplexer based on multi-plane optical conversion is compact, simple, and flexible, effectively realizing the mode shaping and mode separation of Hermite-Gauss beams. The mode shaping and mode separation techniques of Hermite-Gauss beams are expected to be applied to small displacement measurements in space and super-resolution imaging.
Aug. 25, 2024Vol. 44 Issue 16 1627001 (2024)
Liangyuan Zhao, Gonghui Zhang, Wei Sun, Dong Xu, Zheng Wei, Hongyuan Liang, and Lin Wang
ObjectiveWith the continuous advancement of multi-core fiber (MCF) preparation technology, multiple signals can now be transmitted simultaneously through different cores within a single fiber, enabling space division multiplexing (SDM) co-transmission of quantum and classical signals. This addresses the previous issue of quantum signals monopolizing individual fibers in quantum key distribution (QKD) systems. Despite advancements, previous SDM-QKD experiments using MCF have encountered limitations: limited fiber length, higher attenuation coefficients compared to standard single-core fibers, and lower inter-core crosstalk in laboratory-customized MCFs. We pioneer the practical industrial feasibility of SDM-QKD using commercial 4-core low-loss MCF and phase-coded QKD, demonstrating SDM of quantum and classical signals under realistic urban conditions. This verification provides crucial feasibility for future large-scale deployment of SDM-QKD in urban fiber optic networks.MethodsThe SDM-QKD experimental setup utilizes a commercial 4-core MCF and phase-coded QKD. Quantum and synchronous QKD signals occupy one core, while classical data signals occupy another core within the 4-core MCF. The MCF has a length of 21.39 km with a cladding diameter of 125 μm and core-to-core spacing of 43 μm. The cores are sequentially numbered clockwise as 1#, 2#, 3#, and 4#. Each core exhibits an attenuation coefficient of 0.182 dB/km@1550 nm with inter-core crosstalk coefficients ranging from 10-7 km-1. Spatial coupling and decoupling of signals across cores are achieved using 1×4 fan-in/fan-out devices with an insertion loss of 0.9 dB and an isolation degree of 50 dB. The experiment employs a commercial QKD device based on the phase-encoding decoy-state BB84 protocol with a Faraday-Michelson interferometer. The emission frequency of quantum signals is 50 MHz, with a distribution ratio of 14∶1∶1 among signal, decoy, and vacuum states. The average photon numbers for these states are 0.6, 0.2, and 0, respectively. Quantum and synchronous signals at wavelengths of 1549.32 nm and 1550.92 nm are co-propagated via dense wavelength division multiplexing before being connected to the 1# core of the 4-core MCF through fan-in/fan-out devices. For classical post-processing, QKD-T’s electrical signal is converted to 1490 nm optical signal by the optical line terminal, connected to other cores, while QKD-R’s electrical signal is converted to 1310 nm optical signal by the optical network unit, connected to the same core as the 1490 nm classical signal.Results and DiscussionsQuantum and synchronous signals occupy the 1# core, while the classical signals occupy cores 2/3/4# sequentially. The average secret key rate (SKR) of SDM-QKD at 21.39 km is 2.90 kbit/s with an average quantum bit error rate (QBER) of 0.88% over continuous operation exceeding 4 hours. Compared to non-SDM QKD, SKR is reduced by 0.68% and QBER is increased by 2.33 percentage points (Table 2). A loop test connecting cores 1# and 3# achieves an SDM-QKD experiment over 42.78 km with an average SKR of 0.75 kbit/s and QBER of 2.15%. Compared to non-SDM QKD, SKR is reduced by 8.54 percentage points and QBER is increased by 7.50% (Table 3). When quantum and synchronous signals occupy the 1# core and classical signals occupy the 2# core, the average SKR of SDM-QKD is 2.90 kbit/s with a standard deviation of 0.36 kbit/s. Average QBER is 0.89% with a standard deviation of 0.18% (Figs. 9 and 10). This experiment with commercial MCF reflects the influence of inter-core crosstalk noise on QKD performance in urban environments, addressing the deficiencies of previous SDM-QKD experiments and demonstrating the stable operation of SDM-QKD using commercial MCF and QKD devices.ConclusionsWe build an SDM-QKD model based on MCF and analyze background noise changes for SDM-QKD. It experimentally verifies the feasibility of SDM-QKD in urban environments under near-real conditions using commercial 4-core MCF and phase-coded QKD, alongside classical communication equipment. Compared to existing SDM-QKD experiments, results show that inter-core crosstalk noise in commercial MCF minimally influences SDM-QKD performance. Inter-core crosstalk noise remains a crucial factor affecting SDM-QKD performance; minimizing inter-core crosstalk coefficients is essential to improving the SDM-QKD signal-to-noise ratio. While the commercial MCF used in this paper effectively eliminates inter-core crosstalk noise influence on SDM-QKD performance when classical signal wavelengths are non-adjacent to quantum signal wavelengths, further reduction in inter-core crosstalk coefficient may be necessary for adjacent wavelength scenarios. Moreover, during the actual installation of fiber optic links, multiple fiber segments are typically fused to extend the link’s length. Both this paper and prior SDM-QKD experiments have focused on single MCF deployments. Future research should investigate how inter-core crosstalk changes at these fusion joints influence SDM-QKD performance. This will enhance the theoretical and experimental framework necessary for developing and implementing quantum secure communication systems based on MCF.
Aug. 25, 2024Vol. 44 Issue 16 1627002 (2024)
Lü Xin, Guohui Li, Ting Guo, Shaoding Liu, Hong Sun, Yanxia Cui, and Rong Wen
ObjectiveIn quantum communication, achieving efficient transmission and long-distance communication relies on an ideal single-photon source. CsPbBr3 quantum dots hold significant promise as single-photon sources due to their high probability of single-photon emission. Among the methods to enhance CsPbBr3 quantum dots' single-photon performance, size reduction is crucial. In this study, we synthesize CsPbBr3 quantum dots doped with varying concentrations of Al3+ ions using a thermal injection method and systematically investigate their optical and material properties. The results demonstrate that Al3+ ion doping effectively modulates the emission intensity and wavelength of CsPbBr3 quantum dots while enhancing the interaction of Pb—Br bonds, thus significantly improving their environmental stability. Moreover, by leveraging the smaller ionic radius of Al3+ ions compared to Pb2+ ions, Al3+ ion doping effectively induces lattice contraction in CsPbBr3 quantum dots, leading to reduced size and enhanced size uniformity. Consequently, the reduced size enhances the quantum confinement effect, significantly improving single-photon emission performance. This study presents new strategies for optimizing perovskite quantum dot single-photon sources, advancing the development of perovskite single-photon sources.MethodsWe utilize a hot injection method to synthesize CsPbBr3 quantum dots and Al3+-doped CsPbBr3 quantum dots, ensuring high crystallinity and superior size uniformity. The method involves two steps. First, a mixture of cesium carbonate, oleic acid, and octadecene is heated for 2 h in an inert environment. To enhance the synthesis quality of quantum dots, an excess of oleic acid is added, resulting in a cesium oleate precursor that is soluble at room temperature. Second, a mixture of lead bromide, aluminum bromide, oleic acid, oleylamine, and octadecene is heated for 2 h in an inert environment. This is followed by the rapid injection of 0.4 mL of cesium oleate precursor. After allowing the reaction to proceed for 5 s, immediate cooling is achieved using an ice-water bath. Subsequently, well-dispersed quantum dot solutions are obtained through high-speed centrifugation. Throughout the synthesis process, quantum dots with different doping concentrations (Al/Pb molar ratios of 0∶1, 1∶2, 1∶1, 2∶3, and 3∶2) are synthesized by controlling the amount of aluminum bromide added.Results and DiscussionsThe prepared Al∶CsPbBr3 quantum dots can maintain the crystal structure of CsPbBr3 quantum dots within a specific concentration range of Al3+ ions, successfully introducing the energy level of Al3+ ions. The addition of Al3+ ions enhances the interaction of Pb—Br bonds in CsPbBr3 quantum dots and significantly improves their stability (Fig. 2). Notably, while maintaining the crystal morphology of CsPbBr3 quantum dots, Al∶CsPbBr3 quantum dots exhibit reduced size and improved size uniformity. This is due to the substitution of larger Pb2+ ions by smaller Al3+ ions (Fig. 3). Furthermore, fluorescence and absorption spectral analysis reveals that Al3+ ions effectively enhance the optical properties of CsPbBr3 quantum dots, significantly increasing their fluorescence intensity. Importantly, CsPbBr3 quantum dots and Al∶CsPbBr3 quantum dots exhibit the same emission linewidth and demonstrate good environmental stability (Fig. 5). These improvements broaden the potential applications of Al∶CsPbBr3 quantum dots across various fields.ConclusionsIn the paper, we successfully prepare Al∶CsPbBr3 quantum dots using a hot injection method and comprehensively investigate the influence of Al3+ ions on the properties of CsPbBr3 quantum dots. The results from fluorescence spectra and absorption spectra indicate an effective enhancement in the fluorescence intensity of the quantum dots. With an increasing Al/Pb ratio, both the fluorescence and absorption spectra of the quantum dots exhibit a blue shift. However, when the Al/Pb ratio reaches 3∶2, the emission and absorption wavelengths unexpectedly undergo a red shift. Combined with X-ray diffractometer (XRD) data, this suggests that while a small amount of Al3+ ions improves the optical properties of CsPbBr3 quantum dots, an excessive amount disrupts their crystal structure. X-ray photoelectron spectroscopy (XPS) data demonstrate that the introduction of Al3+ ions shifts the Pb and Br energy levels of CsPbBr3 quantum dots towards higher binding energies, enhancing Pb—Br bond interaction and thereby improving stability. Moreover, single quantum dot excitation tests comparing CsPbBr3 quantum dots and Al∶CsPbBr3 quantum dots (Al/Pb molar ratio of 1∶1) reveal distinct fluorescence blinking characteristics. The g2(0) values suggest that Al∶CsPbBr3 quantum dots (Al/Pb molar ratio of 1∶1) demonstrate superior single-photon performance, attributed to the effective reduction in quantum dot size, improved size uniformity, and enhanced quantum confinement effects upon the introduction of Al3+ ions. This study offers new experimental insights and methods for the preparation of perovskite quantum dots and the optimization of their quantum light source performance.
Aug. 25, 2024Vol. 44 Issue 16 1627003 (2024)
© Copyright 2018-2021 | Chinese Laser Press.
All Rights Reserved 沪ICP备15018463号-20