


 View fulltext

2025
Volume: 54 Issue 1
24 Article(s)
Weidong CHU, Peng BAI, Ning YANG, Yi WANG, Shangjie HAN, Yingxin WANG, and Ziran ZHAO
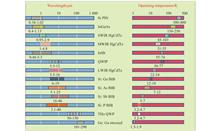
In recent years, infrared/terahertz detection technology has made remarkable progress. This review article will focus on the current infrared and terahertz detectors and make corresponding comments on their advantages and disadvantages. To meet the needs of the current level of technology, photon-type infrared/terahertz detectors required for high-speed detection have received extensive attention and research, but their disadvantages such as low operating temperature and narrow response spectral range limit the application scenarios. This article will mainly introduce and comment on the GaAs-based classical infrared/terahertz photon-type detectors based on aspects such as working principle, working mode, research progress, and band gap engineering. On this basis, the research progress of the quantum ratchet photodetector (QRPD) proposed by our research group is introduced in detail, and its advantages and feasibility are explained from the working principle to device structure of the QRPD device. By studying the working mechanism and quantum characteristics of QRPD under different impurity types, doping concentrations, growth processes, and band gap structures, the experimental results of different structural QRPD devices are listed and analyzed in this article.Significance The ratchet structure can detect infrared radiation without an external electric field, and can achieve the property of spectrally tunable under a specific bias to achieve broadband detection. Further, the QRPD is integrated with the LED to prepare a quantum ratchet upconversion device, which can achieve ultra- broadband detection in the range of 4-200 THz, and the responsivity of the quantum ratchet upconversion detector can reach 0.4 A/W at 25 K. This study shows that the quantum ratchet detector can effectively increase the operating temperature and response spectral range of the device, and provides a new idea for high-temperature infrared/terahertz photon-type detectors.Progress First, we introduced the advantages and disadvantages of the existing traditional infrared/terahertz detectors in the detection band, operating temperature, and response speed. We analyzed the detection band range and operating temperature of InGaAs, HgCdTe, InSb, QWIP, BIB, and Ge-based detectors, and found that although the current infrared photon-type detectors have a fast response speed and high sensitivity, the detection band range is limited and the operating temperature is low. Terahertz photon-type detectors are limited by extremely low temperature operating conditions and the diffraction limit, and related imaging technologies currently have no major breakthroughs. Then, we introduced four kinds of GaAs-based infrared/terahertz detectors. Among them, the n-type QWP structure requires the design of the coupling structure to increase the complexity and cost of the preparation, and the response spectral range is very narrow, and broadband detection cannot be achieved. Like QWIP, QCD also faces the same problem. Due to the limit of experimental growth, the cutoff wavelength of HIWIP/HEIWIP detectors cannot be further increased, and the operating temperature is low. The responsivity of OPHED detectors is low, and the peak responsivity is only on the order of µA/W. On these bases, we introduced the principle of quantum ratchet and the related research progress in recent years using the principle of optically responsive quantum ratchet. The related research progress of the GaAs-based quantum ratchet detector we recently proposed was introduced in detail. Due to the hot hole effect and the complexity of the valence band, the quantum ratchet ratchet detector breaks through the semiconductor band gap limit, and achieves an ultra-broadband response in the range of 4-300 THz. And due to the higher barrier in the ratchet structure, the overall dark current is reduced by more than three orders of magnitude compared with other traditional terahertz detectors. The asymmetry of the ratchet structure also causes the detector to produce a ratchet effect, that is, it can generate effective photocurrent even under zero bias, which is considered a new type of photovoltaic effect. The ratchet detector we proposed not only solves the problem of narrow spectral width and low operating temperature of traditional photon-type terahertz detectors, but also provides a new method for the study of optically responsive ratchets and quantum ratchets. We also tried different material epitaxial growth methods to prepare quantum ratchet detectors and presented the latest comparison results. In addition, for the aspect of high-temperature operation, our latest research results show that the highest response temperature of the terahertz band of the quantum ratchet structure upconversion device can reach 25 K.Conclusions and Prospects We first introduce the key problems of current infrared/terahertz detectors in broadband, high temperature, and high speed. Then, we focus on introducing four common GaAs-based infrared/terahertz detectors, and makes comments on their working principles, device structures, advantages, and disadvantages. On this basis, we focus on introducing the research progress of the QRPD proposed by our research group. The superiority and feasibility of the QRPD are explained from the aspects of the basic principle of the device, the device structure, and the experimental characterization results. The quantum ratchet detector we proposed provides a new type of solution and idea for achieving high-speed, broadband, and high-temperature infrared/terahertz detection and upconversion. The realization of broadband response and high-temperature operation broadens the new idea of the detection technology band gap engineering design. Inspired by this, we can try to use different material structures for infrared detection, and optimize the device through the ratchet structure to achieve broadband, high-temperature and other characteristics. This work opens a new window for the traditional semiconductor band gap engineering to achieve high-performance infrared/terahertz detection.
Jan. 25, 2025Vol. 54 Issue 1 20240211 (2025)
Research on scattering suppression imaging technology under computational optics framework (invited)
Xuemin CHENG, Lieyu LUO, Zesen ZHANG, and Qun HAO
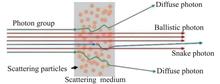
Significance Anti-scattering imaging is always a challenging problem in the field of optical imaging. For decades, researchers have conducted extensive and in-depth research on this issue and developed a variety of methods and technologies. Scattering media are ubiquitous in the imaging process, which makes the application of scattering imaging technology very extensive. In the medical field, scattering imaging is used to reduce the influence of scattering characteristics of biological structures and tissues on medical image acquisition. In the field of ocean and water detection, scattering imaging is used to solve the problem of optical imaging quality degradation caused by a large number of scattering impurities in water. In the field of military and environmental observation, the elimination of scattering factors such as water mist and smoke in the environment is very important; even in the field of astronomy and remote sensing observation, how to detect the weak light signal scattered through the atmosphere to achieve imaging also belongs to the application of scattering imaging. It is not difficult to imagine that the development of scattering imaging technology will continue to promote progress in many fields.ProgressFirst, starting from the basic principle of scattering, the physical process and key parameters of scattering are introduced, including the causes of scattering, photon characteristics, and the differences in scattering types caused by different particles. Because the light wave undergoes multiple scattering, the wave-front is distorted, and the light no longer propagates in a straight line, losing the target information originally carried by the light, which makes it extremely difficult to obtain effective target information or form a clear image. Therefore, the research of scattering imaging technology mainly focuses on how to recover the target in the scattering scene. This paper introduces the theoretical framework of computational optics to analyze the scattering imaging technology. The computational optical imaging framework includes the analysis of the action process of three imaging system modules, such as light input, medium propagation, and light field output. It is a calculation and optimization study of the entire imaging process of the system. From the perspective of computational optics, the functions of each module in the scattering imaging system are classified, and the existing anti-scattering imaging technologies are divided into six categories for detailed introduction: ballistic light extraction technology, speckle correlation imaging, photon counting imaging, scattering compensation technology, computational optical imaging technology and deep learning technology. Among them, ballistic light extraction technology is the earliest research direction, and then the use of optical information has gradually deepened, speckle correlation imaging, and photon counting imaging have entered people 's field of vision. With the development of optical components, the scattering compensation technology based on spatial light modulator has also attracted people 's attention. In recent years, computational ghost imaging technology has become a new research focus due to its unique imaging mechanism, and has promoted the progress of anti-scattering imaging technology together with deep learning technology. Divided by different module optimization calculations, it can correspond to four types of scattering imaging techniques: ballistic light extraction method, speckle correlation imaging method and photon counting imaging corresponding output detection module optimization. The scattering compensation method is based on optimizing the intermediate control process. The computational ghost imaging method encodes the illumination and combines the bucket detector, and the data-driven deep learning method.Conclusions and ProspectsOne of the significant advantages of computational optics theory is that it can clearly reveal the interaction between imaging results and scattering media. This provides a high-dimensional analysis framework for analyzing and dealing with specific problems in anti-scattering imaging. These studies not only open up a new path for imaging exploration in complex scattering environment, but also overcome the limitations of traditional imaging technology through comprehensive application of technology, and promote the development of this field to a higher imaging effect and application breadth. The content of this paper aims to help researchers understand the principles and latest progress of various anti-scattering imaging technologies, and clarify the characteristics and application scenarios of different technologies, so as to promote the further development of anti-scattering imaging technologies.
Jan. 25, 2025Vol. 54 Issue 1 20240298 (2025)
Ning JIANG, Ying GUO, Zhaoyang LIU, and Feng QI
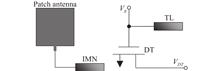
Objective The terahertz (THz) frequency range (0.3–3 THz) , has garnered extensive attention in recent years. THz detectors are fundamental components in terahertz wave technology research. By virtue of its advantages of low cost, high yield, and easy integration, CMOS technology is emerging as an alternative to other technologies. To address the performance degradation of the terahertz detector due to low radiation efficiency, a patch antenna with upward radiation is employed, characterizing its various performance attributes.Methods The architecture of the proposed THz detector is shown in Fig.1. The detector consists of an on-chip patch antenna and a source-feeding NMOS transistor. To enhance the efficiency of terahertz power transmission between the antenna and the transistor, an impedance matching network is integrated. This network consists of a single microstrip transmission line with a length of 105 μm. Additionally, a notch filter is designed at the transistor gate to minimize the impact of the gate bias line and chip bonding wires on impedance matching. The notch filter is implemented as an open-circuited microstrip transmission line with a length of 124 μm and a width of 1 μm, fabricated from the top metal layer, while the bottom metal layer serves as the ground plane.Results and Discussions Simulation results indicate that incorporating an impedance matching network enhances the detector's performance by approximately 20 times compared to the configuration without the impedance matching network. The detector is fabricated in the 180 nm CMOS process, with an area of 460 μm×497 μm. Measurement results, as shown in Fig.10, demonstrate that the detector operates over a frequency range of 220-325 GHz, with a maximum responsivity (Rv) of 1 524 V/W at 281 GHz and a minimum noise equivalent power (NEP) of 19.9 pW/Hz1/2 when Vg = 0.48 V. Table 1 presents a performance comparison between the detector designed in this work and other previously reported detectors. Compared to detectors that require integrated silicon lenses, the patch antenna in the proposed design radiates upwards, thereby avoiding the transmission of terahertz waves through a lossy substrate and eliminating the need for expensive high-resistivity silicon lenses to enhance antenna radiation efficiency. Furthermore, compared to detectors that do not integrate silicon lenses, the detector designed in this study exhibits a lower NEP. Utilizing this detector, a terahertz scanning imaging system was constructed, as depicted in Fig.12.Conclusions A 281 GHz terahertz detector has been designed based on a 180 nm standard CMOS process. The detector comprises a patch antenna, an NMOS field-effect transistor, an impedance matching network, and a notch filter. It operates over a frequency range of 220-325 GHz, achieving a maximum Rv of 1524 V/W at 281 GHz and a minimum NEP of 19.9 pW/Hz1/2. This performance is comparable to that of existing direct detectors which require integrated silicon lenses. A scanning imaging system has been constructed using this detector, and the detector can obtain clear scanned transmission images under continuous terahertz illumination.
Jan. 25, 2025Vol. 54 Issue 1 20240419 (2025)
Can LI, Bo REN, Kun GUO, Tao WANG, Jian WU, Jinyong LENG, and Pu ZHOU
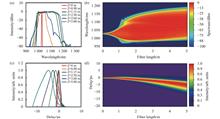
Significance Ultrafast laser refers to a type of light source with pulse duration in the picosecond or femtosecond range and high peak power. It is generally generated from active or passive mode-locked lasers and is widely used in fields such as material processing, biomedicine, and precision measurement. At present, researchers have demonstrated mode-locked lasers based on gain materials such as solid-state crystals, semiconductors, and active fibers with various types of ultrafast laser output. However, due to the limited optical gain inside the laser cavity or severe nonlinear effects caused by high peak power in the waveguide structure, the power and energy of ultrafast lasers that directly generate through mode-locking operation are generally low, rendering it difficult to meet the practical application needs. Regarding the power or energy scaling of ultrafast lasers, rare earth doped optical fiber is recognized as the preferred choice for constructing high-power ultrafast laser amplifiers due to their unique waveguide structure, which implies a large ratio of surface area to volume, excellent thermal optical performance, and high conversion efficiency (electro-optical efficiency can exceed 30%). In recent years, lots of research teams at home and abroad have made significant progress in improving the power and energy of ultrafast lasers based on the technique of fiber chirped pulse amplification (CPA), whilst with the compromise of a de-chirped pulse width >200 fs, owing to the spectral narrowing after amplification induced by the gain saturation effect. An alternative is to leverage the fiber nonlinearity to counteract the gain narrowing effect, such as the pre-chirp managed and self-similar amplification, which is capable of generating μJ level pulse energy with sub-50 fs pulse duration. However, the former involves fine controlling of the chirping parameters of the laser pulse, rendering the system sensitive to changes in amplifier parameters, while the latter is explicitly restricted by the limited optical gain spectrum in terms of further energy scaling. Recently, researchers have proposed another scheme called gain managed nonlinear (GMN) fiber amplification, in which the laser pulse undergoes self-similar pulse evolution firstly and then further experiences spectrum broadening under the effect of active fiber dynamic gain, achieving pulse energy enhancement with a pulse width within 50 fs. Specifically, researches have shown that the fiber GMN pulse evolution is a novel nonlinear attractor that can tolerate nonlinear phase shift up to 200 π, thus having the potential to achieve higher energy ultrafast pulse laser output.Progress First, the technical principle of the GMN fiber amplifier is introduced through establishing a theoretical model that involves the generalized nonlinear Schrodinger equation, distributed rate equation and power transmission equation. Based on the theoretical model, the evolution of pulse time-frequency characteristics of the ytterbium-doped fiber GMN amplifier are simulated, and the effects of different seed parameters on the laser output are analyzed. According to the simulation, it can be proven that the pulse evolution under GMN amplification mechanism is a new type of nonlinear attractor, which is mainly formed by the nonlinear spectral broadening managed by dynamic gain in the amplifier, and is less affected by the initial pulse characteristics of the seed source.Based on the GMN fiber amplification mechanism, researchers have conducted a series of experimental investigations in recent years and achieved significant research progress. According to theoretical simulation results, GMN pulse amplification generally occurs in positive dispersion optical fibers. Spectrally narrowband ultrafast laser pulses, under the combined effect of fiber nonlinear self-phase modulation and dynamic gain, evolve into laser output with a significant spectral extension to the long wavelength range and can be temporally compressed to the transformation limit with an increasing of the pulse energy. At present, output pulse energy higher than 1.3 μJ with duration in the 50-fs level has been realized from GMN amplifiers that exploit large mode area fiber, while further energy scaling is limited by the stimulated Raman scattering (SRS) effect. Based on the GMN fiber amplification mechanism, researchers further explored its output laser pulse characteristics at ultra-high/low repetition rates from the perspective of practical application requirements. In addition, the spatiotemporal degradation (STD) in GMN fiber amplifiers has also been theoretically investigated, and the results show that the STD has apparent threshold characteristics. When the pump power of the amplifier exceeds a certain threshold, the beam quality of the output laser rapidly deteriorates, Raman noise increases, pulse coherence decreases, and the amplified laser pulse is difficult to compress. The main driving factors are the nonlinear SRS effect and the induced four wave mixing effect between transverse modes. With the overall performance improvement of GMN fiber amplifiers, its application in for example multi-photon microscopy imaging and fine micro-machining has also begun to receive widespread attentions. Moreover, GMN fiber amplifiers have also been used as component of ultrafast laser systems, supporting ultrafast laser output with engineered performance.Conclusions and Prospects As a new type of nonlinear fiber amplification mechanism, GMN pulse evolution can realize wider linear spectrum broadening compared with convention self-similar amplification and pre-chip managed amplification, and thus possesses more advantages in laser pulse width narrowing and energy scaling. In recent years, the GMN fiber amplifier has attracted more and more research attentions, and its outputted single pulse energy has reached more than 1 μJ and the de-chirped pulse duration approached 30 fs level, as well as preliminarily realized application in fields such as multi-photon microscopy. Nevertheless, there exist a significant room for the improvement of the output laser pulse performances of GMN fiber amplifiers such as single pulse energy and spatiotemporal properties. To achieve the above goals, it is necessary to carry out more accurate simulation analysis of the pulse evolution process and further clarify the physical mechanism of its high tolerance for nonlinear phase shift. Based on the theoretical research, by using active fibers with larger mode field area associated with optimizing the amplifier structural parameters, it is expected to achieve ultrafast laser output with higher single pulse energy, shorter pulse width, and higher spatiotemporal characteristics, as well as further expand its application breadth and depth.
Jan. 25, 2025Vol. 54 Issue 1 20240438 (2025)
Nan ZHA, Junhu CAI, Yun YE, Sheng XU, Tailiang GUO, and Enguo CHEN
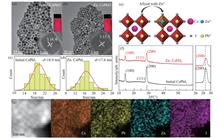
ObjectiveInorganic perovskite quantum dots (PQDs) have garnered significant interest due to their exceptional optical characteristics, including narrow emission spectra and high photoluminescence quantum yield (PLQY). Despite these advantages, PQDs are often hindered by environmental instability, particularly notable in CsPbI3 QDs which exhibit lower PLQY and susceptibility to phase transitions at ambient conditions, compromising optical performance. To address these challenges, enhancing the stability and optical properties of CsPbI3 QDs is crucial. Current research focuses on methods such as ligand exchange, encapsulation, and ion doping, with the latter proving particularly effective in improving PLQY and stability. Ion doping, involving substitution at A, B, or X sites, can mitigate Pb toxicity, alter bond lengths, and enhance phase stability, thereby significantly impacting quantum dot performance. Initial CsPbI3 QDs typically demonstrate a PLQY of 50% to 60% but suffer rapid fluorescence quenching within ten days in environmental settings. This study proposes Zn ion doping as a promising strategy to augment the optical properties of perovskite quantum dots.MethodsThis article employs a high-temperature thermal injection method for the synthesis of Cs-oleate precursors. Initially, Cs-oleate precursors are synthesized and subsequently rapidly injected into a high-temperature octadecene solution containing PbX2, ZnI2 and ligands. The reaction proceeds for a few seconds before the mixture is quenched in an ice water bath. Various molar ratios of ZnI2/PbI2 can be adjusted to achieve a series of CsPb1-xZnxI3 (0 < x < 1) quantum dots.Results and DiscussionsDue to the partial substitution of Pb with Zn, the lattice of quantum dots (QDs) gradually contracts with increasing ZnI2 concentration, while the overall cubic structure of the QDs remains unchanged. This modification enhances the radiative recombination rate and effectively mitigates defect states. The maximum enhancement in photoluminescence quantum yield (PLQY) reaches 98%, accompanied by improved stability(Fig.3(b)). Original CsPbI3 QDs exhibit complete fluorescence quenching within ten days at room temperature, whereas Zn-doped CsPbI3 QDs maintain over 80% of their initial PLQY under the same conditions(Fig.3(d)). Transmission electron microscopy (TEM) analysis shows that despite the addition of ZnI2 precursor, the QDs retain their cubic morphology, with the average particle size decreasing from 18.9 nm to 17.6 nm. This size reduction is attributed to the inhibitory effect of I ions on further QD growth. The interplanar spacing of the QDs decreases from 3.16 Å to 3.13 Å, indicating lattice contraction induced by Zn doping. X-ray diffraction (XRD) patterns confirm that Zn-doped CsPbI3 QDs exhibit no new diffraction peaks compared to pure CsPbI3 QDs, but show a gradual shift of peaks towards larger angles, indicating successful substitution of Pb by Zn ions. Analysis of time-resolved photoluminescence (TRPL) spectroscopy reveals that CsPbI3 QDs have an average fluorescence lifetime of 138.44 ns, while Zn-doped CsPbI3 QDs exhibit a shorter lifetime of 103.61 ns(Fig.3(e)), attributed to the suppression of halogen vacancy defects and shallow-level states by Zn doping(Tab.1). This doping strategy effectively passivates surface defects and enhances the optical properties of CsPbI3 QDs.ConclusionsIn this study, CsPbI3 quantum dots doped with Zn2+ were successfully synthesized using ZnI2 via the thermal injection method. The incorporation of Zn enhanced the phase stability of CsPbI3 quantum dots compared to their undoped counterparts. Photoluminescence quantum yield (PLQY) significantly improved from 56% to 98%, with PLQY retention above 80% after 10 days. Subsequently, narrow-emitting Zn:CsPbI3, CsPbBr3, and CsPbCl3 quantum dots were selected as replacements for conventional phosphors in LED color conversion materials. These quantum dots achieved a color gamut of 135.22% based on the National Television Standards Committee (NTSC) standard(Tab.2), highlighting their promising applications in LED display technologies.
Jan. 25, 2025Vol. 54 Issue 1 20240440 (2025)
Xingxu YAN, Hubing DU, Hui WANG, Bo TANG, Gaopeng ZHANG, and Jinge JIA
ObjectiveHigh accuracy and precision 3D measurement have been extensively employed for industrial inspection, object three-dimensional reconstruction and reverse engineering. Many methods can be used to achieve the objective. Among then, line-structured light technique is regarded as a representative of the techniques of this kind owing to their advantages of high accuracy, high robustness, rapid speed, non-contact, and low cost. However, the existing line-structured light method suffers from calibration difficulties and low calibration accuracy in applications. In this regard, this paper establishes an efficient and reliable calibration method for laser plane equation by combining a binocular vision system with a target with fixed feature points.MethodsThe measurement system consists of a camera and a structured light projector. During the task of measurement, the light projector projects the laser stripe on the object to be measured, and the image is collected by the detector. the three-dimensional coordinates of the object are obtained based on the principle of laser triangulation if the pixel coordinate position is laser stripe centers obtained through image processing. Specifically, the calibration process of the line structured light vision system includes camera calibration and laser planes calibration. For the camera calibration, which mainly involves calculating the internal and external parameter matrix of the imaging system and the aberration coefficient, the process is considered more mature and can be well done by Zhang’s method because of its high calibration accuracy, flexibility, and low cost. The calibration process of line-structured light 3D measurement system is as follows: 1) The line laser emits line-structured light stripes, which project the light plane onto the target’s surface to produce the left and right calibration images; 2) The camera acquires the calibration images and extracts the feature points of the structured light contour from the light knife of the left and right calibration images; 3) Calculation of 3D coordinates corresponding to 2D coordinates of the feature points by matching the corresponding feature points on the left and right images; 4) Fitting the laser plane with the least-squares algorithm using the 3D coordinates of the feature points obtained by the calibration images of different positions of target.Results and Discussions The calibration of the exact relative position between the camera and the structured light projector or the light plane equation of the linear structured light projector in the camera coordinate system is vital for line-structured light system. Therefore, the performance of the linear structured light technology largely depends on the calibration accuracy of the light planes.Many feasible methods have been done by researchers for this end, which can be divided into three categories based on the type of calibration target used: 3D, 2D, and 1D methods. Compared to 3D targets, which it is possible to calibrate the light plane with at least one image, 2D and 1D targets are easier to handle and have lower production costs, making them more suitable for on-site calibration despite they cannot complete the light plane calibration with only one image. Other side, the method based on 1D target is highly susceptible to random errors, leading to unstable calibration results. So, the study of 2D based calibration method becomes a hot spot of line-structured light three-dimensional measurement technique in recent year. However, the existing line structured light calibration method has problem such as complex calibration process, limited feature points, the larger extraction error of the center point and low calibration accuracy in application. In other word, the obtain the desired depth information directly. With the technique to obtain the depth information, the constraint relationship of measurement system must be established to overcome the ill posed problem. The process is crucial but full of uncertainty, as the constraint relationship can greatly affect the accuracy and speed of calibration. By contrast, the binocular vision method can calculate the coordinates of the points on the stripe using the binocular intersection algorithm but without the establishment of the constraint relationship of measurement system. Inspired by the technique, we developed a flexible line structured light calibration method based on binocular vision technique. We also manufacture a target by gumming multiple black stripes to a white planar board (Fig.4). If the line laser emits line-structured light stripes and projects the light plane onto our target’s surface, we can get lots of feature points from the acquired contour image (Fig.8 and Fig.9). Assuming that the additional camera is calibrated under the detector’s coordinate system, The proposed method only requires the detector, along with an additional camera, to observe a planar board (assumed to be a perfectly plane) at a few (at least two) different unknown position (Fig.10). Feature point matching by light bar center extraction from left and right calibration images (Fig.1). Calibration of the line structured light vision system can be completed (Fig.11).ConclusionsTo evaluate the performance of the proposed method, the measurement system is calibrated by this method. It shows that the proposed method is simple, easy to operate, has the advantages of abundant feature points and high calibration accuracy. Using standard block as sample, we conducted depth measurement experiments. Compared with the typical calibration methods, our method is significantly better than the traditional structured light calibration methods. Moreover, the measurement accuracy of our method is improved by 10 μm compared with the measurement results of existing commercial line laser sensors.
Jan. 25, 2025Vol. 54 Issue 1 20240390 (2025)

Chunyan LI, Ninglin WANG, Jihong LIU, Shaojie WU, Wenwen FU, and Kaili REN
In order to improve the accuracy of spectral confocal displacement measurement system, the influence of surface scattering characteristics of samples was studied. Firstly, the principle of spectral confocal displacement measurement system is introduced. Based on scalar scattering theory, the axial response of spectral confocal under the influence of surface scattering characteristics is deduced, and the relationship model of scattering influence on displacement measurement is established. Then, the displacement measurement error caused by the peak wavelength curve shift caused by scattering is studied theoretically and simulated. The results show that when the surface roughness of the sample is large, it will produce a large scattering effect, which will lead to a significant decline in measurement accuracy. At the same time, the spectral confocal shift measurement is affected by the incident characteristics of each wavelength. In order to correct the influence of scattering, a multivariate scattering correction method combined with generalized regression neural network (GRNN) is proposed to process spectral data, and a scattering correction algorithm model is established. Finally, an experimental platform was built, and samples were selected for displacement measurement experiments. The experimental results show that the measurement performance of the system decreases with the increase of roughness. For the sample with roughness of 20 nm, the maximum displacement measurement error is reduced from 12.6 μm to 1.9 μm, and the average displacement measurement error is reduced from 8.1 μm to 0.86 μm, which improves the displacement measurement accuracy and verifies the correctness of theoretical analysis and the effectiveness of the proposed scattering correction method.This research result has certain reference significance for improving the accuracy of spectral confocal displacement measurement system.ObjectiveDisplacement measurement technology can be used to detect surface morphology, film thickness, three-dimensional structure of living cells in biomedicine, so it has a wide range of applications. Spectral confocal displacement measurement technology uses a broad spectrum light source, establishes the coding correspondence between each wavelength and its respective axial focusing position by using the principle of optical dispersion, decodes the information according to the obtained reflection spectral characteristics of the sample surface, and obtains accurate axial position or tiny displacement data, thus realizing precise measurement; This method has ultra-high distance measurement resolution of nanometer level, and has universal adaptability to environment and measured materials, and has obvious application advantages and development prospects in the field of precision manufacturing of nondestructive measurement. When the spectral confocal method is used for precise displacement measurement, the scattering characteristics of the sample surface will cause some scattered beams to enter the system, which will make the received effectively reflected spectral response signal have invalid scattering noise, and the measurement data will drift, causing measurement errors. Based on the scalar scattering theory, in the spectral confocal displacement measurement system, the shift of peak wavelength curve caused by scattering is studied by constructing the functional relationship between surface scattering and light intensity, and the displacement measurement error caused by scattering is analyzed and studied. In order to correct the influence of scattering, a multiple scattering correction method combined with General Regression Neural Network (GRNN) is proposed to establish a scattering correction model to process the spectral data. Finally, the effectiveness of the correction method is verified by experiments.MethodsThe influence of surface scattering characteristics of samples on the measurement of spectral confocal shift is studied. When the surface of the sample is not smooth, it will lead to the scattering of reflected light on the surface (Fig.2). Analyze the relationship among root mean square roughness, incident angle and scattered light intensity (Fig.3, Fig.4). Compare the spectral data shifts under different root mean square roughness (Fig.5, Fig.6). The method of multivariate scattering correction combined with GRNN is used to process the spectral data and establish the scattering correction model. Experiments verify the effectiveness of the scattering compensation algorithm in spectral confocal.Results and DiscussionsIn the experiment, all kinds of measured samples can't be absolutely smooth. The accuracy of the spectral confocal displacement measurement system mainly depends on the reflection spectrum received by the system, and surface scattering is the main source that affects the reflection spectrum error. By analyzing the influence of surface scattering on the error of reflection spectrum, a scattering compensation algorithm is established to reduce the measurement error. The spectrum received by the system is mixed with scattered light. When the scattering situation is serious, the reflected light intensity will decrease Fig.3, Fig.4) and the peak wavelength will shift (Fig.5), which will lead to the decrease of measurement accuracy. The measurement error increases with the increase of root mean square roughness (Fig.6). The scattering correction algorithm established by multivariate scattering correction and GRNN generalized regression neural network can reduce the error caused by surface scattering and improve the accuracy of spectral confocal displacement measurement system.ConclusionsIn order to improve the accuracy of spectral confocal displacement measurement system, the influence of surface scattering characteristics of rough samples is studied and analyzed. Firstly, the working principle of spectral confocal displacement measurement system is introduced. Based on scalar scattering theory, the functional relationship between surface scattering characteristics and spectral response of samples is constructed, and the peak wavelength drift and displacement measurement error caused by scattering are analyzed. The scattering characteristics of the sample surface will shift the reflection spectrum curve and affect the displacement measurement accuracy, especially when the root mean square roughness δ is large, the scattering influence is great and the system resolution is obviously reduced. Then, in order to correct the influence of scattering characteristics, a scattering error correction model is established by using multivariate scattering correction method combined with GRNN generalized regression neural network, and it is verified by experiments. The experimental results show that the maximum displacement measurement error is reduced from 12.6 μm to 1.9 μm, and the average displacement measurement error is reduced from 8.1 μm to 0.86 μm when measuring the roughness sample with δ of 20 nm. In addition, the measured data of sample blocks with roughness of 12 nm, 50 nm and 100 nm are compared and analyzed. The results show that the surface scattering increases with the increase of roughness, which reduces the performance of the system. After the scattering error correction, the measurement accuracy of the system is improved. The research results have guiding significance for further improving the performance of the spectral confocal displacement measurement system and promoting the engineering application of the system.
Jan. 25, 2025Vol. 54 Issue 1 20240407 (2025)
Shaodong LI, Ji LIU, Jinhui WU, Lixia YU, Peng SUN, and Daqian GUO
ObjectiveFlash phenomena occur in various impact scenes. By capturing the flash spectra and analyzing their spectral line wavelengths and intensities, many critical pieces of information can be obtained, such as the composition of the colliding materials, the intensity of the radiation, and other environmental conditions. In the field of deep space exploration, obtaining the types of materials such as space meteorites and analyzing their structures are important indicators of deep space exploration missions, and it is of great significance to study the flash spectra generated by the collision of space materials and analyze the time-varying characteristics of the collision spectra for the development of deep space exploration technology.MethodsThe study investigates the collision spectral properties of a metal alloy consisting of Al and a small amount of W hitting a steel plate by means of a high-speed metallic material collision experiment. The experiment was conducted by laser targeting to focus the telescopic fiber-coupled lens on the surface of the steel plate and to collect the collision spectra within a spatial radius of 0.3 m, as shown in Fig.2. The flight speed of metal materials is measured by broken-target velocimeter. The experiment sets the integration time of the spectrometer to 50 μs and collects it continuously for 10 times, in order to ensure that the integration time can contain the moment of impact flash, the delayed triggering function of the broken-target velocimeter is used to realize the delayed triggering of the spectrometer.Results and DiscussionsFigure 3 shows that at the beginning of the collision, the collision core area has the strongest brightness, and then high-temperature thermal radiation occurs and rapidly spreads to the entire target surface. From the high-speed photographic data and spectral data, it can be inferred that at the moment of the first effective spectral acquisition, the metal material begins to collide with the steel plate and disintegrate, and the temperature begins to gradually increase, and at this time, the main collection of the material is the impurity composition of the most easy to be excited by the spectral lines of Na I and K I. At the moment of the second acquisition, the metallic material starts to melt under the high temperature, and oxidizes with O2 and CO2 in the air under the high temperature condition, while the small amount of W in the metallic material starts to be excited to produce spectral lines. As the collision progresses, the burning of Al particles is limited by the surface oxidation rate, and the AlO emission lines disappear while the intensity of other lines decreases.ConclusionsFrom the effective spectral data, it is easy to find that the intensity of the line spectra formed by atoms (Ions) is much higher than that of the continuous spectrum formed by high-temperature thermal radiation, and that the line spectra mainly come from Na and K, as well as Al and W in metallic materials, with the Na and K spectral lines being present in almost the entire collision process. With the collision process of metal materials, more and more line spectra were excited in the second acquisition, and several line spectra appeared in the range of 460-530 nm, which were mainly the emission spectra of AlO generated by the combustion of Al gas phase, and the high-speed photographic data could see that the metal materials were completely broken at this time and impacted the steel plate, which can be proposed that the collision of aluminum alloys and steels as the main materials could be based on whether the collision was sufficient or not. It can be suggested that in the collision of aluminum alloy and steel as the main materials, the spectral lines within the range of 460-530 nm can be used as the basis for whether the collision is sufficient or not.
Jan. 25, 2025Vol. 54 Issue 1 20240282 (2025)
Wenlong CHE, Yue ZHANG, Jianxing ZHAO, Yinghao CAO, Yao ZHOU, Yinglin SONG, and Jianhong ZHOU
ObjectiveIn the "post-molar" era, photonic chips have been widely studied because of their characteristics of high speed, large bandwidth, and low energy consumption. Because of its high refractive index, ultra-wide transmission range in the infrared region, and adjustable composition, chalcogenide glass has achieved many excellent results in integrated photonics, infrared sensing, biomedicine, etc. As a basic component of photonic chips, the preparation process of optical waveguides also needs to evolve towards the advantages of simplicity, operability, and low cost. Based on the photoinduced chalcogenide glass, the embedded optical waveguide was prepared and the coupling efficiency between the input fiber and the waveguide was studied, which helps promote the development of chalcogenide glass photonic chips. Therefore, in this paper, the waveguide structure is prepared by vacuum deposition of chalcogenide glass thin film using the photo-bleaching property, the coupling efficiency is investigated, and the feasibility of the experiment is verified by using simulation, which provides an important reference for the further development of related devices.MethodsIn this paper, the preparation of Ge28Sb12Se60(GSS) thin film samples was conducted using the thermal evaporation technique. The samples were exposed to a 638 nm laser (Fig.2), and the refractive index difference was calculated to be 0.013, which satisfies the conditions for preparing the waveguide. The surface structure of the waveguide was measured by an optical microscope (Fig.3). According to the loss monitored by the automatic waveguide coupling test system in real-time (Fig.4), the coupling efficiency between the input fiber and the GSS optical waveguide is calculated, and the beam propagation method is used to simulate the coupling efficiency to verify the variation trend of the coupling efficiency is the same (Fig.9).Results and DiscussionsTo study the coupling efficiency of embedded GSS optical waveguide, the end coupling of embedded GSS optical waveguide is carried out by the waveguide coupling automatic test system. The coupling efficiency increases first and then decreases as the moving position gradually moves closer to the waveguide. The coupling efficiency is the highest at the best position where the fiber is coupled to the embedded optical waveguide, which is about 0.575% (Fig.5). The laser in the input fiber can propagate in the embedded optical waveguide, but due to the influence of actual loss, the light in the optical waveguide can only be observed near the input (Fig.6). To further study the accuracy and feasibility of the photomask moving exposure preparation of optical waveguide, the structure is simulated by the beam propagation method (BPM), and the quasi-TE and quasi-TM modes in the waveguide can be well restricted in the propagation of the waveguide structure (Fig.8). The coupling process between the input fiber and the embedded optical waveguide is simulated, and the relationship between the position change of the input fiber and the ideal coupling efficiency is calculated (Fig.9). As the simulation results tend to be ideal, the GSS waveguide sample is affected by many aspects, such as the flatness of the end face, the transmission loss of the waveguide, the coupling efficiency of the waveguide fiber at the time of exit, etc. the coupling efficiency measured by the experiment is low. However, the experimental results are consistent with the curve trend of the simulation results, and the experimental results can be further verified.ConclusionsGe28Sb12Se60(GSS) film with a thickness of 1000 nm and SiO2 with a thickness of 50 nm were deposited by vacuum thermal evaporation method. The refractive index before and after exposure was compared, and the difference in refractive index before and after exposure at 1310 nm was 0.013, which verified the feasibility of preparing optical waveguides. On this basis, the embedded optical waveguide structure with a width of 20 μm was prepared by mask moving exposure method. The morphology of the waveguide structure was characterized by the microscope, and the edge of the waveguide structure was smooth without obvious defects. The end coupling efficiency of the fiber-embedded GSS optical waveguide is about 0.575% by using the automatic waveguide coupling test system, and the light in the optical waveguide can be observed near the input end. In addition, to further verify the experimental results, the beam propagation method is used to simulate the GSS optical waveguide structure, and it is confirmed that the coupling efficiency results of the experiment and the simulation are consistent. The research results can provide a reference for applying GSS in photonic chips and optical information processing.
Jan. 25, 2025Vol. 54 Issue 1 20240320 (2025)
Hui ZHAO, Yu ZHAO, Xinyang SONG, Chenhui XIA, Lifeng JIN, and Tingting WU
ObjectiveUltra low orbit satellites generally refer to satellites that operate at an altitude of 300 km or below and above 150 km. Deploying satellites in this orbit can achieve small aperture high-resolution reconnaissance. The height of the ultra-low orbit decreases, the influence of Earth's albedo on the remote sensor increases. The thermal flow environment outside the orbit is complex and harsh. And the high sensitivity brought by the large compression ratio makes the optical tolerance twice as strict as traditional systems, the requirements for thermal stability are further improved. At the same time, small and medium-sized satellite platforms reducing the thermal control resources further increases the difficulty of thermal control. Thermal control design requires adaptation to complex and harsh external heat flow environments, achieving high temperature stability and low thermal control power consumption, which poses challenges to thermal control design. Therefore, the high temperature stability thermal control design of ultra-low orbit remote sensors is of great significance and application prospects.MethodsBased on the overview and temperature index requirements of remote sensors, the focus and difficulties of thermal control design were analyzed. The key and difficult points in the thermal control design are specifically reflected in the following : 1) Because of the ultra-low orbit has low altitude, the external heat flow in shadow and sunshine areas and seasonal greatly changed; 2) When remote sensors imaging, it is necessary to maneuver, and the external heat flow will change with attitude; 3) The remote sensor has a flat design to reduce wind resistance and the optical lens is installed close to the inlet, which increases the angle coefficient between the inlet surface and the Earth, further widening the difference between high and low temperatures; 4) Higher requirements for full cycle temperature stability of ± 0.3 ℃ are proposed for thermal control which is a key factor in achieving the optical performance of the system; 5) Modern small satellites have limitations on power consumption and weight of thermal control resources, further increasing the difficulty of control.An external insulation combined with external precision control strategy was adopted to the system level thermal control design (Fig.4) achieves high temperature stability. The specific measures are as follows: 1) Camera’s door reduces the impact of external heat flow on the remote sensor, improve the temperature stability of the remote sensor, and save thermal control compensation power consumption. Table 2 show the temperature stability of each position of the remote sensor has been optimized and improved with camera door. 2) Reduce the thermal coupling between spacecraft and remote sensors and strengthen the insulation between key components. 3) The focal plane circuit box radiates heat dissipation to the cabin panel. 4) To reduce the impact of external heat flux, a high-precision temperature control radiation insulation structure was installed on the front support rod of secondary mirror and front mirror cylinder (Fig.5), which shields the influence of external heat flux while controlling the radiation temperature of key structures. 5) Add high thermal conductivity graphite to reduce temperature gradient, meanwhile reduce the number of thermal control temperature control circuits and power. 6) The regionalization and refined temperature control power density distribution design can be used for components with large temperature differences (Fig.6), to ensure the temperature stability of the controlled structure. Table 3 shows the temperature stability and gradient of front tube and secondary mirror bearing with refined heat shield improved, which beneficial for structural stability and improving imaging quality.Results and DiscussionsTo verify the correctness of the thermal control design of the main body of the remote sensing device, high temperature stability thermal control design measures were applied to the actual remote sensor. A thermal balance test was conducted in a large vacuum tank, and the thermal balance test results of the main components are shown in Fig.7-Fig.9. It was verified that high temperature stability thermal control design can ensure the main body temperature within the required temperature range under various extreme working conditions. After in orbit flight verification, Figure 10 shows that the thermal design effectively shields internal and external heat flow disturbances, the temperature meets the requirements. The temperature stability of key components throughout their entire life cycle can be better than ± 0.2 ℃.ConclusionsThe characteristics of the thermal environment, structural form, and indicator requirements of ultra-low orbit remote sensors propose challenges for thermal control design which achieve high temperature stability control under multiple adverse conditions. The high temperature stability thermal control providing a good temperature environment for the main body through system level thermal control design used the concept of combining external insulation with internal precision control and measures like camera’s door, high-precision temperature control radiation insulation structure, graphite composite uniform temperature structure, and variable density refinement temperature control power. The ground test results and in orbit flight data proves the correctness and rationality of the high stability thermal control design.
Jan. 25, 2025Vol. 54 Issue 1 20240076 (2025)
Xiaoheng WANG, Jianqing LV, Boyang CHENG, Yizhuang ZHANG, and [in Chinese]
ObjectiveThe traditional space target detection technology primarily relies on single-mode sensors such as optical telescopes, radar, and LiDAR. However, single-mode detection methods have significant limitations when faced with complex space environments. For instance, optical telescopes are constrained by ambient light conditions, radar detection is susceptible to clutter interference, and the effective range of LiDAR is limited. Additionally, single detection modes struggle to adapt to changing space environments. For example, using only visible optical detection can lead to weak signals in shadowed areas and signal saturation under intense light, all of which affect the effectiveness of space target detection. To address these issues and enhance the environmental adaptability of space target detection systems, this article explores the development of a multi-mode space target sensing system that utilizes aperture and detector multiplexing, leveraging the advantages of different bands and detection modes. This approach aims to provide multi-source space target detection data.MethodsThis paper designs a highly integrated multi-mode space target sensing system consisting of four detection structures: visible to near-infrared, short-wave infrared, mid-wave infrared long focal length, and zoom (Fig.1). The visible-near infrared system, the short-wave infrared system (Fig.2), and the mid-wave infrared long focal length system (Fig.5) share the front-end optical aperture, while the mid-wave infrared zoom (Fig.7) and mid-wave infrared long focal length system share the infrared detector. Through a clever multi-optical path layout design, this system resolves the conflicting issues between various detection modes of the optical system and limited space.Results and DiscussionsThe system uses a 1 920×1 080 detector for the visible to near-infrared band, with a pixel size of 9 μm. The RMS radius of the spot diagram of is less than 1.6 μm, and the MTF across the full field of view at the characteristic frequency of 55.6 lp/mm is greater than 0.6. For the short-wave infrared band, a 1 280×1 024 detector is used, with a pixel size of 10 μm. The system's spot diagram RMS radius is less than 2.5 μm, and the MTF at 50 lp/mm is greater than 0.39. The mid-wave infrared zoom and long focal length system modes use the same detector, with an array size of 1 080×1 024 and a pixel size of 12 μm. In both modes, the optical system's spot diagram is close to the diffraction-limited Airy disk, and the MTF across the full field of view is also near the diffraction limit. In summary, each mode of this multi-mode space target detection system has excellent imaging capabilities.ConclusionsAn integrated multi-mode space target sensing system is proposed and designed, which has four detection modes: visible to near-infrared detection system, short-wave detection system, mid-wave infrared long focal length and mid-wave infrared zoom system. The visible to near-infrared detection system, the short-wave detection system, and the mid-wave long focal system employ a common aperture design, while the mid-wave long focal system and the mid-wave zoom system share a common detector. Compared to single-mode space target sensing systems, the highly integrated multi-mode sensing system can obtain multi-source data while maintaining a lightweight design, allowing for high-precision spatial information through data fusion. This system boasts stronger environmental adaptability, thereby enhancing the ability of space-based target sensing systems to detect targets in complex space environments within the constraints of current satellite resources.
Jan. 25, 2025Vol. 54 Issue 1 20240375 (2025)
Chengbin WANG, Tingliang HU, Haijia CONG, and Haitao YUAN
ObjectiveThe large-aperture off-axis three-mirror optical system, with its advantages of multiple optimization variables, simple structure, wide field of view, unobstructed view, no chromatic aberration, and high resolution, is widely used in space infrared cameras. Before entering orbit, space infrared cameras must endure severe mechanical environments during the launch phase. After entering orbit, they are subjected to microgravity and complex space thermal conditions. Under a series of external loads, the ideal focal plane position of the camera is likely to shift, leading to defocus issues in the infrared camera and ultimately failing to achieve the mission objectives. Therefore, improving the load adaptability of large-aperture off-axis three-mirror infrared cameras and reducing the risk of defocus in orbit have become key research areas. This paper focuses on the secondary mirror of the off-axis three-mirror optical system as the target for focus adjustment, and carries out adaptive design and experimental verification for the application scenarios of the focus-adjusting secondary mirror. MethodsStarting from the weight and positional tolerance accuracy requirements of the optical elements in a large-aperture off-axis three-mirror infrared camera, and considering the feasibility of the corresponding focusing mechanism, a focusing scheme using the secondary mirror as the focusing object was determined. Based on the constraints of the focusing secondary mirror's application scenarios, adaptive design was performed for the secondary mirror and its support structure. A scheme utilizing silicon carbide for the secondary mirror material and central support was adopted to achieve a lightweight and compact structure for the focusing secondary mirror. A parameterized model (Fig.1), a finite element model (Fig.2), and an optimization function for the focusing secondary mirror were established. Structural optimization of the secondary mirror was carried out based on the parameterized model, with surface shape accuracy and weight as optimization constraints. To verify the feasibility of the design, machining, assembly, and experimental validation of the secondary mirror and its support structure were conducted.Results and DiscussionsBased on the parameterized model and optimization function, the structural optimization of the secondary mirror was completed (Tab.3), and the simulation analysis results met the design requirements (Tab.4). To verify the engineering feasibility of the focusing secondary mirror scheme, optical machining of the mirror surface and secondary mirror structure was completed (Fig.3-Fig.4). Assembly and testing of the secondary mirror and its support structure were carried out, and no change was observed in the mirror surface shape accuracy (Fig.5). After assembly, the mirror was installed on the focusing mechanism and underwent vibration testing (Fig.6). The RMS change in mirror surface shape accuracy after vibration testing was 0.001λ (λ=632 nm) (Fig.7). The variation in mirror surface shape accuracy may be due to the redistribution of bonding stresses between the secondary mirror and its support during the vibration process. However, the final surface shape accuracy of the focusing secondary mirror meets the optical system's requirements.ConclusionsTo improve the imaging reliability of the off-axis three-mirror infrared optical camera under harsh mechanical and thermal conditions, a focusing method using the secondary mirror as the focusing object was proposed, based on the feasibility of implementing various focusing objects. Additionally, to reduce the load on the focusing mechanism and lower the mechanical response, a compact and lightweight method for central support of the secondary mirror was proposed. Through component assembly and mechanical testing, the secondary mirror maintained good surface shape accuracy, validating the engineering feasibility and reliability of the design. This provides a reference solution for the focusing method and support design of the focusing secondary mirror in off-axis three-mirror infrared cameras.
Jan. 25, 2025Vol. 54 Issue 1 20240439 (2025)
Zhongyu YUE, Canyi JIANG, Jin XU, Zhuangzhuang DENG, Bo ZHENG, and Liang CHEN
ObjectiveThe ground-based Primordial Gravitational Wave Telescope is designed to detect radiation in the microwave band, but physical noise sources fluctuations can interfere with the detection of gravitational waves, leading to reduced transient sensitivity and data collection gaps. This type of observation requires highly accurate and stable equipment to capture and interpret weak signals. Traditional telescopes often rely on dome structures for protection. For the Ali Primordial Gravitational Wave project in China, a unique environmental protection cover was proposed to protect the telescope. One major difference between this telescope and traditional optical telescopes is the movement range of its altitude axis (Fig.1). To accommodate the motion range of the Ali telescope, this paper focuses on the design of the altitude axis system and its control strategy.MethodsThe study first designs the motion and structural scheme for the altitude axis of the protection cover based on the telescope's unique motion pattern (Fig.2). A contact model and a friction model were established, followed by dynamic simulations. Based on the simulation results (Fig.6), a torque compensation dual-motor control strategy targeting specific positions was developed for the environmental protection cover. Additionally, for the non-linear complexity of the altitude axis system, a control strategy using SAPSO-BP-PID was designed for the active motor to enhance system robustness (Fig.9). Results and DiscussionsThe designed system uses a retractable roller-shutter structure instead of a traditional dome, ensuring protection while maintaining the telescope’s observation range. Dynamic simulations show that when only one motor drives the system, three main stages occur roller convergence and clearance compensation, normal operation, and eventual stall or loss of control (Fig.6). Simulation results indicate that, with a 1 (°)/s step signal as the reference input and an external load applied at a certain point to simulate disturbances, the SAPSO-BP strategy achieves a smaller overshoot and shorter settling time during the initial startup phase compared to other strategies with similar response times. Under disturbance conditions, the SAPSO-BP strategy demonstrates superior peak error suppression, resulting in lower mean error and integral of squared error (ISE) (Fig.11). Despite error fluctuations caused by system delays and model simplifications, the proposed dual-motor control strategy, combined with the SAPSO-BP-PID controller for the active motor, ensures effective tracking performance. The integral of speed tracking error under various reference speed curves consistently meets the design requirements (Fig.12-Fig.19).ConclusionsThe environmental protection cover system for the altitude axis proposed in this paper meets the requirements for large-range motion of the altitude axis of the Ali Primordial Gravitational Wave Telescope. The system adopts a dual-roller shutter structure, allowing the observation window to rotate freely within the altitude angle range of 45° to 135°. To achieve precise control, a torque compensation dual-motor control strategy based on target position was designed, and an SAPSO-BP-PID controller was developed by leveraging the global search capability of SA and the fast convergence ability of PSO. Simulation results show that under the same reference input and disturbance conditions, the SAPSO-BP strategy exhibits higher control accuracy compared to the PSO-BP strategy, maintaining smaller overall error during dynamic system changes. Therefore, the SAPSO-BP strategy outperforms the PSO-BP strategy in terms of dynamic response, error control, and disturbance rejection. Across various reference speed curves, the dual-motor control strategy, combined with the SAPSO-BP-PID controller for the active motor, effectively achieves coordinated allocation and stable operation of the master and slave motors. Despite error fluctuations caused by system delays and model simplifications, the strategy demonstrates excellent tracking performance in terms of response speed and overshoot. The integral of speed tracking error consistently meets the design requirements. The system design satisfies the performance needs for high-precision and large-range motion of the telescope, demonstrating its effectiveness and robustness.
Jan. 25, 2025Vol. 54 Issue 1 20240464 (2025)
Shanshan ZHANG, Yinghao SONG, Fei WANG, Dongyang AN, Zhenxu LIU, Honghao YUE, and Junyan LIU
ObjectiveCompared with other non-destructive testing methods, ultrasonic infrared thermography has a larger detection range, intuitive results, and selective identification characteristics for crack damage. This article conducts experimental research on the detection of crack defects in aluminum alloy specimens using ultrasonic infrared thermal imaging technology. Firstly, a theoretical model is established, and based on the finite element simulation analysis results of the heat generation mechanism and thermal wave diffusion behavior in the crack area under ultrasonic excitation, the frequency modulated pulse ultrasonic excitation form is introduced. The principal component analysis method and dual channel orthogonal demodulation algorithm are proposed for the extraction of surface thermal wave signals. Secondly, a lightweight ultrasonic infrared thermal imaging detection system built independently is used for pulse frequency modulation ultrasonic excitation to obtain temperature sequences and perform post-processing. Finally, crack defects of different sizes were fabricated on three aluminum alloy specimens, and the correctness of the feature extraction algorithm and the feasibility of ultrasonic infrared thermal imaging method in aluminum alloy material crack detection were verified through experiments. The amplitude map of the dual channel orthogonal demodulation algorithm with high feature image resolution and good presentation of crack defects and the first principal component analysis method were selected, and the influence of different pulse modulation parameters on the detection effect was explored. It is ultimately known that the best detection effect is achieved at a starting frequency of 2 Hz, a ending frequency of 5 Hz, and a scanning period of 6 s; The detection effect of crack defects was quantified using eigenvalue contrast and contrast fluctuation percentage. For the DOD amplitude feature image, the contrast increased by 48.63%, 47.27%, and 35.22% respectively compared to the average situation; For the PCA first principal component feature images, the contrast was improved by 41.45%, 44.26%, and 42.70%, respectively.MethodsFirstly, a lightweight ultrasonic infrared thermal imaging inspection system is built based on heat generation mechanism of defects under ultrasonic excitation. The experimental platform includes an ultrasonic excitation system, an infrared thermal imaging system, and a bench. The ultrasonic power supply is controlled by computer and data acquisition card to realize the excitation of FM pulse signal, and the small infrared camera is used to capture the thermal signal of the specimen for feature extraction. Secondly, the temperature sequence acquisition and two feature extraction methods (Dual orthogonal demodulation and Principal component analysis) are given. In addition, the universal experimental machine is utilized to obtain cracks of different sizes by stretching on three aluminum alloy specimens. Lastly, a series of experiments are carried out on the constructed experimental platform, and the effects of different pulse modulation parameters on the detection effect are explored.Results and DiscussionsThrough a series of experiments on the constructed experimental platform, the correctness of the feature extraction algorithm and the feasibility of ultrasonic infrared thermography in crack detection of aluminum alloy materials are verified. The amplitude diagram of the dual orthogonal demodulation algorithm and the first principal component of the principal component analysis method are selected, and the feature image has a higher resolution and presents the crack defects better. In addition to the obvious temperature rise at the known crack location, tiny cracks generated at the notch edge during machining can also be observed in the characteristic cloud image. Taking specimen #3 as an example, two tiny cracks with lengths of 218.2 μm and 245.8 μm at the edge of the notch were successfully detected, which further confirms that the ultrasonic infrared thermal imaging method has a high degree of identification of fine cracks (Fig.10). The effects of different pulse modulation parameters on the detection effect are investigated, and the modulation parameter that can achieve the optimal detection effect is given, and it has the optimal detection effect in the starting frequency of 2 Hz, the termination frequency of 5 Hz, and the scanning period of 6 s (Tab.3).ConclusionsFor non-destructive testing of cracks in aluminum alloy specimens, this paper chooses the infrared thermal imaging detection method with frequency modulated ultrasonic pulse excitation to conduct research on the detection of metal cracks in aluminum alloys. The main conclusions are as follows: 1) For the detection method that uses frequency modulated ultrasonic pulses as the excitation method for the detection device and extracts features from surface thermal wave signals, by extracting features from the simulated defect heat generation model, the amplitude characteristics of the first principal component using principal component analysis (PCA) and the dual orthogonal demodulation algorithm (DOD) can characterize the defect. 2) Three 7075 aluminum alloy sheet specimens with artificial crack defects were tested, and the crack shape and size on the thermal wave image obtained were basically the same as the actual crack. In addition to the crack defects obtained from experiments, this detection method also successfully identified two small cracks with lengths of and at the edge of known defects, further confirming the high recognition ability of ultrasonic infrared thermography for small cracks. 3) Changing the different modulation parameters of the pulse sequence will have a significant impact on the detection performance. The results show that under the given parameter combination conditions, the crack defect feature image has the highest contrast when the starting frequency, ending frequency, and compression period are used. For DOD amplitude feature images, the contrast has increased by 48.63%, 47.27%, and 35.22% respectively compared to the average situation; For the PCA first principal component feature images, the contrast was improved by 41.45%, 44.26%, and 42.70%, respectively.
Jan. 25, 2025Vol. 54 Issue 1 20240092 (2025)
Haiying LI, Kai ZHANG, Yun ZHA, Chonghua JIANG, Jian HUAN, and Wenli ZHAO
ObjectiveRotary Stirling coolers are critical components in missile-borne infrared thermal imaging systems. Accurately predicting their remaining life after long-term storage is essential for ensuring missile precision and operational effectiveness. This study aims to develop a reliable method for estimating the remaining life of rotary Stirling coolers that have been in storage for over ten years.MethodsBased on an analysis of storage failure mechanisms, the study considered factors such as working environment and operating conditions. Accelerated tests were designed to simulate two primary failure mechanisms: working gas pollution and leakage. Samples with over ten years of application history underwent high-temperature storage tests at 80 °C and temperature cycle tests between -55 °C and 80 °C. Storage life prediction models were established for each failure mechanism. Failure analysis was conducted on samples that failed during testing.Results and DiscussionsHigh-temperature storage tests revealed that gas pollution was not the primary cause of failure, as samples did not fail after 5 760 hours of accelerated testing (equivalent to 14.2 years under normal conditions). Temperature cycling tests proved more effective in inducing failures. Two samples failed after 330 and 270 cycles, respectively, due to excessive leakage rates (Tab.2). Failure analysis using scanning electron microscopy revealed cracking between the metal substrate and coating layer in one sample (Fig.3), and partial extension and loss of the outer coating layer in another (Fig.4). These findings suggest that temperature cycling has a more significant impact on cooler storage life than gas pollution. A prediction model based on the Norris-Landzberg equation was proposed for estimating remaining life under temperature cycling conditions.ConclusionsThis study provides valuable insights into the long-term storage behavior of rotary Stirling coolers. While working gas pollution appears to have a slower impact on storage life, gas leakage induced by temperature cycling emerged as the dominant failure mechanism. The developed prediction models offer a foundation for estimating remaining cooler life. However, due to limited sample size and potential environmental prediction biases, further research is needed. Future work should focus on increasing sample size, refining temperature cycling test parameters, and incorporating more field usage data to enhance the accuracy and practical significance of the remaining life prediction models.
Jan. 25, 2025Vol. 54 Issue 1 20240221 (2025)
Pengfei BAO, Xianliang ZHU, Chunlei YU, Bo YANG, Xiumei SHAO, Xue LI, and Dafu LIU
Objective The preparation of a high consistency, high aspect ratio indium bump arrays represent a pivotal technology for fabricating high density focal plane array (FPA). Indium is one of the most commonly utilized materials for interconnecting bumps in FPAs, particularly cooled FPAs, due to its exceptional ductility, electrical conductivity, thermal conductivity, and other properties. The current research on indium bump growth is primarily concerned with the macroscopic effects of process parameters on the growth of indium bump. However, there is a paucity of in-depth reports on the growth mechanism of indium bump. When considered in conjunction with the theory of thin-film nucleation growth, the impact of pivotal process parameters, such as substrate temperature and deposition rate, on the growth of indium bumps can be elucidated from a microscopic perspective. This offers a theoretical and technical foundation for developing and preparing indium bump arrays with smaller pixel pitch.Methods According to the indium bump growth model (Fig.1), indium bump arrays with an image element spacing of 10 μm and a photolithography pattern diameter of 6 μm (abbreviated as P10-Φ6) were studied, and indium bump arrays were obtained by thermal evaporation method under different growth parameters. The morphological differences (Fig.2(a)-(f)), high uniformity (Fig.3(a)-(b)), top diameter uniformity (Fig.4(a)-(b)), and indium bump growth rate differences (Fig.5(a)-(b)) of the indium bump arrays were comparatively analyzed with the theory of thin film micro growth for the indium bump arrays with three different substrate temperatures (T0 K, T0-30 K, and T0-45 K). Comparative analysis of indium bump arrays at three different deposition rates (VV0+2 Å/s, VV0+15 Å/s, and VV0+23 Å/s) in terms of morphology difference (Fig.6(a)-(f)), height uniformity (Fig.7(a)-(b)) and top diameter uniformity (Fig.8(a)-(b)), indium bump growth rate differences (Fig.9(a)-(b)).Results and Discussions The standard deviation of the height distribution of indium bumps decreased from 0.22 to 0.14 and 0.09(Fig.3(a)-(b)), the height nonuniformity from 15.4% to 11.8% and 6.6%(Fig.3(a)-(b)), and the standard deviation of the top diameters from 0.64 to 0.43 and 0.37(Fig.4(a)-(b)), respectively, when the substrate temperature was decreased from T0 K to T0-30 K and T0-45 K. This resulted in an improvement in the homogeneity of the indium bump arrays. Nevertheless, a reduction in the substrate temperature from T0-30 K to T0-45 K has been observed to increase the lateral growth rate of the indium layer from 3.4 Å/s to 4.1 Å/s(Fig.5(a)-(b)). This is an unfavorable phenomenon for the growth of indium bumps with high aspect ratio. The increase in deposition rate from VV0+2 Å/s to VV0+15 Å/s and VV0+23 Å/s resulted in a reduction in the standard deviation of the indium bump height distribution from 0.14 to 0.09(Fig.7(a)-(b)), the height nonuniformity from 11.8% to 8.1%(Fig.7(a)-(b)), and the standard deviation of the top diameter of the indium bumps from 0.49 to 0.31(Fig.8(a)-(b)). The standard deviation of the top diameter of the indium bumps decreased from 0.49 to 0.31 and 0.34(Fig.8(a)-(b)), respectively. The increase in deposition rate resulted in enhanced indium bump uniformity. Nevertheless, when the deposition rate is elevated from VV0+15 Å/s to VV0+23 Å/s, the indium film roughness undergoes a mere 0.001 μm alteration(Fig.9(a)-(b)). Additionally, the lateral growth rate of the indium layer demonstrates a linear correlation with the deposition rate, thereby limiting the potential for further enhancement of indium bumps through the continued pursuit of elevated deposition rates.Conclusions On the one hand, high deposition rates and low substrate temperatures result in the refinement of indium film grains and facilitate the deposition of highly uniform indium bump arrays. Following a decrease in substrate temperature of 45K, the nonuniformity of the indium bump height was observed to decrease from 15.4% to 6.6%. In contrast, the indium bumps' top diameter range difference decreased by 0.9 μm. Following an increase in deposition rate of 21 Å/s, the indium bump height nonuniformity decreased from 11.8% to 6.6%, and the top diameter range difference of indium bumps decreased by 0.4 μm. Conversely, the impact of kinematic roughening in the high deposition rate specific gravity increases, while indium film roughness moderates with the deposition rate. Concurrently, the capacity of indium diffusion from the photolithography pattern edge to the surrounding area is diminished at a high deposition rate and low substrate temperature.Furthermore, the lateral growth rate of the indium layer increases from 3.4 Å/s to 4.1 Å/s following sustained temperature reduction. However, accelerated closure of the photolithography pattern is not conducive to the growth and preparation of high density, high aspect ratio and high uniformity indium bumps. The effects of the deposition rate and substrate temperature on indium bump growth are twofold. In order to obtain indium bump arrays with flat tops, high uniformity, and full morphology, it is necessary to select a suitable combination of substrate temperature and deposition rate parameters for small pitch focal planes.
Jan. 25, 2025Vol. 54 Issue 1 20240315 (2025)
Changhang ZENG, Jun CHEN, Youyu GAN, Hongsheng SUN, Yibin HUANG, Zhengchao CHEN, and Zhiyu ZHANG
ObjectiveThe cold shield is an important component in the infrared detector assembly to prevent external stray energy from entering the detector focal plane and to improve the system's response temperature sensitivity to targets. High operation temperature infrared detector is one of the research directions for third-generation infrared photon detectors. At higher operation temperature, the stray light from the cold shield component will generate background radiation noise, causing interference with the imaging of the infrared detector. Researching the influence and suppression of thermal radiation from high operation temperature cold shield component has a certain significance for the development of high operation temperature infrared detector assembly.MethodsBased on the Monte Carlo principle, a cold shield model was established using 3D Studio Max (Fig.2). The model information was extracted to write program to calculate the radiation exchange factors of various parts of the cold shield component to the IRFPA, and the noise signal generated by the thermal radiation of the cold shield component on the IRFPA was obtained. During the internal blackening of the cold shield, the relationship between the noise signal generated by the thermal radiation of the cold shield component on the IRFPA and the temperature was investigated. To suppress the thermal radiation from the cold shield component, two schemes of overall reduction in cold shield emissivity and part reduction in cold shield emissivity were studied and compared.Results and DiscussionsWhen the cold shield is internally blackened, the noise signal generated by the thermal radiation of the cold shield component on the IRFPA at different temperature were calculated (Fig.5, Tab.3). When the temperature is below 200 K, the noise signal slowly increases as the temperature rises; When the temperature is above 200 K, the noise signal rapidly increases as the temperature rises. When the overall emissivity of the cold shield is reduced, the noise signal generated by various stray radiation on the IRFPA at 200 K were calculated (Fig.6-Fig.7). Overall reduction in cold shield emissivity leads to a rapid increase in noise signals from external stray radiation. Similarly, when the part emissivity of the cold shield is reduced, the noise signals generated by various stray radiation on the IRFPA at different temperatures were calculated (Fig.11-Fig.14), and the suppression effect of part reduction in cold shield emissivity on total stray radiation is temperature-dependent.ConclusionsWith the given parameters in this study, the calculation and analysis of a certain high operation temperature cold shield component was carried out. If the ratio of the noise signal generated by the thermal radiation from the cold shield and optical filter to the response signals generated by the target thermal radiation is less than 10%, the temperature of the cold shield component must not exceed 196 K. Total reduction in cold shield emissivity can reduce the noise signal generated by the thermal radiation of the cold shield, but it will cause a rapid increase of noise signal from external stray radiation. Part reduction in cold shield emissivity can reduce the noise signals generated by the thermal radiation of the cold shield and slowly increase the noise signal from external stray radiation. The scheme of part reducton in cold shield emissivity has a temperature-dependent effect on the suppression of total stray radiation; When the temperature of the cold shield component is below 203 K, it will increase the noise signal of total stray radiation; When the temperature of the cold shield component is above 203 K, it can reduce the noise signal of total stray radiation.
Jan. 25, 2025Vol. 54 Issue 1 20240403 (2025)
Baohua DONG, Xiaowei XIA, Peng ZHUANG, Chenbo XIE, Yueling ZHOU, Xiantao KONG, and Hongyan LUO
ObjectiveIn recent years, extreme weather and natural disasters have occurred frequently, causing great harm to socio-economic and life safety, and real-time meteorological data with high spatiotemporal resolution is urgently needed to predict the occurrence of extreme weather and natural disasters. The wind is one of the important parts of meteorological data, and accurate wind field data plays an important role in meteorology, environment, energy, urban planning, transportation, and emergency response. As point measuring instrμments, contact anemometers such as wind cup anemometers and ultrasonic anemometers have the problem of small measurement range, and the contact measuring equipment needs to invade the wind field, resulting in the distortion of the wind field to be measured. Coherent wind lidar uses the Doppler shift effect of aerosol particles on the beam to measure the wind field. Coherent wind lidar has significant advantages in terms of detection range, data accuracy, and spatiotemporal resolution, which can meet the needs of wind field data in meteorology, environment, transportation, energy, and other fields. In this paper, a self-developed coherent wind lidar system is introduced, its principle and design are introduced, the accuracy of the external field ratio data of the system in Anqing National Basic Meteorological Station is verified, and finally, the urban wind field changes and typical weather processes are analyzed.Methods A coherent wind lidar system is developed in this paper. Based on the principle of Doppler frequency shift (Fig. 1), 1550nm is selected as the laser beam. The signal frequency is analysed with the ML DSP algorithm to get the period graph, and then the Doppler translation information is obtained. A coherent wind measurement lidar system composed of transmitting, receiving and receiving is designed (Fig 2). According to the error of the comparison between the system and the sounding balloon data, the measurement accuracy of the data is judged (Fig 6).Results and DiscussionsThe correlation between the coherent wind lidar and the sounding data shows that the correlation of wind speed is 0.962, the correlation of wind direction is 0.96, the standard deviation of wind speed is 0.93m/s, and the standard deviation of wind direction is 6.52°. The coherent wind lidar was observed in Pingyin County from January to March 2024 and found that the wind speed at different altitudes above the city increased. The wind speed decreased significantly in April, and the wind direction at the height of 200 m above the city during the monitoring period was mainly northeast wind and south wind. The wind direction characteristics were more consistent in different months. The wind direction at the height above 500 m gradually changed. The wind direction showed the characteristics of different months, combined with the topography of Pingyin County (Fig.15), the wind direction characteristics at the height of 200 m were more consistent with the terrain characteristics. From June 7 to July 7, 2024, the wind lidar was observed in Beijing. It was found that the wind speed change characteristics within 500 m altitude in Beijing on a sunny day were consistent with the change of temperature near the surface. The wind direction was quite different, and the vertical airflow varied greatly from 12 o'clock to 18 o'clock every day. With the increase in altitude, the vertical airflow change weakened, and the wind speed above 1 km altitude increased as a whole, with no obvious diurnal variation trend. The wind direction was mainly southwest wind (Fig.22- Fig.24).ConclusionsA coherent wind lidar system is developed based on the Doppler effect of laser, which has a detection distance of 50-4000 m, a temporal resolution of 10 s, and a vertical resolution of 30 m. The correlation between the system and the sounding balloon showed that the correlation between wind speed is 0.962, the correlation of wind direction is 0.96, he standard deviation of wind speed is 0.93 m/s, and the standard deviation of wind direction is 6.52°. According to the monitoring data, it is found that the wind field within 1 km of the near-surface altitude of the city changes greatly due to the influence of terrain and near-ground temperature, and the wind field above 1 km of altitude changes little. At the same time, the typical processes of Pingyin County and Beijing are analyzed, and it is found that the coherent wind lidar can effectively monitor the urban rainfall and the intersection of cold and warm air and has good continuous observation ability of wind field and monitoring and analysis ability of typical weather phenomena.
Jan. 25, 2025Vol. 54 Issue 1 20240388 (2025)
Lunjing XIE, Changtao HE, Lingling XIONG, Qianqian SONG, Fuzeng NIU, Yuyang ZHANG, and Jinghua HAN
ObjectiveIn the laser system, the micro-nano impurities attached to the optical glass surface will cause additional modulation of the beam, the laser beam quality and the damage threshold of the optical component will be reduced, and even the output and load capacity of the laser device will be affected. Therefore, in order to improve the stability and reliability of the optical system, it is necessary to maintain the cleanliness of the optical components. For the micro and nano pollutants on the surface of optical glass, laser cleaning is used to clean. In particular, the selection of suitable laser energy is the key to determine the cleaning effect of micro and nano particles on the glass surface. In order to achieve the ideal cleaning effect, it is necessary to study the mechanism of the interaction between laser and micro-nano particles on the glass surface. By analyzing the comprehensive effect of the action process to predict the action effect, the appropriate cleaning energy can be selected.MethodsThe sample was prepared by particle deposition, K9 glass is used as the substrate, cerium oxide particles are used as the pollutants on the glass surface, and the laser cleaning experiment and analysis are carried out. For different laser energy, the micro and nano particles are cleaned in two ways: "forward" and "back". Among them, in the "forward" cleaning, the particle is located above the glass base, the laser is cleaned from top to bottom, and on the contrary, it is "back" cleaning. The cleaning effect for different energy and the thermodynamic damage of glass substrate by different cleaning methods are analyzed by experiment. At the same time, the thermal stress model of the cleaning process was established, and COMSOL was used for simulation to analyze the mechanism of the interaction between the laser and the micro-nano particles on the optical glass surface and the thermodynamic effect of the particles on the substrate.Results and DiscussionsThe experiment shows that the backward cleaning is better than the forward cleaning. By using the method of backward cleaning, for the laser energy of 0.815 J/cm2, the large particles on the glass surface can be cleaned better. And for increasing the laser energy to 1.120 J/cm2, the cleaning effect is further improved(Fig.9). The laser energy of 1.426 J/cm2 causes obvious thermodynamic damage on the surface, such as pits and deformation(Fig.10). The simulation results show that for laser energy greater than 0.764 J/cm2, the micro and nano pollutants with particle size greater than 1 μm can be stripped off the glass surface due to thermal stress. The glass surface is cleaned without heat damage. However, if the laser energy exceeds 1.426 J/cm2, the thermal stress and shock wave generated by the thermal effect and particle temperature exceeding the melting point of the glass substrate will cause damage to the glass surface (Fig.3).ConclusionsThe cleaning samples were prepared by particle deposition method and the laser cleaning experiments were carried out. The results indicate that the laser energy in the range of 0.815-1.120 J/cm2 can achieve significant cleaning effects by using the method of backward cleaning, and there is no damage to the substrate. And for the energy of 1.426 J/cm2, the obvious thermodynamic damage appears on the cleaning surface. The model of heat conduction and thermal stress between particles and substrate was established, and the comprehensive effect of laser cleaning on glass surface was analyzed. COMSOL was used for simulation, and the results showed that a good cleaning effect can be obtained when the laser energy is greater than 0.764 J/cm2. When the laser energy is 1.426 J/cm2, irreversible thermodynamic damage occurs on the glass surface. The comprehensive effect of laser cleaning analyzed by theory is consistent with the experimental results. Therefore, through the analysis and modeling of the comprehensive effect of the interaction process between laser and micro and nano particles, the cleaning effect of different acting energies can be accurately predicted, so that the correct laser cleaning energy can be selected to achieve the ideal cleaning effect.
Jan. 25, 2025Vol. 54 Issue 1 20240394 (2025)
Mi LI, Yu QI, Hengyu YI, Jianli SHANG, Jijin HUANG, and Yan KUANG
ObjectiveWith the increasing emphasis on near space in various countries, the importance of high-altitude drones with the ability to fly in near space is also increased. In order to obtain more accurate real-time information, it is necessary to significantly extend the flight time of high-altitude drones. Using laser wireless energy transmission technology to transmit energy to high-altitude drones is a feasible route to extend their flight time. Therefore, this paper conducted theoretical research on laser wireless energy transmission technology at long distance and analyzed the feasibility of using laser for wireless energy transmission to high-altitude drones in theory.MethodsThe current problems such as insufficient transmission distance, low transmission power and low transmission efficiency on laser wireless energy transmission are found by investigating the current development status on laser wireless energy transmission technology at home and abroad. In order to enhance the transmission distance, transmission power and transmission efficiency of laser wireless energy transmission, the technical route for wireless energy transmission to high-altitude drones is proposed by comparing the laser source and photovoltaic cells, which using Yb doped fiber laser as the laser source, InGaAs photovoltaic cell as the photoelectric conversion module and combining laser relay technology. Based on the workflow of laser wireless energy transmission, the efficiencies of multiple workflows such as laser generation, transmission, reception and photoelectric conversion are analyzed, and then the system efficiency of using this technical route for laser wireless energy transmission to high-altitude drones is calculated. At the same time, the technical approaches to enhance the system efficiency of laser wireless energy transmission are discussed preliminary.Results and DiscussionsAccording to the workflows of laser wireless energy transmission and based on the investigation of efficiencies in multiple workflows such as laser generation, transmission, reception and photoelectric conversion, the system efficiency of wireless energy transmission to high-altitude drones at the distance of 60 km can reach 11% to 14% by using the technical route proposed in this paper, which demonstrates the feasibility of laser wireless energy transmission to high-altitude drones at long distance theoretically. At present, the high power laser sources and InGaAs photovoltaic cells have basically met the requirements of wireless energy transmission at long distance, but the laser relay technology is still immature and requires in-depth research. The technical approaches to enhance the system efficiency of laser wireless energy transmission at long distance are discussed preliminarily. Besides the laser relay technology (Fig.3), the rational layout of photovoltaiccell arrays (Fig.6) and the phase modulation to laser beam by using phased array technology (Fig.7) also can enhance the systemefficiency of laser wireless energy transmission.ConclusionsThe laser wireless energy transmission technology is a feasible solution to extend the flight time of the high-altitude drones. The investigation on the progresses of laser wireless energy transmission technology and the analysis on the current problems of laser wireless energy transmission technology are conducted in this paper. In order to solve the problems such as insufficient distance, low transmission power and low transmission efficiency of laser wireless energy transmission, a technical route is proposed to enhance the system efficiency of laser wireless energy transmission for the first time by using Yb doped fiber lasers as the laser source, InGaAs photovoltaic cells as the photoelectric conversion module and combining laser relay technology. The efficiencies of multiple workflows on wireless energy transmission are investigated and estimated, and then the system efficiency of ground laser wireless energy transmission to high-altitude drones at the distance of 60 km can reach 11% to 14% by calculation, which proves the feasibility of transmitting energy to high-altitude drones by laser theoretically. At present, the quantitative analysis and calculation about the system efficiency of laser wireless energy transmission at long distance aren't found in public literatures. At the same time, the technical approaches to enhance the system efficiency of laser wireless energy transmission at long distance are discussed preliminarily, such as reasonable layout of photovoltaic cell groups and using phased array technology to improve the uniformity of laser intensity distribution, which provides reference to the research on high power laser wireless energy transmission at long distance in future.
Jan. 25, 2025Vol. 54 Issue 1 20240396 (2025)
Pengcheng ZHANG, Yang WANG, Anna LI, Hao HUANG, Cheng ZHANG, Jiachang ZHANG, Yonggui ZHANG, Lihao WANG, Yichen LIU, and Zhenyu WU
ObjectiveIn MEMS laser tracking and aiming systems, MEMS micro-mirrors are identified as the key components. These micro-mirrors enable the systems to achieve stable tracking and aiming of targets through their control of laser deflection and the signal acquisition by photoelectric detectors. However, the pursuit of higher response speeds and sizes of larger mirror in the design process has led to a compromise in the scanning field of view, which does not meet the requirements for large field of view tracking and aiming of targets. To address the issue of the limited scanning field of view of MEMS micro-mirrors, this paper has conducted research on the wide-angle optics and has designed a wide-angle lens suitable for tracking and aiming systems.MethodsUtilizing Zemax optical simulation software, a wide-angle lens was designed, which composed of a bi-convex lens and two bi-concave lenses along with its mounting sleeve and clamp rings (Fig.6). The wide-angle lens was evaluated using indicators such as the beam divergence angle and the Gaussian fitting error of the light intensity distribution. A beam quality analyzer was employed to compare the beam quality before and after expansion, thereby analyzing the impact of the expanded field of view lens on the beam quality. An experimental characterization device was set up to characterize the expansion magnification rate of the wide-angle lens (Fig.8). By altering the control current of the voice coil motor's fast reflection mirror, the laser deflection angle before and after the addition of the wide-angle lens was compared to analyze the expansion results. A MEMS quasi-static micro-mirror was used to control the deflection of a 638 nm laser, and a practical application demonstration device was set up to compare the laser scanning patterns before and after expansion (Fig.9). This included line scanning patterns and Lissajous scanning patterns.Results and DiscussionsThe experimental results indicate that the designed wide-angle lens possess an expansion magnification rate of approximately 2.88 times, with the expansion nonlinearity error being less than 0.7% (Fig.14). There is no significant change in the laser beam quality before and after expansion, with the Gaussian fitting goodness exceeding 99%. The divergence full angle after expansion is controlled within 2 milliradians (Tab.4), ensuring the quality of the laser beam post-expansion. The use of the wide-angle lens has increased the scanning field of view of the original MEMS micro-mirror from less than 4° to over 10°, essentially meeting the design requirements.ConclusionsA wide-angle lens for MEMS micro-mirror laser tracking and aiming systems has been designed, characterized by its simple structure and stable expansion. With an expansion magnification rate of approximately 2.88 times and a nonlinearity error of less than 0.7%, the design of the wide-angle optics for MEMS micro-mirror laser tracking and aiming has realized a larger scanning field of view for the system. This has been successfully applied to the expanded scanning of MEMS micro-mirrors, contributing to the rational application of high-performance MEMS micro-mirrors with small scanning angles in laser tracking and aiming.
Jan. 25, 2025Vol. 54 Issue 1 20240418 (2025)
Siyuan CAO, He ZHAO, Tong XIA, Weihua SONG, Qian ZHANG, Xiuhong WANG, and Pu WANG
ObjectiveHolmium laser in solid state has become one of the commonly used lasers in kidney stone surgery because of its high productivity, safety and wide application. However, there are some problems with lithotripsy of holmium laser, like pulverizing stones insufficiently or exerting thermal effects. Tm-doped fiber laser promises to solve these problems with laser lithotripsy because it has its specific emission wavelength, high conversion efficiency, good beam quality and stable structure. Because of its wavelength’s covering water absorption peak, high peak power, and low pulse energy, 2 μm ultrafast laser can increase the efficiency of breaking stones, and decrease the thermal damage to peripheral soft tissue. Therefore, 2 μm picosecond thulium doped fiber laser was constructed and in vitro studies were conducted to explore the effect and mechanism of 2 μm laser lithotripsy.MethodsLinear-cavity SESAM mode-locked fiber laser was used as seed source, and the amplification method of MOPA structure was applied. Thus the high peak power picosecond laser pulse was achieved, with the wavelength of 1962 nm, the pulse width of ~50 ps and the peak power of over 20 kW, as shown in Fig.1-Fig.3. Set up a laser lithotripsy optical path device, as shown in Fig.4. Laser output was collimated through a lens with a focal length of 100 mm, and then residual pump light was filtered out using a dichroic mirror. Three mirrors were used to control the laser transmission trajectory, and finally operated a lens with a focal length of 50 mm to focus the laser. By adjusting the distance between the lens and the sample, controlled the laser to focus on the sample with spot diameters of 200 μm, 300 mm, and 400 μm, respectively. Placed the stone in a culture dish, added water to a depth of less than 1 mm, and performed laser lithotripsy for 30-120 s, breaking it into small pieces as much as possible. Due to the ability of the human body to expel stones smaller than 2 mm on its own, a 2 mm sieve was used for continuous filtration of stone fragments. Then placed the stone in a drying oven at 80 ℃ for 10 minutes to dry the surface moisture of the stone. Measured the mass of stones before and after the experiment using an electronic balance, with three measurements per experiment. Maintained a distance of 2 mm between the probe of the digital temperature tester and the stone, recorded the temperature changes before and after laser lithotripsy to study the influence of liquid thermal effects during the lithotripsy process.Results and DiscussionsWith the increase of laser power and the decrease of spot size, the mass reduction of stones significantly increases, as shown in Fig.5(a). With the combination of minimum laser power and maximum spot size (5 W, 400 μm), the reduction in stone mass was the smallest ((5.8 ± 1.1) mg); When the highest laser power was combined with the minimum spot size (12 W, 200 μm), the reduction in stone mass reached its maximum ((75.2 ± 9.1) mg). In addition, Figure 5(b) further indicated that during the 120 s experimental period, the fragmentation efficiency of picosecond thulium doped laser remains relatively stable, and there was no significant fluctuation in the mass of melted stones every 30 seconds. Confirmed the close relationship between the efficiency of picosecond thulium laser lithotripsy and power density. Under a fixed spot size, increasing the laser power could effectively increase the energy density per unit area, thereby promoting faster ablation of stones. Meanwhile, reducing the size of the light spot could further improve energy concentration and enhance stone crushing efficiency at the same power.ConclusionsLinear-cavity SESAM mode-locked fiber laser was used as seed source, and the amplification method of MOPA structure was applied. The high peak power picosecond laser pulse was achieved, with the wavelength of 1962 nm, the pulse width of ~50 ps and the peak power of over 20 kW. Vitro lithotripsy studies showed that increasing laser power can effectively increase the energy density per unit area under a fixed spot size, thereby promoting faster ablation rate of stones. At the same time, reducing the size of the light spot could further improve energy concentration and enhance stone crushing efficiency at the same power. The efficient fragmentation efficiency during the interaction between picosecond thulium laser and stones wad related to the micro explosion of pore fluid caused by the short pulse and high peak power of picosecond laser. However, the specific mechanism of action and parameter optimization still required extensive research in the future. In summary, these preliminary research results indicate great potential for future applications in the field of short pulse picosecond laser lithotripsy.
Jan. 25, 2025Vol. 54 Issue 1 20240436 (2025)
Xiaofan WANG, Ning XU, Yonghui GONG, and Jiawei LI
In order to obtain high coherent narrow linewidth laser diode array (LDA) output, an effective method of in-phase mode phase-locked output is proposed by using a half period transverse offset face-to-face mutual injection Talbot cavity on LDA chip. By numerically solving the dynamic Lang-Kobayashi (L-K) rate equation of the (8+8) laser array structure, the phase-locking process of the array under different fill factors (FF) is analyzed. The results show that when the FF increases from 0.05 to 0.4, the laser units experience a process from periodic oscillation to stable phase-locking and then to chaotic state. It is determined that when the FF is between 0.08 and 0.2, the in-phase mode phase-locked can be obtained. Through the simulation of mutual injection of (8+8) laser array, it can be found that when FF=0.09-0.25, single longitudinal mode frequency locked output can be achieved, while the output spectra corresponding to other FFs are coexistence of multiple longitudinal modes. Finally, the threshold gain between different supermodels is calculated by laser intracavity transformation matrix, and the maximum threshold gain difference of the in-phase and out-of-phase modes under different FFs are determined. The results show that, for the face-to-face mutual injection phase-locked structure, when the FF is around 0.1, stable in-phase mode phase-locked can be achieved, and the threshold gain difference between in-phase and out-of-phase modes is the largest, the in-phase mode phase-locked output with the strongest robustness of the system can be obtained.MethodsUsing a half period transverse offset face-to-face mutual injection Talbot cavity on LDA chip, a method of in-phase mode phase-locked output is built (Fig.1). The dynamic process of the (8+8) laser array model is calculated using the fourth-order Rung-Kutta algorithm of Matlab (Tab.1). Lumerical-Interconnect is used for laser arrays frequency locking simulation (Fig.3). Besides, the threshold gain of supermodes is calculated by laser intracavity transformation matrix under different FFs (Fig.6).Results and DiscussionsTemporal evolution of wavelength and phase are studied under different FFs, the results show that as FF increased, the units experienced a process from periodic oscillation to stable phase locking, and then to chaotic state. Using the fourth-order Rung-Kutta algorithm, in-phase-mode phase-locked can be confirmed when FF between 0.08-0.2 (Fig.2). With simulation of frequency locking through mutual injection, the frequency-locked phenomenon under different FFs by output spectra can be intuitively observed (Fig.5). The results show that when the FF is between 0.09-0.25, the ideal single longitudinal mode output can be realized. After calculating the threshold gain between supermodes, the maximum threshold gain between in-phase mode and out-of-phase mode is determined (Fig.7). When FF increases from 0.02 to 0.3, the threshold gain difference between in-phase mode and out-of-phase mode rises up at the beginning and decreases in late.ConclusionsA face-to-face mutual injection LDA structure based on integrated Talbot cavity is proposed, and the phase-locked dynamic behavior of the structure is theoretically analyzed. By simulating units mutual injection, the output spectra under different FFs are analyzed. The results indicate that stable in-phase mode locked can be achieved when FF around 0.08-0.2. By calculating the threshold gain of supermodes under different FFs, it is found that when FF=0.1, the difference in threshold gain between in-phase mode and out-of-phase mode is the largest, indicating the FF is the optimal value for achieving single in-phase mode output. This phase-locked model and structure can be used to fabricate phase-locked laser arrays with on-chip Talbot cavity.
Jan. 25, 2025Vol. 54 Issue 1 20240448 (2025)
Yang LI, Xianguo LI, Lian CHEN, Qingyong YANG, Changyu XU, and Sheng XU
ObjectiveMany object target methods perform excellently under ideal lighting conditions, but their performance is not satisfactory in environments with varying lighting, particularly in low-light conditions. Applications such as autonomous vehicles at night, surveillance drones, and security systems requiring continuous monitoring often face challenges under low illumination conditions. Consequently, there is a heightened demand for the performance of target detection methods in low-light environments. Low-light conditions lead to a degradation in image quality, including reduced brightness, decreased contrast, increased noise, loss of detail, and color deviation. These issues significantly impair the accuracy of target detection methods. These issues not only alter the visual appearance of the images but also negatively impact the performance of object detection methods. Therefore, it is crucial to design an end-to-end object detection method that integrates an image enhancement network with a target detector, specifically for low-illumination environments, to maintain high detection accuracy. For this purpose, an end-to-end target detection method for low-illumination images is designed in this paper, named FDLIE-YOLO, which effectively enhances detection accuracy and confidence, reducing omissions and misjudgments.MethodsTo enhance target detection performance in low-light conditions and reduce missed detections and false positives, an end-to-end low-light image object detection method called FDLIE-YOLO (Fig.1) has been proposed. Firstly, the FDLIENet (Frequency Domain Low-Illumination Image Enhancement Network) is constructed, with the core component being the frequency domain processing module FDPB (Frequency Domain Processing Block) (Fig.2). This Block extracts global information from the image through Fourier transform and, based on the positive correlation between amplitude and brightness, enlarges the amplitude components to enhance both the image brightness and contrast, effectively improving the image quality under low-illumination conditions. Adopting YOLOv8n as the detection module, and achieving end-to-end training through a joint loss function, optimizes image enhancement and target detection(Fig.3). The combined loss comprises a magnitude difference loss with Mahalanobis distance to precisely control image magnitude, and employs the MPDIoU (Minimum Point Distance based IoU) loss to replace the original regression loss, thereby enhancing detection accuracy.Results and DiscussionsThe experiments were conducted on two datasets: the LOL-Real dataset and the ExDark dataset, FDLIENet with the mainstream low-light image enhancement network on the LOL-Real dataset and the ExDark dataset enhancement effect (Fig.5-Fig.6), the de-enhanced image obtained by the network has lower distortion and chromatic aberration than the other algorithms, and it can retain more important image information in the image. As can be seen from the results of illumination image enhancement experiments (Tab.1-Tab.2), except for SNR-Aware, PSNR is improved by at least 1.7 dB and SSIM is increased by at least 0.011; compared to FECNet and PENet, PSNR is improved by 2.51 dB and 1.7 dB, and SSIM is improved by 0.063 and 0.020, respectively; The average NIQE index on the ExDark data NIQE average index on the ExDark data set, significantly exceeds MBLLEN, ZeroDCE, KinD, and reduces 0.35 and 0.30 compared to FECNet and PENet, respectively; Param is only 0.14 which has a significant advantage over other enhancement networks; The above results show that the image has better enhancement performance. As can be seen in the detection results of the FDLIE-YOLO end-to-end low illumination image target detection method (Fig.7), the detection results of this paper's method can reduce the leakage and misdetection and show better confidence. As can be seen from the illumination image target detection experimental results (Tab.3-Tab.4), the low illumination image target detection results obtained by applying this paper's method, the target detection accuracy of FDLIE-YOLO in low illumination exceeds that of IA-YOLO and PE-YOLO, and the mAP improves by 1.6 percentage points and 1.1 percentage points, respectively; And the Param is only 3.16M, and the FPS is 88.82, which proves the excellent detection performance of this paper's method in low illumination environment.ConclusionsAn FDLIE-YOLO low-light image target detection method is designed. The method features simple structure, good image enhancement, high degree of target detection accuracy, and achieves more advanced SOTA results with better detection performance. The experimental results show that FDLIENet has a peak signal-to-noise ratio (PSNR) and structural similarity (SSIM) mean value of 23.18 and 0.858 on the LOL-Real dataset, and a natural image quality evaluator (NIQE) mean value of 3.98 on the ExDark dataset, which is superior to the state-of-the-art low-illumination image enhancement networks in recent years. FDLIE -YOLO achieves a mean accuracy (mAP) of 80.6% on the ExDark dataset, which is ahead of YOLOv8 and other end-to-end target detection methods, and the number of parameters (Param) is only 3.16 M, and the number of detected frames per second (FPS) is 88.82, which proves the excellent detection performance of this paper's method in low illumination environment.
Jan. 25, 2025Vol. 54 Issue 1 20240376 (2025)
© Copyright 2018-2021 | Chinese Laser Press.
All Rights Reserved 沪ICP备15018463号-20