


 View fulltext

2024
Volume: 53 Issue 12
29 Article(s)

Hongbing ZHOU, Rumao TAO, Xiong XIN, Haoyu ZHANG, Chenxu LIU, Xinyu WANG, Qiang SHU, Qiuhui CHU, Honghuan LIN, Jianjun WANG, Lixin YAN, and Feng JING
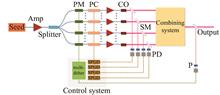
ObjectiveCoherent beam combining (CBC) can improve laser brightness while maintaining beam quality, which is one of the most promising techniques to break through the power limitation of a single fiber laser. CBC requires high-purity linearly-polarized lasers, which are usually obtained from all-polarization-maintained fiber lasers. Unfortunately, nonlinear effect thresholds of all-polarization-maintained fiber lasers are lower than that of non-polarization-maintained ones, and the system cost is higher. Non-polarization-maintained fiber laser system with active polarization control technology is one of the alternatives for achieving linearly-polarized laser sources. However, there is little research on the theory of active polarization-phase control, and no comprehensive analysis of different control schemes has been reported. In this paper, active polarization-phase control of multi-channel CBC system with different control schemes is modeled. The convergence and feasibility of the control schemes are verified, and the channel scalabilities as well as the effect of extra residual phase and dynamic noise on combining efficiency have been studied.MethodsBased on the structure of filled-aperture CBC, active polarization-phase control model is constructed, where phase control adopts multi-dithering method while the polarization control adopts SPGD algorithm to ensure fair comparison. According to the sampling scheme of laser beams, the polarization-phase control schemes is divided into individual sampling and simultaneous sampling categories. The latter ones are further divided into SPGD-based schemes and multi-dithering-based schemes. CBC performance based on the above three kinds of control schemes has been simulated with their convergence and feasibility being verified. The channel scalabilities of different schemes are compared, and the effect of the extra residual phase on combining efficiency of simultaneous sampling schemes is analyzed. Moreover, dynamic noise is modeled with emphasis on either low-frequency or high-frequency contributions, and the impact of both dynamic polarization and phase noise is simulated and analyzed.Results and DiscussionsThe control scheme of individual sampling had good channel scalability, and could converge in an average of 9 steps as shown in Fig.4. The control scheme of simultaneous sampling of beams based on SPGD algorithm was relatively insensitive to extra residual phase, where efficiency loss caused by extra residual phase of 0.1 rad was about 7% as illustrated in Fig.9(b), but the number of convergent steps was about 4.5 times of the number of channels as listed in Tab.2. The control scheme of simultaneous sampling of beams based on multi-dithering method had the fastest convergence speed (less than 7 steps for different channel numbers), but its combining performance was greatly affected by residual phase as shown in Fig.9(a). Fortunately, efficiency loss caused by extra residual phase could be reduced by increasing the amplitude of reference laser, and combining efficiency loss of < 5% could be achieved when the amplitude of reference laser was increased to be greater than 10 times of the sampled combined beam as suggested by Fig.9(c). The behaviors In dynamic perturbations were exhibited in Fig.12, indicating that the scheme of individual sampling of beams performed best, while the control scheme of simultaneous sampling of beams based on multi-dithering method showed advantage in the case of slow-varying polarization noise, but it performed worse than others when high frequency perturbations were inevitable.ConclusionsThe convergence speed, channel scalability and sensitivity to residual phase of different active polarization-phase control schemes are investigated numerically. When the number of channels is small and the system complexity is low, the control scheme of individual sampling of beams can be adopted. When the requirement of polarization bandwidth is low, the control scheme of simultaneous sampling of beams based on SPGD algorithm is more suitable, which has the simplest structure. For large-scale CBC systems, the control scheme of simultaneous sampling of beams based on multi-dithering method has great potential, but the accuracy of polarization error signal should be improved to be robust with dynamic perturbations, which deserves further research.
Dec. 31, 2024Vol. 53 Issue 12 20240380 (2024)
Wenxiao ZHAO, Jiaqi JIANG, Chunyu LI, Bo ZHAO, Aili WANG, Haibin WU, and Zhihan ZHU
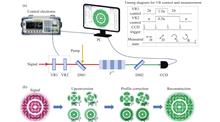
ObjectiveUpconversion infrared (IR) detection, a method leveraging nonlinear parametric upconversion, effectively upconverts the signal beam spectrum from the IR to the visible band, thus enabling the indirect detection of targets using silicon-based detectors or cameras. However, like most traditional imaging technologies, in practical applications, the scattering and reflection of light caused by fine particles can lead to issues such as gray images and information loss. This limits the application range of this technology. Polarization imaging detection can extract the polarization of the target based on the polarization difference between the target and background light. This allows for obtaining more information independent of intensity and spectrum, thus avoiding the shortcomings of traditional detection imaging technology. It also helps weaken background noise, improve detection and recognition ability, and has a wide range of applications in target detection classification, three-dimensional target reconstruction, and biomedicine. Therefore, combining upconversion with polarization detection technology is an important technical means to accelerate the development of infrared detection technology. This study proposes and experimentally validates a time-division multiplexed nonlinear Stokes tomography scheme based on an electrically controlled Variable Retarder (VR), with a focus on the structural design of a polarization-resolved upconversion detection system. The proposed system functions as a time-division Stokes upconversion tomography device, operating through a cyclic process involving "VR delay control—signal triggering—data acquisition." The electrically controlled liquid crystal VR, with millisecond-level response time, sequentially transmits the different polarization Stokes components of the signal light field into a bulk quasi-phase matchings crystal for efficient frequency upconversion. Ultimately, a visible array detector performs time-division sampling to reconstruct the polarization image. This scheme does not require a complex opto-mechanical structure, involves no mechanical components, and fully utilizes the spatial resolution of visible detectors. The study offers a practical and innovative technological pathway for research related to infrared polarization-resolved imaging techniques.MethodsA time-division multiplexed polarization-resolved upconversion detection system is implemented based on VR, combined with spatial Stokes tomography and upconversion detection technology (Fig.1(a)). The system is capable of collecting each Stokes component of the signal beam in real-time and obtaining the spatial polarization distribution of the signal beam after Gaussian profile correction (Fig.1(b)). Additionally, a set of vector beam polarization detection optical paths is constructed to verify the detection effect of this system (Fig.2).Results and DiscussionsThis study first use vectorial Ince-Gaussian (IG) modes at different ellipticities ($ \varepsilon $) as detection targets (Fig.3). In particular, as $ \varepsilon =0 $ and $ \epsilon \longrightarrow {\infty } $, the IG modes converted to Laguerre-Gaussian (LG) and Hermite-Gaussian (HG) modes of the same modal orders, respectively. The experimental results show that the IG vector modes detected using the time-division multiplexed nonlinear Stokes tomography principle exhibit an excellent match with the direct observation results obtained through an InGaAs polarization camera at the 1560 nm wavelength. Based on the Gaussian profile correction Stokes components, the spin-orbit coupling (SOC) states and spatial polarization distributions of the relevant target vector modes can be reconstructed. By comparing the Signal and the Reconstruction in the SOC states on the SOC sphere, both the spatial polarization structure and the position on the SOC spatial mode sphere align with high fidelity, with all fidelity metrics exceeding 99%. Building on this, the performance of the experimental system was further validated using more generalized polarization images carried by non-paraxial beams (Fig.4). The detection results indicate that the spatial polarization distribution of the reconstructed upconverted beam aligns well with that of the preset images.ConclusionsThis paper addresses the structural complexity of infrared polarization upconversion detection technology by proposing a novel method based on electrically controlled VR, termed "Time-Division Multiplexed Nonlinear Stokes Tomography." The proposed approach utilizes an electrically controlled VR loop to achieve millisecond-level time-response, enabling time-division upconversion and capturing the polarization components of the target beam to reconstruct the polarization image. Quantitative analysis of the detection results for vector modes demonstrates that the upconverted light field can faithfully inherit the spatial polarization distribution of the signal light field. Furthermore, by targeting generalized polarization images carried by non-paraxial Gaussian beams, the potential of this system for practical applications is explored. The study shows that this method can achieve high-precision tomographic detection of the target polarization state while simultaneously accomplishing spectral migration. The proposed method features a compact structure and strong robustness, offering a new technical route for polarization imaging and detection in the infrared or terahertz bands, with broad application prospects in fields such as astronomical observation, disease diagnosis, and environmental monitoring.
Dec. 31, 2024Vol. 53 Issue 12 20240410 (2024)
Tingyu YAN, Wenyi LUO, Hao WANG, Chunmin ZHANG, and Shiping GUO
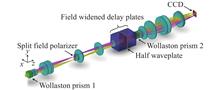
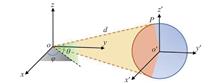
ObjectiveThe wind field in the middle and upper atmosphere is a crucial parameter in the study of atmospheric dynamics. High-resolution and high-precision detection of the wind field can provide more comprehensive data support for further understanding the local or global atmospheric wave conditions, the coupling process between different altitudes of the atmosphere, and the characteristics of atmospheric material and energy transport. The wind imaging interferometry has become an effective means for detecting the wind field in the upper atmosphere. The representative instrument of the four-zone birefringent static wind imaging interferometry technology, the Birefringent Doppler Wind Imaging Interferometer (BIDWIN), has advantages such as good stability, small size, light weight, and low calibration difficulty. This paper aims to establish the Jones matrix model of BIDWIN, simulate and analyze the variation of the phase steps in the four-zone field of view, study the variation of the usable field of view range of BIDWIN with the optical misalignment of the system, provide guidance for the instrument development, calibration, maintenance, and wind field detection experiments, and optimize the development of the four-zone birefringent static wind imaging interferometry technology scheme.MethodsBased on the system principle of BIDWIN, the Jones matrix model of the instrument was established to elaborate the principle of wind field detection. A birefringent Doppler wind imaging interferometer optical system was designed, relevant parameters were set, and the Jones matrix model was used to simulate the four-zone interferogram obtained on the detector. The BIDWIN Jones matrix model was used to simulate the rotation and tilt of the second delay plate relative to the first delay plate, as well as the rotation of the entire field widened delay plates, and analyze the variation of the phase steps across the field of view in the case of optical misalignment of the instrument.Results and DiscussionsThe simulated four-zone interferogram showed that the interferogram was divided into four zones, and each zone still retained the annular feature. The phase steps of the four zones of the interferometer will change with the field of view and do not always satisfy the four-step full-cycle equidistant sampling. Among them, there must be 0° and 180° in the four phase steps (Fig.3). If the other two phases are also close to or equal to 0° and 180°, it will cause the condition number of the measurement matrix to be extremely large, resulting in a large measurement error of the wind speed. The parameter sin(Q) changed with the field of view, and two zero-value lines appeared in the field of view, indicating the existence of a maximum wind speed error. The usable field of view of the instrument was limited between the two red strips (Fig.5). When the crystal of the delay plate had a relative rotational misalignment, the usable field of view would become narrower, and with the increase of the rotation angle, the usable field of view would correspondingly narrow (Fig.6-Fig.7); when the delay plate had a tilt misalignment, the usable field of view would remain unchanged but would shift in the overall field of view (Fig.9-Fig.10). If the area with a large wind speed measurement error in the center of the field of view was excluded, a larger available field of view can be obtained, comparing with the situation where the optical system is ideally aligned; when the entire instrument was deflected, the area with a large wind speed measurement error would be slightly curved, but the actual usable field of view would remain basically unchanged (Fig.12).ConclusionsSimulation results show that because BIDWIN uses a Wollaston prism to angle-shear the beam before the field widened delay plates, the phase steps of the upper and lower zones vary greatly in the vertical direction of the field of view, creating mathematically underdetermined and therefore unmeasurable wind speed strips at specific locations, which limit the usable field of view of the instrument. When the relative rotation misalignment of the crystal slabs occurs, the angle of rotation increases, resulting in a narrowing of the distance between the two strips, an increase in the number of strips in the field of view. If it is required to maintain more than 80% of the field of view in the ideal case, the rotation misalignment angle should be within ±0.2°. When there is a tilt misalignment in the delay plate, the usable field of view remains the same but shifts in the overall field of view. If the required field of view displacement is no more than 4 image elements, the tilt misalignment angle should be within ±0.03°. If the instrument is deflected as a whole, the strips will be slightly curved, but the actual usable field of view range will be essentially unchanged.
Dec. 31, 2024Vol. 53 Issue 12 20240397 (2024)
Wei WANG, Zhijun QI, Donghui ZHU, Wenjie CHENG, and Zengquan LIU
ObjectivesFitting spherical point clouds has a wide range of applications in the field of measurement, such as point cloud registration, instrument calibration, and laser tracker self-calibration. In the uncontaminated point cloud or the data processed by robust estimation, existing geometric and algebraic fitting methods use the identity matrix as the cofactor matrix, which ignores the correlation of point cloud coordinates. In order to consider the rigorous statistical models of the point cloud, the nonlinear Gauss-Helmert model (GHM) needs to be established for the iterative solution. The method based on GHM is verified to be more accurate than the existing methods, including geometric fitting and algebraic fitting. However, when estimating a large number of spherical point clouds, this method generates a serious computational burden.MethodsThe spherical fitting method based on GHM requires large matrix inversion operations, which is the main reason for reducing the efficiency of the algorithm. Because the complexity of matrix inversion is the cube of its dimension. For example, when the number of observations doubles, the time consumed by matrix inversion will be 8 times the original operation. In order to reduce the dimension of the matrix, all point cloud coordinates are grouped in many subsets. Only the three coordinate components of the same point are correlated, so the point clouds of different groups are independent of each other. When the existing parameter estimators are fused with the unprocessed point cloud data, the center and radius parameters are updated sequentially. In the proposed method, the matrix dimension is significantly smaller than the existing spherical fitting method based on GHM, which will help reduce the running time of the algorithm.Results and DiscussionsIn the simulation experiment, we used five methods to fit 1000 spherical points with different coverages (Fig.2), including geometric fitting, algebraic fitting, linear least squares, the method based on GHM, and the proposed method. All the observations are divided into 20 subsets randomly in the proposed method. The results of 1000 Monte Carlo experiments show that high coverage will increase the accuracy and computational efficiency of the five schemes. The results of the algorithm based on the GH model and the proposed algorithm are consistent in the root mean square errors (RMSE) of the sphere center and radius, and both of them are better than the existing benchmarking methods. Therefore, it is necessary to consider the statistical models of the point cloud in spherical fitting. When the coverage is 50%, the average running time of the proposed method is only 0.021s, which is less than 1.633 s of the method based on the GH model (Tab.1). Our algorithm has significant superiority in efficiency compared with the method based on GHM in the different coverages. When the number of point clouds increases from 1 000 to 5 000, the running time of the proposed algorithm is much lower than that of the method based on GHM (Fig.3). Further experiment by the point cloud data of 5 target balls in the Tongji University model (Fig.4) shows that the time the proposed method consumes is only 0.98%-1.74% of the method based on the GH model (Tab.2). Different grouping strategies covering from 10 to 100 were tested for the second spherical point cloud. As the number of groups increases, the running time first decreases and then increases (Fig.5). Although more grouping can reduce the matrix dimension in the computation, it will increase the number of recursions. In general, the grouping strategy can still significantly improve the efficiency of the original algorithm by more than an order of magnitude.ConclusionsThe efficiency of the algorithm is as important as its numerical performance. We derive a sequential solution based on the spherical fitting of the GH model, which reduced the matrix dimension and greatly increase the computation efficiency. The next step is to obtain a more rigorous statistical model by variance component estimation and fitting more geometric shapes.
Dec. 31, 2024Vol. 53 Issue 12 20240340 (2024)
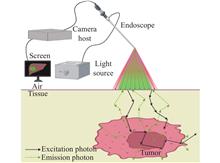
Mingjie QIU, Xiangxiang MENG, and Han SHANG
ObjectiveFor fluorescence endoscopic imaging system, the depth of tumor detection determined by the signal-to-noise ratio of the fluorescence image is the core index of its detection ability, which directly affects the effect of tumor resection. During the design process of rigid endoscopic systems, under the condition of working distance determination, the signal-to-noise ratio is determined by the entrance pupil diameter, excitation light irradiance, fluorescent probe concentration, integration time, noise and so on together. Traditional design methods do not consider either the propagation process of illumination light in biological tissues nor the response of the detector, so that the optical design and biological tissues are isolated from each other. The overall performance of endoscope system cannot be optimized theoretically. The overall design index lacks the theoretical guidance of the signal-to-noise ratio model. At present, most of the tumor depth is estimated by CT, ultrasound and other diagnostic means, and there is a lack of assessment methods using fluorescence endoscopy. So, it’s necessary to apply auxiliary diagnosis by other methods while using fluorescence endoscopy, which does not meet the practical application requirements. Therefore, it is necessary to establish an whole-link signal-to-noise model, which not only provides theoretical guidance and basis for the design of fluorescent rigid endoscopes, but also aids in intraoperative tumor localization by combining the advantages of fluorescent endoscopes in terms of high image contrast, fast imaging speed, low adverse reaction and non-contact measurement.MethodsFirstly, starting from the illumination of the end face of the optical fiber, photometric theory is used to calculate the luminescence intensity and the surface irradiance of biological tissues at the working distance of the endoscope. And then the propagation of photons in the tissue body is simulated through the Monte Carlo method, some of the fluorescence generated by it will be transmitted outside the tissues at the same time. The internal distribution of light in biological tissues and its external radiation intensity are calculated based on theory, which can help to obtain the irradiance at the pupil entrance of the fluorescent endoscope. Secondly, the fluorescence is gain-focused on a CMOS detector image through the fluorescent endoscope optics. The noise of the background, detector, and readout circuit is taken into account subsequently. So, the relationship between the signal-to-noise ratio of fluorescence endoscopic imaging and the depth of tumor detection is finally derived (Fig.2).Results and DiscussionsWhen a Gaussian beam with a total power of 2 W, divergence half angle of 45°, and wavelength of 808 nm is incident vertically (Tab.1) and transmitted to a depth of greater than 46 mm from the light source, the irradiance of the excited fluorescence reaching the surface of tissue is much less than 10-30 W/m2, which can hardly be received by the detector (Fig.6). When the tumor radius increases from 0.5 mm to 5 mm,the maximum depth of the tumor that fluorescence can reach the surface of tissue increases from 36 mm to 44 mm from the light source (Tab.4). Moreover, when the tumor center is 35 mm from the light source, the fluorescence center irradiance on tissue surface of the tumor with a radius of 5 mm and that of the tumor with a radius of 2.5 mm increases by a factor of 63. The mean irradiance values of fluorescence excited at a depth of 6 mm within the tissue body and at the surface of the tissue body for tumors of radius 2 mm, 3 mm, 4 mm, and 5 mm centered at z=35 mm from the light source are roughly 100-fold, 50-fold, 10-fold, and 5-fold different, respectively, for tumors of the same radius (Fig.7). The fluorescence center irradiance of a tumor with a radius of 5 mm and a center distance of 35 mm from the light source on the surface of the tissue is 35.28 W/m2. And the signal-to-noise ratio of the whole-link system is 34.64 dB under the circumstances, which is of good imaging quality (Fig.8). As the radius of the tumor decreases and the center of the tumor deepens, the number and energy of fluorescent photon packets reaching the surface of the tissue are reduced, which results in non-statistical simulation results, so that the signal-to-noise ratio of the whole-link system fluctuates and attenuates. In addition, when the radius of the tumor is less than 2 mm, it is beyond the endoscopic detection ability to measure small volume tumors in deeper locations.ConclusionsThe process of establishing the whole-link signal-to-noise ratio model of the fluorescence endoscope system and using it to simulate the depth of tumor detection is proposed. Not only a two-layer tissue-tumor model is established, but also the interaction of photons with the tissue body and the process of fluorescent molecular probes being excited to fluorescence are taken into account. According to the above, the in vivo light distribution law of the biological tissues is obtained and the relationship between the fluorescence endoscopic whole-link signal-to-noise ratio and the depth of tumor detection has been analyzed. This fluorescence endoscopic tumor detection depth analysis method provides theoretical guidance to reduce the detection error. Therefore, it can improve the detection depth and sensitivity of small tumors and metastatic lesion, providing a guarantee for accurate tumor resection.
Dec. 31, 2024Vol. 53 Issue 12 20240356 (2024)
Yanzhen ZHU, Zhiwei LI, Liqin LIU, Yuqing GUAN, Yujie ZHANG, Chuangwei GUO, Qiang LI, Yi LIU, Jinhui CAI, Jun WAN, and Lihua LEI
ObjectiveThe measurement of grating pitch is a key technological requirement for achieving high-precision positioning in nanometer-level measurement techniques. It finds wide applications in fields such as micro-nano fabrication, precision manufacturing, and microelectronics, which are based on nanotechnology research. To enhance the precision of grating pitch measurements, calibration can be achieved through two methods involving digital processing of interference signals. The phase information of grating interference signals can be characterized through digital methods in both time and frequency domains. Traditional phase unwrapping methods in time-frequency domains typically involve global analysis of signals, which are more suitable for small discrete points and stable signals. However, they are susceptible to noise when handling non-stationary and nonlinear signals, leading to phase loss issues and insufficient phase information. Addressing the limitations of traditional algorithms, it is crucial to research optimized algorithms that effectively improve signal robustness and measurement stability while reducing the impact of nonlinear factors on phase accuracy. Therefore, this paper proposes an advanced method for high-precision digital calibration of dual grating pitch using Improved Complete Ensemble Empirical Mode Decomposition with Adaptive Noise combined with Hilbert Transform (ICEEMDAN-HT).MethodsThis paper proposes an advanced digital calibration method for high-precision dual grating pitch using ICEEMDAN-HT. The theoretical analysis begins with the calibration principles of the dual grating homodyne interferometer and discusses the interference signal nonlinearity (Fig.1). It further elaborates on the principles and methods of digital calibration based on ICEEMDAN-HT (Fig.2). Simulation is conducted to decompose and reconstruct signals, comparing them with other algorithms to validate the completeness and stability of the ICEEMDAN method (Tab.1). Two sets of interference signals are collected from the dual grating homodyne interferometer calibration system (Fig.7). The ICEEMDAN-HT method is employed for signal reconstruction and phase extraction (Fig.8). Atomic force microscope scanning results are calibrated using a self-traceable grating serve as the standard measure (Fig.9). Comparison of calibration results between this method and others assesses the effectiveness and completeness of ICEEMDAN-HT digital calibration method (Tab.3).Results and DiscussionsSimulation results indicate that the RMSE of the ICEEMDAN method is the lowest among the three methods at 0.029, with SNR and CC also the highest at 15.012 and 99.87%, respectively (Fig.6). In all three aspects, ICEEMDAN outperforms CEEMD and EMD, with a correlation coefficient close to 99.9%, indicating nearly complete restoration of the original noise-free signal with minimal information loss (Tab.1). This demonstrates that ICEEMDAN is the most effective in handling noisy nonlinear signals, showcasing superior completeness and stability in signal reconstruction. Validation through dual grating homodyne interferometer calibration experiments shows that ICEEMDAN-HT method achieves a relative error as low as 0.40%, surpassing other signal decomposition methods in calibration accuracy (Fig.8). These results illustrate that ICEEMDAN-HT digital calibration method effectively enhances signal robustness and measurement stability, mitigating the impact of nonlinear factors on phase accuracy. This research holds significant practical implications for real-time signal measurement and instantaneous processing efficiency.ConclusionsThis paper addresses the nonlinear influences in dual grating distance measurement and proposes a digital calibration method based on ICEEMDAN-HT built upon existing EMD algorithms. Validation is conducted through dual grating homodyne interferometer calibration experiments, comparing the ICEEMDAN-HT method with several existing signal decomposition and reconstruction methods. The relative error of calibration with ICEEMDAN-HT can be reduced to as low as 0.40%, demonstrating higher calibration accuracy compared to other signal decomposition methods. The results indicate that the ICEEMDAN-HT digital calibration method effectively enhances signal robustness and measurement stability against nonlinear factors affecting phase accuracy. This research holds significant practical implications for real-time signal measurement and instantaneous processing efficiency.
Dec. 31, 2024Vol. 53 Issue 12 20240367 (2024)

Jinsheng FU, Qi LI, Yan WANG, Yuan ZHANG, Bo XU, and Yimin SONG
ObjectiveCamera calibration is a key step to realize high precision three-dimensional(3D) visual measurement. In order to solve the problem of severe lens distortion effect and ensure the accuracy of camera calibration, lots of calibration research using different calibration objects is carried out. When using a one-dimensional reference ruler, due to the limited feature information of the ruler and insufficient dimensional information, a large number of calibration images need to be collected, resulting in low overall calibration efficiency. When using a 2D calibration board, although it can provide sufficient feature information, manufacturing large-sized calibration boards is not only costly, but also technically difficult in some cases. When using a 3D calibration object, the layout of measurement field of view is relatively complicated, and different measurement field of view require 3D calibration objects made with different scales and specifications, resulting in low calibration flexibility and poor applicability. To solve these problems, a large field of view camera calibration method based on self-made concentric circle array calibration board is proposed.MethodsIn this method, a calibration board matching the measured field of view is made by using the concentric circle array pattern printed by laser to accurately extract the image coordinates of the concentric circle center. Then, based on the distribution characteristics of lens distortion on the imaging plane, the strategy of sub-region acquisition of calibration images is adopted to reduce the influence of large distortion imaging region on the estimation accuracy of camera internal parameters. At the same time, considering the size error between concentric circles and flatness error on the calibration board, an initial value algorithm for estimating internal parameters of camera, external parameters of camera and 3D coordinates of the calibration board is proposed. Finally, the system parameters are optimized by minimizing the back projection error of the image coordinates of the center of the circle as the objective function to improve the calibration accuracy of the camera.Results and DiscussionsIn order to prove the superiority of the proposed method, the back-projection errors calculated by the proposed method and ZHANG’s method were compared. Experimental results show that the root mean square error obtained by ZHANG’s method were 0.764 pixel and 0.806 pixel in the X and Y directions, respectively, while those obtained by the proposed method were 0.177 pixel and 0.201 pixel, which were reduced by 76.8% and 75.1%, respectively. In order to prove the validity of the proposed method, the measurement accuracy of the system calibrated by the proposed method was tested in the measuring field of 2.2 m × 2 m. It can be seen that the minimum measurement error of the system was 0.151 mm, and the average error was 0.478 mm. The minimum relative error was 0.016% and the mean relative error was 0.052%.ConclusionsAiming at the technical requirements of camera calibration with large field of view, high precision and high applicability, a large field of view camera calibration method based on self-made concentric circle calibration board is proposed. This method uses the concentric circle array pattern printed by laser to make a calibration board for camera calibration, and proposes a high-precision calculation method of concentric circle center coordinates, which is used as the basis for model parameter estimation. Considering the distribution characteristics of lens distortion, the strategy of regional acquisition of calibration images is adopted, and considering the dimensional errors between concentric circles and the flatness errors of the calibration board, an initial value algorithm for estimating internal and external parameters of camera and 3D coordinates of the calibration board is proposed. In addition, the whole system parameters are optimized to achieve high precision camera calibration. Experimental results show that compared with ZHANG’s method, the root mean square error obtained by the proposed method is reduced by 76.8% and 75.1% in X and Y direction, respectively. The minimum relative error of the system is 0.016%, and the mean relative error is 0.052%, which proves the correctness and superiority of the proposed method.
Dec. 31, 2024Vol. 53 Issue 12 20240386 (2024)
Hao YANG, Chunlian ZHAN, Guangwei SUN, Zhouhong ZHU, Jiapeng WANG, Jidong DU, Guoao ZHOU, and Kui JIANG
ObjectiveAt present, vacuum ultraviolet space detection technology is widely used in a number of scientific and technological projects in China, such as extreme ultraviolet lithography machine, Fengyun satellite, Mars exploration plan, Kuafu plan, etc. The national demand for calibration technology for related vacuum ultraviolet detection systems is also becoming more and more urgent. As one of the six international key comparisons in the field of optical metrology, spectral responsivity reflects the response ability of detectors to different wavelengths of light, and the research on vacuum ultraviolet spectral responsivity calibration technology plays a vital role in the development of vacuum ultraviolet detection technology. The domestic spectral responsivity calibration technology cannot fully cover the 10-200 nm band. Therefore, in this paper, we will carry out the research on the vacuum ultraviolet spectral responsivity calibration device based on synchrotron radiation source to realize the spectral responsivity calibration of the vacuum ultraviolet 10-200 nm band, and control the spectral responsivity calibration uncertainty within 10%.Methods A vacuum ultraviolet spectral responsivity calibration device based on synchrotron radiation was constructed. The light source is a synchrotron radiation source located in the National Synchrotron Radiation Laboratory in Hefei, and the detector uses a silicon photodiode with a model of AXUV100G, and the calibration process uses the comparison method to calibrate the calibration of the calibrated detector. The wavelength is calibrated using a gas ionization chamber prior to calibration, and the Gaussian harmonics are filtered using a gas filter cell during calibration.Results and DiscussionsThe uncertainty of the synchrotron radiation-based spectral responsivity calibration device was analyzed and verified. The uncertainty component introduced by the measurement repeatability, the uncertainty component introduced by the vacuum ultraviolet beamline instability of the synchrotron radiation source, the uncertainty component introduced by the standard detector, and the uncertainty component introduced by the data acquisition equipment were introduced respectively, and the relative extended uncertainty of the calibration device was calculated to meet the requirements of 10-35 nm: U=2.0% (k=2), 35-130 nm: U=10% (k=2), 130-200 nm:U=3.0%(k=2).ConclusionsA set of vacuum ultraviolet spectral responsivity calibration device based on synchrotron radiation source was established, and the calibration wavelength range covered 10-200 nm, which effectively made up for the gap of relevant calibration bands in China. The gas ionization chamber is used to self-calibrate its own wavelength before calibration, and the Gaussian harmonics are suppressed using a gas filter cell during the test. It has a wide range of application and promotion value in the field of space exploration. In the future, it is planned to use the self-developed cryogenic radiometer to realize the traceability of relevant bands, laying the foundation for getting rid of foreign monopoly.
Dec. 31, 2024Vol. 53 Issue 12 20240426 (2024)
Ruiping ZHANG, Qin WANG, and Lixia BAO
Significance Due to its advantages of low energy, high transmission, fingerprint spectroscopy, and safety, terahertz spectroscopy technology can be used to detect and identify single substances, mixtures, and hidden explosives. It is a promising detection technology in the field of security and has broad application prospects. However, owing to various factors inlcuding instruments, environment, and samples, the signal-to-noise ratio of terahertz spectral data decreases, making it difficult to obtain effective spectral characteristic peaks, which seriously affects the effectiveness and accuracy of peak finding comparison methods for identifying explosives. In order to improve the accuracy of terahertz spectral data, the application of machine learning technology in terahertz spectral analysis technology for detecting explosives was explored. It was pointed out that machine learning can further improve the accuracy of terahertz spectral technology detection, and develop more refined data processing techniques and more effective data augmentation techniques. Combining machine learning with traditional spectral analysis techniques is an important development direction in the field of terahertz spectral technology for detecting explosives.Progress Firstly, spectral technology is a commonly used method for substance detection. Based on the different absorption, reflection, and scattering of electromagnetic waves by explosives in different frequency bands, the main detection methods include Raman spectroscopy, terahertz technology, millimeter wave technology, X-ray technology, etc. Among these detection methods, terahertz technology is widely used in explosive detection due to its non invasiveness, high resolution of biological tissues, strong penetration, specific fingerprint spectra, and safety advantages. Next, the principle of terahertz spectroscopy technology and its research in explosive detection are introduced in detail. This article summarizes the research on terahertz spectroscopy technology in detecting single substances and their mixed explosives, detecting hidden explosives, and analyzing the characteristic absorption peaks of explosives. It is of great significance for establishing an explosive spectrum database and also promotes the application of terahertz spectroscopy technology in the field of security inspection. However, due to the influence of factors such as samples, environment, and detection instruments on the detection results, the ability and reliability of using characteristic peak comparison method to identify substances are greatly weakened. Machine learning technology has the characteristics of adaptability, efficiency, and accuracy, which can solve these problems to a certain extent. This emphasizes the important application of machine learning in terahertz spectroscopy technology.Conclusions and Prospects Terahertz spectroscopy technology has great application prospects in the field of explosive detection, and plays an important technical support role in explosive risk monitoring and prevention. However, during the detection process, factors such as instruments, environment, and sample status can affect the accuracy of identifying characteristic terahertz spectral peaks. With the continuous optimization of machine learning algorithms and the gradual expansion of datasets, machine learning will become an important means of detecting explosives in future terahertz spectroscopy technology. The future application of machine learning in terahertz spectral analysis has the following trends: Firstly, it is necessary to develop more sophisticated data processing techniques and more effective data augmentation techniques to solve the problem of large amounts of data; Secondly, machine learning needs to be combined with traditional spectral analysis to meet the requirements of fine interpretation, such as anomaly detection.
Dec. 31, 2024Vol. 53 Issue 12 20240293 (2024)
Yujin WANG, Jinhui WU, Ji LIU, Boyang ZHANG, Tao YUAN, Yuan PENG, and Shaodong LI
ObjectiveHigh-speed imaging is critical for testing moving objects. However, traditional imaging methods based on charge-coupled devices or complementary metal-oxide-semiconductor devices have limitations in imaging speed and photon sensitivity. High-speed cameras face challenges such as high equipment costs, imaging difficulties in complex environments with large fields of view, and the need to balance temporal and spatial resolution. This paper proposes a Frame Interpolation High-Speed Imaging Method (FIHSIM) based on wide-field general-purpose cameras to address the abovementioned constraints. This method serves as a complementary solution to meet the needs of high-speed imaging.MethodsA virtual frame interpolation super-resolution algorithm for general camera image acquisition was proposed for FIHSIM (Fig.1). This method first preprocesses the blurred images captured by conventional general-purpose cameras to eliminate complex backgrounds. Subsequently, normalization, inverse normalization, threshold processing, and deconvolution operations are applied to map the grayscale values from the blurred images to the time domain, separating grayscale values and time information to extract precise temporal information. Finally, with the exposure time and subsampling time as input parameters, they are fed into the frame interpolation reconstruction algorithm to reconstruct the transient scene changes of dynamic targets during exposure.Results and DiscussionsTo validate the feasibility of the method, a comparative experiment was conducted between FIHSIM and a high-speed camera. Detailed measurements and analysis of the object's displacement and associated errors in the images indicate minimal discrepancies (Tab.1). The experimental results demonstrate that the method can accurately reconstruct the position of the object's motion front (Fig.4). In the experiment, we utilized a standard CMOS camera with a frame rate of 100 Hz and achieved an imaging speed of 12800 Hz using FIHSIM, representing a 128-fold increase. Two key camera factors constraining the ability to increase frame rates are exposure time and bit depth. The frame interpolation high-speed imaging method proposed maintains a high frame rate during continuous recording, enabling virtual frames to span multiple exposure periods. This method is suitable for scenarios requiring continuous recording of dynamic events. However, specific techniques can increase frame rates in application scenarios where continuous recording is unnecessary. The enhancement factor β, representing the multiplier for increasing the virtual frame rate, is defined by the characteristics of the camera sensor. However, in theory, it can be improved by reducing the exposure time τ to raise the maximum frame rate FMAX, thereby enhancing the camera's ability to freeze motion.ConclusionsFIHSIM can accurately recover the precise positions of objects at different time points during exposure from the motion-blurred areas in the images, thereby significantly enhancing the temporal resolution of the images. This technology effectively overcomes the limitations of traditional CMOS cameras in high-speed imaging. Furthermore, by precisely measuring the displacement of dynamic target objects, we experimentally validated the outstanding performance of FIHSIM in high-speed imaging. This method utilizes widely available portable general-purpose cameras as imaging and detection platforms, simplifying the implementation of the imaging process. Additionally, FIHSIM exhibits excellent scalability, allowing for selecting cameras with different fields of view and spatial resolutions and pulse light sources with varying pulse widths based on experimental requirements to capture vast fields of view and objects moving at different speeds.
Dec. 31, 2024Vol. 53 Issue 12 20240370 (2024)
Shuyang HUANG, Hanbin JIA, Wei SUN, and Xiangsheng XIE
ObjectiveScattering is one of the major obstacles to optical imaging. However, scattering media in daily life sometimes play the role of privacy protection, such as PDLC, a widely used and electrically switchable novel scattering media. However, studies on PDLC (Polymer Dispersed Liquid Crystal) have mainly focused on materials, structures, and preparation methods. The optical scattering properties of PDLC, especially on the destruction of object-field information corresponding to the protection of privacy, have not been reported in detail. So that, this study investigated the scattering properties of a typical PDLC and analyzed the performance differences between PDLC and other commonly used diffusers, finding that optical homogenization cannot be the only indicator of PDLC design and preparation.MethodsThis paper investigated the optical properties of a typical PDLC, including scattering characteristics, transparency, stability and electronically controlled characteristics, and analyzed the performance differences between PDLC and commercial diffusers. Then, we explored and analyzed the image recovery effect of two methods: one is direct imaging using ballistic light through lens, and the other is image recovery using scattered light by deconvolution (Wiener filtering).Results and DiscussionsThe results show that PDLC has a large scattering angle and optical memory effect range, so that its scattering distribution maintains correlation during angle change (Fig.1), and its scattering pattern does not change significantly at different voltages (Fig.2), showing a high proportion of ballistic light and a stable structure. However, compared with diffusers, PDLC is poor at reducing the zero-frequency light and enhancing the scattering effect. The ballistic light information can still be collected by the lens and used for imaging (Fig.4). Nevertheless, PDLC is able to achieve object hiding effects close to those of 10° diffusion angle diffusers without the assistance of an optical device (Fig.3), providing some privacy protection. What’s more, we explored two image recovery methods. One is to use the ballistic light through the lens for direct imaging, which found that the scattering effect of PDLC is mainly manifested in the homogenization of the broad-spectrum background light resulting in the decrease of the target imaging contrast. And target information can be effectively obtained by optical filtering processing and direct imaging can be realized (Fig.5). The other is the use of scattered light by deconvolution (Wiener filtering) to achieve a certain degree of image recovery (Fig.8). Compared to the diffusers, the presence of the ballistic photon component in the PDLC reduces the scattered light component but leaves a certain light intensity background in the scattering pattern, resulting in a lower contrast and poorer uniformity of the scattered image.ConclusionsThe results show that large scattering angle and optical memory effect range expose the disadvantage of PDLC, a high percentage of ballistic light. Nevertheless, PDLC, has some privacy protection function, whose ability of hiding object close to 10° diffusion angle diffusers without the assistance of optical devices. However, PDLC is still worse than diffusers in terms of reducing ballistic light and enhancing scattering effect. Then, we explored and analyzed two image recovery methods for the scattering characteristics of PDLC. One is to use the ballistic light through the lens for direct imaging, which found that the scattering effect of PDLC is mainly manifested in the homogenization of the broad-spectrum background light resulting in the decrease of the target imaging contrast. And the other is the use of scattered light by deconvolution (Wiener filtering) to achieve a certain degree of image recovery. The experimental results demonstrate that current PDLC still have risks in privacy protection if it only relies on the optical homogenization effect to assess performance. Therefore, the design and preparation of PDLC must provide more comprehensive scattering optical characteristic indexes as a test standard.
Dec. 31, 2024Vol. 53 Issue 12 20240371 (2024)
Benchao LV, Xiaoniu LI, Junfeng WU, Lingfeng TANG, Feng YANG, Hongsheng SUN, Youyu GAN, Shufen LI, and Ming LI
ObjectiveInfrared detection, characterized by its robust anti-interference capability and all-weather operability, finds extensive application in infrared optical systems, particularly in military domains such as tracking, reconnaissance, and surveillance. Advancing technology has escalated the requirements for infrared optical systems, necessitating the implementation of variable F-numbers for enhanced performance through F-number matching. Ultrasonic motors, offering distinct advantages such as compact size, simple structure, and absence of electromagnetic interference, present a compelling alternative to electromagnetically driven variable apertures. Despite the introduction of several ultrasonic motor-driven variable apertures, research emphasis has primarily been on structural design and performance evaluation, underscoring the critical need for control methodology studies. The inherent challenges of limited assembly space, non-linear friction dynamics among aperture blades, non-linear relationships between rotation angle and aperture size, and the output non-linearity of ultrasonic motors, introduce complexities in the control of ultrasonic motor-driven variable apertures. Thus, the investigation of effective control methods for ultrasonic motor-driven variable apertures is imperative to meet the requirements of miniaturization and precise aperture control.MethodThis study proposes an innovative open-loop control approach for ultrasonic motor-driven variable apertures, grounded in a grey box model. A traveling wave type ultrasonic motor-driven variable aperture was conceptualized and developed, featuring an adjustable aperture diameter spanning from 4 mm to 60 mm. A dynamic control model for the ultrasonic motor-driven variable aperture was formulated (Eq.11). Leveraging image recognition technology, aperture change data was meticulously collected, and the parameters were identified through the grey box model (Tab.1). To substantiate the efficacy of the open-loop control method based on the grey box model, a series of experimental validations were carried out (Fig.11-Fig.12).ResultsThe grey box identification model exhibited a fitting degree of 97.06% during the aperture opening phase, with error margins confined within ±0.15° (Fig.7). When the aperture was in the closing phase, the model showed a fitting degree of 92.49%, with errors tightly bounded within ±0.1° (Fig.8). These metrics underscore the model's effectiveness in accurately representing the system's dynamic characteristics. When subjected to aperture changes from 10-20 mm, experimental validation revealed a maximum error of -0.11965° and a minimum error of -0.02304°, confined within ±0.12° (Fig.11). During aperture transitions from 20-10 mm, the maximum error was recorded at 0.12707°, with the minimum at -0.02183°, all within ±0.13° (Fig.12). The average absolute error was measured at 0.077° during aperture opening and 0.079° during closing, corroborating the feasibility and precision of the ultrasonic motor-driven variable aperture control method.ConclusionAn open-loop control strategy for ultrasonic motor-driven variable apertures, underpinned by a grey box model, has been successfully proposed. The method adeptly tackles the multifaceted challenges posed by limited assembly space, the non-linear dynamics of aperture blade friction, and the output non-linearity of ultrasonic motors. A grey box control model was established, and aperture change data was meticulously collected using image recognition techniques. The grey box model's parameter identification capability was validated, achieving a fitting degree of 97.06% during the aperture opening phase and 92.49% during the closing phase. Experimental results demonstrated negligible error values during aperture changes, attesting to the control method's efficacy in achieving precise control of ultrasonic motor-driven variable apertures without the reliance on additional sensors. This approach not only simplifies system architecture but also enhances response speed, making it a compelling solution for advanced infrared optical systems.
Dec. 31, 2024Vol. 53 Issue 12 20240266 (2024)
Jiatong ZHENG, De SONG, Feng SHI, Bei JIANG, Tong ZHANG, and Weijun CHEN
ObjectiveElectron bombardment complementary metal-oxide semiconductors (EBCMOS) is an advanced imaging technology that combines electron beam bombardment and CMOS technology. In order to improve the image quality of EBCMOS and obtain high resolution low-light level imaging devices, the factors affecting the spatial resolution of EBCMOS doped with electron multiplier layer were studied. MethodsBased on carrier transport and recombination theory combined with Monte Carlo method, the theoretical calculation model of the spatial resolution in the electron multiplication layer in EBCMOS is established. The effects of substrate thickness, substrate doping concentration and incident electron energy on the resolution of EBCMOS were simulated and analyzed. Results and DiscussionsThe influence of different thickness of substrate on resolution under homogeneous substrate doping was studied. The base thickness was selected from 10-25 μm. Figure 3 shows the PSF image of multiplying electrons at different base thicknesses. Figure 4(a) shows the corresponding LSF curves under different base thicknesses. Figure 4(b) shows the corresponding MTF curves under different base thicknesses. When the MTF value is the same, the larger the thickness of the substrate, the smaller the corresponding spatial frequency, and the smaller the limit resolution, that is, increasing the thickness of the substrate will lead to the decrease of the device resolution. In the subsequent simulation, the thickness of P-type substrate is selected to be 10 μm, and the limiting resolution of the device can reach 31 lp/mm. The influence of different substrate doping concentrations on the resolution of uniform substrate doping was studied. The doping concentration of the substrate was selected as 1014-1017 cm-3. Figure 5 shows the PSF images of multiplying electrons at different substrate doping concentrations. Figure 6(a) shows the corresponding LSF curves under different substrate doping concentrations. Figure 6(b) shows the MTF curves corresponding to different substrate doping concentrations. With the same MTF value, the larger the substrate doping concentration, the smaller the corresponding spatial frequency and the smaller the limiting resolution, that is, increasing the substrate doping concentration will lead to lower device resolution. The doping concentration of P-type substrate is 1014 cm-3, and the limiting resolution of the device can reach 37 lp/mm. The effect of incident electron energy on resolution under uniform substrate doping is studied. The energy of incident electron was selected from 1 to 2. 5 keV. Figure 7 shows the PSF images of multiplying electrons at different substrate doping concentrations. Figure 8(a) shows the corresponding LSF curve under different incident electron energies. Figure 8(b) shows the MTF curves corresponding to different incident electron energies. When the incident electron energy changes, the MTF curves under different incident electron energies almost coincide, that is, the incident electron energy has little influence on the resolution, and the corresponding limit resolution is also little different. Due to the randomness of the doubling electrons, the influence of the incident electron energy on the resolution can be ignored.ConclusionsThe results show that thinning the substrate and reducing the doping concentration of the substrate can reduce the diffusion radius of the multiplier electrons, and then obtain high resolution devices. Changing the energy of the incident electron has little effect on the focus and resolution of the doubling electron. When the substrate thickness is 10 μm, the substrate doping concentration is 1014 cm-3, and the incident electron energy is 1 keV, the limit resolution can reach 37 lp/mm. The work in this paper will provide theoretical basis for optimizing the electron multiplier layer structure and improving the resolution of EBCMOS.
Dec. 31, 2024Vol. 53 Issue 12 20240333 (2024)
Bingrui ZHANG, Zhiwang YANG, Chenzhong ZHANG, and Weihua ZHAO
ObjectiveZoom lens is widely used, it can achieve both wide field of view to observe and narrow field of view to get high resolution image. Alvarez lens (AL) is used in zoom lens to achieve continuous change of focal length in a large range through small lateral movements. However, AL has asymmetric aberrations and the aberrations are difficult to be compensated by other lenses. Firstly, in order to correct on-axial aberrations, the relationship between aberrations in AL and the coefficients of free-form surfaces is analyzed by using wave aberration theory, the factors that affect the decentration of the symmetry center of aberration field is also analyzed. Secondly, a five-group zoom lens is proposed based on the aberration characteristics in AL and the principle of minimizing lateral movement. Finally, using the above theory, a medium-wave infrared continuous zoom lens is designed. The zoom lens has good imaging quality and small lateral movements, verifying the correctness of the above theory.MethodsFringe Zernike polynomial wave aberration is used in present study to analysis the aberration in AL. Firstly, the relationship between the wave aberrations of each order on-axis and the lateral movement, spacing, and aperture of AL are analyzed. According to thin-element approximation of AL, its surface needs to extend to higher-order polynomials, and the relationship between the coefficients of free-form surfaces and the Fringe Zernike wave aberration coefficient is given. Secondly, the relationship between off-axis aberrations, lateral movement, spacing, and aperture of AL are analyzed, and their effects on the decentration of aberrations field center are given. Finally, according to the aberration of AL and the principle of minimizing movement, a five-component zoom lens is proposed. The zoom equation is given with Gaussian Brackets, and a design example is provided.Results and DiscussionsThrough theoretical calculations and simulations, it is found that aperture, lateral movement, and spacing are the main factors affecting the aberration of AL. When the focal length is fixed, the aberration of AL on-axis and the decentration of the AL aberration field center is smaller with smaller aperture, larger lateral movement, and smaller spacing. The decentration of the AL aberration field center is related to the asymmetric air gap of the AL. The larger lateral movement is, the smaller the polynomial coefficient is, and the less asymmetric it is. At the same time, reducing the spacing can also minimize the impact of asymmetry. Most importantly, the asymmetric aberration of AL on-axis such as primary and secondary coma, trefoil and tetrafoil can’t be corrected by other lenses. These aberrations will be directly added to the optical system, so they must be corrected by AL itself. With the lager aperture and smaller lateral movement, the value and order of aberration will be larger and higher, so it is necessary to extend the free-form to higher order xy polynomials. In most cases, the aberrations on-axis can be corrected effectively by increasing the order of polynomial to seventh order. At this point, the center of coma moves to the central field of view, meanwhile, astigmatism and field curvature decreases slightly, with no significant change in the symmetry center. The designed five-element zoom lens places two pairs of AL in the middle of three groups, with the front-fixed group and the middle-fixed group reducing the AL aperture in order to reduce the aberrations of AL. A continuous zoom lens with a focal length of 100 mm to 600 mm and a maximum lateral movement of 8.6 mm for AL has been designed, the max aperture of zoom lens is 150 mm, F number is 4, and the optical length is 349 mm.ConclusionsThrough theoretical calculations and simulation analysis, the relationship between the on-axis aberration of AL and the xy polynomial coefficients of the AL is given. It is found that the aperture, lateral movement, and spacing are the main factors affecting the decentration of the AL aberration field center. Expanding the AL surface to a high-order xy polynomial to correct the aberration in the central field of view, the coma center moves to the center of the field, and there is no significant change in the symmetry centers of astigmatism and field curvature. Based on the characteristics of the aberration field center of AL and the principle of minimizing lateral movement, a five-component zoom lens is proposed, and the zoom equation is derived using the Gaussian bracket. A design example is given, with compact size and good imaging quality. The maximum lateral movement is 8.6 mm, allowing for a continuous zoom range from 100 mm to 600 mm, the small lateral movements are enabling fast zoom.
Dec. 31, 2024Vol. 53 Issue 12 20240364 (2024)
Jun SU, Hao WANG, Yuan CHEN, and Jinsong WANG
ObjectiveInfrared imagery is highly valued for its wide range of applications in defense, scientific research, production, medicine and health, security and other fields. Infrared technology is able to work effectively in environments where visible light is impenetrable or illuminated insufficiently, which makes it excellent for night vision, temperature monitoring, target identification, medical diagnosis, etc. However, in the process of acquiring infrared images, infrared detectors are inevitably affected by a variety of interference noise, which not only reduces the image quality, but also affects the effectiveness of the subsequent image processing process. The cold reflection phenomenon in infrared imaging systems, the narcissus effect, is a kind of interference noise generated by the detector itself emitted by the infrared radiation reflected back to the detector. This phenomenon often leads to artifacts and blurring in the image, which seriously affects the visibility of the image, and thus the subsequent processing applications such as target detection, identification and tracking. This not only degrades the image quality, but also restricts the miniaturization and lightweighting of the system, especially in modern precision systems, and solving the cold reflection problem becomes the key to achieving high-performance infrared imaging systems.MethodsIn order to solve the problems caused by cold reflection, this study aims to develop an effective image restoration method to eliminate the cold reflection effect on infrared images, so as to improve the quality of infrared images and the overall performance of the system. The problem of cold reflection is not only important in theory, it also affects the design and application of various infrared imaging systems in practice. As the application of infrared technology in national defense and industry continues to expand, the development of a method that can effectively suppress or eliminate the cold reflection noise is of great practical significance to enhance the performance of infrared systems, reduce the computational burden, and promote the progress of infrared imaging technology. Aiming at the cold reflection phenomenon, this study designs a mid-wave cooling infrared computational imaging optical system based on the system design principle and optimized evaluation function. The mid-wave cooling infrared system has become a key component of modern infrared imaging technology due to its superior performance in detection sensitivity and imaging quality. The designed optical system is modeled in detail using TracePro software to obtain radiance outgrowth data for the system. These data include the radiative properties, reflection coefficients, and other important parameters of the different optical components of the system that may affect the cold reflection phenomenon. After completing the TracePro modeling, the radiance data are imported into Matlab software and matched with the gray values of the simulated image to generate a high-precision simulated image that can reflect the cold reflection effect. Considering the difficulty of eliminating the cold reflection in the image restoration process, this paper proposes a Butterworth cross-section-based method. The Butterworth filter is widely used in the field of signal processing due to its smooth transition and less oscillation. In this study, the Butterworth cross-section method is applied to image processing to eliminate the image blurring caused by the cold reflection effect. The image incompleteness caused by cold reflection noise is effectively suppressed by this method, and thus smooth image recovery is achieved.Results and DiscussionsIn order to verify the effectiveness of the proposed method, a detailed simulation of the cold reflection phenomenon in simulated infrared images and real infrared images is carried out in this paper. In the experiments, infrared images under different scenarios are generated and the possible cold reflection effects in them are simulated. By comparing the degraded images with the images recovered based on the Butterworth cross-section method, it is found that the method can effectively reduce the cold reflection noise and significantly improve the clarity and visibility of the images (Fig.6-Fig.7). In addition, the image quality before and after the restoration was quantitatively analyzed from various perspectives such as image standard deviation (STD), peak signal-to-noise ratio (PSNR) and structural similarity index (SSIM). The experimental results show that PSNR and SSIM, on the other hand, are significantly improved after image restoration using the Butterworth cross-section method (Tab.3-Tab.4). These results fully demonstrate the effectiveness of the method in improving IR image quality and signal-to-noise ratio.ConclusionsThe experimental results show that the use of the Butterworth cross-section method to remove cold reflection noise not only significantly reduces the computational workload, but also significantly improves the quality and signal-to-noise ratio of infrared images. This study provides a new technical path for solving the cold reflection problem and provides a valuable reference for the design of future infrared imaging systems. The Butterworth cross-section method proposed in this study has a wide range of applications in both theory and practice. Particularly in the military, medical and security fields where high-precision imaging is required, the method can significantly improve the imaging quality of the system, reduce unnecessary computational overhead, and help to realize the miniaturization and lightweighting of the system. In addition, the method can be further applied to other types of image processing tasks, such as noise suppression in remote sensing images and image enhancement in industrial inspection.
Dec. 31, 2024Vol. 53 Issue 12 20240405 (2024)
Yulong XIANG, and Wei CHEN
ObjectiveLaser underwater transmission has many advantages, such as high transmission rate, low time delay and high precision. When light is sent underwater, it is affected by the absorption and scattering of particles in the water, as well as different types of turbulence, which further limits the wide application of light transmission systems. There is a large vorticity region near the bubble, and the movement of the bubble will produce turbulence. The more bubbles there are, the greater the number of bonds of the corresponding fluid, so that the bubbles contained in the fluid are more likely to break into small-scale bubbles, thus increasing the instability of the fluid and generating turbulence. Due to the wake of ships, underwater vehicles, wave breaking and other factors will produce bubbles, which will have an important impact on the performance of underwater optical transmission system. On the basis of previous studies, the underwater wireless optical transmission system under the influence of bubble scattering is studied in this paper.MethodsA simulation model of light transmission under the influence of bubble scattering is proposed in this paper. Compared with the traditional Monte Carlo model, the model introduces random variation of scattering coefficient and changes the random step size of photon motion according to the amount of bubble in water. Based on the idea of simulation research, the transmission characteristics of laser in the bubble are experimentally studied, and the energy ratio between the left and right sides of the average received light intensity is analyzed.Results and DiscussionsThe results show that the received light intensity distribution obtained by the model is in good agreement with the experiment. With the change of the position of bubbles, the probability density distribution of the received light intensity hardly changes significantly, and the probability of receiving light intensity reaches the maximum at the position with greater than the average light intensity ($ I/{I}~~{0} > 1 $) (Fig.4). With the increase of the number of bubbles, the peak probability density of received light intensity gradually transitions from a position greater than the average light intensity to a position less than the average light intensity (Fig.5). In addition, the change of the energy ratio of the left and right sides of the average received light intensity was also analyzed, and it was found that with the increase of the number of bubbles, the received light intensity energy ratio showed a trend of first increasing and then decreasing, but was always less than 1(Fig.6).ConclusionsA simulation model of underwater light transmission under the influence of bubbles is established in this paper. The model is based on the random variation of the scattering coefficient under the influence of bubbles, and the random step of photon transmission is changed according to the amount of bubbles in water. By comparing the results obtained from the simulation model with the experiments, it is found that by changing the maximum scattering coefficient under the influence of the bubble and the random step size in the photon collision process, the received light intensity distribution obtained from the simulation model can be well consistent with the experiment, indicating that the bubble will have an important impact on the performance of light transmission by changing the scattering coefficient and scattering times of light in water. In addition, the change of the energy ratio between the left and right sides of the average received light intensity is also studied. It is found that with the increase of the number of bubbles, the energy ratio increases first and then decreases, but it is always less than 1. The research results of this paper can provide a useful reference for the study of underwater light transmission characteristics in the real bubble environment.
Dec. 31, 2024Vol. 53 Issue 12 20240321 (2024)
Xingdong BAO, Xuehe ZHENG, Yuan TIAN, Zhenhua WANG, Sihui WANG, and Zhihe XIAO
Objective For relatively high-density areas inside and near the exit, axial symmetry can be used to compress the Navier-Stekes equation description, and the realizable turbulence model is closed to the model equation. Use a limited volume method to discrete, and the time is promoted to adopt hidden methods. Axially simulates the Monte Carlo method described by axisymmetric in the spray exit and far field. Combined with the HITEMP2010 database, the spectral absorption coefficient of the gas component of infrared radiation is calculated by line-by-line integral method. The radiation transmission equation that is regarded in the light method is used to solve the high-altitude feathers. Experimental data of high-altitude feather flow flow is used to verify the effectiveness of high-altitude feathers flow and radiation computing models in this article.Results and Discussions Through the effects of analysis of the total pressure and total temperature conditions of different shots and the effects of the general temperature conditions on the flow of high-altitude feathers and their infrared radiation characteristics, the calculation conditions of different shots are used (Tab.1). The display of the non-balance effect mainly occurs in the shock area (Fig.3). The pressure at the ink at the entrance will have a more obvious impact on the contour, spectral level, and the brightness of the ranceling layer of the separation wave line (Fig.4). The brightness distribution of the same calculation in different bands is similar, and the differences are mainly magnitude (Fig.5). The difference between the brightness in the same calculation in different bands is mainly values (Fig.6). Calculation conditions of different freedom flow (Tab.2) show that the greater the density of freedom, the more powerful the impact on the compression of the shooting (Fig.7). Increased freedom flow density will slowly raise the spectral radiation intensity (Fig.8). Freedom flow has a small impact on the relatively high-voltage area near the engine exit (Fig.9-Fig.10). After different operating conditions, after using the formula for infinite outline, its boundary characteristics are no longer affected by the engine and freedom, and have good consistency (Fig.11). Different bands have a similar change trend (Fig.12). The characteristics of high-altitude feathers flow and radiation are mainly determined by the total pressure, total temperature, freedom to flow density, speed, etc., which will significantly affect the distribution of the brightness of the feather flow radiation.Conclusions Under the same boundary conditions, high-altitude feathers have similar structures, that is, internal flow, turbulence, and outflow areas. The location of the separation wave line is basically the same. The launch and absorption are mainly concentrated in the center of the spectrum. It is manifested as a relatively separate spectrum line. Its radiation energy is mainly concentrated near the spray mouth and in the rim layer. After the direction of the shot axis and crossing the separation wave line, the brightness has decreased. It has similarity, the distribution of feathers is similar to feather-like, and the brightness field presents crescent-shaped; The total pressure of the engine has increased, and the shot and freedom flow form a relatively obvious wave layer. The effect, with the further increase of the density of the shot, the unbalanced effect of the shooting area itself weakened, the overall expansion of the separation wave line and the radiation of the feather flow will significantly, and the increase in the total temperature of the engine's shooting will not affect its separation wave line. However, the temperature of the high-altitude feathers inner flow area and the swarm area will increase, and the non-balance effect of the swarm area increases, which will greatly increase the radiation of the feather flow; The increase in density or speed of freedom will significantly compress The inflating of the feather is continuously shifted in the position of the separation wave line. Due to the changes in the flow field structure, the brightness distribution of different bands has a relatively significant difference. Under the conditions of different shots and freedom, the spectral radiation structure is similar. The difference is mainly reflected in the difference. In terms of numerical values; From the perspective of the characteristics of the flow boundary, after the total pressure, total temperature and freedom flow, density, and density of the shot flow, the separation streamline calculated under different conditions has very good consistency; From radiation in terms of strength characteristics, the increase in the total pressure and total temperature of the engine shot will significantly increase the radiation intensity of high-altitude feathers, and when the density and speed of freedom are changed, although the flow field and brightness distribution will have a great impact, it will have a great impact on the distribution of the flow field and the distribution of brightness, but it will be on its radiation intensity has less impact.
Dec. 31, 2024Vol. 53 Issue 12 20240196 (2024)
Shangju LI, Baoyu YANG, Jinghao ZHU, Jiakun ZHANG, and Yuhan LI
As the main equipment to provide low temperature environment of space infrared load, the multi-directional micro-vibration of mechanical cryocooler is an important factor affecting the image quality of large aperture and high resolution space telescope and the stability of superstable cavity in atomic optical clock system. According to the multidirectional vibration characteristics of cryocooler, a multi-directional active vibration control method based on the principle of adaptive narrowband filter is proposed, and a multidirectional adaptive active vibration reduction system is built. The experimental results show that this method can effectively suppress the multi-directional micro-vibration of the cryocooler, and the high order vibration acceleration of the compressor in the axial direction, the tube direction and the vertical bottom plate direction is reduced to the order of 1E–4 g.ObjectiveMechanical cryocoolers are widely used in fields such as space-based astronomical observation and low-temperature infrared detection. The reciprocating motion of the compressor piston and the internal airflow pulsation of the cryocooler are the main reasons for the multi-directional vibration of the cryocooler. Micro vibrations can cause visual axis jitter in optical systems, reducing stability accuracy. In optical clock systems, vibrations directly affect the stability of the low-temperature ultra stable cavity length, thereby affecting the stability of laser frequency. There are already various control methods for micro vibration disturbances in cryocoolers. In recent years, the suppression of multi-directional vibration in cryocoolers has mainly been achieved through passive vibration isolation or a combination of active and passive vibration control methods. However, passive vibration isolation, due to structural limitations, may bring additional problems such as in orbit unlocking. Therefore, based on the adaptive narrowband filter control method, this article designs a multi-directional adaptive active vibration reduction system for cryocoolers.MethodsThis article compares two different active vibration reduction methods (Tab.1), selects external actuators as the active damper, conducts dynamic analysis of the system to determine the installation position of the active damper (Fig.5), proposes a multi-directional active vibration control method based on the principle of adaptive narrowband filter, and establishes an adaptive active vibration reduction model (Fig.6). Finally, a multi-directional adaptive active vibration reduction system was built (Fig.7). which consists of vibration sensors, control circuits, and dampers. Among them, the input of the control circuit is the vibration signal collected by the acceleration sensors. After being processed by an adaptive algorithm, the vibration reduction drive signal is output to the external actuators, generating a multi-directional vibration force that cancels out the original vibration force.Results and DiscussionsAdopting the adaptive active vibration reduction method, a multi-directional adaptive active control system testing platform for cryocooler was built (Fig.8). Perform vibration analysis on the three directions of the cryocooler, namely axial (x), pipe connection direction (y), and vertical bottom plate direction (z) (Fig.9). After vibration reduction, the second, third, and fourth order vibrations in the x direction decreased from 0.001 34 g, 0.002 77 g and 0.001 54 g to 0.000 08 g, 0.000 1 g and 0.000 1g, respectively; The y direction high-order vibration decreased from 0.001 72 g, 0.000 85 g and 0.000 06 g to 0.000 17 g, 0.000 03 g and 0.000 05 g, and the z direction high-order vibration decreased from 0.005 71 g, 0.002 22 g, 0.000 57 g to 0.000 17 g, 0.000 19 g and 0.000 13 g. The overall additional power consumption of the three damping actuators was less than 1.5 W.ConclusionsThree active vibration reduction methods using external actuators were proposed by comparing different active vibration reduction methods. A multi-directional adaptive active vibration reduction model was established, and a multi-directional vibration reduction testing system for cryocoolers was built to verify the model's effectiveness. The experimental results show that after multi-directional vibration control, the acceleration of high-order vibrations in the x, y, and z directions of the compressor is reduced to the order of 1E–4 g, providing technical support for the research and application of multi-directional adaptive active vibration reduction methods for cryocoolers.
Dec. 31, 2024Vol. 53 Issue 12 20240361 (2024)
Qianfeng YIN, Jiazheng CHEN, Zhongyu ZHOU, Yongqiang ZHANG, Fuli TAN, and Li ZHANG
ObjectiveThe interaction between laser and metal materials under high-speed airflow is an important aspect of laser irradiation effects. In high-speed airflow environment, laser ablation behavior characterized by high temperature rise rate can oxidize and rapidly transform the surface of metal steel, resulting in significant changes in surface heat transfer, oxidation heat release, and aerodynamic forces, which in turn affect its thermal performance and usability. The ablation behavior of metal steel is influenced by various factors such as surface high-temperature oxidation reaction, airflow convection heat dissipation, airflow erosion, and absorption rate. Currently, there are few numerical models that consider the coupling effect of these factors. Therefore, it is necessary to establish a suitable numerical model to describe the laser thermochemical ablation behavior of metal steel under airflow conditions, in order to characterize the multi physics field response law of metal steel during laser loading and improve the calculation accuracy of the numerical model.MethodsCombining experimental and simulation methods, the laser thermochemical ablation behavior of metal steel is studied. The thermal response temperature and ablation morphology of 30CrMnSiA steel are obtained through laser airflow combined loading experiments using a chemical laser (Fig.2) and a movable wind tunnel (Fig.6-Fig.7). The finite element software flow field analysis and thermal analysis module are used to numerically simulate the thermal fluid solid coupling process of laser irradiated 30CrMnSiA steel. Nonlinear changes in parameters such as reflectivity, chemical reaction heat, and latent heat of phase transformation during the ablation process are implemented using a secondary development program. The degradation process of the ablation interface in the fluid and solid domains is achieved using the dynamic grid method (Fig.4).Result and Discussion A numerical model for laser ablation of metal steel was established, which considers the effects of high-speed airflow, changes in reflectivity caused by thermochemical reactions (Fig.9), and heat absorption/release. For the thermochemical ablation behavior of metal steel, a chemical laser loading experiment was designed to obtain the morphology of metal melting and thermal response temperature. This numerical model can accurately reflect variables such as thermal response temperature and ablation amount during laser ablation of 30CrMnSiA steel. By simulating the dynamic changes of metal surface melting pits and the growth process of surface oxide films, this model can provide data support for the study of laser ablation effects on metals. Based on this model, the influence of strong coupling between high-speed airflow and thermochemical reactions on laser ablation was elucidated (Fig.10-Fig.11).ConclusionA numerical model of laser thermochemical ablation of 30CrMnSiA steel is constructed based on the compressible unsteady N-S equation, the principle of high-temperature oxidation of metallic iron, and the thermal fluid solid coupling calculation method. The dynamic changes of the surface melt pit and the growth process of the surface oxide film of the metal steel under the action of airflow are simulated. By designing laser ablation experiments of 30CrMnSiA steel under airflow conditions, the thermal response temperature and ablation morphology during the ablation process are obtained, and the accuracy of the numerical model calculation is compared and verified. By combining the nonlinear changes in reflectivity and heat absorption/release caused by high-speed airflow and thermochemical reactions, the influence of airflow velocity and ablation temperature on metal oxidation heat is analyzed. The research results reveal the interaction and influence laws of multiple factors, which can provide theoretical guidance for the practical application of laser ablation.
Dec. 31, 2024Vol. 53 Issue 12 20240250 (2024)
Yuanchun XIE, Bowen LIU, Fan ZHOU, Erse JIA, Yaqi WU, Genyu BI, Chen XIE, and Minglie HU
ObjectiveChirped pulse amplification is a laser amplification technology widely used in industrial processing, which effectively suppresses the nonlinear effect in the amplification process and ensures the safety of the gain fiber in the amplification process. With the increase of output power, the pulse duration of the CPA output pulse also increases, because the influence of gain-narrowing effect becomes more serious during the amplification process, and the increase of pulse duration will lead to the decrease of the peak power of the output pulse, which in turn affects the processing effect. Shaping the seed spectrum into a saddle spectrum is an effective method to suppress the gain-narrowing, and there have been many experiments using this method to successfully suppress the gain-narrowing. However, few studies have been conducted on the shape of saddle spectrum to better suppress the gain-narrowing, which will affect the time-domain quality and pulse duration of the output pulse, and thus affect the processing effect. Therefore, this paper will investigate which shape of saddle spectrum can better suppress the gain narrowing effect, and the answer to this question is of great significance.MethodsWe build a spectral and chirped control device based on liquid crystal spatial light modulator (LC-SLM) and tunable chirped fiber Bragg grating (T-CFBG) and it is applied to the fiber chirped pulse amplification (FCPA) system to realize spectral shaping and pulse chirp control (Fig.1). The seed spectrum is formed into saddle-shaped spectra of different shapes by LC-SLM, and the chirp control was carried out by T-CFBG to explore the effect of inhibiting the gain-narrowing of saddle-shaped seed spectrum with different depression center wavelengths, different depression depths and different depression widths, and then the law under different powers was explored by changing the system output power.Results and DiscussionsThe saddle-shaped seed spectrum with different depression center wavelengths, different depression depths, and different depression widths are successfully modulated, and the autocorrelation curves after amplification and compression are measured: the wavelength of the depression center have little effect on the pulse duration of the final output pulse (Fig.4). Under different output powers, the greater the depression depth, the narrower the pulse duration after compression (Fig.5). There is an optimal depression width that makes the pulse duration narrowest after compression (Fig.6), and the optimal depression width decreases with the increase of output power at different output powers (Fig.7). Under the guidance of this rule, the femtosecond laser output with an average power of 25 W, a repetition rate of 1 MHz and a pulse width of 197 fs after compression was obtained (Fig.8).ConclusionsThe research confirmed the effectiveness of the LC-SLM and T-CFBG in controlling spectral intensity and chirp in FCPA systems, which is crucial for achieving high-quality femtosecond laser pulses. The study identified key parameters for shaping the seed spectrum to suppress gain-narrowing and optimize pulse duration, providing valuable insights for future applications of this technology in scientific research and industrial processes. The system successfully delivered a high-energy femtosecond laser output with improved spectral and temporal characteristics, paving the way for further advancements in the field.
Dec. 31, 2024Vol. 53 Issue 12 20240265 (2024)
Wenbo ZHONG, Xinsheng ZHAO, Junsheng CHEN, Hao LEI, and Jianfeng LI
ObjectiveThis study systematically analyzed the impact and mechanism of various parameters on the efficacy of fusion splicing and explored an efficient and widely applicable fusion splicing technology between fluoride fiber and silica fiber. By investigating the optimal splicing parameters between single-mode indium fluoride fiber and single-mode silica fiber, we introduced the large-package-small structure concept, which establishes a reliable fusion point based on the significant difference in thermal expansion performance. We quantitatively analyzed key splicing parameters such as heating time, power, offset, and hot push that greatly influence the splicing outcome. The relationships between heating time, splicing loss, tensile strength, power, offset, and hot push were established by comparing splicing outcomes under different parameters. This research successfully achieved high-quality fusion splicing between single-mode indium fluoride fiber and single-mode silica fiber, with a minimal splicing loss of 0.04 dB and a tensile strength exceeding 150 MPa. Furthermore, the fusion point's temperature remained below 40 ℃ when subjected to a 9.6 W pumping test with a mid-infrared supercontinuum source, demonstrating high damage threshold and long-term stability. Additionally, high-quality fusion splicing was accomplished between silica fiber, fluorotellurite fiber, and ZBLAN fiber, resulting in a splicing loss of less than 0.1 dB, thereby confirming the broad applicability of the technology. These findings serve as a solid foundation for the advancement of mid-infrared high-power all-fiber lasers.MethodsThe study analyzed the principle of the offset thermal splicing method and identified its inability to yield a stable splicing point. As an alternative, the large-package-small structure concept was proposed, leveraging the thermal expansion coefficient difference between fluoride fiber and silica fiber to create a stable splicing point. Building upon this concept, the study elucidated the action mechanism of each parameter in the fusion splicing process and determined the splicing loss and tensile strength trends with each parameter through quantitative analysis of heating time, power, offset, and hot push. A laboratory fusion splicing process was developed based on this technology, and its reliability was validated through fusion splicing experiments involving silica fiber with ZBLAN and silica fiber with fluorotellurite fiber.Results and DiscussionsUnder the optimal fusion splicing parameters for single-mode indium fluoride fiber and single-mode silica fiber, a splicing loss as low as 0.04 dB and a tensile strength exceeding 150 MPa were achieved at lower power levels. Moreover, the temperature of the fusion-splicing point remained below 40 ℃ during testing with a 9.6 W mid-infrared supercontinuum source, indicating high damage threshold and long-term stability. Fusion splicing between silica fiber and fluorotellurite fiber, as well as silica fiber and ZBLAN fiber, resulted in splicing losses of less than 0.1 dB and satisfactory tensile strength, affirming the technology's reliability.Conclusions This study highlights the effectiveness of the offset thermal fusion splicing method through the fusion of single-mode indium fluoride fiber and single-mode silica fiber. By establishing a mature laboratory fusion splicing technology, the research achieved a high-quality fusion-splicing point with ultra-low loss, high tensile strength, high damage threshold, and long-term stability. The technology's reliability was confirmed through fusion splicing experiments involving silica fiber with fluorotellurite fiber and silica fiber with ZBLAN fiber, underscoring its significant potential in the realm of high-power all-fiber mid-infrared fiber lasers.
Dec. 31, 2024Vol. 53 Issue 12 20240329 (2024)
Shenhe REN, Ming GAO, Mingjun WANG, Yan LI, and Yuanzhuo CAO
Objective The study of laser transmission and scattering in ice crystal particle clouds is an important component of studying the scattering characteristics of complex systems and stochastic media. When the laser signal is transmitted within the cloud layer and interacts with ice crystal particles, it leads to energy loss, resulting in a decrease in the signal-to-noise ratio at the receiving point, sometimes even below the receiving threshold; On the other hand, it may cause some or all of the light spot to drift outside the receiver aperture, resulting in reception errors. In the field of remote sensing engineering, the physical characteristics of targets are often inverted by reflected waves. Due to the presence of clouds, ice crystal particles, and water droplet particles, the atmospheric refractive index undergoes small fluctuations. When laser passes through it, the intensity of the light field is affected, which can also cause significant inversion errors. This greatly interferes with and hinders free space optical communication and LiDAR detection. In addition, the generation mechanism of ice crystal particles in high-altitude clouds is very complex, not only with complex structures and shapes, but also with motion randomness (i.e. different spatial positions). It is necessary to consider the spatial orientation of particles in simulation calculations.MethodsThe scattering parameters of individual nucleated particles and aggregated particles in this article are simulated and calculated using DDSCAT software. The calculation objects can be isolated entities , or a collection of "object units" in one-dimensional or two-dimensional periodic arrays, and can even be used to study the absorption and scattering around the smallest nanoscale structure array. DDA approximates objects through a set of polarization points. Draine and Flatau implemented the application of DDA theory in DDSCAT in 1994 and conducted effective near-field calculations in 2012. DDSCAT 7.3 can establish dipole arrays of various geometric shapes (although the dipoles must be located on a cubic lattice), the incident plane wave can have any elliptical polarization, and the object can be oriented arbitrarily relative to the incident radiation. DDSCAT can be used to calculate absorption efficiency, scattering efficiency, and extinction efficiency. It can also calculate the scattering matrix element Sij to characterize the scattering characteristics of any spatially oriented object.Results and DiscussionsFigure 1-Figure 3 take into account the different particle shapes, resulting in different scattering cross-sections. Therefore, the shape of ice crystal particles is an important factor affecting extinction efficiency, absorption efficiency, scattering efficiency, and phase matrix element light scattering; Figure 4 shows the structural models of pure and ideal tetrahedral ice crystal particles with nucleus; Figure 5-Figure 7 shows that under the condition of constant ice crystal particle size, the increase of crystal nucleus lead to the strengthening of the interaction between the inner and outer media of tetrahedral nucleated particles, and the real part of the refractive index of the crystal nucleus medium increases; Figure 9-Figure 13 establish visual orientation maps for individual particles and aggregated particles; Figure 14-Figure 19 investigates the influence of particle spatial orientation on light scattering, and then uses the least squares method to obtain the minimum value of the spatial azimuth calculated by particle simulation.ConclusionsThe stronger the irregularity of ice crystal particles, the larger the effective size of the particles, and the more significant the changes in extinction, absorption, and scattering efficiency; The larger the crystal nucleus of the particle, the more pronounced the scattering directionality of ice crystal particles with nuclear structure. To study the light scattering of ice crystal particles, we cannot only study single structured particles. We should enrich the particle shapes as much as possible, consider the complex structure of particles, and improve the accuracy of simulation calculations. The maximum deviation of scattering efficiency of ice crystal particles under different spatial orientations reaches 60%. Simulation calculations must cover all directions as much as possible, but are limited by the CPU of the computer. The scattering data of tetrahedral particles in different spatial orientations were calculated in the article, and the difference between the average scattering curve of tetrahedral particles and the spatial orientation was statistically analyzed to find the minimum spatial azimuth required for tetrahedral model simulation calculation. We extended this minimum spatial azimuth to other models, providing a theoretical basis for the selection of spatial azimuth in future simulation calculations.
Dec. 31, 2024Vol. 53 Issue 12 20240336 (2024)
Yijun HUANGFU, and Muchun ZHOU
ObjectiveOptical phased arrays have attracted much attention in the research of all-solid-state lidar systems due to their wide field of view, high accuracy, and flexible pointing characteristics. The simultaneous optimisation of metrics such as gate level, scanning range and main flap intensity is a guarantee for its high performance. In the existing research methods, the use of non-equally spaced arrays to inhibit the grating is a common means, scholars commonly used algorithms to achieve this process, as well as other performance indicators, some scholars are also in the research. However, most of their studies are independent and do not consider the overall needs. And the relationship between the indicators is more complex, it is difficult to optimise multiple indicators at the same time to the ultimate situation. In order to meet the overall needs of multi-indicator optimisation, a multi-objective optimisation scheme based on improved population algorithm is proposed.MethodsThe scheme of this paper is based on the Harris Hawk population algorithm awakening improvement. In terms of algorithm iteration, the use of good point set initialization to generate more ephemeral first generation, using Levy flight to speed up the exploration process, nonlinear function for search transformation, double perturbation strategy to jump out of the local solution; in the direction of multi-objective optimization, the use of fast non-dominated sorting as well as congestion distance strategy to achieve the sorting of multiple indexes in the algorithm, coupled with the elite strategy to retain the good individuals of the previous generation, to complete the overall algorithmic scheme design(Fig.4). Finally, simulation software is used to simulate the experiment and get the results.Results and DiscussionsThe optimisation of the three schemes at a deflection angle of 0° was found to achieve multi-objective optimisation for all schemes, with an improved level of gate flap suppression of up to -16.11 dB, a reduction of 80.3%, and a scanning range of 37.4° (Fig.5). The scheme was then compared with the results for different deflection angles, different array ranges and different array spacings, and it was found that the gate flap could be suppressed, the main flap could be strengthened and the scanning range could be extended. The comparison of this scheme with other multi-objective optimisation methods (Fig.7, Tab.2) proved the superiority of the multi-objective optimisation scheme in this paper.ConclusionsAn optical phased array alignment scheme based on an improved multi-objective Harris Hawk algorithm is proposed for non-equally spaced multi-directional array optimisation. The algorithmic scheme obtained -16.11 dB side-mode rejection ratio of the side flap and more than 4000 main flap intensity in the two-objective optimisation, respectively, and the gate flap decreased by 80.3%; and the three-objective optimisation obtained -14.29 dB side-mode rejection ratio of the side flap, which is decreased by 59.9%, and there was 37.4° scanning range and more than 4000 main flap intensity, which successfully achieved the suppression of the gate flap and the enhancement of the optical beam. It helps the subsequent simulation and practice to improve the overall performance of optical phased array lidar.
Dec. 31, 2024Vol. 53 Issue 12 20240339 (2024)
Tong WU, Peng ZHANG, Yang LIU, Yunlong FAN, and Hao YU
Objective Tunable pulsed fiber lasers have important applications in optical fiber sensing, spectral measurement, and optical fiber communication. Currently, there are three types of pulses in fiber lasers: Q-switched pulse, mode-locked pulse, and Q-switched mode-locked (QML) pulse. QML pulse is a transition state between Q-switched pulse and mode-locked pulse. Therefore, QML pulse has the characteristics of both Q-switched pulse and mode-locked pulse. Compared with mode-locked pulse, QML pulse has higher single pulse energy and adjustable repetition frequency. Most of the fiber lasers utilize saturable absorber materials, nonlinear polarization rotation (NPR) structure, and nonlinear amplifying loop mirror (NALM) structure to achieve pulse output. Compared with saturable absorber materials and NPR structure, NALM structure has the characteristics of high environmental stability, high damage threshold, and high efficiency. Moreover, NALM structure also has filtering effect, which can realize wavelength tunability of pulsed fiber lasers. Therefore, this paper proposes a tunable multimode QML laser based on NALM structure.Methods A tunable multimode QML laser based on the NALM structure has been constructed (Fig.1). This laser consists of a NALM structure on the left and a linear arm on the right, connected by a 50∶50 coupler. The end of the linear arm is a fiber optic mirror. After being reflected by the mirror, the light enters the NALM structure on the left through the coupler. The incident light is split into two beams of equal intensity. The clockwise transmitted light is amplified by the gain fiber and then passes through a section of ordinary fiber, where it accumulates nonlinear phase shifts due to self-phase modulation and cross-phase modulation effects. The counterclockwise transmitted light passes through the ordinary fiber first and then is amplified. After both beams propagate one cycle within the left-side loop, due to the different nonlinear phase shifts accumulated by the two beams, interference occurs within the coupler (1:1), resulting in narrowing of the optical pulses. On the basis of achieving pulse output, by controlling the rotation angle of the polarization controller, the propagation path and optical path difference of the light waves within the NALM structure can be altered, thereby achieving tuning of the output wavelength.Results and Discussions The experiment successfully generated multimode QML pulses (Fig.3), and by adjusting the polarization controller, multimode QML pulses with different center wavelengths were obtained (Fig.4). The center wavelength can be tuned from 1564.1 nm to 1609.2 nm, with a tunable range of up to 45.1 nm. The optical spot patterns were all multimode distributions, and the side mode suppression ratios of the spectra were all around 40 dB, indicating good stability. To further explore the characteristics of multimode QML pulses, the pump power was increased, resulting in dual-wavelength and triple-wavelength multimode QML pulses (Fig.6). By adjusting the polarization controller, the wavelength spacing of the dual-wavelength QML pulses could be increased from 2.66 nm to 31.78 nm, with a tunable range of up to 29.1 nm.Conclusions The experimental results showed that stable multimode QML pulses can be obtained in the multimode cavity of the NALM structure, with a tunable range of up to 45.1 nm for the center wavelength of single-wavelength QML pulses and a tunable range of up to 29.12 nm for the wavelength spacing of dual-wavelength QML pulses. This tunable pulsed fiber laser holds great promise in fields such as optical fiber sensing, spectral measurement, and optical fiber communication.
Dec. 31, 2024Vol. 53 Issue 12 20240351 (2024)
Qunli ZHANG, Tianlu LI, Zhijun CHEN, Siyuan XIANG, Guolong WU, Xuechun LIN, and Jianhua YAO
ObjectiveIn the process of laser solid-state phase transformation, the temperature has a significant impact on the performance of the workpiece, and the accuracy and responsiveness of temperature control are the key factors to ensure the quality of workpiece hardening. During this process, multiple variables, such as laser output power, scanning speed, and spot size, affect the temperature within the laser-affected zone of the workpiece. In addition, material attributes like composition, geometry and surface roughness also affect the temperature of laser solid-state phase transformation, and the surface temperature of the material is also affected by environmental condition and unpredictable elements like heat dissipation. Critical to the process is maintaining the temperature of the material above its austenitizing temperature and below the melting point. Insufficient temperature will inhibit the phase transformation, while excessive heat induces surface melting. And a stable temperature will contribute to the formation of a uniform phase transformation hardened layer. Thus, in order to improve the quality of solid-state laser phase transformation, developing a real-time temperature controller is necessary.MethodsA fuzzy adaptive parallel PID control method based on thermal imaging temperature measurement technology was proposed. It integrates surface sensor technology to capture temperature information across the camera's visual spectrum, and an additional fuzzy control module is introduced on top of the fuzzy PID control. This design empowers the system to evaluate temperature discrepancies across diverse points within the laser's action zone. These differential values are subsequently funneled into a fuzzy logic system, which operates concurrently with the fuzzy PID controller to jointly adjust the laser output power. This dual-control mechanism ensures rapid and meticulous temperature regulation, thereby improving control and an enhancing quality of intensification.Results and DiscussionsThe simulation and experimental validations of the system were conducted utilizing MATLAB/Simulink software and a laser solid-state phase transformation temperature control platform, respectively. The simulation results indicated that the performance of the FAP-PID controller was significantly improved: the rise time was shortened by 14.63%, the settling time was diminished by 28.13%, and the average steady state error was reduced by 74.92% compared with traditional PID ones. In contrast to the fuzzy PID control algorithm, the FAP-PID control algorithm further reduced the rise time by 10.26%, settling time by 16.36%, and trims down the average steady-state error by 64.29%. The experimental results also showed that the FAP-PID control algorithm reduced the rise time by 24.24%, the settling time by 34.0% and the average steady state error by 56.68% compared to the PID control algorithm. Versus fuzzy PID control algorithm, it showed a reduction of 15.38% in the settling time and 56.06% in the average steady state error. In summary, these metrics substantiated that the FAP-PID control algorithm had a faster response speed and a smaller average steady state error, showing superior control performance.ConclusionsAiming at refining the laser solid-state phase change temperature control problem, a fuzzy adaptive parallel PID control algorithm based on thermal imaging was proposed. Through data analysis and application of the step response method, the transfer function model of the laser solid-state phase transformation system was determined. The model accurately described the dynamic characteristics of the system providing a reliable basis for controller design. Subsequently both a traditional PID controller and a fuzzy PID controller were designed, monitoring the laser solid-state phase transformation process through the thermal imaging technique, and then an FAP-PID controller was designed by incorporating fuzzy control. The simulation and experimental results affirmed the superiority of FAP-PID controller, including shortened rise time, reduced settling time, and decreased average steady-state errors. The FAP-PID control algorithm exhibited favorable performance in terms of response speed and stability, thereby substantiating its potential for extensive applications of temperature control in process of laser solid-state phase transformation.
Dec. 31, 2024Vol. 53 Issue 12 20240359 (2024)
Yifei GAO, Qingsong LI, Yi LIN, Qi WANG, Lijun WANG, Tonglu WANG, Guangze GAO, Qinzheng HE, Song HAN, Jieyu LEI, Shuxian QI, and Hui JIANG
ObjectiveThe 3-5 μm mid-infrared laser plays an important role in atmospheric monitoring, medical treatment, and photoelectric countermeasures. The Optical Parametric Oscillators (OPO) as an important means of realizing 3-5 μm laser, has the many advantages such as compact structure, high optical-optical conversion efficiency and widely wavelength tuning range. At present, the nonlinear crystals which achieves 3-5 μm mid-infrared laser are ZnGeP2 (ZGP), MgO-doped period-polarized LiNbO3 (MgO:PPLN), etc. However, the ZGP crystals has a strong absorption of laser below 2 μm wavelength, and it is difficult to use 1 μm laser as a pump source. The MgO:PPLN crystals has the advantages of large nonlinear coefficient, widely laser transmission range, and avoids work-off by using quasi-phase matching technology. In this study, the domestic fiber laser and MgO:PPLN crystal was used to realize the domestic mid-infrared laser output based on MgO:PPLN-OPO technology.MethodsThe domestic all-fiber nanosecond pulsed lasers used a master oscillator power amplifier (MOPA) structure (Fig.1). The seed source was a Q-switched pulse fiber laser which the repetition frequency, pulse width and output power were 150 kHz, 78 ns, and 1.1 W; The 1st of the power amplifier used Ytterbium-doped double clad fiber (YDF) with a core diameter of 20 μm and the cladding diameter of 130 μm, with an output power of 9.5 W; The 2nd of the power amplifier used YDF with a core diameter of 30 μm and the cladding diameter of 250 μm. The 1 064 nm laser passed the two-stage power amplifier and outputted by an isolated collimator. The OPO system included polarizing beam splitter (PBS), half-waveplate (HWP), Faraday rotators (FR), coupled lens (M1 and M2), resonator mirrors (M3 and M4), MgO:PPLN crystals (CTL Photonics), oven and beam splitters (M5). The crystal size of MgO:PPLN was 50 mm×3 mm×2 mm and the polarization periods was 29.5 μm, respectively. The radius of curvature of the input mirror M1 and the output mirror M2 was 300 mm (Fig.2).Results and DiscussionsWith the increase of LD power of the 2nd power amplification, the output power of fiber pulse laser increased linearly. When the LD power of the 2nd power amplification was 115 W, the output power which after the PBS was 43.7 W. At the highest power, the laser pulse width, repetition frequency and output laser center wavelength were 120 ns, 150 kHz and 1 064.3 nm. The spectral width of 3 dB was 3.47 nm and the beam quality factor M2 was 1.62. When the signal laser transmission rate of the output mirror are 0%, 10%, 20% and 30%, the threshold pumping power of 3 817 nm laser were 7.2 W, 12.4 W, 16.3 W and 24.5 W, respectively. Under the maximum pumping power, the output power were 5.93 W, 5.24 W, 5.05 W and 4.06 W, respectively (Fig.7). The corresponding optical-to-optical conversion efficiencies were 13.5%, 11.9%, 11.5% and 9.2%, respectively (Fig.8). And the signal laser pulse width were 94.6 ns, 95.8 ns, 89.8 ns and 92.4 ns, respectively (Fig.9). When the temperature was controlled at 30 ℃, the mid-infrared laser and signal wavelengths were 3 817.2 nm and 1 476.2 nm, respectively (Fig.11). The divergence angle of the output mid-infrared laser was measured by the hole-set method. On the maximum power pumped, the divergence angle was less than 12.3 mrad. At the same time, the 15 min instability root mean square (RMS) was 1.97%.ConclusionsA domestic high power mid-infrared laser based on MgO:PPLN-OPO was studied. When the maximum pump power was 43.7 W, the maximum output power of 3 817 nm laser was 5.93 W, and the optical-optical conversion efficiency was 13.5%. The time-domain characteristics of signal laser and depleted pump laser under high power pumping were experimentally studied and analyzed. It was concluded that the decrease of optical-optical efficiency under high power pumping was caused by the back conversion effect and the crystal thermal effect. On the low power pumped, due to the low power density in the cavity, the optical conversion efficiency and the OPO threshold improved by reducing the transmittance of the output mirror; On the high power pumped, the strong back conversion effect and crystal thermal effect in the cavity became the main reasons which reduced the OPO optical-optical conversion efficiency. The output mirror with large transmittance should be selected to improve the OPO optical-optical conversion efficiency and stability under high power pumped. Compared with previous reports, this study adopted a domestically produced wide-spectrum fiber Q-switched pulse laser and MgO:PPLN crystal, which greatly reduced the technical difficulty, development period and cost, and provided a feasible technical path and experimental reference for the development of a domestically produced high-power mid-infrared laser.
Dec. 31, 2024Vol. 53 Issue 12 20240423 (2024)
Sirui ZHU, Xia WANG, Gangcheng JIAO, Huiyang HE, and Xin ZHANG
ObjectiveIn hazy weather conditions, images captured by conventional cameras often suffer from blurring and distortion due to the effects of particle scattering. Image dehazing has emerged as a focal research area to achieve clear imaging under these adverse conditions. This technique is primarily employed to enhance visual clarity, improve image visibility, and facilitate optical analysis in specialized environments. It finds extensive applications in remote sensing, target recognition, defense and military sectors, as well as autonomous driving technologies. Polarization imaging technology, as an emerging optical-electronic imaging technique, captures both intensity and polarization information, providing distinct advantages in extracting target shapes and texture details, which has garnered widespread attention in the field of dehazing. Existing polarization dehazing algorithms often require the extraction of sky regions, a process that is intricate and prone to introducing artifacts. Moreover, the calculated polarization degree and polarization angle images are significantly affected by particle scattering effects, leading to substantial information loss. To address the aforementioned challenges, this paper proposes a fusion dehazing algorithm based on polarization dark channel.MethodsA fusion dehazing algorithm utilizing polarization information is built in this paper. Based on the principle of dark channel prior, the polarization dark channel is extracted to estimate the atmospheric light and transmission rate for obtaining the scene image. Subsequently, a global adaptive tone mapping method is employed to restore the image brightness. Additionally, hazy images and ground truth images were collected through artificial hazing experiments. An analysis of the effects of haze scattering revealed the issue of blurred image details. Therefore, a local histogram equalization method is introduced to enhance image contrast. Finally, the results of polarization dehazing were fused with those obtained from local histogram equalization using wavelet transform. The high-frequency components were fused using local saliency fusion, while the low-frequency components were fused using weighted average fusion. Various image evaluation metrics are then computed to assess the effectiveness of the algorithm.Results and DiscussionsThe images used for algorithm validation consist of 40 sets of real hazy scenes and 20 sets of simulated hazy scenes. The contrast algorithms selected include the Retinex enhancement algorithm, WANG's polarization dehazing algorithm based on dark channel prior, and deep learning-based methods C2Pnet and D-former. Subjectively, the algorithm proposed in this paper achieves high-quality dehazing for both near and distant scenes, with significant detail recovery and superior visual image quality. Objectively, the proposed algorithm shows a significant improvement in contrast. The enhancements in average gradient and local standard deviation are also notable, indicating that the algorithm effectively reduces blur and noise and enhances edges and details. There is also a noticeable increase in information entropy, further reflecting the recovery of image complexity and richness. In summary, the algorithm presented in this paper demonstrates significant effectiveness and superiority, meeting the requirements for clear imaging in hazy conditions.ConclusionsA wavelet fusion dehazing algorithm based on the polarization dark channel prior is proposed. The algorithm has a simple structure, does not require sky region extraction, and is applicable to a broad range of scenarios. Additionally, it provides stable dehazing effects and produces high-quality images. A global adaptive tone mapping method is introduced to solve the image degradation problem. Through the design of a haze imaging experiment, the impact of haze on the grayscale distribution of ground truth images is analyzed. Consequently, the local histogram equalization method is introduced to enhance image contrast. Finally, by employing wavelet image fusion and integrating the advantages of polarization dark channel and local histogram equalization, fusion dehazing images with rich detail recovery and a high dynamic range are obtained. The experimental results indicate that the polarization dehazing algorithm proposed in this paper can effectively restore real hazy weather scenes.
Dec. 31, 2024Vol. 53 Issue 12 20240195 (2024)
Zifen HE, Jinsheng XUE, Yinhui ZHANG, and Guangchen CHEN
ObjectiveThis article presents an infrared small target detection model called Embedded Spatial Location Information and Multi-view Feature Extraction (ESLIMFE) aims to tackle the challenges of low resolution, restricted feature information, and low recognition accuracy in infrared small target images.MethodsThis article proposes an improved version of the YOLOv5 algorithm, introducing a network model for infrared small target detection designated as ESLIMFENet (Fig.1). To address the loss of detailed information caused by the decreasing resolution of feature maps as network depth increases, a Spatial Location Information Fusion attention mechanism is embedded in the backbone network (Fig.2). Additionally, a Multi-view Feature Extraction Module combines the C3 module and Dynamic Snake Convolution (Fig.3) to enhance the feature representation of small targets by extracting features from various viewpoints. The Large Selection Kernel module utilizes different sizes of convolution kernels to capture multi-scale information, improving the localization capability of infrared small targets. Finally, the Attention-based Intrascale Feature Interaction (AIFI) module is introduced to strengthen feature interaction.Results and DiscussionsTo evaluate the detection performance of the proposed network model, various metrics such as mAP75, mAP50-95, Size, GFLOPs, and Inference time are utilized for a comprehensive comparison. The ablation study in Tab.1 shows that the improved infrared small target detection model achieves an average detection accuracy increase from 82.8% to 90.5%, with a slight increase in inference time from 6.6 ms to 8.5 ms. Comparative experiments in Tab.2 reveal that the improved model outperforms advanced models YOLOv8n and YOLOv8s in detection accuracy. Furthermore, the proposed modules are compared with classic attention mechanisms (SA, CBAM, etc.) in Tab.3, demonstrating superior detection accuracy with our tailored attention mechanism for infrared small target detection.ConclusionsAn algorithmic model is introduced to address the deficiencies in feature information and detection accuracy of infrared small targets. Improvements are made to the YOLOv5s model by integrating a Spatial Location Information Fusion attention mechanism into the original backbone network, enhancing its capacity to extract spatial location information for small targets. A Multi-view Feature Extraction module is designed to further bolster the feature extraction capability for C3 small targets by extracting features from the same perspective at different angles. Furthermore, a Large Selection Kernel module is incorporated to expand the model's receptive field and increase focus on small targets. Finally, an Attention-based Intrascale Feature Interaction module is implemented to dynamically assess the importance of different positions in the input sequence, highlighting key small targets and allocating additional attention to them. Experimental results demonstrate that the model achieves an mAP value of 90.5%, indicating a significant precision advantage over other models and meeting the detection requirements for infrared small targets.
Dec. 31, 2024Vol. 53 Issue 12 20240286 (2024)
Shuai YUAN, Mingzhao OUYANG, Yuegang FU, Chennan YANG, Junwei XU, Qingqing CHENG, and Yahong LI
ObjectiveThe polarization information is related to the material properties and physicochemical characteristics of objects, with different objects exhibiting distinct polarization characteristics. This unique property endows infrared polarization technology with significant advantages in the recognition of camouflaged targets. To meet the application requirements of recognition technology for high-temperature burning camouflage in the air, this paper conducts a study on the long-wave infrared polarization recognition technology for high-temperature solid/gas targets based on biomimetic polarization vision principles.MethodsTaking high-temperature metal heat sources and butane gas combustion heat sources as research subjects, the two-channel PD2 (Fig.1), three-channel PD3 (Fig.2), and four-channel PD4 polarization distance models (Fig.3) are used for imaging high-temperature solid/gas heat source scenarios (Fig.6). The polarization characteristics and target-background contrast of high-temperature solid heat sources are analyzed using four quality evaluation metrics. The three channel polarization distance images are encoded and fused using R, G, and B channels, combining the polarization information of each channel. Three channel combination forms, 234, 223, and 443, are selected for target-background contrast enhancement, and the target-background contrast is analyzed using quality evaluation metrics. A dataset of three types of fused images is created, and the YOLOv8 network is used for solid/gas heat source target recognition.Results and DiscussionsFor PD2 (Fig.6(b)), the camouflaged heat source exhibits edge polarization information. For PD3 (Fig.6(c)) and PD4 (Fig.6(d)), the edge and texture information of the camouflaged heat source are displayed, and there is a significant difference between the target and background in the images. According to the quality evaluation function (Tab.1), PD2 has a BSF value of 1.8236, indicating strong background suppression capability. PD3 and PD4 have high GSC, SCR, and FD indicator values, showing good contrast in noisy environments, with PD3 performing the best. PD3, which has excellent target-background contrast, is introduced into PD2 and PD4 for contrast enhancement. According to the quality evaluation function (Tab.2), the 223 combination (Fig.7(b))'s BSF value is reduced to 0.6238 compared to PD2, making the solid/gas heat source target more prominent. Compared to PD4, the 443 combination (Fig.7(c))'s GSC, SCR, and FD values increased, enhancing the target-background contrast. The 234 combination (Fig.7(a)) has the highest GSC, SCR, and FD values among the three fused images, performing the best. Solid/gas heat source targets can be effectively identified in the dataset of the three types of fused polarization distance infrared images (Fig.8). According to Tab.3, their mAP0.5 is over 99%, with mAP0.5∶0.95 being 73.7%, 75.2%, and 67.3%, respectively. The 223 combination dataset, due to the introduction of PD3, has a reduced BSF value and less background clutter, resulting in the highest mAP0.5∶0.95. The 234 dataset, which integrates PD2, PD3, and PD4, has rich polarization information and less background clutter, with a detection accuracy of 73.7%. The 443 combination has the lowest mAP0.5∶0.95 value due to more background clutter.ConclusionsThis paper conducts a study on the polarization recognition technology for high-temperature solid/gas targets in the long-wave infrared band. By combining bionic vision algorithms, the extraction of material and edge information of high-temperature solid/gas targets can be effectively enhanced, increasing the accuracy of classification and recognition. The integration of bionic polarization vision algorithms with deep learning technology enables a comparative study of classification and recognition of high-temperature solid/gas targets under multi-channel combinations.
Dec. 31, 2024Vol. 53 Issue 12 20240324 (2024)
© Copyright 2018-2021 | Chinese Laser Press.
All Rights Reserved 沪ICP备15018463号-20