


 View fulltext

2023
Volume: 52 Issue 2
26 Article(s)

Yin ZHANG, Pengyuan DING, Guiyi ZHU, Mengwei SHI, and Junhua YAN
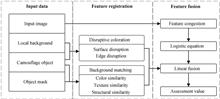
Optical camouflage technology, which is widely used in the military field, can significantly reduce the detectability and detection probability of high-value targets, and improve the survivability of targets. Evaluating camouflage's effectiveness is one of the critical points of current research, which directly affects the design and selection of camouflage strategy. Traditional evaluation models mainly focus on the similarity of color, brightness, texture between target and background based on background matching strategy. However, the traditional models fail to consider the target's surface's integrity and its edges' coherence, so they cannot accurately evaluate the camouflage effect of the target in the complex and changeable field environment. In this paper, the evaluation of camouflage effectiveness is regarded as a confrontation between visual search and target camouflage strategy. The disruptive coloration feature is introduced into the traditional background matching feature, and a representation model of target surface damage degree based on multifractal theory is proposed to evaluate the target camouflage effect comprehensively. The experimental results demonstrate that the target camouflage effect is in accordance with the probability of detection and mean search time in the Search~~2 dataset and CamData dataset. Search~~2 dataset is widely used as a public dataset in the field of camouflage effect evaluation. Camdata dataset is a self-built dataset to verify the performance of the proposed model. We expect this model to be used to evaluate and compare the camouflage effect of different patterns and can be applied to optimize pattern design. The proposed model is divided into feature registration and feature fusion. In the feature registration stage, the ability of visual system to gather scene information is simulated. Based on the classical background matching features such as color similarity, texture similarity, and structure similarity, the target surface disruption and edge disruption are introduced to represent the disruptive coloration color features. Multifractal theory and Gabor filter are used to measure target edge and surface disruption. In the feature fusion stage, the feature congestion index is introduced to calculate the background complexity. The adaptive adjustment of feature fusion weight is guided by background complexity through Logistic Equation to evaluate target camouflage effectiveness in different changing scenes effectively. The overall framework of the camouflage effectiveness evaluation model is shown. The performances of our method and several existing methods are evaluated by the Pearson Correlation Coefficient (PLCC), Spearman Correlation Coefficient (SRCC) and Root Mean Square Error (RMSE). In order to verify the robustness of the model, experiments are conducted both on the classical dataset (Searach~~2) and the self-built dataset (CamData); the proposed model outperformed the related evaluation algorithms. Among the competing methods, the PCDGM and UIQI methods are based on background matching strategy, and the GabRat method is based on disruptive coloration features. The experimental results show that the PLCC, SRCC and RMSE of detection probability are 0.888, 0.773 and 0.054 on Search~~2 dataset, and 0.835, 0.805 and 0.126 on CamData dataset. The results of target search time are 0.874, 0.775 and 2.340 on Search~~2 dataset, and 0.834, 0.760 and 0.727 on CamData dataset. The model in this paper uses scene complexity to guide background matching features and disruptive coloration features to carry out adaptive fusion, which is more consistent with the visual search mechanism and can accurately reflect the changes in target camouflage state and background environment. It is suitable for the evaluation of high reliability camouflage effectiveness of targets in different scenes. The proposed model, from the visual search mechanism against the target camouflage strategy perspective, combines the features of matching disruptive coloration and background matching through background guidance and overcomes the traditional model of the shortcoming of low reliability in a complex environment. Consequently, the comprehensive assessment of the camouflage effect of different targets in a complex environment is realized. Experiments on the Searach~~2 and CamData datasets confirmed the superior performance of the proposed method over other relevant algorithms. Theoretical analysis and experiment prove that the method presented in this paper has good subjective consistency in two scenes of different complexity, and has high operability and stability, which has specific application and promotion value. Besides, our study shows that the camouflage effect can be evaluated more accurately by using background characteristics to guide the fusion of background matching and disruptive coloration features, which is helpful for people to understand the mechanism of camouflage further.
Feb. 25, 2023Vol. 52 Issue 2 0210001 (2023)
Jiang HE, Qiangqiang YUAN, and Jie LI
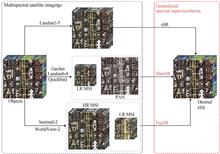
Spectral super-resolution, a very important computational imaging technology to obtain high-spatial-resolution hyperspectral images at a low cost, has received more and more attention. However, the existing works about spectral super-resolution are all based on the assumption that there is only spectral degradation between the observed multispectral data and the real spectra. For multispectral satellites, different imaging modes also include spatial degradation. For this type of data, the existing spectral super-resolution usually uses only a part of the multispectral data to reconstruct hyperspectral data, which will lead to the waste of multispectral data. This paper extends the traditional spectral super-resolution to the generalized spectral super-resolution by summarizing the imaging modes of different multispectral satellites. There are FusSR, which makes full use of the additional multispectral bands with a lower spatial resolution to further optimize the spectral reconstruction, and PansSR, which uses the panchromatic channel with a higher spatial resolution to simultaneously improve the spatial resolution of the reconstructed hyperspectral data. The above two extended spectral super-resolution technologies have made the best of all multispectral data. Besides, after modeling the imaging degradation, the generalized spectral super-resolution is expressed as an optimal problem containing two data fidelity terms and one image prior term. To ensure the algorithm's physical interpretability, the deep unrolling strategy is adopted to build a generalized spectral super-resolution network that combines data-driven and model-driven manner. In addition, the idea of spectral grouping is also employed to generate the initial results. The spectral grouping includes three steps. Firstly, the difference information between bands is calculated. Then the coverage relationship of spectral response function between hyperspectral images and multispectral images is counted. Lastly, bands with high correlation are uniformly reconstructed, so as to eliminate mutual interference between bands with a large radiation gap. To discuss the feasibility of combining model driven and data-driven algorithms in the generalized spectral super-resolution problem, this paper proposed multiple multispectral satellite data sets, named Sen2OHS and GF2Hyper respectively. The former includes four high-resolution Sentinel-2 multispectral bands, four low-resolution Sentinel-2 multispectral bands, and 32 high-resolution Zhuhai-1 hyperspectral bands; the latter includes four low-resolution multispectral bands, one high-resolution panchromatic band and 63 high-resolution hyperspectral bands. CC, mPSNR, mSSIM and SAM are used to evaluate the reconstruction quality. Comparing the results of traditional sSR and FusSR, we can find that the quantitative result of FusSR is higher than sSR. It can be inferred that introducing additional spectral information can effectively improve the spectral reconstruction results, even if they are low-spatial-resolution. Comparing the data before and after PansSR, we can see that not only the spectral channel number of the input data has increased, but also its spatial resolution has been improved. Above resulets show that using higher-resolution panchromatic data can effectively help spectral super-resolution improve spatial resolution. Whether in FusSR or PansSR, their experimental results in this paper effectively prove that a broader concept of spectral super-resolution should be proposed for remote sensing satellite data to effectively reduce data waste.
Feb. 25, 2023Vol. 52 Issue 2 0210002 (2023)
Junzhao GAO, Dangfei HUANG, Lechao ZHANG, Dong SONG, Jinghui HONG, Lili ZHANG, Hongyu TANG, and Yao ZHOU
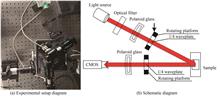
As the second most common cause of death in the world, cancer has become a persistent public health challenge facing the world. At present, the most mature treatment for cancer is surgical resection, and the determination of whether the resection is clean depending on the detection of artificial pathological sections. During the operation, it is necessary to repeatedly confirm whether the diseased tissue is removed cleanly, and each test requires the preparation of pathological sections for manual detection. Pathological section staining is tedious and time-consuming, and the process of manual section detection and confirmation is time-consuming and inefficient. Therefore, there is an urgent need for an auxiliary detection method that skips the staining process, and the method is accurate, fast, highly sensitive, non-contact, non-invasive, and highly safe.Polarization is a new information dimension independent of light intensity, wavelength, and phase. Polarization imaging uses the incident light to irradiate the sample to detect the outgoing light and obtain the physical information of the sample. Polarization imaging is a non-invasive, label free, non-contact optical detection technology. The detected polarization information is often represented by Mueller matrix. Mueller matrix characterizes the polarization characteristics of complex media, including rich macro and micro structural information. Mueller matrix imaging can encode rich information on microstructure even under low resolution and wide field conditions.Polarization detection technology has the advantages such as large information, strong compatibility, wide scale, but the microstructure of each element value of Mueller matrix is not directly related to the same product, and it is difficult to characterize due to the mixing of a large number of influencing factors. It is difficult to obtain specific indicators of sample microstructure. Today, the focus on information extraction of Mueller matrix is only on the processing level of individual array elements with obviously different information, which is very dependent on the information content of sample array elements. This research mainly uses the existing clear classification of physical relations to establish the relationship between the internal information of Mueller matrix, analyze the full array element of Mueller matrix vertically with pixel as the unit, and further extract the overall difference information.In this paper, we will start with the reconstruction of the original backward Mueller matrix imaging system light source and the incident direction to improve the imaging quality. We use the measurement method of double wave plates rotating 30 times to generate Mueller matrix, which is different from the previous data analysis and processing methods. With the help of the classified physical information of Mueller matrix, the new arrangement order is linked, and the Mueller matrix data cube is generated by analogy with the spectral data processing method in the remote sensing field. The full array element curve is extracted longitudinally in pixels. The whole array element curve calls the overall polarization characteristics, which is different from the description form of two-dimensional space image. The expression form is flexible and changeable, which can more intuitively describe the multi-level analysis ability of information. The included angle cosine method is used to eliminate the system error caused by the included angle of the light path, and the target classification is realized by traversing the entire two-dimensional space. This method is fast and easy to implement. On this basis, the samples were selected from the pathological sections of unstained lung cancer and breast cancer. According to the above methods, information visualization analysis, feature extraction and classification, cross scale experiments were carried out, and a confusion matrix was used to show the classification and accuracy. The results show that the pixel level full array information observation mode has more flexible target selection, more variable observation forms and strong anti-interference ability, and good accuracy in distinguishing cancerous change, non cancerous change and background. The accuracy of lung cancer and breast cancer can reach 89.59% and 87.82%, and the accuracy of high magnification breast cancer is 77.52%. Low magnification imaging with cross scale characteristics can still complete feature extraction. Skipping the staining process and assisting in manual detection is of great significance for shortening the time of pathological detection in clinical practice.
Feb. 25, 2023Vol. 52 Issue 2 0210003 (2023)
Yuanyuan LV, Zhaohui LIU, Wenlong QIAO, Liang ZHOU, Xiaoxiao SUN, Peiquan CHEN, Wenkai LI, and Haiyang ZHANG
Event cameras are increasingly popular in the field of artificial vision systems as a new type of biological vision sensor. Different from traditional detectors, which capture images at a fixed rate, event cameras are inspired by biological retinas and respond asynchronously and independently to changes in the brightness of each pixel in the scene. The pixel unit independently detects the change range of the logarithmic value of the light intensity. When it exceeds the preset threshold, the pixel unit is activated and reads out the relevant information of this activation through an external unit, generally including the position of the pixel, activation time, polarity, and other information. When read out, these information are packaged into a data packet, which is called an “event”. After the event is output, the photosensitive pixel unit will return to the inactive state and re-monitor the changes in the outside light intensity. This working principle makes event cameras offer attractive properties compared to traditional cameras: large dynamic range (140 dB vs. 60 dB), high temporal resolution (in the order of μs), low latency, low power consumption, and high pixel bandwidth (in the order of kHz) resulting in reduced motion blur. Hence, Event cameras are widely used in spatial vision problems such as pose estimation, 3D reconstruction, and SLAM. With the development of the event camera, it has been gradually applied in the field of space target detection, and has shown great potential. Event cameras provide a new solution for monitoring satellites and stars for space situational awareness. However, there are few research on space situational awareness based on event cameras. Aiming at the problem of space target detection based on event cameras, we clarify the mechanism of event camera for space target observation, and systematically analyze the influencing factors that affect the detection sensitivity of space target based on event camera. Apart from theoretical analysis, we also build a detection sensitivity model of space target based on event cameras. As described by the proposed sensitivity model, the optical system parameters of the observation system, such as the clear aperture of the observation optical system, the diameter of the dispersion spot caused by the optical system, the transmittance of the optical system, the photoelectric conversion capability of the camera, and the atmospheric turbulence, determine the limit observation capability of the system. As the threshold of the event camera increases, the detection sensitivity of the system (characterized by limit magnitude) decreases linearly. Besides, we performed field experiments with telescopes using the CMOS camera and event camera. First, we conducted an experiment to observe the planetary based on the event camera. The observation results show that the event camera can be applied to space target observation. Compared with the traditional CMOS camera, the event camera has a lower spatial resolution, but the characteristics of its low bandwidth communication, low weight, low power, and high speed make it fully meet the harsh requirements of sensors in the aerospace field, and have great application prospects in space target monitoring. In order to explore the impact of the event camera threshold setting on the detection results, we observed Polaris at different thresholds, and the results show that the low threshold makes the signal in the image more obvious but more noise events. When the weak target is observed, the too-low threshold is easy to cause the indistinguishability of noise events and signal events. When the threshold is raised, the detection sensitivity of the system decreases, and the signal is not obvious, which affects the signal recognition. Therefore, when using the event camera for space target observation, the selection of the threshold value is extremely important, not only to ensure high detection sensitivity, but also to avoid the generation of a large number of noise events, which will affect the signal recognition. So establishing a sensitivity model of space target detection based on event camera can provide theoretical guidance for experiments. For the observation system we built, we selected five celestial objects that are easier to distinguish in the sky to calibrate the sensitivity model. The fitting results show good linearity with correlation coefficient greater than 0.95. After that, we chose three other celestial bodies to verify the model. The relative error was less than 3%, so the model we built is accurate. Event cameras are revolutionary sensors that offer many advantages over traditional, frame-based cameras. Their characteristics, such as low latency, low power, high speed and high dynamic range, make event cameras have a large potential for space target detection. In the meantime, many challenges remain ahead. By conducting theoretical analysis and experimental verification, this paper obtains the sensitivity model of space target detection based on event camera. We hope it can provide a few theoretical guidance for space target observation and other related research based on event camera.
Feb. 25, 2023Vol. 52 Issue 2 0211001 (2023)

Yue YU, Zhaohua YANG, and Yuanjin YU
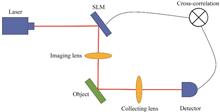
Single-pixel imaging is a new type of imaging technology which uses a non-scanning single-pixel detector to image objects and has attracted much attention from the public since it was produced. It has forged ahead from theory research to experiment exploration and industrial appliance after nearly thirty years of development. What’s more, it has profound potential value in micro-medicine, remote sensing, statement detection, and other aspects. Single-pixel imaging projects objection via speckle light field of consecutive projection. Light intensity is detected by a single-pixel detector rather than a traditional area detector and image restoration requires correlation calculation between speckle light field and detection information. Single-pixel imaging can be divided into forward and backward modulation modes according to the different modulation modes. In the forward modulation mode, speckle light field is created by the spatial light modulator or light source array and used to illuminate the object, then the reflected light intensity is collected by a non-scanning single-pixel detector. In the backward modulation mode, the image of the object is sampled by the spatial light modulator, and the corresponding light intensity is detected by a non-scanning single-pixel detector. Forward modulation is more valuable in remote imaging detection, therefore, it is applied in this study. Since single-pixel imaging uses a non-scanning single-pixel detector to obtain spatially resolved information, it requires a large amount of different modulation information from spatial light modulator or light source array at different times. Therefore, single-pixel imaging sacrifices temporal resolution in exchange for spatial resolution. Generally, to restore high-quality object images with single-pixel imaging, a large number of speckle light patterns are needed to illuminate the object and the corresponding intensity are measured sequentially. This mode is effective in the static object imaging. However, when applying single-pixel imaging to handle a moving object directly, the images restored are likely to be disturbed by motion blur. This is mostly because the position of the moving object is changing while measuring the reflected light intensity, which is different from the case in static object. The traditional imaging system can make moving object in a relatively static state and record a clear object image by shortening the single exposure time. The existing high-speed camera can shorten the single exposure time to less than 1/10 000 seconds. It can photograph the crack propagation at the moment of glass breakage or a bullet in flight. However, single-pixel imaging is different from traditional imaging. The single-frame imaging time of it is difficult to shorten to this level while requiring high imaging quality. If the single-pixel imaging is used in satellite detection, the correlation between reference light field and detector signal will be lost due to the orientation dither caused by the change of satellite attitude, which seriously degrades the reconstructed image quality. Therefor we propose a tracking compensation scheme which can extend single-pixel imaging from continuous exposure sampling imaging of static objection to single-pixel imaging of moving objection. There are two studies in this paper, impact analysis of high quality spaceborne single-pixel motion imaging reconstruction and compensation of spaceborne single-pixel motion imaging based on it. First of all, to solve the above two problems, single-pixel imaging system and its theory are introduced in detail, which lays a theoretical and experimental foundation for the further introduction of solutions and verification. The known series of structured speckles and the measured light intensity can be combined and inverted using a variety of algorithms to yield a good estimated image of the object. Differential ghost imaging is used to complete our research because of its good denoising ability. Second, a tracking compensation scheme in light field was proposed to solve the influence of the satellite orientation dither on the imaging. By analyzing the influence of the roll, pitch and yaw angles on correction imaging, it is clear that the reason of image quality degradation is lower connectively between the speckle light field and the detection value of single-pixel detector due to the satellite orientation dither. The correlation can be restored by light field tracking compensation scheme, and the simulation results show that the scheme is suitable for roll, pitch and yaw angles motion. The experimental results show that the peak signal-to-noise ratio of the reconstructed image is improved obviously, which proves the effectiveness of the method. Finally, the light field tracking compensation scheme of satellite orientation dither is carried out for typical scenes. Comparing the results before and after compensation, the PSNR is increased by 4.7 dB at least, which effectively improves the imaging quality. This scheme provides an effective technical approach for single-pixel imaging of space-borne motion.
Feb. 25, 2023Vol. 52 Issue 2 0211002 (2023)
Wendan HUANG, Heng MA, and Zhanwei LIU
As a common means of non-contact temperature measurement technology, radiation temperature measurement is often limited by the performance of the detector, and the temperature measurement range is narrow, which can not meet the measurement needs of wide temperature range distribution. The analysis of radiation temperature measuring range and influencing factors of a single camera has certain application value in practical engineering applications. As the error of temperature measurement is an important issue to be considered in the process of temperature measurement, this paper briefly introduces the principle of monochrome temperature measurement and two-color temperature measurement and analyzes the influence mechanism of temperature measurement error in detail. The accurate measurement of emissivity is the key factor affecting the error of temperature measurement in the monochromatic method. The accuracy of the colorimetric method is higher than that of the monochromatic method, which can meet the need of temperature measurement accuracy in actual working conditions. Aiming at the problem that the temperature range of the single camera is narrow in the process of single wavelength temperature measurement, the process of object radiation energy conversion into camera and imaging is introduced in detail from the process of single wavelength temperature measurement, and the theoretical formula of the influence of camera sensor dynamic range and working wavelength on the temperature range of the single camera is derived. Combined with the formula, then the influence mechanism of exposure time on the temperature range of radiation thermometry was analyzed, and the influencing factors in the process of band selection are analyzed. The reference principle of band selection is given to select the band where the object radiation is stronger than diffuse reflection and ambient light as far as possible. In colorimetric thermometry, the selection of two working bands should be close to meet the premise that the emissivity of the two bands is approximately equal. The central band and bandwidth of the filter should be selected according to the actual conditions of the test, in order to ensure a high temperature measurement accuracy and a wide range of temperature measurements. The theoretical analysis results show that the selection of camera dynamic range and wavelength limits the maximum span of temperature measurement range during one exposure. When the camera sensor is uniquely determined, the dynamic range of the camera is certain, and the working band is selected according to the band selection principle. After the lower limit of the estimated temperature range is selected, the upper limit of the temperature to be measured can be determined by the formula. Then the band and the lower limit of the estimated temperature are adjusted according to the actual temperature measurement range. By adjusting the exposure and aperture, and making full use of the full dynamic range of the camera sensor, the measurement of the wide temperature range in the radiometric thermometry method of a single camera can be realized. According to the formula, combined with the induction eddy current heating device, the relevant experiments are carried out, and the measurement of a wide temperature range in the single camera radiometric method is realized. Combined with the on-line measurement of the molten pool temperature field, the spectral response function of the camera and the characteristics of the optical components were considered comprehensively, and the relevant verification of the formula was carried out. In addition, for the distribution range of different temperatures, the influence of working wavelength and exposure time on the temperature range is similar, which verifies the results of the theoretical analysis. The selection of better wavelength and better exposure time can improve the single temperature measurement span by at least 40%, which provides important technical reference for the specific implementation of single camera temperature measurement technology.
Feb. 25, 2023Vol. 52 Issue 2 0211003 (2023)

Jing SUN, Xuezhu LIN, Lili GUO, Yue LIU, Dongming YAN, and Lijuan LI
With the development of digital twin technology, the intelligent measurement degree of aerospace assembly products is getting higher and higher. Assembly of large parts is the basis of product performance, and assembly accuracy is an important index to ensure product quality. During the process of skin assembly, the deformation of the assembly force structure with the change of state will result in interference between thin-walled parts, and the forced positioning will affect the stability and safety of the product structure. Digital twin technology has the characteristics of multi-source, heterogeneous, massive, real-time and so on. The twin model gathers all the data obtained by acquisition, reading and fusion. It is particularly important to measure and perceive the product structure to obtain the real state information of components. Therefore, real-time sensing of structural deformation not only meets the characteristics of dynamic updating of the digital twin assembly model but also plays an important role in realizing the high-precision assembly of products. In this paper, based on the characteristics of real-time perception of product form and large-scale measurement field, combined with different measurement advantages of laser tracking, visual measurement and fiber monitoring system, a multi-source system fusion measurement model is constructed. The structural morphology sensing technology based on multi-source system fusion has the characteristics of real-time monitoring, which is not limited by the assembly state, and can effectively reduce the frequency of visual measurement deformation. The high-fidelity data obtained can provide a reference for constructing the twin assembly model. Firstly, the multi-station coordinate unified model of the multi-source system was established, and the pose relationship between multi-source systems was established based on the global coordinate system, so as to realize the measurement network fusion of multi-source system. Secondly, the heterogeneous data fusion model was established, and the heterogeneous data of optical fiber monitoring wavelength and spatial point coordinates were unified based on the surface interpolation reconstruction idea. The multi-source data fusion was realized based on the Gaussian process to predict the deformation point cloud and realize the product structure shape perception. Thirdly, the accuracy evaluation index is listed based on the measurement model, and the accuracy evaluation of the multi-source system fusion structure morphometry model is realized comprehensively. To verify the feasibility of the measurement model, the accuracy of the global measurement network was verified by the spatial coordinate component errors before and after the fusion of the common transfer stations. The accuracy of the fusion model was verified by comparing the predicted shape variables of multi-source data fusion, the shape variables obtained by the interpolation algorithm and the actual shape variables. The deformation point monitoring selection is determined based on ANSYS simulation analysis. Finally, the thin-walled structure with skin was taken as an example to simulate the assembly deformation experiment. The experimental results show that the absolute error of the deformation data obtained by the multi-source data fusion method is kept at 0.016 mm, and the average relative error is 4.66%, which is about 4% lower than that obtained by the interpolation algorithm. The multi-source system fusion structure shape sensing technology predicts the deformation model based on high-precision measurement field fusion heterogeneous data. The deformable point cloud contains the physical attribute information of the parts, which makes the surface detail reaction more complete. The measurement method of multi-source system fusion realizes the real-time monitoring of structural deformation, and the measurement data has the characteristics of high fidelity. The digital twin model is based on the interactive mapping of real-time data, which can monitor and predict the assembly process status of precision products, such as aerospace products, through measurement adjustment and finally achieve high-quality assembly. High-fidelity information sensing is the key to build the twin preassembly model. Therefore, the structure and morphology sensing technology based on multi-source system fusion can provide support for the establishment of the twin model.
Feb. 25, 2023Vol. 52 Issue 2 0211004 (2023)
Junyao WANG, Yansong SONG, Yang LIU, and Jifeng ZHANG
In recent years, photoelectric tracking technology has developed rapidly and has been widely used in space laser communication, laser weapons and other fields. Traditional optoelectronic tracking systems mostly use servo turntables or optical mirrors to achieve beam adjustment to ensure accurate tracking of the target. However, they usually have a large size and weight, and excessive sensitivity to vibration also affects their dynamic tracking performance. A typical representative of a small-inertia beam servo system is the rotating double prism, which consists of a pair of circular optical prisms with specific wedge angles. Both prisms rotate with the same central axis to achieve fast beam deflection, which has the advantages of high accuracy, low rotational inertia, fast beam pointing, and low vibration sensitivity, which makes the double prism system of important practical value in laser communication, interferometry, photoelectric detection, and other fields. The key to achieving target tracking using double prisms is to reveal the nonlinear variation mechanism of beam delivery and to develop an effective prism control strategy. In this paper, a beam compound tracking technology based on a rotating double prism is proposed to replace the traditional servo turntable to achieve precise optical tracking. Firstly, the beam deflection model of the double prism is established, the relationship between the beam deflection vector and the prism angle is deduced in detail, and the nonlinear problem of the prism rotation in the tracking process is analyzed. A double-prism composite tracking system is designed to change the direction of the beam by using two independently rotating prisms, each of which is rotated under the drive of a motor. In the double-prism tracking system, an improved controller is designed to improve the tracking performance, and an FSM is added behind the double prisms, and the beam passing through the prisms will be deflected by the FSM for the final error complement. Among them, the rotating double prism is responsible for a wide range of beam adjustment, and a large field-of-view target viewing camera is added to the system for searching the target position and initial alignment of the optical axis. The FSM is used to compensate for the beam control error of the double prism, and the tracking camera is used as the target detection element in the system to obtain the aiming error of the optical axis in real time. The inertial measurement unit is mounted on an optical abutment. Unlike traditional two-dimensional servo turntable, the rotating dual prism system has a special structure and beam deflection mechanism, which cannot achieve optical axis stabilization through on-axis gyroscopic feedback as in traditional two-dimensional servo turntable, so the dynamic compensation of the optical axis is achieved through attitude decoupling. An experimental system is built to verify the compound tracking technology of the rotating double prism. A collimator is used in the direction along the center axis of the rotating double prism to generate near-parallel light to simulate a long-range target, and the rotating double prism system is fixed to a six-degree-of-freedom swing table for simulating attitude perturbations of a moving pedestal platform. In the dynamic tracking experiment, the control accuracy of the biprism using the improved controller is obviously improved. Compared with the PID controller and the linear active disturbance rejection controller, the control accuracy of the prism is increased by 58.33% and 32.81% respectively, and the corresponding tracking errors are reduced from 49.03 μrad and 38.88 μrad to 31.15 μrad. After turning on boresight compensation, the tracking performance is further improved, with the total tracking error reduced to 7.49 μrad and the tracking accuracy increased by 4.16 times. The experimental results show that the beam compound control can effectively improve the tracking accuracy of the rotating double prism, which verifies the effectiveness of the proposed method.
Feb. 25, 2023Vol. 52 Issue 2 0211005 (2023)
Jiang DING, Chaocheng SONG, Cui MA, Kai HE, and Qiyang ZUO
Industrial robots are gradually applied in the field of precision measurement on account of its high degree of freedom and high precision of repetitive positioning. In order to achieve autonomous movement and complete specified actions, industrial robots often need to carry out precise motion control and precise measurement of the physical scale of the target. The former is accompanied by the development of the manipulator, and its control algorithm has become mature, while the latter has an increasingly high demand for relevant algorithms due to the changing actual working scenarios. As an important part of the autonomous motion of industrial robots, the solution method and efficiency of the spatial plane pose are directly related to the final motion accuracy of robots. In order to simplify the robot structure and improve the sensitivity of the whole system, the monocular vision system is adopted in this paper, which has a wider working range and a more compact structure. At present, the solution of the spatial plane pose can be divided into multi-point constraint problems and non-point constraint problem. The multi-point constraint problem usually involves the identification and pose settlement of multiple feature points, and its application often requires the use of a specific calibration board or the addition of multiple auxiliary feature objects, so the solution is complicated. The non-point constraint problem mainly solves the space pose of the plane by analyzing the characteristic circle. As a common basic feature in life, the circle appears widely on all kinds of workpiece. The research of the spatial plane pose algorithm based on the spatial circular feature is very important to improve the autonomous measurement and motion control of industrial robots. Because of camera perspective distortion, the image of the circle in the camera is not a standard ellipse, but a quasi-ellipse. There is no accurate basis for ignoring this perspective distortion to treat the projection of a circle as an ellipse. In this paper, by analyzing the variation of elliptic-like short diameter length in circle imaging, the ratio of object distance d to circle radius r is taken as the parameter to measure the distortion error of circle perspective, and its maximum value is taken as the precision value of each ratio of d to r, and the accuracy variation curve of perspective distortion is given. The traditional algorithms for solving spatial plane pose based on the characteristic circular target mainly involve the application at a long distance, and the solution shows duality, which often requires complex calculation. In this paper, considering perspective distortion, we mainly study the problem of using the feature circle to solve the position and pose of the space plane in a short distance. By using three points in the projection image of a feature circle to solve the relative position and pose of the target plane and the camera, we derive the algorithm of solving the relative position and pose. In order to verify the accuracy and actual effect of the algorithm, two comparison algorithms are added. By establishing an error analysis model, error simulation and experimental verification of the three algorithms are carried out respectively. The results show that the average accuracy of the algorithm can reach 0.1° when the ratio of object distance to feature circle radius is within 18 and the prime precision is 0.1~1 pixel, which is better than the other two algorithms in this paper.
Feb. 25, 2023Vol. 52 Issue 2 0211006 (2023)
Three-channel Integrated Device for Graphene Electro-optic Modulation and Mode Division Multiplexing
Wanle PAN, Heming CHEN, and Yuchen HU
In the Internet era, the demand for transmission speed and transmission capacity of optical communication systems has increased significantly. Electro-optic modulators for optical communication systems are developing towards high speeds. Traditional silicon-based electro-optic modulators have a slow response speed. Graphene has excellent optical and electrical properties and is compatible with Complementary Metal Oxide Semiconductor (CMOS) processes. Combining graphene with silicon materials can improve the response speed of electro-optic modulators. At the same time, wide bandwidth, high extinction ratio, low insertion loss, and low energy consumption are the development trends of graphene electro-optic modulators. On the other hand, to meet the needs of optical communication systems, multiplexing technologies such as mode division multiplexing are used to increase the communication capacity. The research on a single-function optical communication device has gradually matured, and the combination of different devices to form an integrated device has become a research hotspot in recent years. The combination of electro-optic modulation and mode division multiplexing technology can improve the transmission speed and transmission capacity of optical communication systems. With the continuous advancement of science and technology, optical interconnection has attracted widespread attention due to its advantages of high speed, wide bandwidth and large capacity, and various integrated devices have emerged as the times require. Among them, the integrated device for electro-optic modulation and mode division multiplexing has shortcomings such as small transmission capacity and low transmission speed. Meanwhile, different devices are difficult to integrate due to differences in materials and structures.A three-channel integrated device for graphene electro-optic modulation and mode division multiplexing is proposed, which consists of a one-dimensional photonic crystal nanobeam cavity electro-optic modulation module covered by a single-layer graphene and nanowire waveguides mode division multiplexing module. The electro-optic modulator is composed of a one-dimensional photonic crystal nanobeam cavity, a nanowire waveguide, and a silicon plate. Combining the curved waveguide with the straight waveguide improves the coupling efficiency of the one-dimensional photonic crystal nanobeam cavity and the nanowire waveguides. A layer of Al2O3 is covered on top of the silicon plate and the one-dimensional photonic crystal nanobeam cavity, and a single-layer graphene is added on top of the Al2O3. The electrodes on graphene serve as anodes, and the electrodes on silicon plates serve as cathodes. Applying a voltage changes the chemical potential of graphene, enabling modulation of specific wavelengths. According to the principle of mode matching, the mode division multiplexer adopts an asymmetric directional coupling nanowire waveguides structure. In the phase matching region, the fundamental modes in the single-mode waveguide are converted into the higher-order modes in the multi-mode waveguide, realizing the conversion of different modes. The TE0 modes are output from the same port in the form of TE0 modes, TE1 modes and TE2 modes through the graphene electro-optic modulator and mode division multiplexer, achieving the functions of electro-optic modulation and mode division multiplexing.The performance parameters of the three-channel integrated device for graphene electro-optic modulation and mode division multiplexing are analyzed using the three-dimensional finite-difference time-domain method. During the production and preparation of the devices, the influence of process errors on the performance of the devices needs to be considered. Therefore, important structural parameters of the graphene electro-optic modulator and nanowire waveguides mode division multiplexer are selected for tolerance analysis, respectively. At the wavelength of 1 570 nm, when the voltage is 0 V, the incident light is not coupled with the one-dimensional photonic crystal nanobeam cavity and can be transmitted along the waveguide. The modulator is in the on-state. When the voltage is 3.8 V, the chemical potential of graphene changes, resulting in a change in the equivalent refractive index of the material. Therefore, the resonance wavelength of the one-dimensional photonic crystal nanobeam cavity is shifted to match the target wavelength (1 570 nm), and the incident light is coupled into the microcavity, realizing the off-state of the modulator. The insertion loss is 0.07 dB, the extinction ratio is 22.5 dB, and the 3 dB bandwidth is about 100 GHz. The modulated incident light enters the mode division multiplexer. In the phase matching region, the effective index of the single-mode waveguide and the multi-mode waveguide is equal, and the TE0 modes are converted into TE1 modes and TE2 modes. The insertion loss is less than 0.1 dB, and the channel crosstalk is less than -26 dB. The TE0 modes input from the three ports are output from the same port in different modes.In conclusion, a three-channel integrated device for graphene electro-optic modulation and mode division multiplexing is proposed. The integrated device can realize modulation and mode division multiplexing of TE0 modes, TE1 modes, and TE2 modes at the same time. The simulation results using the three-dimensional finite-difference time-domain method show that when the wavelength is 1 570 nm, the extinction ratio of the integrated device is greater than 28.3 dB, the insertion loss is less than 0.21 dB, the channel crosstalk is less than -28.6 dB, and the 3 dB bandwidth of the modulator reaches 100 GHz. The integrated device has excellent performance and has important application value in high-capacity optical communication systems.
Feb. 25, 2023Vol. 52 Issue 2 0213001 (2023)
Zhiyuan CHEN, Xingfa DONG, and Hao SUN
Surface Plasmon Polaritons(SPPs) is a kind of electromagnetic wave propagating along the interface between metal and dielectric. SPPs has the property of confining electromagnetic wave energy in half wavelength region, which can break through the diffraction limit in traditional optics, and is widely used in the design of subwavelength optical devices. In this paper, the Metal-Insulator-Metal (MIM) structure is chosen to excite SPPs. The MIM structure has a wide spectrum range, supports high group-speed modes at subwavelengths, and enables accurate optical regulation over long distances propagation. In this paper, a MIM waveguide filter based on anchor resonator is designed, the structure is simulated, and the transmission characteristics are analyzed. The simulation results show that the filtering effect at the resonance wavelength changes significantly with the changes of the arc structure angle θ, the rectangular structure height H and the arc structure radius R, and the filtering effect can be precisely controlled by adjusting the corresponding relationship between the parameters fitting data. Because SPPs is sensitive to the refractive index of the medium in the resonator, it can be used to design the refractive index sensor if the anchor resonator is filled with different mediums. In order to explore the influence of structural parameters on waveguide transmission characteristics and further optimize the filter structure, the structural parameters θ, H and R are analyzed, the transmission curve skewing caused by the change of structural parameters is discussed, and the factors leading to the spectral line red shift are expounded. Using the fitting results, high performance narrow band band-stop filters with specific wavelength can be designed. Narrow band band-stop filter is designed based on three windows of multimode fiber. The performance of the three communvication window filters is superior, and the performance is significantly improved compared with other MIM filters. When filtering one window, the normal transmission of the other two windows will not be affected. The communication window selection regulation in optical communication is realized. The sensitivity of the resonance wavelength λr to the refractive index n of the medium in the anchor resonator is studied. The simulation results show that with the increase of the refractive index n, the resonant wavelength of each mode is red shifted and the transmission curve is changed. The SPPs coupling in MIM structure is sensitive to the refractive index of the medium in anchor resonator , which can be used to make sensing equipment. Compared with the MIM structure of L-shaped resonator, the sensitivity is improved and it is more suitable for designing medium refractive index sensor. In conclusion, a filter based on anchor resonator is designed in this paper. Simulation analysis shows that the structure parameters θ, H and R of anchor resonator can affect its filtering effect, and the narrow band band-stop filtering under the communication window is realized. When the anchor resonator is filled with different mediums, the red shift of transmission spectrum is caused by the increase of refractive index, which provides a theoretical basis for the design of simple dielectric refractive index sensor by using anchor resonator.
Feb. 25, 2023Vol. 52 Issue 2 0213002 (2023)
Wanqi MA, and Zhiwei CUI
Graphene, a one-atom-thick layer of carbon atoms arranged in a hexagonal honeycomb lattice, has attracted intensive attention and extensive investigation because of its striking electronic and optical properties. Especially, the reflection coefficients of graphene are determined by the fine structure constant and intrinsic parameters, which can be tuned by altering the Fermi level. Such interesting feature makes graphene a good candidate for tuning the optical properties of structured light. On the other hand, structured light beams with vortex phase have become a research hotspot in optics and optoelectronics due to their unique physical properties and novel physical effects, as well as various promising potential applications. It is well known that the complex amplitude of a vortex beam comprises a phaseexpilφ, wherelis an integer often called the topological charge andφis the azimuthal angle. A common example of the vortex beams is the Laguerre-Gaussian (LG) beams. As a special type of electromagnetic wave, the LG vortex beams can carry energy, momentum, and angular momentum, which can be classified into Spin Angular Momentum (SAM) and Orbital Angular Momentum(OAM). As well known, energy, momentum, SAM, and OAM are the main dynamical characteristics of light and play a crucial role in understanding the light-matter interactions. There has been a recent study on the dynamical characteristics of vortex beams reflected from an air-glass interface. However, to the best of our knowledge, the local dynamical characteristics of vortex beams reflected from a graphene-substrate interface have not been reported. Compared to the conventional air-glass interface, graphene-substrate interface may reveal many other important and interesting features of the vortex beams upon reflection. Meanwhile, the dynamical characteristics of reflected vortex beams are of great importance in understanding the optical properties of graphene. In this work, we investigate the dynamical characteristics of the vortex beams impinging on graphene-substrate surfaces. Firstly, the Fresnel reflection coefficients of the graphene-substrate system in the presence of an imposed magnetic field are briefly given. The proposed expressions of the Fresnel reflection coefficients are characterized by the parameters of refraction angle, permittivity of the substrate, permittivity and permeability in vacuum, and the longitudinal, transverse and Hall conductivities. Among these parameters, the Hall conductivity, a very important parameter of the graphene-substrate system, is quantized in multiples of the fine structure constant and is described by the number of occupied Landau levels, the imposed magnetic field, the Fermi energy and the Fermi velocity. Then, a theoretical model that takes into full account the vectorial nature of electromagnetic fields is established to describe the LG vortex beams reflected from a graphene-substrate interface. In this model, starting from the expression of the vortex beam on the initial plane in the source plane and utilizing the Fourier transform, the angular spectrum amplitude of the LG vortex beam is obtained. The angular spectrums of the reflected beam are related to angular spectrums of the incident beam by means of a matrix considering boundary conditions and Taylor series expansion. Utilizing the angular spectrum representation, the horizontal and vertical components of the reflected LG vortex beam are derived. Further, introducing vector potential and using a Lorenz gauge, the explicit analytical expressions for the electric and magnetic field vectors of the reflected LG vortex beam are obtained. Based on the derived formulas, the energy, momentum, SAM, and OAM of the LG vortex beams reflected from a graphene-substrate interface are examined. The effects of the incidence angle, topological charge, Fermi energy, and magnetic field on these dynamical quantities are analyzed. The results show that the energy, momentum, SAM, and OAM density distributions change abruptly near the Brewster angle. With the increasing of topological charge, the distributions of these dynamical quantities in the transverse plane gradually go away from the center and the peak position changes greatly. When the incident angle is small, the Fermi energy and magnetic field have little effect on the energy density of the reflected vortex beam. When the incident angle is greater than a certain angle, which is 50° for the case considered, the greater the Fermi energy or the smaller the magnetic field, the greater the energy density. The momentum and OAM density distributions show a similar trend with the change of Fermi energy and magnetic field. When θi70°, the smaller the Fermi energy or the larger the magnetic field, the smaller the momentum and OAM densities. As the incident angle increases, the SAM density first decreases gradually, reaches its minimum value, and then increases rapidly. The larger the Fermi energy or the smaller the magnetic field, the larger the incident angle corresponding to the minimum value of the SAM density. These findings lay a foundation for the characterization of graphene based on the local dynamical characteristics of vortex beams, and are of great significance for promoting the theoretical and applied research on the tunable optical properties of vortex beam with graphene.
Feb. 25, 2023Vol. 52 Issue 2 0213003 (2023)
Yuxia ZHOU, Aiziheerjiang Abulikemu, Dana Jiashaner, and Taximaiti Yusufu
The high energy, high beam quality mid-infrared lasers (3~5 μm), located in the most transparent atmospheric window band, including super-resolution molecular absorption microscopy, molecular spectroscopy, remote sensing, infrared countermeasures, military, and medical treatments, have been widely investigated for a wide variety of applications. In this research, we report on a high energy, high beam quality idler-resonant mid-infrared Optical Parametric Oscillator (OPO) based on a KTiOAsO4 and pumped by a conventional Q-switched Nd:YAG laser. The all solid state Q-switched Nd:YAG laser wavelength at 1.064 μm (25 ns, 50 Hz, and 20 mJ) was used as a pump source, its nearly Gaussian spatial formed output was loosely focused a waist radius of ω0 = 500 μm to the center of the crystal. A Half-Wave Plate (HWP) and a Thin-Film Polarizer (TFP) were used to control the pump energy injected into the OPO. The idler-resonant oscillator compromised of a concave input mirror (R=500 mm) with antireflection for pump and high-reflection for signal and idler outputs, and a plane output coupler with partial reflection (R=80%) for idler output, and high transmission to the pump and signal outputs. The physical length of this nearly half-symmetric OPO cavity was fixed ~ 35 mm. The compact half symmetric-stable cavity with appropriate radius curvature of the cavity mirrors provided high efficiency near- and mid-infrared generation. The KTiOAsO4 crystal as a nonlinear parametric gain medium has high transmission in the 3~5 μm region, it was cut along its X-axis (θ=90°, φ=0°) to realize type Ⅱ Noncritical Phase Matching (NCPM) among pump, signal and idler outputs. A Ge filter is used to filter out the signal and undepleted pump beam from the idler output. We recorded the spatial form of pump beam using a conventional CCD camera, a Spiricon pyroelectric camera was also used to observe spatial forms of the signal and idler outputs. With this idler-resonant OPO, we have obtained 2.91 mJ of 1.535 μm near-infrared and 1.13 mJ of 3.468 μm mid-infrared energy outputs at the maximum pump energy of 20.2 mJ, corresponding to the slope efficiencies of 20.9% and 8.1%, respectively. In this system, although the mid infrared idler beam has a large beam divergence, when it is reflected back to the crystal by the input concave mirror with a radius of curvature of 500 mm, it is size reduced to the same size as the pump beam. This greatly increases the spatial overlapping efficiency of the pump and idler fields in a nonlinear crystal, resulting high energy, high beam quality mid-infrared output being achieved in this idler-resonant half symmetric-stable cavity. It is also worth noting that the compared to the signal-resonant OPO with the same pumping and cavity condition, in the idler-resonant OPO, idler beam with large angular dispersion allows to generate narrower spectral bandwidth and higher quality beams, it is an effective approach to improve the beam quality of the mid-infrared output radiation from OPO. We also measured the beam quality factor (M2) of the mid-infrared idler output by using the knife-edge method, resulting beam quality factors of the idler outputs were Mx2≈1.1,My2≈1.1 along the horizontal and vertical directions, respectively. These values significantly indicated that the idler-resonant OPO can generate excellent beam quality mid-infrared outputs. We believe that a high energy, high beam quality mid-infrared beam will play an important role in the variety of applications. Further selecting an appropriate nonlinear crystal and optimizing the cavity design are expected to yield improved OPO performance.
Feb. 25, 2023Vol. 52 Issue 2 0214001 (2023)
Huade ZHANG, Xilun GAO, and Yonghang SHEN
This paper studies a dual-wavelength single-frequency Er-doped fiber laser based on ring cavity, the output wavelengths are 1 570 nm and 1 548 nm. The laser combines Fabry-Perot (FP) filter and Fiber Bragg Grating (FBG) to achieve wavelength selection and preliminary stabilization. And two unpumped Er-doped fibers act as saturable absorbers to realize linewidth narrowing effect. The Laser Diode (LD) used has a maximum drive current of 700 mA, which corresponds to a maximum pumping power of 450 mW and 500 mW. When the pump power of LD1 is up to 58 mW and the diver current of LD2 is up to 138 mW, the fiber laser gets dual-wavelength output. The output power of the 1 570 nm and 1 548 nm laser generated at this time are 4.2 mW and 10.1 mW respectively. Then the pump power of LD1 and LD2 are adjusted to 104 mW and 83 mW respectively, and the output laser characteristics were studied under this condition. The output power in 1 570 nm is 10.3 mW, and the Optical Signal to Noise Ratio (OSNR) is 58 dB. The output power in 1 548 nm is 4.7 mW, and the OSNR is 55 dB. It shows that the output laser has a relatively high-quality factor and high slope efficiency. Then the stability of the output laser is studied. In order to measure the stability of the output laser of the dual-wavelength single-frequency laser, data collection is started half an hour after the laser is turned on in the experiment. Every 10 min, the spectrum is collected and the output power is recorded. The power fluctuations of the laser output in 1 570 nm and 1 548 nm are 0.01 dBm and 0.02 dBm, respectively, and the wavelength drifts of the output laser are both less than 0.01 nm. The result shows that the fiber laser can avoid the mutual interference between the two wavelengths. The output laser has good power stability and wavelength stability. The laser linewidth is the parameter of most concern for a single-frequency fiber laser. In this experiment, the linewidths of the output laser are measured by the delay non-zero self-heterodyne method based on the Mach-Zehnder interferometer and fitted with the Lorentz curve. And it can be calculated from the -20 dB bandwidth of the Lorentz curve. The linewidths of output laser in 1 570 nm and 1 548 nm measured are about 230.2 Hz and 223.6 Hz. The narrow linewidth indicates that the output laser has good single-frequency performance, and it is also an important basis for the wide application of this laser. In this study, the idea of multiplexing Fiber Fabry-Perot (FFP) filter is proposed, and the two sub-cavities do not interfere with each other by introducing circulator at both ends of FFP. It also does not introduce any expensive polarization devices, and does not need to use a polarization controller to control the polarization state of the light in the cavity. So it greatly reduces the difficulty of experimental operation and cost of the experiment. The fiber laser has a simple structure, good stability and the output laser has a narrow linewidth. It provides a technical method for realizing dual-wavelength single-frequency laser output, and it can also be used as a seed light source in high precision measurement field.
Feb. 25, 2023Vol. 52 Issue 2 0214002 (2023)
Nonlinear Frequency Correction Technology of DFB laser with High Frequency Modulation for FMCW LiDAR
Jiajun GOU, and Yonghang SHEN
With the development of autonomous driving technology, lidar technology has also been rapidly developed. As one of the Lidar systems, Frequency Modulated Continuous Wave (FMCW) calculates the distance of the target by detecting the beat signal frequency of the local light and the signal light. It can also calculate the velocity of the target by the optical Doppler effect. Compared with traditional time-of-flight lidar, FMCW lidar has many advantages. First, FMCW utilizes the principle of coherent detection to filter out the background noise effectively. The peak power of the continuous-wave is small, which is safe for human eyes. Secondly, the FMCW system can detect both the speed and distance of the target. Thirdly, when it comes to long-range detection, the FMCW system doesn't need a Single photon detector, so it can reduce the cost. However, in the field of autonomous driving, with the increase of imaging speed, the laser modulation rate has to increase, and then the nonlinearity of the laser source rises. as a result, the frequency of the beat signal varies greatly and the precision and resolution of the detection become worse. The resampling method, photoelectric negative feedback method, and pre-correction method can solve this problem. Considering the cost of the FMCW system, we use the pre- previous studies based on the auto-driving application. This paper studies the nonlinear pre-correction of DFB laser in high-speed tuning by simulation and experiments at the same time. Here, we first briefly introduce the principle of FMCW detection and analyze the influence of optical nonlinearity on detection precision. Secondly, we carry out the DFB simulation and use the Simulink toolbox of MATLAB to establish the temperature dominated tuning model of the DFB laser. Then, we assume the parameters of the DFB laser and analyze the nonlinearity distortion with the modulation rate of 100 kHz. Because the temperature hysteresis has most of the influence on optical nonlinearity, here, we do not consider the carriers' effects on frequency turning. After that, we use the iterative algorithm to correct the nonlinearity of optical frequency for many times and analyze the convergence of this algorithm. The correctness of the DFB module and iterative algorithm is verified. There are three steps in the iterative algorithm. At first, we calculate the optical frequency by STFT or Hilbert transform from the beat signal, then we calculate the differential value between two adjacent time points in the arbitrary wave generator and figure out the relative value of each point. At last, after the linear transform, we can get the real value of arbitrary wave generator at each time. Based on the simulation, we first set up an experimental platform to correct the nonlinearity of the existing DFB laser with two times of iterations. To analyze the effect of the nonlinear correction method, we detect two adjacent targets with the distance of 51.5 m and 60.5 m. The correctness of the simulation model and an iterative algorithm is verified. The results of the simulation and experiment show that the iterative method can effectively reduce the nonlinearity of the light source. With the increase of the number of iteration times, the nonlinearity improvement of the light source becomes more obvious. The nonlinearity of the lower and upper area of the optical frequency of the light source decreases from 0.050 0 and 0.020 0 to 0.004 2 and 0.002 6 respectively after two times iterations, which is consistent with the simulation. The detection results of two adjacent targets show that the 3 dB bandwidth of the detection system is effectively reduced after correction, which proves the feasibility of the iterative algorithm and modulation module.
Feb. 25, 2023Vol. 52 Issue 2 0214003 (2023)
Yi HUANG, Yue YOU, Chuanlu DENG, Chengyong HU, Lisen WANG, Xiaobei ZHANG, and Tingyun WANG
The output stability of semiconductor lasers is simultaneously affected by current and temperature, and the power and wavelength of lasers are prone to fluctuations in practice, which may even damage lasers permanent. In this paper, a high-stability Modulated Grating Y-branch (MG-Y) laser control system based on self-adaptive current compensation is proposed to address the problems of poor stability of wavelength and power as well as the complexity of the laser control system. The whole system is integrated into a printed circuit board with a small size, light weight and low power consumption. Based on the current inner loop feedback, we optimize the parameters of Fuzzy Proportional-Integral-Differential (PID) algorithm by orthogonal experiments and propose a wavelength calibration algorithm based on self-adaptive current compensation.The high-stability MG-Y laser control system is described in detail. Firstly, we introduce the system device and principle of operation. MG-Y laser is controlled by 5 currents and operates at 25℃. Left reflector current (Ileft), right reflector current (Iright), and phase section current (Iphase) are used for wavelength adjustment, while the power is adjusted by the gain section current (Igain) and the semiconductor optical amplifier current (ISOA). The control system is mainly composed of MG-Y laser, constant current source chip ADN8810, temperature control chip ADN8834, and operational amplifier chip AD8620. Secondly, in terms of power stability, a Fuzzy PID control parameter optimization algorithm based on orthogonal experiments is proposed to reduce both the overshoot of laser power and adjustment times of control system. The number of orthogonal experiments and the range of Fuzzy PID parameters need to be confirmed, then we design the orthogonal tables by screening the value range of each control parameter. The algorithm can effectively approach the optimal value of each parameter and also improve the performance of the laser control system. In the wavelength calibration part, we propose a wavelength calibration algorithm based on self-adaptive current compensation to reduce the central wavelength drift of MG-Y laser at different power levels. The algorithm takes advantage of the wavelength fine-tuning characteristics of the phase section current Iphase, by adjusting Iphase from 0 to 7.5 mA, continuous tuning of wavelength in the range of about 0.3 nm is possible. After setting a standard wavelength λ, the Iphase region with stable wavelength variation and broad coverage is selected as linear compensation data region. ISOA scans in 1 mA steps until the range of the laser output power is fully covered, while the calibrated wavelength λ* is obtained by updating Iphase according to the compensation data region so that λ* is infinitely close to λ. We establish the look-up table for ISOAand Iphase and also fit the data in the table into segments. When the laser changes its power, the system adaptively calculates the corresponding Iphase according to ISOA and sets the wavelength to the standard wavelength λ adaptively. The algorithm solves the cross-influence problem between wavelength and power caused by current inner loop feedback, and improves the output stability of the MG-Y laser.The simulation and test results of the whole laser control system are shown at last, including the laser output power stability and wavelength drift. First, the performance of Fuzzy PID parameters optimization algorithm based on orthogonal experiments is simulated, and the results show that the overshoot of the laser power is reduced from 1.528% to 0.014% after optimization, and adjustment times of control system are lowered from 21 to 17. Then, we test the performance of MG-Y laser, and the results are almost consistent with the simulation results. The power stability is measured by the optical power meter PM400 and integrating sphere probe S145C. Before power stabilization, the output power fluctuation of 3 000 samples (about 60 min) is 0.021 9 mW, and the stability is 0.269 8%. In comparison, the maximum fluctuation of laser power is 0.004 4 mW, and the stability can reach 0.060 4% in 60 min after stabilization. Finally, the wavelength stability is measured by fiber Bragg grating analyzer FBGA. The wavelength drift is 1.9 pm within 60 min. After wavelength calibration, the wavelength drift at different power levels is reduced from 23.4 pm to 2.6 pm at 1 559.68 nm. In order to verify the accuracy of the wavelength calibration method, the output wavelength of the laser is increased from 1 531 nm to 1 569 nm with a step of 1 nm, and the output spectrum of the MG-Y laser was collected by spectrometer AQ6370D. Before wavelength calibration, the wavelength fluctuated at 1 553 nm and 1 555 nm where the drifts were as high as 91 pm and 76 pm respectively. After wavelength calibration, the wavelength drifts at 1 553 nm and 1 555 nm are lowered to 2 pm and 1 pm separately. The stability of wavelength under different output power is greatly improved. The simulation and test results show that the laser control system has excellent control capability and expands the application scenarios of MG-Y laser.
Feb. 25, 2023Vol. 52 Issue 2 0214004 (2023)
Rongqing LI, Weiwei ZHOU, Yue TONG, Qinghua ZHENG, Zhaocheng LV, Wang ZHAO, Zhengrong XIA, and Fangfang LIU
The industry of white light-emitting diodes, next-generation illumination sources, has become an interesting field for their superior advantages such as energy savings, high efficiency, long operating lifetime as well as environmental friendliness. By far, the most effective white light-emitting diode is a combination of a near-ultraviolet chip and yellow-emitting phosphors. However, this type of phosphor converted white light-emitting diode has some disadvantages, it suffers from the weakness of low color rending index and high correlated color temperature because of the deficiency of red component. Thus, to overcome this problem, a large number of red phosphors, especially the trivalent Eu3+ doped phosphor, have been widely studied. Eu3+ ion is an important red activator in most of the commercial red phosphors, which can provide an efficient and narrow band emission due to characteristic 4f-4f transitions. Especially, Eu3+ ions can be used to prove the point group symmetry of the substituted site in the host. When Eu3+ ions occupy noncentrosymmetric lattice sites, Eu3+ can emit intense red emission, benefiting to improve the overall efficiency of the white light-emitting diodes. So the host can affect the intensity of emission peaks of Eu3+ ion. Tellurate exhibits excellent properties in the optical, physical, and chemical fields. Given the low phonon energy of tellurate, this material can avoid the competitive non-radiative decay for the Eu3+ ions doped. Therefore, tellurate is suitable for hosting matrices used in phosphors. We report herein, the preparation and luminescent properties of red-emitting (Y1-x)6TeO12:xEu3+ phosphor. The (Y1-x)6TeO12:xEu3+ phosphors were prepared through the high-temperature solid-state reaction at 1 200 °C for 20 h. The (Y1-x)6TeO12: xEu3+ phosphors were prepared in this way for seven different concentrations of Eu3+ (x=0.1, 0.2, 0.3, 0.4 and 0.5). The samples (Y1-x)6TeO12:xEu3+ were analyzed in detail by XRD, excitation and emission spectra, concentration quenching, thermal stability, luminescent decay curves, quantum efficiency, and color coordinates. To identify the detailed crystal structure information of (Y1-x)6TeO12:xEu3+ phosphors, the Rietveld refinement was performed using the Generalized Structure and Analysis System. The absence of an impurity phase in the present doping concentration ranges (0.1≤x≤0.5) confirmed that incorporation of Eu3+ ions did not show any notable change in Y6TeO12 phase. The refinement results were clear that the as-obtained (Y1-x)6TeO12:xEu3+ phosphors were of trigonal structure with R3(No.146) space group. Further representative particle distribution and scanning electron microscopy of the (Y0.7)6TeO12:0.3Eu3+ phosphors were carried out and the results indicate that average grain size is 4.61 μm with diameter ranging from 2 μm to 8 μm. The band gap energy Eg of (Y0.7)6TeO12:0.3Eu3+ obtained from diffuse reflectance spectra is 3.25 eV. The excitation and emission spectra of (Y1-x)6TeO12:xEu3+ phosphors show that the prepared phosphor can be excited by ultraviolet light (393 nm) or blue light (464 nm), and exhibits a strong red light emission band at 632 nm corresponding to 5D0→7F2 electric dipole transition of Eu3+ ions. The intensity ratio R of 5D0→7F2 to 5D0→7F1 transition (R=I(5D0→7F2)/I(5D0→7F1 )) is a good way to measure the symmetry of Eu3+ sites. The intensity ratio value R is calculated to be 6.338. It is higher than some reported Eu3+-doped phosphors. Usually, with the increase of magnitude of R, the ideal value of the color chromaticity is closer. The dependence of integrated intensity on Eu3+ contents reveals the optimum doping concentration is x=0.3, beyond which concentration quenching was observed. Concentration quenching for the prepared (Y1-x)6TeO12:xEu3+ phosphors confirmed that the electric dipole-electric dipole interaction was responsible for energy transfer, resulting in the concentration quenching. The integrated emission intensity of prepared phosphor (Y0.7)6TeO12:0.3Eu3+ at 150℃ is as high as 76.5% of that at ambient temperature. The thermal activation energy was obtained as 0.196 9 eV, which ensures a good thermal stability. This demonstrates its possible application in solid state lighting or optical thermometry. The decay characteristics of (Y1-x)6TeO12:xEu3+ phosphors were studied to understand the average lifetime of an activator ion in an excited state. The decay curves of the prepared (Y1-x)6TeO12:xEu3+ phosphors were monitored under 393 nm excitation wavelength and 632 nm emission wavelength. At doping concentrations of Eu3+, the luminescence lifetimes are 1 114 μs, 907 μs, 813 μs, 661 μs and 583 μs, respectively. The lifetime decreases with an increase in Eu3+ dopant concentration. This type of observation is results when the distance between the dopant Eu3+ ion decreases and this leads to nonradiative transitions. Based on the datum of emission spectrum of (Y0.7)6TeO12:0.3Eu3+, the chromaticity coordinates are determined to be (0.637 6,0.343 1), close to the National Television System Committee value (0.67,0.33). To further evaluate the potential applications of the (Y0.7)6TeO12:0.3Eu3+ phosphor, the prototype light-emitting diodes fabricated by coating the phosphors on the near-UV chips emit a bright light. The strong emission band (360~440 nm) originates from the near-UV chip and other sharp emission bands attribute to the Eu3+ 4f-4f transitions. The phosphor exhibits favorable luminescent properties, thermal stability of luminescence with good chromaticity coordinate, which have potential application in white light-emitting diodes.
Feb. 25, 2023Vol. 52 Issue 2 0216001 (2023)
Zhongwei XIAO, Minggang CHAI, Mengyu WANG, Chengfeng XIE, Zhuang GUO, Lei ZHANG, Tao WU, and Yanjun FU
Optical resonators can limit light into a tiny space, enhancing the interaction between optics and materials. Optical microcavities supporting Whispering Gallery Modes (WGMs) have their advantages with miniaturization and easy integration. The WGMs in optical microcavities achieve optical confinement along the microcavities substance based on the principle of light total internal reflection, which can significantly strengthen light-matter interactions and increase quality factors. These advantages make them have great potential for high-sensitivity sensing applications. WGM optical microcavities have been prepared with various shapes, such as spheres, bottles, disks, rings, cylinders, hemispheres, and so on. In addition, optical microcavities have been also prepared with a variety of materials such as crystals, semiconductors, polymers and glass. Among them, polymer material has the advantages of being flexible, easy to process, and plasticity. It can be easy to be integrated on the optical fiber using the surface tension of the material to install natural formation. In addition, the polymer microbottle resonator is very well integrated. The result makes it possible for packaging the polymer microbottle resonator into a highly stable structure. In this paper, optical microbottle resonators prepared by silica material and Ultraviolet-Curable Adhesive (UCA) material are studied. The preparation methods for the two kinds of microbottle resonators are demonstrated. More specifically, silica microbottle resonators were prepared by the arc discharge method, and UCA polymer microbottle resonators were fabricated by the self-assembling technology. For silica microbottle resonators, the coating layer of a single-mode optical fiber was peeled off firstly and the end of the optical fiber was melted with high voltage discharge so that it formed a microsphere under the action of surface tension. Then, another optical fiber was moved close to the microsphere, and a microbottle resonator could be formed after multiple discharges around the area between the microsphere and the fiber. For UCA microbottle resonators, the polymer material UCA NOA61 is selected because the UCA material has a good light transmission and thermo-light coefficient, and can be cured under ultraviolet light. These properties make it easy to make a microbottle resonator. The self-assembling technology is used to fabricate UCA microbottle resonators. The UCA microbottle resonator was formed through the natural process. Firstly, a tapered fiber was made with the help of the heat-and-pull technique, then an appropriate amount of NOA61 droplets were transferred to the conical transition area above the fiber cone waist. As a result, NOA61 droplets would be self-assembled on the fiber cone because of its own gravity and surface tension to form a flat elongated structure. Subsequently, the NOA61 droplets attached to the tapered fiber were solidified by an ultraviolet lamp. Finally, the samples were placed into a temperature box to heat it and solidify them completely. In the test system, a broadband source in the communication band was a light source to excite the WGMs in the microbottle resonator. The output was detected by an optical spectrum analyzer. In addition, a tapered fiber, fabricated by using the heat-and-pull technique, is chosen as a waveguide to excite WGMs. The basic properties of the two kinds of different materials microbottle resonator were analyzed by a coupled tapered optical fiber. The quality factor of the silica microbottle resonator was 4.683×10⁴ and the quality factor of the UCA microbottle resonator was 3.353×10⁴, correspondingly. The quality factors of the two kinds of microbottle resonators are very close. Temperature sensing applications based on the microbottle resonators were tested. The experimental results show that the sensitivity of the silica microbottle resonator is 11.13 pm/℃ when the temperature rises and 10.25 pm/℃ when the temperature drops. The sensitivity of the UCA microbottle resonator is 111.89 pm/℃ when the temperature rises and 102.02 pm/°C when the temperature drops. Both of them maintain a good consistency when rising and falling. In particular, the temperature sensitivity based on the UCA microbottle resonator is 10 times higher than that of the Silica microbottle resonator. The demonstrated sensors based on our microbottle resonator have the advantages of small size, low price, good plasticity and repeatability, and high sensitivity, and have potential applications in the field of temperature sensing.
Feb. 25, 2023Vol. 52 Issue 2 0206001 (2023)
Mi LI, Chengju MA, Dongming LI, Yuebin ZHANG, Shiqian BAO, Jiasheng JIN, Yao ZHANG, Qianzhen LIU, Ming LIU, and Yixin ZHANG
Relative Humidity (RH) is a physical parameter which reflects the degree of atmospheric dryness. It has wide applications in agriculture, biology, petrochemical fields, food-processing, medical treatment and Internet of Things (IOT) technology. Fiber-optic humidity sensors have attracted widespread attention from scholars due to their high-measurement accuracy, anti-electromagnetic interference, multiplexing, and distributed sensing. Especially, humidity sensors based on Fabry-Pérot Interferometers (FPIs) have been widely valued for their high repeatability, compact size and high-sensitivity. Various humidity sensors based on silica fiber-optic have been reported. In the majority of fiber-optic humidity sensors, however, the sensitivity of RH detection can be improved by coating hygroscopic materials. At the same time, because they are fragile and inflexible, silica optical fibers must be treated carefully. This increases the cost and complexity of the fabrication process. Therefore, it has great research significance and application value to study new materials and structures. In order to simplify the manufacture of sensor and obtain excellent humidity sensitivity, a composite humidity sensor based on Polymethyl Methacrylate (PMMA)-microsphere and Single-mode Fiber (SMF) is designed and fabricated. Since the Polymer Optical Fiber (POF) material is very easily heated to form a molten state. In this work, the proposed sensor can be fabricated with an electric soldering iron. When the soldering iron is heated to about 70℃, place it 1 cm below the POF to slightly attach the POF to the SMF. Slowly rotate the heating source (i. e., electric iron) to allow the POF to be evenly heated. A Fabry-Pérot (F-P) cavity is formed between PMMA-microsphere and the fiber endface. It should be noted that adjusting the heat source temperature and distance between fiber-optic and heat source, the temperature of heating can be controlled in the heating process. Compared with the alcohol lamp heating method, the electric soldering iron heating method can provide a stable heating source and high safety factor in the experiment. And then, the humidity sensing characteristics of the sensor are theoretically and experimentally studied. When the external ambient humidity rises, the volume of PMMA-microsphere can expand after absorbing moisture from the surrounding. It causes the length of the F-P microcavity to grow. Then, the peak (or valley) of the F-P reflection spectrum shift toward longer wavelengths (i.e., red-shift). Thus, the humidity sensing can be realized. To investigate the sensing performance of the designed sensor, a test system that includes a demodulator, a humidity box, and a personal computer is built. Firstly, humidity test experiments are performed when the RH increases from 30% to 80% at a step of 10%. The humidity experimental results show that the wavelength shifts approximately linearly with the humidity changing, and the linearity reaches 0.992 26. The sensitivity of the sensor is up to 173.36 pm/%RH in the humidity range of 30%~80%. Meanwhile, the sensor is placed in the temperature box (NBD-M1200-10IC, NOBODY. China). The reflection spectra of the sensor with different temperature are acquired by a spectral acquisition with the range of 1 520~1 580 nm. Experimental results demonstrate that the interference spectrum has a red-shifted about 3.15 nm in the temperature range from 35℃ to 65 ℃. The temperature sensitivity of the sensor is 105.07 pm/℃, and the linearity is 0.989 55. In the subsequent studies, we will consider cascading FBG in the proposed sensor to solve the problem that cross-sensitivity of temperature and humidity. Finally, the proposed sensor performs well, showing a superior stability and repeatability over the test cycles in the performance evaluation actualized. When relative humidity is 33%RH and 38%RH, the resonant wavelength of the reflection spectrum has a very small shift within 60 min. The maximum deviations are 0.08 nm and 0.09 nm, respectively. The results indicate that the proposed sensor can maintain good stability in a long-term working condition. In addition, the wavelength drift deviation of the three repeated experiments is small, and the sensitivities are 176.05 pm/%RH, 170.35 pm/%RH and 173.68 pm/%RH, respectively. The average humidity sensitivity of the three groups tests is 173.36 pm/%RH. The designed humidity sensor offers numerous advantages such as low cost, high-sensitivity, simple structure and easy fabrication, which has a wide application prospect in the field of biochemical, agriculture and environmental monitoring.
Feb. 25, 2023Vol. 52 Issue 2 0206002 (2023)
Xuan WEN, Shengsheng YANG, Xin GAO, Shengfei SHE, Gencheng WANG, Zhanzu FENG, Jun WANG, Hong YIN, Chaoqi HOU, and Jianfeng ZHANG
Space laser communication has the outstanding advantages of large transmission bandwidth, high transmission rate, and strong anti-interference ability, which is an important development direction of future communication technology. Since relay amplification cannot be realized in space laser communication links, a large transmission optical power is required in addition to ensuring a high modulation rate. Erbium-doped fiber amplifier achieves the amplification of 1.55 μm optical signal through the three-layer structure of erbium ions. The erbium-doped fiber is the core component of the erbium-doped fiber amplifier, and the erbium-doped fiber is a silicon fiber doped with a small number of erbium ions. In the space irradiation environment, high-energy particles impact the erbium-doped fiber, the core component of the erbium-doped fiber amplifier, resulting in a large number of carriers in the fiber, which combines with the original defects in the fiber to form new color-centered defects. The core defect leads to a dramatic increase in the loss of the fiber in the operating band, as well as a decrease in the gain performance of the erbium-doped fiber. As a rare earth element, La, like Er, is present in the interstitial positions of the quartz lattice structure. It can compete with Er ions for the interstitial positions and act as a dispersion of Er ions. It can achieve Al without affecting the maximum amount of Er ion doping. Low dose doping. La doping can disperse Er ions and suppress fluorescence quenching. There are few studies on the radiation effects of lanthanum-doped erbium-doped fibers. It is important to further understand the radiation-induced absorption mechanism of erbium-doped fibers to improve the performance of erbium-doped fibers in harsh environments. To verify the effect of La doping on the radiation resistance of erbium-doped fibers, two types of erbium-doped fibers, lanthanum-doped and non-lanthanum-doped, are selected in this paper, and the macroscopic radiation gain resistance performance and microstructural changes of the fibers are investigated. Radiation damage test study. The optical fiber was irradiated with a 60Co irradiation source at room temperature at a cumulative dose of 100 krad and a dose rate of 6.17 rad/s. The loss of the fiber was found to decrease along the wavelength direction in the range of 843~1 659 nm by electron probe tests and loss spectroscopy tests before and after irradiation, as well as online loss tests at specific wavelength points. However, the five fixed wavelength tests are not sufficient to fully express the loss variation of the fiber in each wavelength band under an irradiation environment. Offline loss tests were performed on both fibers before and after irradiation. The results showed that the increment before and after irradiation was 3 019 dB/km for S1 and 3 922 dB/km for S2. The loss increment of S2 after irradiation was significantly larger than that of S1 after irradiation. it was speculated that Al-OHC mainly caused the radiation-induced absorption. Absorption spectroscopy tests showed that La doping did not cause any change in the performance of Er ions in the fiber. the loss of the La-doped fiber at 1 200 nm was 0.030 67 dB/(km·krad), which was lower than 0.039 53 dB/(km·krad), and the gain of the La-doped fiber changed very little in the irradiated environment. The properties of the core matrix material did not change after irradiation by Raman testing, which proves that La doping does not cause changes in the glass lattice structure of the fiber. The paramagnetic defects of the fibers were further tested by electron paramagnetic resonance spectroscopy. The EPR signal intensities of the color-centered defects corresponding to Ge and Si did not differ much between the two types of light at 3 370 Gauss by fiber absorption spectroscopy and EPR tests. the peak at 3 330 Gauss is mainly due to the difference in Al content. the higher Al content in S2 produces a higher number of Al-OHC defects in the irradiated environment, and the corresponding EPR signal is stronger. the higher number of Al-OHC defects in S2 leads to a larger radiation-induced absorption in the 700~1 600 nm band, and the conclusion that the higher number of Al-OHC defects in S2 is consistent with the results of absorption spectroscopy tests before and after previous irradiation. The changes of Al-related paramagnetic defects in the fiber before and after irradiation were analyzed, indicating that the increase of Al content leads to more Al-OHC defects after irradiation, which in turn affects the gain performance of the fiber after irradiation. Further, by testing the gain performance of the two fibers before and after irradiation, it was found that the gain performance of the La-doped fiber changed less. It was verified that the loss and gain changes of the lanthanum- and erbium-doped fibers are smaller after irradiation, which indicates that lanthanum doping can improve the radiation resistance of the fibers. The doping of La can replace Al as the dispersant of Er ion to improve the radiation resistance of the fiber to a certain extent, and the doping of La does not negatively affect the gain performance of the fiber. This study can provide a reference for the radiation-hardening design of special optical fibers for subsequent space applications.
Feb. 25, 2023Vol. 52 Issue 2 0206003 (2023)
Lijuan ZHAO, Yujing WU, Zhiniu XU, and Qi LIU
Optical fiber sensors are widely valued by scholars for their simplicity of manufacture, resistance to electromagnetic interference, chemical resistance and ease of distributed measurement. Interferometric fiber optic temperature sensors use the phase change of light to achieve sensing. Sagnac interferometer based temperature sensors are widely used in the sensing field due to their high sensitivity and ease of production. The change in the phase difference can lead to a shift in the interference spectrum, which can be analyzed as a function of temperature. It is an important research direction to design special fibers in Sagnac ring to improve the sensing performance of Sagnac-type temperature sensors. The flexible structural design and air-hole fill ability of photonic crystal fibers offer the possibility to achieve excellent properties of optical fibers. In order to improve the temperature range and sensitivity of Sagnac-type temperature sensors, a photonic crystal fiber design method with high birefringence and high temperature sensitivity properties is provided. The high birefringence of the fiber facilitates the demodulation of Saganc-type temperature sensors and the high temperature sensitivity of the fiber facilitates the sensing sensitivity of Sagnac-type temperature sensors. As the optical fiber itself has limited sensitivity to temperature, it can be made to have good temperature sensitivity by filling the air holes of the fiber with temperature sensitive liquid material. The electromagnetic field model of this photonic crystal fiber is developed in COMSOL and the fiber properties are analyzed and calculated. The effect of structure parameters on the birefringence and the temperature sensitivity of the fiber is analyzed using the finite element method, and the effect of the filling method and the type of filling liquid on the temperature sensitivity of the fiber is investigated on the basis of the determined structure. The optimal structure and filling method are determined. The results show that selective filling can achieve higher temperature sensitivity than full filling, and ethanol is the most suitable filling fluid compared to other temperature sensitive liquids. Under optimal conditions, the fiber achieves a temperature sensitivity of 2.050 7×10⁻⁵/℃ and a birefringence of 5.96×10⁻² at 1 550 nm. The 2 mm length of this fiber is used in a Sagnac type temperature sensor to analyze the sensing characteristics by simulation, increasing in temperature from 0 ℃ to 75 ℃ in steps of 5 ℃ and using the trough of the transmission spectrum as a reference point to analyze the variation of the transmission spectrum with temperature. A polynomial fitting method is used to fit the wavelength and temperature in order to analyze the temperature sensitivity of the sensor, improve the accuracy of the fit and reduce the measurement error. The results show that the average sensitivity of the sensor can reach 11.28 nm/℃ and the maximum sensitivity is 15.94 nm/℃ in the range of 0~75 ℃, with an average temperature measurement error of 0.126 9 ℃. Compared to existing typical Sagnac temperature sensors, the Sagnac temperature sensor in this paper achieves a higher temperature sensitivity with a minimized fiber length, a larger temperature range and higher measurement accuracy. Therefore, the sensor has a promising application in the field of temperature measurement.
Feb. 25, 2023Vol. 52 Issue 2 0206004 (2023)
Taifei ZHAO, Jiatong YAO, Yang LIU, and Borui ZHENG
Due to the complex and ever-changing battlefield environment, fixed communication equipment is often damaged in combat zones, resulting in a massive breakdown of communication and thus affecting combat effectiveness. Using the advantages of the UAV's strong survivability and wide coverage, it is possible to carry communication equipment as an UAV aerial base station to provide communication services to ground users. The single UAV base station has disadvantages such as weak resistance to destruction and limited coverage and power, so the choice is made for multiple UAV base stations to work together to provide communication services to a large area and multiple users. In complex military environments such as strong electromagnetic interference and “electromagnetic silence”??, traditional wireless communication methods have poor confidentiality and are susceptible to interference and eavesdropping by the enemy, while wired communication requires cables to be laid in advance and is not easily used in complex, dynamic and changing military environments. Wireless ultraviolet communication, based on its all-round and terrain adaptable working characteristics, overcomes the shortcomings of wired communication requiring cable laying, as well as the strong absorption of ultraviolet light by the atmosphere, making ultraviolet communication with a low location detection rate performance, compared to wireless communication methods such as radio frequency communication and infrared light communication has better area covert transmission. It can be used as an independent network unit to access the modern communication network architecture, and can also be interconnected with wireless and wired communication networks to achieve resource information sharing. By establishing an airborne wireless UV non-direct vision communication model with the UAV coverage model, the coverage of the UAV is maximized while satisfying the premise of path loss. In order to ensure the quality of communication services for ground users, the received power of ground users is required to be greater than a certain threshold value, when the transmit power is certain, that is, the path loss when ground users communicate with the UAV must be less than the maximum acceptable path loss to ensure communication, the maximum acceptable path loss corresponds to a maximum coverage radius, and the path loss of all ground users communicating with the UAV in the radius area All of the ground users within this radius have a path loss less than this threshold. At the initial stage of deployment, the UAVs are randomly segmented over the target area, with the UAV projection on the ground as the centre and the coverage area as the radius, and users within its radius are considered to be covered and vice versa. By randomly deploying drones, a broad coverage blind spot, as well as coverage overlap, is created, resulting in a waste of resources for drones. Therefore how to provide communication coverage for ground users by optimizing the location of UAVs to meet requirements such as path loss and maximum coverage is an important problem faced when using UAVs as aerial base stations to build wireless communication networks. In solving the UAV deployment location optimization problem, this paper proposes a virtual force algorithm based on the relative distance to determine the positive and negative forces acting on the UAV based on the relative distance. The algorithm introduces three relative virtual forces, namely the relative virtual force between UAVs, the relative virtual force between UAVs and uncovered users, and the relative virtual force between UAVs and obstacles, and controls the UAV through the action of virtual forces UAV movement to the optimal position. This paper simulates the covert communication coverage of the UAV to ground users based on wireless ultraviolet light transmission technology, and analyses the performance of the algorithm under different scenarios as well as the effect of the ultraviolet light communication angle on the coverage of the algorithm. The simulation results show that the proposed algorithm effectively reduces the invalid coverage and overlapping coverage, and improves the coverage rate by 18.33%, 3.15% and 1.83% compared with the random deployment algorithm, greedy virtual force algorithm and mobile deployment algorithm, respectively, and the average distance travelled by the UAV in the proposed algorithm is the smallest, which indicates that the algorithm in this paper is more energy-saving compared with other algorithms. By choosing the appropriate reception elevation angle, transmission elevation angle, divergence angle and reception field of view angle, the coverage of the UAV can be effectively improved, and the service time can be extended by reducing energy consumption to meet the communication needs of the UAV and the user in a complex electromagnetic environment.
Feb. 25, 2023Vol. 52 Issue 2 0206005 (2023)
Jianqiu MA, Zhishan GAO, Qun YUAN, Zhenyan GUO, Yifeng SUN, Lihua LEI, and Lin ZHAO
Linewidth is one of the critical indicators affecting the performance of microstructured devices. With the continuous development of the micro-nano processing level, the current microstructure is becoming more and more refined, and the measurement precision requirements of its geometric critical dimensions are also increased. For example, a line or groove structure's critical geometric dimensions mainly include depth, linewidth, and sidewall angle. The linewidth described in this paper is the minimum geometric feature size at the top of the trench structure with a step edge. This study focuses on the measurement method of line width, whose scale covers the range of several microns to tens of microns. Optical microscopy is the mainstream method for fast and non-destructive measurement of microstructure linewidth, but the imaging diffraction limits the measurement precision. This paper analyses the edge positioning error that limits the measurement precision starting from the microscopic imaging's theoretical model of linewidth measurement. The image point of the sample step edge is superimposed by its own diffraction spread and the diffraction spread of nearby points, which affects the positioning of the step edge point. Suppose the light intensity function of the image point affected by the diffraction effect on the step edge can be differentiated; in that case, the influence of other points near the step can be removed, and the light intensity response of the step edge point or a very small range on the image surface can be enhanced, so that the precise positioning of the edge can be achieved. Therefore, this paper explores the sensitive detection principle of light intensity differential induced by step edge diffraction to achieve high-precision detection of groove linewidth. On this basis, an attempt is made to propose a linewidth microscopic measurement method based on translation difference. A high-precision piezoelectric ceramic micro-displacement platform is added to the traditional microscopic imaging method, the sample is fixed on the displacement platform and displaced along the line width direction, and two micrographs before and after translation are collected in one step. Subtract the micrographs to obtain a differential image, and use the differential pulse to solve the problem of step edge localization. Two differential images are obtained by two-step translation, the relationship between the differential and the displacement is established, and the sub-pixels are calibrated with high-precision displacement. Therefore, we can take advantage of the high resolution of differential pulse positioning to improve linewidth measurement precision. Besides, the platform's high resolution ensures the measurement results' accuracy by calibrating the sub-pixels with micro-displacement. In particular, we customize a standard groove template with a linewidth of 30.00 μm as the test sample. The average value of the measurement is 30.03 μm, and the standard deviation is 0.005 μm after ten measurements. The uncertainty of this method has been analyzed, and the final synthesis Uncertainty is 0.37% (k=1). The results show that with the help of the nano-precision micro-displacement mechanism and the diffracted light intensity differentiation of the groove step edge, the limit of the optical diffraction resolution of the microscope can be broken, and the accuracy of the non-destructive detection of the groove line width by the direct imaging method of the optical microscope can be significantly improved. On the other hand, although this paper takes a standard sample with a single groove as an example to verify the feasibility of the method, from the measurement principle and layout, as long as the numerical aperture of the microscope objective is sufficient to resolve the groove, the translation difference method can measure the linewidth of all grooves in the field of view of the microscope objective at one time and has high detection efficiency.
Feb. 25, 2023Vol. 52 Issue 2 0212001 (2023)
Lingli XIE, Xiaokai WANG, Xinghui HAN, Yan ZENG, and Shutong DAI
On account of the characteristics of high bearing capacity and lightweight, the ribbed components are widely applied to aerospace and national defense equipment, such as the overall wall of the fuselage of the space shuttle, the overall wall of the fuel tank of the launch vehicle, the missile cabin, and the conical shell body. The manufacturing methods of large-scale ribbed components usually include milling, welding, and spinning. Therefore, various types of defects are also brought during the manufacturing process, such as cracks and scratches. During the milling forming process, pores and inclusions in the welding, fractures, and rib penetration at the rounded corners during the spinning, which will seriously reduce the bearing capacity and fatigue strength of the components thus affecting the service performance and safety of related equipment.To solve the problems of rapid detection and precise identification of multi-type defects in the R-zone of ribbed components, this paper innovatively proposed a method for the detection, classification, and identification of defects in the R-zone of ribbed components based on distributed laser ultrasonics. Combining the characteristic signals of multiple detection receiving points, this method realizes the classification, identification with quantitative detection of the defects in the R-zone of the ribbed component; and it was carried out that the modeling simulation and experimental verification of the laser ultrasonic detection of the R-zone of the ribbed components.Firstly, finite element models were established to study the propagation law of laser ultrasound in ribbed components and the interaction mechanism between laser ultrasound and defects such as surface cracks and near-surface blowholes in the R-zone; then based on the above-mentioned propagation law and the structural characteristics of the ribbed member, two detection receiving points were set at both sides of the R-zone of the ribbed component. According to the characteristic waveform propagation path, the reflected defect echo RR and RS wave received at the receiving point 1, the diffracted wave RL, RS and SCS wave received at the receiving point 2 could classify and identify the defects in the R-zone of ribbed components based on the reflection and diffraction principle, and the quantitative calculation model of defect location was established through the sound path, sound velocity and the geometric size of the rib. To sum up, the distributed receiving can realize the rapid detection, classification, recognition, positioning, and quantitative detection of defects in the R-zone of ribbed components.Then, 6061 aluminum alloy ribbed component samples were designed and manufactured with typical artificial defects (the angle between crack and fillet is 43°, the crack depth is 1.15 mm, and the angle between blowhole and fillet is 43°, the distance between the blowhole center and the center of the rounded corner is 7.80 mm, the blowhole diameter is 1.20 mm) for distributed laser ultrasonic testing experiment, and obtained the time domain waveforms of two receiving points. When testing the component with crack defect, the receiving point 1 can receive SP-wave, R-wave and RR-wave, and receiving point 2 can receive RS-wave. But it cannot receive a high amplitude R-wave because of the crack hindering the propagation of the R-wave. When detecting the component with porosity defect, receiving point 1 can obviously receive sP-wave, R-wave and RS-wave, and receiving point 2 can also receive RL-wave, SCS-wave and high amplitude R-wave, which was consistent with the simulation results, thus verifying the feasibility of distributed laser ultrasonic testing method.At the same time, the B-scan images with different defects were obtained through experiments, then the experiment was repeated to get three groups of data in total. The arrival time of characteristic waveforms of different defects was obtained from groups of data taken from the scan position x=0 mm in the three B-scan images. The positioning angle of two defects, the crack depth, the distance between the blowhole center and the center of the rounded corner, and blowhole diameter were obtained by the positioning quantitative calculation model, and the positioning quantitative calculation of the three measurement points was calculated on average. The relative error of crack positioning and crack quantification was 3.2% and 7.8%, respectively, and the relative error of blowhole positioning (including the relative angle of the blowhole and the distance from the blowhole to the center of the fillet) was 4.1% and 1.1%, and the relative error of blowhole quantification was 11.7%. Thus, the positioning and quantitative detection of defects in R-zone of ribbed components were realized. In addition, the relative error of blowhole quantification was too large for two reasons. On the one hand, it was because the speed of SCS-wave could only be approximated as the speed of S-wave when calculating the quantitative error, but in fact the two were slightly different, on the other hand, because the inner convex surface of the rounded corners made the sound waves diverge, which had a certain influence on the reception of the diffracted wave signals.In conclusion, this study can provide a new idea for rapid detection and classification of manufacturing defects of ribbed components.
Feb. 25, 2023Vol. 52 Issue 2 0212002 (2023)
Chang LIU, Hubing DU, Leijie FENG, Xingxu YAN, and Gaopeng ZHANG
The temporal phase shifting technique is a powerful tool that is used in numerous industrial, research and development applications, such as range acquisition, industrial inspection, reverse engineering, and object recognition. However, the accuracy of temporal phase shifting technique is limited by the phase-shifting uncertainties resulting from the imperfect conditions in the real testing environments, such as the miscalibration. So, there is a strict requirement on the precision of the phase shifter. To remove this requirement, there have been reported works about phase reconstruction with only two frames. Two-shot phase reconstruction, i.e., the recovery of a complex-valued signal from two intensity patterns that are nearly identical apart from a random and unknown phase shift between them, which can reconstruct the phase without local sign ambiguity using the minimum number of interferograms with higher measurement accuracy than the single-frame algorithm, is especially prevalent in imperfect testing conditions where requires reducing the detrimental effects on the measurements from mechanical vibrations, ambient air turbulence, and temperature changes. In the implementation of the technique, the filtering procedure of the fringe normalization, background removal, or noise reduction must be applied to the two arbitrarily phase shifted patterns before the phase demodulation. However, due to certain experimental imperfections of any physical system that are hard to model accurately, we cannot assume any particular behavior for the intensity pattern in a general case. In this case, the two-shot phase reconstruction technique may have an unsatisfactory filtering effect during the phase demodulation. Recently, much special attention is paid to the algorithm that does not require pre-filtering. In this work, we proposed a novel two-shot phase reconstruction method that can bypass the pre-filtering with the help of the least squares iterative phase shifting algorithm. In our method, a rough estimation of the phase shift is obtained by correlation operation of two background removed fringe patterns under the approximate orthogonal characteristic of a trigonometric function. Thus, we can compute the phase using two frame phase shifting algorithm. Then, using this initial phase shift estimation, both the phase shift and background light improved by solving other N linear equation systems in a frame-wise manner. Further, the two background removed fringe patterns are updated. Iterating this process, it eventually settles down in the searched phase. In essence, this method is a two-frame version of the AIA algorithm except for the use of background terms, which is usuallydiscarded in the standard AIA algorithm. To reduce the effect of spatially varying background intensity and modulation amplitude, we divide the captured interferogram space into several blocks (for example, 150×150). if the blocks are sufficiently small, we may consider that the background intensity and modulation amplitude in each block do not have pixel-to-pixel variation and can be assumed as constants. Then we select one block, and the necessary parameters are estimated by the phases and the intensity in this block. Our novel approach consists of the following steps: 1) Estimate an initial phase step by s correlation operation of two background removed fringe patterns, 2) Compute the measurement phase using the initial phase step, and 3) Use the obtained intermediate parameters for continually updating both the two filtered fringe patterns and the phase step until the accurate phase is reconstructed through the searched phase shift. To demonstrate, the proposed method is compared with other state-of-the-art two-frame random phase-shifting algorithms: CV and PCA&LSI, for they can accomplish the phase reconstruction universally and accurately. We choose the typical scenarios, namely open-fringe pattern, and closed-fringe pattern as our test case. Both simulations and measurement experiment results obtained using the proposed method indicate that it is a simple, albeit robust solution for phase extraction from two-frame unknown phase shift fringe pattern.
Feb. 25, 2023Vol. 52 Issue 2 0212003 (2023)
Sanfeng HAO, Jian ZHANG, and Jianfeng YANG
Compared with traditional spherical surfaces, aspheric surfaces own more degrees of freedom, which is beneficial to the light weight, integration and aberration correction of an optical system. In recent years, with the development and progress of high-precision optical manufacturing technology, aspheric surfaces have been widely used in the optical systems design in aerospace, space telephoto and other fields. Meanwhile, the testing of aspheric surfaces, especially high-order aspheric surfaces, is more difficult and is a prerequisite for guiding optical deterministic manufacturing. That is to say, it is not only necessary to realize the testing of aspheric surfaces, but also to be able to give correct guidance for manufacturing based on the testing results. At present, aspheric surfaces testing can be achieved with null lens compensator, but for high-order aspheric surfaces with a small F-number, traditional two-piece lens compensator cannot meet the testing accuracy requirements, and the structure of null lens needs to be further optimized. What's more, the shape of interfermetric image obtained with null lens compensator is inconsistent with that of the mirror under test, that is, mapping distortion. It is worth noting that deterministic manufacturing techniques such as Computer-Controlled Optical Surfacing (CCOS), Magnetorheological Finishing (MRF), and Ion Beam Figuring (IBF) all require accurate guidance and feedback from interfermetric image, position errors caused by mapping distortion will seriously affect manufacturing efficiency, and even lead to a failure. Therefore, the mapping distortion correction is crucial for the interferometric image to correctly guide deterministic manufacturing. In this paper, not only the design method of high-order aspheric null lens compensator is discussed, but also the mapping distortion correction of interferometric image. Firstly, based on third-order aberration theory and PW method, the initial structure calculation formula of the high-order aspheric three-piece lens compensator is deduced, and the above formula is programmed, which facilitates the null lens compensator design. For an 8th-order even-order aspheric surface with an effective diameter of 314 mm and F/0.78, the initial structural parameters of null lens compensator were obtained by using the calculation formula. Then, it is substituted into the optical design software for scaling and optimization, and finally the design result with PV=0.0096λ, RMS=0.0012λ (λ=632.8 nm) can be obtained, which can meet the high-precision testing requirements. Furthermore, a correction method is proposed to solve the problem of mapping distortion in the interferometric image obtained with null lens compensator. This method combines imaging distortion of null lens and an algorithm for solving null distortion point coordinates, which can conveniently realize the rapid mapping distortion correction. On the one hand, null lens imaging system with high-order aspheric surfaces as object can be obtained by reversing the testing light path, and the imaging distortion is consistent with the mapping distortion, which can be used for mapping distortion correction. On the other hand, since the null distortion point is also the geometric center of the interfermetric image, the least squares method is used to fit the circle boundary in combination with the boundary data of interfermetric image, and then the null distortion point can be obtained. Then, The correction method is used to correct the mapping distortion of the interferometeric image obtained by null lens compensator. After 6 times of magnetorheological finishing based correction results, the surface RMS reduced from 0.270λ to 0.019λ, which verifies the validity and efficiency of this correction method.
Feb. 25, 2023Vol. 52 Issue 2 0212004 (2023)
© Copyright 2018-2021 | Chinese Laser Press.
All Rights Reserved 沪ICP备15018463号-20