


 View fulltext

2023
Volume: 52 Issue 1
24 Article(s)

Jun YANG, Jianheng HUANG, Yuzheng SHAN, Yaohu LEI, Fangke ZONG, and Jinchuan GUO
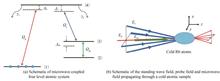
In the past few decades, there are five major methods that can successfully perform X-ray phase-contrast imaging, namely two-beam interferometer, crystal diffraction enhancement imaging, propagation-based imaging, grating-based X-ray interferometer and the coded aperture X-ray phase contrast imaging. Among the above five methods mentioned above, grating-based X-ray interferometer has drawn a lot of attention and made much progress due to its compatibility with X-ray source with large spot size and good image quality. In a grating-based X-ray interferometer, absorption, phase-contrast and dark-field signals can be simultaneously obtained from the same data. Generally speaking, the phase-contrast signal is created by the X-ray refraction after passing through the object, which is more advantageous than the absorption signal for soft materials. Moreover, the dark-field signal, which is regarded as small-angle-scattering information, is sensitive to the density fluctuations onmicrometre length scales. However, grating-based X-ray interferometer is limited by the small size of the absorption grating in clinic applications. It is a great challenge to fabricate the absorption grating over large area and high aspect ratio. To a certain extent, X-ray interferometer based on inverse geometry grating can remove the limitation of absorption grating on the field of view. It interchanges the position of the X-ray source and the detector and doesn′t need any analyzer grating. But its high system magnification can also reduce the field of view. Therefore, a dual phase grating interferometer is proposed to address the above difficulties. It consists of two phase gratings and can generate fringes with periods of tens to hundreds of microns. Due to the lack of absorption grating, the dual phase grating interferometer can realize X-ray phase-contrast and dark-field imaging with large field of view and high dose utilization. In the dual phase grating interferometer, the Lau condition affects the fringe visibility, which in turn affects the signal-to-noise ratio of the system. For the Lau condition of the dual phase grating interferometer, some researchers made use of the intuitive geometric relationship to calculate the transverse fringe shifts caused by the transverse shifts of the X-ray source on two phase gratings respectively, and then subtracted the two fringe shifts from each other to obtain the Lau condition. They thought that for the dual π-phase grating interferometer, the source grating period under the polychromatic illumination was twice as long as that under the monochromatic illumination. However, their theory could not explain the following questions. For the Talbot-Lau interferometer, the period of source grating is the same whether it is illuminated by the monochromatic X-rays or polychromatic X-rays. For the sensitivity of the dual phase grating interferometer, most researchers directly derived it from the sensitivity model of the Talbot-Lau interferometer. The sensitivity of the dual phase grating interferometer is valid when the system is arranged as two cascaded Talbot-Lau interferometers. However, there are still some problems to be addressed in the sensitivity of the dual phase grating interferometer, such as unreasonable physical models and incomplete theoretical results, which restrict the improvement of system sensitivity. Therefore, a new sensitivity model for the dual phase grating interferometer is proposed here: the transverse fringe shift produced by the object is equal to that produced by the position change of the X-ray source. The new sensitivity model converts the X-ray refraction by an object into the position change of the X-ray source. In addition, another key step in calculating the sensitivity of the interferometer is to use the Lau condition to connect the position change of the X-ray source with the transverse shift of the fringe. Using the new sensitivity model above, the sensitivity of the dual phase grating interferometer and Talbot-Lau interferometer are successfully obtained, which provides theoretical support for the optimization of the dual phase grating interferometer.
Jan. 25, 2023Vol. 52 Issue 1 0105001 (2023)
Hongming XIA, Duo ZHANG, Yaqian LI, Zhaoyu SUN, and Mei WANG
Due to the limitations of traditional gratings, researchers began to look for new methods to fabricate gratings. In recent years, some interesting physical phenomena such as coherent population trapping, electromagnetically induced transparency, spontaneously generated coherence have attracted great attenton. If the standing wave field in the form of spatial modulation is replaced by the traveling wave field in the electromagnetically induced transparency effect, alternating high transmission regions and high absorption regions can be generated. The incident probe light diffracts after passing through the standing wave region, forming a grating-like structure which is named electromagnetically induced grating. Compared with traditional gratings, electromagnetically induced grating shows many advantages. For example, the amplitude and phase can be modulated simultaneously, and the grating constant, diffraction energy and diffraction order can be changed by adjusting the wavelength of the standing wave field, the intensity and detuning of the incident light fields. The concept of electromagnetically induced grating is first proposed theoretically in the three-level Λ-type atomic system. Subsequently, researchers experimentally observe and study the electromagnetically induced grating in cold atomic and hot atomic system successively. In order to improve the diffraction efficiency, more schemes have been proposed to realize electromagnetic induction grating in different atomic system, semiconductor quantum well and quantum dot system, and Rydberg atomic system, etc. In recent years, the research about electromagnetically induced grating has gradually developed to two-dimensional space. By using two orthogonal standing wave fields, two-dimensional electromagnetically induced cross grating can be realized in a tripod four-level atomic system. And some other researchers have then studied the electromagnetically induced grating in different two-level, three-level and four-level atomic system. In addition, P-T symmetry, Raman interaction, azimuth modulation of vortex field also are used to achieve high-efficiency two-dimensional electromagnetically induced grating. Due to its many advantages, electromagnetically induced grating has been applied in the research fields of photon and optical quantum devices such as all-optical switching and routing, coherent induced photonic band gap, quantum Talbot effect, beam splitting. In this paper, we propose a scheme to study two-dimensional electromagnetically induced grating in a four-level atomic system with double dark states. In our scheme, the microwave field is used to couple two dipole forbidden low-energy levels, and a weak probe field and a two-dimensional standing wave coupling field with periodic spatial intensity are used to drive the transitions between other energy levels, respectively. The Fraunhofer diffraction pattern and diffraction efficiency of the weak probe field are analyzed in the presence or absence of the microwave field. The results show that the existence of microwave field can weaken the zero order diffraction intensity, and significantly increase the first-order diffraction intensity and efficiency. To explain the physical mechanism more clearly, the plot of the refractive index part and the absorption part of the probe field polarizability with the probe detuning is given and disscused in the presence of microwave field. Then, the amplitude modulation and phase modulation are displayed, and the effect of corresponding modulation on Fraunhofer diffraction diagram is analyzed. The results show that the existence of microwave field has great influence on phase modulation. The incident light of the probe field diffracts toward higher order. High-order diffraction is mainly accomplished by phase modulation, but the diffraction energy of the grating controlled by amplitude modulation . At the same time, we discuss the influence of other system parameters, such as the detuning of the probe field, the intensity of the control field and the interaction length on diffraction pattern and diffraction efficiency of the grating in the presence of microwave field. The results show that, by properly tuning the system parameters, the two-dimensional electromagnetically induced grating with high diffraction efficiency can be realized in the system we studied. The scheme proposed can be applied to all-optical beam splitting and optical switching, which is potentially useful for research in optical information processing and optical network communication.
Jan. 25, 2023Vol. 52 Issue 1 0105002 (2023)
Qinglin AI, Junrui ZHANG, and Feiqing WU
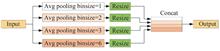
There are a lot of unstructured road scenes in the actual road driving, large-scale engineering work and field work of robots. Compared with the structured road, the unstructured road has the characteristics of small color difference between the road and its surroundings, large variety of road target species and complex information. Traditional methods for detecting unstructured road areas have problems such as low detection accuracy, poor real-time performance and poor detection effect for small targets. Small target obstacles and pedestrians will seriously interfere with the detection of viable road areas. Small target has low resolution and little information in the image, which leads to poor feature characterization capability. The dominance of large categories also easily leads to the neglect of small target categories. To solve the above problems, we construct a lightweight real-time semantics segmentation network of AF-ICNet based on small target category attention mechanism and feature fusion. Firstly, the pyramid pooling module structure in ICNet is replaced by atrous spatial pyramid pooling, which combines feature receptive fields of different scales to reduce the pooling effect, and finally enhances the network′s ability to perceive the global image. On this basis, we embedded coordinate attention mechanism in improved ICNet model. We establish channel information and spatial location information to enhance the network's ability to extract the small target category semantics features of unstructured roads. This method of fusing channels and spatial attention is different from both SE-Net and CBAM. Finally, in view of the imbalance of category distribution in unstructured road scenes, we design a Weighted Cross-Entropy loss function to improve the network's attention to small target categories. The weight of the branch can effectively improve the attention of the network to images of different resolutions. The weight of the category can effectively improve the network's attention to small target categories. In order to verify the validity of the super parameters, we carried out the parameter sensitivity analysis experiment, and the value range of the parameters is determined. Based on the above improvements, we designed AF-ICNet semantic segmentation network. In order to verify the improvement of the model, we use the AF-ICNet model to train Cityscapes and IDD datasets. After training, 19 categories are segmented in the Cityscapes dataset, the final MIoU of AF-ICNet reaches 71.5%, and the final PixAcc reaches 81.3%. 26 categories are segmented in the IDD dataset and the final MIoU of AF-ICNet reaches 62.5%, and the final PixAcc reaches 89.8%. To verify the effectiveness of each improvement point, we perform the ablation experiments. We divided into four groups for the experiment. The four groups of experiments are the original network, the network with Weighted Cross-Entropy, the network with ASPP and Weighted Cross-Entropy, and AF-ICNet with CA attention mechanism. The experimental results show that each improvement point of AF-ICNet can effectively improve the network segmentation accuracy on the basis of guaranteeing the real-time performance of the network. In order to further verify the effectiveness of the improved method in practical application, we establish an experimental testing system for a field test, and use training model of the IDD dataset to test. In the real scene test experiment, AF-ICNet effectively segmented the road area and the surrounding objects, and for the manually placed small target objects, the segmentation edge of AF-ICNet is more accurate. In terms of test speed, AF-ICNet achieves a segmentation speed of 17FPS on a 1 280×960 image, and a segmentation speed of 31FPS on a 1 280×720 image, which fully meets the real-time requirements of road segmentation. The test results show that AF-ICNet effectively improves the network segmentation effect. In the case of real-time performance, the segmentation accuracy of small target categories is improved.
Jan. 25, 2023Vol. 52 Issue 1 0110001 (2023)
Ying SUN, Zhiqiang HOU, Chen YANG, Sugang MA, and Jiulun FAN
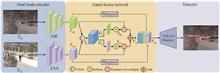
In object detection, unimodal images related to the detection task are mainly used as training data, but it is difficult to detect targets in actual complex scenes using only unimodal images. Many researchers have proposed methods using multimodal images as training data to address the above problems. Multimodal images, such as Infrared (IR) images and Visible (VS) images, have complementary advantages. The advantage of IR images is that they rely on the heat source generated by targets and are not affected by lighting conditions but cannot capture the detailed information of targets. The advantage of VS image is that it can clearly capture the texture features and details of targets, but it is easily affected by lighting conditions. Therefore, for the object detection problem of IR and VS image fusion, an object detection algorithm based on the dual-modal fusion network is proposed. The algorithm can input IR images and VS images at the same time. Due to the imaging differences and their respective characteristics of IE images and VS images, different networks are used to extract features. Among them, IR images use the designed infrared encoder, Encoder-Infrared (EIR), and the SimAM module is introduced into the EIR to extract different local spatial information in the channel. This module optimizes an energy function based on neuroscience theory, thereby calculating the importance of each neuron and extracting spatial feature information by weighting. VS images adopt the designed visible encoder, Encoder-Visible (EVS), and introduce the Coordinate Attention (CoordAtt) mechanism into the EVS to extract cross-channel information, obtain orientation and position information, and enable the model to more accurately extract feature information of the target. To obtain spatial feature information with precise location information, the global average pooling (AvgPool) operation is used to extract features from both vertical and horizontal directions, respectively, and aggregate features from both vertical and horizontal spatial directions. The precise location information encodes the channel relationship. Finally, this paper proposes a gated fusion network with the help of Multi-gate Mixture of Experts (MMoE) in multi-task learning. A gated fusion network is used to learn unimodal features and contributions to detection. According to MMoE, the extraction of infrared image features and the extraction of visible light features are regarded as two tasks, that is, EIR and EVS are expert modules, and EIR is only used to extract features of IR images. Similarly, EVS is only used to extract features of VS images. The results of the two expert modules are integrated to achieve the purpose of specialization in the surgical industry. In the process of fusion, it is necessary to have a certain bias for a certain task, that is, the output results of the expert modules EIR and EVS are mapped to the probability. The proposed gated fusion network adapts the weight distribution of the two-way features to achieve cross-modal feature fusion. This paper uses two datasets to evaluate the algorithm, the first is the public KAIST pedestrian dataset, and the second is the self-built GIR dataset. Each image in the KAIST pedestrian dataset contains both VS and IR versions. The dataset captures routine traffic scenes, including campus, street, and countryside during daytime and nighttime. The GIR dataset is general targets dataset created in this paper. These images are from the RGBT210 dataset established by Chenglong Li's team, and each image contains two versions of the VS image and the IR image. Among them, all types of images share a set of labels. On the KAIST pedestrian dataset, we validate our algorithm on two models of YOLOv5. Compared with YOLOv5-n, the detection accuracy of the proposed algorithm is improved by 15.1% and 2.8% respectively for VS and IR images; compared with YOLOv5-s, the detection accuracy is improved by 14.7% and 3%; at the same time, the detection speed reaches 117.6 FPS and 102 FPS respectively on two different models. On the self-built GIR dataset, compared with YOLOv5-n, the detection accuracy of the proposed algorithm is improved by 14.3% and 1% respectively for IR and VS images; compared with YOLOv5-s, the detection accuracy is improved by 13.7% and 0.6%. At the same time, the detection speed reaches 101 FPS and 85.5 FPS respectively on two different models. The algorithm in this paper is compared with the current classical object detection algorithms, and the effect has obvious advantages. In addition, the proposed algorithm can also perform object detection on separately input VS or IR images, and the detection performance is significantly improved compared with the baseline algorithm. In the process of visualization, the algorithm in this paper can flexibly display the visualization results of detection on VS images or IR images.
Jan. 25, 2023Vol. 52 Issue 1 0110002 (2023)
Haoran LI, Wei XIONG, Yaqi CUI, Xiangqi GU, and Pingliang XU
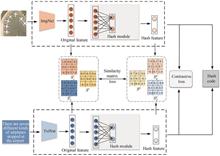
With the continuous enrichment of satellite-borne and airborne remote sensing detection methods, the types of remote sensing data obtained are more diverse and the data scale is constantly expanding, which strongly drives the development of cross-modal correlation methods in the field of remote sensing. Cross-modal retrieval task refers to retrieving relevant data from other modes according to the query samples in a given mode. Multi-modal data usually includes images, text, video, audio, etc. Remote sensing image and text are important components of intelligence information, and the establishment of correlation between remote sensing image and text information is of great significance to the effective use of multi-source intelligence data. The mutual verification of the two is helpful to further improve the reliability of acquiring intelligence information. Remote sensing data usually contains rich information, but getting serviceable knowledge from the massive data effectively can be very challenging. With the continuous development of deep learning, deep neural networks are more and more widely used to obtain feature representations of different modes. Mapping cross-modal information into the same feature space is helpful to solve the “heterogeneous gap” problem among different modalities. Hashing method achieves fast retrieval speed and high efficiency. With the growth of remote sensing data type and scale, it has attracted more and more attention in the field of remote sensing cross modal. However, the existing unsupervised deep hashing cross-mode methods still have some problems. Usually, the similarity information across modes is learned separately, and without the assistance of label information, the model cannot obtain the semantic correlation between different modes correctly and effectively. In addition, most deep hash methods generate hash codes directly from the original features obtained by deep neural networks, and the generated hash features are difficult to obtain satisfactory discrimination information. In general, data from different modalities could give people a comprehensive description of the same object. As a result of the applicability and flexibility of cross modal retrieval, multiple methods of it have been widely explored in the computer vision community. In recent years, some studies have been conducted on cross-modal retrieval in the field of remote sensing. But most of the existing cross-modal correlation methods in remote sensing field are based on real value representation, which has problems of slow correlation retrieval speed and large memory consumption. However, the hash coding method can effectively improve the efficiency of association retrieval and is more suitable for large-scale and rapid association retrieval tasks. However, some semantic information will be lost during the transformation of the hash code. Therefore, this paper proposes an unsupervised hash-cross-modal association method for remote sensing images assisted by a similarity matrix. The constructed original feature and the similarity matrix of the hash feature are used to integrate the semantic correlation information between different modes, so as to preserve the semantic correlation within modes and between different modes as much as possible, and reduce the loss of feature information when the original feature is converted to hash code through semantic alignment between similarity matrices. The loss function uses the weighted sum of the similarity matrix loss and contrast loss. The combination of the two effectively improves the accuracy of unsupervised cross-modal hash association, which is more suitable for large-scale cross-modal remote sensing image association retrieval tasks. Experimental results on benchmark datasets in the remote sensing field show that the proposed method performs better than the existing benchmark method. However, the design of the original feature extraction module of the model does not fully consider the semantic information richness of each mode, and the calculation method of the similarity matrix is relatively simple. Future work can be further improved on the accuracy of association.
Jan. 25, 2023Vol. 52 Issue 1 0110003 (2023)
Jiang WU, Daojing LI, Anjing CUI, Jinghan GAO, and Kai ZHOU
Spaceborne large-aperture infrared optical telescopes are of great significance for astronomical observation and deep space exploration. At present, large-aperture telescopes based on optical synthetic aperture systems are mainly divided into two categories: segmented imaging and interferometric imaging. The segmented telescope obtains the imaging resolution corresponding to the large aperture by splicing multiple small aperture telescopes, and the interferometric telescope achieves the imaging resolution of the aperture corresponding to the baseline length by interferometric processing (cross-correlation) of the signals of two or more small aperture telescopes. Against this background, the telescope in this paper draws on the Fizeau structure, the concept of a spaceborne 10 m synthetic aperture coherent imaging telescope is proposed, which is based on wavelength-tunable laser local oscillator coherent detection and diffractive thin film mirrors.By setting a wavelength-tunable laser local oscillator infrared coherent detector, a low-resolution complex image signal with phase information received by multiple sub-mirrors is sampled firstly, and then a high-resolution images are coherently synthesized in the computer. This imaging method can be defined as optical synthetic aperture coherent imaging. In addition, the optical synthetic aperture imaging processing in this paper is completed on the narrow-band subdivision spectral image signal corresponding to the infrared central wavelength, gating without aliasing of broadband infrared signals in the electronic frequency domain can be realized by adjusting the stepping wavelength of the laser local oscillator, which is equivalent to achieve subdivided infrared spectrum. In this paper, the mixing method of laser local oscillator signal and infrared signal refers to spatial optical path mixing. After spatial superposition of the chromatic aberration-corrected infrared complex image based on the polarization beam splitter and the wavelength-tunable laser local oscillator signal, it enters the array detector to realize photoelectric conversion and simultaneous frequency mixing, and outputs the complex image through narrow-band filtering AD sampling.The form of wavelength tunable laser local oscillator coherent detector is given and the dual band realization method of large aperture diffractive film mirror and main parameters of the system are analyzed. An optical synthetic aperture coherent imaging algorithm based on the sub-mirror structure is proposed and simulation results of array deformation error wavefront estimation based on phase retrieval is given. The telescope in this paper has an angular resolution of 0.15 μrad in short-wave infrared 1.45~1.65 μm spectral range; it has an angular resolution of 0.46 μrad in mid-wave infrared 4.55~4.75 μm spectral range, with a detection sensitivity 2.7 times higher than that of a traditional 10 m telescope in theory. And through the optical synthetic aperture processing, when the received infrared center wavelength is 1.55 μm, the angular resolution of the telescope array in this paper is 16 times higher than that of the single sub-mirror image pixel angular resolution of 3.2 μrad, so its pixel angular resolution is 0.2 μrad, which is close to the 10 m aperture telescope?'?s diffraction limited angular resolution.Compared with the traditional large-aperture optical telescope, the imaging processing of the telescope in this paper is completed on the computer, and the size and weight of the system can be greatly reduced, with good detection performance. Since the imaging processing of complex signals received by the multiple sub-mirrors is completed by software in the computer, compared with the traditional telescope, the accuracy requirements for the fine-tuning mechanism and other hardware can be reduced. When the phase recovery technology of the existing indirect wavefront detection method is adopted, the mechanical control accuracy can be reduced from the order of one-twentieth wavelength to the order of wavelength, and the technical implementation is feasible.
Jan. 25, 2023Vol. 52 Issue 1 0111002 (2023)

Junjie ZHU, Jufeng ZHAO, Haijun TIAN, Guangmang CUI, and Zhen SHI
Coded aperture spectral imaging is a snapshot spectral imaging method, but it usually has the problems of large reconstruction error and high reconstruction computational complexity. To solve this problem, this paper proposes a compressed spectral reconstruction method based on non-local sparse representation and dual-camera system. First, a dual camera system is used to obtain the spectral and spatial data of the target. This dual camera system has two branches, the light is divided into two paths through a spectroscope, half enters the coded aperture spectral imaging system to obtain encoded images, and the other half is received by an RGB camera to obtain RGB images. The RGB observation image is used to construct 3D image patches, and k-means clustering is used to classify these 3D image patches. Then we propose a method to estimate the non-local similarity of target spectral image by RGB observation. The clustering and similarity estimation results of 3D image patches are used to guide the classification and similarity estimation of target spectral images. Divide the initialized target spectral image into a series of three-dimensional spectral patches, and classify the spectral patches based on the previous clustering results. Perform principal component analysis on each cluster, obtain the common features between different patches of the target spectral image, and use them to sparsely represent other spectral patches. For each patch, the sparse representation coefficients of the current patches are estimated by the weighted sum of sparse representation coefficients of nonlocal similar patches, and the weighted coefficients are calculated from the 3D image patches constructed by RGB observation. In order to improve the reconstruction quality, we set adaptive regularization parameters for sparse representation coefficients. We transform these operations into a variational optimization model, and then adopt an alternative optimization scheme to solve the objective function. We use conjugate gradient descent method and iterative threshold shrinkage method to optimize alternately. After every fifteen iterations, perform a principal component analysis on the classified three-dimensional spectral patches to obtain a new dictionary, and continue to repeat the iterative process. Through multiple repetitions, the final objective function converges, and the reconstructed spectral image can be obtained. We have done simulation experiments on the public spectral image dataset, and the experimental results show that our method has smaller spatial and spectral dimensions errors than other methods. We conducted simulation experiments on public spectral datasets, and the results show that our method has smaller errors in both spatial and spectral dimensions. From the perspective of spatial dimension, the proposed method can retain more details. From the spectral dimension, the method has smaller error and smaller error fluctuation in almost all wavebands than other methods. In addition, we compare the RGB auxiliary dictionary learning and similarity estimation method proposed in this paper with the common intermediate result dictionary learning and similarity estimation methods, the RGB auxiliary reconstruction method saves nearly half of the time while maintaining the same reconstruction quality. Finally, we set up an imaging system to do experiments on real data, and took images with filters for reference. The experiments show that our method can also obtain the best reconstruction quality on real data, which is most similar to the images obtained with filters. We also analyzed the influence of some factors, such as sampling step size and patch size, and selected the most appropriate parameter settings through a large number of experiments. Experiments on simulation data and real data show that our reconstruction model can greatly improve the reconstruction quality of spectral images in spatial and spectral dimensions, and the RGB observation assisted reconstruction method can effectively reduce the reconstruction time.
Jan. 25, 2023Vol. 52 Issue 1 0111003 (2023)
Jiayun XUE, Shishi TAO, Lanjun GUO, Zhi ZHANG, Zhi WANG, Lie LIN, and Weiwei LIU
High-energy and ultrafast laser has been an ideal source for frontier physical issues, such as high harmonic generation, attosecond pulse generation, extreme ultraviolet optical frequency comb and electron acceleration. Due to the wide gain bandwidth, titanium-doped sapphire lasers can directly emit laser pulses of few periods. While due to the limitation of quantum efficiency, pumping power and thermal effect, the energy of laser pulse is limited. On the other hand, external pulse compression is also used to generate few-cycle laser pulse, by means of gas-filled multi-pass cell, gas-filled hollow-core fiber, and multiple solid plates. Laser pulse compression based on multiple thin solid plates is characterized by stable performance, high repeatability, and high cost performance. The nonlinear refractive index coefficient of solid medium is higher than that of gas medium. It is easier to generate nonlinear process in solid medium. The spectrum becomes much wider than the original spectrum, as a result of self-phase modulation effect. With efficient dispersion management and appropriate input laser beam size, high-energy laser pulses can be compressed through multiple thin solid plates. Research based on multiple thin solid plates aims mainly at titanium-doped sapphire laser, with shorter laser pulse (<100 fs) and lower energy (<10 mJ). For laser pulses with higher energy, a large-size beam is adopted to control the energy fluence on solid medium. High quantum efficiency and excellent thermal conductivity make the medium of ytterbium to generate high energy and high average power laser pulse. And the ytterbium doped laser is more compact and integrated than titanium-doped sapphire laser. The external pulse compression of high-energy ytterbium doped laser is a reliable scheme to generate high-energy and ultrashort pulses. Previous research about pulse compression of ytterbium doped laser by multiple thin solid plates is also based on low energy laser. In this paper, we demonstrate numerically the nonlinear pulse compression of the high-energy ytterbium doped laser, with an energy of 250 mJ and a wavelength of 1 030 nm, based on multiple thin solid plates. The influence of period and thickness of solid plates is also studied. The period and thickness of solid plates have a positive effect on the spectral broadening when the laser energy fluence is lower than the damage threshold of solid medium. By using appropriate solid plates, a femtosecond supercontinuum is generated with a bandwidth of 229 nm. And the pulse is compressed from 500 fs to 16.2 fs, with a high compression ratio of 30. Besides, we design a three stage pulse compressor to generate laser pulse with different pulse widths to meet the requirements of different applications, such as 51.3 fs, 26.6 fs, 16.2 fs. The simulation results are feasible for high-energy laser pulse compression.
Jan. 25, 2023Vol. 52 Issue 1 0114001 (2023)
Han LIU, Ziping LI, Xuhong MA, Shumin WU, Xiaoyu LIAO, Wen GUAN, Kang ZHOU, Yiran ZHAO, Juncheng CAO, and Hua LI
The electrically pumped terahertz quantum cascade laser is characterized by high output power, low threshold, high quality far-field beam, etc., which is one of the most efficient terahertz radiation sources in the frequency range between 1 THz and 5 THz. Due to its outstanding performances, the terahertz quantum cascade laser is an ideal semiconductor platform for the terahertz frequency comb generation. Different approaches, e.g., group velocity dispersion engineering, active microwave injection locking, passive stabilization, etc., have been employed to obtain broadband frequency combs based on terahertz quantum cascade lasers. Regardless of the stabilization technique employed, the radio frequency transmission in the terahertz quantum cascade laser cavity is a key point for the comb characterization, because the repetition frequency of the laser comb determined by the laser cavity length normally lies in the microwave frequency range. Previous studies mainly focus on the optimizations of laser structures to improve frequency stability. The design and optimization of broadband impedance matching unit are less investigated. In this article, a tapered microstrip line structure is designed to solve the impedance mismatching problem in the extraction and transmission of the radio frequency signal of the terahertz quantum cascade laser frequency comb. The input and output impedances of the tapered microstrip line structure are designed to be 20 Ω and 50 Ω, respectively. The simulation of the tapered microstrip line is carried out by employing a finite element method. The structure and parameter optimization of the tapered microstrip line is systematically studied. The calculated S21 and S11 are -0.1209 dB and -17.5133 dB, respectively, at the central frequency of 6.2 GHz. Then the electric field distribution of the tapered structure is simulated and the skin effect of the calculated electric field distribution of the tapered microstrip line is consistent with that of the traditional microstrip line. Furthermore, a corresponding equivalent circuit model is established to analyze its physical characteristics. In the experiment, the tapered microstrip line structure is applied to the extraction and characterization of the radio frequency signal of a terahertz quantum cascade laser frequency comb to verify the transmission effect of the tapered microstrip line. We first evaluate the basic performance of the terahertz quantum cascade laser. The maximum power is 0.75 mW at an operation temperature of 20 K. And the repetition frequency of the terahertz quantum cascade laser is successfully measured. The radio frequency linewidth and the signal to noise ratio are measured to be 3.7 kHz and 60 dB, respectively. And the repetition frequency shows a stable single-line signal in the injection current range of 700~900 mA. The stability of the repetition frequency is further verified under the condition of resolution bandwidth 500 Hz, video bandwidth 50 Hz, a driving current of 790 mA, and an operation temperature of 20 K. The frequency fluctuation range of the repetition frequency is measured to be 110 kHz in 30 s and 480 kHz in 2 min. And the amplitude Allen variance value of different tine intervals is basically between 10-1 and 10-2. The measured max-hold and amplitude Allan variance results also show a high-level stability of the repetition frequency. The experiments show that the designed tapered microstrip line is able to achieve the impedance matching between the laser chip and the external radio frequency transmission cable, which can significantly improve the signal-to-noise ratio of the comb repetition frequency by at least 10 dB and shorten its linewidth from 394 kHz to 3.7 kHz. The designed tapered impedance microstrip line can effectively transmit the repetition frequency and reflect the comb structure of a terahertz quantum cascade laser optical comb. This work provides a simulation and experimental basis for the radio frequency transmission study and mode-locking of optical frequency combs and dual-comb sources in the terahertz frequency range.
Jan. 25, 2023Vol. 52 Issue 1 0114002 (2023)
Huaqi CHAI, Youxing CHEN, Zhaoba WANG, Xing GUO, Jian WANG, and Xia ZHAO
Laser ultrasonic nondestructive testing technology has become a research hotspot due to its advantages of non-contact, wide frequency, and multi-mode. However, it is also because of its wide-band and multi-mode characteristics that the technology is difficult to identify and extract characteristic signals and determine the receiving position in practical applications. Especially when it comes to the test piece with a complex shape, the generated ultrasonic wave is reflected in the test piece for many times, which increases the difficulty of testing and seriously affects the practical application of this technology. In addition, in order to facilitate the research, the excitation light source is often regarded as an ideal point source, however, the size of the light source is one of the important factors in the actual measurement process. On the basis of previous studies, 1060 aluminum alloy plates with three thicknesses of 5 mm, 10 mm, and 15 mm are taken as the research objects in this paper, and the light source diameters of 1 mm, 2 mm, 3 mm, 4 mm, 5 mm and 6 mm are respectively set to excite the aluminum alloy plates. The Michelson interferometer scans the back of the plates to receive signals. Firstly, the arrival time and amplitude of each echo are obtained from the experimental A-scan data. By analyzing the arrival time of each echo, the echo propagation path under the excitation of light sources with different diameters is derived, and the relationship between the arrival time of each echo of laser ultrasound and the diameter of the excitation light source is given. The directivity formula of ideal point source given by HUTCHINS D A et al. is analyzed, and on this basis, the directivity diagram of laser ultrasonic sound field in polar coordinate system is drawn by using the amplitude of primary longitudinal wave and primary transverse wave excited by light sources with different diameters, from which the law of the directivity of sound field changing with the diameter of the excitation light source is analyzed. The results show that as the detection laser moves away from the center, the amplitude of the longitudinal wave gradually decreases, and then it is submerged in the transverse wave. The arrival time of the longitudinal wave is difficult to extract, and the arrival time of the transverse wave will move forward, deviating from the theoretical arrival time. However, if the influence of waveform aliasing is ignored, the maximum error between the experimental value and the theoretical value of each echo arrival time spread formula given in this paper is not more than 0.1 μs. In addition, by analyzing the amplitude distribution of the primary longitudinal wave and the primary shear wave, it can be seen that an excitation source with a diameter of a≤1 mm can generate a shear wave sound field with good directivity near ±45°, and the longitudinal wave has a considerable amplitude in almost all directions. With the increase of the diameter of the excitation light source, the sound beam of the longitudinal wave sound field becomes narrower and the directivity becomes better, while the shear wave energy gradually moves to the normal direction away from ±45°. However, when the diameter increases to a certain extent, the acoustic fields of both will be affected by the thermoelastic effect. In the longitudinal wave directivity diagram, there are obvious small side lobes around ±30°~±60°, and the energy of the shear wave concentrated in the normal direction will diffuse to both sides. The research results of this paper show that the diameter of the excitation light source is a non negligible factor for the study of the distribution of laser ultrasonic sound field. In practical application, the appropriate diameter of the light source should be selected according to different detection needs.
Jan. 25, 2023Vol. 52 Issue 1 0114003 (2023)
Zehong WAN, Hongyang DENG, Yu LEI, Guoyi TAO, Hongpo HU, and Shengjun ZHOU
As a representative material of the third-generation semiconductor, silicon carbide (SiC) demonstrates excellent physical properties and chemical stability, which is an ideal material for harsh environment operating devices and high power electronics. To fabricate SiC pressure sensitive components, blind holes are processed on the surface of the SiC substrate to obtain sensitive diaphragms. Laser ablation is an efficient way to process SiC materials, and femtosecond laser processing has been widely studied because of its small thermal effect, low damage to materials, fast processing rate, insensitivity to crystal orientation, and ability to form complex structures.To investigate the characteristics of 4H-SiC material processed by femtosecond laser, the effects of fabrication process parameters such as step spacing in the depth direction, scanning direction, single pulse energy and scan line spacing on the surface morphology and ablation rate of 4H-SiC material are investigated. The 4H-SiC blind hole with a diameter of 1 600 μm, a depth of 250 μm and a thickness of 100 μm is prepared.To investigate the effect of depth direction step spacing on the ablation depth and surface morphology, the single pulse energy of the femtosecond laser is set to be 30 μJ; the scanning line spacing is set to be 20 μm; the angle between the laser scanning path and the laser polarization direction (θ) is set to be 90°. The parallel line scanning path is used to process 4H-SiC. The step spacing in the depth direction is set as 2.9 μm and 15 μm. These two samples are marked as sample 2 and sample 3, respectively. The ablation depth of sample 2 was 15.6% larger than the expected ablation depth, and holes appeared on the surface. The ablation depth of sample 3 was 10.2% smaller than the expected ablation depth, and no holes appeared.To investigate the effect of scan path on surface morphology, the single pulse energy is set to be 30 μJ; the scanning line spacing is 20 μm, the step spacing is 2.9 μm; θ is 90°, 60°, 30°, and 0°. The surface roughness of the sample gradually increases with decreasing θ and the number of surface holes gradually increases. This is because the angle between the microgrooves and the scan path gradually decreases with the decreasing θ, leading to an increase inthe probability of overlapping microgrooves on the scan path and thus the generation of holes on the sample surface.To investigate the effect of single pulse energy on the ablation depth and surface roughness, the single pulse energy is set to be 5, 10, 15, 20, 25, 30 μJ; θ is 90°; the scanning line spacing is 20, 15, 10, 8, 5, 4, 3, 2 μm. The laser light intensity increases linearly with the increase of the laser single pulse energy. As a result, the ablation depth gradually increases with the increase of the single pulse energy. With the increase of laser single pulse energy, the light intensity distribution is more uneven, resulting in a gradual increase in the surface roughness. Furthermore, the superimposed light intensity of the femtosecond laser decreases exponentially with the increase of the scan line spacing by changing the scanning line spacing. As a result, the ablation depth decreases exponentially with the increase of the scan line spacing.In this paper, a 1 028 nm, 190 fs femtosecond laser system is used to process 4H-SiC sensitive diaphragms. The experimental results show that the formation of holes on the surface of 4H-SiC samples is related to the overlap of laser-induced microgrooves. The final setting of the femtosecond laser with a single pulse energy of 30 μJ, a scan path angle of 90° to the laser polarization direction, and a scan line spacing of 2 μm is used to process blind holes with a diameter of 1 600 μm and a depth of 250 μm using a circular table-shaped material removal method. The ablation depth of a single turn is 85.7 μm, and the 4H-SiC sensitive diaphragm with a thickness of 100 μm is obtained after three turns of processing. The resulting 4H-SiC pressure-sensitive diaphragm has no obvious holes on the surface, the edge over-ablation depth is less than 10 μm, and the low-damage femtosecond laser processing of 4H-SiC pressure-sensitive diaphragm is obtained.
Jan. 25, 2023Vol. 52 Issue 1 0114004 (2023)
Anchen WANG, Zhongmei HUANG, Weiqi HUANG, Qian ZHANG, Chun LIU, Zilin WANG, Ke WANG, and Shirong LIU
The bulk α-cristobalite, the thin film α-cristobalite with different thicknesses and the Si/SiO2 interface with different silicon oxide layer thicknesses are all direct bandgap semiconductors. The thickness of the thin film α-cristobalite and the thickness of the silicon oxide layer at the Si/SiO2 interface gradually decrease, and the bottom of the conduction band moves continuously to the direction of the high energy level, and the energy band gap gradually increases, showing an obvious quantum confinement effect. The overlapping hybridization of the total density of states and the density of partial electronic states is weakened, and the valence band and conduction band of the energy band structure are more sparse. As the thickness of α-cristobalite decreases from 2.887 nm to 1.047 nm, the band gap of thin film α-cristobalite increases from 5.233 eV to 5.927 eV. As the thickness of silicon oxide decreases from 2.887 nm to 1.047 nm, the band gap of Si/SiO2 interface increases from 1.62 eV to 1.782 eV. With the decrease of the thickness of the silicon oxide layer at the Si/SiO2 interface, the quantum confinement effect is prominent and the energy band gap gradually increases. The bottom of the conduction band of the Si/SiO2 interface moves to the higher energy level with the decrease of the thickness of the silicon oxide layer. The electronic state structure change of the Si/SiO2 interface caused by the thickness change of the silicon oxide layer is similar to the electronic state structure change caused by the thickness change of the thin film α-cristobalite. The density of states and wavelength division states of Si/SiO2 interface with a thickness of 1.047 nm are all lower than those of Si/SiO2 interface with a thickness of 2.887 nm. As a result, the energy band gap is reduced, and the overlapping hybridization of electrons is weakened. The Si/SiO2 interface with a silicon oxide layer thickness of 1.047 nm has a very steep peak at -19.5 eV. It can be seen from the total density of states and partial wave electron density diagram of bulk α-cristobalite that this peak mainly comes from the contribution of 2s electrons of oxygen atoms in silicon oxide layer at Si/SiO2 interface, because the energy of 2s electrons of oxygen atoms in silicon oxide layer is higher than that of 3s electrons of silicon. Near fermi surface, the density of electronic states at Si/SiO2 interface mainly comes from the contribution of 2p states of oxygen atoms. The calculation results of optical properties show that the imaginary part of the dielectric function at the Si/SiO2 interface has a dielectric peak near 4.5 eV. With the decrease of the thickness of the silicon oxide layer at the Si/SiO2 interface, the dielectric peak slightly moves to the high energy direction, and the peak value of the dielectric peak keeps rising. This is caused by the decrease of the thickness of the silicon oxide layer in Si/SiO2 and the increase of the band gap of the Si/SiO2 interface. As the thickness of the silicon oxide layer decreases, the Si/SiO2 interface state density decreases near the left side of the Fermi plane, and the overlapping hybridization of electrons is weakened, so the energy consumed when the electric dipole is formed inside increases. There is an absorption peak at the Si/SiO2 interface near 6 eV, and the peak of the absorption peak of the absorption coefficient of the Si/SiO2 interface also increases significantly with the decrease of the thickness of the silicon oxide layer, and the peak position moves to the high energy direction, resulting in a blue shift . Therefore, the electronic state structure and optical properties of the Si/SiO2 interface can be effectively regulated by controlling the thickness of the Si oxide layer at the Si/SiO2 interface. In the experimental part, the nanosecond pulsed laser deposition method was used to prepare silicon oxide and its silicon thin film, and the oxygen-blowing annealing was performed at a high temperature of 1 000℃, and the growth thickness of the film was changed by controlling the annealing time. During PLD fabrication, a nanosecond pulsed Nd:YAG laser with a third-harmonic 355 nm laser beam was used to deposit silicon crystalline nanolayers on silicon oxide, thereby constructing edge electronic states. In the photoluminescence measurement, the edge electron state on the Si/SiO2 interface sample has a strong luminescence peak at 670 nm; under the excitation of 532 nm laser, the Si/SiO2 interface electrons can be excited from the valence band to the conduction band, and enter the edge electron state to form a strong quasi-excited light peak. The experimental result verifies the results of the energy band calculation: growing a silicon thin film on silicon oxide can form edge electronic states to effectively reduce its energy band gap and maintain its direct band gap characteristics. The electrons in the electronic state at the edge of Si/SiO2 interface can also be transported to the lower partial wave state, forming a luminescent band in the near infrared band. The detection results of the photoluminescence PL spectrum of the silicon crystalline thin film structure sample on silicon oxide verify the results of the computational study. The edge electronic states on the sample narrow the wide direct bandgap of silicon oxide to 1~2 eV, and the position of the luminescence peak is covering visible light and near-infrared bands, thus, the silicon-on-silicon thin film structure will have good application prospects in the fields of light-emitting and photovoltaics.
Jan. 25, 2023Vol. 52 Issue 1 0116001 (2023)
Fengxiang CUI, Yanli BAI, Siqi WU, Huan CHEN, Luye LIANG, Yunfei ZHU, and Jun XIE
Inertial confinement fusion is the main way to obtain experimental data of thermonuclear weapons. Since the Microchannel Plate (MCP) framing camera has picosecond-level temporal resolution and micron-level spatial resolution in the inertial confinement fusion experiment, it can effectively detect the plasma space-time evolution state of the Inertial confinement fusion process. The temporal resolution of the MCP framing camera is about 60~100 ps. The main influencing factors are the electronic transit time and its dispersion in the MCP channel. There are two main improvement methods: the thin MCP and optimized gating pulse. Although thin MCP can effectively improve the temporal resolution of the camera, it is difficult to be widely used due to the poor signal-to-noise ratio and high manufacturing process requirements. Therefore, the improvement of the temporal resolution of MCP framing cameras is commonly achieved by optimizing the circuit structure to obtain high-amplitude and narrow half-width picosecond gating pulse. High-voltage gating pulse with picoseconds is a branch of pulse power technology. Firstly, it usually stores low-power energy, and then releases energy to output high-power pulses in a very short time. The picosecond gating pulse applied to MCP framing camera can be realized by nanosecond high voltage pulse and pulse shaping. In terms of nanosecond high-voltage pulse, avalanche triodes are widely used in pulse generators due to their fast turn-on switching characteristics in avalanche states. However, under different circuit structures, high-voltage discharge ignition and easy breakdown can occur. In terms of pulse shaping, the output of picosecond pulse is usually realized through special line forming and pulse steepening technique. The former achieves a substantial reduction in pulse time width and power by compressing the pulse energy, while the latter achieves pulse time width compression by steepening the front and rear edges of the pulse, which has a relatively little impact on pulse power. The temporal resolution of the framing camera refers to the gain-time curve half width of the MCP. In order to calculate the temporal resolution, a gating pulse is usually loaded on the MCP to study the photoelectron dynamic multiplication process in the MCP channel to calculate the electron gain, so as to draw the MCP gain-time curve. In this paper, Marx pulse generator is designed based on avalanche triode firstly, and the influence of circuit parameters on the output nanosecond pulse is analyzed. Marx generator is a common device used to obtain high amplitude and nanosecond half width pulses in pulse power technology. The n-stage Marx pulse generator is designed in a mixed mode of avalanche triode series and parallel connection. The avalanche breakdown voltage of the avalanche triode 2N5551 is about 480 V, which is used as a switch for the generator. In order to achieve a high amplitude output of the pulse generator and reduce the circuit complexity, it is required that each stage of the generating circuit should be connected in series with multiple avalanche triodes as much as possible to improve the output amplitude. However, due to the situation that too many avalanche triodes in series can lead to high-voltage ignition and reduce the stability of the generator, the number of avalanche triodes at all levels should not be too large. Considering comprehensively that 8 avalanche triodes are used in series to form a primary generator circuit in the design. When the generator stage n is 3, the output amplitude is about -6 kV, which has reached the output target. Considering that the output amplitude efficiency of the generator should be as large as possible and the half height width of the pulse should be as small as possible, a three-stage Marx pulse generator based on avalanche triode is used to realize nanosecond high-voltage pulse. The corresponding output pulse amplitude is -6.058 kV and full width at half maximum is 165.924 ns. A pulse shaping circuit is then designed based on the pulse steepening technology. The principle of pulse steepening is to rapidly charge and discharge small capacity capacitors through nanosecond pulses, shorten the pulse front time while losing part of the pulse amplitude, and shorten the pulse back time by reducing the trailing edge of the pulse. After steepening, the output pulse reaches picosecond. By analyzing the influence of circuit parameters on the picosecond gating pulse, the picosecond high-voltage gating pulse applied to the temporal resolution calculation of the microchannel plate framing camera is output, with an amplitude of -2.8 kV and a full width at half maximum of 124 ps. Monte Carlo method is used to establish the photoelectrons dynamic multiplication model in the MCP channel and the gating pulse is applied to the MCP gain calculation to obtain the temporal resolution. The process of obtaining the temporal resolution of the camera: first, the photoelectrons enter the MCP channel under the action of the gating pulse, and the photoelectrons collide with the MCP channel wall to generate secondary electrons; until the photoelectrons leave the MCP channel; finally, the MCP gain under the gating pulse at different times is calculated to obtain the temporal resolution of the MCP framing camera. The research results show that, the method of generating picosecond high voltage gating pulse by combining the Marx and the sharpening circuit is feasible. The gating pulse with an amplitude of -2.8 kV and a half-width of 124 ps is obtained when the Marx pulse generator is three stages, and the inductances and capacitance of the pulse sharpening circuit are 725 nH, 7 nH, and 1 pF respectively. The MCP gain time normalization curve with a half height width of about 53 ps is obtained by analyzing the dynamic multiplication process of photoelectrons in MCP channel at different times and calculating the gain, which is the temporal resolution of the MCP frame divider. In addition, since the waveform of the gating pulse is V-shaped, the pulse rising edge can be applied to the dilation gradient of pulse-dilation framing camera, which provides conditions for further improving the temporal resolution of pulse-dilation framing camera.
Jan. 25, 2023Vol. 52 Issue 1 0125001 (2023)
Yu LIU, Jianhua HUANG, Chuanjian ZHAO, Cuixia GUO, and Feng HUANG
When the light passes through a scattering medium, the wavefront of the beam is disturbed due to the multiple scattering phenomena. If the light is coherent, scattered light from different optical paths will interfere, resulting in random speckles, which causes extreme degradation in imaging quality. Using wavefront shaping techniques to focus light through strongly scattering media is significant for optical microscopic active imaging through biological tissues. However, the feedback-based optimized wavefront shaping often ignores the background noise light when focusing, and even in some cases, the light intensity of a background bright spot can even exceed 1/3 of the target point. To solve this problem, this paper proposes a different iterative method from the previous multi-objective optimization genetic algorithm aiming to suppress the background noise.The effect of the population scale of the genetic algorithm and the number of modulation units of the spatial light modulator on the focusing intensity and convergence speed are systematically studied. The experimental results show that the genetic algorithm can converge quickly when the population scale and the number of modulation units reach 32 and 16 × 16, respectively. The maximal light intensity of the target region can reach 250 or more. In terms of convergence speed, the fastest convergence is achieved for a population scale of 48, but the shortest iteration time is achieved for a population scale of 32. All target intensities can achieve convergence after 60 iterations when the number of modulation units exceeds 16 × 16, and the number of modulation units is positively correlated with the iteration time. Considering above aspects, the best focusing performance of the genetic algorithm is achieved when the population scale and the number of modulation units reach 32 and 16×16, respectively.After determining the optimal experimental conditions, the study of suppressing background noise is conducted. The experiments aim to enhance the signal-to-noise ratio and propose a different iterative method from the previous multi-objective optimization genetic algorithm. The feedback function is changed to the ratio of target intensity to average background noise. Hence, iterative calculation aims to increase target intensity and suppress background noise simultaneously. The results show that the optimized algorithm significantly reduces the light intensity in the background region after the modulated area is increased. And its optimal value is basically equal to the system noise of the camera, indicating that the optimization function can suppress the light field noise in the modulated background region to the lowest level. In terms of suppressing the area of significant noise bright spot, the area of the significant noise bright spot formed with the optimized algorithm in the background region decreased by 70.4% compared with that before optimization, indicating that the optimization function can effectively suppress the local noise bright spot. In addition, the quality of the focused spot is evaluated by extracting the contour features of the target region. After obtaining the contour features, the circularities of the initial spot and the optimized spot are calculated separately using the circularity formula. The circularity of the initial spot is 0.83, while the average circularity of the optimized spot is 0.9, indicating that the shape of the optimized focused spot is closer to the ideal circular spot. Finally, a quantitative correlation model between the background average light intensity and the modulated area is proposed based on the experimental results. The experimental data are fitted well using the quantitative model, and the fitting results yield a saturated average light intensity of 246.6 in the focused region, which is consistent with the measurement results of previous experiments. It shows that the correlation model proposed in this paper can not only describe the correlation between the modulated background area and the background mean light intensity well, but also quantify the relationship between the light intensity of the focused area and the modulated background area.
Jan. 25, 2023Vol. 52 Issue 1 0129001 (2023)
Shenglong TANG, Baojian WU, Wei YAN, Feng WEN, and Tianfeng ZHAO
With the continuously increasing demand for optical network bandwidth, high-speed data transmission and large-capacity optical fiber communication technologies are being developed to meet the goal. In Mode Division Multiplexing (MDM) systems, the orthogonal fiber modes are made advantage of carrying different user information in the form of Multiple-input and Multiple-output (MIMO) channels. In the case, both the system spectral efficiency and transmission capacity can be effectively improved by means of MIMO digital signal processing technology. At the same time, to save the system cost and reduce complexity of implementation, more attention is being paid to low-complexity MIMO technology, or even MIMO-free MDM high-speed signal transmission, with applications to short-distance application scenarios such as optical access networks, data centers, and supercomputer interconnections.On the other hand, the mode multiplexer/demultiplexer, as a key component for MDM communication systems, are required for a low mode-dependent loss and mode crosstalk as possible. Their performance parameters can directly affect the system's bit error rate and the difficulty of algorithm compensation at the receiver. There are several kinds of mode multiplexers, including those of free space type, optical waveguide, fiber coupler, and photonic lantern. Free-space multiplexers have some advantages in mode purity and mode crosstalk, but are limited by complex optical platforms. The multiplexing/demultiplexing scheme based on the waveguide structure has large connection loss with few-mode fibers since the width of the optical waveguides is much smaller than the core radius of the few-mode fibers. The other two multiplexer/demultiplexer are in the form of fiberization and capable of seamless connection to few-mode fiber systems. Among them, the commercially available Mode-selective Photonic Lantern (MSPL) mode multiplexer, as a passive optical device, has the advantages of simple structure, low insertion loss, and multi-port input. The MSPLs are also compatible with other technologies such as wavelength division multiplexing, polarization multiplexing.In the paper, we focus on the high-speed signal transmission capability of MIMO-free Mode Division Multiplexing (MDM) system constructed by the 3-port MSPLs, where each mode channel carries a Dual-polarization Quadrature Phase Shift Keying (DP-QPSK) signal at a bit rate of 100 Gb/s. The state of the Few-mode Polarization Controller (FMPC) used in the experiment can be accurately characterized by the Signal-to-crosstalk Ratios (SXRs) of LP01 and LP11 mode channels. The relationship between the Bit Error Rate (BER) and the SXRs is measured by adjusting the FMPC. The experimental results show that, no bit error after forward error correction can be achieved when the SXR of each mode channel is more than about 8 dB. When the SXRs of the two channels are respectively 14.25 dB and 13.81 dB, the corresponding degradation of received optical power relative to the back-to-back transceiver system are 1.40 dB and 4.76 dB at the BER threshold of 10-2, respectively. The effects of fiber attenuation, polarization mode dispersion and mode crosstalk on the high speed transmission system are analyzed, and the transmission distance limited by crosstalk is estimated to be about 30 km for the few-mode fiber system of interest. Compared with the technologies reported so far, the research in this paper has the highest channel rate, and indicates that the MIMO-free crosstalk limited distance is about 30 km. The 2×2 high-speed MIMO-free mode division multiplexing experiment is carried out before. 100 Gb/s DP-QPSK has higher requirements on the SXR of the channel. Using the same experimental system, appropriately reducing the channel data rate can achieve 3×3 mode division multiplexing system.
Jan. 25, 2023Vol. 52 Issue 1 0106001 (2023)
Zhenyuan HU, Yaoli YUE, Yanyan ZHANG, Shuaihe GAO, Xiguang YANG, Ming SUI, Zhibing PAN, Shougang ZHANG, and Yang LI
Optical clocks have reached an instability level of 10-19. Remote clock comparisons require more stable frequency transfer systems. Remote time and frequency transfer are currently performed using RF link or laser link. The signal pathway between the clock and RF/laser transceiver also requires high stability. In some applications, ambient temperature change is the main noise source. However, it is difficult to control optical fiber temperature precisely under certain circumstances such as on a space station.A noise suppression method is developed and a frequency transfer system is designed using Michelson interferometer based on a 3×3 fiber coupler. A 3×3 fiber coupler rather than a 2×2 fiber coupler is chosen to build a Michelson interferometer because the direction of the fiber length change can be judged effectively when a 3×3 fiber coupler is used. An optical comb is used as a frequency source, with a wavelength of 1 550 nm, an output power of 40 mW, and fr (repetition frequency) at 200 MHz. A 1 310 nm CW-laser is used as a measurement scale.The two laser beams are input into the same optical fiber via a WDM. Another WDM split the two laser beams at the end of the optical fiber. The optical comb laser beam can be directly input into the target device. The measurement laser beam is reflected by a Faraday rotation mirror back to the fiber coupler. The optical fiber is the measuring arm of the Michelson interferometer. Photodiodes detect the interference fringe.An embedded system is employed in counting the interference fringe shift amount, calculating the compensation value, tuning the fiber length, and compensating the time delay variation in real time. A compensation device was built, and experiments were carried out.The experimental system is mainly composed of a compensation device, 30 m optical fiber, wavelength division multiplexers, Faraday rotation mirrors, and other auxiliary devices. The temperature of the 30 m optical fiber is controlled by an external TEC. For each test, the temperature of 30 m optical fiber is decreased from 26 ℃ to 5 ℃ and then increased to 18 ℃. The temperature variation range is 21 ℃.When the compensation is off, the time delay changes for approximately 20 ps for each 10 ℃ change. When the compensation is on, the time delay has mostly no change. The change is more remarkable than 2 fs at only a few points, which is still lesser than 6 fs.In another experiment, the optical comb laser is split into two beams and input into two optical fibers. Each laser beam is detected by a photodiode. The frequency signals from photodiodes are filtered by bandpass filters and input to a 5 125 A phase noise test set as input signal and reference signal respectively. The frequency instability of fr is measured in the following three cases. In the first case, two short optical fibers of a similar length are used. The frequency instability characterizes the background noise of the test system. In the second case, one optical fiber is a short fiber, and the other is a 30 m fiber. The compensation device is disabled and connected in front of the 30 m fiber. The frequency instability of fr increases by about an order of magnitude compared with the first case. In the third case, one optical fiber is a short fiber and the other is a 30 m fiber. The compensation device is connected in front of the 30 m fiber and enabled. There is no obvious change in the frequency instability of fr between the first and the third case.This work is expected to provide an effective solution for the noise suppression of the transmission pathway from the optical clock to the RF/laser transceiver under space conditions.
Jan. 25, 2023Vol. 52 Issue 1 0106002 (2023)
Zhidong JIANG, Yifeng XIE, Pei ZHOU, Zhigang TANG, and Nianqiang LI
Microwave signal generator is the key component of modern Radio-Frequency (RF) systems, such as navigation, radar, communications, and electronic warfare. Optoelectronic Oscillator (OEO), a new type of microwave oscillator, is able to directly generate a high-frequency microwave signal with low phase noise. Therefore, OEO is considered a promising solution for high-performance microwave signal generation. Phase noise is one of the vital parameters to evaluate the performance of microwave signal sources, including OEO. To date, a number of Phase Noise Measurement (PNM) methods have been designed and carried out to accurately measure the phase noise of microwave signal sources, including direct spectrum method, phase detector method, and frequency discriminator method. Among these methods, the frequency-discriminator-based PNM method is more attractive since it can eliminate the requirement of a low phase noise reference oscillator. However, the measurement sensitivity of this method is related to the time delay, which is limited by the large loss of electrical cables. Fortunately, a photonic delay line PNM method has been proposed with a high measurement sensitivity, where a section of optical fiber is applied to provide a long-time delay with negligible loss. In recent years, a lot of efforts have been devoted to improving the overall performance of the photonic delay line PNM system. For instance, a microwave photonic phase shifter and microwave photonic mixer have been employed to replace the electrical phase shifter and mixer of a traditional photonic delay line PNM system to extend the operation bandwidth. In addition, digital phase demodulation is adopted to eliminate the calibration procedure. Nevertheless, a problem with most previous photonic delay line-based schemes is that too many discrete electrical and optical components are used, which makes them bulky and leads to considerable coupling loss. Furthermore, the functionality of current photonic delay line PNM systems is relatively homogeneous, with only phase noise measurement, and few solutions with dual- or multi-functionality have been reported. However, during the development, optimization and operation of OEO-based RF systems, especially signal generation systems, it is necessary to develop a low-cost, simple and compact phase noise measurement solution to evaluate the quality of the signal source in time and make corresponding parameter adjustments to optimize its performance. In this paper, we propose a photonics-based dual-functional system that can achieve both microwave signal generation and phase noise measurement using an Electro-absorption Modulated Laser (EML). In this system, an EML-based optoelectronic oscillator module and a phase noise measurement module based on a photonic delay line method are implemented simultaneously. By replacing the laser source and intensity modulator with a single EML, the proposed photonics-based dual-functional system achieves a low cost and simple structure, as well as maintaining high performance. In the proof-of-concept experiment, a 9.952-GHz signal generated by the EML-based OEO has a side mode suppression ratio of 66 dB and a phase noise of -116.53 dBc/Hz@10 kHz, which is over 25 dB lower than that of Anritsu-MG3692B. In addition, the PNM module has a phase noise floor reaching -133.71 dBc/Hz@10 kHz, which is lower than that of the commercial signal source analyzer R&S FSV40. The experimental results show that the dual-functional system is capable of simultaneously generating a high-performance microwave signal and providing a high-sensitivity phase noise measurement solution for both internal and external microwave signals. This solution will facilitate the development, optimization and operation of OEO-based RF systems, especially signal generation systems, by evaluating the quality of the signal source in time and making the corresponding parameter adjustments to optimize its performance. Therefore, the proposed scheme is suitable for occasions where a high-performance microwave signal is required, and the phase noise performance of different microwave signals within the system can be monitored at the same time.
Jan. 25, 2023Vol. 52 Issue 1 0106003 (2023)
Qiufeng SHANG, and Xueli LI
Distributed optical fiber sensor has been intensively researched owing to its various advantages, such as long monitoring distance, better sensing accuracy and spatial resolution. It has been widely applied in power cables, oil pipelines, transportation. Among the numerous kinds of distributed optical fiber sensors, Brillouin Optical Time-Domain Analyzer (BOTDA) attracts much attention due to its precise measurement for the temperature and strain in ultra-long sensing range. BOTDA is based on the effect of Simulated Brillouin Scattering (SBS), frequency difference between Brillouin scattering light and incident light is defined as Brillouin Frequency Shift (BFS), which is a linear function of temperature and strain. BFS is usually determined by finding the central frequency, which is with the maximum amplitude of the local Brillouin gain spectrum. However, in order to obtain Brillouin gain spectrum in long-distance monitoring applications, BOTDA needs to scan in frequency range around the Brillouin frequency of the optical fiber, so that a number of time-domain traces associated with each frequency are measured to ensure measurement accuracy, which will lead to tradeoffs among measurement accuracy and real-time performance. To enhance both the processing time and sensing accuracy, in recent years, machine learning and deep neural network have been widely proposed and introduced to BOTDA to extract temperature distribution from the measured Brillouin gain spectrum along the sensing fiber. The temperature extraction can be considered as a nonlinear regression problem and the regression model is constructed by learning from the spectrum samples using learning algorithms. Unlike other methods with the shallow architectures, deep neural network is composed of multiple processing layers that can learn representations of data with multiple levels of abstraction. Among many methodological variants of deep learning, Recurrent Neural Network (RNN) has achieved impressive performance in various challenging areas. By adding the time hidden layer into the architecture, RNN acquired better accuracy for sequential data due to the consideration of sequence characteristics. However, RNN has the problem of gradient disappearance. Therefore, we adopt a deep network called Long Short Term Memory (LSTM) for the temperature extraction of Brillouin gain spectrum. LSTM is a variation of RNN architecture that is overcome the problems of gradient disappearance and explosion, is particularly suitable to input sequences. In this paper, the data set is generated by using Lorentz function for LSTM network training, and the mapping relationship between LSTM network and temperature was established. A 40km BOTDA setup for temperature sensing is built to verify the performance of the trained LSTM. BOTDA that operates over a long sensing fiber is prone to be affected by the detrimental non-Local Effects (NLE), since NLE can distort Brillouin gain spectrum, therefore correctly retrieving BFS is very challenging. The experimental setup that we used to acquire data has distortion phenomenon in long distance temperature monitoring. We firstly use the spectral line subtraction method to correct the distorted Brillouin gain spectrum, the corrected Brillouin gain spectrum appears Lorentz shape, then leverage LSTM to learn the feature of the corrected Brillouin gain spectrum, finally, by feeding the Lorentz spectrum sequentially into the well-trained LSTM model, the temperature information along the sensing fiber of Brillouin spectrum can be quickly determined. The performance of LSTM is investigated both in simulation and experiment under different cases of frequency scanning steps, compared with classical ELM algorithm and curve fitting methods, the LSTM algorithm shows that the minimum root mean square error is 0.11℃. Besides, LSTM network has good robustness to frequency step change, even under the circumstance of large frequency step, the method still has good measurement accuracy, which improves the real-time performance of Brillouin optical time-domain temperature sensing system.
Jan. 25, 2023Vol. 52 Issue 1 0106004 (2023)
Ye LU, Huaping GONG, Jingyi CAI, Qiming FAN, and Chunliu ZHAO
Strain monitoring is important for structural health monitoring of bridges, dams, high-rise buildings and so on. The metrological performance of strain sensing systems is an important guarantee for the accuracy of structural monitoring data. Common sensors for strain monitoring include Fiber Bragg grating strain sensors, resistive strain gauges, and vibrating wire strain gauges. Fibre Bragg grating strain sensors have the advantages of strong anti-electromagnetic interference, high precision, good durability, and distributed measurement. They have a large number of applications in the field of engineering construction and instrumentation. Fibre Bragg grating strain sensors usually work under dynamic conditions during bridge health monitoring. If the sensor measurement data is incorrect, it will have a negative impact on subsequent control, monitoring and fault diagnosis systems. Therefore, it is necessary to perform on-site calibration of the Fiber Bragg grating strain sensor in actual use to ensure the accuracy of the measurement results. At present, there are mainly two methods for on-site calibration of Fiber Bragg grating strain sensors: static calibration and dynamic calibration. In the actual bridge inspection, static calibration must block traffic operation for a period of time, which will have a certain impact on social and economic life, while dynamic calibration has little effect on traffic operation, so it is necessary to perform dynamic calibration of Fiber Bragg grating strain sensors. Aiming at the accuracy of fiber grating strain sensor in measuring dynamic strain value of bridge structure, a calibration method of Fibre Bragg grating strain sensor under dynamic excitation is proposed. The equal-strength cantilever beam is used to simulate the bridge structure, and weights of different weights are suspended instantaneously at the end of the equal-strength cantilever beam to simulate the dynamic excitation generated by the vehicle on the bridge. The resistance strain gauge has a simple structure, high output accuracy and good stability and is suitable for use as a standard sensor for the transmission of strain values. Therefore, a high-precision resistance strain gauge is selected as the reference sensor. The resistance strain gauge is used as the reference sensor, and the Fiber Bragg grating strain sensor is used as the sensor to be calibrated, and the measurement data sequences of the reference sensor and the sensor to be calibrated are compared. The premise of dynamic calibration is that the changes of the magnitude waveform of the sensor to be calibrated and the reference sensor under the same excitation source are basically the same. If the waveform of the two magnitude sequences is poorly matched, the dynamic calibration of the sensor cannot be performed. Because the sampling start time of the reference sensor and the sensor to be calibrated are not synchronized, and their own characteristics are different, the change waveform of the two measured value sequences will appear time misalignment. Therefore, in view of the time dislocation problem in the measurement data sequence, a cross-correlation algorithm is used to match the measurement data of the reference sensor and the sensor to be calibrated. Then, when the Fiber Bragg grating strain sensor has the initial value, the measurement value calibration is studied. When the Fiber Bragg grating strain sensor and the resistance strain gauge have the initial value, the ratio of the wave peak value of the two is used as the sensitivity calibration coefficient of the Fiber Bragg grating strain sensor. The experimental results show that the method effectively solves the time dislocation problem of the measurement data sequence, the data matching rate is more than 98%, and the dynamic calibration of the fiber grating strain sensor is realized. The use of different weights as the excitation source does not effect the calibration results. The sensitivity calibration coefficients of Fiber Bragg grating strain sensors at 1 529 nm and 1 547 nm wavelengths are basically consistent with the static calibration results.
Jan. 25, 2023Vol. 52 Issue 1 0106005 (2023)
Qifan ZHU, Yi CAI, Xuanke ZENG, Hu LONG, Yongle ZHU, Liangwei ZENG, Jingzhen LI, and Xiaowei LU
The existing ultrafast imaging systems can record dynamic events on the femtosecond time scale, but they have the problems of complex components, large systems, limited field of view and time range. The single-shot ultrafast imaging technologies by direct imaging can realize the recording of dynamic images through spatial separation of temporal images. However, their detection systems have the problem of complex structures. The ultrafast imaging system combined with algorithms simplifies the detection structure, but there are some problems, such as complex framing system, limited time range and field of view. This paper proposes a single-shot ultrafast imaging method inspired by the eyes of mantis shrimp, which can be applied to multiple fields of view and wide time range with a compact structure. In this bionic system, the structure light illumination principle is inspired by the orthogonal microvillus arrays, the ommatidium system optical path leads to the optical path of mantis shrimps' ommatidium, and the optical path of compound system is inspired by the compound eye of mantis shrimp, which expands the field of view. Single-shot bionic ultrafast imaging uses a step reflection array to generate sequential pulses of different frequencies and directions and interference fringe structured light illumination to divide the sequential images. It realizes images compressed in a single detector and reconstruction of the continuous images based on the spatial angle division multiplexing algorithm. The bionic mantis shrimp structure can realize single-shot ultrafast imaging, while the compound eye structure is composed of ommatidium systems splice, which can break through the limit size of the field of view to achieve a large field of view. The feasibility of interference fringe multiplexing is verified by static test, and Zemax establishes an optical model to realize the sequential image restoration of ommatidium and compound eye system of 8 images. The framing time is discussed and verified. FDTD simulation is used to verify the feasibility of generating sequential pulses by the step array of mirrors. The framing time can be changed by adjusting the height of adjacent steps, and achieving framing times of 78 fs and 1 ps, and the sequential pulses are not widened compared with the incident pulses. By analyzing the factors affecting the framing time of the bionic single-shot ultrafast imaging system, it can be concluded that the framing time mainly depends on the width of the sequential pulses, so its photographic frequency can reach 1013 frame/s. Besides, the time delay structure and imaging structure are independent. Dispersion element and narrowband filter array can be used instead of mirror arrays to realize time delay. As the dispersion elements can be glass columns, prism pairs, grating pairs, and optical fibers, the bionic system can expand femtosecond pulses to hundreds of femtosecond, picosecond, or nanosecond time scales. Hence the bionic ultrafast imaging system enables the recording of dynamic events on femtosecond, picosecond, or nanosecond time scales. The influence factors of the spatial resolution are then further analyzed. The optical system can achieve high spatial resolution, which can reach the pixel scale of the detector. Furthermore, it can also obtain high-quality restored images, and its intrinsic spatial resolution can theoretically reach 80.6 lp/mm. The bionic system can be used to detect various fields of view by adjusting the focal length of each lens. Hence, it can cover various fields of view. In conclusion, single-shot bionic ultrafast imaging can be applied to various sizes of the field of view in theory, and the framing rate can reach 1.2×10¹³ frame/s in simulation experiment. Single-shot bionic ultrafast imaging provides the possibility for detecting a large range of transient group events, such as light propagation in the scattering media, random motion. Its compact structure lays a foundation for miniaturization and lightweight of ultrafast imaging instruments.
Jan. 25, 2023Vol. 52 Issue 1 0111001 (2023)
Yuqing ZHAO, Zhishan GAO, Qun YUAN, Jianqiu MA, Yifeng SUN, and Zhenyan GUO
Low-coherence vertical scanning interferometry is an effective method for non-destructive testing of micro-structure topography characteristic parameters. However, when the groove aspect ratio of the microstructure is higher than 5∶1, the shading effect and the complex diffraction effect of the step edge will lead to an abnormal vertical scanning measurement interference signal which should contain only one envelope, forming two or even more envelopes, which in turn affects the topography detection results. Establishing an accurate model to describe the modulation of the detection signal by the measurement system and the tested micro-structure parameters is the basis for analyzing the formation mechanism and law of abnormal interference signals, and proposing corresponding topography recovery algorithm. However, the multiple scattering of probe light by the high aspect ratio trench structure is very complicated, and the current diffraction theory is difficult to describe perfectly. The finite difference time domain method can accurately simulate the transmission process of the light field in a discrete time progressive sequence by numerically solving the Maxwell difference equations of the probe light field interacting with the micro-structures. In this paper, the measurement process of low-coherence vertical scanning interferometry is analyzed, and the finite difference time domain method is used to numerically simulate the microscopic imaging and coherent scanning measurement process of the low-coherence microscopic interferometry system, and calculate the modulated light field on the surface of the tested micro-structures and the interference field on the image plane, and finally a low-coherence microscopic interference signal is obtained. The interference signals of the Si-based trench micro-structures with aspect ratios of 5∶1 and 80∶3 are simulated respectively, and compared with the experimental signals of the trench microstructures with above-mentioned aspect ratio measured by the self-developed Linnik type low-coherence vertical scanning interference system. By comparison, the double-envelope characteristics and double-peak characteristics in frequency distribution of the interference signal of the high aspect ratio trench structure are matched to verify the accuracy of the proposed simulation method. The simulation method can be applied to a priori simulation calculation of the low-coherence microscopic interference signal of the measured structure before the actual measurement. By analyzing the signal characteristics in advance, it can guide the optimization direction for the selection and improvement of the topography restoration algorithm.
Jan. 25, 2023Vol. 52 Issue 1 0112001 (2023)
Jisheng XU, Jiaojiao REN, Dandan ZHANG, Jian GU, Jiyang ZHANG, Lijuan LI, and Junwen XUE
Polyethylene pipelines have become the first choice in the field of gas and oil pipelines due to their advantages in corrosion resistance, plasticity and cost performance. Because of their flammable and explosive characteristics, natural gas and oil are prone to safety hazards, so the quality should be strictly controlled in production and use. PE pipes are usually welded on site during laying. Human factors, long-term weathering and corrosion effects in the welding process may lead to defects in the welded joints of pipes. Therefore, the quality inspection of welded joints of pipes is particularly important. At present, the detection methods of hot-melt joints mainly include ultrasonic testing, infrared thermal imaging detection, ray detection, etc. These detection methods have certain limitations in the actual polyethylene pipeline detection.As a non-destructive, non-ionizing, non-contact new detection technology, Terahertz non-destructive testing technology has a strong penetration of non-polar, non-metallic materials. The non-destructive testing technology based on THz imaging technology can obtain the frequency domain, time domain and spatial information of the tested sample, and can clearly image the defects of the material. With high defect detection and positioning ability, it is gradually gaining prominence in the field of non-destructive testing, which can be used as an effective supplement to traditional testing technology.In order to solve the problems of cold welding, over-welding, non-fusion and inclusion defect detection of PE pipe hot-melt joints, reflective pulsed terahertz time-domain spectroscopy with a frequency range of 0.25~2.5 THz is used to detect PE hot-melt joints. The hot-melt welding between PE100 sheets is used to simulate the actual hot-melt welding of polyethylene pipes. Standard hot-melt welding and cold welding, over welding, incomplete fusion and inclusion hot-melt defect joint samples are made. Through point-by-point scanning of terahertz system, the wave pattern and kurtosis imaging at the joint are obtained. In the wave pattern, there is little difference between the cold welding and over welding defect samples and standard welding samples, with obvious differences between inclusion defects and incomplete fusion defects and standard welding samples. The unfused and mixed hot melt defect samples and standard welding samples have obvious difference in waveform, the surface reflection echo of unfused defect is about 50% of the standard welding, the surface echo of mixed defect is between 20% and 40% of the standard welding. In kurtosis imaging, the weld width of cold welding and over welding defects is larger than that of standard hot fusion welding, and there are defects in the weld. Incomplete fusion defects and inclusion defects can clearly see the rough outline of the defect part. The first kind of wavelet scattering network-convolution neural network defect recognition model is constructed for standard welding, inclusion and incomplete fusion defects. The defect recognition rate can reach more than 98%. The second kind of defect recognition model is constructed for quantitative identification of standard welding and metal inclusion, coarse sand and branch defects. The relative error of defect recognition is less than 7.42%. This study lays a foundation for the application of terahertz non-destructive testing technology in the detection of polyethylene pipe hot-melt joints.
Jan. 25, 2023Vol. 52 Issue 1 0112002 (2023)
Leijie FENG, Hubing DU, Gaopeng ZHANG, Yanjie LI, and Jinlu HAN
Optical measurement techniques, such as interferometry, moiré techniques, and digital holography, are the most popular noncontact approaches for measuring three-dimensional (3D) object surfaces in terms of non-invasive, fast, and accurate evaluation. Usually, the property of the measured quantity is encoded in the phase of the intensity distribution of the fringe pattern, which can be decoded by phase retrieval, in other words, the recovery of a complex-valued signal from the sampled intensity patterns. In this way, phase demodulation of the fringe pattern plays a crucial role in the ubiquitous optical measurements. Among various single frame phase demodulation techniques, the high-frequency fringe pattern demodulation technique, such as Fourier transform profilometry, sampling moiré method and spatial carrier phase-shifting have been intensively studied and are mainly based on known analytical models of measurement systems, such as harmonic representation of the intensity of fringe patterns. But for low-frequency fringe pattern, phase reconstruction from only a single interferogram is difficult, especially for those including closed fringes. Sign ambiguity during the single-frame demodulation is one of the main problems that impede the development of single-frame interferometry. In this case, fringe pattern orthogonalization plays a very important role in low-frequency fringe pattern phase extraction. However, due to the ill-posed problem of orthogonalization of a single frame fringe pattern, the development of an analytical method for fringe pattern orthogonalizing is full of challenges. In recent years, researchers have demonstrated that deep learning is a powerful machine learning technique that uses artificial neural networks with deep layers to fit complex mathematical functions, thereby, deep learning provides a promising improvement over classical methods derived from explicit analytical formulations of the forward models. More specifically, deep learning approaches handle problems by searching and establishing sophisticated mapping between the input and the target data owing to the powerful computation capability, and therefore may provide a new solution for the phase demodulation of low-frequency fringe pattern. Inspired by recent successful artificial intelligence-based optical imaging applications, in this paper, we propose to utilize the deep learning to solve this problem of under sampling. This paper shows the new phase retrieval method based on deep learning can effectively improve performance and enable new functionalities for fringe profilometry. In the proposed network, the Generative Adversarial Nets areused to generate digitally the phase shifting of original image by combining the prior knowledge of network and fringe pattern denoising normalization. After training on labeled image pairs, the proposed method successfully implemente the desired phase-shifting fringes pattern, which can be viewed as the orthogonal transformation of a fringe pattern. With this Orthogonal transformation network, the wrapped phase can be extracted easily if the sampled fringes pattern is normalized using a trained deep neural network. The validity of the proposed Orthogonal transformation network is demonstrated on both the simulated and experimentally obtained fringe patterns. We also perform a comparative analysis of the proposed and existing approaches. Herein, we conducted fringe pattern denoising-normalization by using a deep-learning-based method developed because of its high-quality reconstruction ability. Thereafter, we input the normalized FP into the proposed Hilbert transformation network to perform Hilbert transform. We demonstrated our approach on both an open and a closed fringe pattern. Indeed, owing to local phase-sign ambiguity, the processed results show that the unwrapped phase map cannot be reconstructed adequately from the existing D4-PS wrapped map, even for a plane. Further, the reference phase from the proposed method is compared with the phase obtained by the multiple-frame high precision phase shift algorithm. Experimental results show that the proposed Orthogonal transformation network can provide a simple and robust solution for optical phase extraction from a single fringe pattern with phase error distribution within 0.05 rad and, therefore, make it allow for paving a new way to measure object 3D profilometry in a transient situation.
Jan. 25, 2023Vol. 52 Issue 1 0112003 (2023)
Chenxi WANG, Guodong LIU, Fanghui ZHANG, Yinfeng WANG, and Zhongming SONG
Organic Light-emitting Diode (OLED) has attracted extensive attention in display and lighting due to its low power consumption and high contrast. Since a high-efficiency and low-voltage electroluminescent device firstly came out in 1987, there has been a surge of research on the performance improvement of electroluminescent devices. With the progress of processing technology, the performance of OLED has been dramatically improved. However, the production of these OLED is highly dependent on vacuum evaporation technology and requires high thermal stability of their materials. OLED prepared by solution method can overcome these limitations, while it can also present the characteristics of low cost and easy large-scale production, which can meet the demand of the future market for OLED products. Solution treatment of functional layer and matching of energy levels are the key factors to realize the luminescence of devices. However, how to achieve all-solution processed OLED has been a challenge.In the preparation of all-solution processed OLED, the unbalance of electron and hole transport will seriously affect the efficiency of light-emitting devices. Moreover, the electron mobility of most luminescent polymers is lower than the hole mobility, so electron injection is more important than hole injection. At present, the most commonly used material of the electron injection is LiF, but LiF layer is an ultra-thin film layer deposited frequently on the luminescent layer by the evaporation method, which can not be processed into a solution. Ethoxylated Polyethyleneimine (PEIE), as a widely used electron transport material with good solubility, can be processed at a relatively low temperature in ambient air and shows a suitable energy level, which is able to be a substitute for LiF. However, due to its insulating properties, the high concentration of electrons will not be able to transmit from the cathode to the luminescent layer, so exploring the appropriate concentration is a major concern to achieve efficient luminescent devices.In addition, the preparation of transparent electrodes is indispensable for the fabrication of light-emitting devices by the all-solution process. Conductive polymer poly (3, 4-ethylenedioxythiophene) -polystyrene sulfonic acid (PEDOT:PSS) is one of the most important transparent conductive materials. It has great advantages that other conductive polymers cannot compare with, and is expected to become the next generation of transparent electrode materials. The conductive film prepared with PEDOT:PSS often displays high transparency, good mechanical flexibility and excellent thermal stability, which also can be dissolved well in water and polar solvents. PEDOT:PSS, however, presents a very low conductivity of less than 1 S·cm-1, so it is necessary to improve its conductivity by resorting to post-treatment, such as an acid post-treatment onto the prepared PEDOT:PSS film.In this paper, aiming at the formation of functional layers for building an all-solution processed OLED, the emitting layer by spin-coating with a rotation speed of 1000 rpm/min shows an optimal effect of film forming, confirmed by morphology features based on ultra-deep field three-dimensional images and Atomic Force Microscope (AFM) images. Besides, due to the insulating properties of PEIE, different concentrations of PEIE as an electron transport layer can impact on the brightness and efficiency of obtained OLEDs. The measured results have shown that the brightness and efficiency of the device in the low concentrations ranging from 0.5 mg/mL to 2 mg/mL can be enhanced with the increase of concentrations, as the thin PEIE layer formed at a very low concentration is weak for the hole blocking, and cannot prevent hole leakage effectively. However, these characteristics at the high concentrations ranging from 2 mg/mL to 4 mg/mL are decreased as the concentration of PEIE increases. This is because a relatively thick PEIE layer prevents not only hole leakage but also electron injection as well at high concentrations. When the concentration of PEIE is 2 mg/mL, the hole leakage can be effectively prevented and the maximum injected electrons can enhance the balance of carrier transport. Additionally, the sheet resistance of prepared PEDOT:PSS film can be deceased by post-treatment with sulfonic acid, reaching as low as 94 Ω/□, only slightly higher than that of Indium Tin Oxide(ITO), but the transmittance of PEDOT:PSS can reach the same level with ITO electrode. Finally, on the basis of these optimal parameters for the formation of functional layers including emitting layer, electron transport layer and electrode layer, a full-solution processed OLED is prepared in this paper. The experimental results show that the maximum current efficiency is 1.441 cd/A, which are 50 times higher than that of OLEDs prepared with ITO electrode. Therefore, it is also a quite feasible to fabricate the OLEDs by all-solution method except for the vacuum evaporation technology.
Jan. 25, 2023Vol. 52 Issue 1 0123001 (2023)
© Copyright 2018-2021 | Chinese Laser Press.
All Rights Reserved 沪ICP备15018463号-20