


 View fulltext

2023
Volume: 52 Issue 3
26 Article(s)

Shunchun YAO, Songjie GUO, Yan YANG, Jiatong LI, and Zhimin LU
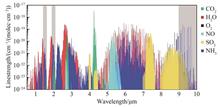
Nitrogen oxides (NOx) are important precursors of air pollution. NOx in the atmosphere mainly comes from the combustion of fuels such as coal, oil, and natural gas. Large energy conversion equipment and motor vehicle exhaust are the main sources of NOx emissions. In order to reduce NOx emissions, China has promulgated various regulations to limit NOx emission values. At present, flue gas denitrification is an important means to control NOx emissions from large energy conversion equipment, including SNCR technology and SCR technology, etc. Among them, SCR technology has the advantages of high denitrification efficiency, low impact on the unit, fully automatic control of the system, easy installation and maintenance of equipment, etc., which has become the most widely used and mature flue gas denitrification technology. Ammonia (NH3) is a common reductant for SCR technology. Although spraying excessive ammonia can improve denitrification efficiency, it is easy to cause ammonia slip. Ammonia slip from flue gas is a problem in many large energy conversion equipment SCR systems. A large amount of ammonia slip not only threatens unit operation and increases system maintenance costs, but also forms secondary pollution, which endangers the air environment and human health, so ammonia slip must be monitored and controlled effectively in real-time.Tunable Diode Laser Absorption Spectroscopy (TDLAS) technology is an advanced trace gas detection technology with the advantages of high sensitivity, selectivity, and real-time online measurement, which is widely used in various pollutant gas detection fields and has become the mainstream technology for flue gas ammonia slip online detection. The modulation spectroscopy technique includes Wavelength Modulation Spectroscopy (WMS) and Frequency Modulation Spectroscopy (FMS). Compared with NIR, the intensity of absorption lines in the 9~10 μm band is 1~2 orders of magnitude higher, making it more sensitive for trace NH3 detection. By adopting appropriate detection methods, analyzers of different wavelengths can basically meet the measurement requirements of flue gas ammonia slip sites. Although the mid-infrared laser source can provide high detection sensitivity, the high cost limits its wide range of applications, and the current commercial products are still mainly 1.5 μm laser sources.The unique physicochemical properties of NH3 with strong adsorption and the complex environment in the flue make online detection of ammonia slips difficult. The complex measurement environment and strict emission limits place high demands on the anti-interference capability, stability, detection limits, and sensitivity of ammonia slip detection equipment. According to the application requirements of SCR denitrification sites, researchers have developed different ammonia slip detection methods, which currently include four main types: in-situ pair penetration, traditional sampling style, permeation tube style, and in-situ sampling style. The in-situ measurement method is simple and does not need to consider the adsorption of ammonia. Currently, most of the large thermal power unit denitrification ammonia slip online monitoring adopts the in-situ measurement style. However, influenced by the flue working conditions, the measurement accuracy is limited, and not suitable for the environment with high dust content. In contrast, the traditional sampling style has a stable measurement environment and can obtain a high signal-to-noise ratio spectral signal. However, the sampling process may lead to changes in flue gas components and has a certain lag, making it difficult to reflect the true value of the flue in real-time. The penetration tube style can avoid the extinction effect of dust and improve measurement accuracy, but requires frequent maintenance. The in-situ sampling style combines the advantages of in-situ and sampling measurement. The measured value is representative, the influence of dust particles can be avoided and the measurement accuracy is high, making it suitable for domestic coal-fired power station boilers with high dust content. Different ammonia slip detection methods have different advantages, disadvantages, and applicability. Currently, in-situ measurement equipment occupies the highest proportion, while the research and application of the remaining three methods are also in progress. Choosing the appropriate detection method according to different site environments is the only way to ensure the accuracy of ammonia slip measurement and the stability of system operation.By analyzing various types of flue gas ammonia slip online analyzers at home and abroad, it is found that their detection limits (or sensitivity) are basically less than 0.5 ppm to meet the site requirements, and the long-term stability of instrument operation depends on the actual situation. In recent years, the development of flue gas ammonia slip detection products based on TDLAS technology has accelerated, especially in China. With the increase of scientific research investment, China's independent research and development capability have gradually improved, and self-designed ammonia slip analyzers with better applicability and programmability will further meet the application needs of China. In my opinion, the in-situ sampling method developed from the traditional sampling method overcomes the shortcomings of the complex sampling system and poor real-time monitoring capability, which is more suitable for ammonia slip detection in domestic coal-fired power station boilers with high dust content, and the combination of calibration-free wavelength modulation, distributed multi-point measurement and other technical solutions can effectively improve the accuracy, real-time and representativeness of ammonia slip detection. Therefore, in situ sampling style ammonia slip analyzer will be further developed and applied.
Mar. 25, 2023Vol. 52 Issue 3 0352101 (2023)
Xing CHAO, Zhen HU, and Ning ZHU
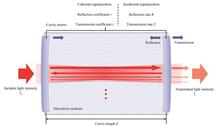
This paper provides a comprehensive review of the recent research development and applications of optical cavity enhanced absorption spectroscopy. It has been well understood in physics that the resonance phenomenon is one of the fundamental principles in various disciplines. It boasts of its powerful capability to filter, amplify, and select signals of specific frequencies. The optical cavity, with its periodic transmission characteristics of only certain frequencies of light, is essentially an optical resonance device.In this review, we provide a summary and logical insights into the recent development progress of Cavity Enhanced Absorption Spectroscopy (CEAS). While the term CEAS has been used to refer to all absorption spectroscopy techniques using an optical cavity in the broader sense, we limit ourselves in this paper to the specific category of techniques that use the transmitted light intensity through the cavity to infer properties of the media. The CEAS technology has the advantages of having a fast response time, high measurement accuracy and reduced space occupation. These allow it to play an important role in spectroscopy and trace gas detection in various applications. The theoretical derivation introduces the principle of signal enhancement by cavity enhancement technique and the diagnostic methods for media absorption. The difference between coherent and incoherent signal enhancement is analyzed to guide further discussion of the technical implementation. Based on this, the development of cavity enhanced absorption spectroscopy, including coherent off-axis CEAS, three-mirror structure CEAS, incoherent optical CEAS and optical comb CEAS, is introduced. This section is based upon the two main demands for species detection with spectroscopic techniques, namely, signal enhancement for trace gas detection and precise spectral measurement, and more spectral information over a broader spectral range for speciation and potentially multi-parameter diagnostics. Such demands have guided the relevant methodologies to be developed into coherent CEAS (on-and off-axis schemes, multi-mirror schemes, etc.), incoherent CEAS (with broadband light sources), and the use in combination with optical frequency comb as a coherent but broadband light source. The characteristics, advantages and main development courses of several main technical systems derived from the development of this method under different requirements are discussed. After that, the main application progress of cavity-enhanced absorption spectroscopy is reviewed from three aspects: atmospheric sensing, biomedical sensing, and chemical kinetics diagnostics. The state-of-the-art achievements in each of these fields are reviewed and summarized. Finally, the future development of cavity enhanced absorption spectroscopy has prospected.In all, by reviewing the design guidelines, recent technological advancements and research achievements of cavity enhanced absorption spectroscopy, this review aims to provide a comprehensive and useful reference for researchers and engineers in relevant research and application fields.
Mar. 25, 2023Vol. 52 Issue 3 0352102 (2023)
Muhammad Bilal, and Zhenyu TIAN
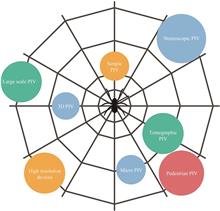
Particle Image Velocimetry (PIV) has emerged as a major experimental technique for measuring the velocity fields of fluid flows. The approach produces quantitative representations of instantaneous flow patterns which are commonly used to help construct phenomenological models for complicated flows and validate numerical simulations. PIV analysis is beneficial in several fields of experimental fluid mechanics. Two-step processing, namely auto-correlation followed by cross-correlation, has been used as a means of examining spatio-temporal flow evolution. The vorticity measurements and estimates of the accuracy as a function of spatial resolution can be achieved. The development of PIV is linked to the gradual increase in the complexity and difficulty of measuring flow fields. PIV techniques for measurements have developed significantly and new trends have emerged. The key developments are stereoscopic PIV, tomographic PIV, large-scale PIV, micro PIV, 3D PIV, pedestrian PIV and the use of high-temporal/spatial-resolution devices. PIV has wide applications in various kinds of research fields, such as medical research, energy fuels, combustion, flow field measurement, real-time process monitoring, structure deformation, irrigation, acoustics, geology, oceanography, water resources, forestry, crowd monitoring, and mining mineral processing. To the best of our knowledge, there have been few literature reviews that comprehensively discuss industrial the aspects of PIV. This review mainly focuses on a comprehensive overview of the development of PIV in the laboratory, which needs to be implemented in industry and daily life by monitoring the real-time process for better understanding. This will lead to fast industrial processing as well as health. Using PIV to replace current analytical imaging techniques with enhanced temporal and special resolution has been discussed. In addition, it also provides a comparison between numerical simulation and previously available analytical techniques with PIV.
Mar. 25, 2023Vol. 52 Issue 3 0352103 (2023)
Lianbo GUO, Xuechen NIU, Mengsheng ZHANG, Jiayuan ZHOU, Deng ZHANG, and Bin LIU
Laser-Induced Breakdown Spectroscopy (LIBS) shows its application prospects in coal detection, metallurgical analysis, biomedicine detection, water quality detection, and other fields because of its advantages of simple sample preparation, fast, in situ, remote, and all-element synchronous analysis. Therefore, it is known as the “future superstar” of analytical chemistry. With the efforts of researchers around the world, LIBS has developed rapidly in various fields, and significant research results have been obtained, which accelerates its commercialization process. Therefore, we focus on the research progress of LIBS in the past five years in the four fields of coal detection, metallurgical analysis, biomedicine detection, and water quality detection.In terms of coal detection, coal is the cornerstone of the energy system. But pollutants such as soot, sulfur dioxide, and nitrogen oxide emitted by coal combustion have caused great harm to our ecological environment. Therefore, researchers have conducted a series of explorations on the coal's detection, greatly improving the quantitative accuracy and detection sensitivity of LIBS. However, the poor industrial environment can interfere with the accuracy of LIBS analysis results. Therefore, to accurately and stably detect the state of coal combustion and timely guide the process of coal combustion, the research and application of the LIBS online instrument will become the development focus in the field of coal detection.In the aspect of metallurgical analysis, metallurgical technology has improved the national economic development level. But the disadvantages of the traditional metallurgical industry are gradually revealed. Therefore, using LIBS technology to select the good quality of raw materials and realize real-time monitoring is of great significance to reduce environmental pollution. Therefore, we summarized the research status of LIBS metallurgy from these aspects. However, due to the influence of various factors, such as device performance and working conditions, the application of LIBS in the field of metallurgy still faces many challenges. With the development of LIBS and the improvement of optical instrument performances, it will play a huge role in energy saving and emission reduction in the metallurgical industry in the future.In the field of biomedicine detection, as a mature analytical technology, LIBS is playing an increasingly important role in biomedical research. Compared with traditional medical diagnostic technology, biomedical detection based on LIBS has unique advantages such as real-time, rapid, and low cost. But these research results lack the physiological and pathological explanation between the changes in elements and diseases. Therefore, it is necessary to combine LIBS with machine learning and pathology. Similarly, practical biological detection equipment will be the next stage of the future development of LIBS.In water quality testing, with the improvement of urbanization and industrialization, wastewater aggravates the heavy metal pollution in water bodies and even seriously harms human health. Therefore, effective and accurate detection of element content in water is the top priority of water pollution control. At present, researchers have proposed a variety of indirect water quality detection methods, which make it possible to detect water element content quickly, efficiently, and stably. However, the field of LIBS water quality detection is still in the laboratory research stage, and the application of LIBS equipment in direct field detection is rarely reported. Therefore, the establishment of a warning system for heavy metal pollution will become the research focus in the future.In summary, although LIBS has made rapid progress in the above four fields, there are still problems such as poor long-term repeatability, poor quantitative accuracy, and low sensitivity in instrumentalization. With the progress of technology, researchers have gradually shifted their research objectives from scientific problems to applications and promoted LIBS to online monitoring.
Mar. 25, 2023Vol. 52 Issue 3 0352104 (2023)
Xiaowen SHEN, Hongpeng WU, and Lei DONG
With the development of photoacoustic spectroscopy, non-invasive photoacoustic imaging technology based on the photoacoustic effect is gradually becoming a research hotspot in biomedical applications. This technology combines the benefits of optical imaging with the advantages of acoustic depth propagation, allowing it to break through the optical diffraction limit and scattering limit while maintaining a high imaging resolution. This article first introduces the principal mechanism of photoacoustic imaging and then introduces the three typical photoacoustic imaging technologies: photoacoustic computed tomography, photoacoustic microscopy and photoacoustic endoscopy. Furthermore, the benefits of these three imaging technologies are compared, and the various methods to improve imaging resolution over the last ten years are summarized. Finally, the future development trend of the three technologies is forecasted.Photoacoustic tomography was the first photoacoustic imaging technique to be developed. Traditional medical tomography plays an important role in diagnosing diseases, but that is not completely safe due to the presence of radiation that can cause some damage to the human body. Photoacoustic tomography is one of the safe imaging methods based on the photoacoustic effect that is radiation-free. Since the 1990 s, photoacoustic computed tomography has made significant progress. Researchers have improved the imaging resolution and imaging reconstruction speed of photoacoustic computed tomography by increasing the number of ultrasound transducers and improving the accuracy of the algorithm. This technology has achieved many excellent results in human breast cancer detection.The advantage of photoacoustic microscopy is that it has a higher imaging resolution at the same penetration depth than the photoacoustic computed tomography system. The photoacoustic signals of photoacoustic microscopy systems are generated at the point where the light and acoustic focal points overlap, so, photoacoustic microscopy systems are usually divided into two categories based on the type of focal point: acoustic-resolution photoacoustic microscopy (AR-PAM) and optical-resolution photoacoustic microscopy (OR-PAM). Researchers are particularly interested in the study of optical resolution photoacoustic microscopy because it can obtain high-resolution imaging results at the subcellular, cell, and tissue levels while allowing for non-invasive detection in vivo and can also be miniaturized under certain conditions for more suitable application in clinical detection technology. In 2005, WANG Lihong designed the first dark-field reflective photoacoustic microscope, and then photoacoustic microscopy technology officially entered the biomedical field. In the last few years, this type of imaging system has made a lot of substantial progress through continuous research on the optical path part, scanning part, and signal receiving part.To image deeper internal tissues and organs, researchers have combined the mature optical endoscopy approach with photoacoustic effects to create photoacoustic endoscopy. In 2009, WANG Lihong was the first to report a rotary mechanical scanning system with built-in optical excitation and micromotor acoustic detection and establish the concept of photoacoustic endoscopy. This method has been continuously improved and optimized by the researchers.The future development of photoacoustic imaging technology will be toward imaging results with high resolution, high timeliness, and high accuracy. Instrumentation will become real-time, small, practical, low-cost, and gradually mature.
Mar. 25, 2023Vol. 52 Issue 3 0352105 (2023)

Mingquan PI, Chuantao ZHENG, Lei LIANG, Fang SONG, and Yiding WANG
On-chip gas sensor based on infrared absorption spectroscopy has the advantages of portability, low power consumption and no need for optical path calibration. Therefore the optical gas sensor has gradually evolved from a large-size discrete system to an on-chip integrated system in recent years. The on-chip gas sensor detects gas based on waveguide evanescent field, and the interaction effect between light and gas is determined by the External Confinement Factor (ECF). However, the ECF of the waveguide is generally smaller than 1. Waveguide length is small and has a non-negligible loss. Compared with the discrete gas sensor system, these disadvantages undoubtedly reduce the sensitivity of the on-chip gas sensor. The following points need to be considered when fabricating an on-chip gas sensor: 1) Appropriate core and cladding materials should be selected to reduce absorption loss at the operating wavelength; 2) Choose and optimize waveguide structure to improve ECF; 3) Consider the feasibility and cost of the fabrication process; 4) Choose appropriate waveguide length according to waveguide loss to improve signal-to-noise ratio; 5) Choose appropriate spectroscopy sensing technique to increase sensitivity.In this review, the on-chip gas sensing method is reviewed, including Direct Absorption Spectroscopy (DAS), Wavelength Modulation Spectroscopy (WMS) and Micro-Cavity-Enhanced Absorption Spectroscopy (MCEAS). DAS technique detects the variation of light intensity, which is easily affected by noise. WMS processes signal in high frequency region and can suppress noise. MCEAS can achieve a large optical path length by an optical cavity with a compact size.Waveguide material and structure are reviewed. Gas has a larger absorption coefficient in the mid-infrared than that in the near-infrared. So transparent material is needed to decrease absorption loss. The commonly used waveguide material and platform for gas sensing are summarized. In addition, the cross-section structures of conventional waveguides are summarized, including rectangular waveguide, rib waveguide, slot waveguide, pedestal waveguide and suspended waveguide. The non-suspended waveguide has low ECF than the free-space with ECF = 1. The suspended waveguide makes full use of the area at the bottom of the core layer, so the ECF of the suspended waveguide can be > 1. But the difficulty of the fabrication process also increases. Photonic crystal waveguide has slow light effect, which can effectively improve ECF. But the loss of the photonic crystal waveguide is larger and limits the size of the interaction length.Theoretical design progress and experimental progress of on-chip gas sensors are summarized. In terms of waveguide sensor structure, sensing waveguide gradually evolved from non-suspended structure to a suspended structure to improve ECF. In the aspect of on-chip integration, on-chip sensors are gradually developing from non-integration (only waveguide) to semi-integration (integrated laser or detector) and full integration. In addition, other physical effects are also combined, such as the adsorption effect and surface-enhanced infrared absorption effect.Finally, the development direction of the on-chip gas sensor has been prospected. First, the biggest advantage of on-chip gas sensing is miniaturization, but the monolithic integration technology of light source, sensing waveguide and detector still needs to be developed, which limits the application of the on-chip gas sensor. In addition, the material and fabrication process of the sensing waveguide are also required to be compatible with the light source and detector. Second, new infrared transparent material can be used to fabricate optical waveguides to reduce the absorption loss of the material. Third, the waveguide length of an on-chip gas sensor also limits sensitivity, and other physical effects can enhance the sensitivity. Fourth, the structure of the optical waveguide directly affects the ECF, so it is necessary to reduce the fabrication difficulty as much as possible on the premise of monolithic integration and large ECF to achieve mass production. Fifth, advanced sensing technology can reduce the noise level of the sensor and improve sensitivity.
Mar. 25, 2023Vol. 52 Issue 3 0352106 (2023)
Mei YANG, Qi WEN, Tingting LIU, Ming YAN, and Heping ZENG
The mid-infrared dual-comb spectroscopy has innovated the detection of trace gases due to its high resolution, high sensitivity, and short response time. The traditional dual-comb system based on mode-locked lasers, electro-optic modulation or nonlinear optical micro-resonators is always combined with shortcomings of complex structure, high cost, few comb teeth, and poor practicability. In recent years, dual-wavelength mode-locked lasers that allow two asynchronous pulse trains to oscillate simultaneously have attracted increasing attention owing to their great potential in facilitating robust and precise dual-comb spectroscopy. In this paper, with two collimators and a segment of polarization-maintaining fiber acting as a Lyot filter, two asynchronous pulse trains centered at 1 034 nm and 1 039 nm respectively can emit from a single-cavity dual-wavelength laser, which is based on a Nonlinear Amplifying Loop Mirror structure. The repetition rate difference between the dual-wavelength pulses is about 1.18 kHz and the 3 dB spectral width per wavelength is ~1.6 nm. The mutual coherence is maintained owing to a shared laser cavity, and common-mode noise is canceled. The radio frequencies of the dual-wavelength pulses are traced and ~60 Hz frequency drift of each wavelength is measured within 10 hours yet only a 3.5 Hz frequency shift and 0.45 Hz standard deviation of the repetition rate difference is observed. The difference in magnitude indicates the high coherence and great environmental stability of the dual-wavelength pulses. To demonstrate the coherence between the dual-wavelength pulses, the multiheterodyne beat notes are detected. Because of the optical spectral overlap, the mode-resolved beat notes with a frequency interval of 1.18 kHz and ~25 dB signal-to-noise ratio are observed. Limited by the resolution bandwidth of the spectrum analyzer, the obtained full width at half maximum of each beat note is about 12 Hz. The average power of the seed pulses is scaled up to 1.1 W with a cascade amplifier to avoid excessive spontaneous emission noise and maintain high coherence. Then, the amplified pulses transform into a mid-infrared band by difference frequency generation with a 2 W continuous laser centered at 1 549.315 nm in the periodically polarized lithium niobite crystal. To improve the conversion efficiency, the temperature of the periodically polarized lithium niobite crystal is accurately controlled at 125 ℃ by high precision temperature control furnace. The power of the generated mid-infrared laser reaches 3.5 mW, and the corresponding spectrum covers more than 50 nm. The spectral width could be expanded by tuning the wavelength of the continuous laser. Moreover, the coherence of the mid-infrared dual-comb is measured and its frequency interval, signal-to-noise ratio and linewidth are consistent with the fundamental dual-comb. According to the Lambert-Beer theory, the absorption intensity of light is proportional to the concentration of the gas molecules and the length of the optical path. Hence, a multi-pass gas cell with an optical path of up to 10 m is employed. The generated mid-infrared laser experiences 50 times of reflection in the gas cell, which can greatly extend the interaction length and is conducive to the detection of trace gases. In a word, we have developed an integrated mid-infrared dual-comb system based on a single-cavity dual-wavelength laser. The two asynchronous pulse trains centered at 1 034 and 1 039 nm with a repetition rate difference of 1.18 kHz can replace the traditional complicated mode-locked lasers and show high coherence due to the suppression of the common-mode noise. The seed pulses are transformed into a mid-infrared band by difference frequency generation in the periodically polarized lithium niobite crystal. The generated mid-infrared dual-comb characteristics are consistent with the fundamental dual-comb. The integrated mid-infrared dual-comb system demonstrated in this paper can provide a potential approach for trace gases detection under complicated conditions.
Mar. 25, 2023Vol. 52 Issue 3 0352107 (2023)
Zhirong ZHANG, Hua XIA, Pengshuai SUN, Runqing YU, Xi YANG, Yuqing LIN, Bian WU, Tao PANG, Qiang GUO, Zhe LI, Xu LIU, Yongjun CAI, Markus W SIGRIST, Brain CALSHAW, and Chimin SHU
Stable isotope technology has been widely used in geochemistry, geophysics, agriculture, biology, clinical medicine and ecological environment science. It is very important for the study of atmosphere, soil, water quality and health to realize the accurate measurement of gas isotope abundance. At present, isotope abundance is measured and analyzed mostly by Isotope Ratio Mass Spectrometers. It is a relatively large, expensive and complex pre-processing, which is not conducive to real-time measurement of isotope abundance in the field. With the development of laser technology, the output wavelength can cover more and more wide bands, and the performance is more better. Many kinds of gases can be detected by laser absorption spectroscopy, and the detection sensitivity is further improved. This makes it possible to measure isotopic gases, which have attracted more and more attention and become one of the hot spots of laser spectroscopy. Compared with the traditional stable isotope analysis instruments, the isotope analysis technology based on laser absorption spectroscopy, as a relatively new isotope abundance measurement method, has the advantages of high selectivity, high accuracy, small volume, real-time online monitoring concentration and abundance, etc. So, the gas isotope analysis system based on laser absorption spectroscopy technology has important application value in environmental monitoring, ecosystem research, pollution tracing and tracing because of its miniaturization, fast response and real-time online measurement. Taking Tunable Diode Laser Absorption Spectroscopy (TDLAS), Integrated Cavity Absorption Spectroscopy (ICOS) and Cavity Ring-Down Absorption spectroscopy (CRDS) as examples, the basic principle, spectrum line selection, system structure and some test results are described in this paper. Under the control of the PID system of temperature and pressure, the temperature control error is 0.003 ℃, and the pressure control error is 0.03mbar, which can meet the requirements of temperature and pressure control during the measurement of isotope gas. The 13C measurement accuracy of atmospheric CO2 is 0.3‰, the 13CH4 measurement accuracy of coalbed methane is 1.25‰, the 18O, 17O and D measurement accuracy of glacial H2O are 0.3‰, 0.2‰ and 0.5‰, respectively. And also, the “gold standard” for 13CO2 of detecting helicobacter pylori infection is also introduced. The feasibility and reliability of laser absorption spectroscopy in isotope measurement are verified. And it is also fully demonstrated that the measurement method based on laser absorption spectroscopy has a very good technical advantage. TDLAS, ICOS and CRDS have become the best choice for the high-sensitivity detection of trace gases and isotope gases. The three technologies have their characteristics: TDLAS technology has the simplest structure, but its cavity volume is large and requires the largest gas samples. The system structure of ICOS technology is relatively simple, but the technology is based on absorption intensity measurement technology, limited by laser intensity noise and frequency drift, which is also a major problem in applying ICOS technology in high sensitivity detection. Therefore, the signal-to-noise ratio and measurement accuracy of ICOS technology is slightly lower than that of CRDS technology. The structure of CRDS technology is relatively complex, and the conditions are relatively harsh, but it can achieve the absorption optical path that the above two technologies cannot reach, so it has the best sensitivity and measurement limits. Based on the above advantages and practical feasibility, laser absorption spectral isotope analysis system will be more and more applied to various fields. And the related system research still has a long way to go. At the same time, laser absorption spectroscopy is also faced with many shortcomings, such as: in these measurements, it is also necessary to consider the error sources such as the concentration dependence of the instrument and the time drift. A certain correction frequency should be set for periodic correction to eliminate the influence of the instrument drift, and the measurement results with accuracy and accuracy meeting the research needs should be obtained through appropriate correction strategies.
Mar. 25, 2023Vol. 52 Issue 3 0352108 (2023)
Zhihui TIAN, Shuqing WANG, Lei ZHANG, Peihua ZHANG, Zefu YE, Zhujun ZHU, Lei DONG, Weiguang MA, Wangbao YIN, Liantuan XION, and Suotang JIA
Thermal power plants in China have the dual tasks of energy security and energy conservation and emission reduction, with coal accounting for 50% to 70% of their operating costs. Faced with the implementation of energy conservation and emission reduction, low-carbon environmental protection, and energy transformation policies, promoting the clean and efficient utilization of coal has become the primary task of thermal power plants. Therefore, measuring the coal quality, pricing according to the quality, and optimizing combustion are the important ways for their production and development. However, China has a large variety of coal and a large difference in coal quality, so thermal power plant generally has the problem that the actual supply of coal and boiler design do not match each other, results in high power generation costs and low combustion efficiency. In order to achieve the optimal control of coal blending and combustion in thermal power plant, the key is to achieve rapid quality analysis and fine management of incoming coal and fired coal. The common methods of coal quality analysis in power plants include manual assay, robotic assay, neutron activation, Laser-Induced Breakdown Spectroscopy (LIBS) and X-Ray Fluorescence Spectroscopy (XRF). Both manual and robotic assay use traditional national standard chemical analysis methods, but the former requires multiple equipments and is time-consuming, while the latter is bulky. In addition, although the analysis results of the traditional national standard method are reliable, it is difficult to analyze the coal in each vehicle or on the belt online due to its long time consumption, which cannot be used for accurate blending and optimized combustion control. Neutron activation online monitor is highly sensitive, but radioactive and expensive. LIBS has the advantages of fast online and simultaneous detection of multiple elements, but the measurement repeatability needs to be further improved. XRF has high repeatability, but it is unable to analyze organic light elements in coal. In this study, based on the proposed coupled multi-spectrum method of LIBS and XRF, we designed a new software-controlled rapid coal quality analyzer, which includes LIBS analysis module, XRF analysis module, sample feeding module, control module, and operation software. This analyzer not only plays the strengths of LIBS for full elemental analysis, but also inherits the advantages of XRF for high stability analysis, which can be used in power plants for fast and continuous analysis of coal pellets. In addition, the spectrum analysis based on Partial Least Squares regression (PLS) method was modeled for hundreds of coal samples. The analysis process of the spectral data included pre-processing of LIBS and XRF spectrum, coupled LIBS-XRF modeling, and model testing, where the accuracy of the model was characterized by the correlation coefficient (R2) and the mean absolute error (Δ), and the repeatability was tested by the Standard Deviation (SD). The industrial testing and performance evaluation were also completed at Shanxi Sunshine Power Plant. We collected spectra of hundreds of coal samples and pre-processed them, then established prediction models using Partial Least Square (PLS) method, and finally completed industrial testing and performance evaluation in Shanxi Yangguang Power Plant. The test results showed that the R2 of the prediction models for calorific value, ash content, volatile matter, and sulfur content were 0.973, 0.986, 0.977, and 0.979 respectively, and the average standard deviations were 0.11%, 0.49%, 0.15% and 0.09% respectively. The model results showed good accuracy and stability, and the measurement repeatability meets the requirements of national standards. The average absolute errors of the analyzer in predicting the calorific value, ash content, volatile matter and sulfur content of coal were 0.39 MJ/kg, 0.83%, 0.50% and 0.23% respectively, and the single measurement takes about 5.5 minutes, which can meet the needs of industrial practical application. This XRF-LIBS coal quality quantitative analysis technology with excellent measurement repeatability is expected to be applied to power plants, coking plants, coal washing plants, cement plants, coal chemical industry and other industrial fields that need to pay attention to coal quality at all times.
Mar. 25, 2023Vol. 52 Issue 3 0352109 (2023)
Chaofeng YANG, Chenying SHEN, Juncheng LU, Juan WANG, and Jie SHAO
A strong adsorption effect appears while ammonia passes through a tube or cell, and its polar molecules can easily stick to the wall surface. This results in low sampling quality, slow systemresponse, and low peak concentration, which largely affects the accuracy of gas-monitoring techniques. This work aims to develop a rapid and sensitive monitor system for ammonia concentration, and presents an evaluation method for ammonia desorption at the same time.The developed system of ammonia concentration monitoring makes use of a Quantum Cascade Laser (QCL) operating at 8.91 μm as its light source, along with the technique of Wavelength Modulation Spectroscopy (WMS) and multiple-pass cells of low-volume and long-pathlength. Particularly, we study the spectrum of ammonia absorption at 1 122.16 cm-1 and implement a direct gas absorption monitor of ammonia under different pressures by fitting multiple direct absorption spectrum lines to its Lorentz curve, which analyzes the effects of gas pressures on the absorption spectrum within the specified spectrum range and lays the application foundation for wavelength modulation technology to obtain the 2f ammonia absorption spectrum curve in the target spectrum band.To suppress the system noise, improve its signal-to-noise ratio and further implement the measurement of ammonia wavelength modulation, the optimal pressure for ammonia gas monitor by wavelength modulation technology is hence set to be 0.8 atm.By monitoring the wavelength modulation of ammonia at different concentrations, it shows a perfect linearity between the amplitude of the obtained second-order harmonic wave and gas concentration, with a linear fitting of 99.50%. In the meanwhile, at the ammonia gas concentration of 0~100 ppm, the average error of the second-order harmonic wave is less than 3%, when the relative error is less than 1% at the gas concentration of 10 ppm~100 ppm, along with a sensitivity of 10.35 ppm/V. To evaluate the system stability, ammonia gas at the concentration of 6.25 ppm is prepared to make measurements when flowing through multiple-pass cells. By means of Allen variance analysis on the developed system, the system detection limit of 121.58 ppb is reached at its best integration time of 195 s.In addition, we conduct experiments on the absorption effects of ammonia under different tube materials and gas temperatures. For example, the system response time for detecting ammonia for the PU tube at the gas concentration of 6.25 ppm and room temperature is 138 s, while the system response time for PTFE is 19 s at the same gas concentration and a temperature of 200.The system developed in this work demonstrates excellent performance in the experiments of monitoring ammonia gas absorption in practice. On the other hand, it provides a novel method for studying ammonia absorption.
Mar. 25, 2023Vol. 52 Issue 3 0352110 (2023)
Haizhen WANG, Xue CHENG, Tinghao LIN, and Dehui LI
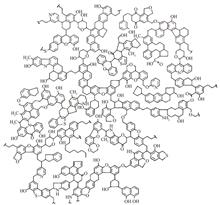
In addition to amplitude, frequency and phase, the polarization states of light can also carry information and thus will find important applications in imaging, medical detection and optical communication. Traditionally, the generation and detection of polarized light mainly rely on the combination of commercial unpolarized light sources and photodetectors with polarizer and wave plate, which are usually bulky and costly. Therefore, it is urgent to develop alternative strategies to achieve on-chip compact polarized light source and detector. Optical anisotropy is related to the polarization response of optoelectronic devices, which is the basis for polarization optical elements such as polarizers, wave plates, and phase matching devices. The study on the optical anisotropy is of great significance for polarization-sensitive photodetectors and light emitting devices. In recent years, perovskites have received extensive attention due to their prominent optoelectronic properties and potential applications in optoelectronic devices. In particular, one dimensional perovskites are expect to exhibit large optical anisotropy due to the crystalline structure anisotropy. Together with the excellent optoelectronic properties of perovskites, we anticipate that one dimensional perovskites will find promising potential applications in the polarization-resolved optics. However, its optical anisotropy has been rarely reported. Our previous study has reported on the optical anisotropy of one-dimensional single chain perovskites, which exhibits a large emission linear dichroic ratio of 5.5 at room temperature. Nevertheless, this linear dichroic ratio is still not large enough for certain polarization resolved applications and far smaller than the linear dichroic ratio of the commercial optical elements. In this end, it is necessary to explore new materials to enhance the optical anisotropy.According to previous reports, it is possible to further increase the optical anisotropy by reducing the symmetry of the crystalline structure of a materials. By reducing the symmetry of the crystal structure, the octahedral structure of perovskites is more prone to distort, which increases the anisotropy of the transition dipole moment, thus increasing the optical anisotropy. Based on this principle, we design a one dimensional double chain perovskites, which will have a much lower symmetry compared with one dimensional one chain perovskites and thus can possibly exhibit a much larger optical anisotropy. The single crystal of one dimensional double chain perovskite C5H16N2Pb2I6 crystals are synthesized via aqueous synthesis route. The as-synthesized crystals show needle-like shape with a length of 2~3 mm. X-ray diffraction pattern reveals the excellent crystal quality and one-dimensional nature of the crystals. Scanning microscope images show that the crystals have a rather smooth surface, which is beneficial for the spectroscopic measurement. The photoluminescence (PL) spectra of the as-synthesized crystals suggest that the spectral profile strongly depends on the excitation laser. Under a 405 nm laser excitation, the PL spectrum has a strong narrow emission peak at the high energy side and a weak broad emission peak at the low energy side while the spectrum is dominated by the broad emission peak when excited by a 473 nm laser. Nevertheless, both of those two emission peak show a linearly increase with the increasing the excitation power, which can exclude that those emission peaks are from defects or impurities. Together with previous studies, we assigne those two emission peaks as free exciton emission and self-trapped exciton emission. Since the broad emission can find important applications in white light emitting devices, we focus on the optical anisotropy of the broad emission peak hereafter.The temperature dependent polarization resolved PL studies have been carried out from 78 K to 260 K. For all temperature range we have investigated, a large optical anisotropy of PL spectra has been observed. At 78 K, the linear dichroic ratio can reach about 15.9, which is 7 times larger than that in a one dimensional single chain perovskite crystals (1.92). This observation confirms our hypothesis that reducing the symmetry of the crystalline structure of a material can indeed improve the optical anisotropy. The maximum linear dichroic ratio of our crystals appears at 110 K, which can be as large as 17.4, and also much larger than the maximum linear dichroic ratio in one dimensional single chain perovskite crystals (5.5). Finally, we have also extracted the complex dielectric constant, birefringence and dichroism of our crystals based on the reflection spectra via Kramers-Kronig relation. The birefringence and linear dichroic ratio reflect the real and imaginary part of complex dielectric constant, which are intrinsic properties of a materials and originated from the optical anisotropy of a material. The extracted dichroism and birefringence can reach 1.5 and 1.3, respectively. The birefringence of our crystals is much larger than the highest values reported in liquid crystals.In summary, the optical anisotropy of one-dimensional double chain perovskite crystals has been systematically studied, and the optical anisotropy of the crystals is proven to be improved by reducing the symmetry of crystals. Our study is of great significance for polarization sensitive optoelectronic devices based on one-dimensional double chain perovskites and shed light on how to further improve the optical anisotropy via deigning the crystal structure of a material.
Mar. 25, 2023Vol. 52 Issue 3 0352111 (2023)
Sha CHEN, Yanting YANG, Xu WANG, Qingwen FAN, and Yixiang DUAN
It is one of the basic works to determine the elemental contents of cuttings' samples from different depths in the process of oil and gas exploration and development. An accurate element logging map can provide significant information for identifying lithology, predicting the formation to be drilled, selecting suitable drilling parameters and reducing drilling risks. With the disadvantages of complex operation processes, complicated sample pretreatment and long analysis time, most traditional element analysis technologies are difficult to meet the requirements of rapid analysis for cuttings at thelogging site. In recent years, X-ray fluorescence spectrometry technology has been widely used in the logging field for real-time online element analysis due to its portability, low sample demand and fast detection speed. However, based on its technical principles, XRF has a certain radiation risk, and it is poor to detect light elements (atomic number < 11). As a promising analytical technology, laser-induced breakdown spectroscopy technology has the advantages of real-time, in-situ, simple structure and multi-element simultaneous analysis, which meets the actual need of rapid analysis for cuttings logging. The experimental system used in this study was a self-developed benchtop laser-induced breakdown spectrometer, mainly consisting of a Nd: YAG laser, three spectrometers, a digital delay generator and several optical fibers and lenses. A total of 1320 LIBS spectra of 66 rock samples, including 49 Chinese national standard rock samples as training samples and 17 supplementary samples as test samples, were collected by the instrument. The characteristic peaks including 288.16 nm (Si Ⅰ), 308.22 nm (Al Ⅰ), 445.48 nm (Ca Ⅰ), 516.73 nm (Mg Ⅰ) and 769.90 nm (K Ⅰ) were selected as target peaks for quantitative analysis. To improve the data stability and repeatability, a part area normalization was proposed. Different from total area normalization, only considering18 characteristic spectral lines of 9 main elements in rocks, part area normalization could take into account the mapping relationship between the spectral line intensity and content of the element, reduce the spectral difference caused by the inconsistent ablative amount and weaken the influence of matrix effect. Based on the training data set, the appropriate data pretreatment method was selected from three normalization methods (including min-max normalization, total area normalization and part area normalization) for each element. To improve the quantitative accuracy, a coefficient correction method based on a principal component regression algorithm was proposed to correct the characteristic peak intensity. On the basis of the calibration curve of peak intensity after normalization and content established for each element, the ideal peak intensity and correction coefficient between peak intensity corresponding to different content could be calculated. PCR algorithm was used to establish models for calculating correction coefficients with the input of the full spectrum data. Then, the quantitative analysis models for five target elements were established upon the corrected peak intensity data. The test data set was applied to evaluate the quantitative models. The coefficients of determination (R2) of the Si, Al, Ca, Mg and K between LIBS predicted values and known contents were 0.974 5, 0.941 1, 0.984 3, 0.990 1 and 0.811 4, respectively, which proved the effectiveness of quantitative models. Finally, to verify the feasibility of application in logging site, the quantitative models were integrated into the self-developed instrument to analyze 97 cuttings samples from the same well at different depths, which were collected from a drilling site in southwest China and provided by Chengdu Aliben Science & Technology Co., LTD. The predicted results were compared to the detection values obtained by using the laboratory XRF. The coefficient of determination (R2) between LIBS predicted values and XRF detected values of Si, Al, Ca, Mg and K were 0.971 9, 0.960 4, 0.947 9, 0.965 2 and 0.924 5, respectively, which indicates that the instrument integrated with the quantitative models can rapidly and effectively analyze cuttings element content. In the light of the analysis results, the variation curves of contents for five target elements were plotted, which demonstrated the overall variation trends of element contents obtained by LIBS and XRF were basically consistent. Based on the variation trends of LIBS predicted values, the changes of lithology and formation could be analyzed, which were consisted with the real situation at the logging site. The research results showed that this instrument integrated with the developed quantitative models is expected to achieve rapid and effective quantitative element analysis for cuttings, and has good potential application value in the field of oil and gas exploration and development.
Mar. 25, 2023Vol. 52 Issue 3 0352112 (2023)
Tiantian LIANG, Yinghao HONG, and Yufei MA
Gas sensing technology can detect gas concentration with high sensitivity and has significant application demands in the fields such as atmospheric chemistry, hazardous gas monitoring, etc. Compared with the non-spectral gas sensing technology, spectral technology utilizes the characteristic fingerprint spectrum of gas molecules, so it has excellent selectivity. The traditional photoacoustic spectroscopy technology employs the microphone as the acoustic detection element. However, the problems of the microphone itself, such as low Q value, wide response band, large background noise, and the large volume of the photoacoustic cell, restrict the practical application of this technology. In contrast to this, Quartz-Enhanced Photoacoustic Spectroscopy (QEPAS) and Light-Induced Thermoelastic Spectroscopy (LITES) take the Quartz Tuning Fork (QTF) as the acoustic wave detection element and light energy detection element respectively. Due to QTF having the characteristics of a narrow response frequency band (~4 Hz), high Q value (~10 000), an unnecessary photoacoustic cell, and so on, QEPAS has the advantages of anti-noise, small size, compact structure, low price, and so on, while LITES also has the advantage of non-contact detection. QEPAS and LITES have developed rapidly in recent years, and it has become a hotspot in gas sensing. Considering that both QEPAS and LITES technology can generate photoacoustic signals in the experiment and microresonators are usually devoted to increasing the acoustic signal strength. Therefore, in this manuscript, based on the resonance enhancement effect between the incident acoustic wave and the reflected acoustic wave, a non-one-dimensional resonant cylindrical cavity was designed to enhance the signal strength of the sensing systems and is first applied in out-of-plane incident QEPAS and LITES techniques. Firstly, the simulation model of QTF was established using the QTF size with the standard frequency of 32.768 kHz and was defined as a piezoelectric material. A cylindrical cavity was constructed near the QTF. Subsequently, the finite element analysis method was used in this paper. With and without adding the cylindrical cavity, respectively, to theoretically simulate and optimize the swing amplitude of the QTF and the position of the cylindrical cavity. The simulation results show that the QTF amplitudes in QEPAS and LITES are increased by 3.7 times and 1.9 times, respectively, after the addition of cylindrical cavities, compared with bare QTF. The experimental research, used a QTF with a standard resonant frequency of 32.768 kHz. Water vapour was selected as the target gas to test system performance, and its spectral line at 7 168.43 cm-1 with a line intensity of 1.196×10⁻²⁰ cm/molecule was chosen as the target line to avoid interference from other gases in the air. A diode laser with an emission wavelength of 1.395 μm was adopted as the excitation source to match the water vapour absorption line. At this time, the output power of the laser was 18.9 mW. The low-frequency sawtooth wave output by a signal generator was employed for the coverage of the water vapour absorption line. The high-frequency sine wave generated by a lock-in amplifier was used to modulate the output wavelength. The two signals were superimposed and fed to the laser driver. The lock-in amplifier also demodulated the piezoelectric signal generated by QTF into the second harmonic signal, and its integration time and rolling coefficient were set as 100 ms and 18 dB/oct, respectively. To obtain the best response from the system, all experimental results were measured at the resonance frequency of the QTF and the optimum modulation depth (0.43 cm-1). To make full use of the acoustic waves generated by the photoacoustic effect, the cylindrical cavity was made of 304 stainless steel material with high reflectivity, and a small hole slightly larger than the size of the QTF was machined on the side of the cylindrical cavity so that the QTF can be put into the cavity. The Minimum Detection Limits (MDL) of QEPAS and LITES systems with the cylindrical cavity were 17.27 ppm and 7.21 ppm respectively. Compared to the bare QTF system without the cylindrical cavity, the performance is improved by 2.32 times and 1.27 times. The experimental result is slightly different from the theoretical simulation result, caused by the deviation of the mesh division degree in the simulation, the piezoelectric conversion efficiency and the resonance frequency of the QTF from the actual.
Mar. 25, 2023Vol. 52 Issue 3 0352113 (2023)
Yuan JIANG, Ruijian ZHENG, Xinke XU, Longyang REN, Gang ZHAO, Yanting ZHAO, and Weiguang MA
The economic loss and the threat to personal safety caused by the leakage of hazardous chemical gases in natural gas stations, mining, industrial chemicals, manufacturing, gas pipeline transportation and other places are huge. It is extremely necessary to strengthen the real-time monitoring and warning of such hazardous chemical gas leaks. However, traditional detection methods have defects such as slow response, high maintenance cost, low efficiency, the need for close contact sampling and testing, and the inability to monitor in real time. In recent years, tunable diode laser absorption spectroscopy has become a key technology for trace gas detection, with the advantages of fast measurement response and strong wavelength selectivity. In order to realize real-time, long-distance and non-contact monitoring of hazardous chemical gas leakage and to improve monitoring efficiency and accuracy, a multi-component trace gas remote sensing system based on wavelength modulation spectroscopy is proposed. The core of the system is based on STM32 chip combined with a self-designed driver circuit to control the laser, and the second harmonic signals of methane, ammonia and acetylene are extracted separately by using different modulation frequencies to realize simultaneous, real-time and long-distance detection for the mixed gases. We use wavelength modulated spectroscopy with light intensity modulation amplitude normalization to make the remote sensing results free from the influence of the echo laser on the signal intensity. By comparing the direct absorption signal and the second harmonic signal of the gas concentration detected by the system, it is verified that the wavelength modulation technique has a significant noise suppression effect and can greatly improve the detection sensitivity and detection distance. Through calibration experiments, the measurement accuracy and lower detection limits of the system are evaluated. The experiments have shown that the lower detection limits of the system can reach 87 ppm·m, 212 ppm·m and 12 ppm·m for methane, ammonia and acetylene, respectively, and the measurement error is less than 10%. We tested the remote detection performance of the system over long distances, and the results showed that the remote detection distance can be up to 40 m. The system provides a multi-component, real-time, synchronous, high-sensitivity, long-distance and stable performance remote sensing solution for the research and application of laser trace gas detection, which can be widely used in gas monitoring and early warning of mine disasters, gas leakage monitoring and early warning of hazardous chemical field stations and transportation pipeline networks.
Mar. 25, 2023Vol. 52 Issue 3 0352114 (2023)
Fengxiang MA, Yue ZHAO, Xinyu ZHAO, Nan WANG, Taiyun ZHU, Chen HANG, and Ke CHEN
SF6 gas is a chemically stable and non-toxic inert gas with excellent insulation and arc extinguishing properties. It is widely used as an insulating medium in high-voltage electrical equipment. SF6 decomposes under a strong electromagnetic field to produce a variety of low-fluorine sulfides and then chemically reacts with impurities such as trace H2O and O2 existing in the equipment to produce HF, SO2F2, CO, CF4, H2S, SO2 and other gases. The type and severity of faults inside the equipment are closely related to the type and content of SF6 decomposition products. SO2 gas is one of the important characteristic components of SF6 decomposition products, which can effectively reflect the severity of latent faults inside SF6 gas insulation equipment and is highly corrosive. The increase of SO2 content will aggravate metal surface corrosion and increase the degree of discharge. Therefore, real-time monitoring of trace SO2 concentration is an important means to ensure the safe and stable operation of power systems. Photoacoustic Spectroscopy (PAS) based on the Beer-Lambert absorption law has been applied in the detection of SF6 decomposition products due to its advantages of no carrier gas, high detection sensitivity, good selectivity and fast response speed. SO2 gas was excited to a high-energy state after absorbing a broad-spectrum light of 275 nm. The life of the high-energy state was extremely short. The modulated excitation light source caused the temperature in the Photoacoustic Cell (PAC) to change periodically, and the pressure inside the non-resonant PAC with good sealing changed accordingly, generating a Photoacoustic (PA) signal. The signal processing unit inverted the concentration information of the SO2 gas to be measured according to the amplitude of the PA signal detected by the acoustic sensor. A set of SO2 detection device based on ultraviolet PAS was built using a miniaturized non-resonant PAC with a gas chamber volume of only 0.79 mL, which realized the high-sensitivity detection of SO2 in SF6 background gas. An Ultraviolet Light Emitting Diode (UV-LED) with a central wavelength of 275 nm and an output optical power of 3.233 mW was selected as the PA excitation light source of SO2 gas, which avoided the absorption interference of ultra-high concentration SF6 background gas and greatly reduced the system cost. The modulated excitation beam passed through the ultraviolet quartz window and vertically passed through the gas to be measured in the PAC and exited from the window at the exit end. The internal pressure of the non-resonant PAC was evenly distributed. Two acoustic sensors were symmetrically embedded in the PAC to receive the exciting sound signal in real-time and convert it into an electrical signal. Finally, the concentration information of the gas to be measured was calculated. The amplitude-frequency response of the non-resonant PA system was tested to obtain the best PA signal amplitude. In the range of 0 Hz to 500 Hz, the maximum frequency response of the system occurred at 40 Hz, and the PA signal amplitude was the highest when the operating frequency was 40 Hz. The detection sensitivity and linear response of this PA system were evaluated. Different concentrations of SO2/SF6 mixed gas were filled into the non-resonant PAC to analyze the PA response of the system to SO2 gas. In the concentration range of 0 ppm to 100 ppm, there was a good linear relationship between the excitation PA signal amplitude and the SO2/SF6 mixed gas concentration, with a responsivity of 5.59 μV/ppm. The system's Minimum Detection Limit (MDL) was mainly affected by acoustic sensor noise and the background drift in the cell wall and window absorption. The normalized noise equivalent absorption (NNEA) coefficient normalized the absorption line intensity and the effective power of the excitation light. The NNEA coefficient was 7.2×10⁻⁸ cm-1W·Hz-1/2. The detection sensitivity and stability of the system were evaluated by Allan-Werle deviation analysis. The Allan-Werle deviation analysis results showed that the Allan-Werle variance showed a continuous downward trend with the increase of the average time, indicating that the system has good stability, and the white noise in the system mainly limited the detection sensitivity. Therefore, the sensitivity of the detection system can be improved by a longer averaging time. The MDL of the system for SO2 reached 0.1 ppm with an average time of 100 s. The proposed high-sensitivity SO2 gas in-situ detection technology provided an effective solution for judging the failure degree of SF6 gas insulation equipment.
Mar. 25, 2023Vol. 52 Issue 3 0352115 (2023)
Wenxue PAN, Yinbo HUANG, Dandan LIU, Jun HUANG, Leilei ZHANG, Jianyu LI, Xingji LU, and Zhensong CAO
Nitrous oxide (N2O) is an important anthropogenic greenhouse gas (GHG) in the atmosphere, except for carbon dioxide (CO2) and methane (CH4). There are 75% of N2O sources come from agricultural activities, and the rest is mainly caused by the decomposition of fossil fuel. However, large amounts of N2O will accelerate the greenhouse effect. Because N2O absorbs ultraviolet radiation (wavelength shorter than 315 nm) and photolysis to NO, which will lead to the destruction of the ozone layer. For decades, the global greenhouse potential of N2O is approximately 300 times higher than CO2, thereby causing the significant warming effect on global climate. According to statistics, the globally averaged mole fraction of N2O in the atmosphere was 333.2 ppb (parts per billion by volume) in 2020, representing a 1.2 ppb increase compared to 2019.Ground-based Fourier Transform Infrared (FTIR) spectrometer is an ideal gas concentration detection method with high accuracy, continuous measurement and high sensitivity to ground sources. The Total Carbon Column Observing Network (TCCON) is a ground-based network of Fourier transform spectrometers (FTSs). It was established in 2004 and focused on the accurate measurement of GHG column abundance, through the near-infrared (NIR) solar absorption spectroscopy. The scientific objective of the network is to provide a reference between satellite measurements and the ground-based in situ networks, which can provide the long-term global distribution of N2O mole fractions. All TCCON sites adopt the high-resolution “Bruker OpticsTM IR FT spectrometer (IFS) 125HR” which has high accuracy and excellent performance for GHG detection with a resolution of 0.000 96 cm-1.Due to the relatively high cost of IFS 125HR and the lack of infrastructure and strict network requirements, observations are significantly limited. Compared with the IFS 125HR, the compact and portable GHG observation equipment EM27/SUN spectrometer is a flexible supplement. The EM27/SUN was developed jointly by KIT and Bruker, which has been commercially available since 2014. The EM27/SUN is a portable greenhouse gas observation instrument. The built-in SUN tracker can accurately track the sun's trajectory. The lightweight and compact structure can satisfy the requirements of measuring and retrieving the column-averaged dry air mole fraction of the target gas in the outfield.The observations of the total columns of N2O were carried out in Science Island, Hefei. To invert the column concentration, we first obtained two absorption bands of N2O in the near-infrared spectrum by the LBLRTM simulation based on the standard atmospheric model. Among them, the absorption band of 4 373.5~4 441.6 cm-1 contains the strong absorption of CH4 and H2O, and another one of 4 682.5~4 756.1 cm-1 contains the weaker absorption of H2O and CO2. Based on analysis, the better absorption band for retrieving is 4 682.5~4 756.1 cm-1. After obtaining the optimal absorption band, we can achieve the inverse of the column concentration with the improved PROFFAST algorithm. In particular, the PROFFAST is a search algorithm package developed and maintained by Dr. Frank Hase at KIT, which applies to EM27/SUN. This algorithm, combined with the best estimation method, has been verified to be applicable to the inversion of dry air mole fraction (DMF) of trace gases in EM27/SUN low resolution measurement. The observation results of the EM27/SUN and high-resolution TCCON were comprehensively compared in this paper. The average dry air mole fraction of N2O (XN2O) observed by the EM27/SUN spectrometer is 311.76~334.92 ppb (average 323.26 ppb) in 6 months under a clear sky, which is consistent with the TCCON inversion value. Concretely the XN2O variation amplitude observed by the EM27/SUN spectrometer and TCCON is 319.11~325.37 ppb and 322.40~329.29 ppb, respectively. In XN2O, the overall deviation between EM27/SUN and TCCON is about 0.84~7.88 ppb, and the relative error range is 0.26%~2.41%. The observed value of EM27/SUN is slightly lower than that of the TCCON station. The relative error range is reduced to -0.90%~1.36% by using the empirical correction factor in post-processing. The results of this study provide data and reference for further research on the changes in N2O column concentration in Hefei.
Mar. 25, 2023Vol. 52 Issue 3 0352116 (2023)
Qiang WANG, Hao WANG, Cong XIAO, and Jinsong LI
Laser spectroscopy is a powerful analytical technique based on the interaction process of light and matter (including absorption, reflection, scattering, refraction, interference, etc.), which can provide various useful information (such as composition, concentration, velocity, flux, etc.) by analyzing the detected spectral signal and combing the related physical principles. With the continuous innovation of modern laser light sources and photodetector devices, the laser spectroscopy technique has also been developed rapidly. In terms of the three core components of the laser spectroscopy system (i.e., laser light source, absorption cell, and photodetector) and signal enhancement and noise suppression methods, various advanced laser spectroscopy techniques or detection methods have been developed. Quartz-enhanced photoacoustic spectroscopy and photothermal spectroscopy is a new and rapidly developing laser spectroscopy technique, which utilizes miniaturized quartz tuning forks as detectors with the advantages of small size, high quality factor, and low cost. Quartz-enhanced photoacoustic spectroscopy is a spectroscopic technique that measuring the aco of light and gas in a radiation-free relaxation process, which utilizes the resonance effect and piezoelectric effect of the quartz tuning fork as an acoustic detector. However, the quartz-enhanced photothermal spectroscopy technique is based on the thermoelastic effect using quartz tuning fork as a light detector. To date, quartz-based enhanced photoacoustic and photothermal spectroscopy have been successfully applied to detect many small molecules with narrow absorption spectra and several large molecules with broad, unresolved spectral absorption features. These two techniques have been widely used for developing real-time and compact trace gas sensors with high sensitivity and selectivity.In this paper, a dual-spectroscopy detection technique based on quartz tuning forks is proposed to further improve the sensitivity of the quartz tuning fork based spectroscopic detection technique. To demonstrate this proposed gas detection technique, atmospheric water vapor (H2O) was used for the analytic target and a dual-spectroscopy gas detection system based on two quartz tuning fork detectors (i.e. (QCTF1 and QCTF2) is developed by combing a near-infrared (NIR) diode laser emitting near 1 392 nm, the laser beam is directly coupled into an optical fiber collimator and allowing pass between the two vibrating arms of the QCTF1 detector, which is used to detect the photoacoustic signal generated from the absorption process of atmospheric water vapor. The laser beam between the two arms of the QCTF1 is then focused on the surface of the side arm of the QCTF2 detector through a CaF2 lens, which is used to detect the photothermal signal generated in the same environmental conditions. Moreover, the wavelength tuning characteristics of the laser were measured before the experiments, and the dependence of the emission wavelength on the driving voltage of the DFB laser at a temperature of 34 ℃ was obtained to ensure that the laser emission wavelength could effectively cover the absorption line of H2O near the optical wavelength of 1 391.67 nm. Since other gas molecules in ambient air, such as CH4, CO, O2 and CO2 have not obvious absorption features near 1 391.67 nm, therefore, the spectral interference from other molecules can be effectively avoided. The resonance profile curve and the signal amplitude of the quartz tuning fork detectors are precisely measured as a function of the excitation position, and the optimal modulation frequency and excitation position are also experimentally determined, which is of great significance to improve the detection sensitivity of the proposed dual-spectroscopy detection technique. To further improving the sensitivity, the wavelength modulation technique is combined with the phase-dependent characteristics, and the effective signal enhancement of the wavelength modulated photoacoustic and photothermal spectral signals are realized by using the difference detection principle, which effectively utilizes the laser power compared with the single spectraldetection method used in the traditional detection scheme. The experimental results show that the overall Signal-to-Noise ratio (SNR) of the proposed dual-spectroscopy detection technique is 1.97 and 1.24 times higher than those of photoacoustic and photothermal spectral signal, respectively, which effectively improves the system detection sensitivity. Finally, the relationship between the photoelectric conversion efficiency of the quartz tuning fork and the incident laser power in the dual-spectroscopy detection technique is investigated. The experimental results show that the quartz tuning fork detector has a good linear response to the incident laser power with a regression coefficient R2=0.996, which indicates the sensitivity can further improved by using laser sources with more high output power.
Mar. 25, 2023Vol. 52 Issue 3 0352117 (2023)
Xiyuan ZHAO, Yumei QI, Yadong QIAO, Yang LI, Yuhang WANG, and Fengping WANG
Based on the characteristics of light transmission in a long path absorption cell, a laboratory simulation system for measuring the extinction characteristics of atomphere pollution particles is designed. The system consists of an extinction characteristics measurement device and an atmosphere pollution particle simulation device. The extinction characteristics measurement device consists of a laser, an open Herriot long path absorption cell, and an optical power meter. In the extinction characteristics measurement device, the laser is divided into two beams. One beam enters the open long path absorption cell, and this beam then is reflected many times by the internal high reflective mirrors of the open long path absorption cell and is emitted from the outlet of the open long path absorption cell. Finally, this beam is received by the optical power meter at the outlet of the open long path absorption cell. The other beam after splitting is directly received by the optical power meter at the entrance of the open long path absorption cell. The extinction coefficient is calculated by the laser powers monitored at the entrance and outlet of the the open long path absorption cell. During the measurement of the laser power, the difference method is adopted to reduce the error caused by fluctuations in laser energy, and improve the accuracy of the extinction coefficient measurement. The open Herriot long path absorption cell can reflect a certain wavelength of light through two fixed high reflective mirrors multiple times to increase the optical path. At the same time, it is convenient to clean the internal mirror and improve the measurement sensitivity of the extinction coefficient. Meanwhile, the concentration of particulate matter for extinction is measured in real-time. The atmosphere pollution particle simulation device is mainly composed of an atmosphere pollution particle simulation generation device and an atmosphere pollution particle collection device. The atmosphere pollution particle simulation generation device is composed of a blower, an atmosphere pollution particulate matter storage box and an atmosphere pollution simulation generation box. The simulation generation of atmosphere pollution particles is to place the air pollution particles in the air pollution particle atmosphere pollution particulate matter storage box, and then the blower is used to blow the particles into the air pollution simulation generation box. In the atmophere pollution simulation generation box, the particles with larger particle size will settle at the bottom of the box due to gravity, and the particles with smaller particle size will enter the pollution simulation detection module with the air flow for extinction measurement. The atmosphere pollution particle collection device is an air filter, which can well adsorb the pollution particles in the pollution simulation detection module, and reduce the pollution to the laboratory. The air pollution particle generation device and the air pollution particle collection device can well control the concentration in the pollution simulation detection module. At the same time, a small meteorological station placed in the pollution simulation and detection module can monitor the concentration of pollutant particles in the module in real time. In order to verify the rationality of the extinction measurement system, the extinction coefficients of particles with different diameters and the extinction coefficients of particles with different components are measured in the laboratory simulation system. By measuring the extinction coefficients of SiO2 particles with different particle sizes, it is found that the extinction coefficients of SiO2 particles with different particle sizes are significantly different. And then by measuring SiO2 particles and AL2O3 particles with the same particle size finds that the extinction coefficient of particles with different components are also significantly different, which further explains that particle size and refractive index are the main factors determining the extinction coefficients. By comparing with the extinction coefficient measured by lidar in the atmospheric haze, the reliability and rationality of the extinction simulation measurement system are proved.
Mar. 25, 2023Vol. 52 Issue 3 0352118 (2023)
Qing YAN, Bo PENG, Li WANG, Dong WANG, Hualong ZHAO, Fei GAO, and Dengxin HUA
The ultra-high peak power and ultra-short pulse time characteristics of the femtosecond laser allow it to act quickly on a specific area during machining, and the material in the area of the laser beam is removed in the form of a plasma eruption to achieve cold machining with almost no thermal impact on the surrounding material. Laser cold machining technology is widely used because of its high processing accuracy, small heat-affected zone and high machining efficiency. One of the important applications is the machining of air film holes in aero-engine turbine blades. Due to the existence of hollow cavities and the close distance between the opposite walls of the aero-engine turbine blades, the hole making process is prone to contramural damage. Therefore, in order to avoid contramural damage and improve the quality of air film hole machining, a real-time detecting system needs to be developed to judge the hole penetration status during the hole machining in real time. Laser Induced Breakdown Spectroscopy (LIBS) is a kind of atomic emission spectroscopy technology, which has a fast response time and can achieve real-time detection and analysis of the target under test. In the LIBS detection system, a spectrometer is used to collect the emission spectra excited during the plasma cooling process of femtosecond laser machining, and the elements corresponding to each spectral line can be identified according to the characteristic wavelength of atomic or ion emission spectra in a specific wavelength band, and quantitative analysis can be achieved by measuring the intensity of emission spectra captured at a specific wavelength. Aiming at the problem of contramural damage in the machining of aero-engine turbine blade with femtosecond laser, a hole penetration detection scheme based on laser-induced breakdown spectroscopy detection technology of femtosecond laser hole making is proposed. Based on the elemental analysis of the material and the information of the LIBS spectrogram obtained in the wavelength 520~560 nm during processing, the emission spectrum of Cr(I) 521.531 nm is selected as the characteristic spectral line, and the change in intensity of the characteristic spectral line is used to realize the judgment of the hole machining process. In this paper, we design a laser cold machining hole penetration spectroscopy detection system consisting of an ultrashort pulse laser, a grating spectrometer, a focusing optical path and an upper computer for data processing and analysis. The effect of important machining parameters on the detection performance of LIBS is studied experimentally, and the effect of machining parameters on the spectral intensity is analyzed, and the optimized machining parameters are selected as laser energy of 32 W, the distance of the part to be processed from the focus of 150 mm, and the laser spin speed of 2 400 r/min. The designed hole penetration detection system is used to continuously collect and analyze the plasma spectra during the actual hole machining, and the correspondence between the specific spectral intensity and the penetration state of the sample to be processed in the hole machining is obtained. The intensity of the spectrum peaks at the beginning of the hole punching because of the high percentage of upward reflection of the atomic emission spectra during the laser exit stage; the overall intensity of the atomic emission spectra gradually decreases as the hole depth increases; the detected intensity of the atomic emission spectra starts to decrease significantly when the hole starts to penetrate gradually; when the hole is completely penetrated, there are no reflected back characteristic spectral lines and only background noise with spectral line intensity less than 230. The experimental results verify the feasibility of the method in solving the problem of preventing damage to the opposite wall during femtosecond laser hole machining, and can provide real-time feedback on the completion of hole processing to help the development of the feedback system, which is conducive to the further optimization of laser cold machining technology in terms of accuracy and efficiency.
Mar. 25, 2023Vol. 52 Issue 3 0352119 (2023)
Lingyan CAO, Zhijun LI, Hongchao QI, Jikuang ZHAO, Chenxi LI, and Ke CHEN
The detection of dissolved acetylene (C2H2) in transformer oil is an important means to detect the operating state of transformers. In order to realize the low concentration of dissolved acetylene gas in oil, a detection system of dissolved C2H2 gas in oil based on a miniature resonant Photoacoustic (PA) cell is designed. The oil sample was put in a vacuum oil tank. Then the dissolved gas in oil diffused into the vacuum part of the oil tank. Because of the diffusion of the dissolved gas, the vacuum of the oil tank decreased. The gas was pumped into a gas cell after a set time. The gas in the gas cell was pumped into the detection system by a gas pump to obtain the concentration of C2H2. The degassing time was about 40 min. A Distributed Feedback (DFB) laser was selected as the excitation source of the PA signal. According to the spectrum data of C2H2 obtained from the HITRAN database, the central wavelength of the DFB laser was chosen to be 1 532.83 nm with an emission spectrum width of 0.3 pm after considering the cross interference of H2O and CO2. The output power of the DFB laser was 13.2 mW. To keep the laser power stable, the temperature of the DFB laser was kept to be 27℃. The output of the DFB laser was modulated by a sine signal which was produced by a signal processing circuit of a Field Programmable Gate Array (FPGA). The power of the laser was amplified to 200 mW by an erbium doped fiber amplifier before the laser was emitted into the PA cell through a fiber collimator. The volume of the PA cell was 12.4 mL. In the PA cell, the laser was reflected by a gold-plated mirror with 98% reflectance to double the absorption length. According to the principle of the PA, the PA signal was increased with the increase of the absorption length. A constant temperature device was used to stabilize the temperature of the PA cell at 30℃ to prevent the resonant frequency of the PA cell from drifting due to temperature changes. An electric microphone was used to detect the PA signal. The responsibility of the electric microphone was good between 10 Hz and 10 kHz. A lock-in amplifier based on FPGA was used to extract the second harmonic signal from the electric signal of the microphone. The response frequency range of FPGA lock-in amplifier was 1 Hz~10 kHz. Finally, the electric signal was processed by a LabVIEW program to obtain the concentration of dissolved C2H2 in oil. The signals of 50 μL/L standard C2H2 gas was recorded during the frequency range from 1 000 Hz to 3 000 Hz. The maximum value of the signals was obtained at the frequency of 2 565 Hz. Because of the use of second harmonic technology, the resonance frequency of the PA cell was 5 130 Hz. Modulation current and bias current were determined to be 5 mA and 102.8 mA respectively at the resonance frequency. Dissolve different volumes of C2H2 standard gas into transformer blank oil to prepare oil samples with concentrations of 2 μL/L, 10 μL/L, 20 μL/L, 40 μL/L and 50 μL/L. Under the condition mentioned above, the responsibility of dissolved C2H2 in oil was 1.475 μV/μL?L-1. The performance of the system was verified by repeated experiments on dissolved C2H2 in oil samples of various concentrations. And the system had good repeatability with the absolute error value of each test within ±0.2 μL/L. The minimum detection limit of the system for dissolved C2H2-in-oil samples is 0.2 μL/L. The detection system realizes an ultra-high sensitivity measurement of dissolved acetylene gas in oil, which can provide a new technical solution for on-line monitoring of dissolved gas in transformer oil.
Mar. 25, 2023Vol. 52 Issue 3 0352120 (2023)
Fengxiang MA, Yue ZHAO, Nan WANG, Xinyu ZHAO, Min GUO, Chenxi LI, Taiyun ZHU, Chen HANG, and Ke CHEN
SF6 is applied as an insulating medium in gas-insulated equipment due to its excellent insulation and arc extinguishing properties. However, aging or overheating within the equipment can cause partial discharge, resulting in the decomposition of SF6 to form low-fluoride compounds, which react with water and oxygen inside the equipment to produce the characteristic gas H2S. As a decomposition product of SF6, H2S is one of the characteristic components of fault diagnosis of gas-insulated equipment, and has strong corrosivity and toxicity. The inferior nature of this gas can lead to serious damage inside the equipment. Therefore, high-sensitivity online monitoring of trace H2S gas is of great significance for the stable operation of gas-insulated equipment. Detection techniques for SF6 decomposition products envelop non-optical and optical methods. Beer-Lambert-based Photoacoustic Spectroscopy (PAS) sensing technology is an indirect absorption spectroscopy technique that has gained a wider range of attention than non-optical detection methods due to its advantages of no gas load, no maintenance, fast response time, and high sensitivity. When the concentration of the gas to be measured is unchanged, the excitation light efficiency of the photoacoustic signal can be enhanced by increasing the length of the absorption path. The excitation light injected into the multi-pass cell is collimated by the collimator and reflected back and forth between the concave mirrors installed on both sides of the buffer of the photoacoustic cell. H2S has a good spectral line absorption peak in the near-infrared band. The near-infrared laser is incident on a multi-pass photoacoustic cell after power amplified, and the excitation efficiency of the photoacoustic signal is greatly improved through multiple optical reflections. Combined with acoustic resonance amplification, optical fiber amplification and wavelength modulation-second harmonic detection technology, a set of photoacoustic spectroscopy gas detection system is built to achieve high-sensitivity detection of trace H2S gas in SF6 background. A 1 574.56 nm near-infrared distributed feedback DFB laser cascaded a high-power Erbium-doped Fiber Amplifier (EDFA) is selected as the excitation light source of the system. A single-mode fiber-optic and a collimator are used to collimate the light source into the photoacoustic cell. The photoacoustic cell consists of a resonant tube and two buffer chambers flanked by concave mirrors. The photoacoustic signals are detected in real time by capacitive sensors, and then processed by a Field-programmable Gate Array (FPGA)-based lock-in amplifier. The second harmonic signals are obtained by the LabVIEW program, and the concentration of the target gas to be detected is calculated. SF6 is a gas with special physical properties such as high density, high diffusion coefficient and low specific heat capacity, which is easily affected by the high-pressure environment inside the field work equipment. COMSOL simulation software is used to simulate the resonance frequency of the photoacoustic cell in SF6 background and N2 background, and the experimental results are consistent with the simulation results. In SF6 background, the photoacoustic cell resonance frequency is reduced to 638 Hz. In order to effectively improve the amplitude of the photoacoustic signal of the fiber amplification laser photoacoustic spectroscopy detection system based on wavelength modulation-second harmonic detection technology, the amplitude of the modulation parameters is optimized. When the modulation current of the DFB laser is set to 3.5 mA, the amplitude of the photoacoustic signal detected by the system is the highest. To assess the response of the multi-pass photoacoustic cell to the measured gas concentration, the high-purity SF6 gas is mixed with a H2S/SF6 mixture of 50 ppm in a certain proportion, and the system shows a good linear response of 9.59 μV/ppm for H2S gas concentrations up to 50 ppm. A continuous charge of pure SF6 gas into the multi-pass cell is used to measure the noise level and evaluate the Minimum Detection Limit (MDL) of the system. The standard deviation (1σ) of the noise is 0.85 μV. The experimental results show that the Normalized Noise Equivalent Absorption (NNEA) coefficient is 2.23×10⁻⁹ cm-1·W·Hz-1/2. Allan deviation analysis is performed on the noise over a time period of 1 000 s. The Allan deviation result shows that when the averaging time is 100 s, the MDL of the system is 27 ppb. The system gradually stabilized with the increase of the mean time. The detection limit on the order of ppb provide a favorable solution for diagnosing the failure of gas insulation equipment.
Mar. 25, 2023Vol. 52 Issue 3 0352121 (2023)
Zheng CHEN, Bo SUN, Lei DONG, and Hongpeng WU
Quartz-enhanced photoacoustic spectroscopy technology has the characteristics of zero-background, excitation wavelength independence, compact structure and cost-effectiveness. Compared with conventional photoacoustic spectroscopy, the innovation of the quartz-enhanced photoacoustic spectroscopy is that a quartz tuning fork is employed as an acoustic transducer instead of the wideband microphone. However, the narrow gap size and the high resonant frequency of the commercially available quartz tuning fork prongs limit the abroad application of quartz-enhanced photoacoustic spectroscopy in many fields. To overcome the disadvantage mentioned above, a custom quartz tuning fork which can reduce the resonance frequency while keeping high quality factor was designed. The finite element software COMSOL Multiphysics was used to estimate the stress field distribution along the quartz tuning fork prongs when the quartz tuning fork was designed. The calculation method of resonant frequency is analyzed by combining thr Euler-Bernoulli equation. For a traditional tuning fork quartz, to reduce the resonant frequency of the tuning fork, the length of the prongs should be increased while the width of the prongs should be reduced. At the same time, to obtain a higher quality factor, the width of the prongs must be increased, which results a higher resonant frequency of a tuning fork. Hence, the high quality factor and the low resonance frequency cannot be taken into account at the same time for the traditional shape of tuning fork quartz. From the results of theoretical analysis, the hammer-shaped prongs can optimize the strain field between the prongs and their support effectively. Hence, a quartz tuning fork with hammer-shaped prongs was designed. The homemade quartz tuning fork has the larger gap size ~800 μm between two prongs, which is nearly three times larger than the prongs' gap size of the standard quartz tuning fork. In the meantime, the quality factor and the resonant frequency of the homemade quartz tuning fork were optimized by 14% and 62% respectively, and the compact quartz-enhanced photoacoustic spectroscopy sensor for C2H2 detection was demonstrated by using hammer-shaped quartz tuning fork to verify the performance characteristics of the novel custom quartz tuning fork. A near-infrared distributed feedback diode laser with a center wavelength of 6 523.88 cm-1 and an output power of ~12 mW was served as the C2H2 quartz-enhanced photoacoustic spectroscopy sensor excitation source. A so-called acoustic micro-resonator was employed in addition to the hammer-shaped quartz tuning fork for increasing the C2H2 quartz-enhanced photoacoustic spectroscopy signal amplitude via the acoustic resonance effect. The acoustic micro-resonator was assembled in an “on-beam” quartz-enhanced photoacoustic spectroscopy configuration, in which the acoustic micro-resonator was formed by two metallic thin tubes and was coupled to the homemade quartz tuning fork via the excited sound wave in gas contained inside the acoustic micro-resonator tubes. Both the length and assembly position of the acoustic micro-resonator were optimized in terms of signal amplitude and signal-to-noise ratio. And the two parameters mentioned above were selected to be 9 mm and 1.5 mm by experiment respectively. The second-harmonic detection technique was employed to reduce the sensor background noise and simplify the data process. The wavelength modulation depth was optimized at room temperature and atmospheric pressure. The hammer-shaped quartz tuning fork based C2H2 sensor achieved a minimum detection limit of 282×10-9 for a 300 ms averaging time and 12 dB/oct filter slope, which corresponds to a normalized noise equivalent absorption coefficient of 3.84×10⁻⁹cm-1W/Hz. The results mean that the detection sensitivity was improved by a factor of about one order of magnitude, compared to the case of a sensor using a commercially available quartz tuning fork.
Mar. 25, 2023Vol. 52 Issue 3 0352122 (2023)
Nana YANG, Bo FANG, Chunhui WANG, Hao ZHOU, Nana WEI, Weixiong ZHAO, and Weijun ZHANG
The hydroxyl (OH) free radical is one of the most important oxidants and is at the origin of the majority of chemical transformations in the troposphere. It plays a key role in the formation of ozone and secondary organic aerosols. Accurate and quantitative measurements of OH radical is of great significance to atmospheric chemistry research and air quality control. However, due to the low concentrations in the atmosphere (~106 molecule/cm3), high reactivity, and very short lifetime (<1 s), current techniques that can be successfully employed for tropospheric OH measurement are extremely limited. Therefore, there is a strong driving force for the development of new techniques. Off-axis Integrated Cavity Output Spectroscopy (OA-ICOS) based on Lambert-Beer law can offer an ultra-long optical pathlength on the order of kilometers utilizing a high-finesse optical resonator with a limited optical base length. In addition, the off-axis paths through optical cavity can actively excite higher-order transverse modes and effectively reduce the influence of cavity mode fluctuation. These advantages make it a powerful tool for sensitive measurement of OH radical. We reported the development of a mid-infrared OA-ICOS experimental setup. A room temperature continuous-wave distributed feedback diode laser emitting at 2.8 μm was used as the probe laser. The Q(1.5e) transition line of OH radical located at 3 568.52 cm-1 was selected for detection. The integrated cavity consisted of two 25.4-mm diameter high-reflectivity dielectrically coated plano-concave mirrors (1 m radius of curvature) separated by a distance of 35.8 cm. The measured effective reflectivity of the cavity mirrors was 0.999 3, corresponding to the effective optical path of 512 m. In this mid-infrared OA-ICOS system, the amplified spontaneous emission of the distributed feedback laser, which is usually on the order of nanowatts and is a kind of unwanted broadband radiation outside the highly reflective band of the cavity mirrors, directly passed through the cavity without resonating. This amplified spontaneous emission was received by the detector together with the weak valid absorption signal, causing interference in measurement. It was found that the absorption was about 70 times underestimated due to the amplified spontaneous emission, which needs to be effectively avoided. To reduce the 1/f noise and improve the sensitivity of this system, wavelength modulation spectroscopy was applied. The laser current was swept and modulated by a triangle wave and a sinusoidal wave around the absorption peak to obtain the second harmonic (2f) signals. The sample of OH radical were generated by the reaction of H2O and O(1D) produced by O3 photolysis. The concentration of OH in the cavity was determined by a reference absorption line of H2O in the same spectral region at 3 568.55 cm-1 whose concentration could be calculated by direct absorption spectroscopy. The strong linear relationship (correlation coefficient of 0.999 4) between 2f signals and concentrations was exhibited. Based on a typical spectrum measured under an OH concentration of 4.84×10⁹ molecule/cm3 and 100 s data acquisition time, the noise level was evaluated by standard deviation from the non-absorption wing, giving a signal-to-noise ratio of about 38. From these results, the detection limit of OH radical was determined to be 1.2×10⁸ molecules/cm3 (1σ). The performance of this spectrometer can be further improved by reducing the residual cavity resonances, using higher reflectivity cavity mirrors to increase the absorption path length and signal intensity, re-injecting to the cavity via a third mirror and improving the effective gain of the detector. In particular, the Wavelength Modulation Off-axis Integrated Cavity Output Spectroscopy (WM-OA-ICOS) technique in the mid-infrared provides a new direct spectral method for OH radical detection. The successful combination of OA-ICOS and wavelength modulation spectroscopy means that OA-ICOS also can be combined further with other modulation technologies, such as frequency modulation spectroscopy, to achieve shot-noise limited detection.
Mar. 25, 2023Vol. 52 Issue 3 0352123 (2023)
Qingxin HUANG, Shanshan LI, Runhua LI, and Yuqi CHEN
The accurate determination of plasma electron density is of prime importance for the analysis of plasma dynamic process and quantitative analysis in Laser-Induced Breakdown Spectroscopy (LIBS) and Spark Discharge assisted Laser-induced Breakdown Spectroscopy (SD-LIBS). Among the techniques for experimental determination of the electron density in LIBS and SD-LIBS, the most widely used is the purely spectroscopic method based on the measurement of the Stark-broadened profiles of reference lines with known values of their Stark widths. However, it is difficult to get precise line Stark broadening parameters of complex atoms and ions theoretically, this method is mostly used for spectra of simple atoms and ions. In general, the optical thin Hβ line of hydrogen is preferable for the diagnosis of plasma electron density due to its strong enough profile, the negligible effect of temperature on Stark broadening, and reliable parameters. There are several problems in determination of plasma electron density, such as due to the limitation of the resolution of the spectrometer, it is difficult to measure the Stark broadening of the spectral line, the Stark broadening coefficient of the measured element spectral line is unknown, and sometimes there are no hydrogen spectral lines that can be used. In order to solve these problems, measurement of electron density utilizing the Stark broadened profiles of Hβ and Ag I lines in SD-LIBS was studied.The laser pulse was focused on the surface of the sample along the direction perpendicular to the sample surface to ablate the sample and generate the plasma. The inorganic salt powder containing hydrogen was selected as a sample. The potassium dihydrogen phosphate (KH2PO4) powder was pressed into a pellet under 21.4 MPa of pressure. The sample was mounted on a two-dimensional motion platform to ensure that each laser beam irradiates on the new target surface. Two pure silver needles were selected as the anode and cathode of the spark discharge. The voltage was added to the spark gap through the charged capacitor which was connected to the two electrodes. Once the laser ablated the sample then the laser plasma was generated, spark discharge would happen automatically, and enhanced optical emissions could be observed immediately. The plasma emission was collected by a compact multichannel fiber spectrometer through a light collection system consisted of two quartz lenses under non-gated signal recording mode. The whole experiment was carried out in the atmosphere, and each data point was the average of 10 laser pulses.Firstly, the emission spectra of the plasma in SP-LIBS and SD-LIBS were discussed. The results show that both Hβ line and Ag I at 520.91 nm signal intensities are significantly enhanced in SD-LIBS and interference of close lines of other elements with Hβ profile are less. Secondly, Stark broadened profiles of Hβ line and Ag I at 520.91 nm were determined. The Stark full width at half maximum was obtained from precise fitting of the measured line shapes to Lorentzian and Voigt shapes. The average electron densities inferred from Hβ line was 1.1×1017 cm-3 under current experimental condition. Thirdly, the effect of discharge capacitance on plasma electron density under different discharge voltages was experimentally studied. The results show that with the increase of discharge capacitance, the energy of injected plasma increase, and more particles are excited from low energy level to high energy level. The average electron density of plasma in SD-LIBS also increases. With the increase of discharge capacitance, the change of discharge voltage will also bring obvious changes in the average electron density of plasma. Fourthly, the relation between the Stark broadening of Ag I line at 520.91 nm and the calculated electron density from Hβ line under different discharge parameters was determined. The plasma electron densities obtained from Hβ line shows strong linear dependence on the Stark broadening of Ag I line at 520.91 nm which is clear from the least square fit of 0.982. Although there is no precise Stark broadening parameter for Ag I 520.91 nm spectral line, it is impossible to calculate the plasma electron density directly through the Stark broadening of Ag I at 520.91 nm in SD-LIBS, the Stark broadening of Ag I spectral line can be used to indirectly determine the plasma electron density according to the correction curve measured experimentally.In the SD-LIBS technology, the plasma electron density can be measured indirectly by using the pure silver needle as the discharge electrode according to the Stark broadening of the silver atomic spectrum line when detecting the sample without hydrogen. This method will be helpful to accurately determine the plasma parameters in SD-LIBS technology, and has good scientific significance for further expanding its application field.
Mar. 25, 2023Vol. 52 Issue 3 0352124 (2023)
Tengfei BO, Yafei LI, Baolin LI, Zhuo MA, Chuantao ZHENG, and Yiding WANG
In agricultural harvesting operations, agricultural fires can be induced due to various human or natural factors. Agricultural fires pose a great threat to agricultural production and the safety of life and property, so it is imperative to accurately monitor agricultural fires. At every stage of fire, gas can be produced. So gas sensors have been developed rapidly in the field of fire detection. In case of a fire, the burning of crops will produce a large amount of carbon monoxide (CO) and carbon dioxide (CO2), which will lead to a rapid increase in the concentration of CO and CO2 in the air. Real time monitoring of changes in the concentration of CO and CO2 can give an alarm. A gas sensor based on Non-Dispersive Infrared (NDIR) has the advantages of high integration and low cost, which is conducive to miniaturization design, on-site detection and commercial promotion. Therefore, many studies on NDIR gas sensors have emerged. However, the reported NDIR sensors only show good performance under laboratory conditions, but often do not perform well in low temperature environments. The main reason is that the internal infrared thermoelectric detector is prone to temperature drift in low temperature environments, and it is difficult to work normally under low temperature conditions. In view of this phenomenon, a small temperature control system is designed for the infrared detector, and is applied to a NDIR CO2 detector. Then the detector can be maintained at 21 ℃ in a low temperature environment at -40 ℃. Finally the purpose of making the sensor work normally under low temperature environment is achieved.Firstly, the detection principle of the infrared gas detector is introduced, and the relationship between harmonic signal and gas volume fraction is determined according to Lambert-Beer law. The system structure of the detector is analyzed, which is mainly composed of an electrical module, an optical module, an upper computer monitoring module and a detector temperature control module. Under a low temperature environment below -20 ℃, the output signal from the detector has serious drift, which may even cause irreversible failure to the sensor. Then, the hardware circuit and software program of the temperature control system are designed according to the structure of the detector and the light source. The temperature signal collected by PT100 is converted into a digital signal through an analog-to-digital converter and is collected by the master controller. The sampling temperature is calculated to obtain the adjustment value, and then a heating film drive circuit is used to control the detector temperature. In the hardware part, the influence of the wire resistance on the temperature acquisition is eliminated, and a BUCK driver circuit is modeled. In the software program, both positive temperature and negative temperature are solved by different formulas, and the PID algorithm is improved. Finally, the temperature control system is integrated into the fire detector. Under the ambient temperature of -40 ℃, the temperature is controlled from an initial temperature of 20 ℃, and the response time to stabilize the detector temperature at 21 ℃ is 16 s. The stability of the temperature is 0.012 6 ℃ (1σ). The response time and stability meet the temperature control requirements in low temperature environments. Under the condition of temperature control, the sensor is calibrated, and the first harmonic amplitude ratio of the voltage signals from the absorption channel and the reference channel obtained from the gas calibration experiment and the concentration of the standard gas are exponentially fitted to obtain an exponential fitting curve, with a goodness of fit of 99.852%. The stability of the detector is tested for 25 min using pure nitrogen (N2) sample, and the measured concentration fluctuation range is -28.128 76×10-6~27.240 5×10⁻⁶. Allan variance is introduced for sensor performance evaluation. When the averaging time is 0.25 s, the lower detection limit is 1.213 01×10-6; when the averaging time is 114.75 s, the theoretical lower limit of detection can reach 4.822 5×10⁻⁷. The experimental results show that the temperature control system can ensure the normal work of the fire detector in a low temperature environment, and has practical application value.
Mar. 25, 2023Vol. 52 Issue 3 0352125 (2023)
© Copyright 2018-2021 | Chinese Laser Press.
All Rights Reserved 沪ICP备15018463号-20