


 View fulltext

2022
Volume: 51 Issue 12
29 Article(s)

Pengdan ZHANG, and Jifeng NING
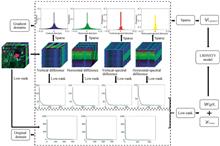
In recent years, with the rapid development of remote sensing technology, Hyperspectral Images (HSI) have attracted more and more attention. Compared with full color and multi-spectrum remote sensing, hyperspectral remote sensing has higher spectral resolution, which greatly improves the recognition ability of surface coverage and the accuracy and reliability of ground object analysis. With the continuous updating of sensors, people can obtain remote sensing images of different space resolution and spectral resolution on different aviation and aerospace remote sensing platforms. Compared with previous remote sensing technology, hyperspectral remote sensing has the characteristics of combining maps and a series of bands from visible light to infrared and even thermal infrared. Especially in the case of weak information on the ground, hyperspectralremote sensing has the advantages of identifying weak information and quantitative detection. The development of hyperspectral remote sensing technology to meet the needs of military and civilian technology is very necessary and practical to carry out research in this field. HSI consists of different intensities, which represents the radiation points of hundreds of discrete wave bands captured by the sensor. Compared with traditional images, HSI helps to provide more reliable expressions for real scenes, so it is often better in various computer visual tasks, such as classification, super resolution, compression perception, mineral exploration, etc. However, under actual situation, HSI is always seriously affected by noise. These noises are usually caused by sensor sensitivity, photon effects, light conditions, and calibration errors. Therefore, HSI denoising is a key problem, and solving this problem can greatly improve the performance of subsequent HSI processing tasks, which is an important and challenging research topic. Around this topic, many experts have proposed various noise models and achieved good results. By studying the existing noise models and analysis of the characteristics of HSI, a new HSI denoising model is established in this paper. Compared with the previous models, the ability to remove mixed noise and retain image details has been strengthened. By analyzing the structural characteristics of HSI, a HSI denoising model based on tensor low-rank decomposition, mixed space-spectral gradient domain low-rank decomposition and group sparse prior is proposed in this study. Firstly, the high-order gradient is introduced to fully explore the intrinsic contact between the high-order differential direction. The HSI is converted from the original domain to the gradient domain by using 1st and 2nd gradient operators, and the weighted norm is established on the mixed gradient tension to explore the gradient group sparse prior of the HSI. Secondly, the low-rank priori of HSI is explored in both gradient domain and the original domain. The low-rank property of the gradient domain is proved by the low-rank theory of transform domain, and it is constrained by the minimization of nuclear norm. The classical tensor Tucker decomposition method is then used to ensure the low-rank prior to the original domain of HSI. The new model makes full use of the prior information of HSI, effectively removes the mixed noise, and greatly improves the performance of subsequent HSI processing tasks. This technique is of great practical significance to meet military and civilian needs. Finally, through a lot of experiments on simulated datasets and real datasets, the superiority of the new model in the field of hyperspectral image denoising is proved. Compared with the suboptimal model, the average peak signal to noise ratio and the average structural similarity index of the proposed model are improved by 5.35 dB and 0.009 respectively.
Dec. 25, 2022Vol. 51 Issue 12 1210001 (2022)
Yong ZHU, Qin XIAO, Zhengzhou LI, Guojin LIU, and Tianqi QIN
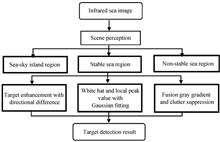
Maritime infrared small target detection plays a very important role in the field of safeguarding marine security and marine rescue. The long-distance ship target degenerates into a small spot in an infrared image, which has the characteristics of small size, weak intensity, serious lack of texture information, and is easily disturbed by noise. Meanwhile, the background clutters in infrared images presented by missile-borne infrared imaging system under backlighting conditions, such as sea-sky horizon line, island clutters, dense sea glints and sea surface bright band-like zone with high grayscale seriously affect the detection performance of long-distance infrared small targets, which can easily lead to target missed detection and false alarms. Only using one strategy to filter an infrared image may result very poor performance of small weak target detection. The reason for this situation is that the high-intensity clutter will interfere with the small target detection in the low-intensity clutter regions and the targets will interact with each other in the detection process. Therefore, using different strategies to filter different local regions of an infrared image is an effective target signal detection scheme. This paper mainly focuses on the key technologies that develop a high detection performance solution of infrared small targets under the complex maritime background. In this paper, the maritime scene perception information is constructed by sensing the regions where the non-stationary sea surface background clutters components exist and their fluctuation states, and the signal processing method adapted to the background clutter is adopted to refine the detection of small targets. Aiming at the characteristics of marine infrared imaging, the background clutters of the non-stationary maritime surface are perceived and the information of infrared marine scene is constructed. Firstly, the large eigenvalue of the structure tensor and Hough transform of an infrared image are used to detect the sea-sky horizon line. The connected region labeling algorithm operates the binary difference eigenvalues map to obtain the sea-sky island region. Bernaola-Galavan segmentation algorithm and the complexity represented by variance weighted information entropy are used to perceive the background clutter components such as sea glints and sea surface bright band-like zone. Therefore, the scene information of sea-sky island region, flat sea region, fluctuation sea region and island region is constructed. Secondly, aiming at the characteristics of clutter components, adaptive signal processing is used to suppress clutter and enhance the signal-to-clutter ratio of target. A clutter suppression and target enhancement algorithm based on directional difference is proposed to suppress the background and highlight target signal for sea-sky region and island region with strong edge structure. Top-hat transform is used to suppress clutter in flat sea area. In the fluctuation sea region of sea glints and sea surface bright band-like zone, a fusion gray gradient clutter suppression method is proposed to suppress the background, greatly reducing the interference caused by sea clutters. Finally, after clutter suppression, target extraction is carried out by targeted methods. The detection results of each region are normalized to the same intensity range and integrated. Constant false alarm threshold segmentation strategy is used to detect targets in sea-sky region, island region and fluctuating sea region. Whereas, the local peak decision strategy is used to detect the targets for flat sea region. Compared with the existing advanced infrared image small target signal detection methods, the experimental results show that the proposed single-frame detection method based on maritime scene perception can effectively adapt to different maritime background clutters, and can not only effectively increase the signal-to-clutter ratio gain and the background suppression factor, but also improve the accuracy and robustness of small target detection in complex backgrounds.
Dec. 25, 2022Vol. 51 Issue 12 1210002 (2022)
Hongjian FU, Hongyang BAI, Hongwei GUO, Yuman YUAN, and Weiwei QIN
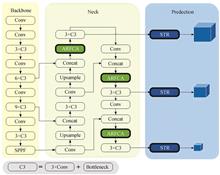
Optical remote sensing image target detection technology refers to the technology that uses algorithms to automatically classify and locate objects of interest. It has a wide range of applications in military reconnaissance, precision guidance and urban construction. From the perspective of development history, optical remote sensing image target detection technology can be mainly divided into traditional target detection algorithms and deep learning-based target detection algorithms. Compared with traditional target detection algorithms, deep learning-based target detection algorithms can automatically extract target features, and the feature expression is more robust and generalisable. In the field of remote sensing image target detection, the application of deep learning target detection technology can achieve better detection results. However, several problems still exist in remote sensing image target detection, such as large differences in target scales, dense target distribution and complex backgrounds. In response to the above problems, this paper makes improvements based on the YOLOv5 network, and proposes the MA-YOLOv5 (Multi Attention-YOLOv5) network, which improves the remote sensing target detection effect, and the experiments verify the effectiveness of the improvement. Considering the requirement of on-orbit real-time processing of remote sensing images, ensuring a certain detection speed is necessary. Therefore, this paper selects the YOLOv5l network whose network depth and width coefficients are oneas the basic network. YOLOv5 is mainly divided into three parts: Backbone, Neck and Prediction. The Backbone part mainly uses the backbone structure of CSP (Cross Stage Partial) Darknet for feature extraction; the Neck part uses the FPN (Feature Pyramid Network)+PAN (Path Aggregation Network) feature pyramid structure for feature fusion; the Prediction part uses CIOU~~loss (C Intersection over Union~~loss) as the loss function for calculation. To improve the detection effect of remote sensing images with multiple scales and complex backgrounds, this paper proposes a coordinate attention module with adaptive receptive field size. Through the separation and selection mechanism in the module, the network can adaptively select the information output by convolutions with different receptive field sizes according to the size of the target, thereby improving the feature extraction ability of the model for multi-scale remote sensing targets. At the same time, through the coordinate attention mechanism in the module, the long-term dependency of one spatial direction is captured, and the position information of another spatial direction is saved, which helps the network to locate the target more accurately. In addition, in view of the dense distribution of remote sensing targets, the Swin Transformer self-attention mechanism module is added to the protection head of the YOLOv5 network to enhance the network's ability to capture the target environment information. To verify the influence of the different number of branches of the ARFCA (Adaptive Receptive Field Coordinate Attention) module on the model, and to determine the optimal number of branches of the ARFCA module, a set of ablation experiments are set up in this paper. The experimental results show that the best effect is when the number of ARFCA branches is 3. Finally, this paper sets up a set of experiments to compare the following seven networks: The MA-YOLOv5, YOLOv5 with ARFCA module added, YOLOV5 with STR (Swin Transformer) module added, YOLOv5 original network, SSD, RetinaNet and FCOS. Seven categories of indicators are used for evaluation. The experimental results show that compared with the original YOLOv5 network, the MA-YOLOv5 network achieves a 3.6% improvement in accuracy and has a certain ability of real-time detection.
Dec. 25, 2022Vol. 51 Issue 12 1210003 (2022)
Haijun LI, Fancheng KONG, Junjie MU, Xiao LIU, Zhenbin DU, and Yun LIN
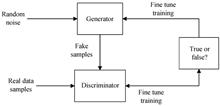
Infrared imaging guidance has a stronger anti-interference ability and a more obvious dynamic range than traditional infrared guidance, which is one of the main guidance means of current precision guidance weapons. In recent years, with the continuous development of computer vision, the application of deep learning to military infrared target detection has attracted more and more attention. Model training has high requirements on the quantity and quality of data. However, it is difficult to obtain complete infrared ship images in the complex environment in the military field, which affects the detection accuracy of infrared ship based on deep learning. Most infrared target detection is achieved through the algorithms of the visible light field. Therefore, the research of GAN-based image generation by GAN data is still mainly visible image. The research on infrared image generation is scarce, and the research on ship data generation under infrared background is even less. In response to these problems, high cost-efficiency ratio, and a small amount of data in field acquisition of Infrared Ship images, this paper proposes ISE-StyleGAN (Infrared Ship Enhancement StyleGAN) algorithm for Infrared Ship image generation. By training the generative adversarial network model, high quality infrared ship image is obtained, which can provide infrared ship data. In this paper, improvements are made based on the StyleGAN model. Firstly, because of the size of receptive field in StyleGAN is limited by the convolution kernel. In this paper, self-attention is introduced into the generator, so that the algorithm can operate in the global domain can learn more details in the image and long-distance pixel association information. Setting the resolution of the last module of the generator to 256×256 can make the generator more suitable for the data requirements provided in this study. On the premise of ensuring the quality of the generated image, the number of parameters required by the network and the amount of random noise input can be reduced, and the computing efficiency of the generator can be improved. As the texture details of infrared ship images are not as rich as those of visible images, too much noise will introduce more noise points during image generation according to the original StyleGAN model, which will affect the normalization of adaptive instances, thus resulting in the degradation of the generated image quality. Therefore, this study only introduces one noise module into the noise input of each network module of different resolutions of the generator. Secondly, a Wavelet discriminator is used to extract image features through Wavelet decomposition and combine them into feature representations derived from higher resolution blocks. In the representation of the characteristics of the image, the discriminator stratifies the input image to perform a bilinear downsampling scale reduction, degree processing, and detection of separation at each scale. Then, by scattering wavelet, the frequency difference between the generated image and the real image is obtained. Such a Wavelet discriminator is very effective against blocking artifacts. Then, TTUR and Adam are used for optimization. In the training process, TTUR can make the generator and discriminator automatically set different learning rates so that the discriminator convergence speed is accelerated and the training speed of the two can be balanced. Finally, WGAN-gp loss function is introduced to improve convergence efficiency. The experimental results of the original data, DCGAN, CycleGAN, StyleGAN and ISE-StyleGAN were compared by visual interpretation in this paper. The infrared images obtained by the algorithm can basically show the ship contour and texture details, and the gray distribution is relatively uniform. Compared to the real image, the overall similarity of the two pictures is high. From the objective indicators, PSNR value and MS-SSIM value are the highest in all types of targets. It shows that the improved algorithm proposed in this paper has better quality and image phase than several classical generative adversarial network methods in generating infrared ship images. At the same time, the outline and details of the ship generated by ISE-StyleGAN are more prominent. Therefore, it can be inferred that the ship image features generated by ISE-StyleGAN are more similar to the original image features. Finally, the validity of the generated image is further verified by applying the generated data set to the ship detection task. Different datasets are used in the verification process, including the original infrared ship dataset, the original dataset and the conventional augmented data combination dataset. The combined dataset of images generated by DCGAN, CycleGAN, StyleGAN and ISE-StyleGAN were used for ship detection training respectively. Then, the detection algorithm adopted Faster R-CNN, SSD, YOLOv3 and Centernet. Compared with the original dataset, the average accuracy of the expanded ISE-StyleGAN target detection network is about 15% higher than that of the original dataset, which verifies the effectiveness and feasibility of generating infrared ship images based on ISE-StyleGAN.
Dec. 25, 2022Vol. 51 Issue 12 1210004 (2022)
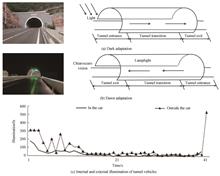
Lian MA, Qinglu MA, Binglin FU, and Jianghua WANG
In highway tunnels in mountainous areas, there is insufficient illumination intensity in a closed environment at night, and after imaging, the average pixel illumination intensity is low. The data information obtained by a single sensor is usually limited. Multiple sensors improve the image fusion performance at the tunnel mouth with low illumination. Infrared sensors use the thermal radiation generated by the object to achieve automatic detection and capture the object under the condition of low illumination; visible images provide rich background information. The image information of infrared and visible light and the electromagnetic spectrum is fused to obtain enhanced and more comprehensive scene information. Image processing in a low-illumination environment has always been a hot issue in academic research. This paper used Convolution Sparse Representation (CSR), Spectral Edge (SE) and local energy features for image fusion. An intelligent sensing method for spatial information of highway tunnels under static and dynamic light environments is proposed. The denoising and fusion are processed simultaneously to avoid the loss of visible and near-infrared information during fusion processing. Bilateral filtering and light component are used for adaptive image enhancement of low-illuminance infrared and visible light source images at the tunnel mouth. Gamma correction is used to correct the illumination component to avoid distortion during image enhancement. In order to improve the visual information presented by visible tunnel light, infrared and original visible image are fused to enhance the dark details of infrared pixels. In order to further improve the feedback of multiple information in the image, the non-subsampled contour is used to decompose the preprocessed image in multi-scale and multi-direction. The non-subsampled pyramid and non-subsampled directional filter are the main components of the non-subsampled contour wave. The k-layer decomposition of the preprocessed source image, k+1 subband image with the same size can be obtained. The algorithm uses bilateral filters to decompose a single low-frequency subgraph decomposed by k layers into low-frequency basic components and detail feature components, respectively, for visible image and near-infrared images. The former is fused by local energy features, while the detail feature components are fused by convolution sparse representation strategy. The weighted local energy preserves structured information. Since simple weighting often leads to fading of infrared targets, the local feature energy ratio is used to measure the details extracted to maintain the brightness of fusion targets. A new activity measurement method and spectral edge processing were constructed at the high-frequency coefficients according to the underlying visual features; edge information is injected into the multi-source image to extract high-frequency information. Finally, the fusion coefficients were reconstructed to obtain the fused image. Four groups of visible and infrared source images captured by simulating the driver's line of sight were fused and compared with the algorithm results. The experiments were compared and analyzed from subjective evaluation and objective evaluation. Experimental results show that the CSR-SE-Energy algorithm overcomes the traditional "SR" and "pseudo-Gibbs" effects, makes up for the shortcomings of poor correlation between images, and saves Energy information and edge details. The fusion algorithm outperforms BF, SE, NSCT-BF, SF-Energy-Q and SR-C&L in subjective evaluation. The subjective visual effect has high contrast and good identification, the whole image scene can be highlighted, and the running time can be shortened. In objective evaluation, the highest MI value was 7.596 2, the highest IE value was 7.764 2, and the highest standard deviation value was 82.194 1. Compared with BF, SE, NSCT-BF, SF-energy-Q and SR-C&L algorithms. This method has significant reference significance in reducing noise, equalizing illumination and restoring details. When processing the image at the entrance and exit of the low illumination tunnel, the operation time is reduced by 0.023 2 s at most, reducing the overall operation cost and improving the image's robustness and visual clarity.
Dec. 25, 2022Vol. 51 Issue 12 1210005 (2022)
Jianye LIU, Sufeng ZHUANG, Dawei TU, Can ZHANG, and Pan JIN
Binocular stereo imaging technology has a wide application prospect in underwater archaeology, Marine geological survey, autonomous navigation of underwater robot, underwater biological investigation and other fields. However, when the camera is applied in an underwater environment, the imaging light enters the lens through media of water, window glass and air. Due to the different densities of the three media, the light will be refracted and bend, and the measurement model and calibration method in air will fail, making it difficult to realize underwater 3D reconstruction. In the early studies, the refraction effect was ignored, resulting in low accuracy of underwater 3D measurement. Subsequently, researchers at home and abroad believe that establishing an accurate underwater refraction imaging model is the key to improving the calibration accuracy of binocular stereo measurement system. Therefore, based on the multi-layer plane refraction model, this paper describes the underwater camera imaging process by using the 4D parametric representation method of light, and establishes the underwater binocular stereo vision imaging model. On this basis, this paper proposes the corresponding calibration method and uses the forward projection error as the objective function to optimize the normal vector of parameter interface and the thickness of air medium, and verifies the correctness of the calibration algorithm through MATLAB simulation. The results show that the average error of system parameter calibration simulation analysis is 0.078 pixel, showing that the calibration algorithm is extremely accurate. Then, the system calibration experiment, underwater precision experiment and underwater object 3D reconstruction experiment are carried out. The results show that the average error of the system calibration experiment is less than 0.12 pixel, indicating that the proposed calibration method of underwater binocular stereo vision imaging system has high calibration accuracy of system parameters, which lays a foundation for pixel matching and 3D reconstruction. In the underwater accuracy experiment, the standard deviation of the underwater standard ball rod measurement error is 0.8 mm, the standard deviation of the measurement error is 0.6 mm, and the standard deviation of the ball center distance measurement error is 1.2 mm, indicating that the 3D measurement accuracy based on the calibration algorithm is very high. The point cloud obtained by underwater 3D reconstruction of physical objects is generally dense, without obvious holes, with good and smooth contour and good effect of detail reconstruction, which fully indicates that the underwater stereo vision model and calibration method proposed based on the above theory have good underwater 3D reconstruction effect.
Dec. 25, 2022Vol. 51 Issue 12 1211002 (2022)

Zhiyuan CHENG, Zhou JI, Yansheng GAO, Hua SU, Peipei YAN, and Aili XIA
Laser optical field imaging system transmits multiple laser beams to scan the target for imaging. When the new optical field imaging theory is applied in practical engineering, the inevitable multi beam intensity jitter effect will cause fluctuation in intensity amplitude. In the subsequent reconstruction of spectrum components based on the spectrum iteration theory, the fluctuation in light intensity amplitude will cause the reconstruction spectrum error, which will lead to degradation of imaging quality in further. Aiming at the problem of image quality degradation of optical field imaging caused by laser beam intensity disturbance, an approximate calculation method based on the demodulation ratio of light field echo signal is proposed in this study. First, the interference light field signals with different frequencies in optical field echo signal are demodulated. The demodulated optical field echo signal is affected by random fluctuations of the beam intensity amplitude. The phase closure coefficient is calculated based on the multi beam phase closure theory and an isospectral sampling array is constructed. Then, according to the principle of isospectral iterative reconstruction, the high-order spectral components can be obtained by iteratively solving the lower order spectral components in turn. In this study, the influence model of the light intensity perturbation factor on reconstructed spectrum component error is established, and the influence mechanism of light intensity perturbation on image quality is revealed. Due to the amplitude fluctuation effect of beam intensity, the disturbance factor of beam intensity fluctuates randomly, which affects the accuracy of spectral signal reconstruction and reduces the imaging quality. In order to eliminate the influence of light intensity disturbance on image quality, the influence of light intensity disturbance factor on reconstructed spectral signal should be suppressed. In the weak turbulence scene, the scale coefficient of the disturbance factor of multi-beam intensity can be approximated by the demodulation component of laser echo signal. The light intensity perturbation factor is calculated by the scale coefficient of demodulation echo signal. The value of laser beam intensity perturbation factor is substituted into the spectrum reconstruction model. Finally, the spectrum of eliminating light intensity disturbance factor is obtained. The target image is obtained by performing an inverse Fourier transform of signal spectrum component, and the image index of target is calculated to evaluate the reconstructed image quality. The demodulation ratio of optical field imaging method is analyzed and verified based on the simulation experiment. The simulation experiment results show that the demodulation ratio method suppresses the light intensity disturbance and improves the reconstruction image quality. The demodulation ratio method can effectively suppress the degradation effect of light intensity disturbance and improve the image quality. The validity of the demodulation ratio method is verified based on the desktop experimental platform. The experimental results show that the image sharpness is significantly improved, and the three image quality evaluation indexes of the reconstructed image Strehl ratio, peak signal-to-noise ratio and structural similarity are all improved, which further proves the effectiveness of the demodulation ratio method. The imaging error correction model of light intensity perturbation factor is proposed and the corresponding demulation ratio solution is proposed in optical field imaging system. This study provides an effective theoretical guidance for the suppression of light intensity perturbation factor and the improvement of image quality in actual optical field imaging. The research shows that the proposed demodulation ratio method can effectively suppress the influence of beam intensity disturbance on image quality, and effectively reduce the requirements of beam intensity stability and multi-beam intensity consistency for optical field imaging, thus reducing the difficulty of optical field imaging engineering. The research can provide technical support for experimental research and application transformation of optical field imaging technology.
Dec. 25, 2022Vol. 51 Issue 12 1211003 (2022)
The Effect of Temperature and Salinity on Imaging Quality of Optical System in Underwater Turbulence
Shuwei SUN, Hao WANG, Wei WANG, Peng LI, Fuzeng KANG, and Xiaoping XIE
Underwater imaging technology is a critical means to explore the ocean. With the development of underwater imaging technology, it is found that underwater turbulence is an important factor that restricts the imaging quality of optical system. Turbulence is a phenomenon of small vortices occurring at the interface due to different flow rates of each part of the medium. This physical phenomenon can directly lead to changes in the refractive index of the medium. Thus, it can change the wavefront structure of the beam, affect the modulation transfer function, and ultimately cause the degradation of the image quality at the receiving end.Most of the studies about turbulence on beam is based on refractive index and power spectrum, and the researches on turbulence is based on Nikishov's power spectrum. In this power spectrum, eddy diffusion rate is constant, does not relate to the average water temperature and the average salinity which can influence on eddy diffusion rate. Thus, the turbulence caused by the refractive index models still needs further refinement. Later, some scholars improved the refractive index fluctuation power spectrum. In this model, the average temperature and average salinity are used to characterize the vortex diffusion rate, and the refractive index fluctuation power spectrum model based on temperature and salinity is established. Compared with Nikishov's power spectrum, the power spectrum model is more complete, but the temperature variance dissipation rate and kinetic energy dissipation rate used to characterize turbulence intensity cannot be measured in the experiment, resulting in a gap between the simulation model and practical applications.In order to study the effect of underwater turbulence on the imaging quality of optical systems, we deduced the wave structure function and established an underwater optical imaging model based on the refractive index fluctuation power spectrum contained with temperature and salinity. The effects of temperature and salinity on the modulation transfer function under turbulent conditions are simulated. For verifying the reliability of the turbulence imaging model, a 3-m long underwater optical imaging experiment platform is designed and built. A water pump and water tank are used to create a turbulence region with controllable turbulence intensity. A CCD camera also plays a part of the region to image the resolution plate, thus analyzing the imaging quality. By controlling the experimental conditions, the imaging results under different temperatures and different salinity conditions are obtained. On this basis, the modulation transfer function is analyzed after the ensemble average obtained by several experiments. The results show that the modulation transfer function of the image decreases with the increase of temperature and salinity. Further studies show that the contrast of different spatial frequencies decreases linearly with the increase of salinity, and the decrease amplitude is basically the same. With the increase of temperature, the MTF basically conforms to the linear decline law, and the MTF of high-frequency components decreases faster. The experimental results show that the imaging quality under turbulent conditions is affected more by temperature than salinity, and the experimental results are consistent with the simulation results. This research has certain reference value for the design optimization and development of underwater optical systems.
Dec. 25, 2022Vol. 51 Issue 12 1211004 (2022)
Zijun ZHU, Yudong LIU, Wu HUI, Bingxin WANG, Feng ZHANG, and Baolu GUAN
Vertical Cavity Surface Emitting Laser (VCSEL) array has the advantages of high integration, high modulation bandwidth, high output power, fast response and individual addressing, so it is widely used in parallel optical interconnection, 3D recognition and sensing, high resolution printing and other fields. With the development of science and technology, the quality of laser array light source is required to be higher. For example, in order to suppress the speckle phenomenon and realize confocal micro-interference detection with high spatial resolution and high contrast, the VCSEL array light source is required to have flat top beam output with low spatial coherence. In the optical capture and microoperation of biological cells, in order to produce an optical trapping array effect, the beam of the VCSEL array needs to be regulated into Laguerre-Gaussian hollow circular distribution. The beam distribution and spatial coherence of VCSEL and its array have attracted more and more attention. Similarly, in free-space optical communication, the laser beam distribution and spatial coherence are closely related to the disturbance effects such as beam broadening, spot drift and intensity scintillation transmitted in a turbulent atmospheric scattering medium. It is of great significance to research the spatial coherence and light field distribution of array light source to optimize their transmission characteristics. In this paper, the spectrum of the VCSEL array is measured and the light field distribution of the VCSEL array is researched. At the threshold current, the VCSEL array is emitted as the fundamental mode, and the energy of the fundamental mode beam is distributed in the center of the luminous aperture and the light spot divergence degree is small. At this time, the far field of the array is a circular light spot formed by the superposition of the light beams of each luminous unit, and the light field is Gaussian distribution. With the increase of injection current, the high-order mode of the VCSEL array beam gradually appears. Because the energy of the high-order mode is mainly concentrated at the edge of luminous aperture, the light field of the VCSEL array is Laguerre-Gaussian hollow circle. Furthermore, the experimental device of VCSEL array beam space transmission was built. The propagation characteristics of a standard coherent light source and VCSEL array beam with different coherence were compared in the atmospheric turbulent scattering medium. The VCSEL array beam is collimated out through the lens, after the beam splitter through the two-hole interference, the interference fringes are recorded by Spiricon SP920s beam analyzer, and the spatial coherence of the beam is obtained by calculating the contrast of the interference fringes. At the same time, the randomness and inhomogeneity of atmospheric turbulence are simulated by a scattering medium. The beam analyzer is used to record the far-field spot radius and light intensity before and after VCSEL array beam transmission, and the beam expansion rate and light intensity attenuation rate in the transmission process is calculated. Experiments show that compared with the standard coherent light source, the VCSEL array beam has smaller spot diffusion and lower light intensity attenuation when propagating in a turbulent atmospheric scattering medium. As the spatial coherence of the VCSEL array decreases from 0.695 to 0.608, the spot spread rate decreases from 8.6% to 3.4%, and the intensity attenuation rate decreases from 24.9% to 15%. VCSEL array beams with relatively low spatial coherence show better propagation characteristics, which has important guiding significance for the application of VCSEL array light source in the fields of free space radar detection and optical communication.
Dec. 25, 2022Vol. 51 Issue 12 1214001 (2022)
Qian YANG, Zezhong ZHOU, and Zuxing ZHANG
Because of their outstanding advantages of high power, high efficiency, multi-wavelength, tunable, narrow linewidth, and variable bandwidth, fiber lasers based on random distributed feedback have a broad development prospect in the exploration of new light sources. Random fiber lasers based on Rayleigh scattering distributed feedback are widely studied and discussed by scholars. As a result, they can overcome the disadvantages of traditional distributed feedback random lasers such as a complex structure, large cavity loss, low output laser efficiency, spectral instability, and low practicality. In recent years, several research reports on random fiber lasers have widely applied the combination of Stimulated Brillouin Scattering(SBS), Stimulated Raman Scattering(SRS), and Rayleigh Scattering(RS) to achieve multi-wavelength cascaded output. A single multi-wavelength Brillouin-Raman random fiber laser with tunable frequency spacing is innovative and worthy of further exploration, considering the lack of flexibility and limited applications of multi-wavelength output at a fixed frequency interval. In this paper, the cavity loss is controlled by tuning the attenuator in the reflection ring, which makes the laser cavity structure switch between a semi-open cavity and a full-open cavity. What's more, the frequency interval of multi-wavelength output can also be switched by this way. Compared to other multi-wavelength fiber lasers with switchable frequency intervals, this structure is more simple and has a wider output bandwidth.In the current laser configuration, the multi-wavelength cascade output is the result of a combination of SBS, RS, and SRS at high Raman Pumping (RP) power. The RP produces a distributed Raman gain in the DCF and then amplifies the BP. When the BP power satisfies the SBS threshold, a back-propagating first-order Brillouin Stokes Light (BSL) is generated. Similarly, the first-order BSL is also amplified by the distributed Raman gain and acts as a new pump source to generate a second-order BSL that propagates backwards with respect to the first-order BSL. Thus, the lower-order BSLs act as a pump source to generate more higher-order BSLs, and such a cascade process will continue until the overall gain is insufficient to offset its losses. The switchable frequency interval of multi-wavelength output is achieved by tuning the attenuator in the reflective ring 2, which can precisely control the power of the reflected signal entering the cavity. When the attenuation is small, the multi-wavelength output has a single-frequency interval, and when the attenuation is large, the multi-wavelength output has a double-frequency interval.The influence of changing the attenuation in reflection ring 2 on the Peak Power Difference (PPD) between adjacent Stokes lines is discussed in the experiment. When the attenuation is small, most of the even-order BSLs propagating to the right are reflected into the fiber through the reflective ring 2, and then combine with the odd-order BSLs propagating to the left. As a result, the laser produces Stokes lines with a single-frequency interval, at which time the spectral flatness is less than 3 dB, satisfying the condition of producing BSLs with a frequency interval of ~10 GHz. Continuing to increase the attenuation, the frequency interval of adjacent Stokes lines is in the transition from ~10 GHz to ~20 GHz, while the PPD is also changing in the range of 3 dB to 20 dB. When the even-order BSLs propagating to the right are almost all attenuated, the laser produces Stokes lines with a double-frequency interval, and only the even-order Rayleigh components propagate together with the odd-order BSLs. Under this circumstance, the PPD is more than 20 dB and almost constant, which satisfies the condition of producing BSLs with a frequency interval of 20 GHz. The influence of BP wavelength and power on the multi-wavelength output is further discussed in the experiment. The best result is obtained under the optimal experimental conditions, at which multi-wavelength outputs with a single-frequency interval (~10 GHz) in wavelength range of 39 nm (1 532 ~1 571 nm) and multi-wavelength output with a double-frequency interval (~20 GHz) in wavelength range of 39.5 nm (1 532 ~1 571.5 nm) are obtained.A frequency interval switchable multi-wavelength Brillouin-Raman random fiber laser based on cavity loss modulation is proposed and demonstrated. The random fiber laser based on the random distributed feedback is formed by RS combined with nonlinear effects such as SBS and SRS to achieve multi-wavelength cascaded output. Further by controlling the attenuation of the tunable attenuator in the reflective ring 2, the cavity structure is switched between a semi-open cavity and a full-open cavity, which makes the frequency interval and optical signal-to-noise ratio of the multi-wavelength output switchable. The experimental results show that when the attenuation is -2 dB, the multi-wavelength output with a single-frequency interval (10.48 GHz) in a wavelength range of 39 nm (1 532 ~1 571 nm) can be obtained, and the optical signal-to-noise ratio is 17.2 dB at this time. When the attenuation is -30 dB, the multi-wavelength output with a double-frequency interval (20.96 GHz) in a wavelength range of 39.5 nm (1 532 ~1 571.5 nm) can be obtained, and the optical signal-to-noise ratio is 25.2 dB at this time. Compared to other multi-wavelength fiber lasers with switchable frequency intervals, this structure is simpler and has a wider output bandwidth.
Dec. 25, 2022Vol. 51 Issue 12 1214002 (2022)
Wei GUO, Xiaofang CHEN, and Xingqiang LU
With the advances in ultra-strong and ultra-short laser pulses, many research works have concentrated on the real-time control of molecular dynamics. Apart from plotting the wave packet dynamics data of the electronic state, the state population is also capable of reflecting the excitation, dissociation and ionization of molecules. By controlling the wave packet evolution, the state population can be manipulated, thereby facilitating the optical control over the molecular processes experimentally. NaI molecule is a reference molecule for monitoring wave packet evolution experimentally and theoretically because a crossing is present between two electronic states that are coupled in a nonadiabatic way. The wave packet moves periodically between the internal and external turning points, which induced the periodical change of the photoelectron spectrum. Many researches mainly investigated the photoelectron spectrum, the competitive ionization channel and the predissociation dynamics of the first passage through the crossing region. Although the photoelectron spectrum offers the significant plotting of the exited-state movement of wave packets and ionization yields, it is not enough to reflect the excitation, dissociation as well as ionization processes of molecules. Herein, this work focuses on the study of the respective parameter effects of pump and probe pulses on the probabilities of excitation and ionization, and the total probability of dissociation of NaI molecules, which are examined completely and quantitatively analyzed. State populations of the ground and excited states of NaI and the ionic ground state of NaI+ are calculated by adopting a time-dependent wave packet method, because it has the intuition of classical mechanics, no lack of accuracy of quantum mechanics. By appropriately changing the laser parameters, the population on each state can be controlled, and so can the excitation, dissociation and ionization probabilities. The dissociation increases while the ionization decreases when the delay time is prolonged. The pump-probe delay time evolution of total dissociation probability reveals a series of increasing stair-stepped plateaus, which are indicative of the individual parts of the wave packet reaching the asymptotic region i.e., discontinuous dissociation process. The results reveal an increase in the excitation, marginal decrease in dissociation probability, and marginal increase in ionization probability with increasing pump laser intensities.With the increase in pump wavelength, the excited state population increases initially and then decreases, reflecting the resonant region of 313~328 nm. The ionization probability increases while the dissociation probability decreases with the increase of the pump wavelength. The dissociation probability associates with the wave packet propagation velocity and the time taken for passing through the crossing zone. A pulse with a shorter wavelength indicating the higher energy, causes a wave packet with a higher velocity at the crossing point, increasing the predissociation. The dissociation probability decreases slightly with enhancing pump pulse width for shorter pulse widths, in which the propagation velocity dominates. The dissociation probability increases slightly with rising pump pulse width for longer pulse widths, in which the propagation time dominates. As suggested by the derived results, pump laser is the sole influencing factor of molecular excitation and dissociation, while the ionization was affected by both pump and probe lasers. The seemingly counterintuitive understanding: the pump pulse affects the ionization probability, can be clarified. The pump laser parameters affect the dissociation of the wave packets moving between the internal and external points before the probe pulse appears. Then ionization may occur when the probe pulse appears at 3 000 fs. The ionization follows the general understanding of photoionization: ionization occurs when the photon energy is greater than the ionization energy, and the ionization probability is determined by the ionization dipole moment at the internuclear distance for the delay time of 3 000 fs. In other words, The dissociation and ionization processes compete and coexist, the pump pulse affects the wave packets before ionization through affecting the dissociation, thus affects the ionization. This provides an additional control means for controlling ionization, and even a very effective way. The laser field with weak field intensity, short wavelength, narrow pulse width and long delay time is conducive to dissociation, on the contrary, it is conducive to ionization. The control of the excitation, dissociation, and ionization yields can be possible by adjusting the form of the laser pulse. The obtained findings are crucially valuable for the molecular spectroscopy, which can also contribute to attain optical molecular control experimentally.
Dec. 25, 2022Vol. 51 Issue 12 1214003 (2022)
Tao ZENG, Long XU, and Zhengmao WU
Femtosecond laser filamentation has attracted extensive interest during the last two decades. When femtosecond laser beam power is much larger than the critical power for self-focusing, the beam breaks up into multiple filaments due to the modulation instability of the wave-front. Multiple filaments are essential for many applications, such as multichannel white-light radiation, terahertz generation, phase-matched ultrafast Raman frequency conversion, and waveguiding of microwave radiation. One of the most challenging problems is to obtain high reproducibility and regular localization of the multifilament pattern. Nowadays, the multifilament array has been realized based on amplitude masks, beam ellipticity, focusing with an axicon, diffractive optical elements or a spatial light modulator. These approaches depend on control of beam wave-front amplitude, initial phase distribution or spatial waveshape by a kind of optical tuning devices. However, an all-optical switching approach to control the multifilament array has not been considered up to now, which would be particularly important for 2-D all-optical switching devices or pump-probe experiments based on multifilament arrays. Therefore, a new type of optical control of switching on and off the multifilament array pattern is explored based on two noncollinear elliptical femtosecond laser beams in this work. For the two noncollinear femtosecond laser beams with different frequencies, a simulation model of the two crossing beams propagating in air is set up, considering self-focusing, cross-phase modulation and the plasma defocusing effect based on a multiphoton ionization model. Based on this model, a numerical simulation of two noncollinear elliptical femtosecond laser beams with central wavelengths of 800 nm and 700 nm propagating in air is carried out. The radii of the two input elliptical beams along x long- and y short- axis are both set to be 0.9 mm and 0.6 mm respectively, while the input powers of both two beams are 10 Pcr. The crossing angle is 0.44°. A reproducible and regular multifilament array pattern is generated finally. In order to investigate the effect of beam ellipticity on the multifilament pattern generation, the propagation of two noncollinear Gauss femtosecond laser beams without ellipticity in air is simulated. Comparing with two crossing elliptical beams, the multifilament array generated by two crossing Gauss beams is less regularly distributed. The ellipticity of input beam can dominate the effect of transverse modulational instability, regularizing the nucleation of annular rings and resulting in predictable and highly reproducible multiple filamentation patterns. The propagation of two elliptical femtosecond laser beams individually without any interaction effect between two beams is considered as well. The result indicates that without cross-phase modulation effect between two crossing laser beams, much fewer multifilament laser spots can be observed. Further, the filament cluster number as a function of propagation distance for the above three conditions, including two crossing elliptical beams, two crossing Gauss beams and two individual elliptical beams without any interaction, is investigated. The result confirms that Cross-phase modulation and the cylindrical symmetry breaking in the initial beam profile contribute to the 2-D multifilament array generation from the two noncollinear elliptical femtosecond laser beams with different frequencies. Moreover, the filament cluster number and spatial distribution of the multifilament array can be tuned by the crossing angle, laser beam power, ellipticity and frequency of the second femtosecond laser beam. In addition, multiple filaments can be significantly elongated by using this method. For the propagation of two noncollinear elliptical femtosecond beams with identical frequencies, the total complex amplitude can be obtained by the superposition of the two beams directly. The wavelength of the two beams are both 800 nm. The initial input beam parameters, such as elliptical beam widths, the distance between two input beams, and the crossing angle between two beams are all set to be the same with those of two noncollinear elliptical femtosecond laser beams with different frequencies. The evolution of the beam intensity pattern under this condition is investigated. A regular 2-D multifilament array is generated with a relatively large filament number, resulting from the modulation instability of the wave-front dependent on both the ellipticity and the interference effects of the two beams. Therefore, interference plays a dominant role in the regular multifilament array generation under this condition.
Dec. 25, 2022Vol. 51 Issue 12 1214004 (2022)
Dongyang GAO, Zongmei CHEN, Huan CHEN, Qingjie SHI, Tuanjie XIA, and Longjiang CHEN
Benefiting from the high sensitivity and high temporal resolution of single photon detector, Geiger mode laser ranging technology has become a research hotspot for three dimensional imaging detection in recent years. The range reconstruction method is one of the key technologies in the application of laser three dimensional imaging. Facing the application of long distance, high precision laser three dimensional imaging, the biggest technical problem based on photon counting LiDAR is to maintain the distance reconstruction accuracy under the interference of strong background noise. Most of the noise of single photon detectors can be suppressed through distance gating and spectral filtering. The laser backscattered noise also can be suppressed through polarization modulation. But, there still exist strong backgrounds such as sunlight scattering within the distance gate and the spectral bandwidth. Laser ranging accuracy is decreased by sunlight scattering noise. The results of previous photon counting laser ranging experiments under daytime conditions show that, it is impossible to meet the needs of high precision ranging under strong noise backgrounds by improving the performance of single photon detectors of lasers. Therefore, it is necessary to study different distance reconstruction methods, and propose a laser echo information processing method under strong noise conditions. The experimental comparison study work can provide the support for the innovation and development of long-distance, high frame rate active laser imaging technology. In this paper, the principles and characteristics of multi-class distance reconstruction methods based on cell Geiger mode avalanche photodiodes are systematically sorted out in. It mainly includes photon counting time statistics method, linear or exponential fitting method, matrix or Gaussian matching method, temporal correlation method and spatial correlation method. Aiming to the application of long distance and high frame rate lase three dimensional imaging, an experimental scheme based on laser beam emission scanning and focal area array detector receiving is proposed. The scanning azimuth information is fused in the process of laser echo data processing to improve the detection signal to noise ratio. A laser three dimensional imaging experimental device is built. The two dimensional scanning angle of the laser beam covers the detection field of view. Based on the digitized output of Geiger mode focal plane array avalanche photodiode, a comparative experiment of different distance reconstruction methods is carried out. The different distance reconstruction methods are used to extract target distance information. The difference in target distance reconstruction results is quantitatively evaluated by the ratio of signal photon counts to background photon counts. The experimental comparison results show that, for focal plane array detector, the spatial correlation method has better distance reconstruction effect. Meanwhile, the spatial correlation method can greatly improve the frame rate of three dimensional imaging. The better reconstruction effect is mainly reflected in two aspects. Firstly, the ratio of signal photon counts to background photon counts after spatial correlation processing has an order of magnitude improvement, from 0.5 to 6.67, while the improvement effects of other reconstruction methods in this paper are not obvious. Secondly, it is found that only the spatial correlation method can reconstruct the three dimensional contour of the target at an imaging frame rate of 100 frames per second. The experimental results confirmthe advantages and effectiveness of the spatial correlation reconstruction method. Through theoretical and experimental analysis, the research results in here provide a theoretical basis and experimental support for the application of the high-frame rate detection of laser three dimensional imaging under strong noise background. The next step is to carry out outdoor long-range laser 3D imaging experiments and to further explore and study the application of three dimensional imaging target recognition and tracking method based on array devices.
Dec. 25, 2022Vol. 51 Issue 12 1214005 (2022)
Jing ZHANG, Haicheng LIU, Xiuhua FU, Shengqi WANG, and Fei YANG
The demand for dense wavelength division complex narrowband filter film for 5G optical communication is increasing, and the research on DWDM filter film is more mature at home and abroad, but most of them adopt sputtering to form film, and there are fewer reports on the preparation of DWDM filter film by thermal evaporation, which has research significance because the deposition rate of film material is large and the time used is relatively small. However, due to the large deposition rate, the accuracy and sensitivity of the film thickness monitoring system is more demanding. In addition, the DWDM film system is highly sensitive, and if the traditional method of adjusting film thickness uniformity by means of correction plates is used, the correction plates can be deformed due to the long coating time and high temperature in the vacuum chamber, which makes it difficult to meet the control accuracy. Therefore, in this paper, when preparing DWDM filter film by thermal evaporation, the ion beam etching principle is used to correct the film uniformity in order to improve the effective coating area. The feasibility of using ion source etching to adjust the film uniformity is firstly verified by comparing the film thickness uniformity with and without ion source-assisted deposition. Based on this, the effects of ion source acceleration voltage, ion source voltage and ion source current on the film uniformity of Ta2O5 and SiO2 materials are further investigated by using the control variable method. Among them, the film layer uniformity gradually becomes better as the ion source acceleration voltage and ion source voltage increase, and the film layer uniformity first becomes better and then worse as the ion source current increases. Compared with the change of ion source current value, the change of ion source acceleration voltage has more influence on the membrane uniformity. By analyzing the experimental data of the monolayer film, it is determined that the monolayer film uniformity is better when the ion source acceleration voltage is 750 V, the ion source voltage is 900 V, and the ion source current values are 165 mA and 200 mA for SiO2 and Ta2O5, respectively. The optical direct monitoring method is used to monitor the film thickness during the plating of the narrow-band filter film. The signal of the real-time brightness value of the substrate is collected, and the collected brightness data is fitted using sin curves, and the evaporation is ended according to the fitting results. This method can accurately monitor the film thickness with relatively small requirements for environmental noise, and the crystal-controlled average thickness method is used to monitor the coupling layer. The inverse analysis of the experimental results is performed using Macleod film system design software, and the filter film passband ripple is improved by adjusting the ion source parameters for multiple experiments to adjust the thickness distribution of the two materials and modifying the thickness of the coupling layer. The difference in the center wavelengths of the spectral curves of the points on the final substrate that meet the technical requirements is 0.15 nm, and the center wavelengths of the spectral curves are between 1 557.26 nm and 1 557.41 nm, all in the same channel. The maximum insertion loss in the passband of each curve is in the range of 0.13 dB to 0.19 dB, which is less than 0.2 dB. The passband width at -0.2 dB is about 0.48 nm, and the passband ripple is between 0.05 dB and 0.09 dB. The bandwidth at -13.5 dB is about 0.81 nm, and the insertion loss of the reflection band of each curve is greater than 20 dB. The effective coating area is 2 123 mm2 by calculating the area of the circle where the points of the spectrum meet the technical requirements.
Dec. 25, 2022Vol. 51 Issue 12 1216001 (2022)
Xinwei KANG, and Pengpeng DAI
Phosphor-converted White Light-Emitting Diodes (pc-WLEDs) have energy-saving, environmental protection and other excellent performance. At present, the commercial WLEDs are composed of blue LED chip combined with Y3Al5O12:Ce3+ yellow phosphor. However, due to the lack of red components in the emission spectrum, the white light generated by this method has a low color rendering index (CRI4 500 K), which cannot satisfy the needs of indoor lighting. Researchers at home and abroad have proposed an improved method to generate white light by excitation of red, green and blue phosphors by a near-ultraviolet LED chip. Although this method can produce warm white light for indoor illumination, there is a significant cyan gap in the cyan region of the visible spectrum (480~520 nm), which makes it challenging to achieve full spectral illumination. Therefore, it is desirable to obtain a cyan luminescent material that can achieve full spectrum illumination by mixing phosphors. It is well known that rare-earths Eu2+ and Ce3+ have been widely used as activator ions in inorganic phosphors. However, Eu2+/Ce3+ activated phosphors have spectral overlap in the visible region, resulting in low luminescence efficiency and color drift of the synthesized devices. Compared with rare earth ions, Bi3+ hardly absorbs in the visible region, so Bi3+ activated phosphors can effectively avoid the spectral reabsorption problem encountered by rare earth Eu2+/Ce3+. At the same time, the outermost electrons 6s and 6p of Bi3+ are exposed and sensitive to the changes of crystal field environment, so Bi3+ is considered as an activator ion that can realize the color-tunable of phosphors luminescence. Therefore, the abundant optical properties of bismuth ions have attracted extensive attention. In this paper, a series of Cs3Gd1-xGe3O9:xBi3+ (0.02≤x≤0.1) blue phosphors were synthesized by the traditional high-temperature solid-state method. The local environment around Bi3+ is regulated by replacing Gd3+ in the matrix with Lu3+. A series of Cs3Gd0.96-yLuyGe3O9:0.04Bi3+ (0.1≤y≤0.9) solid solution phosphors with color-tunable were prepared. The phase structure, luminescence properties, fluorescence lifetime, and thermal stability of the phosphors were characterized by X-ray diffraction, steady-state/transient fluorescence spectra and variable temperature spectra. The results showed that a series of pure phase Cs3Gd0.96-yLuyGe3O9:0.04Bi3+ compounds were successfully synthesized. Under the excitation of the ultraviolet light wavelength of 330 nm, the emission peak of Cs3Gd1-xGe3O9:xBi3+ phosphor is located at 452 nm, showing blue emission. The broadband emission peak originates from the 3P1 → 1S0 transition of Bi3+. When the Bi3+ doping concentration is 0.04 mol, the luminescence intensity of Cs3Gd1-xGe3O9:xBi3+ phosphor reaches the maximum value. Under the optimal Bi3+ doping concentration, by substituting Lu3+ for Gd3+, the emission peak of Cs3Gd0.96-yLuyGe3O9:0.04Bi3+ gradually redshifted. With the gradual increase of Lu3+ doping concentration, the emission peak gradually redshifted from 453 nm at x=0.1 mol to 483 nm at x=0.9 mol, the corresponding half-peak width is widened from 88 nm to 116 nm, and the color coordinates transition from the blue region (0.168 5, 0.160 2) to the cyan region (0.217 9, 0.300 7). The change of spectral behavior is attributed to the increase of crystal field splitting degree and stokes shift displacement. The luminescence thermal stability of x=0.04 mol and y=0.5 mol samples was investigated,and the luminescence intensity of the samples remained 55% of the initial value when the temperature was raised to 423 K. A series of solid solution phosphors with adjustable luminescence color obtained have potential applications in the fields of full spectrum lighting and plant lighting.
Dec. 25, 2022Vol. 51 Issue 12 1216002 (2022)
Diffuse Optical Tomography Method Based on Multi-information Fusion and Stacked Auto-encoder Network
Zhilong SUN, Jie ZHANG, Zongyang LIU, Feng GAO, and Limin ZHANG
Diffuse Optical Tomography (DOT) is a new functional optical imaging technique that demonstrates the potential applications in breast tumor imaging and functional brain imaging. It has the advantages of being non-invasive, non-ionizing radiation, and providing physiological information about biological tissues. The image reconstruction process of DOT, that is, the inverse problem, is ill-posed, resulting in a low degree of quantification and spatial resolution of the reconstructed image. Traditional DOT image reconstruction methods cannot completely solve the problem of low imaging accuracy, mainly reconstruct the target with a regular shape (circle). In recent years, artificial neural networks have been widely used in the field of image reconstruction with their strong feature extraction and recognition capabilities. In this paper, Stacked Auto-Encoder (SAE) neural network is proposed to improve the DOT image quality. SAE is a relatively simple model where fewer network parameters need to be adjusted, and therefore the training speed is fast. SAE network consists of two autoencoders, which are unsupervised learning neural network models, including encoder and decoder. The encoder works by extracting the features of the input data to the hidden layer, while the decoder reconstructs the input data from the hidden layer. A fully connected layer after the autoencoder is added as the output layer of SAE. The SAE network training process consists of two stages. The first stage is unsupervised pre-training for getting initial weights and bias values. The second stage is that based on the principle of error backpropagation, the network minimizes the loss function by calculating the mean squared error between the predicted output value and the expected output value, then optimizes the weights and biases in the network model, and finally reconstructs the optical parameter image. For practical applications, anatomical prior information incorporated into SAE neural network is utilized to reconstruct DOT images with the targets of different shapes (circle and ellipse). To simulate the tumor in breast tissues, a two-dimensional circular phantom with a radius of 40 mm is used to simulate background tissue, and the circular and elliptical targets are respectively embedded in the background phantom to simulate breast tumors. Sixteen coaxial source-detector optodes are equally arranged around the phantom boundary. For each illumination, except the 4 detectors nearest to the source position, the remaining 11 detectors are used to measure the light intensities on the boundary, leading to a total of 16×11 (176) measurements. To more closely simulate the real case, 40 dB noise is added to the measurement data. Based on the numerical optical phantoms, the corresponding MRI images with the size of 51×51 are simulated to provide anatomical prior information. In SAE network, the normalized measurement data and the normalized gray values of the MRI image are utilized as the neural network inputs, and the optical parameters of the finite element nodes are used as the outputs to obtain DOT image. In order to verify the feasibility and effectiveness of the proposed method, a series of numerical simulation experiments with and without prior information are carried out. The experimental results are assessed and compared quantitatively using the Mean Absolute Error (MAE), Mean Square Error (MSE) and Quantitativeness Ratio (QR). The experimental results of the single circular target with different absorption contrast and different size show that the reconstruction results of the prior information-based SAE method are closer to the real image, and when the absorption contrast is low (1.5), the MAE of the fusion prior information method is reduced by 62%, the MSE is reduced by 11%, and the QR value is reduced from 139% to 107% which is closer to 100%, compared with no prior information method. It is worth mentioning that when the absorption contrast is larger than 1.5 and the radius is larger, both methods can achieve better image reconstruction quality since it is easier to recover the target in theory. For the image reconstruction of single and double targets of elliptic shapes, the prior information-based SAE method can accurately recover the size and position of the target and demonstrates high noise robustness and quantitativeness. Especially, when the absorption contrast is relatively small, the prior information-based SAE method can reduce the prediction error effectively. In addition, the quantitative analysis and comparison show that the MAE and MSE are significantly reduced by using the prior information-based SAE method. We find that the MAE is reduced by at least 8%, MSE is reduced by at least 5%, and the value of QR is closer to 100%. The comprehensive evaluation indicates that our proposed method can effectively improve the imaging accuracy and the quality of DOT reconstruction images.
Dec. 25, 2022Vol. 51 Issue 12 1217001 (2022)
Zhiyuan QIU, Wanrong GAO, Chaoliang CHEN, and Ying CHANG
Optical Coherence Tomography (OCT) is an interferometric imaging method, and it is mostly used in the field of imaging for its non-invasive, high-resolution and high-speed properties. This technology can also be applied to detect defects in materials. Although OCT can provide images of morphological structure, it can not distinguish tissues with similar light intensity properties in pathologies. Polarization-sensitive Optical Coherence Tomography (PS-OCT) is an imaging system extended from conventional OCT,enabling functional imaging. It can use Stokes parameters, Jones and Muller matrices to calculate the polarization properties of the samples, like the birefringence phase retardation, the optic axis orientation and depolarization. PS-OCT has been used in a number of medical applications, such as burn depth determination and tumor yield assessment. And it also can be applied to examination of stress-induced birefringence of materials. In previous systems, it is required to detect the two orthogonally polarized components by using dual cameras based spectrometers. But there are problems with this system arrangement. For example, it has high cost and requires complex hardware and software designs. In addition, it is hard to achieve the uniform detection for two cameras, the mismatch between the two channels can lead to polarization distortions and failure to calculate the true information and additional algorithms are necessary to tackle it. So a series of single cameras based methods have been proposed. Single cameras based systems can achieve time-sharing detection or real-time detection of two orthogonal channels with relatively lower cost and simpler system setup. Wollaston prism, optical switch, grating and multi-camera are often used to achieve single camera detection. Improving the axial resolution of the system can enable it to have more potential applications. The OCT system with micron axial resolution can achieve cellular and subcellular level imaging and detect subsurface defects in ceramics or other materials. In order to achieve such a high axial resolution, super-continuum light source is generally used to increase the bandwidth of imaging. Because the optical path of the reference arm and the sample arm are not completely symmetrical, as the spectral bandwidth increases, the system can introduce serious dispersion and affect axial resolution. In this paper, we demonstrate a polarization-sensitive spectral domain optical coherence tomography imaging system using a single camera with micron axial resolution. It is an all single-mode fiber-based system, and a broad bandwidth light source is used to achieve micron axial resolution. In order to increase actual axial resolution of the system, the system dispersion effects are compensated by using both hardware and software methods. After compensating the first order and second order dispersion, the measured axial resolution of the system is about 1.61 μm for the sample with an approximated refractive index of 1.4. In order to realize the measurement of the polarization state of the light reflected from the sample, the polarization state of light incident on the sample surface and the reference arm is modulated by the polarizer and four polarization controllers. The horizontal and vertical polarization interference signals are separately measured via channel switching of a polarizer and they can achieve time-sharing detection by using only one camera. Intensity and phase retardation information of the samples can be calculated by the signals obtained from the two channels at different times. To verify the capability of our system to measure the polarization information, we succeed in polarization imaging with a single camera and obtaining the images of intensity and polarization parameter contrast of the biological tissue in vitro by using Stokes vector. From the retardation image of bovine tendon at different position, it can be obviously observed that the phase retardation varies periodically with the increase of the depth in the tissue. This method is characterized by its simple system arrangement and lay the basis for miniaturizing in vivo high resolution polarization parameter imaging.
Dec. 25, 2022Vol. 51 Issue 12 1217002 (2022)
Caoyang LIU, Lin SUN, Jiawang XIAO, Bangning MAO, and Ning LIU
There has been a lot of interest in the installation of high-speed short-reach optical interconnect systems recently because of the growth of 5G and the Internet of Things (IoT), which have caused the data traffic between and within data centres to expand quickly. In data centres, optical transmission systems frequently use optical Intensity Modulation and Direct Detection (IM/DD) to save cost and power consumption. However, loss of optical phase from square law detection and fiber dispersion cause a nonlinear distortion in the optical IM/DD system. Moreover, the nonlinear responses of modulator and driver/amplifier also cause serious nonlinear distortions at the same time, which seriously reduce the optical IM/DD system's transmission range and capacity.Various equalization algorithms have been proposed to eliminate them. A classical equalization scheme is the combination of feedforward and decision feedback equalizer, but the nonlinear distortions can not be effectively equalized. Volterra Nonlinear Equalizer (VNE) can correct for nonlinear distortions, nevertheless, higher-order VNE items in strongly nonlinear settings result in a significant increase in complexity. On the other hand, nonlinear equalizers based on neural networks were also widely investigated in optical communication recently, which includes feedforward neural network, radial basis function neural networks, convolutional neural network and recurrent neural network. In contrast to the feedforward equalizer and VNE, feedforward neural network equalizer exhibits stronger equalization performances, but also brings a higher complexity in order to compensate for strong nonlinear impairments in optical IM/DD system. Moreover, equalizers based on auto-regressive recurrent neural network have higher complexity, however, better performance thanks to the involvement of additional feedback neurons. These equalisers, however, only employ one or two hidden-layers. In optical IM/DD systems, the influence of the number of hidden-layers as well as the number of neurons in every hidden layer on the performance of the equalizer remains unknown. Also, the optimal structure of neural network equalizer is worth exploring. Thus, we constructed a 112-Gbps 20-km four-level pulse-amplitude modulation optical IM/DD transmission simulation platform to investigate the influence of the number of hidden-layers and the number of neurons in every hidden layer on Recurrent Neural Network Equalizer (RNNE) performance. Also, to seek the most efficient equalization scheme with better complexity and Bit Error Rate (BER) performance. The effects of the number of hidden layers and the number of hidden neurons on the performance of RNNE are studied quantitatively to determine the ideal structure for RNNE. Initially, the performance of the RNNE with different numbers of neuron in the second hidden layer has been compared when the number of neurons in the first hidden layer is fixed. The results show that when RNNE has a comparable number of neurons in each hidden layer, the BER and complexity performance is optimized. Then, as for the RNNE with multiple hidden layers, we quantitatively examined the influence of the number of hidden-layer on the BER and complexity of RNNE. According to the results, the two-hidden-layer RNNE outperform RNNE with three-hidden-layer. The complexity of two-hidden-layer RNNE is 23.3% less complex than a single-hidden-layer RNNE. With similar algorithm complexities, the power budget of the two-hidden-layer RNNE is approximately 1 dB higher as compared to the single-hidden-layer RNNE at 7%-OH FEC threshold. This optimization strategy provides a reference for the selection of the number of hidden-layer number as well as the number of hidden neuron while using RNNE to compensate for nonlinear distortions in the optical IM/DD system.
Dec. 25, 2022Vol. 51 Issue 12 1206001 (2022)
Yang CAO, Zupeng ZHANG, and Xiaofeng PENG
The adaptive optical system without wavefront detection has the advantages of simple structure and easy application, and it is now turning into a research hotspot in the field of optical communication. With the rapid development of artificial intelligence technology in recent years, deep learning has been introduced into wavefront detection-free adaptive optics systems to correct wavefront aberrations. This paper proposes an adaptive optical wavefront recovery method based on the residual attention network in order to prevent the degradation of neural network. To prevent the degradation phenomenon of neural network, the residual network is first used as the backbone network, and its hopping layer connection property is utilised to enable the network model to learn deeper features. The input light intensity map is transformed into a feature map by a 7×7 downsampling convolution operation in the residual network, followed by a maximum pooling operation with a filter size of 3×3 to reduce the computational parameters and prevent overfitting phenomenon. Then, to increase the feature extraction capability of the network without significantly increasing the computational effort, this paper constructs a multi-scale residual hybrid attention network structure based on the residual network, using a null convolution operation to convert the light intensity image into a feature map for backward propagation. In the attention layer, features are extracted by convolution kernels of different scales in a distributed manner, and the dual-stream network structures of 3×3 and 5×5 sizes are chosen to extract the feature maps. The attention mechanism is used to improve the recognition rate of the network for broken light spot features and to achieve the effect of enhancing the network to express light intensity image features. Each hybrid attention module contains two convolution operations and one hybrid attention computation operation. The dimensionality of the feature map remains unchanged after the attention layer, and each channel is assigned a different weight coefficient. Finally, a network loss function combining the realistic evaluation metrics of wave crest and trough values as well as root mean square values of wavefront is designed, and the Zernike coefficients of the actual wavefront aberration are ensured in the training to match the final result. In order to simulate the transmission of vortex beams at different turbulence intensities, the Zernike coefficients and corresponding light intensity maps are randomly generated at different turbulence intensities in accordance with Kolmogorov turbulence theory. Parameters such as the gradient descent algorithm, batch size and number of iterations of the network are set reasonably, and the simulations are carried out using the keras deep learning library. The final results show that the residual attention network can reconstruct the turbulent phase quickly and accurately, and the recovered residual aberrations have peaks and troughs between 0.05 and 0.3 rad and root mean square between 0.01 and 0.07 rad. The experimental results show that the Zernike coefficients predicted by the residual attention model are similar to the actual coefficients and the phases reconstructed by the coefficients are highly similar to the actual phases compared with other network models. The effectiveness of the hybrid attention network in the task of reconstructing wavefront phases is then also verified, with the highest accuracy achieved with less increase in time complexity. The high accuracy, real-time performance and flexibility of the residual attention network provide practical applications for deep learning in adaptive optical systems.
Dec. 25, 2022Vol. 51 Issue 12 1206002 (2022)
Yun GUO, Shenglin CHEN, Ping WANG, Xiangyu WEI, Yujuan WANG, Shanping WANG, and Haicheng WAN
Based on distributed fiber optic sensors, fiber grating sensors and fiber interferometers have been widely used in tensile force measurement. In contrast, fiber interferometers have been widely studied due to their high sensitivity, such as Mach-Zehnder Interferometers (MZI), Fabry-Perot Interferometers (FPI), and Sagnac Interferometers (SI). On this basis, in order to improve the tensile force sensitivity of fiber interferometers, cascade fiber interferometers based on Vernier effect are proposed, such as cascaded dual MZI, cascaded dual FPI and cascaded MZI-FPI structures. However, the matching of the optical path difference and insertion loss of the cascade structure has always been a difficult problem to solve, which can affect the spectral quality of the Vernier effect. Therefore, the sensing accuracy and resolution of the tensile force measurements are limited.In this paper, a parallel FPI all-fiber tensile force sensor based on the Vernier effect is proposed, which is composed of a Sensing FPI (SFPI) and a Reference FPI (RFPI) in parallel. The structure is prepared only by an arc discharge technology, which ensures the uniformity and repeatability of the structure preparation. Among them, the SFPI is a closed air cavity. The tapered air microcavity is fabricated by precisely controlling the discharge position of HCF by an optical fiber fusion splicer. Then, the tapered air microcavity is discharged multiple times with a small current to improve the reflectivity of the microcavity. RFPI is an open air cavity. A section of HCF and Single-Mode Fiber (SMF) with an inner diameter of 80 μm is directly fused, and the length of the HCF cavity is precisely controlled by a precision cutting platform, so that the FSR of the interference spectrum is consistent with the SFPI. Subsequently, a section of HCF with an inner diameter of 10 μm is splicing on the end face.The parallel structure only consists of SMF and HCF, and the thermal expansion coefficient and thermo-optic coefficient of silica and air are very small, which reduces the crosstalk effect of temperature on tensile force. Through theoretical analysis, it is found that when the optical path difference between SFPI and RFPI is close to when not equal, a Vernier effect can be formed, and the smaller the optical path difference ratio between the two, the greater the sensitivity magnification. In order to form a high-quality Vernier envelope, a fiber attenuator is added between the RFPI and the fiber coupler to adjust the insertion loss of the RFPI to match the energy of the SFPI. The influence of the fiber attenuator on the Vernier envelope quality is verified by numerical analysis and experiments. The experimental results show that after adding the fiber attenuator, the contrast ratio of the Vernier envelope is increased from 0.05 to 0.2, and the magnification is four times.In the experiment, SFPI with a cavity length of 67 μm is prepared for tensile force test. In order to verify the hysteresis of the tensile force sensor, the experiments of increasing and decreasing the tensile force are carried out, respectively, with the sensitivities of 4.022 nm/N and 3.986 nm/N. In order to further increase the tensile force sensitivity of the sensor, two RFPIs with cavity lengths of 80 μm and 63 μm are prepared in this experiment, and formed parallel structure 1 and parallel structure 2 with SFPI, respectively. Tensile force experiments are carried out on two groups of parallel structures. With the increase of tensile force, the reflection spectrum of structure 1 undergoes a clear blue-shift. The corresponding sensitivity is -19.31 nm/N with the linearity of 0.992, which is 4.8 times larger than the sensitivity of a single SFPI. With the increase of tensile force, the reflection spectrum of structure 2 undergoes an obvious red-shift. The corresponding tensile force sensitivity is 63.5 nm/N with the linearity of 0.993, which is 15.8 times larger than the sensitivity of a single SFPI. The simulation analysis shows that when the SFPI cavity length is greater than the RFPI cavity length, with the increase of the tensile force, the drift direction of the envelope is consistent with the drift direction of the single SFPI interference spectrum.To explore the temperature crosstalk of the sensors, the temperature experiment of single SFPI and parallel structure 1 is carried out, and the temperature measurement range is 100°C ~600 °C. The experimental results show that the temperature sensitivity of single SFPI and parallel structure 1 are 3.93 pm/°C and -18.91 pm/°C, respectively, the sensitivity is amplified by about 4.8 times, and the temperature crosstalk is only 9.8×10⁻⁴ N/°C.To verify the stability of the proposed sensor, structure 1 is tested under different tensile force conditions. The experimental results show that the maximum drift of the Vernier envelope at 0.79 N is 0.02 nm, which proves that the sensor has good stability.In this paper, a high-sensitivity fiber-optic tensile force sensor based on the Vernier effect is proposed, which consists of a parallel FPI structure. By matching the energies of SFPI and RFPI through fiber attenuators, the Vernier envelope quality is optimized. The tensile force sensitivity can be improved from 4.022 nm/N to 63.5 nm/N, and the amplification factor is 15.8 with the linearity of 0.993. The simulation results show that the experimental results are basically consistent with the theory. At the same time, the temperature crosstalk of the sensor in the range of 100°C ~600 °C is only 9.8×10⁻⁴ N/°C.
Dec. 25, 2022Vol. 51 Issue 12 1206003 (2022)
Bin WANG, Yichun DAI, Fangyu XU, and Zhenyu JIN
The 8-meter ring segmented primary mirror is one of the important alternatives for China Giant Solar Telescope plan. The active control technology of the segmented mirror is the key to realizing the high spatial resolution of the segmented solar telescope. In the active control of the ring segmented mirror, high precision edge detection and tip/tilt detection are important factors in determining the co-phase maintenance of the primary mirror. In the current CGST active segmented scheme, the piston error of the segmented primary mirror is detected and corrected by the electromechanical edge sensors. However, in solar observations, the daytime temperature fluctuates greatly, and the primary mirror surface is affected by solar thermal radiation to generate temperature gradients. The primary mirror temperature control is required to improve mirror seeing. The temperature of the telescope truss system will also change due to the influence of thermal radiation. Therefore, the complex observation environment of the solar telescope will cause the zero-point drift of the electromechanical edge sensor, which will gradually increase the figure error of the primary mirror and will not be able to maintain the co-phase for a long time. To solve the problem of the unstable zero-point of the electromechanical edge sensor in the solar telescope, it is necessary to find a short-period calibration method for the electromechanical edge sensor, and the calibration period is about tens of seconds to several minutes. The accuracy of edge detection is better than 5 nm, and CGST can achieve the co-phase maintenance of the primary mirror in visible or near infrared. Therefore, the calibration accuracy of the edge sensor needs to be better than 5 nm. The optical co-phase detection technology detects the figure error of the primary mirror and the phasing error, and measures the absolute position of the segments. The short-period calibration of edge sensors of segmented solar telescopes using the optical detection technology is an optional solution. In this paper, in order to verify the feasibility of short-period calibration of edge sensors with the optical detection technology, edge detection research based on point spread function is carried out. Cross-calibration experiments are carried out using actuators, edge sensors and point spread function cross-correlation detection. The detection error level of this method is evaluated, and an active control experiment based on point spread function edge detection is carried out on a two-mirror system. In the 5-hour active control experiment, the RMS of the tilt/tip change of the segmented mirror is maintained at 0.01″, the RMS of the edge height change of the segmented mirror is maintained at 6.33 nm, and the RMS of the figure error of the segmented mirror is maintained at 18.73 nm. The experimental results show that the optical edge detection can accurately reflect the change of the position state of the segments in the active control, and the edge detection accuracy is better than 5 nm. The edge detection accuracy and detection frequency based on the point spread function satisfy the short-period calibration of edge sensors. The research results provide a reference for the active maintenance of the ring segmented solar telescope in the near infrared or visible light.
Dec. 25, 2022Vol. 51 Issue 12 1211001 (2022)
Heng SHI, Xin GAO, Xiyu LI, Chengqiang LEI, Lei HU, Yonghong ZONG, Donghao ZHENG, and Rui SUN
The high-precision trajectory data of the rocket vertical take-off phase can be used to evaluate the technical performance and accuracy of the rocket, provide data reference for the improved design and finalization of the rocket, and also provide important trajectory reference data for the rocket take-off safety control system. The trajectory of the rocket in the vertical take-off phase changes greatly in the vertical rising direction, while the theoretical trajectory in both directions of the horizontal plane does not change. However, in the actual launch process, due to various interferences and certain delays and deviations in the real-time control of the rocket, the actual trajectory of the rocket in the horizontal plane will inevitably have a certain offset.The traditional trajectory measurement methods in the vertical take-off phase of rocket mainly include telemetry, optical and radio radar measurement. Due to the vibration caused by rocket launch, the trajectory measurement accuracy of telemetry system is not high, and it is difficult to obtain effective original analysis data after rocket failure. The optical measurement system uses images taken by multiple stations to obtain the rocket trajectory data after the rendezvous, but it is easily affected by the weather and has poor real-time performance. Due to the interference of ground clutter, it is difficult for radio radar to obtain effective trajectory data at this stage. It can be seen that there is no real-time trajectory measurement data in the vertical take-off phase of the rocket at present, and it is urgent to fill the data gap in this phase through new measurement methods.A single lidar can be used to measure the rocket trajectory in the take-off phase, but the trajectory data of the rocket in both directions of the horizontal plane in the vertical take-off phase changes very little, and only relying on a single lidar to measure the trajectory in the two directions will cause large errors. Compared with a single lidar measurement system, the field of view of the two multi-line lidars in the vertical direction can reach 25°, and a total of 128 laser scanning lines scan the rocket target area at the same time. In addition, the two lidars conduct fusion measurement at an intersection angle of 70°, which can cover the target area of the rocket with a larger angle range. Therefore, more target measurement points can be scanned, which can not only improve the fitting accuracy of the center of the ellipse, but also effectively ensure the reliability of the data measurement.In view of the difficult technical problem of obtaining real-time high-precision trajectory data in the rocket vertical take-off phase, a new rocket take-off phase trajectory fusion measurement system based on lidar is proposed in this paper, which has the advantages of convenient station layout, easy installation and low power consumption. At the same time, it is less affected by weather, ground clutter signals and rocket vibration, and can effectively obtain the rocket real-time trajectory data. Two lidars are installed on a two-dimensional precision turntable to form a fusion measurement system. Before the launch of the rocket, the two lidars jointly scan the middle and upper target areas of the rocket. Based on the proposed algorithm of laser point cloud data correction, the initial value solution of rocket target area trajectory and data fusion processing of the two trajectory data, the static and dynamic trajectory measurement accuracy of the lidar are calculated and analyzed to be 0.023 5 m and 0.036 6 m respectively. In the process of rocket vertical take-off, the two-dimensional precision turntable receives the trajectory data of the rocket target area in real time, guides the lidar to track and scan the whole process of the rocket vertical take-off phase with high precision according to the rocket position information, and completes the real-time and high-precision trajectory measurement of the rocket vertical take-off phase, which effectively fills the gap of the trajectory measurement data of the rocket at this stage and ensures the safety of rocket launch. Up to now, the rocket real-time trajectory measurement system based on lidar has successfully completed many test tasks in a satellite launch center. Under the conditions of vibration, tail flame and other environmental interference in the rocket take-off phase, the real-time dynamic trajectory measurement accuracy can be better than 0.05 m. It is verified that the measurement system and method proposed in this paper can effectively improve the measurement accuracy and reliability of rocket trajectory, which has important engineering application value.
Dec. 25, 2022Vol. 51 Issue 12 1212001 (2022)
Xiyu LI, Xin GAO, Liangliang SUN, Chengqiang LEI, Heng SHI, Lei HU, Yonghong ZONG, and Donghao ZHENG
The optical measurement equipment has gradually expanded from ground-based to ship-borne, vehicle-mounted, and airborne platforms. At this stage, the traditional ground-based single axis dynamic detection device is used to detect the tracking performance of the optical measurement equipment with the moving platform, and its motion trajectory is relatively single. The motion equation components of the simulated target in the azimuth and pitch directions have high-order derivatives. Although the axis number for the detection target has been increased to three, there are still position blind spots in the workspace. It is impossible to truly simulate the 6-DOF (Degree of Freedom) motion characteristics of moving platform and typical maneuvering target.In order to test and evaluate the tracking performance of optical measuring equipment with a moving platform under ground conditions, a 6-DOF detection target and detection method are proposed. In view of the fact that the traditional kinematics modeling and trajectory planning methods of multi-DOF serial mechanisms need to establish six coordinate systems, the calculation process is cumbersome, and there are problems such as poor real-time performance and easy to appear motion singular solutions. A continuous and singularity free kinematic model of the detection target is established in a global way by using the screw exponential product method. The method only needs to establish the head and tail coordinate systems of the detection target, which can completely express the transformation relationship between joints, and it is convenient to solve the inverse kinematics. The fusion motion trajectory in real time and high precision is simulated and the operation efficiency is improved. Shipborne optical measuring equipment is a typical ship moving platform equipment. The XX-1109 shipborne optical measuring equipment is studied and its tracking performance is tested.According to the performance of the detection target and optical measurement equipment, the azimuth and pitch axes tracking random errors of the XX-1109 shipborne optical measurement equipment are calculated and analyzed to be 23.88″ and 23.86″, respectively. The simulated optical target is installed at the end of the 6-DOF manipulator, and then a new 6-DOF detection system is constructed. The detection system is mainly composed of the simulated optical target, 6-DOF manipulator, operation control subsystem, data communication subsystem, time measurement terminal and data processing subsystem. The detection target adopts ABB 6-DOF manipulator IRB 6700-205, and its repeated positioning accuracy is 0.1 mm. The XX-1109 shipborne optical measurement equipment is deployed at a distance of about 5 meters from the detection target. The detection target simulates the movement track in real time. The XX-1109 tracks the simulated target in real time to achieve the detection and identification of tracking performance. By formulating a reasonable and feasible detection method, the tracking performance of XX-1109 optical measurement equipment is tested and evaluated. The test results show that the kinematics model of the detection target established by the screw exponential product method realizes the real-time high-precision trajectory planning of the ship moving platform and typical maneuvering targets, which improves the calculation efficiency and avoids the problem of motion singularity in traditional modeling methods. Considering the size of angular velocity and the randomness of error, the tracking random error of the XX-1109 optical measuring equipment is consistent with the theoretical analysis, which verifies the effectiveness and superiority of the new detection system and method. The tracking performance test of the optical measuring equipment with moving platform under the ground conditions is realized.The new detection system and method have successfully completed the detection and identification of the optical measurement equipment on shipborne, vehicle-mounted and airborne moving platforms. It can not only quickly find tracking performance problems in the development stage, but also reduce the development cycle and the cost, which has important engineering application value.
Dec. 25, 2022Vol. 51 Issue 12 1212002 (2022)
Chen YE, Donggen LUO, Yixin LI, Pingping YAO, Yi WANG, Guangfeng XIANG, Yang LI, Shuang LI, and Jin HONG
During the process of developing directional polarimetric camera, its stability is an important performance parameter, which represents the normal working state of the imaging remote sensing instruments when it is in orbit. Therefore, it is extremely important to accurately measure the stability parameters of the imaging remote sensing instruments, which can provide instructive information for developing imaging remote sensing instruments. At present, the traditional halogen tungsten lamp integrating sphere light source is usually adopted as a radiation source. At the same time, a wide-spectrum trap detector is used to synchronously monitor the light energy stability of the light source, and the obtained monitoring data is used for stability parameter processing correction. In order to monitor the stability of the integrating sphere radiation in different wavelength bands better and solve the problems of spectral bandwidth mismatch as well as data acquisition time alignment difficulty, which cannot ensure measurement accuracy, the method is proposed in this paper. It works by using data of directional polarimetric camera data instead of trap detector data, 12 channels of directional polarimetric camera data wavelet decomposition, respectively, to extract the variation of each band energy. Then normalize the fluctuation of each band energy. It can be inferred that the change of the digital number caused by the fluctuation of the traditional halogen tungsten lamp integrating sphere light source. Therefore, through measurement data correction, the influence of light source instability can be deducted and effectively improve the stability parameter measuring accuracy. After deducting the light source fluctuation according to the above method, the instability parameter of the directional polarimetric camera has reduced from 0.153% to 0.031%. The corrected value shows the actual instability of the directional polarimetric camera more realistically. The detected light source energy variation trend of the same band with three detection directions is highly consistent, and the signal-to-noise ratio of the multi-frame image method is improved more significantly, which strongly proves the effectiveness of the proposed method. Compared with the signal-to-noise ratio before being corrected, the corrected signal-to-noise ratio has increased by 2.52% on average by the wavelet decomposition de-illumination method, while only increased by 0.72% on average by the trap detector de-illumination. In the 865 nm and 910 nm bands, the wavelet decomposition de-illumination method improves the signal-to-noise ratio by 4.34% and 12.9%. It is worth noting that the signal-to-noise ratio increase in the correction by wavelet decomposition de-illumination method is much larger than that of the other method. It also shows that there are limitations in correcting fluctuation in the 865 nm and 910 nm bands with broad-spectrum trap detector monitoring data. In the 490 nm band, the wavelet decomposition de-illumination method increased by 0.54%, but the other correction method only increased by 0.09%, mainly because the light source energy in the 490 nm band is very low, so the digital number of directional polarimetric camera acquired is the lowest. Therefore, although the light source has the largest change in the 490 nm band, the improvement of the signal-to-noise ratio is not as significant as that in the 910 nm band. The reason for the small signal-to-noise ratio improvement by the two correction methods in 670 nm band is that the variation of the light source in this band is less than 0.205%. Therefore, it is reasonable that the improvement effect is not obvious. The proposed method can be used to test the stability parameters of various imaging remote sensing instruments.
Dec. 25, 2022Vol. 51 Issue 12 1212003 (2022)
Dong HUANG, Xin LI, Yanna ZHANG, Wei WEI, and Quan ZHANG
When the satellite is in orbit for a long time, the remote sensor will be affected by factors such as the space environment and the aging of components, which will cause the phenomenon of radiation response decay. To meet the quantitative requirements of satellite data and the monitoring of remote sensor performance change, continuous and precise calibration of remote sensors is required. At present, the vicarious calibration based on the reflectance-based method is widely used. A large area of uniform and stable targets are used as the radiometric calibration site. When the satellite transit, the surface reflectance and atmospheric parameters of the site are synchronously measured manually, and the apparent reflectance is calculated in combination with the radiative transfer model, to obtain the calibration coefficient of the satellite sensors. It takes much time, manpower, material and financial resources to complete an effective calibration test. At the same time, due to the limitations of weather conditions, the calibration frequency is basically maintained at the level of once a year. With the increase in the number and types of optical satellites, the radiometric calibration based on the traditional vicarious calibration method can not meet the needs of remote sensing quantification in time. In recent years, a method of automated vicarious calibration based on high frequency, high precision, low cost and other considerations has been adopted internationally. This method uses unattended and automated observation equipment to measure the surface reflectance and atmospheric parameters and combines with the radiation transfer model to realize the high-time calibration of remote sensors. The automated vicarious calibration observation network such as the Radiometric Calibration Network and the Automated Vicarious Calibration System has been deployed in Railroad Valley Playa in the United States, La Crau in France, Baotou in China, Dunhuang in China, etc. for satellite calibration and verification. Surface reflectance is an important parameter for automated vicarious calibration. Considering the long-term field observation and operation stability, the channel-type radiometer is usually used.The automated test-site radiometer is the core equipment of the automatic vicarious calibration system in the Dunhuang radiometric calibration test site, which provides surface reflectance parameters. In order to ensure the high-precision measurement of reflectance in the long-term automated vicarious calibration process, the high-precision calibration of the automated test-site radiometer is generally completed in the laboratory. The calibration process needs to be completed by returning to the laboratory. The long calibration cycle will cause the loss of observation data, and long-distance transportation vibration will also affect the calibration accuracy.The damage to the automated test-site radiometer observation area caused by manual mobilization, installation and disassembly will seriously affect its consistency with the satellite transit observation area. In addition, light sources standard lamp and sun are used for instrument calibration and surface reflectance calculation, respectively in the satellite automated vicarious calibration.There are differences in spectral distribution between the two.To solve these problems, the on-site calibration method of the channel-type automated test-site radiometer was studied. The automatic observation data of the hyperspectral irradiance meter was introduced into the solar-radiation-based calibration method to calculate the sky diffuse illuminance. The acquisition methods and calculation processes of light source, aerosol optical thickness, diffuse to total ratio and other parameters used in the calibration of the automated test-site radiometer and satellite automated vicarious calibration were consistent. The solar-radiation-based calibration method is used to calculate the calibration coefficient and surface reflectance, and the calculated surface reflectance is compared with the manually measured surface reflectance using ASD spectrometer. Then the uncertainty of surface reflectance calculation is analyzed.The results show that the relative deviation between the reflectance of the automated test-site radiometer calculated by the solar-radiation-based calibration method and the reflectance of artificial ASD measurement is better than 1.4%, and the uncertainty of reflectance calculation is better than 2.78%~4.35%.Solar-radiation-based calibration method has high accuracy and system advantages in practical application. The calibration coefficient of the automated test-site radiometer calculated by the solar-radiation-based calibration method is applied to the satellite's automatic vicarious calibration. The automatic vicarious calibration results in recent three years are in good agreement with the AQUA/MODIS on-board calibration coefficient. The relative deviation of single calibration of each channel is basically within 5%, and the average percentage deviation is better than 3.58%. It can monitor and track the operation of satellite load, and verify the effectiveness and applicability of the SRBC method.
Dec. 25, 2022Vol. 51 Issue 12 1212004 (2022)
Xinghao FAN, Chunyu LIU, Minglin XU, Shuai LIU, Yingming ZHAO, and Yazhen CUI
Hyperspectral remote sensing technology is an optical remote sensing technology developed on the basis of imaging spectroscopy, which can realize comprehensive observation of spatial information, spectral information and radiation information. The imaging spectrometer adopting the Prism-Grating-Prism (PGP) spectroscopic element avoids the off-axis problem of traditional prism-type and grating-type imaging spectrometers, and is conducive to the miniaturization and compactness of imaging spectrometers. Aiming at the problem that the spectral smile of coaxial PGP imaging spectrometer is difficult to correct, this paper proposes a method to rectify the curvature of spectral line by using curved slit and distortion of the collimator lens and focusing lens. On the basis of retaining the advantages of PGP such as high diffraction efficiency and coaxial optical path, this method can correct spectral smile and keystone of the instrument. In this paper, the prism-grating-prism vector dispersion model is established by focusing on the influence of lens distortion, the number of grating lines and prism angle on spectral smile and keystone. By tracing the light vector and analyzing the intersection between the light vector and the image plane after the light vector passes through the PGP element with different parameters, the influence of different parameters on the smile was analyzed. It is worth noting that when the shape of the slit changes, the direction of the initial light vector also changes. Therefore, this model can also analyze the effect of the slit shape on the spectral smile and keystone. Further, the prism-grating-prism vector dispersion model is used to analyze the spectral line bending characteristics of coaxial PGP spectroscopic elements: when the coaxial condition is met, the PGP imaging spectrometer will inevitably have a large smile, and the spectrum is bent in the short-wave direction. After adjusting the prism Angle, the number of grating lines and the lens distortion, we analyzed the smile size of the combination of the above parameters, and came to an optimistic conclusion: the smile problem of the imaging spectrometer could not be eliminated only by changing the prism, grating and lens. However, the smile can be corrected well by the method of bending the slit and matching the appropriate lens distortion. In order to improve the versatility of this method, this paper gives an objective function for correcting spectral curvature and spectral line curvature by using the PGP vector dispersion model, and uses genetic algorithm to optimize the objective function and calculate the best combination of slit shape and lens parameters quickly. In order to verify the feasibility of this method, this paper uses the calculation results of this method to design a curved slit PGP imaging spectrometer with a slit length of 22 mm, an operating wavelength of 400~800 nm, a spectral resolution of 3 nm, and an F number of 3.5 which has a spectral curvature of less than 2 μm and a spectral line curvature of less than 2 μm. The optical system has a diffuse spot radius of less than 5.4 μm in the wavelength range of 400~800 nm, and can distinguish slit images with a spectral interval of 2 nm. The energy concentration of all fields of view can reach 90% in the 2×2 pixel scale. The design results show that the use of curved slit and distortion of the collimator lens and focusing lens can effectively correct the curve of the spectral line, which has important guiding significance for the design of the coaxial PGP imaging spectrometers. In this article, we calculated the optimal slit shape and lens parameters for different slit lengths and different grating parameters, which proved that the method had universal applicability.
Dec. 25, 2022Vol. 51 Issue 12 1212005 (2022)
Hongping WANG, Xin LIU, Shichen ZHAO, Yu WANG, and Lei WANG
To realize the quality measurement of the spot facing of the aircraft skin, a structured light 3D vision inspection system is employed in this paper. Due to the high reflection of the workpiece and the influence of the noise, the system mainly solves the problem in the actual project. The acquisition of 3D point cloud data is partially missing. At the same time, due to the complexity of the surface parameter equation on the surface of the countersunk hole, the measurement of the normal deviation angle is difficult and accurate. Aiming at the above problems, the establishment of a spatial cone parameter model based on the orthogonal projection method for quality inspection of countersunk workpieces, and a mathematical model for optimizing the normal deviation angle parameters is proposed to improve the inspection accuracy. First, most points of the workpiece scanned by a point cloud camera are disordered and discrete. In the process of devising, normal estimation, and surface fitting of the original point cloud, it is necessary to operate based on the neighborhood. If there is no efficient auxiliary data structure, and if it is convenient to all points in space to have the k closest distances to a given data point index point, this time complexity will be very large for a large number of data points. KD tree, or k-dimensional tree, is a data structure employed in computer science. It mainly divides data through dimensions and efficiently manages high-dimensional data. In this paper, KD-tree is used to determine a spatial index structure index of scattered points.The first crucial link in the quality inspection process of 3D point cloud spot facing is to denoise the original point cloud. The fundamental purpose of this operation is to remove the influences of point cloud noise and provide high-precision and high-quality 3D data for subsequent workpiece quality inspection. In this experiment, when a surface structured light camera is used to obtain the three-dimensional point cloud data of the workpiece, due to the complexity of the actual working environment, there are various errors in the equipment obtained by the point cloud, which can generate a large number of noisy point clouds. These noisy point clouds are 3D data irrelevant to the detection target. And these noisy data are scattered and disordered spatial point clouds. Noise may also be generated due to external interference, line of sight occlusion, reflection and diffraction characteristics of some metal workpiece surfaces, obstacles, and other factors. To ensure that the quality parameters of the countersink can be accurately detected, this paper adopts a bilateral filtering noise reduction method to reduce the influence of outliers and noise. Secondly, the RANSAC algorithm is used to segment the upper surface, extract the upper and lower boundaries according to the characteristics of the centralized distribution of the boundary point cloud on one side, and the plane parameters are fitted. According to the orthogonal projection, the cone angle satisfies the Fourier transform function relationship on the plane XOY or the plane XOZ, the cone angle and cone point of the spot-facing hole are calculated, and an accurate spatial cone mathematical model is established. Finally, through data fusion between the upper and lower boundary planes of the spot facing and the spatial cone mathematical model, the parameters of the spot facing to be detected are obtained. When the spatial conical axis and Z axis have ceviation angle, the optimal mathematical model of normal deviation angle is proposed. For the surface parameter equation of surface countersink is too complicated, the problem of low normal precision fordetection countersink is avoided. Furthermore, to verify the algorithm performance, comparisons are made with machine vision and mobile least squares surface fitting methods. The experimental results show that the algorithm has higher accuracy and better anti-noise performance.
Dec. 25, 2022Vol. 51 Issue 12 1212006 (2022)
Zehua SUN, Weiguo LIU, Shaobo GE, Bingcai LIU, Chunfang WU, and Yingxue XI
When a planar wave illuminates the microstructure of a dielectric material, it will appear in the shadow surface of the high-intensity energy gathering area and radiate to the far field, which is the photonic nanojet effect. Due to its strong focusing and ability to break through diffraction limits,the photonic nanojet has broad application prospects in the field of biological detection and optical characterization. Since the concept of photonic nanojet was proposed in 2004, researchers have explored the factors influencing the performance characteristics of photonic nanocrystals by changing various parameters. The results show that the formation of photonic nanocrystals is related to the microstructure shape, the incident wavelength and the ratio of the microstructure to the refractive index of the background. Although different photonic nanojets can be obtained in relevant studies, dynamic regulation can not be achieved. Liquid crystal has entered the field of scholars studying the phenomenon of photonic nanojet because of its tunable external field, providing more possibilities for subsequent studies. Subsequently, the method of combining with liquid crystal to change refractive index contrast and realize tunable photonic nanocrystals is proposed successively. However, most of the existing liquid crystal photonic nanojet is developed around the microsphere structure. When considering the microstructure of liquid crystal combined with the gradient profile of heterogeneous materials, the tunability of its light field deserves further study. This paper proposes a photonic nanojet optical element coupled with space light modulation of heterogeneous material bilayer micropyramid structure, which uses the liquid crystal as the background medium, and changes the rotation angle of the liquid crystal molecule by applying external forces to reduce the ratio of the microstructure to the refractive index of the background, and to realize the dynamic adjustment of the photonic nanojet. The Finite Difference Time Domain (FDTD) method is used for simulation. The fundamental law of photonic nanojet performance characteristics changes when the contrast between the microstructure and the background refractive index is reduced. The results show that the effect of reducing refractive index contrast on the photonic nanojet of heterogeneous material bilayer micropyramid structure is mainly reflected in the lateral width and focusing efficiency at the focal point, the focal length increases, the energy shifts backwards and the multifocus appear. The focal length of PNJ changes from 6.1λ to 22.3λ, and the decay length is up to 36.5λ. Comparing with the photonic nanojet generated by the bilayer microsphere structure coupled with liquid crystal, the decay length is improved by 10λ. With the reduction of the ratio of the refractive index of the microstructure to the background medium, the full width at half maximum increases, and the adjustment range of the focusing efficiency can reach 16.9% to 43.2%, when the focus gradually moves away from the microstructure, and the energy is transmitted to the far field. By comparing microstructures without and with liquid crystals, it can be concluded that the intensity and half-height full width of the microstructure light field without liquid crystal are similar to those with the presence of liquid crystal, and the focal length and attenuation length are much smaller than those with the presence of liquid crystal. Moreover, liquid crystal can give diversity to the light field and has the ability to regulate it. The spherical MIE scattering theory agrees with the results in this paper. With the help of liquid crystal as a spatial light modulation method, the bilayer micropyramid structure photonic nanojet realizes a wide range of focal length adjustment and ultra-long propagation length, providing theoretical support for the application of photonic nanojet in photoelectric detection and optical capture.
Dec. 25, 2022Vol. 51 Issue 12 1223001 (2022)
Zhengli LAN, Yiji SONG, Xiaosheng YANG, Qingping ZENG, and Feng HE
Graphene has good electrical and optoelectronic properties, and the heterojunction photodetector formed by the combination of graphene and silicon semiconductor materials has excellent photodetection properties. The band gap of silicon is 1.12 eV, resulting in the cut-off wavelength of silicon-based near infrared ray photodetectors generally around 1.1 µm, and its detection wavelength range is relatively narrow, and Ge-based photodetectors can detect longer-wavelength near infrared ray light.In this study, a graphene/germanium Schottky junction photodetector in the near-infrared communication band was fabricated. First, high-quality graphene was prepared on the surface of copper foil by chemical vapor deposition method. Subsequently, the graphene was transferred to n-Ge surface by the wet transfer method, thus forming a Schottky contact. Finally, a high-performance graphene/germanium Schottky junction device is obtained by depositing gold electrode on the front side of the germanium substrate and spin-coating the In-Ga electrode on the back side.By simulating the photon absorption rate in the two-dimensional structure of the n-Ge substrate with Synopsys Sentaurus TCAD, the unique distribution of the photon absorption rate can be seen. When the wavelength of the incident light is short, the penetration depth of the incident light is very shallow (less than 10 nm), indicating that photons are almost absorbed in the surface of the heterojunction. Due to the existence of surface defects and/or dangling bonds, there is severe carrier recombination in this region, which reduces the photoresponse. But as the wavelength of the incident light increases, the penetration depth will gradually increase, reaching the strongest absorption at 1 600 nm. With the introduction of the graphene transparent electrode, it will form a good Schottky contact with the germanium substrate, which greatly improves the photo-generated carrier collection efficiency of the device. As the incident wavelength increases from 265 nm to 1 550 nm, the generation of electron-hole pairs will gradually expand from the depletion region of the monolayer graphene/n-Ge junction to the diffusion region, causing the photodetector has different responses with different wavelengths. Using the band diagram of the junction and the carrier transport process to analyze and explain the working mechanism of the detector, the Fermi level (EF) of graphene is 4.7 eV. The resistivity of n-Ge is 1~10 Ωcm-1, and its work function is about 4.37 eV. After the two materials form a Schottky junction, electrons diffuse from germanium to graphene due to the difference in work function, while holes are formed in the depletion region of germanium. This charge transfer breaks the original respective energy band balance, the energy levels near the germanium surface bend upward, and a built-in electric field appears. The depletion region of germanium produces electron-hole pairs when exposed to light with energies exceeding the forbidden band width of germanium (0.67 eV). Carriers generated near the depletion region diffuse into the depletion region. Subsequently, the electrons and holes are rapidly separated by the built-in electric field, the electrons are collected at the bottom In-Ga electrode, while the holes are transferred through the graphene and finally collected by the gold electrode at the upper surface.The same is true of the experimental results, the graphene/germanium Schottky junction shows obvious rectification characteristics, and the rectification ratio of the device is about 5.3×10² under the condition of ±1 V without illumination, which is better than many previous Ge-based heterogeneities structure. The detector shows good switching characteristics and good repeatability for pulsed light at different frequencies (1 kHz, 5 kHz, 10 kHz), indicating that the device has good operability over a wide modulation frequency range. After 5 months in the air environment, the photocurrent almost did not decay, and it still maintained its excellent optical switching characteristics, showing good stability. The device also exhibits obvious photoelectric response performance. Under the irradiation of 1 550 nm near-infrared light with a light intensity of 0.3 mW/cm2, the responsivity and detection rate of the device can reach 635.7 mA/W and 9.8×10¹⁰ Jones, respectively. At the same time, the device has a fast response speed, with rise and fall times of 40 μs and 35 μs, respectively, at a 3 dB bandwidth. The potential applications of high-performance graphene/germanium photodetectors in near-infrared optoelectronic systems are demonstrated.
Dec. 25, 2022Vol. 51 Issue 12 1223002 (2022)
© Copyright 2018-2021 | Chinese Laser Press.
All Rights Reserved 沪ICP备15018463号-20