


 View fulltext

2022
Volume: 51 Issue 11
34 Article(s)

Jinzhuang HAN, Xinqiang LI, Jin SHEN, Baojun WANG, Wei LIU, and Yajing WANG
Dynamic Light Scattering (DLS) is a technique for submicron and nano Particles Size Distribution (PSD) measurement. With convenience and rapidity and no interference to the measured particle system, it is widely used in science and engineering. Generally, the DLS measurements are carried out with non-flowing samples in suspension, in which particles move only in the form of Brownian motion. In this situation, the fluctuations of scattered light of particles are only caused by the Brownian motion. Different from the DLS measurement of non-flowing particles in suspension, the translational motion of flowing particles leads to extra fluctuations of scattered light, making DLS measurement for flowing aerosols more difficult.The key of flowing aerosol measurement is that the PSD is difficult to accurately recover, because the increase of velocity aggravates the ill-conditioned state of the inversion equation, which is manifested as the increase of the condition number of the kernel matrix. Regularization is a common equation. However, the effectiveness of regularization is restricted by increasing the velocities of flow particles. To solve this problem, in this paper, the inversion equation was preconditioned to reduce the condition number of the kernel matrix before the Tikhonov regularization was used, which significantly improved the accuracy of recovered PSDs for flowing particles.To verify the effectiveness of the proposed method, the recovered PSDs of the 600 nm unimodal aerosols and 200 nm/700 nm bimodal aerosols with different velocities were simulated. The results show that the peak position error (EP) and the distribution fitting error (EF) of recovered PSDs become significant as the flowing velocity increases, which is represented that the particle size at the peak position is smaller than the true value and the distributions are wider than true distributions. Under the same flowing velocity, the recovered PSDs by preconditioned Tikhonov regularization (Pre-Tik) are closer to the true PSD than Tikhonov regularization (Tik). And the effect of preconditioning is increasingly obvious with the flow velocity increase. When the particle velocity is 2.0 m/s, the EP and EF of the PSD obtained by the Tik is 0.046 7 and 0.006 9 respectively, and by the Pre-Tik is 0.026 7 and 0.005 7 respectively. The simulated inversions of the 200 nm/700 nm bimodal PSDs show similar results in the particle size at both peaks position and the width of distribution, which results in the value of EPs and EFs rising. However, the performance indices of the inversion results of the two methods were quite different. When the flowing velocity is 2.0 m/s, the EP and EF of the PSD obtained by the Tik method are 0.660 0/0.274 3 and 0.012 1 respectively, while the EP and EF of the PSD obtained by the Pre-Tik method are 0.460 0/0.091 4 and 0.009 1 respectively. The accuracy of the recovered PSDs is improved by using the Pre-Tik method.To further compare the performance of the Tik method and the Pre-Tik method, DLS experiments of flowing aerosols were carried out. The measured ACF data were obtained from a homemade DLS measurement platform for flowing aerosols. For unimodal flowing aerosols at 1.77 m/s, the EP and EF of PSDs reduced from 0.087 7 and 0.012 4 by using the Tik method to 0.052 6 and 0.008 6 by the Pre-Tik method. The recovery of the latter method is better than the former. For bimodal aerosol PSDs, the results are similar to unimodal aerosol PSDs. The EPs and EFs of the PSD recovered by the Pre-Tik method are smaller than those obtained by the Tik method, which agrees with the simulations.The inversion results of simulated and experimental data show that the limitations of the regularization method in DLS measurements of flowing particles can be broken through by preconditioning. In this paper, the preconditioner in the form of a diagonal matrix constructed with priori velocity and delay time can weaken the ill-condition state of the inversion equation and makes regularization less sensitive to velocities. Compared with the Tikhonov regularization, the preconditioned Tikhonov regularization can improve the inversion performance significantly for flowing aerosols in DLS measurement.
Nov. 25, 2022Vol. 51 Issue 11 1101002 (2022)
Chunhe YAO, Xu YANG, Mingxin ZHAO, Jian LIU, Nanjian WU, and Liyuan LIU
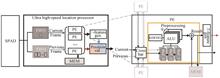
Ultra high-speed object location has potential prospects in civilian and scientific applications. However, the conventional image sensor has a bottleneck that can not achieve continuous ultra high-speed imaging. The Single-Photon Avalanche Diode (SPAD) image sensor, as a new type of spike image sensor, can realize continuous ultra high-speed imaging to support high-speed moving object location. The background subtraction method is a simple and effective high-speed location method, but the image noise caused by the SPAD image sensor will seriously interfere with the processing effect of the background subtraction method. Therefore, denoise processing is required before locating. This paper proposes an ultra high-speed object location processor for SPAD image sensors. It consists of a Processing Element (PE) array, a Y-feature generator, and a position calculator, and is capable of denoising and object location processing. The SPAD image sensor adopts row rolling exposure to produce N pixel output of one row at once exposure. The output format of the SPAD image sensor is a single-bit spike image containing only “1” and “0”. The processing array contains N processing units, each PE unit contains 9 ALUs, which equals the size of filtering window 3×3, for processing Gaussian filtering and background subtraction methods with the current and earliest frames of spiking image data accessed from its two adjacent PEs. The current frame data, the earliest frame data, and the convolution kernel are calculated by complement logic and XOR gate in each ALU of the PE, and then the ALU results and the data in the memory are accumulated to obtain the filtering result. The object location module outputs a row of X feature vector and a column of Y feature vector at the end of each frame. The position calculator compares the feature vector with their thresholds and outputs the coordinate position of the object. We propose the Gaussian filtering and background subtraction method to remove the multiplication and subtraction operations, which reduces the computational complexity and hardware resource consumption while improving the processing speed significantly. Based on the overlapping sliding window method on impulse images, this paper replaces multiplications with additions merely by refactoring the filtering equation without any hardware overhead. During background subtraction, a static scene without objects is used as the background. The image is accumulated and the Gaussian filtering method is applied to obtain a background image. Then the negative value of the background image is regarded as the initial partial sum accumulation, and Gaussian filtering is applied to the following images containing moving objects based on this initial partial sum. In this way, we implement the background subtraction algorithm without a subtractor in the data path. Fixed pattern noise removal can be performed by simply controlling the relationship between the number of accumulated images of the foreground and background, and reusing the circuit of the background subtraction method to perform fixed pattern noise removal. The object location method determines the coordinates of the four corners by comparing the result of background subtraction with the threshold. The whole process is implemented on the FPGA development board. The experimental results show that the quality of the recovered grayscale image is significantly improved after Gaussian filtering. The processor can process spike images with a resolution of 128×128 at a speed of 100 Kfps, and locate moving objects in it. Compared with other studies focusing on ultra high-speed object location, the processor we proposed reaches a favorable trade-off between the processing algorithm complexity and hardware resource overhead. This paper also compares the performance of the processor with the original na?ve Gaussian filter circuit using the multiplication operation with our optimized processor. The result shows that our optimized processor can be synthesized to a frequency of 31.8% higher than the original one and achieves about 72.4% superiority over the original one on hardware resources. Moreover, our solution also can be applied to other spike image sensors to build a sensing-computing system.
Nov. 25, 2022Vol. 51 Issue 11 1104001 (2022)
Qian WANG, Jiangtao XU, Zhiyuan GAO, and Quanmin CHEN
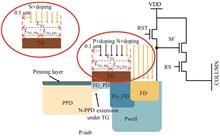
In recent years, Pinned Photodiode (PPD) CMOS Image Sensors (CISs) are widely used in consumer electronics, medical, and other fields due to their advantages of high integration, low power consumption and low cost. CMOS active pixels play an important role in CISs. The design of the Transfer Gate (TG) affects image quality, which is related to Full Well Capacity (FWC) and dark current. TG affects the feedforward effect by channel potential. The feedforward effect directly influences FWC as the charges in PPD can flow into Floating Diffusion (FD) by thermal emission. In addition, due to the existence of interface states, dark current generates at the interface of the TG channel, which flows into PPD during the integration period. Several papers have analyzed the influence of TG on FWC and dark current, and have proposed different improvement techniques and designs. When a negative bias is added to TG, the channel is in a state of accumulation, isolating the interface state of the channel from the depletion region of PPD so that dark current is greatly reduced. Furthermore, adopting a negative bias to TG increases the channel barrier, inhibiting the feedforward effect and increasing in FWC. A positive voltage adopted to TG is also beneficial to reduce dark current, but will make FWC decrease. Adjusting the doping length of p-type impurities can change the position of the potential barrier, so that dark charges flow to FD. In this paper, the influence of two types of doped transfer gates, named N+TG and P+TG, on full well capacity and dark current are investigated. Channel potential is affected by the work function difference between TG and substrate. As the barrier height between pinned-photodiode and floating diffusion increases, the feedforward effect is inhibited and the full well capacity increases. On the other hand, the channel in charge accumulation can reduce dark current. To analyze the influence of TG doping on FWC and dark current, a typical 4T-PPD pixel structure is used in this paper. The device consists of a PPD, a “special” TG transistor whose drain is a FD node, and three conventional transistors named Reset Transistor (RST), Source Follower (SF), and Row Select (RS) transistor. The two kinds of TG have the same structure except for different doping types. P-type doping is shared with p+doping used in PMOS transistors, so no additional steps need to be introduced. Device level simulation using Technology Computer Aided Design (TCAD) is performed based on 4T pixels working process, trap model is added to the simulation. The concentration of traps is set to 1 × 10¹⁰ traps·cm-2 and the capture cross-section to 1 × 10-14 cm2. PPD of two doping types of TG integrates for 10 ms in dark conditions. In addition, the light intensity is set to 2 × 10⁻³ W/cm2 when testing the FWC of PPD. This paper compares P+ TG and N+ TG under the same channel and substrate doping conditions. FWC and dark current characteristics are simulated when the turn-off voltage (VTG~~off) is 0 V. Simulation results demonstrate that the full well capacity of photodiode based on P+TG is 26.5% higher than that of N+TG. The dark current is 0.377 times that of N+TG without negative voltage during the exposure. In practical engineering, a negative voltage is usually applied to N+TG during exposure to obtain good full well capacity and dark current characteristics. The opening characteristics of TG affect image lag, which plays an important role in imaging quality and is usually determined by Charge Transfer Efficiency (CTE). CTE of N+TG is greater than 99.999% at 2.3 V, while P+TG requires 3.0 V. P+TG requires a higher voltage to ensure excellent charge transfer. When the FWC of PPD is high, CTE will be negatively affected, resulting in image lag. At this point, the positive charge pump needs to be introduced to ensure transfer characteristics. Under the simulation conditions in this paper, two doping types of TG have good transfer characteristics at 3.3 V.
Nov. 25, 2022Vol. 51 Issue 11 1104002 (2022)
Binjun MENG, Bingcai LIU, Dong YANG, Hongjun WANG, Xueliang ZHU, Xiaotong QIAN, Rui Niu, and Ailing TIAN
Digital holographic microscopy plays an important role in the surface topography measurement of micro-optical elements. It is based on the interference superposition of waves, and realizes the measurement of three-dimensional information of objects through digital recording and diffraction reproduction. However, due to the interference of background information in the process of microscopic imaging, there are some problems such as poor focusing effect and unsatisfactory image quality. For the wave-front phase detection of micro-optical elements with different structures, the traditional digital holographic 3D field reconstruction method cannot effectively reconstruct part of the angular spectrum components of object light wave, resulting in low accuracy of the wave-front phase measurement of micro-optical elements. Therefore, this paper proposes a phase reconstruction method of compressed sensing based on sparse sampling in the frequency domain. In combination with the characteristic that most phase information is contained in the frequency domain, the sparse characteristics of compressed sensing theory are utilized to conduct random sparse sampling of the spectrum information of holograms during the reconstruction process of the traditional digital holographic reconstruction algorithm. The effective spectral information of the reconstructed object is recovered in the domain of wavelet transform, and then the frequency domain is transformed into the spatial domain by Fourier inverse transform, and the complex amplitude distribution of the reconstructed object is obtained. Finally, experimental research is carried out for continuous and discontinuous phase objects, and the phase reconstruction results of higher quality than the traditional method are obtained by analyzing the quality of phase image reconstruction and the accuracy of 3D reconstruction, respectively, and the accurate measurement of the phase information of the object is realized. After spectral filtering in the frequency domain is carried out by the traditional method, it is easy to lose high-frequency information after conversion from the frequency domain to the spatial domain. However, based on the compressed sensing theory, the proposed method takes advantage of the sparse characteristics of the image to sparsely sample the spectral signals in the frequency domain and sparsely expand them in the wavelet base domain. This means that even if the expansion term has only a few effective terms, the effective spectrum of light wave of sparsely recovered object can still be guaranteed. Experimental results show that the wave-front phase reconstructed by this method is more stable and has higher contrast. Compared with the phase reconstruction results of traditional digital holography, the peak to Valley Value (PV) and Root Mean Square Value (RMS) of residual errors are reduced by 26.97% and 15.04%, respectively, the method based on compressed sensing theory with the compression of imaging mechanism, can be obtained through the low resolution of sampling high-resolution reconstruction of wave-front phase object under test, for surface topography measurement of micro-optics element provides effective information acquisition, improve the reconstruction quality of micro-optics element wave-front phase and 3D measurement accuracy, in discontinuous object wave-front phase measuring has potential advantages.
Nov. 25, 2022Vol. 51 Issue 11 1109001 (2022)
Lulu GUO, and Hongwei YI
Aiming at the limitation of the dynamic range of the imaging sensor, the size of the local window and the fusion image method is further studied, and the multi-exposure image fusion method based on the camera response curve is improved. By changing the exposure time, a set of images with different exposure degrees is obtained, and image fusion is performed on the high-brightness image and the low-brightness image. Firstly, the conversion factor is directly calculated based on the image pixel value, which simplifies the calculation of the pixel ratio factor curve of the High Exposure (HE) image and Low Exposure (LE) image, and avoids the solution of the camera response curve. The pixel values in the low-brightness image are mapped to the pixel value range of the high-brightness image through the ratio factor, and then the image is subjected to local windowing processing. There are three cases of overexposure and good overexposure. For different exposure situations, according to the saturation of the neighborhood pixels in the highlighted image window, different weight coefficients are determined for multi-exposure weighted fusion, which is roughly divided into three steps:1) Select the unsaturated pixel value of the HE image and the corresponding pixel value in the LE image to linearly fit to obtain the pixel ratio factor curve.2) After adding local windows to the HE image, determine the saturation of the pixel values in each window. Whether the center pixel value of the highlighted image is saturated and whether the neighborhood pixel values of the center value are all saturated, the exposure of the center pixel value is determined. The situations are divided into three categories, 1) Good exposure: the central pixel value is not saturated, and all the neighborhood pixel value sets are not saturated; 2) Incomplete overexposure: the central pixel value is not saturated, the neighborhood pixel value set is not completely saturated or the central pixel When the value is saturated, at least one of the neighboring pixel value sets is saturated; 3) Complete overexposure: the center pixel value is saturated, and the neighborhood pixel value set is also saturated.3) According to the saturation situation, determine the weight coefficient of each pixel value fusion of the HE and the LE images. The weight coefficient is determined by the proportion of unsaturated pixel values in the neighborhood pixel value set in the HE image, and the final HDR image is obtained by weighted fusion.In terms of experimental verification, two typical multi-exposure fusion test sets of Bottle and Airport are selected to select the size of the local window and the imaging effect in a low signal-to-noise ratio environment. The wavelet transform fusion method and the window fusion method in this paper are compared horizontally. The experimental results show that:(1) With the increase of the selected window, the more pixels involved in the calculation, the influence of the over-bright central pixel value in the scene in the fusion process gradually decreases, the overall brightness decreases, and the quality of the fused image is more vulnerable. However, if the selection window is too small, the estimation accuracy of the saturated pixel value of the neighboring pixels will decrease. Therefore, in the selection of the window size, the influence of local noise on the quality of the fused image and the constraining ability of the neighboring pixels to the highlighted center pixel value should be considered at the same time. In order to achieve a better fusion effect, the algorithm in this paper selects the 5×5 window to fuse multiple images, improves the contrast of the image while maintaining the details of the image, and effectively restores the changes in the light and dark levels in the scene. (2) When the image signal-to-noise ratio is higher than 18 dB, the dark scene information in the LE image can still be effectively recovered after fusion, and the overall imaging effect of the fusion result can be guaranteed. There are two main reasons for the improvement of the anti-noise ability of the fused image: 1) The algorithm tries to use the pixel value in the highlighted image as much as possible, but the signal value of the highlighted image is generally too large, and the SNR of the pixel value after adding noise is still very large. 2) The pixel value of the low-brightness image used to replace the overexposed pixel value of the high-brightness image will also be larger, so the influence of noise on the pixel value will also be reduced. (3) Compared with other algorithms, the algorithm in this paper can not only keep the overall contrast accurate and the image undistorted but also restore the edge clarity, retain the dark information in the bright environment, and reduce the halo caused by the strong light source. At the same time, the fusion algorithm uses local windows to process pixel values. The calculations between each window are independent of each other, and it is not necessary to process pixel values with good exposure. Therefore, the unique values of independent operations between each window are expected to be realized on hardware platforms such as GPU. Thread parallel processing, with the potential to achieve HDR real-time fast imaging.
Nov. 25, 2022Vol. 51 Issue 11 1110001 (2022)

Xiang LIU, Lihua ZHANG, Zeyuan DAI, Qiu CHEN, and Yinfei ZHOU
The Ice, Cloud, and Land Elevation Satellite-2 (ICESat-2) was launched on 15 September 2018 to measure ice sheet and glacier elevation change, land elevation, global vegetation elevation and monitor clouds and aerosols. The sole instrument on-board ICESat-2 is the Advanced Topographic Laser Altimeter System (ATLAS). ATLAS employs a micro-pules multi-beam photon-counting laser lidar technology, which is the first time this technology has been applied to a spaceborne platform. However, since the laser pulses emitted and detected by ATLAS are weak signals, the ICESat-2 data introduces a significant number of noise photons. The denoising of the ICESat-2 data is a key point for its application.A few algorithms have been proposed to remove noise photons in the ICESat-2 data, which are based on the criterion that signal photons are more densely distributed than noise photons. Most of the denoising methods nowadays depend on the set parameters and the parameter-free method is becoming a new frontier. To fix the current parameter-free quadtree denoising method which misidentifies noise photons under the strong noise background, this paper proposes an improved parameter-free denoising method for the ICESat-2 point cloud. For avoiding the noise photons sparse in density but close in the distance in a partial area, which means photons may be separated by the original quadtree and misrepresented as a high density, the pruned quadtree is used to represent a suitable density. According to the location of ICESat-2 photons, the initial space is given and recursively divided into four quadrants. Instead of dividing until each quadrant contains no more than one photon, a quadrant is not divided in the case that the quadrant is divided once and its internal photons are not separated. The density of photon is the corresponding level value in the tree structure. Then, several equidistant windows are divided according to the along track distance to adapt the changes of SNR. The Otsu method adaptively calculates the photon density threshold of each window. Photons with level values less than the density threshold are removed to complete the first-level denoising. After that, there may be a small number of outlier noise photons with a high local density and cannot be identified by the pruned quadtree, the box-plot is used to complete the second-level denoising. Considering that the change of elevation will affect the box-plot denoising, equidistant windows are also divided according to the along track distance. Photons whose elevations in each window are not within the upper and lower thresholds calculated by box-plot are identified as noise photons.Using the data from North Dakota and California to carry out the denoising experiments for the ICESat-2 point cloud under strong noise. The airborne lidar elevation products with a resolution of 1m are used as the verification data, and the denoising effect is verified by a combination of qualitative and quantitative methods. Experimental results show that: 1) Compared with the original quadtree denoising method, the number of noise photons misidentified by the pruned quadtree method is reduced under strong noise. Based on the advantages of pruned quadtree, the proposed pruned quadtree method combined with box-plot is also superior to the quadtree method combined with box-plot in terms of denoising effect; 2) The ground and canopy top curves fitted by the signal photons obtained by the quadtree method have large deviations from the profile elevation curves of the airborne lidar elevation products, while the curves fitted by the signal photons obtained by the proposed method can basically be consistent with the profile elevation curves. Moreover, the accuracy evaluation results of the proposed method are better than those of the quadtree method. The RMSE and R2 values of the ground accuracy evaluation corresponding to the proposed method in study area 1 are 0.91 m and 0.997, respectively. The RMSE and R2 values of the ground accuracy evaluation corresponding to quadtree method in study area 1 are 10.51 m and 0.713, respectively. In study area 2, the RMSE values of the ground and canopy top accuracy evaluation corresponding to the proposed method are 2.47 m and 3.56 m with the R2 values are 0.999 and 0.998, respectively. The RMSE corresponding to quadtree method are 90.92 m and 90.17 m with R2 are 0.156 and 0.400. Overall, the proposed method without input parameters is effective for removing noise photons in the ICESat-2 data under strong noise.
Nov. 25, 2022Vol. 51 Issue 11 1110002 (2022)

Xueyuan GUAN, Wei HU, and Heng FU
Optical remote sensing images contain complex texture features. The noise in remote sensing images affects not only the visual effect of images but also the processing, analysis, transmission, and storage of images. Therefore, image denoising becomes an important step in remote sensing image processing. Traditional denoising methods are likely to cause problems such as loss of image details and blurred denoising results. Recently, deep learning has been rapidly developing in the field of image denoising, compared with traditional algorithms, the stability of the denoising algorithm of deep learning algorithms has improved tremendously. However, the real noise in remote sensing images and the reconstruction of the image after denoising, is the main problem in the field of image denoising at present. In this paper, an MRFENet remote sensing image denoising algorithm based on multi-sensory field feature fusion and enhancement is proposed. To address the problem that image details are lost after denoising and real noise is difficult to be eliminated, the following approach was used. First, a global feature extraction module is introduced, which consists of several convolutions with different dilation rates, followed by fusion of the extracted features. The purpose of this process is to allow the model to expand the receptive field without increasing the number of parameters, and to enable the model to converge quickly by extracting shallow features at different scales. Second, multi-scale feature enhancement blocks are introduced. Each block consists of a multi-scale feature extraction layer and a channel attention module, both of which form the residual structure. The purpose is to be able to extract multi-scale features at different levels and to assign higher weights to important features to achieve enhancement of important features. The residual structure ensures that the network does not explode in gradient due to excessive depth. Finally, in order to reduce the loss of feature information and the fluctuation caused by the fusion of shallow features with deep features, the resulting features at different levels are chosen to be fused step by step to enhance the continuity of pixels. To make the denoised images more consistent with the visual perception, MS-SSIM is chosen as the loss function during the training process. The number of channels and the number of multi-scale feature enhancement blocks of the MRFENet are configurable, and the performance of the network does not increase with the number of modules, so the most suitable network parameters can be obtained by combining the network performance with the computational effort. In order to test the denoising ability of MRFENet for remote sensing images of different sizes, two publicly available remote sensing image datasets with different sizes are selected. By adding different intensity of noise on each dataset, this paper tests the denoising stability of MRFENet for different intensity of noise. In order to test the denoising performance of MRFENet for real noise, a hyperspectral real remote sensing image is selected for testing. PSNR and SSIM are selected as quantitative evaluation metrics for different intensity noise datasets to evaluate the denoising results. NIQE, BRISQUE, PIQE are selected as quantitative no-reference evaluation metrics for real noise datasets to evaluate the denoising results. After comparing the denoising results with those of traditional denoising algorithms NLM, BM3D and deep learning algorithms DnCNN, RIDNet and REDJ, it can be concluded that the proposed algorithm has the best performance on each dataset and outperforms other algorithms in all metrics. The images denoised with MRFENet can retain the edge details and do not show excessive smoothing, which is more in line with the visual perception. The effectiveness and generalization of MRFENet algorithm for remote sensing image denoising are verified.
Nov. 25, 2022Vol. 51 Issue 11 1110003 (2022)
Ruyu YAN, Xiaoxia WANG, Jiangtao XI, Fengbao YANG, and Daerhan BAO
With the rapid development of the economy, financial services such as bills are also increasing day by day. Among them, the important information in the bill business, such as personal vouchers, checks, and other bills, requires manual reading and input of a large amount of digital information. In order to avoid the waste of human and financial resources, related researchers classify and recognize handwritten fonts based on the neural network classification idea of ??deep learning. When the method based on deep learning is used for feature extraction of handwritten fonts, there is often a lack of detailed information such as edges and textures, which leads to the problem of low recognition accuracy.Aiming at the problem that the features of handwritten digits or letters are difficult to effectively extract, the recognition efficiency was not high and even caused recognition errors, a new automatic recognition method of handwritten digits or letters was proposed by combining the principle of ghost imaging and the classification network based on deep learning. This method utilizes the principle of ghost imaging. It can save the imaging process in the traditional image recognition method, and jumping out of the inherent thinking that identifying objects is identifying images, and can quickly classify the image of handwritten digits and letters only by the total light intensity value transmitted by handwritten digits or letters without extracting and identifying features of handwritten digits or letters. The automatic recognition of handwritten digits or letters based on ghost imaging solves the critical problem of needing to extract digits or letter images features in traditional handwritten font recognition methods, and can greatly improve the recognition efficiency of handwritten digits or letters. Firstly, a ghost imaging detection system is built using commonly used optical instruments such as lasers, digital micromirror arrays, and single-pixel detectors. The laser in the built detection system is used to generate a pseudothermal light source, and the digital micromirror array is used to obtain the Hadamard speckle sequence with a resolution of 32×32 irradiating the target object at different times. And realizing the irradiation of 17 239 handwritten images of handwritten digits and letters. Secondly, the single-pixel detector is used to collect data on the total light intensity value transmitted by the handwritten digits and letters. The data collection process is very fast and does not cause huge time costs. The value of the bucket detector after the collection is converted into a one-dimensional vector, and use the one-dimensional vector corresponds to the handwritten font as the input of network training. Finally, the network framework is built based on the advantages of the convolutional neural network in image classification and is used to solve the problems in the training process. The network degradation problem is added to the residual block structure, which can directly pass shallow information to deeper layers by skipping one or several layers through skip connections. In order to solve the problem of overfitting, the Dropout layer is added to it, and the robustness of the network to the loss of specific neuron connections is improved by reducing the weight.The experimental results show that: for handwritten digits, compared with the fully connected network, the precision, recall rate and F1 value of the convolutional neural network model are increased by 86.50%/97.25%, 86.40%/98.03%, 86.31%/97.60%; for handwritten letters, the precision, recall, and F1 value of the convolutional neural network under full sampling are 91.87%, 90%, and 90.23%, respectively. At the same time, in the case of undersampling and non-undersampling, the ten types of digits from 0 to 9 under the two models of convolutional neural network and fully connected neural network and randomly selected l, v, y, z, m, n, o, r, s, and h ten types of letters are compared and analyzed. The experimental results show that the accuracy rate of each type of digit and letter of the convolutional neural network is higher than that of the fully connected network under the same conditions. The accuracy of each type of digit and letter under the two models further verifies that as the sampling rate increases, the recognition accuracy also increases. By comparing the evaluation indicators of the convolutional neural network and the fully connected network architecture, the effectiveness and rationality of the proposed method are further illustrated. The classification and recognition results of handwritten letters verified by experiments further illustrate the versatility of the constructed convolutional neural network. It provides the possibility for the wide application of handwritten fonts in real life. The research on the classification and the recognition of handwritten fonts based on ghost imaging can effectively solve the bottleneck problem of low recognition efficiency of existing font recognition methods.
Nov. 25, 2022Vol. 51 Issue 11 1111001 (2022)
Gang YANG, Zongjie BI, Zihao CUI, and Zhaoshuo TIAN
Optical detection and ranging techniques based on range-gated active imaging systems have been greatly developed. Flash lidar obtains slice images of targets by accurately measuring the time of flight of laser pulses, and effectively reduces the influence of backscattering on imaging results through range gating technology. It has the ability to work in the harsh environments. Therefore, flash lidar is widely used in various fields. However, in the flash lidar daytime measurement, since sunlight dominates the backscattered noise, when the backscattered sunlight is received by the lidar detector, there is a huge amount of energy due to the wide wavelength range of solar radiation. The huge energy will make the target mixed with the sunlight. Even if the range gating technology is used, the influence of sunlight on the intensity image received by the lidar cannot be avoided. As a result, the flash lidar cannot obtain target distance information during the daytime, severely limiting the application of flash lidar. In order to eliminate the light pollution of sunlight on the target, this paper adopts the intensity image preprocessing method based on morphological opening operation to preprocess the original intensity image received by the flash lidar during the day, and then uses the adjacent frame difference method to get the distance information of the target. First of all, a structural element is selected according to the principle of selecting structural elements for morphological opening operation. Secondly, the chosen structural element is used to preprocess the target slice images received by the flash lidar imaging system using morphological opening operation, while the preprocessing results are evaluated by average intensity image. Thirdly, the adjacent frame difference method is used to obtain the distance information of the target from these preprocessed intensity images. In order to verify the feasibility of this method, we use a self-developed flash lidar to conduct imaging experiments on a target building at a distance of 500 m during the daytime. The raw average intensity image obtained from the raw slice image received by the flash lidar system shows that the sunlight scattered by the surrounding target is mixed with the laser echo signal reflected back from the target building, making it difficult to distinguish the target building. Therefore, we can only obtain the distance information of the target by preprocessing the raw slice image obtained by the flash lidar system. Based on the principle of preprocessing the original intensity images with morphological opening operation, in this experiment, a 3×3 cross-shaped structural element is selected by the structural element selection principle. The chosen structural element is then used to preprocess the raw sliced images of the building target at 500 m received by the flash lidar system with morphological opening operation, while compared with binarized average intensity image from Gaussian filtering preprocessing, median filtering preprocessing and threshold segmentation preprocessing. The results of the comparison amply demonstrate that preprocessing based on morphological opening operations can extract the target from sunlight pollution. After that, the adjacent frame difference method is used to obtain the distance information of the target from the preprocessed intensity images based on these four methods. Using structural similarity to evaluate the distance information of the reconstructed target building, the morphological opening operation preprocessing is compared with Gaussian filtering preprocessing, median filtering preprocessing and threshold segmentation preprocessing, and the structural similarity is 0.78, 0.83, and 0.85, respectively. By analyzing the structural similarity between them, the result fully demonstrated that the preprocessing method using the morphological opening operation could completely obtain the distance information of the target while removing the isolated noise caused by sunlight.
Nov. 25, 2022Vol. 51 Issue 11 1111002 (2022)
Kaisheng ZHANG, Xiuqin SU, and Zhilong YE
Star sensor is a high-precision space attitude measurement instrument with high precision, good autonomy and independent existence of other systems. It takes the starry sky as the working background and stars as the benchmark to obtain the attitude information of the spacecraft by detecting stars in different positions in space. Therefore, its accuracy is the key factor affecting the overall performance of the whole system. The all day star sensor is a star sensor that can still detect stars under the strong background in the daytime and has the anti-interference ability to the strong sky background. As the most important part of the optical system, its imaging quality is very important to improve the star detection ability of the star sensor. However, with the development of aerospace technology, space science has higher and higher requirements for the attitude accuracy of spacecraft. Therefore, in order to meet the needs of all-time high-precision detection, the lens of the star sensor optical system must adopt a large relative aperture to improve the star detection ability. In order to realize the all-time high-precision detection of class 3 stars by star sensor in J-band, this paper adopts the method of passive thermal difference design, carries out matching optimization according to the thermal difference performance difference between the optical system and structural materials, and then realizes lens thermal difference elimination. An all-time star sensor optical system with a large relative aperture is designed and completed. Firstly, the irradiance and signal-to-noise ratio of class 3 stars in the J-band are analyzed to determine the main parameters of the optical system, in which the focal length is 84 mm, the F number is 1.4, and the working spectrum range is 1.1 ~ 1.4 μm. The field angle is 8.4°. Secondly, considering that the optical system of the star sensor has the characteristics of a large relative aperture, long focal length and the influence of optical system distortion on the accuracy of star point extraction, the distortion free telephoto objective is selected as the initial structure of the optical system for optimization. In the process of optical system design, common optical materials and lens barrel materials are selected. By changing the shape and thickness of each lens, the focal power and air gap between each lens are reasonably matched, so as to realize the passive compensation non-heating design. After the optimized design, the dispersion spot size of the optical system is better than 30 when the defocus is 0.02 mm under the conditions of high and low temperature (-40 ℃~ +60 ℃) and vacuum μm. The color distortion is less than 0.018 mm, and the design results meet the design requirements. The inner surface of the star sensor is blackened, the light shield is designed with non-equidistant layout, and the surface is blackened with an SB-3A domestic extinction paint with high solar absorption, which can effectively reduce the weight under the condition of ensuring the effect. The inner baffle ring of the light shield adopts a 16 ° oblique angle, which can ensure good stray light suppression ability. The stray light of the optical mechanical system is simulated and analyzed by using TracePro software. The analysis results show that the stray light generated by the target in the field of view is 3×10⁻⁵ of the intensity of the target, the stray light intensity outside the field of view decreases rapidly from the order of 10-2, and the stray light intensity outside 18° is less than 10-4 of the strong light outside the field of view. Finally, the actual ground star observation test is carried out on the principle prototype. Through the star photos and three-dimensional energy diagram taken by the principle prototype, it can be seen intuitively that the signal intensity of the class 3 star target is much greater than the background intensity. After subsequent image processing, a clearer star observation effect can be obtained. Through theoretical analysis and design and practical observation experiments, it is verified that the optical system designed in this paper can meet the requirements of all-time high-precision detection of class 3 stars in J-band, which also shows the rationality of the design of the optical system.
Nov. 25, 2022Vol. 51 Issue 11 1111003 (2022)
Xin XU, Huichun YE, Xueying JIN, Haoran GAO, Dong CHEN, Yang LU, and Liandong YU
Microresonator-based optical frequency combs have attracted extensive interest due to their compactness, flexibility, low power consumption, and compatibility with complementary metal-oxide-semiconductor integration. When modulation instability dominates in nonlinear microresonators, a particular field of dissipative Turing patterns is demonstrated. Turing patterns exhibit wider frequency comb intervals than a soliton field in the spectral domain. Owing to their robustness against perturbations and optimal spectral purity, Turing patterns provide a creative platform for high-capacity communication, on-chip optical squeezing, and other applications.At present, the effect of high order dispersion on Turing patterns is generally ignored. However, this effect is particularly important for microresonators with a large amount of high order dispersion. Therefore, the influence of high order dispersion on Turing patterns is investigated in this study. The step-Fourier is used to solve the theoretical model of Lugiato-Lefever Equation, the evolutions of the field inside the microresonators are investigated, and the influences of higher order dispersion on Turing ring optical field are also analyzed. The theoretical analysis and numerical calculation prove that the third-order dispersion coefficient β3 causes a time shift in Turing patterns at a uniform speed. The fifth-order dispersion coefficient β5, which is smaller than the third-order dispersion coefficient β3, has a weak effect on the time shift of the field, the time shift speed is relatively low. Moreover, high odd order dispersion also affects the direction and speed of the time shift. In the third-order dispersion example, the positive and negative values correspond to the opposite directions of time shift. The larger the third-order dispersion is, the faster the time shift is. On the other hand, high even order dispersion is added into the theoretical simulation, which indicates no change in the number or position of the pulses. Therefore, the high even order dispersion does not affect the stable distribution. As a result, the drift velocity and direction of Turing patterns can be controlled by changing the magnitude of high odd dispersion. In addition, the dispersive wave of Turing patterns with high order dispersion, which represents the spectral properties of the optical field, is investigated. When the initial field in microresonators is a Gaussian pulse, frequency detuning plays a major role, and four pulses are generated in the microresonators. The field of multiple pulses experiences a time shift because of the third-order dispersion. Moreover, high order dispersion affects the spectrum, the comb spectrum is obviously modulated. The position relationship of spectrum and dispersive wave curves indicates that the zero points of the dispersive wave curves correspond to the mode number of spectral sub-peaks. When frequency detuning is further aggravated and high order dispersion remains constant, the multi-pulse field evolves into another kind of Turing patterns that contains numerous equally spaced pulses. And the third-order dispersion can cause the time shift of the Turing patterns or multiple pulses, and the zero frequency position of the dispersive wave curves with third-order dispersion relates to the sub-peak in the spectrum. This condition means that the strongest new exciting modes with third-order dispersion have a dispersion frequency of 0. An increase in β3 results in the augmentation of the slope of the dispersive wave curves, which means that a strong high order dispersion leads to a strong dispersive wave for high order modes of Turing patterns. However, it has almost no effect on the low order modes, the dispersive wave is nearly close to zero. Hence, high order dispersion strengthens the dispersive wave for high order modes of Turing patterns. The results of the theoretical analysis are crucial for studying Turing patterns in microresonators, whose material has a large high order dispersion.
Nov. 25, 2022Vol. 51 Issue 11 1113001 (2022)
Xilin HAN, Lingxuan ZHANG, Jintao XUE, Shenlei BAO, Jinyi WU, and Lei MI
The applications of silicon photonics in data bearer networks, data centers and other scenarios will support high-speed data transmission. In order to meet the demand, lots of technologies in silicon photonics have emerged, such as Wavelength Division Multiplexing (WDM),Polarization Division Multiplexing (PDM) and Mode Division multiplexing (MDM). To further increase the channel capacity, the hybrid multiplexing technology is studied based on the technologies above. Our work is such a hybrid WDM-MDM multiplexer.This paper focuses on the design of a microring resonator with mode splitter. First of all, the effect of mode splitting is better at a longer length, but we need to put the mode splitter into the microring resonator, and such a high mode separation efficiency and coupling efficiency will lead to low efficiency of microring resonance. So, we take the appropriate length. Secondly, an asymmetric structure for the geometry of the mode splitter is designed. One side of the structure is a waveguide with a width of 0.88 nm, allowing high order mode transmission, and the other side is a slot waveguide with a width of 0.86 nm, with an air gap of 50 nm in the middle. The advantage of this structure is that it can effectively split TE0 and TE1 modes. In addition, for microring resonators, we can select the desired resonant wavelength by designing appropriate parameters such as radius, waveguide width, coupling region length and gap.By simulating the proposed structure with the finite difference time domain method, the multiplexer and demultiplexer can realize ultra-compact WDM-MDM structure at C band. The microring resonator has a response of -0.66 dB to TE1 mode input, a Q value of 3 692, and an optical bandwidth of 52 GHz. Its free spectral range is 1.03 THz, and the crosstalk generated by TE0 mode is -11.0 dB. The insertion loss of the microring resonator is as low as -0.66 dB. Based on this, we also propose a transmitter-receiver MDM system with dual mode input. The simulation results show that the dual-mode input MDM system based on microring resonator can effectively separate TE0 and TE1 modes, and the microring also has the ability of wavelength selection. In addition, the through ports with fabrication tolerance from -10 nm to +15 nm have responses of less than -20 dB, while the response of the drop ports remains within -1 dB. Compared with other devices, our design has advantages in insertion loss, crosstalk and FSR.In conclusion, proposed system using wavelength-mode multiplexing mircroring can effectively separate the TE0 and TE1 modes and has the ability of wavelength selection, which may be the main device for ultra-compact hybrid multiplexing technology in near future.
Nov. 25, 2022Vol. 51 Issue 11 1113002 (2022)
Zheng HAN, and Binfeng YUN
With fast developments and wide applications of spectrum analysis, there is a great requirement for the miniaturization and chiplization of spectrum analyzer. Spectrometers based on photonic integrated chips have great advantages in size, weight and power consumption, which can be applied in many fields such as chemical and biological sensing, spectroscopy, spectral imaging and radio frequency spectrum analysis, etc. Some on-chip spectrum analyzing schemes have been proposed, such as cascading Arrayed Waveguide Grating (AWG) with Micro-Ring Resonators (MRR) and cascading multi-stage AWGs. For the scheme of cascading AWG with tunable MRRs, a long measurement time is needed due to its wavelength scanning mechanism and the crosstalk is relatively large. On the contrary, spectrum analysis chip based on cascade AWGs without wavelength scanning processes can achieve much faster spectrum acquisition.Arrayed Waveguide Grating (AWG), as a planar dispersive device, is one of the effective ways to be used as an on-chip spectrometer since it has a compact size and can be integrated with other components easily. However, it is rather difficult to achieve high resolution and large working wavelength range simultaneously with just single AWG. This intrinsic contradiction can be alleviated by cascading several AWGs. On the other hand, silicon nitride waveguide, which has the merits of low loss, transparent from visible to infrared and compatible with the Complementary Metal-Oxide-Semiconductor (CMOS) processes, has become one of the main photonic integration platforms. Various silicon nitride AWGs with low losses have been demonstrated. In this paper, a spectrum analysis chip constructed by cascading two silicon nitride AWGs is proposed, designed and optimized.In the proposed spectrum analysis chip, a silicon nitride 1×6 AWG with high resolution is cascaded with six 1×25 AWGs with coarse resolutions. By using the periodic routing property of the 1×6 AWG and setting its Free Spectral Range (FSR) equal to the channel spacing of the 1×25 AWG, spectral interleaving can be achieved between the two cascade AWG stages, then relative large working bandwidth and high resolution can be achieved simultaneously. In other words, the first stage AWG is used to provide high resolution, and the second stage AWG is used to increase the working bandwidth.In order to optimize the proposed spectrum analysis chip, the first stage AWG and the second stage AWG were designed and optimized firstly. The following results are obtained. For the primary AWG: the center wavelength, the wavelength channel spacing and the free spectral range are 1 549.90 nm, 0.5 nm and 3.0 nm, respectively. The obtained channel insertion loss, adjacent channel crosstalk and non-adjacent channel crosstalk of the center channels are about 1.2 dB, -26.1 dB and -39.0 dB, respectively. The channel insertion loss, adjacent channel crosstalk and non-adjacent channel crosstalk of edge channels are about 2.5 dB, -28.7 dB and -24.4 dB, respectively. The central wavelengths of the six secondary AWGs are set as 1 548.80 nm, 1 549.30 nm, 1 549.75 nm, 1 550.20 nm, 1 550.73 nm and 1 551.22 nm. For each secondary AWG, the wavelength channel spacing and the free spectral range are 3.0 nm and 90.0 nm, respectively. The obtained channel insertion loss, adjacent channel crosstalk and non-adjacent channel crosstalk of the center channels are about 3.6 dB, -17.8 dB and -42.2 dB, respectively. The channel insertion loss, adjacent channel crosstalk and non-adjacent channel crosstalk are about 4.5 dB, -12.7 dB and -32.3 dB, respectively. Then the obtained spectra of the cascade two-stage AWGs were multiplied to obtain the performances of the proposed spectrum analysis chip. Simulation results show that total 150 channels with wavelength resolution of 0.5 nm, which covers a working bandwidth of 75 nm can be achieved. In addition, minimum channel insertion loss of about 4.9 dB and maximum channel insertion loss of about 7.9 dB were obtained. The minimum adjacent and non-adjacent crosstalk between channels are about -27.7 dB and -23.0 dB, respectively. The maximum adjacent channel crosstalk and the maximum non-adjacent crosstalk are about -22.6 dB and -12.5 dB, respectively.According to the simulation results, we find that the performances of the middle channels are better than those of the edge channels. The reasons cause this phenomenon are analyzed theoretically and simulation results show that different FSRs are obtained for the primary AWG at different diffraction orders, while the wavelength interval of adjacent channels of the secondary AWG is the same. This will introduce center wavelength misalignment between the primary AWG and the secondary AWG, which deteriorates the insertion losses and crosstalks of the edge channels. Finally, some suggestions are given for future optimization.
Nov. 25, 2022Vol. 51 Issue 11 1113003 (2022)
Decai ZHU, Yaozong HU, Lewen ZHOU, Changqing HUANG, and Xinyong DONG
Random Fiber Lasers (RFLs) based on random distributed feedback can operate without a precise resonant cavity, leading to the advantages of simple structure and low production cost. In previous work, random fiber lasers operating in the band of 1.0~1.6 μm have been widely investigated. However, limited by the high transmission loss of ~30 dB/km and the weak Rayleigh scattering efficiency in normal silica fibers, random fiber lasers operating in the band of 2 μm are rarely reported. It’s of great fundamental interest to push the random fiber lasers to 2 μm mid-infrared band for their potential applications in the fields including medical surgery, nonlinear optics, material processing, and remote sensing. In this work, a random fiber laser operating in 2 μm band is developed by using a 1.5 m long thulium-doped fiber as the gain medium and a fiber random grating for random distributed feedback with enhanced Rayleigh scattering efficiency. The proposed random fiber laser adopts the half-open cavity design by using a high reflectivity fiber Bragg grating with a central wavelength of 1 940 nm to provide strong feedback to the laser system. A 793 nm semiconductor laser is employed as the pump laser source. The fiber random grating containing over 6 000 refractive index distortion spots was inscribed point by point along with a 10 cm long single-mode fiber by using a Ti:sapphire femtosecond regenerative amplifier with an operation wavelength of 800 nm, a repetition rate of 100 Hz and a pulse duration of 80 fs. The neighboring refractive index distortion points were spaced at a random distance between 7.5 and 12.5 μm. Experimental results show that random laser output at the wavelength of 1 940 nm is achieved with a relatively low threshold power of 2.33 W. Benefit from the enhanced Rayleigh scattering efficiency of the fiber random grating, the pump threshold of the random fiber laser is much lower than that of the previously reported random fiber laser in 2 μm region. With increasing the pump power, an output power of the random fiber laser increases nearly linearly with a slope efficiency of 4%. When the pump power reaches 3.8 W, the output power is 57 mW and the optical signal-to-noise ratio is up to 56 dB. The laser output wavelength remains quite stable during the change of pump power. To further test the stability of the random fiber laser, laser output spectra and powers were measured at an interval of 5 min and one second respectively within 60 min under the fixed pump power of 3.8 W. Good wavelength stability of 0.1 nm and power stability of fluctuation less than 0.26 dB are achieved. The good performance in stability should be related to the good wavelength selectivity and stability of the high-reflectivity fiber Bragg grating in both wavelength and reflectivity. It was fabricated on ordinary single-mode fiber, not the thulium-doped fiber, so its reflection wavelength and reflectivity can keep stable even when the pump laser reaches new heights and changes the temperature of the thulium-doped fiber. The slope efficiency is relatively low if compared with that of the common thulium-doped fiber lasers. It should be related to the relatively large insertion losses, 7.5 dB in total, of the two fiber fusion splicing points between the pump laser source and the thulium-doped fiber. The fiber parameters of the lead-out fiber of the pump laser and the thulium-doped fiber are much different from those of the single-mode fiber of the ports of the wavelength-division multiplexer. However, it can be improved by customizing a wavelength-division multiplexer with matching fiber parameters. Anyway, the proposed random fiber laser provides an effective technical method to develop random fiber lasers in the 2 μm wavelength band with relatively low pump threshold and better performances.
Nov. 25, 2022Vol. 51 Issue 11 1114001 (2022)
Li DU, Cuihong JIN, Zhi YANG, and Yudong CUI
Fiber lasers have attracted substantial research interest due to their high stability, excellent beam quality and system compactness. Furthermore, lasers generating high-energy ultrafast pulses and operating at the 1 550 nm region are widely developed due to the low optical attenuation at the first communication window and more cost-effective than other laser sources in a variety of applications such as ultrafast spectroscopy, precision material processing and terahertz-wave generation. To achieve high-energy pulses, an Erbium-doped fiber amplifier was employed to amplify seed pulses. However, pulses will accumulate large nonlinear effects such as Self-Phase Modulation (SPM) and Stimulated Raman Scattering (SRS) during direct amplification, thus degrading the pulse quality. One common solution is to widen the pulse width by introducing a chirp before amplification. The peak power intensity is significantly attenuated, avoiding excessive nonlinearity. The amplified pulse is then de-chirped by a compressor. This method is called Chirped Pulse Amplification (CPA). Several high-power CPA systems operating at 1.56 μm have been demonstrated in recent years. However, all of these sources produced a pulse with spectral width between 5 nm and 15 nm. Broadband fiber laser plays an important role in optical frequency combs, optical coherent tomography, optical coherence radar and fiber optical sensing systems. There is a lack of high-energy devices capable of generating pulses with spectral width above 30 nm. Several approaches have been utilized to generate broadband pulses. A noise-like mode-locked fiber laser was demonstrated based on the precise adjustment of intracavity dispersion. However, this laser regime was seldom applied in ultrashort pulses due to its incompressibility. A Mamyshev oscillator is able to generate broadband pulses as shorter than 100 fs at the expense of complicated intracavity structure and accurate pulse evolution. The extra-cavity generation method relies on Highly Nonlinear Fibers (HNLFs), such as photonic crystal fibers, whose complexity of design is increased by demanding careful selection of parameters for the seed pulse. In addition, the nonlinear effect induced by SPM generates a nonlinear chirp on both sides of pulses which degrades the beam quality in CPA systems. Note that self-similar pulses are nonlinear optical structures whose amplitudes and widths could be altered by dispersion, nonlinearity, gain and other system parameters, while maintaining the overall shapes. Since the self-similar pulse has a strict linear frequency chirp induced by the balance between SPM and normal group velocity dispersion in the erbium-doped fiber, it could be effectively compressed by grating pairs to obtain a high-power ultrashort pulse. Therefore, the combination of self-similar amplification and CPA is a promising solution to generating broadband watt-level pulse. High-energy ultrafast pulses based on parabolic evolution in ytterbium-doped lasers have been reported. Nevertheless, the Erbium-Doped Fiber Amplifier (EDFA) based on self-similar amplification operates at an anomalous dispersion region, which is less applicable to generating pulses with the average power above watt-level high-energy pulses comparing to Ytterbium-Doped Fiber Amplifier (YDFA). At the same time, high-energy CPA systems operating at 1 550 nm significantly lag behind Yb-doped lasers due to high quantum defect, thermal effects and nonlinearity. At present, there is no report on a broadband high-energy CPA system based on parabolic evolution operating at 1 550 nm. Here, we demonstrated an all-fiber Er-doped chirped-pulse amplification laser, which generates Watt-level broadband pulse with the application of self-similar amplification. Numerical simulations of the model laser were performed by following the propagation of the pulses and considering every action of cavity components on the pulses. We use the results of one round-trip circulation as the input of the next round of calculation until the optical field becomes self-consistent. For this context, pulse propagation equation is given by the nonlinear Schrodinger equation. The parameters of each element of the laser are optimized according to theoretical simulations. In our experiment, the seed source is a dispersion-managed passively mode-locked fiber laser with a Gaussian-spectral profile, which evolves into a parabolic shape after self-similar amplification, achieving a broadband pulse bandwidth with the full-width at a half-maximum of 44.8 nm under 400 mW pump power. The spectral width and energy of the pulse increase rapidly during amplification. The pulses are stretched in Dispersion Compensating Fiber (DCF) to reduce peak power, avoiding excessive nonlinearity. Then a Double-Clad Er/Yb co-Doped Fiber (DC-EYDF) is used as the main amplifier. The spectral width of the pulse is narrowed down to 30 nm with the effect of gain filtering during amplification. The pulse is amplified to 1.3 W with the pump power of 9 W. The amplifier delivers 32 nJ pulses at a repetition rate of 40.1 MHz, which can be compressed down to 587 fs through a pair of transmission gratings. We believe that the narrower pulses could be achieved by switching to fiber Bragg gratings to adjust the dispersion between the stretchers and compressors precisely. The robust, broadband, and watt-level 1 550 nm fiber laser source can be used for nonlinear frequency conversion, solar cell micromachining and ophthalmology due to its compact size.
Nov. 25, 2022Vol. 51 Issue 11 1114002 (2022)
Pengfei LI, Zuncheng ZHAO, Wei LU, Desheng HONG, Peirong CHEN, Chuanbiao ZHANG, Xiaoguang TIAN, Chang LIU, and Cong CHEN
In experiments of pulsed laser-matter interaction, pre-pulse with higher peak power interacting with matter produces a plasma that corrupts the experimental results. To avoid this problem, it is necessary to reduce the peak power of the pre-pulses. Therefore, it is necessary to find a way to improve the temporal contrast of the pulsed laser, which is also the main purpose of this paper. When using chirped pulse amplification technology to design femtosecond Ti: sapphire regenerative amplifier with high peak power, on the one hand, the amplified spontaneous emission in the amplified laser will be amplified before the seed light, so the temporal contrast of the amplified spontaneous emission of the amplified laser will be low; on the other hand, due to the low extinction ratio of the polarization selective device in the amplifier, the pre-pulse temporal contrast of the amplified light will be low, both of which will lead to low temporal contrast of the amplified light.In order to improve the temporal contrast of laser pulse output by regenerative amplifier, it is necessary to improve the temporal contrast of nanosecond and temporal contrast of picosecond laser pulse simultaneously. On the one hand, this paper studies the influence of a compact dual-channel pulse cleaner for the Pockels Cells on nanosecond pre-pulse temporal contrast, through this device, two laser pulse cleaning can be completed on a set of the Pockels Cells which makes the pre-pulse temporal contrast of regenerative amplifier by 5 orders of magnitude. On the other hand, the influence of the position where the regenerative amplifier is inserted into the spectral shaping filter on laser pulse amplified spontaneous emission contrast is studied. By inserting the spectral shaping filter in an appropriate position in the ring cavity and adjusting the angle of the spectral shaping filter, the position with the lowest actual transmittance of the spectral shaping filter is just the position with the strongest amplified spontaneous emission spectral intensity in the ring cavity. It is shown that amplified spontaneous emission can be reduced by 1 order of magnitude in the range of a few hundred picoseconds. The pre-pulse temporal contrast ratio is enhanced from the original 4.3×10⁻⁴ to 6.6×10⁻¹⁰, and the amplified spontaneous emission temporal contrast ratio (400 ps before the main pulse) is improved from 5.0×10⁻⁸ to 5.0×10⁻⁹.This optical system which includes both dual-channel pre-pulse cleaner and intracavity spectral filtering has the following advantages: the dual-channel pre-pulse cleaning devices using only a single Pockels Cells is placed at the optical outlet of the amplifier. This device not only greatly increases the pre-pulse temporal contrast of the laser pulse, but also effectively reduces the volume of pre-pulse cleaning device, avoiding the redundancy of optical elements and the space waste caused by the additional pre-pulse cleaning device, thus reducing the cost. Then, instead of changing the seed light energy, the amplified spontaneous emission contrast of the laser pulse output by the regenerative amplifier is improved by adding a spectral shaping filter at a suitable position in the cavity. This method not only effectively suppresses the problem that the amplified spontaneous emission in the amplifier cavity is amplified, but also suppresses red shift and gain narrowing of the spectrum during the amplification process. This process simultaneously achieves the purpose of outputting a broad-spectrum laser pulse and enhancing the temporal contrast of the amplified laser. In addition, adding a spectral shaping filter in the cavity can effectively improve the energy stability of the amplified laser. The above scheme comprehensively improves the temporal contrast and stability of laser pulses output by the regenerative amplifier, and provides high-quality seed light for subsequent laser energy amplification.
Nov. 25, 2022Vol. 51 Issue 11 1114003 (2022)
Kuikui HE, Yutang DAI, and Chaofan YAN
Hard and brittle dielectric materials represented by quartz are widely used in aerospace, consumer electronics, weapons and other fields. In view of the defects such as re-condensation and micro-cracks in the process of femtosecond laser machining such materials, the ultrasonic gas jet assisted femtosecond laser machining technology is proposed. The steady-state jet is transformed into pulsating jet through the coupling of ultrasonic and gas jet. With the help of the purging effect of gas jet and the high-frequency scouring and crushing effect of pulsating jet, the re-condensate produced in the machining process is taken away, which reduces the adhesion of re-condensate on the machined wall, improves the machining efficiency and improves the machining quality. Firstly, this paper proposes an ultrasonic gas jet device and analyzes the coupling mechanism of ultrasonic and gas jet. The coupling effect of ultrasonic and gas jet is mainly manifested in two aspects. One is that the local shock wave structure is formed by the direct coupling of ultrasonic and inlet jet. The formation of shock wave structure originates from the combination of sound pressure and jet pressure. Due to the alternating propagation of ultrasonic sound pressure with time, the combination of sound pressure and jet pressure makes the gas jet change from a steady jet to pulsating jet with alternating high and low pressure. Second, the ultrasonic transducer is mechanically fixed with the jet nozzle, and the high-frequency micro-displacement generated by the transducer is transmitted to the nozzle. The high-frequency displacement of the nozzle drives the whole flow field to generate high-frequency vibration, thus high-frequency scouring the machined surface. The coupling effect of ultrasonic sound pressure and jet pressure is deduced theoretically, and simulated with ANSYS Fluent software. The theoretical analysis and simulation results show that the steady-state jet is transformed into a pulsating jet, alternating high and low pressure under the action of ultrasound. Secondly, the AT tangential quartz wafers were etched by femtosecond laser with a wavelength of 1 030 nm, pulse width of 290 fs and repetition rate of 20 kHz under the condition of 45 ° between the central axis of the jet nozzle and the laser axis. The effects of ultrasonic frequency, ultrasonic power and gas inlet pressure on the depth and width ratio of femtosecond laser etching quartz microgrooves were investigated, and the morphology of femtosecond laser etching quartz microgrooves with or without ultrasonic gas jet was compared and analyzed. The experimental results show that: 1) Under the assistance of gas jet and ultrasonic gas jet, the depth and aspect ratio of femtosecond laser etching quartz microgrooves have been greatly improved. Under the same conditions, the gas jet and ultrasonic gas jet have little change in the depth and aspect ratio of etching. 2) There is little difference between the etching depth and aspect ratio of quartz microgrooves under different ultrasonic frequencies, but the etching depth increases slightly with the increase of ultrasonic frequency. There is no significant difference in ultrasonic power (ultrasonic amplitude) etching. Ultrasonic power has little effect on the etching depth and aspect ratio of femtosecond laser etching quartz microgrooves. Under the same laser processing parameters, the depth and depth-width ratio of microgrooves increase with the increase of inlet pressure. When the inlet pressure reaches a certain value (about 0.4 MPa), the depth and depth-width ratio of microgrooves reach the maximum value. When the pressure is above the value, the depth and depth-width ratio of quartz microgrooves change little. 3) Under the single laser etching, the particles on the surface of quartz microgrooves are disorderly and irregular, and the size is large. The particle size of quartz microgrooves tends to be consistent under the assistance of jet. Compared with the single laser etching, the particle size of quartz microgrooves is reduced. Under the assistance of ultrasonic gas jet, the particle size of quartz microgrooves further decreases and tends to be consistent, and the wall quality is significantly improved and improved. The reason is that the high-speed pulsating jet formed by the coupling of ultrasonic and gas jet breaks and forms an impact in the laser action zone. The impact takes away the laser removal near the molten pool and accelerates the melt injection, thereby reducing the adhesion of laser removal on the machined surface. In addition, under the high-frequency impact of pulsating jet, the large particle slag generated in the laser action zone is decomposed into small particles. Some of these small particle slags are brought out with the gas, and even some are attached to the machining surface. Compared with the attachment of large particle slag, the quality of the machining surface is improved.
Nov. 25, 2022Vol. 51 Issue 11 1114004 (2022)
Luyao XIAO, Xi TANG, Xiaodong LIN, Ziye GAO, Zhifei DUAN, Xiaorui DU, Guangqiong XIA, Zhengmao WU, and Tao DENG
With the rapid development of society, modern technologies such as artificial intelligence, the Internet, multimedia, 5G communication, and big data services have been widely used in national production and daily life. Moreover, the demand for computing power in the whole society is increasing at a rate of at least 20% every year, which brings unprecedented challenges to the computing power of present computing systems. At present, the traditional Von Neumann architecture based on the separation of storage and computing has encountered bottlenecks including storage, computing speed, power consumption, etc. In addition, Moore's Law has also encountered bottlenecks due to the limitations of CMOS technology, and the development of integrated circuits has entered into a post-Moore era. Consequently, the research and development of artificial neural networks have attracted much attention, and photonic neural networks based on silicon-based electronic devices or optical devices have become the focus issue. Photonic neural networks can overcome the limitations of the von Neumann architecture and have the advantages of low power consumption and high speed when dealing with complex artificial intelligence tasks, which can provide a new feasible solution for solving complex problems such as decision-making, deep learning and optimization, pattern recognition, and perceptual information processing. In recent years, photonic neural networks have become a research hotspot due to their obvious advantages over traditional electronic methods in terms of speed and energy efficiency. As a result, neuromorphic photonic devices have attracted extensive attention. Amongst of them, semiconductor lasers have become an ideal artificial neuron due to similar response behavior to biological neuron and ultrafast response speed. In particular, VCSELs possess these advantages of small size, low power consumption, low cost, and high coupling efficiency with optical fibers. Therefore, exploring the nonlinear dynamic behaviors of VCSEL and their applications in these fields related to neuromorphic computing is expected to promote innovative development in the field of artificial intelligence. Recently, the spiking dynamics of VCSEL photonic neurons under external stimuli has been reported theoretically and experimentally. It is worth noting that introducing an extra Saturable Absorber (SA) into VCSEL can constitute an integrated two-section excitable laser (VCSEL-SA). Compared with the traditional photonic neuron model, this integrated photonic neuron can be used as a LIF model. Moreover, the spatiotemporal information can be encoded in the output spike signals of VCSEL-SA and the characteristics of biological neurons can be better simulated. In addition, VCSEL-SA can excite a shorter sub-nanosecond light pulse and its excitation threshold can also be flexibly controlled within a certain range. Therefore, the research and application of VCSEL-SA in the related fields of photonic neural network has become increasingly important.At present, optoelectronic hybrid information processing technology is still an important development direction for the future information technology field. Optoelectronic logic gate, as a key functional element in an optoelectronic hybrid system, can be applied to functional modules such as payload coding, parity checking, generation of ultra-high-speed pseudo-random sequences, and optical computing. So far, logic operation based on optoelectronic method has been realized. However, the traditional scheme usually has some disadvantages such as complex structure, multi-step or requiring relatively high power. Combining the cost efficiency of reconfigurable logic devices for future large-scale integration and unique advantages of VCSEL-SA, the optoelectronic logic gate based on VCSEL-SA can open a new path for future optoelectronic hybrid processing platform. In this paper, we propose a reconfigurable optoelectronic logic gate (NOT, NAND, NOR, XOR) based on the VCSEL-SA under the combined action of current modulation and optical injection, then the spiking dynamics of VCSEL-SA under current modulation are numerically studied, and the logic operation performance of VCSEL-SA is realized by the combined action of current modulation and optical injection. The research results show that, for the optical injection VCSEL-SA under current modulation, the optoelectronic logic gate can be realized within a certain bias current range. By selecting an appropriate modulation current, reconfigurable logic operations (NAND, NOR) can be realized, and the time delay between the two modulation signals has little effect on its performance. By changing the input mode of the current modulation signal and removing the optical injection signal, the VCSEL-SA can realize the XOR logic operation. In addition, the reconfigurable logic operation based on VCSEL-SA has good robustness to noise. These research results can provide a certain theoretical basis for future neuromorphic photonic networks to solve complex tasks.
Nov. 25, 2022Vol. 51 Issue 11 1114005 (2022)
Jiafu GUO, Zhengzhou WANG, Yaxuan DUAN, Li WANG, and Zhengmao XIE
The high-power laser device needs to complete optical path self-alignment, analog optical alignment and optical docking alignment before physical experiment starting. With the deepening of physical experiments, the optical docking alignment process of high-power laser device encounters some new problems. First of all, the number of optical targets has changed. In the previous optical docking alignment process, alignment task was performed with the analog laser source turned off. There was only one main laser target in the docking alignment image. Now, in order to reduce the influence of the drift alignment accuracy of the main laser target, the analog laser source is no longer turned off in the alignment process, which means an optical path alignment image contains both an analog laser target and a main laser target. Moreover, optical docking alignment mathematical model has changed, too. In the original high-power laser device, the automatic alignment of 8-path beams adopted the same unit alignment model. The original mathematical model has only one optical target in alignment image instead of multiple optical targets. And the original mathematical model is only for a single-path beam, and the parameter information of multi-path beams is not reflected in the mathematical model. Finally, the docking alignment process of high-power laser was executed in serial in the past, which greatly affected the alignment efficiency. In order to solve the above problems, this paper makes improvements from the following three aspects. For the first problem, according to the characteristics of different optical targets in optical docking alignment images, a dual-optical target recognition algorithm based on circle fitting algorithm is proposed. This algorithm uses the edge pixels of optical objects to perform circle fitting, then calculates their circle fitting ratio. Different optical targets can be recognized by comparing their circle fitting ratio. However, in some special situations, the difference between the circle fitting ratio of the analog laser target and the main laser target is very slight. It is not effective to recognize the dual targets only by the circle fitting ratio. Therefore, a new parameter, based on the circle fitting coefficient, BLOB region number is added as a supplement to the circle fitting coefficient to jointly determine the final target recognition result. For the second problem, this paper build a new automatic alignment mathematical model based on multi-optical path and dual-target. The new mathematical model embodies the characteristics of optical targets well, and improves convergence condition, which could judge whether the distance between the main laser center and target position is less than the given error threshold. For the last problem, this paper improves the efficiency of optical docking alignment by parallel alignment multiple optical paths. The experimental results show that the dual-optical target recognition algorithm proposed in this paper based on circle fitting can recognize analog laser target and main laser target well. Besides, the recognition error accuracy is less than 3 pixels, and the processing time is less than 1 second, which meets the accuracy and efficiency requirements of optical docking alignment of the high-power laser device. Simultaneously, the automatic alignment mathematical model constructed in this paper based on multiple optical paths and dual targets has great significance for the success of optical docking alignment.
Nov. 25, 2022Vol. 51 Issue 11 1114006 (2022)
Tianfeng CHEN, Jiamin QIU, Hong PENG, Xi CHEN, and Ying YAN
Controlling and manipulating the internal states by optical pulses are crucial in some physical systems. However, it is a challenge to achieve the high-precision quantum computing in imperfect physical systems, because it is limited by various dephasing factors such as frequency detuning or fluctuation in a tightly packed frequency interval, the unwanted off-resonant excitation outside this interval, decoherence, and Rabi frequency fluctuations. At present, different methods, such as Lewis-Riesenfeld Invariant (LRI) and Transitionless Quantum Driving (TQD), have been put forward and been implemented experimentally to inversely engineer the time-dependent Hamiltonian of a quantum system and to accelerate slow adiabatic processes via nonadiabatic shortcuts. Here, we use the TQD method to speed up adiabatic passage technique in the Rare-Earth Ions (REI) system and to eliminate the microwave field that is hard to implement experimentally. According to the characteristics of the REI system, to achieve the high-precision quantum control demands that the light-matter interaction treat different frequencies as a single one, but shut off abruptly. That means, the quantum control should have the same manipulation over the ensemble qubit ions with a frequency distribution in the range of ±170 kHz. At the same time, it can’t affect the background qubit ions which are about 3.5 MHz away from the addressing frequency of the target qubit as these excited background qubit ions have a probability of interfering with the target qubit ions. Therefore, it is necessary and important to control the light-matter interaction by designing appropriate optical pulses specifically, so that the quantum control can overcome the influence of the restrictive factors present in the system, eventually achieving high-fidelity quantum manipulation in such systems. In this article, we made an analysis on the three limitation factors: 1) the frequency detuning between the ensemble qubit ions, 2) the off-resonant excitation to the background qubits around the target qubit, 3) the infeasibility of using a microwave field to directly couple the two qubit levels. We proposed a theoretical scheme for non-adiabatic high-fidelity quantum operations in a three-level system to overcome the three limitation factors. The main work includes: 1) The theoretical scheme to construct the optical pulses by utilizing the time evolution operator is proposed. It is constructed based on a set of orthogonal auxiliary states containing time-dependent parameters, and the Hamiltonian of the system is inversely constructed from the time evolution operator. From the one-to-one correspondence between the matrix elements in the Hamiltonian and the Rabi frequency of optical pulses, the representation of optical pulses is obtained. 2) A method of eliminating a microwave field to directly couple the two qubit levels is proposed. By confining the relationship between the time-dependent parameters, which are introduced in the orthogonal auxiliary states and time evolution operators, the microwave coupling term in the Hamiltonian is eliminated. The elimination of the microwave field can simplify the experimental operation. 3) The non-adiabatic optical pulses to manipulate the quantum state of REI ensemble qubits with high fidelity are designed. The performance of the optical pulses is improved by optimizing the multiple degrees of freedom in the pulses. In summary, the optical pulses developed in this scheme can not only eliminate the direct-coupling microwave field between the two qubit levels, but also achieve high-fidelity (99.86%) quantum control over the ensemble qubits which are distributed in a frequency range of about ±170 kHz, and in the mean while suppress the unwanted excitation of other qubits with a distance to the qubit-ion addressing frequency ≥3.5 MHz. This scheme is not only applicable to REI ensemble qubit system, but also to other quantum systems where qubits are addressed in frequency.
Nov. 25, 2022Vol. 51 Issue 11 1127001 (2022)
Lei LI, Liping TANG, Qiuyang MA, Zijiang GAO, Yang GAO, and Yingying QIAO
CO is a highly toxic gas that causes worldwide accidental deaths. So there is an extensive demand to achieve real-time and highly sensitive detection of CO for many applications. Photoacoustic spectroscopy has become a popular optical method for trace CO detection due to its advantages of zero-background detection, high sensitivity, fast response, and wide dynamic range. Hence, a CO gas sensor based on photoacoustic spectroscopy technology is demonstrated in this paper. According to the principle, the detection limit of the gas sensors based on photoacoustic spectroscopy can be improved by selecting a stronger absorption line, increasing the optical power, optimizing the structure of a photoacoustic cell, and choosing an acoustic detector with higher sensitivity. Firstly, according to the absorption spectrum of CO gas, the second overtone band locates at optical fiber communication window is chosen as the detecting waveband. The excitation laser and the optical components have been well developed and show more stable performance than other wavebands. In order to compensate the drawback of the weak absorption coefficient and increase the strength of the photoacoustic signal, a commercial erbium-doped fiber amplifier can be employed to boost the optical power to ~ 300 mW. Secondly, considering that the flow noise, the ambient noise, the background noise generated by cell window and cell wall absorption and the electronic device noise existing in the photoacoustic spectroscopy system seriously reduce the system performance. A differential photoacoustic cell is designed and employed, which can effectively strengthen the photoacoustic signal and suppress the noise. Finally, the data processing module of the system has been optimized to obtain the optimal performance. Additionally, a data processing algorithm can be used to increase the signal-to-noise ratio and improve the system performance without increasing the complexity of hardware system. So far, several existing denoising algorithms for photoacoustic spectroscopy are suitable for dealing with linear and non-stationary signals or nonlinear and stationary signals, but the photoacoustic signal is a nonlinear signal due to the gas absorption is a non-linear and non-stationary process with various noise. Hence, the performance of these algorithms is limited when dealing with the photoacoustic signal. On the contrary, Complete Ensemble Empirical Mode Decomposition with Adaptive Noise (CEEMDAN) is a well-known algorithm for non-stationary and non-linear signal, which decomposes the signal according to the time scale characteristics of the data. It is regarded as an intuitive and adaptive signal processing method and holds the ability of making up for the inadequacies of other denoising algorithms. The CEEMDAN algorithm decomposed the second harmonic signal into a finite number of intrinsic mode function components and residual component, and then Savitxky-Golay filter was used to denoise each component. In fact, the key feature of the Savitxky-Golay filter is that it can keep the shape and width of the signal unchanged, and it is widely used in spectrum analysis. Finally, the effective components used to reconstruct the signal are selected by evaluating the cross-correlation coefficient between the denoised components and the original signal. The experimental results show that when the integration time is 100 ms at atmospheric pressure and room temperature, the signal-to-noise ratio of CO detection is increased to 4.6 times of that of the original signal, and the minimum detection level is reduced to 2.6×10⁻⁶ by algorithm. The sensor has a good linear response to gas concentration. The experimental results verify the feasibility and effectiveness of this algorithm in improving the detection performance of photoacoustic spectroscopy system.
Nov. 25, 2022Vol. 51 Issue 11 1130001 (2022)
Junjie LI, Jian SUN, Hengxiang ZHAO, Chenguang CHANG, Di FU, Hao ZHAO, Lu BAI, and Yutao FENG
Wind detection in middle and upper atmosphere is an important way to characterize atmospheric environment and atmospheric dynamics, which is significant for accurate weather forecast and smooth operation of aerospace missions. Satellite remote sensing of the atmospheric wind field is not limited by weather and geographical conditions, and can be used for global all-weather remote sensing observation. More importantly, using limb viewing geometry can provide long-term observation results of the global horizontal wind field and temperature distribution, which is necessary for studying large-scale and long-term space climate. Compared with Michelson interferometer and Fabry-Perot interferometer, the Doppler asymmetric spatial heterodyne interferometer has higher sensitivity, no moving parts and lower processing accuracy requirements. These advantages can greatly improve the performance of the system, and are very suitable for wind field detection activities in the middle and upper atmosphere. The space-borne wind interferometer is designed to detect the weak airglow emissions employing limb viewing geometry, which can be easily affected by background radiation from the lower atmosphere. The earth's atmosphere is composed of a variety of gases and aerosol particles. These components enable the atmosphere to absorb and scatter the incident solar radiation, which constitutes the atmospheric background radiation. The stray light will degrade the quality of the original interferogram data, decreasing the contrast and effective signal-to-noise ratio. This paper uses a satellite based on 500 km orbital altitude to measure the winds in the middle atmosphere at the height of 60~90 km, and the typical atmospheric background radiation and airglow radiation intensity are selected. The detection range of the above loads is in the upper atmosphere, and the observation of wind field in the middle atmosphere (60~90 km) will put forward higher requirements for the suppression of stray light. In addition, the multistage diffraction energy of Doppler interferometer should be analyzed. According to the atmospheric background radiation intensity at different altitudes, combined with the optical system parameters, the baffle is designed. The primary purpose of the baffle is the suppression of signal that originates from angles outside the field of view since the illuminated earth’s disk and the sun represent light sources that are many orders of magnitude brighter than the targeted airglow emissions, and during the day, the bright earth is always close to the fields of view. The adopted criterion is that the entrance aperture in front of the first lens should not receive light directly from the sunlit cloud tops, which is assumed to be 20 km altitude. In order to suppress the stray light in the field of view, the optical system is simulated to find the key surfaces which can cause the ghost image in the interferometer and the suppression structure is made. For the stray light of the interferometer multistage diffraction, simulation of rays tracing is taken to evaluate the influence on imaging. In order to evaluate the stray light suppression effect, point source transmittance analysis and illumination simulation are taken. The point source transmittance is the ratio of the illuminance at the image surface to the illuminance at the entrance pupil. The image surface illuminance map is obtained by simulating the airglow light source and the atmospheric background radiation light source. Through point source transmittance analysis and illumination simulation, the following conclusions are obtained. First, in the horizontal and diagonal directions, the point source transmittance drops below 10-5 at 0.2° outside the field of view, and in the vertical direction, the point source transmittance drops below 10-5 at 0.04° outside the field of view. Second, the atmospheric background radiation and ghost image account for 1.35% of the total energy of the image. The results show that the proposed stray light suppression method is effective and meets the requirements of the satellite-borne Doppler asymmetric spatial heterodyne interferometer.
Nov. 25, 2022Vol. 51 Issue 11 1130002 (2022)
Jun XIE, Jianglei DI, and Yuwen QIN
Underwater imaging plays an increasingly important role in marine military, marine engineering, marine resource development,marine environmental protection, and so on, with the advantage of providing rich information, high resolution and high visibility underwater images. However, a large number of plankton and suspended particles in water environment, especially in the marine environment, causing strong scattering and absorption effects and resulting in image degradation problems such as blurring, short imaging distance, color distortion, low contrast, etc. Therefore, a series of underwater imaging methods have been proposed to solve the above problems.The underwater image enhancement technology can be used for image denoising, contrastimprovement and color distortioncorrection. The underwater image restoration uses the physical model of water degradation to restore the real image. The underwater polarization imaging uses the polarization difference between background and target to remove noise. The underwater ghost imaging and underwater compressed sensing imaging are used for imaging in scattering media. The underwater spectral imaging is used for color restoration. The underwater laser imaging is used for long-range and three-dimensional imaging. The underwater holographic imaging is used for water microorganism imaging, and so on. However, the above methods can only solve some image degradation problems, and there are some drawbacks, such as the subjectivity of underwater image enhancement technology, the dependence of underwater image recovery technology on prior information, and the computational load of underwater image correlation.The development of deep learning together with the development of hardware technology provides new solutions to the above problems, which makes the combination of deep learning and underwater imaging technology more and more widely used. As a powerful tool, neural network can extract similar features of different images using a wide range of datasets and convert them into high-level features, which can be used to process new input data, and completes a variety of complex tasks implicitly. It performs excellently in the field of image processing, and has made some achievements in the application of underwater imaging.Deep learning-basedimage restoration uses neural network to establish image-parameter mapping to estimate model parameters, avoiding human-dominant influence. Deep learning-based polarization imaging uses a neural network to map polarized images to clear images for image denoising. Deep learning-based spectral underwater imaging technology uses neural network to fuse multispectral images and hyperspectral images to obtain images with both high spatial resolution and hyperspectral resolution. However, some problems such as lack of datasets, poor generalization, and insufficient network interpretabilitystill exist, which need to be further solved.In this review, we discuss the characteristics of water environment and the various problems existing in underwater imaging, such as image blurring, short imaging distance, severe color distortion, and so on. The causes of the problem are analyzed and the underwater IFM model proposed by Jaffe-McGlamey is introduced. The latest application progress of various classic underwater imaging methods is systematically reviewed, including underwater image enhancement, underwater image restoration, underwater polarization imaging, underwater correlation imaging, underwater spectral imaging, underwater compression sensing imaging, underwater laser imaging and underwater holographic imaging. In addition, the basic concepts of deep learning, the composition of neural network and the structure of classical CNN network are introduced, and the latest application in combination with the above underwater imaging technology is systematically reviewed. At the same time, the application characteristics, deficiencies of traditional underwater imaging and the improvement by deep learning are analyzed and compared, and the applications of deep learning in various imaging methods are summarized. CNN network structure and MSE loss function are most commonly used due to its simplicity and efficiency. Finally, the future direction of underwater imaging technology based on deep learning is prospected.
Nov. 25, 2022Vol. 51 Issue 11 1101001 (2022)
Kehong WANG, Yang YU, Yang WANG, Xiaochen LIU, Shuaichang ZHAO, Yong YANG, Qi ZHANG, and Xiaobei ZHANG
The ambient temperature sensing is essential in industry, agriculture, medicine, food processing and so on. Optical fiber sensors have been widely valued by scholars due to the advantages of simple fabrication, electromagnetic interference resistance, chemical corrosion resistance and easily distributed measurement. In recent years, Hollow Core Fiber (HCF) has been investigated in fiber temperature sensing due to its hollow structure. In addition, antiresonant Negative Curvature Hollow Core Fiber (NCHCF) as a special hollow photonic crystal fiber, greatly reduces transmission loss of HCF by virtue of its negative curvature structure and quite thin cladding tube wall thickness. Hence, the mechanism of Multimode Interference (MMI) and Anti-Resonant (AR) of NCHCF are significantly enhanced, so it has more potential in the field of sensing and has become the focus in optical fiber sensing. At present, the sensitivity of the NCHCF cascaded temperature sensor based on the MMI mechanism is low. And some simulations have indicated that the high temperature sensitivity based on AR mechanism can be obtained by filling temperature-sensitive liquid into the hollow core of NCHCF. In order to simplify the fabrication of devices and obtain high temperature sensing sensitivity, the temperature sensing characteristics of the unfilled cascaded device based on AR and MMI are both studied theoretically and experimentally in this paper. Firstly, Single-Mode Fiber (SMF), Graded Index Fiber (GIF) and NCHCF are fused to form the cascaded fiber sensing structure (SMF-GIF-NCHCF-GIF-SMF). And then, the temperature sensing principle of the cascaded sensor based on MMI and AR is analyzed and the formulas are deduced. As temperature increases, the tube wall thickness and the refractive index of cladding and will increase due to the thermal expansion and thermal-optical effect of fiber materials, while the refractive index of air will decrease. Therefore, the dips based on MMI and AR both show red shift with the increases of temperature. The temperature sensitivity based on AR resonant dip is calculated as 17.25 pm /℃, and the sensitivity only caused by the thermo-optic effect of the fiber cladding material is 15.50 pm/℃. It is concluded that the thermo-optic effect of the fiber cladding material should play a leading role in temperature sensing. Therefore, the confinement losses of the core fundamental mode at corresponding resonant wavelength vary with different temperatures are simulated, where only the thermo-optic effect of the fiber cladding material is considered. And the simulation result is 15.57 pm/℃, which is consistent with the theoretical calculation. Finally, the temperature sensing experimental setup is designed and built. The temperature sensor is placed in the temperature controller and the endpoints of the sensor are connected with Broadband Light Source (BBS) and Optical Spectrum Analyzer (OSA), respectively. As the transmission bandwidth between adjacent AR resonant dips of NCHCF is large, the range of monitoring wavelength of the OSA is set as 600~1 700 nm, and its resolution is 0.02 nm. Multiple experiments are performed for monitoring MMI and AR dips when the temperature increases from 20 to 80 ℃ at a step of 10 ℃. It is found that the wavelength of each dip shifts as a function of temperature, which is fitted with an error bar. And the experimental results show that the temperature sensitivity and Detection Limit (DL) based on the MMI mechanism are 7.70 pm/℃ and 2.60 ℃, respectively. As for AR based sensors, there are three resonant dips in the resonant region of the transmission spectrum, which correspond to the three AR modes supported by NCHCF. The temperature sensitivities of the three dips are 17.29 pm/℃, 17.38 pm/℃ and 17.22 pm/℃, respectively, which are consistent with the theoretical results. And the DL based on AR mechanism is 1.16 ℃. Compared with the above experimental results, the temperature sensor based on AR mechanism has higher sensitivity and more fine detection, and thus AR mechanism is more suitable for temperature sensing. The temperature sensing experiment of the cascaded device is mainly carried out in the temperature range of 20~80 ?℃. However, the relevant studies have shown that the detection temperature based on the quartz material sensor can be up to 1 100℃. Therefore, the proposed sensor can be used in a higher temperature environment theoretically. Meanwhile, it has the advantage of good stability and can be widely used in environmental temperature detection scenes. In addition, the comparative study of dual mechanisms carried out in this paper can provide the theoretical basis for multi-parameter sensing.
Nov. 25, 2022Vol. 51 Issue 11 1106001 (2022)
Lin SHE, Niannian XU, Peilong YANG, Peiqing ZHANG, Zhenrui LI, Pengfei WANG, and Weimin SUN
Chalcogenide glass material has an ultra-broad infrared transmission window, ultrafast nonlinear response time and ultra-high third-order nonlinearity. The As2S3 material has lower cost, higher nonlinearity and a broader transmission span than other chalcogenide materials, which is a supporting factor for supercontinuum generation. In this paper, a chalcogenide As2S3 glass based Photonic Crystal Fiber (PCF) with an As2S3 glass fiber core and air-holes as the microstructure cladding was theoretically designed, and the optical performance of the As2S3 glass PCF was studied using a commercial software of COMSOL Multiphysics. The proposed As2S3 glass PCF preform was then experimentally fabricated using an improved molding method along with a chemical etching method. The As2S3 glass PCF was drawn at the temperature of 350oC under the protection of dry N2 gas. The fabricated As2S3 glass PCF has a solid hole in the center and its cladding consists of four layers of air holes arranged in regular hexagonal order. The solid core diameter of the fabricated As2S3 glass photonic crystal fiber is 10 μm, the diameter of the air-holes is 3.3 μm and the air hole pitch between the centers of proximal holes is 7.2 μm. For the fiber tapering process, a micro-tapering system using a CO2 laser along with a scanning mirror and two high precision translation stages was established, all of which are computer programming controlled. The use of a CO2 laser to heat the fiber is advantageous over standard oxyhydrogen flame-tapering systems since it allows greater control over the tapering parameters, namely the size of the irradiated zone over the sapphire capillary, the heating rate and the exposure time, and also this avoids potential further pollution of OH- and H2O into the As2S3 glass PCF. By mounting the As2S3 glass PCF on computer-controlled translation stages gives programmable dynamic control over the fiber tension, as well as the ability to control the position of the tapered section with an accuracy of ±0.5 μm. Using this tapering system, taper regions as long as 5 cm were achieved with a tapering fiber diameter reduction of 56%. The diameter of the As2S3 glass photonic crystal fiber can be tapered down to 40 μm based on the tapering method. To fabricate a pump source of supercontinuum generation, a customized mode-locked femtosecond (fs) fiber laser based on nonlinear polarization rotation effect in a home-made Ho3+/Pr3+ codoped (Ho3+∶2 mol.%, Pr3+∶0.2 mol.%) ZBLAN glass fiber (the core diameter is 12 μm, the cladding diameter is 125 μm and the NA is 0.16) was achieved and it generates 173 fs pulses at the wavelength of 2.87 μm with an estimated peak power of 25 kW and a repetition frequency of 42 MHz. Then, the tapered chalcogenide glass photonic crystal fibers were pumped using the above ZBLAN fs fiber laser to generate the mid-infrared supercontinuum spectra. After optimizing the tapered diameters of the tapered As2S3 glass photonic crystal fiber, the tapered As2S3 glass photonic crystal fiber with a waist diameter of 55 μm and a waist length of 3 cm can generate a supercontinuum spectral coverage range of 2 000 nm to 5 500 nm at the loss level of -20 dB. A theoretical model based on the well-known generalized non-linear Schr?dinger equation was also established for simulating the evolution of the proposed supercontinuum generation in the tapered As2S3 glass photonic crystal fiber over the length of 3 cm. The experimental results have a good agreement with the theoretically calculated results. This investigation constitutes a major step toward devoloping an efficient chalcogenide glass photonic crystal fiber based broadband supercontinuum light source operating in the mid-infrared region.
Nov. 25, 2022Vol. 51 Issue 11 1106002 (2022)
Zehua BU, Bangning MAO, Zhaopeng SI, Huaping GONG, Ben XU, Juan KANG, Yi LI, and Chunliu ZHAO
With the rapid development of the Internet of Things era, the perception and acquisition of all kinds of external information is becoming increasingly important. Traditional monitoring and warning technologies such as manual inspection, video surveillance, infrared detection, and microwave detection have been widely used in various fields. Although these technologies have succeeded, they are expensive, environmentally sensitive, and cannot be monitored over long distances. To realize real-time and environment-free long-distance monitoring, distributed optical fiber sensing technology has developed rapidly in recent years. Distributed optical fiber sensing uses the whole optical fiber as the signal's transmission medium and sensing unit. When external factors act on the optical fiber, the light wave transmitted in it is modulated accordingly, and its light intensity, frequency, phase or polarization state, and other parameters will change accordingly. Distributed optical fiber sensing has the advantages of flexible layout, high cost performance and wide measurement range. Compared with traditional methods, distributed optical fiber sensing realizes large-scale measurement at a lower cost. As an important branch of distributed optical fiber sensor, phase sensitive optical-time domain reflectometer has the advantages of high sensitivity, high resolution and simple structure. At present, φ-OTDR plays an important role in many applications, such as structural crack detection, railway monitoring, traffic flow detection, vehicle detection and intrusion detection. With the development of modern productive forces and the diversification of life scenes, simple vibration location and signal demodulation cannot meet the actual needs and user needs. Random interference in nature (such as thunderstorm, wind, hail, etc.), passing vehicles and moving personnel will interfere with the accurate recognition of intrusion signals, increasing the false alarm rate. It is hoped that the type of vibration signal can be obtained at the same time as the location of the vibration signal, so as to replace manual inspection more intelligently. Compared with traditional monitoring methods, phase sensitive optical-time domain reflectometer system has greater advantages in real-time performance and convenience. At the same time, compared with video surveillance, phase sensitive optical-time domain reflectometer system is more covert, has strong resistance to external electromagnetic and other interference signals, and has the advantages of low cost, wide range and continuity. Therefore, it is of great significance to classify and identify vibration signals, identify the types of vibration signals, and study related identification algorithms to improve the identification accuracy and response speed of vibration signals, which are of great significance to the monitoring occasions in the fields of road traffic and border security. In view of the phase-sensitive optical time domain reflectometer distributed optical fiber sensing system has difficulties in real-time performance and accuracy of signal recognition. A method based on wavelet packet decomposition and support vector machine is presented. The energy feature vector is extracted by the wavelet packet decomposition of the signal as the input samples of the support vector machine, and the energy distribution trend of different signals is analyzed. A total of 800 experimental samples of knock, shake, walk and noise signals were trained. The recognition effect was evaluated by four evaluation indexes: accuracy rate, recall rate, F1 value and accuracy. The experimental results show that the precision rate, recall rate and F1 value of the knocking signal are 94.12%, 96% and 95.05%, respectively; the precision rate, recall rate and F1 value of the shaking signal are 95.92%, 94% and 94.95%, respectively; The precision rate, recall rate and F1 value of walking signal and noise signal are all 100%. The overall recognition accuracy is above 97%. The method improves the recognition result accuracy and real-time performance in the signal recognition of phase sensitive optical-time domain reflectometer system.
Nov. 25, 2022Vol. 51 Issue 11 1106003 (2022)
Zhuang CHANG, and Yi JIANG
With the rapid development of aerospace industry, optical fiber sensing technology has been widely used. The optical fiber sensor does not contain electronic components, so it has strong anti-electromagnetic interference ability and good electrical insulation, it can be used in many kinds of environment. It uses light wave transmission in an optical fiber to obtain the outside signal and measure the relative physical quantity. Fiber optics can both transmit light and sense signals. When the optical fiber sensor detects the measured physical quantity, the parameters such as wavelength, intensity, phase and frequency of the transmitted light wave will change. The optical fiber sensor can measure hundreds of physical quantities, including temperature, pressure, strain, displacement, acceleration and so on. The use of optical fiber sensors has become more and more popular in recent years, in the military defense, aerospace, industrial control, measurement and testing, exploration and other fields have a broad market. At present, Fiber Bragg Grating (FBG) sensors and Fiber Fabry-Perot (F-P) sensors are mainly used in practical applications. The optical fiber EFPI sensor has many advantages, such as small volume, high precision and large dynamic range. At present, there are two demodulation methods for the measurement of optical fiber EFPI sensor, one is fiber laser interferometry, the other is fiber white light interferometry. The former is suitable for the relative measurement of dynamic signals, while the latter is generally used for the absolute measurement of static or slowly varying signals. White light interferometry can realize absolute measurement, which has the advantages of a large dynamic range and strong anti-interference ability. Currently, various types of white light interferometry demodulation methods have been applied, including peak method, wavelength tracking method, interference order method, principal frequency method and Fourier transform method. Because of its various advantages, this technology can be widely used in practical engineering. With the increasing demand of the latest applications, the research on high-speed fiber-optic white-light interferometry has become the main trend in the future. With the increasing demand of applications, such as the monitoring of the surface pressure of the space engine and the strain produced at the moment of explosion, these unstable static physical variables change very frequently. In order to get better measurement results, high-speed white-light interferometry is studied. But it is difficult to achieve the absolute measurement of high-speed signals and achieve the required resolution. In general, the measurement system will be limited by the scanning light source module and computer processing speed and other factors. As the number of signals to be processed increases, the measurement speed decreases. Field Programmable Gate Array (FPGA) processor can solve the speed problem. Because it contains a lot of digital logic resources and rich RAM resources, FPGA can process and analyze data at the same time. The speed of demodulation can be improved by combining FPGA with white-light interferometry. In this paper, a multichannel high-speed Extrinsic Fabry-Perot Interferometric (EFPI) sensor interrogation system based on White-Light Interferometry (WLI) and FPGA is proposed and experimentally demonstrated. The system uses a semiconductor Optical Amplifier (SOA) and a Fiber Fabry-Perot Tunable Filter (FFP-TF) to make a high-speed wavelength scanning fiber laser. The symmetrical triangular wave technology drives the tunable Fabry-Perot filter to generate a swept spectrum, the scanning frequency is 2 kHz. Use FPGA to realize high-speed signal demodulation of EFPI sensor. The system realizes high-speed demodulation of EFPI sensors with 4 channels, the demodulation speed of each channel reaches 2 kHz.
Nov. 25, 2022Vol. 51 Issue 11 1106004 (2022)
Wei SONG, Youjin XIE, Zhiguo LI, Wei HAO, Peipei YAN, Xin LI, and Chuandong SUN
As an important part of modern communication system, satellite communication undertakes important tasks such as communication, earth observation, navigation and positioning in military and civil fields. The traditional spaceborne optoelectronic load realizes the data signal and power transmission between the relative rotating bodies through the slip rings. With the continuous development of optical fiber technology and related components, laser communication with optical fiber as the transmission medium has gradually replaced the traditional signal transmission with wires. The fiber optic rotary joints have the characteristics of a wide communication frequency band, strong anti-electromagnetic interference ability, strong confidentiality ability, fast transmission rate, low loss, etc. Its performance largely determines the service life of the satellite. Low loss and high reliability are important indicators of single-channel fiber optic rotary joints. This paper takes the single-channel fiber optic rotary joints as the research object. In order to achieve its low loss and high reliability goals, it is necessary to explore the factors affecting the insertion loss. The gap between the single-mode fiber and the gradient-index lens and the position error between the two gradient-index lens collimators are all important factors that affect the insertion loss of the fiber optic rotary connector. The Gaussian beam coupling has attracted the attention of universities and research institutions from all over the world. But the previous analysis ignored the influence of the position error between the fiber and the gradient-index lens on the coupling efficiency. There is no corresponding compensation method for the above-mentioned errors, which is crucial for improving performance parameters and reducing the difficulty of processing and assembly. This paper takes the single-channel fiber optic rotary joints as the research object. In order to achieve the goals of low loss and high reliability, it is necessary to explore the factors affecting the insertion loss. The fiber optic rotary connector studied in this paper uses two gradient-index lens collimators as the main optics. Theoretically, the propagation model of Gaussian beam in the construction of gradient-index lens is established, and the optical characterization parameters of the gradient-index lens are obtained by mathematical analysis method of light transmission matrix. In order to describe the propagation of the Gaussian beam in the gradient-index lens, the (x, y, z) and (x', y', z') coordinate systems are established, and the electric field vector equations are established for the lenses at the receiving end and the transmitting end. Based on this equation, the influence of lateral offsets on the coupling efficiency of the system is discussed. Using the geometrical optics analysis method, the energy distribution equation under the separation misalignment is established, and the influence of the separation misalignment on the coupling efficiency of the system is analyzed.This paper design the single-channel fiber optic rotary joints with low loss as the key parameter by ZEMAX, and the optical model of the single-channel fiber optic rotary joints is established, and the optical parameters of the gradient-index lens are preliminarily determined. For the convenience of processing and assembly, the two gradient-index lenses are designed with the same parameters. First, without changing the working distance, set the distances to 0, 0.05 mm, 0.10 mm, 0.15 mm, 0.20 mm, and 0.25 mm between the optical fiber at the transmitting end and the gradient-index lens. In order to obtain the insertion loss at different positions, the value of the fiber at the receiving end and the gradient-index lens is changed. It can be seen from the analysis that the same insertion loss as the initial value can be obtained by adjusting the position of the optical fiber. This method can reduce the influence of the error between the optical fiber and the gradient-index lens.Secondly, by changing the lateral offsets and separation misalignment of the two gradient-index lenses, the effects of lateral offsets and separation misalignment on the insertion loss of the system are obtained. It should be noted that due to the particularity of the gradient-index lens, the lateral offsets cannot be so large that the Gaussian beam cannot be coupled into the fiber. The axial distance is controlled within 0~14 mm, and the radial distance is controlled within 0~0.25 mm. It can be seen from the simulation that the lateral offsets have a great influence on the insertion loss of the system, and it is necessary to strictly ensure the accuracy in processing and assembly.In view of the above errors, the insertion loss is reduced to 0.2 dB by the displacement method, which provides a reference for the optimal design of the single-channel fiber optic rotary joints. For the separation misalignment and lateral offsets between two gradient-index lenses, a beam steering technology based on wedge prism and flat glass is proposed. This method mainly uses two wedge prisms to achieve beam steering, the flat glass adjusts the transmission optical axis and the receiving optical axis to be on the same axis as possible. The insertion loss of systems can be reduced to 0.7 dB by beam steering technology, which greatly reduces the influence of errors. The difficulty of processing and assembly is reduced, and the reliability of the system can be improved.Finally, a test system for the insertion loss of a single-channel fiber optic rotary joints was built, and the position of the optical fiber and the gradient-index lens was adjusted with a high precision fiber alignment stage, and observed through a binocular microscope. By fitting the experimental data with the simulation data, the accuracy of the system design and simulation analysis is verified.
Nov. 25, 2022Vol. 51 Issue 11 1106005 (2022)
Qingze YAN, Yixin ZHANG, and Yun ZHU
Since Orbital Angular Momentum (OAM) mode can form an infinite N qubit basis, it provides a new coding scheme for communication links. However, ocean turbulence and other external disturbances can cause phase disturbance of OAM mode, which generates the cross talk between the energy states of OAM modes. The self-focusing property of POV is beneficial to the transmission of OAM modes. The transmission quality of POV beams in oceanic turbulence is most related to the beam radius, while it is nearly free from the wavelength, topological charge, and radius-thickness ratio. Because of these special characteristics, POV has attracted wide attention of researchers. Moreover, the absorption of seawater reduces the information carrying capacity of POV photons and weakens the reliability of the system. Therefore, it is necessary to study the absorption of seawater and the transmission characteristics of POV. In addition, the modulation of POV also increases the information capacity carried by the POV's OAM mode. In this paper, the ABEP and information capacity of underwater optical transmission system based on POV carrier and M-PSK modulation are studied under weak absorption turbulence. The wavelength dependence of fading channel is especially considered. The fading channel consists of two parts: signal energy loss caused by seawater turbulence and seawater absorption. Under the condition of paraxial transmission and Rytov approximation, the closed expressions of mean signal-to-noise ratio and signal error probability for M-PSK OAM channel are derived. Considering that the number of OAM signal level channels in common use is far less than the number of OAM topological charge (energy level) of POV vortex carrier, the concept that POV vortex carrier communication link is a symmetric link composed of multiple OAM level channels is proposed. Using the derived expression of ABEP of M-PSK OAM channel and the concept of symmetric link of multi-OAM channel, a novel closed-form expression of ABER and average capacity under various modulation schemes is proposed. Finally, through numerical analysis of the model, new results are draw. The results show that when transmitting over short distances, the wavelength of the photon of the OAM signal of POV has a greater impact on the information capacity of the transmission system than on the absorption of seawater, while when transmitting over long distances, the effect of seawater absorption on the information capacity of the optical transmission system is greater than the wavelength. When the ring radius of the perfect optical vortex increases, the information capacity of the system also increases, and ABEP decreases, but with the increase of the ring radius of POV there is a stable region of ABEP decrease and information capacity increase related to turbulence intensity. The increase in the signal-to-noise ratio of the receiving and transmitting optical systems results in an increase in the information capacity of the system and a decrease in ABEP. The increase of the inner-scale and the decrease of the outer-scale also lead to the increase the information capacity of the system and the decrease of ABEP. In addition, the OAM signal photons of the POV under QPSK modulation are less affected in absorbing weak turbulence links than other orders of modulation. Therefore, on the basis of selecting the appropriate modulation scheme, the ring radius of the POV and the signal-to-noise ratio of the transceiver optical system, which can effectively enhance the information capacity of the OAM signal photon of the POV.
Nov. 25, 2022Vol. 51 Issue 11 1106006 (2022)
Zuyang ZHAO, Haihua CUI, Kunpeng DU, Yiming QU, Dong QUAN, and Zhiguo MU
As a branch of augmented reality technology, 3D laser projection positioning technology can accurately present the contour information of the digital 3D model of the product and part of the manufacturing information at the required place on the product assembly site. The 2D galvanometer system is an optical reflection system that can precisely control the optical path of the laser beam. The calibration technology of the 2D galvanometer is the key to achieving high-precision 3D laser projection. As the application of two-dimensional scanning galvanometers expands from two-dimensional plane scanning to three-dimensional space scanning, the difficulty of galvanometer system calibration is also increasing, and the continuous expansion of galvanometer system applications promotes the development of galvanometer system calibration technology. However, the calibration process of the existing laser projection technology has the problems of complicated process operation, low efficiency and the need to use high-cost equipment such as laser trackers, resulting in the inability of 3D laser projection to be widely used in the field of view of assembly manufacturing. Vision measurement technology is a typical non-contact auxiliary measurement technologies with high measurement accuracy. It can not only collect a large amount of high-precision data for the calibration of the galvanometer, but also can be used as a basic coordinate system to realize the alignment of the coordinate system of the projected object and the galvanometer coordinate system. In addition, visual measurement has the advantages of mature development and low hardware requirements. The study of the 3D laser projection system based on visual assistance can lower the threshold for the realization of this technology and promote the promotion and application of 3D laser projection. Aiming at the problems of complicated operation and low efficiency in the existing 3D laser projection system calibration, a 3D laser projection calibration method based on a homography matrix is proposed. Firstly, the monocular vision was introduced as an auxiliary means to establish a model of the 3D laser projection system; secondly, the pose of the projected target was solved by using the 2D homography of the image, and the conversion relationship between the galvanometer and the camera was calibrated. The performance of the proposed calibration method is analyzed from three angles of error, stability and error distribution, and the reliability of the 3D laser projection calibration method based on the homography matrix is verified. By independently building a 3D laser projection system based on visual aids, and conducting specific experiments with standard parts as the projected parts, it is proved that the proposed calibration method can solve the above problems. The experimental results show that when the distance between the projected part and the galvanometer is within 3 m, the calibration time is less than 5 min, and the projection accuracy can reach 0.3 mm. The calibration method of the homography matrix is limited to the plane object, and it is suitable for the case where the projected part is a plane. Compared with the domestic conventional calibration method, the method in this paper avoids the complicated pre-calibration process and improves the calibration efficiency. Such a positioning device reduces the cost and solves the problem of low operation efficiency of the entire 3D laser projection system at present.
Nov. 25, 2022Vol. 51 Issue 11 1112001 (2022)
Shiwei LIU, Haiping MEI, Yichong REN, Zhiwei TAO, Azezigul Abdukirim, Junxin ZHANG, Yanling LI, and Ruizhong RAO
Compared with interferometry and shadowgraph, Background Oriented Schlieren(BOS) has significant advantages of a large field of view and low cost as a new flow field measurement technology. Developed on the basis of traditional schlieren technology and modern image processing technology, BOS has developed rapidly and has been widely used in a variety of flow field measurements and displays since its invention in 1998, such as combustion field diagnosis, temperature field visualization and density field reconstruction. Consists of a random background, a flow field and an image acquisition and processing system, the device of BOS is simple and can be used in a variety of scenarios, but it also has the limitation of over-reliance on background and algorithms because the core of this technology lies in the use of image processing algorithms, the displacement of pixels are calculated by comparing the original background without the flow field and the disturbing background after passing through the flow field. Furthermore, the pixel offset of the image represents the refractive index gradient of the flow field. In theory, the refractive index can be reconstructed from the gradient with the phase reconstruction algorithm, which is of great significance in the study of flow field structure and fluid characteristics. Firstly, the influence of five different dense optical flow algorithms such as Farneback, Sparsetodense, Deepflow, Pcaflow and Dualtvl1 and the background under different brightness, contrast and correlation on the displacement detection accuracy is analyzed by bilinear interpolation. The research found the following rules: 1) the Farneback algorithm takes the least time and has the best stability as well as the highest accuracy; 2) among the optional parameters of Farneback, the average window size ought to be determined according to the pixel displacement, and the number of iterations should not be too much to avoid time-consuming; 3) the detection accuracy of the optical flow algorithm is negatively correlated with the image correlation, positively correlated with the image contrast, and almost independent of the brightness; 4) under the appropriate algorithm and background, the displacement detection accuracy of the BOS system can be up to 1/400 subpixel. Secondly, after obtaining the pixel offset through the optical flow algorithm, according to the quantitative relationship between the background image displacement and the flow field wavefront gradient, the flow field wavefront can be reconstructed by the Fourier transform method and the iterative method respectively. The Antisymmetric Partial Derivative Integral (ASDI) method is a type of Fourier transform. A least squares error model between the measured slope and the actual slope of the wavefront is constructed firstly, and the integral operation in the space domain is mapped to a linear combination of Fourier primary functions in the frequency domain,and the original gradient matrix is filled and expanded to twice, and then the optimal solution is obtained. The main idea of the Guass-Seidl (GS) iteration method is to generate the current latest refractive index value by iteration, and use the latest value to calculate the next step of the latest parameter, and bring it into the calculation of the refractive index of the surrounding points, and so on until the convergence condition is reached. After numerical simulation, we draw the following conclusions: 1) the ASDI is faster but has lower accuracy, which can be applied to real-time processing; 2) the GS iterative method is slower but more accurate and can be used for post-processing. In practical application, we can choose the appropriate algorithm according to our needs. Finally, a set of high-precision background oriented schlieren flow field detection system was built. In the laboratory, the laser speckle pattern is used as the background, and the temperature pressure gradient is generated by the alcohol lamp combustion as the flow field. After processing the background pictures before and after the alcohol combustion with the algorithm, the obvious fluctuation of the optical path difference above the flame can be clearly seen. In the natural environment, with the forest as the background and the huge sound pressure gradient generated by the gun barrel as the flow field, images were continuously collected, and the propagating sound waves were seen after algorithm processing. The above two experiments prove that under different conditions, the BOS device can achieve both qualitative observation and quantitative measurement. The high-precision background schlieren system is simple in device and mature in the algorithm. In addition to the temperature pressure field and sound pressure field shown in this paper, the refractive index obtained by BOS can also be used for temperature and density calculation of thermal field or density field. The extracted wavefront information also helps to further study the flow field structure, and has a wide range of application prospects in scientific research such as adaptive optics and target detection, as well as in industrial fields such as precision instrument detection, engine performance improvement, aerodynamic shape optimization and so on.
Nov. 25, 2022Vol. 51 Issue 11 1112002 (2022)
Roujing CHEN, Sen HAN, Yanhui KANG, Chunfeng XU, and Xueyuan LI
In optical metrology, Phase-Shifting Interferometry (PSI) is used to measure the surface morphology and wavefront phase of optical components, one of the most accurate methods. Phase-shifting interferometers often use piezoelectric ceramics as phase shifters to drive the reference arm to generate phase shift step. The measurement accuracy of the PSI technique is subject to the phase shifter accuracy. If the actual phase shift value deviates from the ideal one, the phase restoration accuracy will be greatly reduced. Considering that the 5-step with step size such as 5°, 10°, and 20° phase shift is greatly shortened compared to the 90° stroke, the hysteresis and nonlinearity in the PZT phase-shift curve can be ignored, and higher precision. At the same time, shortening the time can increase the frequency sensitivity to vibration and reduce the introduction of main low-frequency vibration in the actual environment. Therefore, this paper proposes to replace the common 90° with a tiny phase shift step to acquire five frames of interferograms. In order to verify the performance of the tiny phase shift 5-step algorithm, numerical simulation analysis is carried out at the primary error sources of calibration error and random phase shift error. Based on a self-tuning algorithm, restoring the actual phase shift step size by 3-step algorithm before the 5-step Hariharan algorithm is proposed. Under the calibration error, when the fringe phase spatial distribution satisfies the integer fringe number, the actual phase shift can be obtained with high accuracy through the space averaging operation to eliminate phase error as much as possible. While the random phase shift error, the restored phase shift amount will be around to the average value of the intermediate phase shift error by extending the 3-step method to fully utilize the interferograms. The simulation results show that within the ±10% calibration error, the restoration accuracy of the phase shift step size increases with a lager calibration error, but as high as 10-5λ. The phase error curve is the same trend as the phase shift amount recovery error curve. The phase restoration error PV and RMS by the self-tuning algorithm remain in the order of 10-6λ while 10-3λ by the classic 5-step Hariharan algorithm, which significantly improves the phase restoration accuracy. Within the 5% random phase shift error, the phase restoration accuracy of the self-tuning algorithm is lower than that of the Hariharan algorithm. The average values ??of PV and RMS of the two algorithms differ by three times. The maximum PV values are 0.0097λ and 0.0029λ, respectively, and the RMS values??are 0.004λ and 0.0014λ. When the solving phase shift step size is close to the average value, the restoration accuracy is the same as that of the Hariharan algorithm, it may even be higher than that of the Hariharan algorithm. From the results, within 5% of the error margin, the self-tuning algorithm can still ensure high restoration accuracy. At the same time, the results at the smaller phase shift steps of 5° and 10° show that the phase restoration accuracy of the two algorithms does not change significantly under the calibration error; the accuracy of the two algorithms is reduced under the random error, and the self-tuning algorithm is difficult to ensure the phase restoration accuracy when the phase shift step is 5°. The 20° phase shift step is a better choice. Due to the tiny phase shift, further sampling of the interferograms can be considered, and the phase error can be eliminated as much as possible by the overlapping average method. Experiments should be carried out to verify the anti-vibration performance of the tiny phase shift algorithm. During the experiment, processes such as CCD sampling and calibration should be considered.
Nov. 25, 2022Vol. 51 Issue 11 1112003 (2022)
Jinwei SONG, Junwei MIN, Xun YUAN, Yuge XUE, and Baoli YAO
Quantitative Phase Imaging (QPI) is a technique that can measure the phase map of the light field. It has the characteristics of label-free, non-invasive and three-dimensional observation and has been widely used in bioimaging and industrial inspection. A number of techniques have been developed to measure phase information of objects, including the interferometric method such as Digital Holographic Microscopy (DHM), and the non-interferometric method such as the Fourier Ptychography Microscopy (FPM), Transport of Intensity Equation (TIE) method and so on. The interferometric method has high measurement accuracy but a complex experimental setup sensitive to the environmental disturbance. The non-interferometric method recovers phase from the intensity patterns of objects, but requires iterative calculation or multiple images recorded at different positions, which makes the imaging speed slow and unsuitable for real-time observation. The quantitative phase imaging based on Quadriwave Lateral Shearing Interferometry (QLSI) has the advantages of the referenceless beam, simple configuration, high stability and fast imaging speed. In the existing studies, Cross Grating (CG), Modified Hartmann Mask (MHM), Randomly Encoded Hybrid Grating (REHG) and other splitter elements were used for QLSI. The cross grating has low diffraction efficiency and energy utilization rate (~10%) for the four beams of first-order diffraction. The MHM and REHG can concentrate the diffracted light energy on the four first-order diffraction beams. But the MHM still has a low energy utilization rate (~37%), and the REHG has a complex structure for fabrication.This paper proposes a quantitative phase imaging method based on QLSI using a two-dimensional (2D) Ronchi phase grating. The light incident to the 2D Ronchi phase grating is diffracted mainly with energy concentrated on the four first-order diffraction beams, occupying 65.7% of the total incident energy. The object light carrying the sample's phase information is imprinted to the 2D Ronchi phase grating and then copied into four beams, which interfere with each other to produce the quadriwave lateral shearing interferogram. The quantitative phase image of the sample is reconstructed by Fourier analysis of the interferogram. The influence of the grating period on the QLSI imaging is analyzed theoretically, and the optimal grating period is determined to be six times of the pixel size of the detector. This match can make the best use of the spatial bandwidth product of detector and achieve high resolution image. The influence of the illumination wavelength on the phase reconstruction is theoretically analyzed, which shows that the proposed method is insensitive to the illumination wavelength. The feasibility of quantitative phase imaging under wide spectral light illumination source is demonstrated. The compact QLSI module is constructed with the pixel size of 9 μm×9 μm of the detector and the period of 54 μm of the 2D Ronchi grating. The grating period is precisely six times of the pixel size, meeting the requirement of the optimal condition. The QLSI module is directly connected to a conventional optical microscope to implement the QPI imaging of e.g., Polymethyl Methacrylate (PMMA) microspheres, microlens arrays and staphylococcus section. The relative error of phase experimentally measured is about 1.8%, proving that the method has a high precision of phase measurement. The experimental results also show that the method can be used for quantitative phase imaging with a wide-spectrum light source, making it easily combined with conventional optical microscopes to have a great application potential in biomedicine, three-dimensional topography measurement and other related fields.
Nov. 25, 2022Vol. 51 Issue 11 1118001 (2022)
Caihong HUANG, Xingxing ZHU, Wei GUO, Dingrong YI, Fujiang JIN, and Lei HUANG
The spatial resolution of traditional optical microscopy imaging technology is limited by the optical diffraction limit, which can only reach the order of half wavelength of the incident wavelength, which greatly limits the application scope of optical microscopy technology. Among the mainstream optical super-resolution microscopy techniques, Structured Illumination Microscopy (SIM) is an attractive choice for fast super-resolution microscopy due to its fast imaging speed, low phototoxicity, and no additional complex sample preparation process. SIM technology applies periodic sinusoidal fringe structured light with a spatial frequency close to the diffraction limit to the sample. The high-frequency information that could not pass through the sample is now converted into a low-frequency "Moire fringe", which couples the high-frequency information of the sample beyond the diffraction limit to the imaging. The frequency region detectable by the system can theoretically double the lateral resolution of the microscope. The SIM image reconstruction algorithm is the key to determine the final super-resolution image quality. Traditional frequency-domain image reconstruction algorithms need to estimate the initial phase, spatial frequency and other parameters of the structured light field. It is also necessary to perform multiple Fourier transforms between the spatial domain and the frequency domain. The operation speed is slow affecting its application in real-time dynamic imaging and other fields. The proposed spatial-domain super-resolution imaging algorithms are currently limited to solving the 2π/3 phase shift for structured light super-resolution reconstruction. In the traditional structured illumination microscopy based on the projection of the digital micromirror device, the structured fringes with a period of 4 pixels need to adopt a phase shift interval of π/2. The spatial domain reconstruction algorithm under this application has not been reported yet. Here, a super-resolution image reconstruction for SIM in the Spatial domain is proposed. The algorithm is called differential SIM, or DIFF-SIM for short. First, three structured light illumination images with phases 0, π/2, and π are obtained. The two adjacent original images are subtracted to achieve the elimination of background interference, at which point we obtain two new expressions. Simplify the subtracted expression using the two-angle sum-difference formula of trigonometric functions. Then, we construct a new complex function, and take the simplified two expressions as the complex real part and the complex imaginary part respectively. Next, Euler's formula is used to simplify the complex number to the e-exponential function. Using the convolution formula, the function is transformed, and then the Fourier transform frequency shift characteristics are used to further simplify the expression. Finally, by taking the modulo of the result, the frequency domain spectrum of the system is expanded to obtain a super-resolution reconstructed image. Theoretically, when the structured light frequency is equal to the cutoff frequency of the system, the algorithm can double the lateral resolution of conventional microscopy systems. It is verified by simulation that the resolution of DIFF-SIM is nearly 1 time higher than that of wide-field imaging. Meanwhile, the super-resolution reconstruction effect of DIFF-SIM and FairSIM, the frequency domain reconstruction method of SIM, is the same. In a projected structured illumination microscope based on digital micromirror devices, spatial domain super-resolution reconstruction experiments were performed on fluorescent microspheres and bovine pulmonary artery endothelial cells. The system employs computer-controlled digital micromirror devices for fast fringe generation and uses multicolor light-emitting diodes for illumination. Firstly, the system resolution analysis experiment was carried out, and the system Point Spread Function (PSF) obtained by the fluorescent microspheres proved that the algorithm could expand the system resolution. The experimental results of the resolution expansion are close to the theoretical value. Then, super-resolution reconstruction of bovine pulmonary artery endothelial cells was performed, and the experimental results were compared using the frequency domain method FairSIM. The experimental results show that the DIFF-SIM algorithm can obtain super-resolution image reconstruction effects similar to FairSIM. In the defocus experimental verification of the groove of the coin, it is proven that the algorithm can eliminate the interference of the defocused background focal plane information similar to laser scanning confocal microscopy (LSCM). To evaluate the efficiency of the DIFF-SIM algorithm, a comparison of the FairSIM and DIFF-SIM algorithms is performed on the same computer, and the execution speed of DIFF-SIM is approximately 5 times faster than that of FairSIM. This study is conducive to expanding the application range of the SIM method, helping to take advantage of the technical advantages of SIM with low light dose and low phototoxicity, and has good application potential in dynamic imaging of living cells and long-term monitoring.
Nov. 25, 2022Vol. 51 Issue 11 1118002 (2022)
© Copyright 2018-2021 | Chinese Laser Press.
All Rights Reserved 沪ICP备15018463号-20