


 View fulltext

2022
Volume: 42 Issue 4
50 Article(s)

Heng-shan XU, Guan-qun GONG, Ying-jie ZHANG, Fei YUAN, and Yong-xia ZHANG
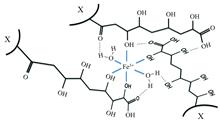
The divalent metal ion Cu2+ exceeds the standard in water sources and soils around many industrial and mining enterprises, causing deterioration of the ecological environment, and traditional chemical and biological treatments are prone to secondary pollution. Fulvic acid is composed of molecular clusters with similar properties. It has the characteristics of good water solubility, strong complexation and high chemical activity. It can efficiently control the distribution, migration and bioavailability of Cu2+ in the environment and is a hot spot in scientific research in recent years. Modern multispectral characterization analysis is helpful to reveal the changes in the structure-activity relationship between fulvic acid and metal ions, environmental effects and the migration behavior of heavy metal ions. It has important scientific value for studying the characteristics and mechanism of the complexation process of fulvic acid and Cu2+. This article reviews the basic theoretical research on the complexation of fulvic acid with Cu2+ in recent years. This paper further analyzes the characterization of fulvic acid and Cu2+ before and after complexation through infrared spectroscopy, fluorescence spectroscopy, differential spectroscopy, and interdisciplinary collaborative research. The effects of pH, ion concentration and the difference in composition of fulvic acid on the complexation process were discussed. The complex sites’ structural characteristics and action rules between fulvic acid and Cu2+ are revealed. Oxygen-containing acidic functional groups, such as carboxyl and phenolic hydroxyl, are the main complex sites between the complexation process of Cu2+ and fulvic acid. The carboxyl site has a significant ability to complex Cu2+. The phenolic hydroxyl site is helpful to increase the stability of the Cu2+and fulvic acid complex, and the nitrogen-containing functional group also plays an important role in the complex process. On this basis, this article further points out that the change of pH value will change the affinity of the active site of fulvic acid to Cu2+, the reason is mainly related to the ion exchange between Cu2+ and H+ on the active site and the electrostatic attraction of fulvic acid. The difference in FA components affects the complexation of FA and Cu2+, which is mainly reflected in the different numbers of phenolic hydroxyl, carboxyl and nitrogen-containing functional groups in different FA. The coexistence of Fe3+, Mg2+ and Al3+ the solution will have significant competition with Cu2+ at the active binding site of fulvic acid. At the same time, the concentration of non-strong adsorption ions such as K+ and Na+ in the solution environment increases, so that a large number of positively charged ions in the solution enter the electronic layer of fulvic acid nearby to enhance the charge shielding effect, inhibiting the complexation of Cu2+ and FA. Finally, this paper summarizes and looks forward to the problems and challenges of coexistence of scientific application of fulvic acid-related disciplines and technical theories in modern agriculture, ecological restoration and environmental governance.
Apr. 01, 2022Vol. 42 Issue 4 1010 (2022)
Yin-jing GUO, Lei WANG, Ming-yue SU, Ya-qi SONG, and Wen-hong LÜ
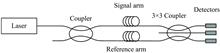
Fiber-optic hydrophone is a key technology in underwater acoustic research and has significant advantages in practical application. It is widely used in AUV navigation and positioning, resource exploration, seawater warning and other scenarios. The optical fiber hydrophone transmits the sound signal into the light signal. The optical signal needs to be demodulated to extract the sound pressure signal when receiving the signal. Several common signal demodulation algorithms are summarized in this paper, including the PGC demodulation algorithm, 3×3 coupler demodulation algorithm and heterodyne demodulation algorithm. Then, the basic principles and improved technology of various demodulation algorithms are described with a summary and comparison of their advantages and disadvantages. Finally, the challenges that the demodulation technology of fiber optic hydrophone faces have been put forward.
Apr. 01, 2022Vol. 42 Issue 4 1017 (2022)
Ruo-nan JIAO, Kun LIU, Fan-yi KONG, Ting WANG, Xue HAN, Yong-jiang LI, and Chang-sen SUN
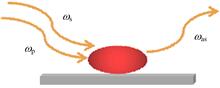
With the development of the plastic industry, microplastic, which is difficult to degrade in nature, became one of the main environmental pollutants. Moreover, it harms human health as it accumulates within the organisms and environment. Therefore, the detection and assessment of microplastics in the environment have been highly concern in recent years. Most the works first extract microplastics from samples by flotation, density or centrifugation separation system, and then find the microplastics under a microscope directly or combine with Raman spectroscopy, Fourier Transform infrared spectroscopy, Hyperspectral imaging and other methods for analysis and identification. Nonetheless, these methods require a long waiting time for pretreatment and could easily be affected by subjective factors. To identify whether the microplastics are in environmental samples or not quickly and accurately, we propose to use the multi-channel image acquisition, including white light channel imaging and Coherent Anti-stokes Raman Scattering (CARS) spectral imaging. CARS spectral imaging is a non-invasive and non-destructive real-time imaging method based on chemical bond vibration. Microplastic with a diameter of 10 μm polluted seawater and sand were simulated by the collected seawater/sand mixing with polystyrene microspheres. We detected the distribution of polystyrene in seawater intuitively through multi-channels image acquisition. The multi-channel image of polystyrene microspheres in the sand was collected and compared with the image by Raman spectroscopy. In the detection of Raman spectroscopy, the signal of polystyrene microspheres is easily interfered with by the fluorescence signal of sand, and only when the laser is focused on the location of polystyrene, does the weak signal can be detected. In the multi-channel image acquisition and detection, polystyrene microspheres can be seen in the sand, and we used a simple morphological analysis and filtering algorithm to make the microplastic signal obvious. Multi-channels image acquisition for microplastics detecting (in seawater and sand) without pretreatment is fast and simple, which has a certain potential for detecting microplastics in the environment value.
Apr. 01, 2022Vol. 42 Issue 4 1022 (2022)
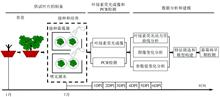
Plasmopara viticola (P. viticola)infection poses a serious threat to grape production. Early prevention and treatment is essential to the control of P. viticola infection. In order to detect this disease early, the relative biomass of P. viticola detected by PCR as the basis of P. viticola infection, the chlorophyll fluorescence images of 80 grape leaves inoculated with P. viticola and 80 healthy control leaves were collected for 6 consecutive days from the three continuous changes of photosynthetic physiological state, namely dark adaptation, light adaptation and dark relaxation, using the relative biomass of downy fungus as the basis of P. viticola infection. The sensitivity of chlorophyll fluorescence parameters to downy mildew infection was evaluated by one-way analysis of variance (ANOVA). The optimal feature subset of chlorophyll fluorescence parameters extracted by feature selection strategies was input to machine learning classifiers to establish the early detection model of P. viticola infection. The results showed that with the increase of DPI, the degree of downy mildew infection was deepened, and the chlorophyll fluorescence dynamics curves and parameters of healthy and inoculated leaves were significantly different from 2DPI (p<0.01). Due to the infection, the photochemical quenching rate of inoculated leaves decreased (Rfd decreased), and the photosynthetic efficiency decreased (Fv/Fm decreased). Leaf vitality and photoprotection ability continued to decline (NPQ and qN decreased), and the light energy absorbed by leaves was more released in the form of fluorescence (Ft and Fm increased). BP neural network model using the feature subset (qN-L3, RFD-L2, NPQ-L1 and Fv/Fm-D1) optimized by the SFFS algorithm had the best detection accuracy, and the detection accuracy of healthy, and inoculated leaves at 3DPI was 83.75%. The average accuracy of the whole experiment period for 6 consecutive days reached 85.94%. These results provide a fast and accurate method for photosynthetic phenotype analysis and early detection of grape downy mildew.
Apr. 01, 2022Vol. 42 Issue 4 1028 (2022)
Ling-ling ZHA, Wei WANG, Yu XIE, Chang-gong SHAN, Xiang-yu ZENG, You-wen SUN, Hao YIN, and Qi-hou HU
Measurement of CO2 concentration with high accuracy and precision is essential for monitoring local emission sources of greenhouse gases at regional and city scales. Based on Fourier transform spectroscopy and near-infrared solar absorption spectra collected by portable FTIR spectrometer, the column concentration of CO2 in the Hefei area from September 2016 to May 2020 was retrieved using the nonlinear least-squares algorithm. As the observation results show, the column concentration of CO2 has obvious seasonal variation, with the maximum value in spring, the fast decline in summer, and the minimum in autumn. The daily average value of XCO2 is between (401.23±0.60) and (418.41±0.31) ppm, while the monthly average value shows a seasonal amplitude of 6.96 ppm during 2017. XCO2 showed an increasing trend during the observation, with an annual growth rate of (2.71±0.66) ppm·yr-1. In order to verify the accuracy and reliability of portable FTIR spectrometer observations, we compared the observations with the high-resolution FTIR measurements. It is found that the mean deviation of XCO2 was about 1.32 ppm, the linear fitting coefficient was 1.08±0.03, and the correlation coefficient r was 0.97. Further, our data are compared with GOSAT satellite data, the average deviation of the two data is (0.63±1.76) ppm, and the correlation coefficient r is 0.86, showing a high correlation between ground-based data and satellite data. Also, ground-based observations in Shanghai were compared with the simultaneous observations in Hefei. The results showed that the variation of XCO2 in Shanghai is similar to our results. The daily average of XCO2 in Shanghai is between (411.87±1.07) and (416.63±1.70) ppm, and the value is between (415.09±0.84) and (417.80±0.67) ppm in Hefei in autumn. It is found that XCO2 in Hefei was slightly higher than that in Shanghai during the observation. The results provide the data for tracking carbon sources and sinks of greenhouse gases in the Hefei area.
Apr. 01, 2022Vol. 42 Issue 4 1036 (2022)

Dan-yang JIANG, Zhi-feng WANG, Cheng GAO, and Chang-jun LI
Given the tristimulus value of an object, its reflectance reconstruction has important applications in the field of cross-media color reproduction. Common algorithms for reconstruction reflectance, including the basis vector method, Wiener estimation method, weighted pseudo-inverse method, etc., are derived based on the reconstructed reflectance and the original reflectance as the reconstruction and evaluation objective. All algorithms map low dimensional tristimulus value or RGB to high dimensional spectral reflectance. Hence most of these algorithms need to be trained using a training dataset. However, in many application areas, color constancy or color inconstancy index (CII) should be considered in product design to ensure that the object is perceived as the same color under different lighting conditions. Object’s spectral reflectance determines the color constancy property of the object. Takahama and Nyatani developed a linear programming method for reconstructing reflectance based on the given tristimulus values so that the reconstructed reflectance has a better color constancy. However, test results showed that the reflectance reconstructed by this method has stair-like shape, which is much different from the real object reflectance. After that, Berns et al. further improved the Takahama and Nyatani method by introducing further constraints. It was found that the reflectance reconstructed by the improved method is smooth but heavily oscillated. Li and Luo proposed a smoothing constrained quadratic programming algorithm. The reconstructed reflectance is s smooth and close to the reflectance of real object color. In this paper, a new algorithm or more exactly, a new constrained nonlinear optimization algorithm is proposed to reconstruct reflectance based on the given tristimulus values so that the reconstructed reflectance is smooth and has a better color constancy property. The proposed method is tested using the reflectance dataset measured from 1 560 Munsell chips from Munsell Color System and compared with other methods. The comparison results show that our method is not only better than Takahama and Nyatani method, Berns et al. method and Li and Luo method in terms of color constancy index, but also better or similar to other methods in terms of root mean square error (RMSE) and good fitting coefficient (GFC). Therefore, the proposed method has important application in many industries with color constancy requirements for designing products.
Apr. 01, 2022Vol. 42 Issue 4 1044 (2022)

Ya-xiong HE, Wen-qi ZHOU, Bin ZHUANG, Yong-sheng ZHANG, Chuan KE, Tao XU, and Yong ZHAO
Laser-induced breakdown spectrometry (LIBS) is technically characterized by the atomic emission of laser-induced microplasma, and it is receiving attention and vigorous development in scientific research and industrial fields. As the ambient gas, argon has an important influence on the collision process of particles in the plasma evolution process, which determines the performance of LIBS technology analysis. It is of great significance to improve the LIBS technology and its application level to study the spectral characteristics of argon in depth with the spectroscopic diagnosis technology. This paper uses an echelle spectrometer to record time series spectral information to study the transient Ar plasma collision and decay process, including the radiation mechanism during plasma evolution and the time evolution characteristics of plasma electron number density and temperature. The results show that the spectrum is mainly composed of continuous at the initial stage of the interaction between laser and argon. After 0.6 μs, the spectrum is mainly composed of discrete transition radiation lines of argon atoms and ions. The evolution period of the argon atomic line is different from that of the ion line. The ion line is dominant in the delay time of 0~1.0 μs, and the atomic line is dominant in the 1.0~30 μs. Using Stark broadening and Saha-Boltzmann curve equation, the electron number density and temperature of plasma excited by 60, 80 and 100 mJ pulsed laser energy are calculated. The plasma electron number density decays rapidly within 0.2~2.0 μs delay time, and then decreases slowly during a longer delay time, reaching the same order of magnitude at about 4.0 μs. The plasma temperature (with 80 mJ laser energy) dropped rapidly from 18 000 K at the initial 0.2 μs to 13 000 K (2.0 μs), and slowly dropped to 12 000 K after 5.0 μs. In order to further verify and optimize the analytical performance of laser pulses for argon, the evolution of the signal-to-noise ratio of different characteristic spectral lines of argon with time was studied. The research results show that the argon atom line has a higher signal-to-noise ratio in the delay window of 2.0~6.0 μs, and the argon-ion line has a higher signal-to-noise ratio in the delay window of 0.1~1.0 μs.
Apr. 01, 2022Vol. 42 Issue 4 1049 (2022)
Li-sheng ZHANG
The surface plasma produced by the collective oscillation of conducting electrons in metal nanostructures can redistribute the electromagnetic field in time and space and redistribute the excited carriers. Graphene materials were prepared by the mechanical stripping method. The distribution of the layers in the two-dimensional region was studied by Raman spectroscopy. SERS enhancement of 2-naphthalene mercaptan (2-NT) as probe molecule on graphene substrate was studied. The results show that the Raman signal of the 2-NT molecule is enhanced on the graphene surface, and the SERS enhancement effect of graphene increases with the decrease of the number of layers. Based on graphene catalytic substrate, with the aid of SERS technology, the fingerprint is common. The photocatalytic reaction of 4,4’-dimercaptoazobenzene (DMAB) is generated by the real-time monitoring of p-Nitrobenzene thiophenol (4NBT) as a probe molecule driven by local surface plasma. Then, under the same experimental conditions, the DMAB can be produced by reverse chemical reaction under the plasma drive to generate para aminothiophenol (PATP) in situ. A uniform probe molecule 4NBT was assembled on the surface of a graphene catalytic substrate. The light Cui reaction was carried out by a certain wavelength focused laser to generate a new molecule DMAB. By this means, the specific DMAB molecular distribution or letters and Chinese characters information can be drawn on the micro nano-scale, and the micro nano-scale graphics drawing, and information encryption can be realized. Then, the graphics can be displayed and decrypted by mapping and two-dimensional imaging with the characteristic peak intensity of DMAB. In addition, the reverse photocatalytic reaction can be carried out by adding sodium borohydride on the encrypted substrate under the action of surface plasma and stimulated light to erase the micro nano scale graph and encrypted information.
Apr. 01, 2022Vol. 42 Issue 4 1058 (2022)
Zhou-xuan OUYANG, Ying-jie MA, Dou-dou LI, and Yi LIU
Primary bremsstrahlung spectrum of X-ray tube has serious influence for trace Cadmium analysis in traditional EDXRF. Secondary targets with different geometry sizes were studied by Geant4 code. To enhance the efficiency of Geant4 simulations, the simulation processes were divided into three stages. In the first stage, primary spectra at different tube voltages were acquired using Geant4 code to simulate electrons of different voltages hitting anode target. In the second stage, Te and BaSO4 of different kinds and geometry as secondary target materials, simulated. The simulation results show that when Te, whose Kα1 energy (27.468 keV) closes to the absorption limit of Cd (26.711 keV) is used as the fluorescence target material, the characteristic peak intensity of Te increases rapidly before 100 μm with the increase of target thickness, and tends to be stable after 150 μm. However, the signal to noise ratio (SNR) reaches the maximum value of 21.434 at 80 μm. Due to the self-absorption effect of the secondary target material, SNR declines slightly and becomes stable after reaching the saturation absorption thickness. In different application scenarios, the materials of the secondary target should be various. When there is no limit to the measurement time, the secondary target with greater fluorescence intensity should be selected. But, when the measurement time is relatively short, the secondary target of greater SNR should be selected. In the third stage, output spectra of the secondary target were used to activate sample containing 0.01% cadmium element. The output spectra of the Te element secondary target were used to activate samples, and the peak-to-background ratio of the Kα1 peak of Cd element was 8.28. The primary spectra were used to activate samples, and the peak-to-background ratio is 2.29. Although it has a great increase, the scattering peak of the Te element always influences the Kα1 peak of the Cd element. The BaSO4 was selected as secondary target material because the characteristic X-ray energy is farther away from the Kα1 peak of the Cd element. The decrease of the peak-to-background ratio of target element could be weakened caused by the matrix elements of the sample. The peak-to-background ratio is increased to 14.179. The activation effect can be further improved by increasing the tube voltage of the X-ray tube. The optimal peak-to-background ratio of 21.431 could be obtained at the 70 kV tube voltage.
Apr. 01, 2022Vol. 42 Issue 4 1064 (2022)
Wen-long QIAO, Liang ZHOU, Zhao-hui LIU, Yong-hui GONG, Le JIANG, Yuan-yuan LÜ, and He-tong ZHAO
Biological tissues are very complicated with strong scattering characteristics. The light-source of detecting physiological parameters of tissues is critical. Combined with the advantages of polarization imaging, this paper studies the multispectral polarization characteristics of biological tissues. We established uniform monolayer biological tissue samples based on the distribution of different particle sizes and simulated the scattering model with single-particle by combining Rayleigh and Mie scattering theory. Rayleigh theory has good forward and backward scattering symmetry; Mie theory has strong forward scattering characteristics. The two scattering models are closely related to the size parameter, a dimensionless quantity, depending on the incident wavelength and the size of scattered particles. Mie theory is generally used as the research model in biological tissues. We used a Monte Carlo method to simulate the transmission characteristics of polarized light in the tissue model. The wavelength range is 4001 000 nm. In this paper, we have simulated four typical polarization states, (horizontally polarized light, vertically polarized light, 450 linearly polarized light and right-rotated circularly polarized light). The experiment system used a white LED lamp as a light source. It used filters to obtain different wavelength beams, a color camera was used to record the image of the target, two groups of linear polarizers and right-rotated circular polarizers were used as polarizers and analyzers to test horizontally polarized light, and right-rotated circular polarized light with wavelengths of 450, 525, 550, 590, 610, 650 and 690 nm, respectively, and the target is our palm. Both simulation and experimental results show that with the increase of wavelength, the degree of polarization (DOP) of linearly polarized light after backscattering from skin tissue shows an overall upward trend, while that of circularly polarized light is on the decline. However, the overall DOP of circularly polarized light is higher than that of linearly polarized light, which indicates that circularly polarized light has better polarization retention than linearly polarized light in biological tissues and is more suitable for detecting physiological information. Our study has confirmed the multispectral characteristics of circularly polarized light and linearly polarized light transmitted in tissues, which provided theoretical support for obtaining multispectral polarization physiological parameters.
Apr. 01, 2022Vol. 42 Issue 4 1070 (2022)
Rui DONG, Zhuang-sheng TANG, Rui HUA, Xin-cheng CAI, Dar-han BAO, Bin CHU, Yuan-yuan HAO, and Li-min HUA
The extension of poisonous plants in alpine meadows is one of the main problems of the grassland ecosystem in the Qinghai-Tibet Plateau. The classification technology of poisonous plants in alpine meadows is of great significance for timely monitoring, scientific preventing and controlling changes in grassland communities. In recent years, poisonous plants species and harmful areas have increased rapidly. Traditional manual field surveys were time-consuming and laborious, and poorly represented the survey results. At the same time, poisonous plants have certain differences in geographical distribution, so it is not easy to conduct large-scale investigations by the workforce. Hyperspectral remote sensing technology has great advantages in the fine classification of poisonous plants due to its high resolution, multiple bands, integration of maps, and so on, which can meet the needs of fast, accurate, and large-scale acquisition of poisonous plants. Some scholars have carried out studies on the spectral reflectance characteristics of grassland plants, which proved that the spectral reflectance characteristics of plants could effectively distinguish their species. On the contrary, there are few reports on the selection of spectral reflectance characteristics variables of poisonous plants and the construction of a predictive classification model based on the spectral characteristics of poisonous plants. In this study, 11 kinds of main poisonous plants field spectrum data on alpine meadows, including Oxytropis ochrocephala, O latibracteata, Astragalus polycladus, Saussurea hieracioides, Ligularia virgaurea, Anaphalis lactea, Cirsium souliei, Stellera chamaejasme, Elsholtzia Densa, Aconitum gymnandrum, and Pedicularis cheilanrthifolia (in Tianzhu County and Maqu County, Gansu Province) were collect by using the SOC710VP near-infrared hyperspectral imager. The Savitzky-Golay convolution smoothing algorithm (SG) was applied to denoise the original spectral values, the first-order differential derivative (FD) was used to carry out spectral feature analysis, and the canonical discriminant analysis (CDA) was performed to sort the absolute values of the standardized score coefficients of 16 selected spectral feature variables. Then from the size of large to small, they were added to 5 algorithms, namely random forest (RF), support vector machine-radial kernel function (SVM-RBF), k-nearest neighbor classification (KNN), naive bayes (NB), and decision tree (CART) to construct classification models and screen the best feature variables, and the confusion matrix was used to evaluate the classification effects. The results showed that: (1) The overall classification accuracy of canonical discriminant analysis (CDA) for 16 spectral characteristic variables was 92.34%, R2=0.89; (2) The best classification spectral characteristic variables were selected as green peak amplitude (Mg), blue edge area (Ab), red edge amplitude (Mre), red edge area (Are), red edge position (Lre), NDVI2, and RVI1; (3) The selected 7 spectral characteristic variables were used to classify poisonous plants, and then the SVM-RBF has the best classification effects, with an accuracy of 96.45%.
Apr. 01, 2022Vol. 42 Issue 4 1076 (2022)
Ying AN, Jing DING, Chao LIN, and Zhi-liang LIU
Chlorophyll concentration in ocean waters is the main parameter for describing marine primary productivity, estimating phytoplankton abundance and variation, assessing environmental quality and forecasting ecological disasters. The general inversion model of chlorophyll products used by satellite remote sensing at home and abroad is the OCx (x=26) algorithms based on the intensity ratio of remote sensing reflection spectra in different bands. When applied to case-1 glasses of waters, the mean relative error on a global scale is about 35%. However, for case-2 waters with complex inherent optical properties and large regional differences, OCx algorithms have large errors or even fail. The previous research results show that the relative spectral height is beneficial to extracting the feature information and improving the signal-to-noise ratio of ocean color. However, the inversion model based on relative height still has problems, such as single band selection and a narrow application range. In China coastal, the construction method and application effect of the relative height model need to be further studied and verified. Based on in-situ measured chlorophyll concentration data and apparent optical parameters in Qinhuangdao coastal waters, after normalizing hyperspectral data and selecting characteristic bands, the inversion model has been constructed based on relative reflection depths of characteristic bands in this paper. The related coefficient between the inversion and the measured values is 0.883 58, and the mean relative error is 28.33%. Compared with the OCx algorithms, the average relative errors are reduced by more than 27%~50%. The model is verified, and the mean relative error is 31.17%. On this basis, correlation analysis was carried out on the multi-spectral data of HY-1C China Ocean Color & Temperature Scanner and the measured chlorophyll concentration, and the inversion model was established based on the relative reflection depths at 443 and 520 nm. The mean relative error of the model was reduced by 53.44% compared with that of the L2B product at the same time. The results show that the inversion model based on relative reflection depths can make full use of the information of chlorophyll characteristic bands, reduce the sensitivity to noise, and improve the signal-to-noise ratio of ocean color constituents, thus greatly improving the inversion accuracy and robustness of the model. This research has important scientific significance and substantial application value for constructing hyperspectral and multi-spectral inversion models of ocean color elements, measurement of water optical parameters, popularization and application of satellite products, estimation of primary productivity, ecological environment monitoring, hydrodynamic process research and other fields.
Apr. 01, 2022Vol. 42 Issue 4 1083 (2022)
Yue YU, Hai-ye YU, Xiao-kai LI, Hong-jian WANG, Shuang LIU, Lei ZHANG, and Yuan-yuan SUI
It is one of the necessary measures to achieve accurate regulation and scientific management of rice production using the characteristic bands of hyperspectral reflectance curve to construct spectral index and establish chlorophyll content inversion model.In order to establish a hyperspectral inversion model for relative chlorophyll content (SPAD values) of rice leaves at the jointing and booting stage, the hyperspectral data and SPAD values of rice leaves at the jointing and booting stage were obtained respectively. The original spectral reflectance curve was denoised utilizing using the wavelet analysis method, and the spectral index NAOC based on the integral operation was simplified to obtain a simple spectral reflectance curve based on dual-wavelength. The correlation coefficients between SPAD values of rice leaves at jointing and booting stage and the optimized spectral and transformed spectral indices constructed by the original reflectance spectrum R and mathematical transformation spectrum LgR, 1/R and R were calculated by the correlation analysis method. The two-dimensional matrix of correlation coefficients with the integration limit (a, b) as the abscissa and ordinate was obtained. Three band combinations with the highest correlation coefficient: R (641, 790) (0.872 6), R(653, 747) (0.871 7) and R (644, 774) (0.871 6) were selected to calculate 60 optimized spectral indices corresponding to the combination of three integral bands in 20 original samples, which were divided into modeling set and validation set according to the ratio of 2:1. Three SPAD inversion models of rice leaves were established: partial least squares regression model (PLSR), support vector machine (SVM) and BP neural network. The results showed that: the determination coefficients of the three SPAD inversion models were all greater than 0.79, and the normalizedroot mean square error was less than 5.4%. Compared with the other two models, BP neural network has the highest fitting degree and the highest prediction accuracy, the modeling set R2=0.842 6, NRMSE=5.152 7%; the verification set R2=0.857, NRMSE=4.829 9%. In general, it is feasible to establish an SPAD inversion model of rice leaves at the jointing and booting stage based on optimized spectrum and transformed spectrum index after simplified operation of dual-wavelength. The results of SPAD inversion of rice leaves by BP neural network are ideal and better than the other two inversion models, which have a certain reference value for improving the precision control technology of rice at jointing and booting stage establishing a scientific management system for rice production.
Apr. 01, 2022Vol. 42 Issue 4 1092 (2022)
Meng-jun LI, and Hui FANG
Surface plasmon has a history of more than one hundred years since its birth and has been a brand new discipline-plasmonics. Localized surface plasmon in metal nanostructures can gain very strong near-surface electric field enhancement and has been applied to many types researches successfully. However, there is relatively less study of the interaction between localized surface plasmon and magnetic field in incident light. This paper calculates the near-surface electromagnetic field enhancement of metal nanosphere-nanodisc gap based on the previous achievement. This paper shows that under the excitation of the single tightly radially polarized optical beam, the metal nanodisc can produce localized surface plasmon breathing mode and electric dipole moment mode, which give rise to the longitudinal electric field enhancement at the nanodisc center. And then, because of the resonance interaction of the metal nanodisc and localized surface plasmon electric dipolar moment of the metal nanosphere, a gap mode of localized surface plasmon resonance with efficient longitudinal electric field enhancement can be produced. Through carrying out the numerical simulation, this paper demonstrates that the near-surface longitudinal electric field of metal nanostructure gap mode can obtain 250 times electrical field enhancement relative to the valid transverse electrical field that is used to excite the breathing mode, and the enhancement factor of near-surface magnetic field could be 170. In order to present more clearly the character of the spectrum and the near-surface electromagnetic field distribution of this new metal nanostructure, the near-surface electromagnetic field distribution and the resonant wavelengths of this new metal nanostructure are also studied. The calculation results show that the proposed metal nanosphere-nanodisc nanostructure owns an obvious advantage on the local near-surface electromagnetic field enhancement and a relatively large frequency spectrum. Due to the electromagnetic field enhancement advantage of the metal nanostructure proposed by this paper, the future is not without hope that the results here could be applied to more and more researches, especially biomedicine, and provide a bit of reference in order to fight for novel coronavirus.
Apr. 01, 2022Vol. 42 Issue 4 1098 (2022)
Zhuan-ping ZHENG, Ai-dong LI, Jun DONG, Yan ZHI, and Jia-min GONG
Polymorphs refer to substances with the same chemical composition but in more than one crystal form. These polymorphs exist widely in nature, especially in pharmaceuticals. These polymorphs have the same chemical molecular composition, but their physical and chemical properties are different, ultimately affecting the effect of pharmaceuticals. In recent years, with the generation of terahertz (THz) wave becoming a conventional technology, the application fields of terahertz time-domain spectroscopy (THz-TDS) has been gradually broadened. THz wave is related to intramolecular interaction mode and closely related to weak interaction modes such as hydrogen bond and van der Waals force. THz radiation can induce low-frequency bond vibration, crystal phonon vibration, hydrogen bond stretching and torsional vibration, and the collective vibration modes of many organic molecules are located in this region, especially pharmaceutical molecules. Thus in this paper, THz-TDS was used to study the THz absorption spectra of maleic hydrazide polymorphs (MH2 and MH3) in the range of 0.252.25 THz. The experimental results show that the THz absorption peaks of MH2 and MH3 are completely different. Specifically, MH2 has three characteristic absorption peaks, which are located at 0.34, 1.41 and 1.76 THz. MH3 has two characteristic absorption peaks at 0.75 and 1.86 THz. These results show that the polymorphs of maleic hydrazide can be distinguished and characterized by their THz absorption peaks. Then, to analyze the THz experimental peaks, solid-state density functional theory (DFT) is used to simulate. In matching experimental and theoretical spectral data, the origins of the THz absorption peaks are analyzed and discussed. The results suggest that the THz absorption peaks of MH2 and MH3 are very sensitive to their three-dimensional structures, and the absorption peaks all originate from intermolecular interactions Finally, the THz spectra of the commercial tablets of maleic hydrazide were tested. By comparing the THz absorption peaks between MH2(MH3) and Qingxiansu, it is found that the crystal form of Qingxiansu is MH3. This result shows that THz-TDS is a potential tool for detecting pharmaceutical polymorphism. Our research is expected to promote the detection of maleic hydrazide polymorphs in industrial production and clinical application.
Apr. 01, 2022Vol. 42 Issue 4 1104 (2022)
Rui ZHANG, Xin-yi TANG, and Wen-qing ZHU
Short-wave infrared (referred to as SWIR) generally refers to the 9001 700 nm light band, which is invisible to the naked eye. This band’s mainstream detectors are InGaAs, which are mainly used for military, biological, biological and material spectral analysis. In the field of biological tissue observation, short-wave infrared fluorescence imaging is characterized by small optical damage to biological tissues, large imaging depth, high imaging signal-to-noise ratio, and high spatial and temporal imaging resolution, making bio-optical imaging based on InGaAs detectors biological Organize research focus in the field of observation. The bio-optical window’s multi-window and wide-spectrum fluorescence spectrum characteristics allow us to collect multi-spectrum spectral images of biological tissues to observe the structural characteristics of biological tissues under different spectral illuminations, which further facilitates scientific knowledge research. In this paper, a multi-spectral imaging system of mouse vein based on InGaAs detector was designed for the spectral characteristics of the bio-optical window, which can collect the vein images of mice without contact and help observe the infrared spectrum of mouse veins. The system based on the InGaAs detector we designed can achieve an integration time of up to 5 000 ms. By extending the integration time, the signal-to-noise ratio of vein imaging is significantly improved, and the detector spectral response characteristics cover the second bio-optical window and a third bio-optical window. From the imaging characteristics of optical microscopy and the characteristic expression of vein tissue in the image, a new single-spectrum multi-focal fusion algorithm is designed to which can well realize the infrared spectrum observation of vein images. This paper proposes a novel multi-focus fusion algorithm based on a multi-scale gradient domain guided filter (GDGF) to compensate for the imaging defects of microscopic characteristics. The multi-scale gradient domain guided filter algorithm extracts the focus pixel region, and then the fusion decision function is calculated. Finally, the fusion decision function is definedby the gradient domain guided filter algorithm, and finally, the final decision fusion function of our fusion algorithm is obtained. Experiments show that the short-wave infrared InGaAs detector designed by us well meets the requirements of fluorescence imaging of mouse veins and achieves spectral imaging of multiple bands including 1 100, 1 250 and 1 350 nm for mouse veins, as well as spectral imaging in multi-focus with the same laser illumination. Meanwhile, the fusion algorithm we designed can well extract the focusing area of the mouse vein image, which can fuse the multi-focus image and reduce the introduction of noise at the same time, thus achieving high-quality global vein imaging.
Apr. 01, 2022Vol. 42 Issue 4 1109 (2022)
Zi-yue NI, Da-wei CHENG, Ming-bo LIU, Yuan-bo YUE, Xue-qiang HU, Yu CHEN, and Xiao-jia LI
After designing a thermal desorption-enrichment device, the mercury in the solution could be enriched, and the sensitivity could be improved when tested by X-ray fluorescence. The test process was as follows: mercury would be desorbed at high temperature and then adsorbed selectively into the filter membrane when passing through it. After that, the membrane was tested with a spectrometer to calculate the concentration of mercury in sample finally. The thermal reduction temperature of mercury can be lowered by increasing the residence time by adding dolomite into the thermal pipeline, and in the presence of a mercury stabilizer, the desorption can be realized by heating to 600 ℃. At the same time, the test conditions of the thermal desorption-enrichment were studied, the thermal-desorption time and the test time for the spectral instrument were chosen, the injection volume and the gas flow rate of pumping were optimized. The signal amplified apparently for this method compared with testing directly and increased with the increase of sample volume, which was 11.78 times higher when the injection volume was 200 μL. Different mercury concentrations were used to draw the calibration curves, and the linear correlation coefficient was 0.993 7. A solution was tested 11 times with 0.05 μg·mL-1 and the relative standard deviation was 4.048%. When a blank solution was tested, the detection limit and quantification limit were calculated as 0.004 μg·mL-1 concentration and 0.015 μg·mL-1 respectively. Mixed solutions were prepared to study the interferences of other ions. The results showed that mercury would not be affected by other ions even when their concentrations were up to 100 times. The river water and tap water were collected, and the standard recovery rate of this method was tested, which was between 94.3% and 102.6%. The device can improve the detection limit for X-ray fluorescence and detect mercury in sewage.
Apr. 01, 2022Vol. 42 Issue 4 1117 (2022)
Liang SHENG, Liang-jing YUAN, Dong-ling LI, Xiao-fen ZHANG, Qiao-chu ZHANG, Lei YU, and Yun-hai JIA
There are reports on the analysis of single type inclusions in steel by spark emission spectroscopy technology, but it is always a hard issue that complex inclusions analysis in steel by spark emission spectroscopy. The complex inclusions in steel are in two forms, one type inclusion containing another type inclusion or one type inclusion couples with another type inclusion. Nevertheless, distinguishing the isolated two types of inclusions and the complex inclusion is difficult by spark emission spectroscopy technology. In this paper, spark source original position distribution analysis (OPA) is used to analyze complex inclusions in the cross sections of a high railway wheel. The OPA technology can characterize the distribution of compositions and inclusions in a large area by the high-speed data acquisition and the analysis of element’s spectrum signal excited by continuous excitation on the scanning process. At the same exciting position where both Al2O3 inclusion spectrum signal and MnS inclusion spectrum signal exist, through sequential spectrum signal correlation between Al2O3 inclusion and MnS inclusion, the complex inclusions information can be obtained at the position corresponding to time point. According to a good linear relationship between the spectrum intensity over a threshold value and average area of inclusions, the area of Al2O3 inclusion and MnS inclusion in Al2O3/MnS complex inclusion are obtained. The sum of Al2O3 and MnS is the area of Al2O3/MnS complex inclusion at the same position. The scanning electron microscope (SEM) method is also used to analyze the Al2O3/ MnS complex inclusions in a limited area. The area of each complex inclusion by SEM corresponds to the normalized area of inclusion by OPA analysis, both the SEM and the OPA methods are in good consistency, and the linear correlation coefficient is better than 0.99. The results of the other two parts B2 and B3 of the cross-section of high-speed rail wheel measured by OPA for verification are also matched with the results obtained by SEM. In other words, in the analysis of small area Al2O3/MnS complex inclusions, the normalized results of OPA analysis can meet the characterization also. Moreover, because the OPA can analyze the whole area of a large sample, more large Al2O3/ MnS complex inclusions can be detected. The weak point is that the detection of leakage of large inclusions by SEM since the smaller testing area can be avoided. An effective method for the Al2O3/MnS complex inclusions analysis in large steel components by OPA is developed.
Apr. 01, 2022Vol. 42 Issue 4 1122 (2022)
Jia-yi LI, Mei YU, Mai-quan LI, Yu ZHENG, and Pao LI
Chrysanthemum is derived from the capitulum of Chrysanthemum. Chuju, Gongju, Hangju and Boju are common medicinal chrysanthemums. Different chrysanthemum varieties have great similarities in appearance, and it is difficult for laypeople to identify them accurately only by naked eyes. The conventional instrumental analysis method has the disadvantages of high detection cost, long analysis time, and destructive treatment of samples, which affects the secondary sales of the products. As a green, simple and rapid detection technology, near-infrared spectroscopy has made great progress in traditional Chinese medicine identification. This study established a nondestructive identification method of different Chrysanthemum varieties based on portable near-infrared spectrometer and chemometric methods. The spectra of complete and powder samples of Chuju, Gongju, Hangju and Boju were collected by grating portable near-infrared spectrometer. The single and combined spectral pretreatment methods were used to eliminate the interferences in the spectra. The identification models of different Chrysanthemum varieties were constructed by combining principal component analysis, soft independent modeling of class analogy and Fisher linear discriminant analysis methods. The results show that: due to the restrictions of the current measure instruments and the difference of sample particle size and distribution, there are obvious interferences of background, baseline drift and noise in the spectra. The baseline drift interference is particularly serious for the analysis of the complete samples. The principal component analysis combined with spectral pretreatment methods could not identify different varieties of chrysanthemum. The best identification accuracy of complete samples was only 8.33%, and that of powder samples was 52.38%. The soft independent modeling of class analogy can obtain more accurate identification results with preprocessing methods. The identification accuracy of complete sample data is 95% with first derivative+multiple scattering correction, while the identification accuracy of powder sample data is 92.5% with the original data. The results of Fisher linear discriminant analysis are the best. When the complete sample spectra were optimized by continuous wavelet transform, the identification accuracy was 97.5%. When the original spectra of powder samples were used, the identification accuracy could reach 100%. The above results show that the complete and powder samples’ identification results are consistent when the appropriate pretreatment and modeling methods are used. Based on the grating portable near-infrared spectrometer combined with chemometrics methods, the accurate identification of different Chrysanthemum varieties can be realized, which provides a new way for the nondestructive identification of food and drug homologous products.
Apr. 01, 2022Vol. 42 Issue 4 1129 (2022)
Yue ZHAO, Feng-xiang MA, An-jing WANG, Da-cheng LI, Yu-mei SONG, Jun WU, Fang-xiao CUI, Yang-yu LI, and Zhi-cheng CAO
Traditional fluorescence analysis and detection methods of transformer insulated oil quality, which use fluorescence spectrophotometer to collect the full bands’ fluorescence spectrum of the oil sample and establish the diagnostic model of transformer operation states using the full bands’ fluorescence characteristics of insulating oil with a different aging degree, have the problems of large volume and the high price of photometer and the inability to realize real-time monitoring due to a long time of spectrum acquisition, a new method to detect the quality of transformer insulating oil based on the fluorescent double-color ratio to extract fluorescence characteristic dual band information and establish fault diagnosis model of transformer operation was raised to solve it. Thus, the traditional fluorescence spectrophotometer can be replaced by custom filters and visible photodetectors to realize the rapid acquisition and processing of double-color fluorescence information, which can meet the on-line monitoring and reduce the hardware cost. The aging of transformer insulating oil caused by discharge breakdown fault was analyzed by fluorescence analysis. Different discharge breakdown conditions were simulated. NYNAS oil samples with different discharge breakdown times (10, 30, 50, 70, 90 and 120 min) were prepared as fluorescence detection targets. Fluorescence emission spectra at different excitation wavelengths were collected by fluorescence spectrophotometer, and the optimal fixed excitation wavelength was found to be 280 nm. The 3-point moving mean smoothing method was used to smooth the fluorescence spectrum of the samples and by analyzing the variation of the fluorescence characteristic peak of the oil sample under different discharge breakdown times, bands of 380388 and 399407 nm were selected as the double-color information extraction band. The fault diagnosis model of transformer insulated oil discharge based on fluorescent double-color ratio was established by least-square curve fitting. The study results demonstrate the effectiveness of the fluorescent double-color method on the fault diagnosis of transformer insulated electric oil breakdown, which provides a theoretical and practical basis for establishing a small, low-cost, fast and effective online monitoring system.
Apr. 01, 2022Vol. 42 Issue 4 1134 (2022)
Pei-chao ZHENG, Ran-ning LIU, Jin-mei WANG, Chu-hui FENG, Yu-tong HE, Mei-ni WU, and Yu-xin HE
As a new type of spectroscopic detection technology, Solution Cathode Glow Discharge technology is widely used to analyse and detect environmental pollutants. Although this technology has the advantages of simple structure and low cost, its sensitivity needs to be improved in detecting heavy metals. In response to the above problems, this paper built a Hydride Generation-Solution Cathode Glow Discharge spectroscopy measurement system to achieve simple and efficient detection for trace mercury (Hg) and tin (Sn) in water. In order to obtain a better detection effect, 270.64 and 253.65 nm were selected as the characteristic analysis lines of Sn and Hg in the experiment. The parameters of the excitation source are configured as the distance between electrodes of 3.5 mm, the discharge current of 60 mA, and the electrolyte flow rate of 2.12 mL·min-1. At the same time, in the experiment, the relevant experimental conditions affecting the hydride reaction were studied, and the optimal sodium borohydride concentrations of Sn and Hg were 2% and 1.5%, the carrier gas flow rate was 141.50 and 183.95 mL·min-1, and the pH value of the sample solution is 1.0. Subsequently, in order to further analyze the influence of coexisting ions in the water on the detection performance of the system, the experiment evaluated Pb2+, Ca2+, Zn2+, Cr3+, Cd2+, Na+, K+, Mn2+, Mg2+, Fe3+ and Cu2+ on the Hydride Generation-Solution Cathodic Glow Discharge technology detects the interference of Sn and Hg. The results show that only Cu2+ interferes significantly with detecting two elements. At the same time, Pb2+ interferes with detecting Hg to a certain extent, and other coexisting metal ions show no obvious interference. Based on the optimization of the above experimental conditions, the Sn and Hg calibration models were established using the standard external method under the best experimental parameters, and the detection limits of Sn and Hg were calculated to be 6.85 and 1.05 μg·L-1. The relative standard deviations were all less than 3% (n=10). The above results indicate that the Hydride Generation-Solution Cathode Glow Discharge technology shows good analytical performance in detecting Sn and Hg. Moreover, this method has the advantages of small size, low cost, and strong anti-interference ability, and it is expected to provide a simpler and more efficient method for detecting heavy metals in water bodies.
Apr. 01, 2022Vol. 42 Issue 4 1139 (2022)
Hao LIANG, Wei-xin XU, Xu-hui DUAN, Juan ZHANG, Na DAI, Qiang-zhi XIAO, and Qi-yu WANG
Grassland, as an important part of the ecosystem in the Qinghai-Tibet Plateau, plays an ecological indicator role. However, during the non-growing season, it generally didn’t monitor or observe alpine grass in winter. It could be a great gap to develop the methods of grassland monitoring and its application in winter. PROSAIL, a physical radiation model, can quantitatively describe the relationship between various vegetation parameters and canopy reflectance spectra. In this study, the latest version of the PROSAIL-D model and ground observed data were applied to explore the thresholds of critical range for 10 parameters of withered grass affected by reflectance spectrum. Based on the reflectance spectrums and the corresponding character’s parameters of withered grass that were obtained in the field, 15 000 possible withered grass spectrums were simulated by the PROSAIL model. Compared to the difference of reflectance spectra between withered grass and green grass observed in winter and summer respectively, it is found that a clear difference displayed on visible and near-infrared bands and with a significant linear in 4001 300 nm spectral range for withered grass in winter in Qinghai-Tibet Plateau. On that basis, we proposed a method to distinguish the withered and green grass using the difference between red and green spectral reflections. It can be considered as a withered grass spectrum while the difference is greater than 0. Furthermore, a dataset of potential withered grass spectrum was established by two-steps identification from 15 000 possible spectrums based on the methods described above. The potential withered grass spectrums are correlated closely to the observed spectrums with a whole range of 4002 500 nm, and the R2 of all the simulated spectrum lines was between 0.904 and 0.994. By EFAST method and global sensitivity analysis, the brown pigment, carotenoid, anthocyanin, leaf structure and hot spot were identified as non-sensitive factors that respond to the withered grass spectrum. Finally, PROSAIL model was run again in OFAT (One Factor at a Time) with 99% confidence interval as the criterion and cosine distance as the evaluation function. The parameter threshold intervals of the sensitive factors of withered grass are estimated as: leaf area index of 0.20.89, chlorophyll content in 01.29 μg·cm-2, the average leaf angle between 11°90°, equivalent water thickness from 0.000 1 to 0.005 cm, dry matter content within 0.0080.05 g·cm-2.The results provide some important parameters and further understanding of grass characteristics in winter, and it will strongly promote the application in remote sensing monitoring.
Apr. 01, 2022Vol. 42 Issue 4 1144 (2022)
Shuang-cheng WU, Pu CHENG, Ting-ting LI, Yang YANG, Fu-de TIE, and Pu-jun JIN
The Haiqu Cemetery in Rizhao city, Shandong province, was one of the top ten great archaeological discoveries of 2002, where roughly 500 lacquerwares with high historical, scientific and artistic value were excavated. Most of them, lacquer boxes exhibit properties with complicated shapes and exquisite representing the highest level of lacquering craft at that time. According to the cross-section of lacquer film, a multilayer structure is observed, including a thick Qihui layer, thick undercoat layer and colored thin paint layer. Mercury sulfide (HgS) is employed as pigment for the red lacquer film and red pattern, and the Qihui layer uses clay and bone-ash as inorganic fillers. The FTIR diagrams show a strong homogeneity between the analyzed ancient lacquer film and simulated lacquer film produced by modern lacquer raw, and a significant difference about peaks at 400~1 000 cm-1 occurring in ancient-lacquer film corresponding to the infrared absorptive bands of quartz. UV-Vis absorption spectra reveal the absorption in the range 260~265 nm for π→π* transition K band with conjugated π system and the other absorption in the range 300~320 nm for n→π* transition R band of bonds. The disappearances of the K band in some samples reflect the serious degradation for those samples, and the general enhancement of the R band reflects continuous oxidation occurring in these ancient lacquer films in long-term burial conditions. This research will benefit to understanding the characteristics of Han Dynasty lacquering technology and revealing the degradable properties of ancient lacquer film enlightening for their research, conservation and duplication.
Apr. 01, 2022Vol. 42 Issue 4 1150 (2022)
Xue-ying LI, Zong-min LI, Guang-yuan CHEN, Hui-min QIU, Guang-li HOU, and Ping-ping FAN
The distribution of water in flat tidal sediments will change greatly in space and time, and the changes will lead to the changes of biogenic elements in sediments. Therefore, the tidal flat sediment water content data are monitored in real time, accurately and quickly, which is of great significance to understanding the tidal flat characteristics, grasp the information of tidal flat biogenic elements, and develop tidal flat resources. This paper collected 115 samples of intertidal sediments from Dongdayang village, Qingdao city. The visible near-infrared spectra and moisture content of fresh samples, air-dried for 4 weeks and 8 weeks were measured. The db10 and sym6 wavelet basis were used to transform the original spectrum, and partial least squares regression was used to establish the tidal flat sediment moisture content model. The low-frequency information An and high-frequency information Dn (n=1, 2, …, 10) of the original spectrum were obtained by 10 order wavelet transform. S- Dn was calculated by the difference between the original spectrum S and Dn. The moisture content models were established using An, Dn and S- Dn, respectively, and the results were analyzed. The original spectrum model’s RP2, RMSEP and RPD were 0.841, 2.767 and 2.481. By analysing low-frequency and high-frequency information, after db10 wavelet basis transforms, the useless information was mainly concentrated in D3 and D4, and the accuracy of the moisture content model established by removing D3 and D4 was significantly improved, RP2 was 0.878, RMSEP was 2.501, RPD was 2.749. Through the analysis of sym6 wavelet basis transform, the useless information was mainly concentrated in D5 and D9, the RP2, RMSEP and RPD by removing D5 and D9 were 0.87, 2.475 and 2.768. Therefore, by analyzing the low-frequency and high-frequency information using wavelet transform, the interference information of sediment moisture content can be effectively found, and the feature information can be extracted. The more accurate the tidal flat sediment moisture content model is established, it provides a theoretical basis for real-time and dynamic monitoring of tidal flat sediment moisture content.
Apr. 01, 2022Vol. 42 Issue 4 1156 (2022)
Ai-yang LI, Liang FU, and Lin CHEN
Plant essential oils are naturally complex compounds extracted from aromatic plants with volatile and tangy aromas as secondary metabolites of aromatic plants, and their diverse biological activities are widely used in the pharmaceutical and cosmetic industries. Plant essential oils are highly permeable and can penetrate skin tissue in an active molecular state and enter the bloodstream after absorption via the lymph glands. The heavy metal elements they contain are also highly susceptible to the entry of plant essential oils into the human body, posing a potential threat to health. This paper used nitric acid and hydrogen peroxide for microwave digestion of plant essential oils. In the dual-mode of multimode sample introduction system (MSIS), the contents of vapor forming heavy metal elements As, Sn, Sb, and Hg and non-vapor forming heavy metal elements Cr, Ni, Cd, and Pb were determined by inductively coupled plasma optical emission spectrometry (ICP-OES). Hydrochloric acid was selected to acidify the sample and reduce the oxidized analytes in the sample. L-cysteine/tartaric acid was added online to improve the vapor generation efficiency. Sodium borohydride/sodium hydroxide was selected to transform As, Sn, Sb, and Hg into the vapor state in MSIS. Because of the multiple or single spectral overlap and background interference in the analysis process, the pure solutions for the blank, analyte and the expected interferences are measured in the sample, and the fast automatic curve fitting technology (FACT) was constructed according to the obtained spectral response data by deconvolution. Analytical spectral lines were separated from interference spectral lines to realize real-time correction of spectral overlap interference and background interference. The method’s accuracy was evaluated by the spike recovery experiments and comparison with inductively coupled plasma mass spectrometry (ICP-MS). The method detection limit (MDL) of analyte was between 0.38~11.2 μg·kg-1, the spiked recovery was 95.4%~104%, the relative standard deviation (RSD) was 1.9%~4.9%, and the relative error (RE) of the comparative analysis ranged from -2.1% to 2.7%, indicating that the method was accurate and reliable with high precision. The heavy metal elements in eight plant essential oils were analyzed, and the levels of As, Hg, and Pb in all plant essential oil samples were well below the maximum limit standards established by GB/T 26516-2011, while the levels of Cr, Ni, Sn, Cd, and Sb, the heavy metal elements in plant essential oils, although no limit standards were established, were at extremely low levels. MSIS has the dual functions of traditional atomization and vapor generation. It does not need to switch different sampling systems when analyzing vapor forming elements and non-vapor forming elements. It can meet the needs of high-throughput analysis of trace heavy metal elements in large quantities of plant essential oils.
Apr. 01, 2022Vol. 42 Issue 4 1162 (2022)
Zhi-chao YANG, Jing CAI, Hui ZHANG, and Lu SHI
Rapid detection of drugs plays an important role in restraining the spread of drugs and cracking down on drug crimes. Surface Enhanced Raman Spectroscopy (SERS) technology has many advantages such as fingerprint identification, fast detection speed, less sample consumption, no damage, high sensitivity and so on, which has attracted much attention. Its characteristics are especially suitable for the rapid detection and law enforcement of public security organs on the spot. This paper used gold nanoparticle sol as the enhancement reagent to enhance the Raman spectrum. Six solutions of amphetamine, ketamine, fentanyl, heroin, cocaine and methamphetamine were prepared by 1 μg·mL-1. The volume ratio of drug solution, enhancement reagent and NaCl solution was 20:6:5, and 30 μL of the mixed solution was dropped on the surface of the slide. Let dry in the air and wait for inspection. Five samples were made for each drug solution, and Raman spectral data of 10 points were randomly collected for each sample. 300 groups of Raman spectral data of 6 drug solutions were collected, and 60 groups of Raman data were randomly selected as the training set. The model was trained by using the training set data. The remaining 240 groups of data were used as test sets to test the classification effect of the model. After pre-experiment comparison, 785 nm laser was selected as the excitation light source in the experiment, 50× objective lens was used, the laser intensity was 3.0 mW, the exposure time was 0.2 seconds, and the scanning times were 1 000 times. The bands from 400 to 1 700 cm-1 were selected for test and research. Savitzky-Golay method was used for smoothing and de-noising Raman data, and the airPLS method was used for baseline correction to complete 0-1 normalization of data. Principal component analysis (PCA), variance screening, genetic selection algorithm and mutual information method were used to process the dimensioning of the data. Modeling training was carried out by the four support vector machine algorithms, random forest, artificial neural network and nearest neighbor respectively. The classification effect of the model was tested by the test set data, and the average accuracy was obtained by repeating 10 times. The results show that the accuracy of all classifiers is more than 95% when the principal component is 5, after the dimension reduction of Raman spectral data by the PCA method. Among the three bands selection methods, the combination of genetic selection algorithm and SVM classifier has higher accuracy. The classification accuracy of the combination of 5 Raman bands screened by the genetic selection algorithm has reached more than 95%, and the accuracy of the combination of 25 Raman bands has reached 99%. As a band selection algorithm, genetic selection algorithm can reduce the dimension of Raman spectral data collection and have stronger interpretation and more important significance, which provides a reference for the rapid detection technology of drugs.
Apr. 01, 2022Vol. 42 Issue 4 1168 (2022)
Chu-han CHEN, Yang-sheng ZHONG, Xian-yan WANG, Yi-kun ZHAO, and Fen DAI
The cost of identifying male and female cocoons by NIR is high, and the cost can be reduced by selecting useful features. Since there is a nonlinear relationship between the NIR spectra of female and male cocoons, a wrapper feature selection method, Bootstrapping Re-weighted Sampling Support Vector Machines (BRS-SVM), was proposed. The diffuse transmission NIR spectra of silkworm cocoons were collected by NirQuest512 NIR spectrometer. The heat map of characteristic importance was obtained by modeling the whole band of the test set, and the heat map obtained the range of important characteristic bands. Then, in the range of important characteristic bands, the single band features and continuous band area features were selected by BRS-SVM, Model-based ranking support vector machines (MBR-SVM), Model-based ranking Logistic Regression feature sorting method (MBR-LR), Recursive feature elimination (RFE), successive projections algorithm(SPA), Genetic Algorithm(GA), and then the support vector machines (SVM) and Logistic Regression (LR) sex classification models were established respectively. According to the characteristic importance heat map, it is found that the important area of male and female classification of silkworm cocoon was within 9001 399 nm. We used this band to build the SVM model, and achieved 99.40% accuracy. BRS-SVM was used to select 5 single-band features. The accuracy of the test set is 89.56%, which is 2%4% higher than other feature selection methods. RS-SVM was used to select 27 single-band features, and the accuracy of the test set of the SVM gender classification model was 94.97%, which reached the requirements of production conditions. The accuracy of modeling test set by BRS-SVM was 94.43% for 14 continuous band features. In the case of selecting a small number of features, our proposed BRS-SVM is superior to other methods. Using BRS-SVM to select a small number of features, we can establish a good performance of the female and male cocoon classification model, effectively reduce the cost, has important practical significance.
Apr. 01, 2022Vol. 42 Issue 4 1173 (2022)
Tao WANG, Jian-xun LIU, Xiao-tian GE, Rong-xin WANG, Qian SUN, Ji-qiang NING, and Chang-cheng ZHENG
In growing InGaN/GaN multiple quantum wells (MQWs) with the technique of metal-organic chemical vapor deposition (MOCVD), the introduction of an appropriate amount of H2 into the N2 carrier gas for the growth of the GaN barrier layers can effectively improve the crystalline quality of the well/barrier interface and therefore enhance the luminescence efficiency of the quantum wells. In this work, we carried out detailed photoluminescence (PL) spectroscopic measurements on the luminescence properties of InGaN/GaN MQWs in the device structure for blue-light laser diodes, and the effects of H2 in the carrier gas for GaN barrier growth on the MQWs, including the improved interface quality, the enhanced luminescence and the underlying mechanisms, have been investigated. The PL spectra of the InGaN/GaN MQWs acquired at room temperature reveal that the introduction of 2.5% H2 in the N2 carrier gas leads to increased emission efficiency by 75%, blue-shifted peak energy by 17 meV, and narrowed full width at half maximum (FWHM) by 10 meV. With the PL spectra measured at varied excitation powers, the quantum-confined Stark effect (QCSE) and band-filling effect on the emission performance of the MQWs have been distinguished, and the QCSE effect is found to dominantly determine the emission energy and width, which can be effectively reduced by the introduction of H2. Upon the complete screening of the QCSE effect, the peak energy of the MQWs emission is located at 2.75 eV. The dependence of the PL spectra on temperature indicates that the introduced H2 in the carrier gas can also reduce the carrier localization effect and narrow the energy fluctuation of the well potential, which leads to the narrowed PL spectral width in the samples grown with the mixture of H2/N2 carrier gas. The variation of the PL intensity with respect to temperature reveals that the physical nature of the nonradiative recombination centers at the interface is not influenced by the introduction of H2, but the amount of these centers is greatly reduced, which accounts for the improved emission efficiency. The results of time-resolved PL measurements exhibit that the introduced H2 in the carrier gas has no impact on the nonradiative recombination lifetime, but causes a shorter radiative recombination lifetime, which further confirms the influences of H2 introduction on both QCSE screening and nonradiative recombination centers. The in-depth analyses of the PL results have revealed that the introduction of H2 in the N2 carrier gas for GaN barrier growth can significantly improve the crystalline quality of InGaN/GaN MQWs and therefore enhance the light emission performance. This work has demonstrated PL spectroscopy as a powerful technique in characterizing the optical properties of semiconductor quantum structures, and the spectral findings could provide helpful insight into the growth of InGaN/GaN MQWs.
Apr. 01, 2022Vol. 42 Issue 4 1179 (2022)
Yu-qing YANG, Jiang-hui CAI, Hai-feng YANG, Xu-jun ZHAO, and Xiao-na YIN
Based on the spectral data classified as Unknown by LAMOST DR5 Pipeline, the characteristics of low-quality spectra are extracted, and clustering analysis is conducted in this paper. The main work includes: (1) Feature extraction based on influence space and the data field. Firstly, a large number of small clusters are extracted from the low SNR spectrum based on influence space; secondly, each small cluster’s data field is calculated, and the spectrum is sorted using the above field; and then, access the sorted spectrum and the members in its small cluster to obtain the characteristic spectrum. (2) Carry out K-means clustering with the above characteristic spectrum and statistics on the sky area, observed visual ninety, the signal-to-noise ratio in each band, brightness, and spectrometer/fiber distribution for each class of targets. (3) Analysis of clustering results of the low SNR spectra. All low-quality spectra are divided into five categories through cluster analysis: A. The spectral SNR is low, or the spectrum is different from the traditional classification template, but its category can be determined by feature analysis (accounting for 2.7%); B. Suspected characteristic lines or molecular bands that do not match the line table appear at the blue or red end of the spectrum (accounting for 23.6%); C. The SNR at the spectrum’s blue end is very low, and the noise value in this wavelength region is strong. While in other wavelength regions, the features of continuous spectrum and line are weak (accounting for 48%); D. Due to the splicing problem, a protrusion can be seen in the local spectrum between 5 700 and 5 900 Å, and the continuum and line characteristics are poor at other wavelengths (accounting for 24.2%); E. Many default values make it impossible to determine the category of the spectrum (accounting for 1.5%). The experimental results show that this method can not only effectively extract the characteristic spectrum of low SNR spectrum, but also effectively carry out clustering analysis on the characteristic spectrum to reveal their causes, to provide a reference for the formulation of spectrum observation plan and the analysis and processing of low SNR spectrum.
Apr. 01, 2022Vol. 42 Issue 4 1186 (2022)
Dong-rong PAN, Tian-hu HAN, and Hao-wen YAN
Time series spectral remote sensing vegetation index is considered an effective index for monitoring vegetation coverage change and plays an important role in monitoring the dynamic change of vegetation coverage in a large area. Qilian Mountains, located at the junction of Gansu and Qinghai provinces, play an important role in maintaining ecological security in western China. In recent years, affected by global climate change, the climate in Qilian Mountains has changed to different degrees, and the state has implemented a series of environmental protection projects in the Qilian Mountains. Given the lack of research on the status and future trends of vegetation coverage in different ecological regions of Qilian Mountains, this research based on SPOT-VGT-NDVI spectral data with a resolution of 1km, used mathematical statistics and spatial superposition method to analyze the spatial and temporal patterns, vegetation stability and future evolution trend of vegetation coverage in different ecological regions of Qilian Mountains, and explored sensitive areas. It provides a theoretical basis for regional ecological security and ecological engineering construction, and further provides a scientific basis for forest and grassland departments to formulate Qilian Mountain protection planning and vegetation restoration measures. The results show that: From 1998 to 2018, vegetation NDVI in Qilian Mountains showed a fluctuating upward trend, with an increased rate of 0.32%·a-1. The NDVI variation rates in the desert ecological area of Qaidam Basin and the Alpine desert steppe ecological area of the Palmier-Kunlun Mountain and the Altun Mountains were relatively low, only 0.14%·a-1 and 0.27%·a-1, while the variation rates in the steppe desert ecological area of the central Inner Mongolia Plateau and the river source area of the Gannan alpine meadow steppe were relatively large, respectively 0.54%·a-1 and 0.57%·a-1. Spatially, the vegetation NDVI of the Qilian Mountains is high in the southeast and low in the northwest, with overall improvement and partial degradation. The areas of degraded and improved areas accounted for 28.37% and 40.76% of the total area of the Qilian Mountains, respectively. The vegetation in the Qilian Mountains is relatively stable. The areas with relatively high fluctuations and high fluctuations total 0.22×10⁴ km2, accounting for 1.20%. In the future, areas with a benign development trend and a malignant development trend account for 42.82% and 26.40% of the total area of the Qilian Mountains, of which the area with continuous degradation accounts for 25.56%. The degraded areas mainly include the alpine steppe and alpine desert near the high altitude snow line and the fragile vegetation areas around the towns, rivers and lakes. The country should take this area as the key area of vegetation restoration.
Apr. 01, 2022Vol. 42 Issue 4 1192 (2022)
Yan-ling YANG, Hsitien Shen Andy, Yu-rong FAN, Wei-zhi HUANG, and Jing-cheng PEI
Emerald is a species of beryl in which chromium (Cr) and vanadium (V) are co-colored, with a long history of synthesis, continuous technological improvements and the emergence of new formulations. Recently, a new type of synthetic hydrothermal emerald with a bright color whose appearance is comparable to natural emeralds from Colombia has shown up in the market. After initially analyzing the emerald, it was a vanadium color-causing synthetic emerald. In order to investigate its characteristics, a detailed study was carried out using LA-ICP-MS and UV-Vis-NIR spectrophotometer, aiming to obtain the content of chromogenic elements and analyze the chromogenic reason in its chemical composition and UV-Vis-NIR absorption spectra. Digging differentiation from natural emeralds, we could provide vital data for testing institutions. The chemical composition showed that these synthetic emeralds were pure vanadium-colored, characterized by vanadium-rich and iron-poor, with copper (Cu) varying widely among the different batches, while Cr and other color-causing elements were mostly below the detection limit. The conventional iron-rich hydrothermal synthesized emerald samples used for comparison were characterized by chromium-rich and iron-rich. In addition, it contained high nickel (Ni) and traces of titanium (Ti), manganese (Mg) and Cu, while the vanadium content was below the detection limit. The UV-Vis absorption spectra of the new synthetic emeralds revealed typical absorption spectral features of vanadium, with two broad absorption bands centered at 430 nm in the violet region and 617 nm in the orange-red region, in addition to a shoulder peak near about 390 and 680 nm respectively, and a weak absorption peak at 756 nm for most samples. 430 nm absorption band was attributed to the d electrons spin-allowed transition [3T1g(3F)→3T1g(3P)] of V3+ , the 617 nm absorption band was attributed to d electrons spin-allowed leap [3T1g(3F)→3T2g(3F)] of V3+, and the 756 nm absorption peak was due to Cu2+, and this spectral absorption feature was different from that of the conventional iron-rich synthetic emerald. Most natural emeralds have a combination of Fe3+, Fe2+ and Cr3+ absorption spectra, which can be easily distinguished from these synthetic emeralds. A small amount of the pure vanadium-colored natural emeralds also have the characteristic absorption peaks of vanadium, but they can be separated from the vanadium-rich synthetic emeralds because they also have the characteristic absorption band of Fe2+ around 810830 nm. The NIR region, mainly showing type I water-related absorption peaks at 1 402, 1 467 and 1 895 nm, can also be differed from natural emeralds. UV-Vis-NIR spectroscopy is an effective means of identifying natural emeralds from synthetic emeralds. However, it should be combined with other identification evidence, such as inclusions and molecular vibration spectroscopy techniques, avoiding the appearance of new synthetic formulations of emeralds that could lead to erroneous identification conclusions.
Apr. 01, 2022Vol. 42 Issue 4 1199 (2022)
Yang LÜ, Jing-cheng PEI, Ya-ting GAO, and Bo-yu CHEN
Triplite is a rare mineral, and gem-grade triplite can present a highly saturated reddish orange. In this paper, three samples from Pakistan are selected for systematic research through Electron Microprobe, Raman spectra, Infrared spectra and UV-Vis absorption spectra. The purpose is to obtain their chemical composition and spectral characteristic, analyze the chromogenic ions, and provide important data for their species identification and optimization processing. The chemical formula of average chemical composition is (Mn1.66, Fe0.17, Ca0.15, Mg0.03)Σ2.02P0.99O4.14(F)0.82, which belongs to the Mg-rich and Fe-poor triplite. And it has a similar chemical composition with the gem-grade triplite produced in the Shigar Valley of Pakistan in the literature. Raman spectra and Infrared spectra show that the main vibration group of triplite is PO43- group. The main peak of Raman spectra is located at 980 cm-1, which can be used to analyze the substitution relationship between OH- and F. The intensity contrast of the 450 and 427 cm-1 bimodal peaks can reflect the substitution relationship between Mn2+ and Fe2+. The Infrared spectra has absorption peaks in the 400~650 and 900~1 200 cm-1 band, which can reflect the substitution relationship between OH- and F, Mn2+ and Fe2+. Thus, Raman spectra and Infrared spectra can be used to clearly distinguish the isomorphic minerals: triplite, wolfeite and zwieselite. In the UV-Vis absorption spectra, the strong absorption peak centered at 406 nm is caused by the spin-forbidden transition of Mn2+. The weak absorption peak centered at 455 nm is caused by the spin-forbidden transition of Fe2+, and Mn2+ also has a certain effect on this peak. The absorption peak centered at 533 nm is caused by the transition of Mn2+, 6A1g(S)→4T1g(G). So the samples show a reddish orange color, which is an idiochromatic mineral. There are common isomorphisms in the triplite group minerals. Raman spectra and Infrared spectra can identify triplite accurately, and EMPA can provide important information for the traceability of its origin.
Apr. 01, 2022Vol. 42 Issue 4 1204 (2022)
Ling-ling JIANG, Long-xiao WANG, Lin WANG, Si-wen GAO, and Jian-quan YUE
Transparency is one of the critical indicators for marine ecological environment monitoring, and it plays a vital role in the military, navigation, fishery, and other fields. Compared with other traditional ocean monitoring technologies, remote sensing technology has the advantages of long time sequence, extensive range, and near real-time acquisition of ocean information. Therefore, it is of great significance to the rational development and utilization of marine resources by using satellites to observe ocean transparency. This study used the in situ transparency data and the equivalent remote sensing reflectance data of the Sentinel-3 OLCI sensor to build the Bohai Sea transparency inversion model, which mainly included the single band method, the band ratio method, and the mixed band method. The model’s accuracy was verified with the in situ-satellite match-ups. It found that the best inversion model was the mixed band model with B6 (560 nm) and B7 (620 nm) as the sensitive factors. The coefficient of determination R2 was 0.68, the average relative error (MRE) was 15.93%, and the root means square error (RMSE) was 0.48 m. On this basis, combined with Sentinel-3 OLCI time-series images, we got the monthlyremote sensing products of Bohai transparency in 2020 and found that thetransparency showed obvious regional and seasonal characteristics. The transparency ranged from 0 m to 10 m. It was higher in July and August. The value of some areas could be deeper than 9 m. While it was relatively low in winter, the value was less than 2 m in January and February. At the same time, we also found that the higher transparency appeared in the central Bohai Sea and the coastal waters of Qinhuangdao, while the transparency was lower in Bohai Bay, Liaodong Bay, and Laizhou Bay throughout the year. The characteristic trend of transparency is inseparable from Bohai Sea coastal geological properties, the distribution of surrounding rivers, and coastal urban agglomerations and industrial ports. This research provided a reliable theoretical basis for remote sensing transparency estimation, and it was of great significance for monitoring the marine environment of the Bohai Sea.
Apr. 01, 2022Vol. 42 Issue 4 1209 (2022)
Meng LI, Xiao-bo ZHANG, Shao-bo LIU, Xing-feng CHEN, Lu-qi HUANG, Ting-ting SHI, Rui YANG, Shu LIU, and Feng-jie ZHENG
Ginseng is a valuable variety of traditional Chinese medicine with high economic value. The growth is very regional, and the effective ingredients of ginseng from different origins are different. Whether ginseng is “authentic” or not, it will cause differences in its quality, medical utility and economic value, so the identification of ginseng origin is of great significance. After powder extraction and other preparations, chemical or optical methods are used to test the origin of ginseng, but this will cause damage to the sample. Besides, the identification based on appearance traits or rhizome head characteristics can not be used as a standardized recognition method because of human subjective differences or easy to be falsified. The main standpoint of this article is how to use high-precision, non-destructive, and rapid detection and identification methods to identify and analyze the origin of ginseng. This experiment uses hyperspectral imaging technology, for ginseng samples with known origin information, the hyperspectral reflectance dataset was constructed by obtaining reflectance spectra from 400 to 2 500 nm, after absolute and relative radiometric corrections based on the whiteboard. A full spectrum ginseng origin recognition model based on hyperspectral data was constructed, and the accuracy of origin recognition was verified for different scales of regional division rules. It was found that the ginseng spectra from different origins were significantly different. The accuracy of origin identification of the northeastern provinces or not can reach 98.2%. The spectral importance results of ginseng origin recognition were given, indicating the characteristic spectrum for developing a special lightweight instrument. As a strict non-destructive detection method, hyperspectral ginseng origin identification research will provide theoretical support and technical means for identifying the origin of authentic Chinese medicinal materials such as ginseng, fingerprint recognition and mining of medicinal materials, identification and quality evaluation, etc.
Apr. 01, 2022Vol. 42 Issue 4 1217 (2022)
Ling-kai MA, Shi-ping ZHU, Yu-jie MIAO, Xiao WEI, Song LI, You-lie JIANG, and Jia-xin ZHUO
Today, the organic food industry is developing rapidly around the world. It reflects consumers’ attention to the quality and safety of food. Organic eggs are produced under strict conditions, and it have nutrition, so the more price it is compared with conventional eggs. Although there are some strict certification processes to the eggs sold in the market, they still cannot prevent illegal elements from making profits by replacing organic eggs with conventional eggs. This phenomenon harms the interests of organic producers, and consumers will have less faith in organic food. Therefore, an effective non-destructive method is needed to identify the organic eggs from conventional eggs. One material’s inner information can be obtained by hyperspectral transmission image technology. In this paper, the organic eggs and conventional eggs were used as the experimental objects, and hyperspectral image data of egg samples were collected in the wavelength range from 364 to 1 025 nm, and the average spectral of the ROI in the area of albumen and yolk were abstracted from the collected data respectively. According to the transmission spectrum curves, bands with obvious differences in spectral response between organic eggs and conventional eggs were selected out. The Partial Least Squares Discriminant Analysis (PLS-DA) and Support Vector Machine (SVM) were used to establish the discrimination model. The results show that the accuracy of the four models based on the yolk and albumen area respectively are closed, further analysis was carry on the datas of yolk area. Due to a large amount of hyperspectral data and redundant information, it is inconvenient for data storage, transmission and modeling. Therefore, Successive Projections Algorithm (SPA) and Competitive Adaptive Reweighted Sampling (CARS) were used to reduce the dimensions of data. After removing a lot of redundant information, the SPA-SVM discrimination model based on 23 wavelengths selected by using SPA on the hyperspectral data of yolk area has the highest accuracy, reaching 94.2%. The results show that the hyperspectral technique has some effect on the non-destructive identification of organic eggs and conventional eggs by hyperspectral technique has some effect.
Apr. 01, 2022Vol. 42 Issue 4 1222 (2022)
Tian-liang ZHANG, Dong-xing ZHANG, Tao CUI, Li YANG, Chun-ji XIE, Zhao-hui DU, and Xiang-jun ZHONG
Given the time-consuming, labor-intensive and time-lagging problems of traditional methods for identifying lodging resistance of maize, this study uses hyperspectral imaging data combined with machine learning methods to identify lodging resistance of maize at the 9-leaf stage. It gives the recommended planting density and modeling methods. The experiment set up 3 planting densities of 5 000, 7 000 and 9 000 plants·mu-1 and 6 typical lodging resistant/non-lodging resistant varieties. Hyperspectral images of corn top leaves at the 9-leaf stage were collected, reflectance correction and target spectral curve extraction were automatically performed by segmentation of the target area. For the collected sample data, the Kennard Stone algorithm is used to divide the sample training set and the test set, the principal component analysis (PCA) and the successive projections algorithm (SPA) are used to extract the spectral features. A support vector machines (SVM) model of Gaussian kernel function is established, with the performing of parameter training and optimization. By comparing the effect of each feature extraction method and the training effect of each model, and its prediction results under different planting densities, the planting density and modeling method recommended for the identification of maize lodging resistance were found. The test results show that the PCA method has the most significant dimensionality reduction effect on the spectral features at various planting densities. At the same time, the characteristic wavelength distribution selected by the SPA algorithm is relatively uniform, and the lodging resistance classification characteristics are obvious. The increase of planting density is beneficial to identifying the lodging resistance of maize. When the planting density is 7 000 plants·mu-1, the training effect and prediction results of the model established by the SPA-SVM method are the best. The 10-fold cross-validation accuracy of the model on the training set data is 97.40%. The prediction accuracy rate of the set data is 98.33%.
Apr. 01, 2022Vol. 42 Issue 4 1229 (2022)
Xiao-hong ZHANG, Xue-song JIANG, Fei SHEN, Hong-zhe JIANG, Hong-ping ZHOU, Xue-ming HE, Dian-cheng JIANG, and Yi ZHANG
Based on near-infrared diffuse transmission spectrum analysis technology, a portable flour quality safety detector is designed, which mainly includes a spectrum acquisition module, light source control module, processing and display module and power supply module. Among them, diffuse transmission detection accessories can be lifted freely to facilitate the placement of samples and effectively avoid the interference of external stray light. The circuit for controlling the switch of the light source is designed, and experiments determine the optimal thickness of samples. Raspberry Pi 4B is selected as the core processor, and a rechargeable lithium battery is selected for the power supply. The instrument can continuously supply power for 2 hours, and its size is 250 mm× 170 mm×300 mm. A total of 180 samples were taken from the flour ground from wheat after bran removal. Each sample was divided into three parts: yellow, red and blue. For all red samples, use the near-infrared diffuse transmission spectrum with the wavelength of 9001 870 nm to collect and record the spectral information, measure and record the humidity value of all yellow samples, and measure and record the Don content of all blue samples. The three samples need to be measured at the same time. The noise at both ends of the spectrum and an abnormal sample are eliminated by box diagram, and finally, the spectrum in 1 0481 747 nm band is selected for modeling. The multivariate scattering correction (MSC), S-G convolution smoothing and standard normal transformation (SNV) were used to preprocess the original spectral data, and the partial least squares regression prediction model of flour humidity and PCA-logistic regression classification model of DON content exceeding the standard were established respectively. The correlation coefficients of the calibration set and prediction set of the optimal PLSR prediction model for humidity are 0.883 and 0.853, the root mean square error is 0.382% and 0.286%, and the residual prediction deviation RPD is 2.5. The AUC value under the ROC curve of the prediction set of the PCA-logistic regression classification model is 0.927. The confusion matrix shows that the prediction accuracy of samples not exceeding the standard is 96%, and that of samples exceeding the standard is 89%. The GUI interface is designed based on PyQt5, and the flour quality real-time detection system is written by Python language. The detection software can realize the training, saving and loading of PLSR and PCA-logistic regression models. The accuracy and stability of portable flour multi-quality tester were verified by external verification set test. The results showed that the correlation coefficient and root mean square error of the external verification set of flour humidity were 0.876 and 0.21%, and the maximum relative error was 2.89%. The recognition accuracy of flour DON content exceeding the standard is 90%, indicating that the instrument can be used for nondestructive detection and analysis of flour humidity and DON content.
Apr. 01, 2022Vol. 42 Issue 4 1235 (2022)
Shi-jie XIAO, Qiao-hua WANG, Chun-fang LI, Chao DU, Zeng-po ZHOU, Sheng-chao LIANG, and Shu-jun ZHANG
There are “high protein”, “high fat”, and other characteristics of milk in the market. In order to realize the nondestructive and rapid grading of super quality milk, high-protein characteristic milk, high-fat characteristic milk and ordinary milk, 5 121 milk samples from 10 pastures in Hebei Province in different months (January, March to October) were collected. Then the mid-infrared spectroscopy data were collected, the protein and fat content in milk were measured, the somatic cell number was measured, and the mid-infrared spectrum model of milk quality grading was established. Firstly, milk spectral analysis was carried out, and redundant bands were removed. Finally, the sensitive band combinations of 9 925~1 597 and 1 712~3 024 cm-1 were selected as the full spectrum to establish the model. In order to improve the prediction accuracy and efficiency of the model, six spectral pre-processing methods were used to improve the signal-to-noise ratio of the original spectrum, including Standard normal variable transform (SNV), multiple scattering correction (MSC), the first derivative and second derivative, first difference and second-order difference. Comparing the effects of different pretreatment methods by establishing naive Bayes model (NB) and random forest model (RF), the second-order difference obtained the best prediction accuracy. The testing set accuracy was 92.11% and 96.87%, respectively. So second-order difference was identified as the best pretreatment method for further analysis. In order to simplify the models, UVE (Uninformative variable elimination), CARS (Competitive adaptive reweighed sampling), SCARS (Stability Competitive adaptive reweighted sampling) were utilized to extract the characteristic variables from the pre-processed spectrum by second-order difference method. Then, the NB and RF models were established based on the full spectral data and the selected characteristic variable data. The results showed that SCARS was the best feature extraction algorithm for the NB model, and the accuracy rates of the training set and the testing set were 94.45% and 93.94%, respectively.UVE-SCARS is the best feature extraction algorithm of the RF model, and the accuracy of the training set and test set are 99.86% and 96.48%, respectively. In conclusion, the second-order difference-UVE-CARS-RF model established based on Fourier transform the mid-infrared spectroscopy technology can realize the rapid and non-destructive prediction of classification of 4 kinds of milk. Through the establishment of mid-infrared spectrum model, the combination of milk protein, milk fat content and somatic cell number is the first time for direct classification and identification, which is unprecedented in previous studies. In applying the model, we only need to input the obtained milk mid-infrared spectral data into the model to output the prediction category, which has practical application value in the milk industry.
Apr. 01, 2022Vol. 42 Issue 4 1243 (2022)
Lian-jie LI, Shu-xiang FAN, Xue-wen WANG, Rui LI, Xiao WEN, Lu-yao WANG, and Bo LI
The separation of coal and gangue is a crucial step in coal mining, but the existing methods such as manual selection and mechanical separation are ineffective and environmentally hazardous. This study aimed to explore the feasibility of the accurate classification of coal and gangue with black background based on the visible and near-infrared hyperspectral imaging technology, simplify classification models using feature selection methods, and provide a reference for constructing a multispectral system for coal and gangue separation. Hyperspectral imaging technology is a fast and non-destructive detection method without sample pretreatment and environmental contamination. Firstly, a hyperspectral imaging system was developed to collect hyperspectral data of 85 coal samples and 83 gangue samples in the range of 400~1 000 nm (Vis/NIR) and 1 000~2 500 nm (NIR) from the XiMing mine. After removing background information of hyperspectral images, the average spectra in the randomly selected regions of 100 pixel×100 pixels in 400~1 000 nm and 50 pixel×50 pixels in 1 000~2 500 nm were extracted. After repeating 10 times, 850 coal spectra and 830 gangue spectra were obtained in each of the two bands. Savitzky-Golay smoothing and standard normal variate transformation were performed successively to reduce the impact of errors and noise on the spectra. Three models, including support vector machine (SVM), k-nearest neighbor (KNN), partial least squares discrimination analysis (PLS-DA), were established based on full-band spectra. The classification accuracy rate of each model for the prediction set was greater than 0.95, which revealed that coal and gangue could be distinguished by spectral information. Subsequently, competitive adaptive reweighted sampling (CARS) and successive projections algorithm (SPA) were employed to select characteristic wavelengths to simplify models. Considering factors such as accuracy and cost, the SVM model based on the 3 characteristic wavelengths screened by SPA in the Vis/NIR range had the best performance, that not only effectively reduced the number of wavelengths, but also improved the classification capacity and the corresponding sensitivity, specificity, accuracy was: 1.000 0, 0.965 2, 0.983 3, respectively. Based on the discriminant model and the average spectra of the samples, the classification and visualization of coal and gangue can also be realized. The research results have great potential for developing a low-cost and multi-spectral separation system for coal and gangue based on the characteristic wavelengths to achieve fast and accurate non-destructive separation.
Apr. 01, 2022Vol. 42 Issue 4 1250 (2022)
Su-ya-la-tu LIU, Zong-li WANG, Hui-zhong PANG, Hu-qiang TIAN, Xin WANG, and Jun-lin WANG
Terahertz metamaterial absorbers, as a kind of important terahertz functional devices, are widely used in biomedical sensing, electromagnetic stealth, military radar and other fields. However, this traditional metamaterial absorber structure has disadvantages such as poor tenability, single function and insufficient performance indexes, which can no longer meet the complex and changeable electromagnetic environment requirements. Therefore, the tunable metamaterial absorber has gradually become a research hotspot in the field of terahertz functional devices. In order to achieve the tuning of the absorption characteristics of the metamaterial absorber, the electromagnetic characteristics of the resonance unit or the substrate material or the geometric size of the metamaterial structural unit are usually adjusted. A terahertz broadband tunable metamaterial absorber based on graphene and vanadium dioxide is proposed in this paper. The absorber consists of a vanadium dioxide resonant layer, a continuous graphene layer and a metal reflector separated by a Topa’s medium. The numerical simulation results show that when the material is in the all-metal state (electrical conductivity of 200 000 S·m-1), and the Fermi energy of graphene is set as 0.1 eV, the absorption bandwidth of more than 90% reaches 2.8 THz. When the Fermi energy of graphene is adjusted to change between 0.1 and 0.3 eV, the operating frequency of the absorber shows an obvious blue shift. The proposed broadband structure can switch freely between the reflector and the absorber when the conductivity of vanadium dioxide varies between 100200 000 S·m-1 due to the phase transformation characteristics of vanadium dioxide material from the insulating state to the metallic state. In addition, the surface current distribution of the metamaterial absorber at the three perfect absorption peaks of 1.87, 3.04 and 4.16 THz was monitored respectively, and its working mechanism was discussed. The structure designed in this paper realizes the dual control of the absorber’s operating frequency and absorption amplitude through two independent adjustable “switches” of graphene and vanadium dioxide, which provides a new development idea for the design of multifunctional terahertz devices.
Apr. 01, 2022Vol. 42 Issue 4 1257 (2022)
Bao-lu DU, Meng LI, Jin-jia GUO, Zhi-hao ZHANG, Wang-quan YE, and Rong-er ZHENG
The exchange flux of CO2 between the ocean and the atmosphere is an important indicator for studying the carbon cycle and the ocean acidification issue. The estimation of CO2 flux mainly depends on the detection of CO2 in seawater. As a widely used gas detection technology, Tunable Diode Laser Absorption Spectroscopy (TDLAS) has advantages in environmental adaptability, selectivity and good sensitivity, and thus it is potential in the in-situ detection for dissolved gas in seawater. In order to verify the feasibility of applying TDLAS technology to the in-situ detection for dissolved CO2 in the seawater, this paper integrates the permeable membrane which realizes gas-water separation with the TDLAS gas detection prototype developed in the laboratory to realize the in-situ detection for CO2 in seawater. The whole prototype is designed as a sealed cabin. The prototype’s material is aluminum alloy which has good tightness, pressure and corrosion resistance. The laser source uses a DFB laser with a central wavenumber of 4 990 cm-1, and its wavenumber is scanned from 4 992 to 4 994.5 cm-1 over time, which can contain two absorption lines of CO2 at 4 992.51 and 4 993.74 cm-1. The permeable membrane’s material uses Teflon AF-2400 X with excellent pressure resistance and air permeability. Considering of requirements of high detection sensitivity and fast response rate for the prototype in underwater, the prototype uses a miniaturized Herriott-type multi-reflection cavity with good absorption characteristics. The cavity can achieve an effective optical path of 8 meters and a gas sampling volume of only 24 mL. A calibration experiment was done in the laboratory to reduce the influence of the prototype error on the measured value. Five different concentration (202.8×10⁻⁶, 503×10-6, 802×10-6, 1 006×10-6, 2 019×10-6) standard CO2 gases were measured by the prototype. The linear correlation (R2) is 99.95% between measured values, and actual values and the prototype has a maximum relatively error ≤8%. The prototype was used to continuously measure the standard CO2 gas with a concentration of 802×10-6 for 30 minutes to evaluate the stability of the prototype for a long time working. The average measured value is 802.6×10⁻⁶, and the fluctuation range is only 10×10-6. The accuracy of the prototype is about 0.5%, which can fulfill the requirement of in-situ dissolved gas detection in seawater. A test was done in an offshore pier with a depth of 3 meters. The prototype successfully obtained the typical absorption spectrum and concentration results of dissolved CO2 in water for the whole 24 hours. The test verifies the long-lasting stability and robustness of the prototype. Through a shipborne adaptability test of five areas with different depths in the East China Sea, the typical absorption spectrum of dissolved CO2 was successfully obtained, which proved the adaptability of the TDLAS detection prototype combined with permeable membrane degassing technology within 30 meters depth of seawater.
Apr. 01, 2022Vol. 42 Issue 4 1264 (2022)
Sheng-ming WANG, Tao WANG, Sheng-jin TANG, and Yan-zhao SU
Hyperspectral images contain abundant spectral information of ground objects and have great development prospects in the field of remote sensing images. Anomaly detection of hyperspectral images can detect abnormal targets in images without any prior spectral information. Therefore, it is widely used in national, military, and civil fields, and it is a research hotspot in hyperspectral image processing at present. However, hyperspectral images are characterized by complex data, strong redundancy, unlabeled and small number of samples, which brings great challenges to anomaly detection of hyperspectral images. Especially in deep learning, large image data is often needed as training samples, which is difficult to obtain hyperspectral images. Aiming at the problems that most existing algorithms are not adaptive to hyperspectral images and lack of space-spectral information utilization, a hyperspectral anomaly detection algorithm based on 3D convolution autoencoder network is proposed, which can effectively utilize hyperspectral image information, learn more discriminative feature expression, and improve detection accuracy under the premise of a small amount of training data. Firstly, the 3D convolution network is designed through 3D convolution, 3D pooling and 3D normalization, and then the spatial-spectral structure features of hyperspectral images are extracted. Then, the 3D convolution network and the 3D deconvolution network are embedded into the auto and decoder of the autoencoder network, respectively. background reconstruction is carried out by minimizing the reconstruction error combining the mean square error and the spectral angular distance. Finally, the Mahalanobis distance between the original hyperspectral image and the reconstructed background image is used for anomaly detection. This algorithm can automatically train all parameters in the network without prior information, learn the effective features of hyperspectral images and carry out background reconstruction in an unsupervised way. It is performed using the nine images from three sets of real high spectral data sets and is compared with the five algorithms of RX, SRX, CRD, UNRS, and LRASR. The experimental results show that this algorithm maintains a high detection effect and accuracy in the context of high spectrum images compared to existing algorithms.
Apr. 01, 2022Vol. 42 Issue 4 1270 (2022)
Maiming Yumiti, and Xue-mei WANG
The hyperspectral estimation of soil organic matter content can quickly and accurately monitor soil fertility and provide a scientific basis for proper fertilization of modern agricultural production. Taking the cultivated soil in the delta oasis of Weigan-Kuqa river, Xinjiang as the research object, the original spectral reflectance (R) of the collected 98 soil samples was subjected to the traditional reciprocal logarithm lg(1/R), the first-order differential (R') and the reciprocal logarithm first-order differential [lg(1/R)]' mathematical transformations, and continuous wavelet transformation (Continuous Wavelet Transformation, CWT) processing based on Bior1.3 as the wavelet mother function through different scale decomposition. Correlation analysis was conducted between the treatment results and the measured soil organic matter content to screen out the characteristic bands and wavelet coefficients closely related to soil organic matter content under various transformations (p<0.01). With the original spectral reflectance, the characteristic band reflectance and the sensitive wavelet coefficient under different transformation treatments as independent variables and the soil organic matter content as dependent variables, partial least squares regression and support vector machine regression was used to estimate models of soil organic matter content. The results showed that: (1) Various spectral transformation methods can effectively improve the sensitivity between the spectrum and the content of soil organic matter. The correlation between the soil spectral reflectance and the organic matter content after continuous wavelet transformation has been significantly improved, and the correlation coefficient has been increased from 0.39 to 0.54 (p<0.01). (2) The support vector machine regression model built by the traditional [lg(1/R)]' transformation has a higher coefficient of determination (R2) than the model built by lg(1/R) and R' transformation, showing the reciprocal logarithm first-order differential transformation can help improve the accuracy of the estimation model, and the accuracy and stability of the support vector machine regression model were higher than that of the partial least squares regression model. (3) After continuous wavelet transformation decomposition, the estimation accuracy and stability of the models were obviously improved by using the sensitive wavelet coefficients of the original spectral reflectance at different scales as independent variables. The decision coefficient (R2), root mean square error (RMSE) and relative analysis error (RPD) of the CWT-23-SVMR model were 0.84, 1.48 and 2.11 respectively. The model has the highest accuracy and excellent predictive ability. After multiple transformation processing, hyperspectral data can effectively remove white noise. In contrast, continuous wavelet transformation processing is more suitable for mining effective soil information than the traditional mathematical transformation method, to realize the effective separation of approximate features and detailed features of spectral signals, and the established inversion model can more accurately estimate soil organic matter content.
Apr. 01, 2022Vol. 42 Issue 4 1278 (2022)
Xian-ming DENG, Tian-cai ZHANG, Zeng-can LIU, Zhong-sheng LI, Jie XIONG, Yi-xiang ZHANG, Peng-hao LIU, Yi CEN, and Fa-lin WU
Under the development trend of intelligent deformation, color change, temperature change, and spectrum change technology, low-feature targets accelerate the realization of feature fusion with the background of natural features, which makes the detection and evaluation of low-scattering, micro-reflection, and weak-radiation targets under complex natural backgrounds more and more difficult . Furthermore, the detection method, rapid decision-making and accurate evaluation of potential threat targets in certain situations have become difficult problems. This paper has proposed a parameter model for Fusion Degree(FD) between targets and background environments to improve the selection efficiency of multi-feature detection algorithms and the accuracy of the detection effect evaluation under the fusion scene of complex natural background environment with low-feature targets, such as discrete targets, camouflage targets, small targets, abnormal targets and so on. At the same time, simulated image data of 4 different spectral feature distribution scenes were designed, including vegetation camouflage targets embedded in the grass background, vegetation camouflage targets embedded in the soil background, vegetation and cement road camouflage targets embedded in the soil background, and vegetation, cement road, and soil camouflage targets embedded in the grass, cement road, and soil background respectively. Furthermore, signal noise ratio(SNR) of 200, 400 and 800 were applied to the spectral feature distribution scenes in which vegetation camouflage targets were embedded in the grass background. Through comprehensive Testal analysis of multiple factors such as spectrum information of targets, spectrum information of background, data noise ratio, etc., the research on threat evaluation of multi-feature detection algorithm was carried out, which was based on FD model between target and environment. Under the condition that the standard deviation is less than 0.08, the average values of FD parameters of the 9 classic multi-feature detection algorithms such as MtACE, MtAMF, MtCEM, SumACE, SumAMF, SumCEM, WtaACE, WtaAMF, and WtaCEM for the detection results of the 4 spectrum distribution scenes are 0.320 0, 0.350 2, 0.862 4, 0.365 8, 0.365 8, 0.846 1, 0.680 0, 0.680 0, 0.948 2, respectively. Meanwhile on the condition that the standard deviation is less than 0.07, the average values of FD parameters of the 9 classic multi-feature detection algorithms for detection results of 3 different levels of noise ratio data are 0.313 5, 0.320 9, 0.774 7, 0.369 6, 0.369 6, 0.847 5, 0.695 6, 0.695 6, 0.960 3, respectively. In this paper, through the analysis of detection and fusion evaluation tests under different spectrum distribution scenarios and different noise levels, the threat level ranking of multi-feature detection algorithms is realized, and the detection efficiency of multiple low-feature targets in complex scenarios is greatly improved. Considering spectrum and noise factors, for the detection of discretely distributed low-feature targets in complex scenes, the priority order of the 9 classic multi-feature detection algorithms is: MtACE>MtAMF>SumACE=SumAMF>>WtaACE=WtaAMF>MtCEM>SumCEM>WtaCEM.
Apr. 01, 2022Vol. 42 Issue 4 1285 (2022)
Dian-kai ZHANG, Yan-hong LI, Chang-yu ZI, Yuan-qin ZHANG, Rong YANG, Guo-cai TIAN, and Wen-bo ZHAO
As a critical fossil energy, lignite has a huge resource, wide distribution, and a low comprehensive utilization rate. Investigations regarding the molecular structure model of lignite are beneficial for pre-judging the chemical reaction mechanism and reaction path of lignite in pyrolysis, liquefaction and gasification, thereby improving its comprehensive utilization. Eshan lignite was studied by Fourier transform infrared spectroscopy, 13C Nuclear magnetic resonance spectroscopy and X-ray photoelectron spectroscopy in this paper. Moreover, the structural unit parameters of carbon, oxygen and nitrogen of Eshan lignite were obtained. According to these parameters, the molecular structure model of Eshan lignite was established and optimized by using the quantum chemical modeling method in the Gaussian 09 computing platform. The results indicate that the content of aromatic carbon and aliphatic carbon is 39.20% and 49.51%, respectively. In detail, the aromatic carbon structure mainly includes benzene and naphthalene, and the ratio of aromatic bridgehead carbon to surrounding aromatic carbon is 0.07. The aliphatic carbon structure mainly contains methylene, methyl and oxy-aliphatic carbon. Furthermore, the oxygen atoms mainly exist in hydroxyl, ether oxygen, carboxyl and carbonyl. Moreover, the nitrogen structure mainly involves pyridine. Based on the results of ultimate analysis and 13C nuclear magnetic resonance spectroscopy analysis, the molecular formula of Eshan lignite was calculated as C153H137O35N2 after eliminating the influence of water by thermogravimetric experiment. The initial structural model of Eshan lignite was constructed via the connecting structural unit. The PM 3 basis set of semi-empirical method and density functional theory M06-2X/3-21G basis set were used to optimize the initial molecular configuration. The optimized model has obvious three-dimensional characteristics. Among these, the aromatic rings arrange irregularly in space, and the distance between every aromatic ring is far. The aromatic carbon structures are mainly connected by methylene, ether oxygen, carbonyl ester and aliphatic ring. The oxygen functional groups mainly distributed at the edge of molecular and aliphatic structures possess many side chains. The simulated infrared spectrum of the molecular model was obtained by analyzing the vibration frequency of the optimized molecular model, and it agrees with the experimental infrared spectrum well, representing the accuracy and rationality of the molecular structure model of Eshan lignite. This molecular structure model is conducive to understanding the physicochemical properties of Eshan lignite more intuitively and revealing its macroscopic properties. Meanwhile, the molecular structure model can provide a theory basis for further research on lignite pyrolysis, liquefaction and gasification.
Apr. 01, 2022Vol. 42 Issue 4 1293 (2022)
Ji-yong SHI, Chuan-peng LIU, Zhi-hua LI, Xiao-wei HUANG, Xiao-dong ZHAI, Xue-tao HU, Xin-ai ZHANG, Di ZHANG, and Xiao-bo ZOU
Incidents of foreign matter contamination in the processing links of soy protein meat occur frequently. Consumers’ accidental ingestion of foreign matters will seriously damage human health. Conventional foreign matter detection methods can easily detect hard and dark foreign matters such as metals and stones. Therefore, soft, light-colored, and transparent foreign matters have become the main source of foreign matters in food foreign body contamination incidents and are difficult to detect. Based on the inconsistency of the chemical composition of the foreign matter and the soy protein meat, this study proposes a hyperspectral imaging detection method for the low-contrast foreign matter in the soy protein meat. According to the difference in the spectral information of the foreign matter and the soy protein meat, a pattern recognition model was established to perform soy protein meat and finally combined with digital image processing technology to visualize the spatial distribution of foreign objects. Five kinds of low-contrast foreign matters: polycarbonate (PC), polyester resin (PET), polyvinyl chloride (PVC), silica gel, and glass were selected as the foreign matter in this study. Collecting foreign matter and soy protein meat region of interest (ROI) reflectance hyperspectral data, using SG, SNVT, MSC, VN, 1ST and 2ND six different spectral preprocessing methods to preprocess the original spectral data, and then use principal component analysis (PCA) to reduce the dimension of the preprocessed spectral data, and use successive projections algorithm (SPA) to extract soy protein meat Characteristic wavelength. Using the raw spectrum, characteristic wavelength and principal component variables as the input variables of the pattern recognition model, try to compare the accuracy of the four pattern recognition models: LDA, KNN, BP-ANN, and LS-SVM, and select the best qualitative recognition model. Set the output variable of the foreign matter category of the optimal model to 1, the category of soy protein meat is 0, generate a binary image, and then combine the digital image processing technology to realize the visualization of the low-contrast foreign matter distribution in the soy protein meat, to realize the recognition of the low-contrast foreign matter in the soy protein meat. The results show that the spectrum after SG pretreatment is better than other pretreatment methods in noise reduction. The SPA method optimized 10 characteristic wavelengths of soy protein meat. The detection effect of the whole band principal component variables combined with the BP-ANN model is the best, with an accuracy rate of 98.33%.
Apr. 01, 2022Vol. 42 Issue 4 1299 (2022)
Shan YAO, Xuan-ling ZHANG, Yu-xin CAI, Lian-qiong HE, Jia-tong LI, Xiao-long WANG, and Ying LIU
Nitrogen and phosphorus are the key limiting factors of lake eutrophication. The study on the distribution characteristics and source analysis of nitrogen and phosphorus fractions in water and sediment can effectively reveal the process and mechanism of water eutrophication and analyze the pollution sources. As one of the most important water sources in the Xiongan New Area, the eutrophication of Baiyangdian Lake is serious, and the pollution of nitrogen and phosphorus is not optimistic. The study on the distribution characteristics and source analysis of nitrogen and phosphorus fractions is helpful to the analysis of nitrogen and phosphorus pollution in this area. However, there are few studies on the distribution of nitrogen and phosphorus fractions in sediment and water simultaneously, and the quantitative analysis of the contribution of nitrogen and phosphorus fractions by various pollution sources using models. In this study, the distribution characteristics of nitrogen and phosphorus in water and sediments of Baiyangdian Lake were studied by spectrophotometry. The contribution of different sources to nitrogen and phosphorus fractions was analyzed based on absolute principle components score combined with multivariate linear regression (APCS-MLR) model. The results showed that the content of total nitrogen (TN) (1.41~4.64 mg·L-1) in the water of Baiyangdian Lake exceeded the environmental quality standards and were all heavy eutrophication; the total phosphorus (TP) content (0.043~0.273 mg·L-1) in the water was also relatively seriously polluted, 95.8% of the sampling point were water quality of Class Ⅳ and above. The total proportion of ammonia nitrogen ($NH~~{4}^{+}-N$) and nitrate nitrogen ($NO~~{3}^{-}-N$) that could be directly absorbed and utilized by algae and plants reached 54.9%. In addition, the dissolved inorganic phosphorus (DIP) and dissolved organic phosphorus (DOP), which contributed a great deal to the eutrophication of water accounted for 52.8%. The distribution regularity of nitrogen and phosphorus total amount and fractions showed that the eutrophication of Baiyangdian Lake was not optimistic, the pollution of Baiyangdian scenic area and margin area was relatively serious, and the proportion of nitrogen and phosphorus fractions which had great influence on water eutrophication was large. The ratio of bioavailable nitrogen (the sum of EN and HCl-N) to TN was 17.9%~66.4%, and the proportion of bioavailable phosphorus (BAP) in TP was 8.50%~28.0%. These results indicated a great risk of nitrogen and phosphorus release in the sediments of Baiyangdian Lake. The results of the principal component analysis showed that nitrogen and phosphorus pollution in Baiyangdian scenic area was more serious than that in other areas. The results of the APCS-MLR model showed that the contribution of domestic source pollution to nitrogen and phosphorus fractions were large, especially in sediments, agricultural pollution, animal and plant residues decomposition and aquaculture also contributed significantly to the content of different nitrogen and phosphorus fractions.
Apr. 01, 2022Vol. 42 Issue 4 1306 (2022)
Wei-hong WANG, Xue-gang LUO, Feng-qiang WU, Ling LIN, and Jun-jie LI
In this paper, five plants (ramie, Indian mustard, Rumex, Brassica napus and maize) were pot cultured with 0 (control group), 25, 75, 125, 175, 275, 375 and 485 μg·g-1 uranium in the soil. The qualitative and quantitative indicating effects of leaf spectral angle on soil uranium pollution in different growth stages were studied, and the relationship between quantitative indicating effect and leaf uranium content was analyzed It provides an effective way to quickly and safely carry out the background investigation and dynamic monitoring of soil uranium content through field measurement of plant leaf spectrum. The results and main conclusions are as follows: (1) Based on the leaf reflectance spectra of experimental plants in different growth stages, the spectral angles of soil polluted by uranium in five bands (350~716 nm for leaf pigment, 717~975 nm for red edge and near infrared platform, 976~1 265, 1 266~1 770 and 1 771~2 500 nm for water) were calculated. In most cases, the spectral angles of the five experimental plants were greater than the thresholds of the control group. The spectral angles of leaves havecomprehensive responses of 350~2 500 nm to theuranium in soil, which can qualitatively indicate whether the soil is polluted by uranium or not. (2) Eight linear regression equationspassing the significance test with spectral angles as independent variables were obtained, covering all five experimental plants. The coefficient of determination R2 of 7 linear regression equations were >0.64, and R2 of 3 linear regression equations (ramie-seedling stage, Indian mustard-flowering stage and rape-bud bolting stage) were>0.81. Combined with other inversion effect evaluation indexes, it can be considered that leaf spectral angles can quantitatively indicate the degree of soil uranium pollution, but the function of the quantitative indicator varies with plant species and growth period. (3) There was a positive correlation between leaf spectral angles and uranium contents in soil. (4) The leaf spectral angles of ramie and Indian mustard at the seedling stage can be used to retrieve soil uranium content, which is an outstanding characteristic for indicating soil pollution status as early as possible through plant spectrum.
Apr. 01, 2022Vol. 42 Issue 4 1313 (2022)
Yue-ying REN, Chen NIU, Jing-jing WANG, He YANG, Yong-hua XU, and Zhi LIU
Ginseng mainly relies on field cultivation, which takes a long time. The use of plant tissue culture technology can not only shorten the breeding period, but also can be directly used to produce secondary metabolites. In plant tissue culture, the influence of light quality on the secondary metabolites of medicinal plants has attracted widespread attention. In our work, ginseng callus was used as the experimental material, and ultra-high performance liquid chromatography was used to study the effects of different light qualities (including red light, red-blue light, blue light, green light, yellow-green light) on the total saponins and the contents of 9 saponins monomers Rg1, Re, Rf, Ro, Rb1, Rc, Rb2, Rb3, Rd. The results show that green light accelerates the aging of ginseng callus and promotes the accumulation of secondary metabolites, while blue light can promote the growth of ginseng callus; red light and green light have no obvious effect on total saponins, and blue light, red-blue light (1:1), yellow-green light (1:1) have obvious inhibitory effects on the conversion and synthesis of ginsenosides; compared with the control group, the contents of Rg1 and Rf were higher under green light treatment, and the contents were 4.063 and 1.194 mg·g-1, respectively, the green light also promoted the content of Rg1 and Rf ginsenoside monomers. This experiment shows that different light qualities have different effects on the growth of ginseng callus and the content of saponins. Green light treatment is beneficial to obtain ginseng monomer saponins Rg1 and Rf. The purpose of this article is to explore the effects of light quality on the physiology and biochemistry of ginseng callus, increase the content of ginsenosides, and provide a theoretical basis for industrial production.
Apr. 01, 2022Vol. 42 Issue 4 1318 (2022)
Kai-yi ZHENG, Wen ZHANG, Fu-yuan DING, Chen-guang ZHOU, Ji-yong SHI, Marunaka Yoshinori, and Xiao-bo ZOU
The near-infrared spectra has been widely used in the food region with advantages of low measurement cost, easy operation, and fast analysis rate. An indirect analytical method should calibrate a feasible model between spectra and concentrations. However, the model calibrated under a specific condition may be invalid for the spectra measured under another condition. Recalibration is a solution to this problem. However, recalibrating the model between spectra and concentration cost much time and workforce. Thus, calibration transfer can correct the spectral deviation to keep the precision of prediction and avoid the expense of recalibration. In calibration transfer, the spectra used for calibrating model are called primary spectra (A), while those not calibrate model but only use the model of primary spectra are called secondary spectra (B). The procedure of calibration transfer is selecting samples as transfer set of primary spectra (At) from the calibration set, while choosing the samples of secondary spectra as transfer-set of secondary spectra (Bt) who share the same concentrations of At. Then the transfer matrix can be constructed through At and Bt. After that, the corrected secondary spectra (Bnew) can be obtained by validating a set of secondary spectra (Bv) multiplying the transfer matrix. Finally, the Bnew can be substituted for the primary spectra model for prediction. In calibration transfer, generating a transfer set is an important procedure. Selecting samples of transfer set is commonly based on the distances of spectra rather than validation errors. However, the transfer errors are important to estimate the power of calibration transfer. Hence, in this paper, ensemble refinement (ER) based on model population analysis has been proposed to refine further the transfer set generated by the KS method. Initially, the ER generates several subsets of a transfer set and then computes the validation errors of each subset. Subsequently the average error of subsets that includes the sample can be obtained for each sample. Finally, the samples with low average errors can be selected as a transfer set for calibration transfer. The corn dataset is used to examine this method. The results exhibited that in calibration transfer methods such as canonical correlation analysis combined with informative components extraction (CCA-ICE), direct standardization (DS), piecewise direct standardization (PDS) and spectral space transformation (SST), ER can select key samples for calibration transfer to reduce the errors, compared with KS method significantly.
Apr. 01, 2022Vol. 42 Issue 4 1323 (2022)
© Copyright 2018-2021 | Chinese Laser Press.
All Rights Reserved 沪ICP备15018463号-20