


 View fulltext

2022
Volume: 42 Issue 5
50 Article(s)

Yi-ya WANG, Yi-min WANG, and Xin-hua GAO
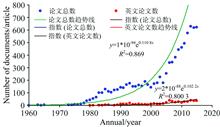
X-ray fluorescence spectrometry analysis in China had experienced 60 years, and the number of relevant technical documents had been over ten thousand. The literature “bibliometric analysis on research trend of X-ray fluorescence spectrometry based on CNKI” and the book of X-ray spectrometry literature index in China were published in 2019. Based on this literature, this paper explained the types, sources and retrieval of the literature in China. The main points of the two kinds of literature were introduced, and the main achievements of statistical metrology were reviewed. The main contents included: the total number of documents and the annual distribution of English literature; the distribution of the total number of periodicals and English literature and the annual distribution of the special literature; the total number of the author's literature, the number of the first author's literature, the total amount of English literature and the total number of the first author's literature; the total number of the literature presented by the author in three periods: 1960—1990, 1960—2000 and 1960—2015. The number of papers and the number of first authors' literature; the total number of literature ≥40 and the first author literature ≥15 (the number of authors: 16), the numbers of the first authors, the total numbers of English literature, the numbers of first author literature in English, the main topics and professional fields of the first authors; the structure of the top 10 papers and the top 10 cited frequency; the overall distribution of periodicals and the top 10 Journal of the numbers of documents; Specialized (or Translated) works and their publishing houses. Finally, the existing shortcomings of the two Bibliometrics studies and the expectation of the experts and technicians of X-ray spectroscopy to participate in the Bibliometrics research were discussed.
May. 01, 2022Vol. 42 Issue 5 1329 (2022)
Qiu-yue FU, Xiang-lin FANG, Yi ZHAO, Xun QIU, Peng WANG, and Shao-xin LI
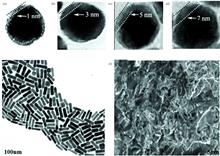
With antimicrobial drugs widely used in the clinic, the drug resistance of pathogenic bacteria is becoming more and more serious. Rapid, highly sensitive, and accurate detection of bacteria and their drug susceptibility is the key to alleviating bacterial resistance. Surface-Enhanced Raman Scattering (SERS), can be used to obtain molecular fingerprint information directly and has become an effective detection technology for bacteria and their drug resistance. The molecular composition and structure of different species of bacteria are different, and the characteristic Raman signal of bacteria will also change before and after antibiotic treatment, which provides the basis for the application of SERS for the detection of pathogenic bacteria and their drug resistance. Based on the differences in molecular composition and structure, combined with traditional multi-class data analysis and machine learning algorithms, SERS can provide objective diagnostic information. In this review, the research progress of SERS for the detection of pathogenic bacteria and their drug resistance in recent years is reviewed, and the current problems existing in the application of SERS in the detection of pathogenic bacteria are also described. Firstly, the materials and structures of SERS substrates commonly used to detect pathogenic bacteria and their drug resistance were discussed, including gold nanoparticles, silver nanoparticles, silver-coated gold nanoparticles and composite SERS substrates formed by the combination of new nanomaterials and nanoparticles. Then, the methods of capturing bacteria in SERS detection were summarized, mainly based on nucleic acid aptamers, immunomagnetic separation, microfluidic systems and electrostatic binding. The principles and methods of the above methods were described, and the research progress of the above methods was summarized. Finally, various data analysis methods of SERS spectra of pathogenic bacteria were summarized. Through spectral preprocessing, feature extraction, classification and recognition, and the establishment of a diagnosis model of pathogenic bacteria, the detection of pathogenic bacteria and their drug resistance was realized. The traditional data analysis methods and machine learning methods were compared, and the advantages and applications of deep learning algorithms in the SERS detection of pathogenic bacteria and their drug resistance were introduced. In this paper, the key issues in the application of SERS in the detection of pathogenic bacteria and their drug resistance were also discussed, and the detection methods of pathogenic bacteria and their drug resistance based on SERS prospected, to promote the application of surface-enhanced Raman spectroscopy in clinical detection.
May. 01, 2022Vol. 42 Issue 5 1339 (2022)
Ya-jing JIANG, Jun-ling SONG, Wei RAO, Kai WANG, Deng-cheng LOU, and Jian-yu GUO
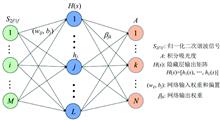
The engine is the core component of the vehicle power system. The dynamic monitoring of the engine flow field can grasp the combustion situation of the internal flow field of the engine, which is of great significance for the vehicle condition monitoring and performance evaluation. Therefore, advanced diagnostic technology is the basis for the development of engine technology and one of the necessary conditions for the development of new aerospace vehicles. The laser absorption spectroscopy technique can realize the measurement of gas parameters in the combustion field, and the absorption spectroscopy wavelength modulation technique (WMS) can improve the signal-to-noise ratio in the harsh flow field environment of the engine. However, the WMS-based methods for solving the integrated absorbance, temperature, and concentration are centered on simulated annealing algorithms (SA) and suffer from long execution times. Based on the intrinsic correlation of the spectral parameters of the flow field evolving and the light distribution as fixed information, a machine learning method is used to model the harmonic signal (S2f/1f) and the integrated absorbance (A), and the extreme learning machine algorithm (ELM) is selected, which has a short training time and fast prediction results. Using the neural network's property can approximate the true value, the simulation determines S2f/1f and A for different flow field models under light layout and constructs data sets to carry out model training for the neural network. In the method validation, 2 000 data sets were simulated, 1 800 sets were selected as the training set to train the model, and the remaining 200 sets were used as the prediction set. The average relative error of the predicted integrated absorbance of the test set was 1.058%, and the coefficient of determination was 0.999, which verified the reliability of the training model. Random noise of 3% and 5% was added to the input S2f/1f data set, and the average relative errors of predicted integrated absorbance were 1.89% and 3.2%, respectively, which showed that ELM has better noise resistance. Based on this method, experimental validation was carried out on a direct-connected scramjet with a practical test duration of 5 s and about 10GB of collected data, and the integrated absorbance was solved by both ELM and WMS methods respectively, and the results were consistent. Compared with the WMS method, which takes several hours to perform, the ELM predicts the integrated absorbance in about 15 seconds, enabling the rapid measurement of the integrated absorbance of the engine flow field.
May. 01, 2022Vol. 42 Issue 5 1346 (2022)
Bin HU, Hao FU, Wen-bin WANG, Bing ZHANG, Fan TANG, Shan-wei MA, and Qiang LU
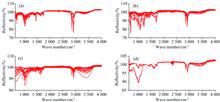
Due to the advantages of high speed and high accuracy, infrared spectra play a vital role in classification and identification. For municipal solid wastes, the application of infrared spectra mainly focuses on recyclable garbage such as plastics, neglecting the deep separation of the non-recyclable wastes. Based on the current “Quartering Method” of municipal solid wastes, the residual wastes contain various high-value potential ingredients that can be sorted into cellulose, vinyl-polymers, and woods. These ingredients have different constituents and structures, so they have different infrared spectra. Therefore, the useful constituents can be further separated from the residual wastes by combing their infrared spectra and the machine learning classification models. This study collected cellulose, vinyl-polymers, woods, and low-value residual wastes, and 72 groups of infrared spectra data were obtained. The influence of data preprocessing, dimension reduction and algorithms on the sorting models' accuracy was investigated. Infrared spectra data were preprocessed by standard normal variate (SNV), multiplicative scatter correction (MSC), derivative correction (DC), and smooth. Principal component analysis (PCA) was used to reduce the dimension of the preprocessed data, and 72×8 and 72×5 datasets were obtained. Sorting models were built using probabilistic neural network (PNN), generalized regression neural network (GRNN), support vector machine (SVM), and random forest (RDF) algorithms. As a result, the classification accuracy of 5-Dimensional data was superior to that of 8-Dimensional data, with the average accuracy increasing 2.4%~4.4%. Based on 5-Dimensional data, DC/Smooth preprocessing achieved the highest average accuracy of 96.5% among the three preprocessing methods. The average accuracy of the PNN model was 4.2%~6.5% higher than the other three sorting models, up to 98.1%. As for the four types of residual wastes, the sorting accuracy for vinyl polymers was 93.8%, it was over 95% for cellulose and woods, and it could be up to 100% for the low-value wastes. This study examined the possibility and scientific potentiality of the combination of infrared spectroscopy and machine learning to achieve the deep sorting of residual wastes, providing a theoretical basis for the future development of fast and accurate deep separation equipment of municipal solid wastes.
May. 01, 2022Vol. 42 Issue 5 1353 (2022)
Ling-tong YAN, Li LI, He-yang SUN, Qing XU, and Song-lin FENG
Fired clay products can absorb water molecules and be re-hydroxylated, and the amount of structural hydroxyl groups generated has a certain relationship with the storage time. Based on the theory of rehydroxylation in fired-clay, thermogravimetric analysis can be used to study the dating of pottery products. Infrared and Raman spectroscopy techniques can also be used to analyze the structural hydroxyl information in mineral materials, so people hope to explore the use of spectral non-destructive analysis for dating traditional ceramics instead of the thermogravimetric method. In order to verify the feasibility, we collected a variety of typical raw materials and traceable ancient ceramic potshards in this paper and analyzed their internal structural hydroxyl groups by infrared and Raman spectroscopy. The obvious peaks of aluminum hydroxyl in orthoclase, porcelain clay and kaolinite can be observed in the range of 3 600~3 700 cm-1 both in infrared and Raman spectra. When analyzing traditional ceramic samples, there is no peak of the structural hydroxyl group in this range in the infrared spectrum. When the wavelength of the excitation light of the Raman spectroscopy is 532 nm, two obvious peaks can be observed in the range of 3 600~4 000 cm-1 in the spectra of many samples. When the wavelength was changed, there was no peak in the corresponding rang. Especially when the excitation light wavelength is 514 nm, two peaks can be observed at 4 288 and 4 512 cm-1. The peaks observed when the excitation light wavelengths are 532 and 514 nm can correspond to about 659 and 669 nm in the wavelength mode of Raman spectra. The results showed that when the excitation light wavelength is 532 nm, the two peaks observed in the range of 3 600~4 000 cm-1 in the Raman spectrum should not be characteristic signal of structural hydroxyl groups in minerals, but rather sharp fluorescence peak. Under current technical conditions, infrared and Raman spectroscopy is difficult to be applied for rehydroxylation dating of Chinese traditional high-temperature ceramic products.
May. 01, 2022Vol. 42 Issue 5 1361 (2022)
Yan-de LIU, Mao-peng LI, Jun HU, Zhen XU, and Hui-zhen CUI
The granulation of navel orange affects consumers' taste and reduces its quality. It has attracted the attention of fruit farmers and consumers. The detection of navel orange granulation is challenging and has great significance for quality classification. In this paper, the different granulation degrees of Gannan navel oranges are used as the research object to explore the qualitative determination of the granulation degree of Gannan navel oranges by using hyperspectral detection technology. Since the degree of granulation of navel oranges cannot be judged by the naked eye, the samples of navel oranges are marked with serial numbers, and then the spectrum is measured. Finally, the samples were cut to determine the degree of granulation. According to the degree of granulation, it is classified as non-granulation (the granulation area is 0%); light granulation (granulation area less than 25%); and medium granulation (granulation area 25%~50%). Take 3 points uniformly at the bottom of these three types of navel oranges, each with 174 samples, and a total of 522 sample data are used as the rows for constructing the spectral matrix. The near-infrared hyperspectral imaging system was used to collect the hyperspectral image information of the sample in the 397.5~1 014 nm band and then use the ENVI 4.5 software was used to extract the average spectral information the sample by selecting the Region of Interest (ROI). Three dimensionality reduction methods: Principal Component Analysis (PCA), Successive Projections Algorithm (SPA), and Uninformative Variable Elimination (UVE) are used to reduce the dimensionality of the spectral data to eliminate irrelevant variables and extract useful information. The original spectrum has 176 wavelengths. PCA selects 6 principal component factors. SPA selects 17 characteristic wavelengths, and UVE selects 54 characteristic wavelengths. The full spectrum data and the variables selected by the three-dimensionality reduction methods are used as input to establish Partial Least Squares Discriminant Analysis (PLS-DA) and Least Squares Support Vector Machines (LS-SVM) model. In the established PLS-DA modeling method, the highest false positive rate of PCA-PLS-DA is 25.58%, and the lowest false-positive rate of UVE-PLS-DA is 5.38%. The LS-SVM modeling method is based on the two kernel functions of RBF-Kernel and LIN-Kernel, and the effect of RBF-Kernel modeling is better than that of LIN-Kernel generally. And the model established after UVE wavelength screening is better than other dimensionality reduction methods, which reduces the model's false positive rate. The UVE-LS-SVM model based on RBF-Kernel has the best effect and the highest detection accuracy, and the total misjudgment rate of classification is 0.78%, achieves the best results. This study shows that the established model can distinguish navel oranges with different granulation degrees. The model reduces the spectral dimension while also reducing the misjudgment rate with only 30.68% of the data, which is useful for promoting the quality of the navel orange industry with certain practical significance.
May. 01, 2022Vol. 42 Issue 5 1366 (2022)

Rong-hua JI, Ying-ying ZHAO, Min-zan LI, and Li-hua ZHENG
Poor generalization ability of soil nitrogen content prediction models based on spectroscopy is the bottleneck of its actual application in agriculture production. However, the deep learning model shows strong potential for generalization because of its automatic feature extraction and excellent nonlinear expression. In this paper, a spectral prediction model of soil nitrogen content combining the auto-encoder and convolutional neural network (Encoder-CNN) was proposed, the influence of model structure and parameters on model performance was explored, and its generalization ability was investigated. After researching the previous references and analyzing the correlation between wavelengths and soil nitrogen content, 180 wavelengths with the highest correlation were selected and taken as the input of the Encoder-CNN model. The output of the Encoder-CNN model was the soil nitrogen content. The Encoder-CNN model first used the auto-encoder to reduce the dimension of 180 wavelengths and then predicted the soil nitrogen content by its convolutional neural network. Two network structures were designed. Each network structure had two different parameter settings. Therefore, four models were used to explore the effects of structure and parameters of the Encoder-CNN soil nitrogen content spectral prediction model on modeling performance. Encoder CNN models were trained by the LUCAS data set. According to the 3σ principle, 20 791 data were obtained from LUCAS and then divided into a training set (18 711) and test set (2 080). The results were analyzed and discussed, and several conclusions were achieved in this research. The reproduction effect of the automatic encoder reached the best when the number of neurons in the last hidden layer was set to 30 with the same number of hidden layers as the others; the more hidden layers, the better the reproduction effect. As for the prediction part based on CNN, increasing the number of convolution kernels, especially 1×1 convolution kernels, could improve the prediction performance and reliability. By adding pooling layer in CNN, the model's prediction accuracy was improved to more than 0.90. The model's performance could also be improved by increasing the number of neurons in the full junction layer. The Encoder-CNN model built by the LUCAS data set was migrated to the Heilongjiang data set, and the generalization ability of the model was observed and evaluated. The prediction accuracy of the model, which was trained 100 times by the Heilongjiang data set, could reach more than 0.90. When the number of iterations was set to 900, the model's prediction accuracy could be as high as 0.98. The results showed that the proposed Encoder-CNN spectral prediction model of soil nitrogen content had good generalization ability, and it could be used to detect soil nitrogen content after the model migration process.
May. 01, 2022Vol. 42 Issue 5 1372 (2022)
Liu ZHANG, Jia-kun ZHANG, Xue-ying Lü, Hong-zhen SONG, and Wen-hua WANG
Aiming at the problem of a large amount of spectral data and low reconstruction accuracy in the field of spectral reconstruction, a spectral tunable spectral reconstruction method is proposed. Prior to this, domestic and foreign-related research were carried out based on hundreds of film systems, and the calculation process was relatively complicated. This method uses 10 film systems to conduct experiments against different monochromatic light sources and perform the spectral reconstruction. Linear equations can express the mathematical model of spectral reconstruction. During the experiment, it will be interfered with by various error sources, such as the error between film processing and design, the fitting error of the detector quantum efficiency, the stray light interference error, the error of grey value selection, etc. These error sources cause the linear equations to become ill-conditioned equations, resulting in an inaccurate solution of the target spectrum information. In calculating the target spectral information, firstly, the convex optimization algorithm is used to solve the initial value of the target spectral information with errors in the wavelength range of 400~900 nm, and the initial fitting is performed to obtain the spectral curve with errors. Then use the known spectral curve information to determine the effective wavelength range of the target spectrum, expand and contract the target spectral range, perform a secondary local calculation in this range, and obtain the spectral information within the local wavelength. Then the local spectral information is locally fitted, combined with the initial fitting results, and a new target spectral fitting curve is obtained, which further improves the accuracy of the spectral reconstruction and obtains a higher-precision target spectral curve. The evaluation index for reconstruction accuracy not only adopts the widely used ARE, MSE and RQE at home and abroad but also proposes a new index for evaluating the accuracy of spectral reconstruction for the first time, which is to calculate the MSE value every 10 nm within the effective wavelength range of the target. If the MSE value per 10 nm is less than 0.1, the spectrum reconstruction accuracy is considered to have reached 10 nm. This method effectively avoids the serious deviation from the true value in the solution and provides constraint conditions during the convex optimization solution process, which is beneficial to improving the reconstruction accuracy. Experimental results show that this method can achieve a minimum MSE of 0.002 3 every 10 nm under the condition of ensuring high accuracy of MSE, ARE and RQE. The tunable spectrum reconstruction method based on spectrum achieves the effect of high-precision reconstruction of the target spectrum and achieves data dimensionality reduction. This method provides a new idea for the work direction in spectral reconstruction and has great application value in engineering.
May. 01, 2022Vol. 42 Issue 5 1378 (2022)
Rong-chang JIANG, Ming-sheng GU, Qing-he ZHAO, Xin-ran LI, Jing-xin SHEN, and Zhong-bin SU
Traditional chemical detection methods for analyzing pesticide residues in chinese cabbage are slow and destructive. In this study, a rapid, non-destructive method for identifying the types of pesticide residues in chinese cabbage samples was developed. First, the hyperspectral imaging system was used to analyze chinese cabbage samples exposed to one of four pesticides chlorpyrifos, dimethoate, methomyl and cypermethrin. The pesticide concentration ratios were 0.10, 1.00, 0.20 and 2.00 mg·kg-1, respectively; and the data was compared to a pesticide-free sample. After 12 hours of natural degradation at room temperature, a hyperspectral imaging system corrected by a black and white plate was used to obtain 400~1 000 nm hyperspectral images of chinese cabbage samples, and the target area was selected by ENVI software. The specific regions of interest (ROI) in samples were further investigated, and the pre-processing by multiple scattering correction (MSC). Secondly, three algorithms such as competitive adaptive reweighting algorithm (CARS), principal component analysis (PCA), discrete wavelet transform (DWT) (based on db1, sym2, coif1, bior2.2, and rbio1.5 wave base functions) were then used to screen for dimensionality reduction from optimally pre-processed results. Finally, the screening results and the samples divided by the Kennard-Stone algorithm were adopted to construct three recognition models separately. Such as k-nearest-neighbor (KNN), support vector machine (SVM), multilayer perceptron (MLP) and convolutional neural network (CNN) were used to determine the best screening method for the dimension of pesticide residues and the optimal hyperspectral recognition model. Our results showed that the CNN, MLP, KNN, and SVM algorithms achieve the best overall accuracy (91.20%, 83.20%, 66.40%, and 90.40%, respectively), Kappa coefficient (0.89, 0.79, 0.58, and 0.88), and the prediction set time (86.01, 63.23, 20.02 and 14.03 ms) under the dimensionality reduction algorithm DWT, respectively; the wavelet basis function and the number of transform layers are coif1-2, coif1-4, bior2.2-2 and sym2-2. All three indicators are better than the modeling results based on CARS and PCA dimensionality reduction algorithms. It showed that the combination of discrete wavelet transform and convolutional neural network shortens the time of classification and identification and significantly improves the classification and identification accuracy, and improves the Hughes phenomenon, providing a new method for non-destructive and rapid detection and identification of chinese cabbage pesticide residues.
May. 01, 2022Vol. 42 Issue 5 1385 (2022)
Shuai-shuai ZHANG, Jun-hua GUO, Hua-dong LIU, Ying-li ZHANG, Xiang-guo XIAO, and Hai-feng LIANG
Subwavelength grating structures exhibit excellent notch filtering properties. The classical design is to find the optimal solution by setting the geometric structure parameters of the subwavelength, solving Maxwell's equations, and setting an optimization algorithm. It consumes a lot of time and computing resources. This paper presents an inverse design method based on deep learning and constructs a series neural network which can realize both forward simulation and inverse design. The Tensorflow library based on Python language is constructed to optimize the height of uniform waveguide layer, the height of sub-wavelength grating, refractive index, period and duty cycle, and to study the characteristics of sub-wavelength grating notch filtering in the range of 0.45~0.7 μm. Using rigorous coupled wave analysis (RCWA) numerical simulation to generate 23 100 data sets, 18 480 data sets were randomly selected as training sets, and 4 620 data sets were used as test sets, the network node and Batch were studied. The results show that the network performance is best when the network model structure is 5×50×200×500×200×26, and the Batch size is 128 after 1 000 iterations. Compared with the independent network model, the loss rate of the forward simulation test set of the series neural network decreased from 0.033 63 to 0.004 5, and that of the reverse design decreased from 0.702 98 to 0.052 98. At the same time, the problem that the network can not converge in the reverse design process caused by the non-uniqueness of data is solved. The geometric structure parameters of the sub-wavelength grating are given in 1.35 s on average by inputting any spectral curve into the trained network, and the correlation between the parameters and the RCWA numerical simulation curve is analyzed, the similarity coefficients of the curves were all greater than 0.658 1, which belonged to strong correlation. In addition, a red, green and blue notch filter is designed, whose peak reflectivity can reach 98.91%, 99.98% and 99.88% respectively. Compared with the traditional method, this method can quickly and accurately calculate the geometric parameters of the grating. It provides a new method for sub-wavelength grating design.
May. 01, 2022Vol. 42 Issue 5 1393 (2022)
Ya-fei YANG, Cai-xin ZHANG, Hua CHEN, Wei-bin ZHANG, Yong TIAN, Ding-hua ZHANG, and Kui-dong HUANG
Dual-energy computer tomography (CT) or spectral CT can obtain the equivalent atomic number of materials, which is very important for the composition detection and production process improvement of energetic materials. However, the existing methods have some disadvantages, such as high complexity, high equipment requirements. In order to improve the measurement accuracy of equivalent atomic numbers, and reduce the equipment requirements and algorithm complexity, a simple method based on the new CdTe photon counting detector is proposed to obtain the equivalent atomic number of materials. In this method, the relationship between the linear attenuation coefficient ratio in two energy bins and the equivalent atomic number is re-deduced using the attenuation characteristics of materials. This method does not rely on the professional knowledge of dual-energy CT or spectral CT. Only the photon-counting detector is used to scan and reconstruct the spectral CT of three known materials, the calibration curve of the equivalent atomic number can be obtained, and the equivalent atomic number of unknown materials can be measured. In practical application, as long as the calibration experiment and measurement experiment are carried out under the same scanning conditions, the influencing factors such as reconstruction errors, detector response errors, beam hardening effects, and scattering effects can be included in the calibration curve (equivalent to re re-calibrating the National Institute of Standards and Technology data under specific scanning conditions), and the influence of above factors on the final result can be restrained. Compared with other methods, this method is more robust and versatile and greatly reduces equipment requirements and algorithm complexity. At the same time, energy bins allowed by this method are relatively wide, which can make full use of the photons emitted by the detector. Therefore, this method makes the detection efficiency meet the needs of industrial detection and medical imaging and has a good commercial application prospect. The experimental results show that relative errors of equivalent atomic numbers measured by this method are less than 2% and have high reliability under current calibration ranges (equivalent atomic number 6~13) and scanning conditions. In the actual production detection of energetic materials, this method effectively judged the high-attenuation impurities without destroying the energetic materials. It is pointed out that the high-attenuation impurities are high-atomic number impurities mixed in the actual production process, rather than high-density concentrated energetic materials. This shows that this method can effectively solve the problem of composition detection in the actual production and testing of energetic materials and is expected to promote the improvement of the energetic material production process, which has great engineering significance.
May. 01, 2022Vol. 42 Issue 5 1400 (2022)
Ling-ling WANG, Bo WANG, Feng XIONG, Lu-cun YANG, Jing-jing LI, Yuan-ming XIAO, and Guo-ying ZHOU
Mineral elements are closely related to the efficacy of traditional Chinese medicine. They affect the synthesis of secondary metabolites by regulating the activities of various enzymes in the secondary metabolism pathway, which is an indispensable characteristic parameter for the quality control of traditional Chinese medicine. In order to effectively identify the quality differences of Astragalus membranaceus, the characteristic elements of Astragalus membranaceus and their relationship with the region were found out. The species and contents of mineral elements in Astragalus membranaceus from different areas in Qinghai Province were determined by ICP-OES. The data were analyzed by cluster analysis and principal component analysis (PCA) with SPSS 22.0 and R package respectively. 12 kinds of elements in Astragalus membranaceus were determined. The results of PCA showed that Ca, Fe, Li, P, K, Mg, Zn, AL, Na were characteristic elements of Astragalus membranaceus; the clustering analysis results showed that the types and contents of mineral elements in the samples were related to the producing area. When the Euclidean distance was 8, the samples could be clustered into three categories: S12 was clustered into one group, S1, S2, S4, S5, S6, S7, S10, S11, S13, S16 could be clustered into one category, the other samples were in one group. Combining with the distribution map of ArcGIS, the relationship between producing area and its quality can be seen more intuitively. In addition, the distribution characteristics of inorganic elements in Astragalus membranaceus were established. The similarity of the characteristics of inorganic elements in Astragalus membranaceus from different areas was more than 0.996. Therefore, the fingerprint can be used to identify and analyze Astragalus membranaceus from different areas. From the results of PCA of element content, the quality of Astragalus membranaceus produced in S10 (Naka village, Donggou Township, Huzhu county) was the best, the total factor score F was the highest, followed by S7 and S8, which showed that the quality of Astragalus membranaceus in Huzhu county was good. The results show that Astragalus membranaceus is rich in mineral elements, and its content is affected by the place of production. Paying attention to the content and types of elements in the medicinal materials is a supplementary explanation of the pharmacological components and can further reveal the quality from the perspective of elements. The results provide a reference basis for the development and utilization of resources and quality identification of Astragalus membranaceus and provide a guarantee for quality and safety control it.
May. 01, 2022Vol. 42 Issue 5 1407 (2022)
Bing HAN, Dan-dan SUN, Wei-hao WAN, Hui WANG, Cai-chang DONG, Lei ZHAO, and Hai-zhou WANG
The low control accuracy and large fluctuation of the composition and microstructure in the micro-scale of the material are the fundamental reasons restricting the localization process of high-speed train aluminum alloy. Therefore, studying the composition uniformity of large size aluminum alloy from the micro scale is very important. Because the research area of microsegregation in aluminum alloy is usually small, the research method of macrosegregation is too simple. In this paper, the distribution results of alloy elements in the 7B05 aluminum alloy sheet were obtained by micro-beam X-ray fluorescence, and the composition distribution data were analyzed from the point, line, surface, frequency distribution. The results show a segregation band of about 2 mm in the central layer of the cast and rolled 7B05 aluminum alloy section. Al, Cr, Ti and Zr are positive segregation elements, and the content of the central layer is higher than that of the upper and lower layers. Cu, Fe and Zn are negative segregation elements, and the content of the central layer is lower than that of the upper and lower layers. The results show that the degree of statistical segregation of each element is small as a whole, the most uniform distribution is the Al element, and the minimum degree of statistical segregation is 0.01. The distribution of Ti and Fe elements is not uniform, and the degree of statistical segregation is 0.81 and 0.6 respectively. The obvious point segregation of Fe and Mn in the plane distribution is since the intermetallic compounds formed by microscopic segregation during the casting process break into several continuous arranged second phases during the subsequent hot rolling forming. Laser-induced breakdown spectroscopy (LIBS) is used to verify the data obtained by this method. The results show that the surface distribution and line distribution of elements measured in the size range of 168 mm2 are consistent with the fluorescence results, proving this method's repeatability and reliability. In conclusion, the calculation of point, line, plane, frequency distribution and segregation degree of the cast and rolled 7B05 aluminum alloy by using the method of micro-beam X-ray fluorescence combined with in-situ statistics can provide a large amount of analytical data, which is of great significance for the quantitative study of the fluctuation trend of microstructure and properties of rolled sheet in a large size range.
May. 01, 2022Vol. 42 Issue 5 1413 (2022)
Chun-hui FAN, Jin-huan ZHENG, and Hong-xin LIU
Soil remediation is the key issue supported by the national government in the 14th Five-Year Plan for Economic and Social Development of P. R. China, and also important for socially sustainable development. Phytoremediation might remove metals from the soil more effectively compared to other methods. As the dominant location of metabolism in a plant cell, protoplast can get respond greatly to the reaction signal to heavy metals, similar to that of the plant cell wall. Currently, it is also significant to further reveal the remediation mechanism and response signal between plant protoplast and heavy metals during the phytoremediation process, with spectral analysis methods than molecular diagnostic techniques. Calendula officinalis was obtained via pot experiments under lead/cadmium contaminated soil, and the protoplast sample was derived with differential centrifugation technology. Tessier's Sequential Extraction Procedure-Atomic Absorption Spectrometry (AAS) was applied to study lead/cadmium speciation variation. The X-ray diffraction pattern (XRD), Fourier transform infrared spectroscopy (FTIR), two-dimensional infrared spectroscopy (2D-IR) and X-ray photoelectron spectroscopy (XPS) were used to investigate the spectral characteristics of protoplast under different lead/cadmium contents. The results show: the exchangeable contents of lead/cadmium in protoplast are relatively low, and the contents of cadmium with different speciation change little under different lead/cadmium concentrations in soil. The representative peak located at 31.7° in the XRD pattern, the evidence of sodium chloride crystal, and peaks of Pb5(PO4)3Cl and CdS could also be easily found. The dominant absorbance band in FTIR spectra appears at 3 510 cm-1, caused by the vibration of —OH. The peak becomes complicated and moves to some extent, and functional groups of —OH and C=O show a preferential combination to lead/cadmium, indicated from 2D-IR spectra. The elemental binding energies of C and O vary during the reaction in XPS spectra. The binding energy of C(1s) increases, and C atoms involve in complexation. The moving peak of O(1s) suggests the reaction nature might be complex. The new peak of Pb(4f) is caused by the interaction of π electron and lead ions. The binding energy of Cd(3d) increases at higher lead/cadmium contents, and cadmium would lose electrons during the reaction. The achievements, together with the results related to metals and Calendula officinalis cell wall obtained previously, will play an important role in the theory and technological improvement of phytoremediation.
May. 01, 2022Vol. 42 Issue 5 1420 (2022)
To detect and prevent potato late disease, the peroxidase (POD) activity of potato late-blight leaves was predicted by spectroscopic techniques, and the prediction of potato late-blight disease was realized based on POD enzyme activity. The spectral reflectivity and POD enzyme activity of potato leaf samples in different temperature, humidity and inoculation time conditions were collected and measured. And the Mean Centering method is ultimately chosen, which is used to eliminate the error of the original spectral data. In order to reduce the complexity of the model, RF, SPA and CARS algorithms were used to filter the wavelengths, and the results showed that the partial least-square regression (PLSR) prediction model was established by using the spectral data at 72 characteristic wavelengths which are extracted by the CARS algorithm was the best. The coefficient of determination Rp2 of the prediction set is 0.958 1, and the root means square error RMSEp is 25.698 6 U·(g·min)-1. Finally, the RBF radial basis network was used to fit the relationship between POD enzyme activity, temperature, humidity and inoculation time and established a kinetic model of POD enzyme activity. So the prediction of the disease period of potato late blight based on POD enzyme activity was further realized. The results proved the feasibility of using spectroscopy to rapidly determine POD enzyme activity to predict potato late blight.
May. 01, 2022Vol. 42 Issue 5 1426 (2022)
Li-qi WANG, Jing YAO, Rui-ying WANG, Ying-shu CHEN, Shu-nian LUO, Wei-ning WANG, and Yan-rong ZHANG
Soybean meal is a by-product of soybean oil extracted from soybean after proper drying and heat treatment. It is the main raw material for making livestock feed, and its quality determines the nutritional value. There are many problems with existing soybean meal quality detection methods, such as the use of toxic chemical reagents, complex operation, long analysis time, so they cannot meet the needs of rapid detection and control in the production process. This paper proposes a multi-component detection method of soybean meal quality based on near infrared spectroscopy for on-line detection and control of product quality. 449 soybean meal samples were collected from the soybean oil processing line. The chemical values of moisture, protein and fat were determined by 105 ℃ oven method, Kjeldahl nitrogen determination method and Soxhlet extraction method, respectively. The diffuse reflectance spectra of samples were collected by the Swiss Buchi NIRMaster Fourier Transform near-infrared spectrometer. Firstly, the Mahalanobis distance method was used to remove abnormal samples, and then the spectral denoising was processed by various methods. The results show that the wavelet denoising effect is the best. KS and SPXY algorithms were used to determine the optimal sample partition of different components. In order to investigate the NIR absorption characteristics of soybean meal components, eliminate spectral redundancy and reduce the computational complexity of the model, interval Partial Least Squares (iPLS) was used to extract the features from the whole spectrum of 4 000~10 000 cm-1. The optimized characteristic absorption bands of moisture, protein and fat were 4 904~5 200, 4 304~4 600 and 4 304~4 600 cm-1, respectively. Finally, a Generalized Regression Neural Network (GRNN) model was established to predict the component contents of soybean meal. In order to reduce the input variables and the network scale improve the operation speed, PLS was used to reduce the dimension of spectral data, and the principal factor score was extracted as the input variable of GRNN. The PLS-GRNN prediction models of soybean meal multi-component contents were established by optimizing the smooth factor spread through the cross-validation and compared with the classical PLS and BP models. The results show that the PLS-GRNN models are good, the prediction determination coefficients (R2) of moisture, protein and fat are 0.976 9, 0.940 2 and 0.911 1, the Root-Mean-Square Errors of Prediction (RMSEP) are 0.091 2, 0.383 4 and 0.113 4, the Relative Standard Deviations (RSD) of prediction are 0.79 %, 0.83 % and 8.53 %, respectively. Although the prediction error for fat is relatively large, it is also within the available range of the model evaluation criteria. The results show that the near infrared spectroscopy analysis based on PLS-GRNN is feasible to detect soybean meal quality and can be used for quality monitoring in the actual production process.
May. 01, 2022Vol. 42 Issue 5 1433 (2022)
Yong ZHAO, Men-yuan HE, Bo-lin WANG, Rong ZHAO, and Zong MENG
Mycoplasma pneumoniae is the main cause of human respiratory diseases. Clinically, the symptoms of patients infected with different mycoplasma pneumoniae are very similar, so it is difficult to distinguish the type of mycoplasma pneumoniae according to the symptoms and give medication. Therefore, the accurate identification of mycoplasma pneumoniae strain type is of great significance for the pathogenesis and epidemiological research of the disease, and accurate clinical treatment. Raman spectrum has been paid more and more attention because of its advantages of fast-speed, high efficiency, pollution-free and non-destructive analysis. One-dimensional Convolution Neural Network (1D-CNN) is a kind of pre-feedback network with a deep structure, including Convolution operation. It has been successfully applied in the analysis of speech and vibration signals. The combination of the One-Dimensional Convolution Neural Network and the Raman spectral data of the main genotypes of mycoplasma pneumoniae M129 and FH were used as the research objects to realize mycoplasma classification pneumoniae strains. The spectral data enhancement method expands the original spectral data set, and the one-dimensional convolution neural network model was trained, and the problem of data hunger of convolutional neural network caused by small samples was solved. In order to obtain the best classification effect of mycoplasma pneumoniae and accelerate the learning process, the model structure was optimized, and the best model parameters were determined. Gaussian noise, Poisson noise and multiplicative noise are often mixed in Raman spectral measurement. Gaussian noise, Poisson noise and multiplicative noise are often mixed in Raman spectral measurement. In order to optimize the anti-noise ability of the model, Gaussian noise, Poisson noise and multiplicative noise were superimposed on the original spectrum respectively, and the 1D-CNN model was trained and compared with the models built by traditional algorithms such as LDA, KNN and SVM. The experimental results show that for the Raman spectra superimposed with Gaussian noise, Poisson noise and multiplicative noise, the classification accuracy of the models based on 1D-CNN method has achieved 98.0%, 97.0% and 97.0%, respectively, which are all much higher than those of the models based on LDA, KNN and SVM algorithms. At the same time, the 1D-CNN model can achieve 92.5% classification accuracy when the noise reacheds the 55 dBW interference factor, aiming at the noise with different intensities of 5, 15, 25, 35, 45 and 55 dBW.Therefore, it is feasible to apply a one-dimensional convolutional neural network combined with Raman spectrum technology to the classification of mycoplasma pneumoniae strain types, which has the advantages of strong anti-noise ability and high classification accuracy. This study provides a new idea for the rapid diagnosis of mycoplasma pneumoniae pneumonia.
May. 01, 2022Vol. 42 Issue 5 1439 (2022)
Qing-hu JIANG, Feng LIU, Dong-yue YU, Hui LUO, Qiong LIANG, and Yan-jun ZHANG
Herba Epimedii contains high amounts of flavonoids, such as epimedin and icariin, which are efficient in tonifying kidney and improving immunity. Nowadays, various chemical analysis methods have been applied to measure the flavonoid content of Herba Epimedii. However, these traditional methods are destructive, time-consuming, and costly and cannot meet the requirements of massive samples analysis in pharmaceutical production and plant breeding. As a rapid and effective tool for quantitative determination and process monitoring, modern hyperspectral analysis technology has earned more and more concerns. However, for the full-range spectra, the existence of insignificant and irrelevant spectral variables can weaken the calibration models' accuracy and efficiency. Therefore, the spectral variables selection is essential to improve the performance of the final models by eliminating the uninformative bands. In this study, the partial least squares regression (PLSR) coupled with the genetic algorithm (GA) variables selection procedure, namely GA-PLSR, was used to estimate epimedin A, epimedin B, epimedin C, and icariin content in Herba Epimedii. This paper aims to explore the feasibility of hyperspectral analysis technology in the measurement of the pharmacologically active constituents in Herba Epimedii and further explore their important spectral response bands. The results show thatthe hyperspectral analysis technology combined with chemometrics exhibited considerable potential for rapid and nondestructive assessment of Herba Epimedii. When compared with full-spectrum PLSR models, GA-PLSR models could improve the accuracies and robustness of epimedin A, epimedin B, epimedin C, and icariin content measurements (with RCV2 values increased from 0.645, 0.720, 0.718, and 0.642 to 0.671, 0.835, 0.782, and 0.796, and with RMSECV values declined from 2.102, 2.896, 21.069, and 1.221 to 2.071, 2.230, 18.656, and 0.912, respectively). Besides, we found some feature wavelengths, mainly around 690~740 and 420 nm, which play important roles in detecting pharmacologically active constituents in Herba Epimedii. Given these desirable findings, this study can provide a valuable reference for the rapid and accurate measurement of epimedin A, epimedin B, epimedin C, and icariin contents by hyperspectral technology, can provide a theoretical basis for the design of spectral sensors in qualifying Herba Epimedii.
May. 01, 2022Vol. 42 Issue 5 1445 (2022)
Lu-lu DAI, Ming-xing YANG, and Hui-lin WEN
The Hetian Yu from Maxianshan have important gemological and archaeological cultural value in Gansu province. The origin discrimination is divided into a research focus for Hetian Yu from Maxianshan. In this paper, through testing and analyzing chemical compositions of Hetian Yu from Maxianshan, comparing its chemical compositions with the main domestic origins of Hetian Yu, and establishing discriminant models for the origins of trace elements, it explores the identifications of Hetian Yu from Maxianshan in Gansu and providing data supports for the traceability of ancient jade artifacts of the Qijia Culture in Gansu. Electron probe analysis of the main elements of Hetian Yu from Maxianshan shows that main component is tremolite. The trace elements and REE of Hetian Yu from Xinjiang, Qinghai, Liaoning, Jiangsu, Guizhou and Gansu provinces were analyzed by laser ablation inductively coupled plasma mass spectrometer (LA-ICP-MS), and show that there were differences in the trace elements, REE parameters and the REE distribution patterns of Hetian Yu from Maxianshan with other origins, which could be used to discriminant Hetian Yu from different origins. Three-dimensional scatter map ΔCe-Σ REE-LREE/HREE can discriminant the origins of Hetian Yu from Qinghai, Liaoning, Jiangsu and Guizhou provinces but can not discriminant the Hetian Yu from Xinjiang and Gansu provinces. SPSS software was used to establish a linear origin discrimination model for trace elements of Hetian Yu in Maxianshan, Xinjiang Uygur Autonomous Region, Qinghai, Liaoning, Jiangsu, Guizhou provinces. For six known origins: Xinjiang Uygur Autonomous Region, Qinghai, Liaoning, Jiangsu, Guizhou, Gansu provinces, the correct rate of discriminant analysis and cross-validation can reach 100.0% and 90.3%. There are 10 sets of Maxianshan data reserved, and the correct rate of back-generation verification is 100%. The linear origins discrimination model of trace elements has a good effect in the discrimination of Hetian Yu from various origins.
May. 01, 2022Vol. 42 Issue 5 1451 (2022)
Peng-cheng YAN, Chao-yin ZHANG, Quan-sheng SUN, Song-hang SHANG, Ni-ni YIN, and Xiao-fei ZHANG
The detection and analysis of power transformer oil is an effective method for power transformer fault diagnosis, and it is of great significance to quickly identify the oil sample of power transformer oil for power transformer fault diagnosis. The detection technology of conventional power transformer oil is mainly gas chromatography, which is complicated and not suitable for on-line detection, and it can't find the fault hidden danger of transformer in time. A method for transformer fault diagnosis of laser-induced fluorescence spectroscopy (LIF) technology and extreme learning machine (ELM) algorithm is proposed. Four oil samples were collected: thermal fault oil, electrical fault oil, local moisture-affected oil and crude oil. The spectral data of different oil samples are obtained by using a laser generator to emit fluorescence. The spectral data are processed by MSC and SNV preprocessing algorithms to prevent noise and other factors. Subsequently, the use of KPCA and PCA dimension reduction, the main components are taken 5, KPCA processing shows that MSC pretreatment of the cumulative contribution rate of the highest, 99%, MSC pre-processed PCA model cumulative contribution rate is still more than 95%, Original-KPCA and Origin-PCA model cumulative contribution rate of less than 65%, you can find that the use of pretreatment model, cumulative contribution rate has increased. Finally, the data after the two dimensions are regression fit by ELM. Experiments show that KPCA and PCA are two kinds of dimensional reduction methods. The KPCA algorithm performs best, the processing time is short, and the reliability and efficiency of the model are improved. In the same KPCA dimension reduction mode, the fitting excellence R2 of the MSC-ELM model is 0.999 41, the mean square error MSE is 0.074%, and the SNV-ELM fit is 0.999 08, the mean square error MSE is 0.129%, The Original-ELM fitting excellence R2 is 0.996 95, the mean square error MSE is 0.399%, and the comparison can be found that MSC is better than SNV after processing. The MSC-KPCA-ELM model performs best, the prediction value is closer to the real value. The mean square root error is the smallest. The results show that the MSC-KPCA-ELM model, combined with laser-induced fluorescence spectroscopy technology, is more suitable for the rapid diagnosis of whether or not the power transformer has failed, which type of fault is accurately determined, and the operation safety of power equipment is guaranteed.
May. 01, 2022Vol. 42 Issue 5 1459 (2022)
Yang TAN, Xiao-hong WU, Bin WU, Yan-jun SHEN, and Jin-mao LIU
Infrared spectroscopy is a technology used to identify the chemical composition of substances based on molecular vibration and quantum-jump theory. Due to the unique absorbance of different functional groups, the spectral data related to the absorbance and the wavelength (or wavenumber) can be obtained when the infrared beam irradiates the molecular. However, the spectral data from experiments always have high dimensions and overlap, making it difficult to process the data. Thus, this paper proposed an improved Gustafson-Kessel possibilistic c-means clustering (GKIPCM), introducing the Mahalanobis distance from GK clustering and the iterative equations of fuzzy membership values and cluster centers from improved possibilistic c-means clustering (IPCM). GKIPCM makes the data adapt to different mathematical distance measures and avoids identical cluster centers. Furthermore, GKIPCM has higher classification accuracy, which is less sensitive to parameters. In the experiments, four groups of washed Chinese cabbage were the objects of spectral analysis and different concentrations of lambda-cyhalothrin pesticide were sprayed on the Chinese cabbages. Spectral data of Chinese cabbages were collected with Agilent Cary 630 FTIR spectrometer. Firstly, multiplicative scatter correction (MSC) was applied to reduce the noise and eliminate data offset when pre-processing the data. Secondly, principal component analysis (PCA) was utilized to reduce dimensions due to the wide wavenumber range (4 300~590 cm-1) and the high data dimensions (971). After conducting PAC, the dimensionality of data was reduced to 23, and the total contribution of 23 principal components reached 99.60%. Nonetheless, the feature information was still mixed. So the linear discriminant analysis (LDA) was used to extract features of the spectral data, and the LDA algorithm reduced the dimensionality of the spectral data to 3. Finally, the fuzzy c-means clustering (FCM) was employed to obtain the optimal initial cluster centers. Then, the GKIPCM algorithm was applied to cluster four different groups of spectral data. Comparisons were made among the clustering results of GKIPCM, GK and IPCM. The running time and accuracy of GKIPCM were 0.218 8 seconds and 97.22%, and those of GK and IPCM were 0.093 8 seconds and 63.89%, 0.062 5 seconds and 91.67%, respectively. According to the results of the experiments, the GKIPCM algorithm finished the qualitative analysis of different concentrations of pesticide residues by analyzing the spectral data.
May. 01, 2022Vol. 42 Issue 5 1465 (2022)
Research on Data Migration Modeling Method for Bending Strength of Solid Wood Based on SWCSS-GFK-SVM
Jin-hao CHEN, Da-peng JIANG, Yi-zhuo ZHANG, and Ke-qi WANG
The modulus of elasticity is an important mechanical index of wood. The advantages of spectral analysis technology include a simple, convenient and fast operation process, which has become an important tool for wood testing. However, in practical applications, we often face changes in temperature and humidity of near-spectrometer testing conditions or aging of instrument components and replacement of accessories when the collected spectral data will be shifted. In order to solve this problem, this paper proposes a near-infrared spectral modeling method combining migration learning and spectral transfer calibration to address the poor generalization of the master model due to the difference data from different types of spectrometers,taking the near-infrared spectral prediction model of larch bending strength as the research object. Firstly, 200 sets of Larch test specimens were processed. Two kinds of spectrometers, the NIRQuest512 spectrometer as the master instrument and the One-chip as the slave, were used to collect the spectral data of Larch test specimens respectively. And the true values of the test specimens were detected by the mechanical universal testing machine. Secondly, the preprocessing of SNV, S-G and spectral shearing was employed, and then the method of PDS transfer correction was applied to complete the linear transformation from the slave instrument to the master. Thirdly, the SWCSS was used to extract the features of two kinds of spectral data, and the stable wave points were optimized. Finally, the GFK-SVM model was established by using two types of near-infrared spectral data of 100 sets of specimens. 100 sets of data were applied to test and compare the modeling methods such as DS-PLS, PDS-PLS, DS-SWCSS-GFK-SVM, and PDS-SWCSS-GFK-SVM. The experimental results show that PDS, compared with DS, can better complete the linear mapping of spectral data due to the sliding window, which could unify the optical length and wave points between the two spectrometers, and improve the modeling accuracy to a certain extent; As a feature extraction method, SWSS can select wavebands according to the differences and similarities of the two groups of spectral data sets, which can ensure the effectiveness and stability of features, and improve the modeling accuracy; The GFK-SVM is suitable for the migration of different spectral data. It can realize high-dimensional mapping of different types of spectral data through reasonable kernel function parameters. A generalized model for different datasets is constructed to realize the generalization of the master model on the slave spectral prediction, which improves the data efficiency, and the test set correlation coefficient Rp reaches 0.875, and the root mean square error RMSEP is 11.975.
May. 01, 2022Vol. 42 Issue 5 1471 (2022)
Xian-guang FAN, Yan-rui HUANG, Long LIU, Ying-jie XU, and Xin WANG
Raman imaging is a very important part of Raman spectroscopy technology. By generating pseudo-color images of spectral data, a substance component's concentration and location distribution information in the collected area can be obtained. At present, Raman imaging technology has gradually become one of the optimal solutions for monitoring biological activity and substance components. In order to obtain a clear imaging effect, the amount of data in the collection process should not be too small otherwise, the imaging effect is poor, the serrations are heavy, and the visual effect is not good. However, although the increase in the amount of data can get a better imaging effect, it will increase the time cost and reduce the instrument's life. Therefore, it is of great significance to improve the spatial resolution of the imaging and reduce the temporal resolution of the imaging by interpolating the data of the collection points without increasing the time and hardware cost. In this paper, an image interpolation algorithm based on the study of the physical properties of Raman spectral waveform structure is proposed. Different from traditional image interpolation algorithm of image pixel values only for processing, by combining the Raman signal of physical properties, least square method and physical properties of the most suitable mathematical model of the Raman spectral peaks Voigt function of existing mathematical fitting spectrum data are extracted eigenvalue, and the extracted eigenvalue by linear interpolation method to calculate the unknown interpolation point. The spatial resolution of existing Raman images can be directly improved by calculating the Voigt function of interpolation points based on the eigenvalue of the GT function. Meanwhile, the scanning time can also be shortened, and the temporal resolution of Raman images can be improved by this method. At the same time, in order to verify the effectiveness and feasibility of the proposed algorithm, the original Raman images of a drug and a biological cell were interpolated, and the histogram Euclidean distance algorithm and structural similarity algorithm (SSIM, an authority image similarity evaluation algorithm) were used to evaluate the interpolation effect. The experimental results show that the proposed algorithm can preserve important information such as the distribution and concentration of sample components well when the pixel increment is 50% and 75% respectively. The proposed algorithm can improve the performance of Raman imaging without upgrading the hardware and is recommended as an effective supplement to the data processing and software of Raman imaging.
May. 01, 2022Vol. 42 Issue 5 1478 (2022)
Jiang-qing LIU, Chang-hui YU, Yuan GUO, Sheng-bin LEI, and Zhen ZHANG
Langmuir monolayers formed by dipalmityl phosphatidylcholine (DPPC) molecules at the air/liquid interface are an important model system for studying the biomembranes, and their chiral structure and interaction with foreign substances have been the frontiers of related fields. Vitamin B2 (VB2) is an important medicine for treating lipid deposition diseases caused by metabolic disorders. The molecular mechanism of the interaction between VB2 and phospholipids is the key to understanding the function of VB2. In this report, the interaction between VB2 and DPPC at the air/water interface was studied using second-harmonic generation linear dichroism (SHG-LD), Langmuir membrane balance and Brewster Angle Microscopy (BAM). The compression isotherm shows that the surface pressure in the liquid expansion phase/liquid condensed phase (LE/LC) of L-DPPC and D-DPPC at the water interface is almost unchanged, while the film pressure region in the co-existing phase of race-DPPC is slightly shortened. The LE /LC coexistence phase of race-DPPC disappears at the interface of the VB2 aqueous solution. In addition, the elastic modulus studies show that the VB2 molecule can increase the elastic modulus of L-DPPC monolayers, but reduce the elastic modulus of D-DPPC and race-DPPC monolayers. SHG-LD results showed that the Degree of Chiral Excess (DCE) of L-DPPC at the interface between VB2 and water was unchanged at the surface pressure of 13 mN·m-1, and the DCE of D-DPPC at the interface between VB2 and water was reversed. The DCE value of race-DPPC does not change with the change of subphase. Under the same surface pressure, BAM observed that the interaction of L-DPPC and D-DPPC to assemble into homochiral microdomains with different arm curvature directions at the pure water interface, and VB2 could induced the increase of D-DPPC microdomains by 1 to 2 times. Meanwhile, VB2 induced the extension of approximately circular microdomains on race-DPPC monolayer and the growth of three curvature arms, which could be explained as VB2 reducing the energy of non-monolayer chiral interactions and resulting in chiral phase separation. VB2 also induced changes in the chiral structure of race-DPPC monolayers. This study is of great significance for understanding the regulation of VB2 on the macrostructure and biological function of the phospholipid membrane.
May. 01, 2022Vol. 42 Issue 5 1484 (2022)
Shi-zhuang WENG, Zhao-jie CHU, Man-qin WANG, and Nian WANG
The edible oil in the humandaily diet is rich in saturated fatty acids, which can provide energy and other healthy nutrients for the human body, but excessive intake of saturated fatty acids can lead to a variety of cardiovascular diseases. In this study, a method for analyzing the content of saturated fatty acidsin edible oils was developed by combining reflectance spectroscopy and machine learning. Firstly, the reflectance spectra of 7 edible vegetable oils, such as rapeseed oil, soybean oil, sunflower seed oil, corn oil, olive oil, sesame oil and peanut oil, were measured in the range of 350~2 500 nm, as well as the contents of palmitic acid, arachidonic acid and behenic acid were obtained by GC-MS. Spectral preprocessing algorithms were employed to eliminate the noise in spectra, including centralization, multiple scattering correction, standard normal variable transformation and standardization. Then, a novel two-dimensional spectral convolution regression network (S2DCRN) was constructed for fatty acids analysis, and a full convolutional network (FCN), partial least squares regression (PLSR), support vector regression (SVR) and random forest (RF) were compared with S2DCRN. Finally, sequential forward selection (SFS), random frog (RFrog) and genetic algorithm were used to select important wavelength spectra to re-build more simple and robust analysis models. The results showed that the S2DCRN obtained optimal performance after pretreatment of edible oil spectra with the determination coefficient of prediction set (RP2) of 0.987 9 and the root mean square error of prediction set (RMSEP) of 0.510 0. Based on important wavelengths selected by combination RFrog and SFS, the S2DCRN exhibited excellent performance with RP2=0.967 9 and RMSEP=0.462 7. Although the results based on important wavelengths obtained is slightly worse, the number of wavelengths is less than 1% of the full spectra. It is convenient for the measurement of spectra and remarkably reduces the complexity of the model, which is helpful for the further development of portable and simplified detection devices. In addition, to further explore the generalization and applicability of S2DCRN, S2DCRN was used to analyze the content of arachidonic acid and behenic acid and gain a prediction result for arachidonic acid RP2=0.950 1, RMSEP=0.152 9. Therefore, the proposed method accurately and rapidly analysed various fatty acids in edible vegetable oils by reflectance spectroscopy.
May. 01, 2022Vol. 42 Issue 5 1490 (2022)
Sha GAO, Xi-ping YUAN, Shu GAN, Lin HU, Rui BI, Rao-bo LI, and Wei-dong LUO
Low-altitude unmanned aerial vehicle (UAV) measurement has become an important technical tool in the remote sensing field by the virtue of low-cost, high-efficiency, high-precision data acquisition mode and rapid acquisition images with high spatial resolution. Image matching technology is an important step in UAV image data processing, and the matching between images directly affects the accuracy and visual effect of the later 3D scenes. For the highland mountainous area, the topography is complex with large elevation changes, high vegetation cover and irregular distribution of features, making it difficult to match the images due to local noise in the UAV topographic survey processing. As the special terrain of the area limits the image acuqisition, large scene images need to be obtained by matching and stitching multiple images. At present, feature point-based image matching is an image alignment technique, which is applicable to the matching between low overlap images and can be applied to the matching between motion recovery images. To explore the fast and effective UAV image matching technique under special terrain and landscape conditions. This paper proposes an integration Scale Invariant Feature Transform (SIFT) algorithm, the Nearest Neighbor Distance Ratio (NNDR) algorithm and Random Sample Consensus (RANSAC) model constraints improved the UAV image matching method for complex terrain in highland mountains. The main technical process is as follows: Firstly, based on the SIFT algorithm for extreme value detection in scale space, a Gaussian pyramid function is constructed, and feature point localization is achieved by a Gaussian difference operation. It also performs statistical analysis on the neighborhood location, direction, and scale of the detected feature points to generate a description suitable for UAV image features. Secondly, the first constraint of feature pairs is extracted, and similarity is detected by integrating the “Mahalanobis distance” and NNDR models. On this basis, the RANSAC algorithm is used to introduce the root mean square error (RMSE) of the matched pairs for the second constraint, to achieve the rejection of the wrong matched pairs and ensure the accurate optimization of image matching. In addition, to confirm the effectiveness of the optimization algorithm proposed in this paper, one group of UAV image data of typical landscapes in the highland mountains were selected for matching tests. The results show that the improved algorithm proposed in this paper can extract a large number of point pairs and improve the correct detection rate of the same name points in UAV image matching for complex terrain in highland mountainous areas. Moreover, the correct rate of alignment reaches 85%, so it is more applicable to the optimization of UAV image matching processing technology for complex terrain in highland mountains.
May. 01, 2022Vol. 42 Issue 5 1497 (2022)
Meng-meng LI, Ya-jun TENG, Hong-lin TAN, and En-dong ZU
The color of the pearl is one of the most critical factors affecting its quality. At present, most researches on pearl's color focus on the constituent elements, coloring mechanism and structural differences of different colors, but there are few studies on how to distinguish the pearl of the same color intuitively. In this paper, three batches of freshwater cultured white pearls from different periods in Anhui were selected and subjected to colorimetry, laser Raman spectroscopy and gemstone microscope observation. Based on this, the relationship between the whiteness value and Raman spectrum of white freshwater cultured pearls was established. Then combined with the observation of gemstone microscope, it provides the basis for the division of its color grade.This paper uses the Hunter whiteness formula, WHT=100-[(100-L*)2+a*2+b*2]1/2 to calculate the whiteness value of different pearls, and then compares the whiteness value with the R value, which is the ratio of the peak area of the 1 132 cm-1 caused by the C—C stretching vibration and the aragonite peak area caused by the symmetrical stretching vibration of the[CO3]2-. It is found that the whiteness value of the freshwater cultured white pearl is inversely proportional to the R value of Raman spectra. The cluster analysis in SPSS can be used to classify the colors of freshwater cultured white pearls from Anhui. By cluster analysis, the whiteness values can be divided into four ranges: above 85, 85~80, 80~75 and below 75. The whiteness value above 85 are the whitest, 85~80 are white, 80~75 are medium whiteness, 75 or less are the worst. By observing the surface morphology of Anhui freshwater cultured white pearls, it can be found that pearls with a whiteness value above 85 have a smoother surface and strong gloss. Pearls with a whiteness value between 85 and 80 have some defects, and strong gloss on the surface, pearls with a whiteness value between 80 and 75 have obvious defects and medium gloss, pearls with a whiteness value below 75 have more defects and poor gloss on the surface. The smoothness and gloss of pearls will affect the whiteness. Both the whiteness value and the R value of the Raman spectra can quantitatively indicate the whiteness of Anhui freshwater cultured white pearls. The relationship between them is that the larger the whiteness values are, the smaller R values in Raman spectrum are, and the whiter pearls are. The gloss and smoothness of pearls can be used as an auxiliary basis for judging the whiteness of pearls. The whiteness of freshwater cultured white pearls can be distinguished by coloration parameters, Raman spectra and microstructure observation. They can also provide a theoretical basis for the classification of the color grade of freshwater cultured white pearls.
May. 01, 2022Vol. 42 Issue 5 1504 (2022)
Yu-yang ZHANG, Mei-hua CHEN, Shuang YE, and Jin-yu ZHENG
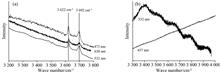
Determination of the geographic origin of blue Sapphire is important in gemological research. Metamorphic Sapphires from Sri Lanka and basalt-related Sapphires from Laos are tested. UV-Vis-NIR chemical analysis fits the basic characteristics of Metamorphic and basalt-related Sapphires. Three-dimensional fluorescence spectroscopy revealed distinct fluorescence at around 420 to 440 nm, 540 to 560 nm, 560 to 580 nm and 694 nm of Metamorphic Samples. Meanwhile, basalt-related samples present fluorescence at 418 nm. In this research, the main difference between the two types of Sapphires is that metamorphic samples present strong fluorescence. Besides, fluorescence at 540 to 560 nm, 560 to 580 nm occurs only in metamorphic Sapphires.
May. 01, 2022Vol. 42 Issue 5 1508 (2022)
Jun-yi ZHANG, De-hua GAO, Di SONG, Lang QIAO, Hong SUN, Min-zan LI, and Li LI
Chlorophyll is an important biochemical parameter involved in crop growth. Accurate detection of chlorophyll in real-time has great significance for the precision management of farmland. The PROSPECT model can simulate the reflectivity and transmissibility of leaf at 400~2 500 nm based on leaf's input structural and biochemical parameters. This study used the PROSPECT model to generate 10 650 reflectivity curves of maize leaf under different input parameters. The sensitivity of the spectral reflectance curve to the chlorophyll content parameter was analyzed when other parameters remained unchanged. The result shows that the chlorophyll content only affects the spectral reflectance curve in the range of 400~780 nm. According to the sensitivity analysis result, 76 wavelengths in 548~610 and 694~706 nm were selected as the characteristic wavelengths of chlorophyll content, which were recorded as SEN-BAND. Based on Backward Interval PLS (Bi-PLS), 5 intervals of 91 characteristic wavelengths were selected, recorded as BP-BAND. Based on the Successive Projections Algorithm (SPA), 10 characteristic wavelengths were selected in chlorophyll-influenced area in 400~780 nm, recorded as SPA-BAND. The PLS detection model of chlorophyll content based on the three characteristic wavelengths was constructed with measured field data in 2019 and 2020. The results show that the -SPA-BAND model has the best results in both 2019 and 2020 datasets. In the 2019 dataset, the coefficient of determination (Rc2) of the modeling set is 0.815 6, the root mean square error (RMSEC) of the modeling set is 2.908 6, the coefficient of determination (Rv2) of the validation set is 0.799 5, and the root means square error (RMSEV) of the validation set is 2.997 7. In the 2020 database, the coefficient of determination (Rc2) of the modeling set is 0.949 2, the root mean square error (RMSEC) of the modeling set is 0.976 8, the coefficient of determination (Rv2) of the validation set was 0.910 2, and the root means square error (RMSEV) of the validation set was 1.562 9. Therefore, the characteristic wavelength of chlorophyll content can be selected under the influence of multiple factors by constructing spectral reflectance curves with multi-parameter input based on the PROSPECT model and the characteristic wavelengths of chlorophyll content can be verified in multi-year data.
May. 01, 2022Vol. 42 Issue 5 1514 (2022)
Hua YAN, Xing-hua LIU, Yong DING, Zhi ZHAO, Yong-feng LUO, Yu-hong WU, Peng YAN, Lu DONG, and Da-xi WANG
Chlorine trifluoride oxide (ClF3O) has stronger corrosive and oxidizing properties than other chlorine fluorides such as ClF3. It can react with numerous materials, e.g., water and hydrocarbons. The reaction between ClF3O and organic hydrocarbons may occur at quite a low temperatures and cause an explosion. So far, however, no detailed information about the reactions is available. Using an intensified charge-coupled device (ICCD) system, transient emission spectra of the reaction of ClF3O and n-decane were measured in a spectral range of 200~850 nm. Using density functional theory (DFT) method were performed to investigate the reaction mechanism of ClF3O and n-decane. All calculated results are consistent with the experimental data, which indicates that the present results are credible. The emission spectra of CH and C2 radical intermediates were observed in the reactions of ClF3O and n-decane under a no-oxygen environment, and this shows that ClF3O is a highly reactive compound. The detection of the CH, C2 and OH radical intermediates shows clearly that a large amount of energy was released during the reaction between ClF3O and n-decane under an oxygen environment. The primary peak was found at 431 nm corresponding to theA2Δ-X2Π electronic transition of the CH radical. The peak at 516 nm produced by theA3Пg-X3Пu electronic transition of the C2 radical was also observed. The peak at 309 nm corresponds to theA2Σ+-X2Пi electronic transition of the OH radical was also found. The results of the calculations showed that the F atom on ClF3O attacks the H atom on n-decane to initialize the reactions, and a F atom on ClF3O abstracted h atom on n-decane to produce HF. The initial reactions were considered to be barrier-less reactions and extremely exothermic. Under a no-oxygen environment, a fluorination reaction occurred between ClF3O and n-decane, and the products were ClFO, HF and corresponding fluoroalkanes. Fluoroalkanes may undergo dehydrogenation to form C10H20F. Then it is cleaved into C4H9 and C6H11F, then C4H9 further decomposed into C2H5 and C2H4, and finally formed CH and C2 radical. The initial steps of reaction in the aerobic environment were the same as in an anaerobic condition. When the reaction proceeded to a certain degree, after producing alkane radicals, O2 formed peroxic radicals, and peroxic radicals continue to decompose to form CH, C2 and OH radical intermediates. In the presence of oxygen, many OH radicals were produced in the reaction process, which accelerated the process of reaction. Macroscopically, n-decane was initiated by deflagration and combustion. Results show that the main emission bands are attributed to OH, CH and C2 radicals produced during the reaction process of ClF3O and n-decane, which reveals that small OH, CH and C2 radicals are important intermediate products in the reaction process of ClF3O and n-decane. This is very important for understanding the micro-process of reaction of ClF3O and n-decane. It also play an important theoretical foundation for the application of the weapon of ClF3O.
May. 01, 2022Vol. 42 Issue 5 1522 (2022)
Liu-yang HAN, Xiang-na HAN, Xing-ling TIAN, Hai-bin ZHOU, Ya-fang YIN, and Juan GUO
Waterlogged wooden cultural relics have been constantly excavated and preserved, driven by increasing public interest and upgrading archaeological technologies. Wood cells' morphology and chemical structure from waterlogged wooden relics normally undergo non-uniform degradation or changes, presenting a different “new material” from sound woods. PEG and sugars have been widely applied for consolidation. This study selected teak (Tectona sp.), the main timber species of the “Xiaobaijiao Ⅰ” shipwreck, as the research object. Based on the developed sample preparation method of nonembedded nanoindentation suitable for wooden cultural relics. The PEG, sucralose and trehalose treated samples were evaluated by Nanoindentation technology (NI) and studied by infrared spectroscopy (FTIR) and thermogravimetric analysis (TGA). The results showed that samples prepared by the nonembedded method could accurately measure the longitudinal elastic modulus and hardness of wood cell wall, and the PEG, sucralose and trehalose were able to significantly improve the elastic modulus of fiber cell wall respectively, by 6.9%, 25.4% and 29.1% compared to untreated samples, and increase its hardness by 9.3%, 25.9% and 13.6%. Infrared spectroscopy showed that PEG, sucralose and trehalose penetrated the wood, and thermogravimetric analysis confirmed that partial consolidants could enter the wood cell wall, which was the main reason for the improvement of cell wall strength. In general, sucralose and trehalose were more suitable than PEG for consolidating the waterlogged archaeological wood, with sucralose being the most effective consolidant in this research. This research provided a proven method for the accurate performance evaluation of consolidates for waterlogged wooden cultural relics such as shipwrecks and could provide a scientific basis for their consolidation and conservation.
May. 01, 2022Vol. 42 Issue 5 1529 (2022)
Xiao-yu JIANG, Fu-sheng LI, Qing-ya WANG, Jie LUO, Jun HAO, and Mu-qiang XU
As a quantitative analysis technique based on stoichiometry, X-ray fluorescence spectroscopy is very important to the prediction accuracy of the results. The competitive adaptive reweighted algorithm (CARS) adopted adaptive reweighted sampling technology and used interactive verification to select the lowest value square error (RMSECV) by interactive verification to find out the optimal combination of variables. To further improving the interpretation and prediction ability of PLS models, the competitive adaptive reweighted algorithm (CARS) was combined with X-ray fluorescence spectroscopy. A partial least square (PLS) model was established after screening the characteristic wavelength variables of lead and arsenic in the soil. Firstly, the CARS algorithm screened the wavelength variables closely related to lead content. When the sampling times were 26 times, 60 effective wavelength points were selected, and the wavelength variables closely related to arsenic content were screened. When the sampling times were 34 times, 19 effective wavelength points were selected. Then used the PLS method to establish the quantitative analysis model of lead and arsenic content in soil and compared it with the PLS model established by continuous projection algorithm (SPA) and Monte Carlo method. The results showed that the prediction sets Determination Coefficient (R2), Root Mean Square Error of Cross-Validation (RMSECV), Root Mean Square Error of Prediction (RMSEP) and Relative Prediction Deviation (RPD) of the lead CARS-PLS model were 0.995 5, 2.598 6, 3.228 and 9.401 1, respectively. Moreover, the prediction sets R2, RMSECV, RMSEP and RPD of arsenic CARS-PLS models were 0.999, 3.013 2, 2.737 1 and 8.211 6, respectively. The CARS-PLS model performance of the two elements is better than that of full-band PLS, SPA-PLS and MC-UVE-PLS model. The CARS-PLS algorithm based on the X fluorescence spectrum can effectively screen the characteristic wavelength, simplify the complexity of modeling, and improve the accuracy and robustness of the model.
May. 01, 2022Vol. 42 Issue 5 1535 (2022)
Yan-ru WANG, Hai-jun TANG, and Yao ZHANG
Given a series of problems such as unplanned shutdown and flight failure caused by the fuel contamination of aviation engine lubricating oil, it is necessary to monitor the lubricating oil in use to determine the right time to change all lubricating oil. In this paper, Spectrum Two infrared spectrometer and Spectrum Quant software of PerkinElmer Company in the United States were combined with the American Society for Materials and Testing Standard (ASTM-E2412-10) on the monitoring instructions of synthetic ester lubricants. The fuel contamination degree of Mobil Jet Oil Ⅱ lubricating oil was quantitatively analyzed. The standard working curve of fuel contamination concentration and peak area of 815~805 cm-1 spectral region was established by using the two-point baseline area method. The correlation of the working curve was 0.999 6, and the standard prediction error was 0.544 1. The standard deviations of the five groups of repeated tests were all lower than 0.12%, which indicated that this method had high prediction accuracy and good repeatability. At the same time, the same lubricating oil samples were detected using the working curve and the fuel sniffer of Spectro Scientific company, and the results were similar, which indicated that the established quantitative working curve could meet the monitoring requirements of fuel contaminationin lubricating oil in civil aviation.
May. 01, 2022Vol. 42 Issue 5 1541 (2022)
Zhao PAN, Zong-liang LI, Zhen-wei ZHANG, Yin-tang WEN, and Peng-yang ZHANG
Ceramic fiber composite is a new Porous light material composed of short cut silicon oxide fibers and its binder sintered by high temperature. The microstructure characteristics of materials directly affect their macrostructure and functional characteristics. The porosity of this material ranges between 84% and 95%. The micro pore size is usually less than 100 microns, with a few occasional nanopores. Ceramic fiber composite materials are used in the outer insulation parts of ultra-high sonic aircraft due to their excellent properties such as high-temperature resistance, low density, high specific strength and ablation resistance. However, this type of material may have inclusions, holes or even large-area debonding caused by factors such as the level of manufacturing and assembly process. The particularity of the structure and application scenarios of ceramic fiber composite materials makes conventional non-destructive testing methods ineffective. Terahertz (THz) technology, as an emerging non-destructive testing technology, has great potential in non-destructive testing of this type of material and can complement conventional testing technologies. This paper studied the defect location method of terahertz time-domain signal and terahertz tomography. Based on Terahertz time-domain spectroscopy (THz-TDS) non-destructive testing technology, this paper obtained the data of waveform peaks and phase differences of the time-domain waveforms and compared them with bonding layer defects and intact bonding layer positions in the sample. The deconvolution filtering technology processed the time-domain waveform, and the relationship between the time-domain waveform and the defect characteristics of the adhesive layer was qualitatively analyzed. The existence of the defect was macroscopically judged. By extracting the optical parameters of the ceramic fiber composite material in the terahertz band, the average refractive index of the terahertz band was determined to be 1.002 8, and then the depth and thickness of the bonding layer defects were 18.4 and 0.28 mm, respectively. Compared with the real depth and thickness of preset defects, the accuracy was 92% and 90% respectively. Since the average refractive index extracted by the time-domain signal will cause errors in the analysis of the defect position of the adhesive layer, this paper used the terahertz tomography method to estimate the position of the defect further analyzing the source of terahertz tomography noise and its impact on imaging quality and used bilateral filtering to reduce the noise of tomography. Based on terahertz tomography technology, a position evaluation model was established, and the thickness of the adhesive layer defect was obtained as 0.26 mm. Compared with preset defect thickness, the accuracy rate was 96%. It effectively perfected the defect location form of the terahertz detection technology and realized the high-precision location and characterization of the bonding layer defects of the ceramic fiber composite material component.
May. 01, 2022Vol. 42 Issue 5 1547 (2022)
Zhong WANG, Dong-dong WAN, Chuang SHAN, Yue-e LI, and Qing-guo ZHOU
As a typical optical detective method, Raman spectroscopy has been widely used in many fields such as biological analysis, disease diagnosis and molecular recognition due to its unique non-invasive, fast, in-situ and extremely high specificity. The fingerprint characteristics of Raman Spectroscopy make it an important tool in the biomedical field. However, many problems greatly influence the application of this technology, including weak Raman scattering signal, the large dependence on analysts for data processing and analysis, and the low capabilities of automated processing. It is usually difficult to obtain an effective and stable Raman spectrum of various interference factors, including the noise from experimental equipment or environment and spontaneous fluorescence of the biological sample. All kinds of random noises will interfere with identifying fingerprint peak information in Raman spectroscopy and increase the difficulty of Raman feature extraction, so denoising is an important task in the preprocessing of Raman Spectroscopy analysis. In this paper, using the backpropagation algorithm and considering the characteristics of the data, we built the noise judgment and denoising neural network model respectively, based on the linear difference between the ideal spectral segment and the noisy spectral segment. For the simulation experiments, the data of Raman spectra are composed of a series of randomly generated mathematical models of the Lorentz peak. Different intensities of noises were added to the randomly generated single Raman spectrum and 100 groups of Raman spectra, respectively. In addition, the new method has been compared with the classic sliding window average method, Savitzky-Golay filter method, Fourier transforms, and wavelet threshold transform method. Using the Root mean square error and Signal to noise ratio indicators for analysis, the results show that all methods can complete the denoising task under low noise, but the denoising effect of the sliding window average method is obviously reduced at the edge of the spectrum. With the increase of the noise signal, the denoising performance of the sliding window average method, S-G filtering method, and Fourier transform method have all decreased significantly. Overall, the denoising method based on a backpropagation neural network is better than the Fourier transform method, sliding average window method, and S-G filter method. This method avoids complex parameter optimization settings and at the same time, obtains the denoising effect that is almost the same as the optimal wavelet transform method. It greatly simplifies the parameter setting and is more suitable for the automated denoising of the Raman spectrum.
May. 01, 2022Vol. 42 Issue 5 1553 (2022)
Cong-cong LI, Qi-wu LUO, and Ying-ying ZHANG
Increasing the photosynthetic rate of crops is one of the reliable methods for high yield breeding. The main method for measuring photosynthesis rate is infrared gas analysis, which owns dependable axiom and mature technology. However, the infrared light source is easily affected by the complex working environment in the field, especially the change in ambient temperature. Therefore, the measurement error is significant in the task of quantitative analysis, and the detection precision of gas with deficient concentration or weak concentration change is not exact. Based on the above questions, first of all, the tunable diode laser absorption spectroscopy (TDLAS) is applied to the measurement of plant photosynthetic rate in this paper, which employs the second harmonic peak difference to represent the relative variation of trace concentration of photosynthetic gas CO2 in unit sampling time. Secondly, we established an environment compensation model of a broad learning system based on firefly algorithm optimization (FA-BLS). The position information of each firefly in the model corresponds to a set of feasible solutions representing the weights and thresholds of the BLS. Through the continuous iteration and update optimization of firefly position to find the firefly with the highest brightness, that is to generate the weights and thresholds that make the model perform the best. Ultimately, the compensation value generated by FA-BLS is used to compensate for the original second harmonic peak difference with environmental impact, and the net photosynthetic rate per unit sampling time was obtained from the compensated second harmonic peak difference. The experimental results indicate that the firefly population size and the number of nodes in the enhancement layer of BLS are significant considerations affecting the output error of TDLAS-FA-BLS, which commendably inherits the advantages of BLS, such as fast training speed and short iteration time. It is worth mentioning that the average measurement time of FA-BLS is merely 0.81 s, and the chi square distance between model prediction output and test set data is only 0.29×10⁻⁴, which indicates its output error is similarly small. At the same time, the sample variance and sample standard deviation of the output error of FA-BLS are lower than those of BLS, which illustrates that FA-BLS overcomes the shortcomings of BLS, such as unstable network output and low generalization due to random selection of parameters. Consequently, the method based on TDLAS-FA-BLS for the determination of plant net photosynthetic rate can nicely meet the needs of high precision, real-time, stability and reliability in the complex field working environment and actual agricultural production.
May. 01, 2022Vol. 42 Issue 5 1561 (2022)
Ruo-chen DAI, Huan TANG, Bin TANG, Ming-fu ZHAO, Li-yong DAI, Ya ZHAO, Zou-rong LONG, and Nian-bing ZHONG
Affected by preservation conditions, foxing will form on the surface of many paper cultural relics. If effective monitoring and scientific judgment are not carried out, the safety of paper cultural relics will be further affected. For the detection of foxing disease on paper cultural relics, there are problems such as hysteresis and subjectivity. It is difficult to identify the area covered by ink, paint and seals in the painting and calligraphy collection. Therefore, the concept of preventive protection based on cultural relics needs to be developed urgently. Non-destructive testing technology for efficient and accurate identification of foxing. The visible-near-infrared hyperspectral image combines spectrum and image, contains rich spatial information and spectral information, and can achieve lossless batch collection of sample spectral information on the flat. This research proposes a rapid identification method based on hyperspectral imaging technology to detect foxing on paper cultural relics. Obtain hyperspectral images of simulating paper cultural relics at the 360~970 nm. Because the 360~450 nm image is much affected by noise, we choose to exclude this part of the spectral data; select the region of interest, obtain the corresponding average spectral reflectivity, and compare the healthy area with that. In the area of foxing infection, it is found that there is a difference in the spectral curves of the two; near 450~600 nm, the spectral reflectivity of the affected area of foxing is higher than that of the healthy area, and the peak shape appears near 600 nm; and in the range of 600~900 nm, The spectrum of the infected area and the healthy area tends to be stable, and the difference between the two gradually decreases. Select the feature information extracted from the image corresponding to the feature wavelength to build an image recognition model, using band math to observe the image characteristics of foxing, the size and distribution of the foxing can be displayed, but the overlapping parts with the seal and ink, the foxing are covered by the seal and ink, which is difficult to identify; use the minimum noise fraction, although different parts are overlapping, it can find hidden foxing that is difficult to identify with the naked eye; 180 pieces of hyperspectral data (450~970 nm) establish a foxing discrimination model, randomly divided into 120 pieces of data as the training set, and 60 pieces of data as the test set, K-nearest neighbor method and BP neural network are used to establish a paper cultural relics foxing spectrum discrimination model. In general, the two methods have distinguished rates of 73.3% and 85% respectively; Comparing with the K-nearest neighbor model, the BP neural network has a higher overall discrimination rate and a better recognition effect. The results show that hyperspectral imaging can efficiently and accurately identify the foxing of paper cultural relics, provide reliable technical means for the follow-up research on the distribution and development of foxing, and provide guidance for the preservation of cultural relics in the museum.
May. 01, 2022Vol. 42 Issue 5 1567 (2022)
Wen-bin SUN, Rong WANG, Rong-hua GAO, Qi-feng LI, Hua-rui WU, and Lu FENG
Automatic identification and diagnosis of crop diseases based on visible spectrum is a challenging research field that agricultural sectors have given great attention. However, the existing research of disease identification based on convolutional neural network is prone to sacrifice network depth for the results of single disease detection, which usually resulting in the waste of hardware resources. This paper proposes a low-level crop disease identification model based on visible spectrum and improved attention mechanism, which designs a novel attention module SMLP (Squeeze-Multi-Layer-Perceptron) and crop disease identification model SMLP~~ResNet. This network first uses a convolutional layer to replace the full connect layer to construct a less-parameter residual network (ResNet) whilst improving residual block (SMLP~~Res) by the SMLP, Batch Normalization (BN) module and residual block (Res~~block). The SMLP consists of global pooling layers and multi-layer perceptron, which can help to build a dependent relationship between channels. The multi-layer perceptron utilizes a three-layer network to double the channel dimension of global features, then restores the channel to the original dimension through carrying out a twice dimensionality reduction operation to minimize the loss of global features. On the above basis, the SMLP~~Res can recalibrate the features of disease and reduce the redundant information that is useless for the detection target, and finally constructs a crop disease identification model SMLP~~ResNet reduces the number of layers and enhances the accuracy of identification at the same time. Moreover, the proposed network is verified on two datasets with multiple crops and diseases, AI Challenger 2018 and Plant Village. The experimental results show that the SMLP~~ResNet model achieves a high classification accuracy at the 18, 50 and 101-layer of the network, especially SMLP~~ResNet18 has the best performance with accuracies up to 86.93% and 99.32% on two verification datasets respectively. SMLP~~ResNet18 not only performs better than unimproved ResNet18 and SENet18 but also has higher accuracy than models in other research works with a small model size 48.6 MB, which is only 1/5 of the amount of AlexNet network of parameters, achieving a good balance between depth of network and accuracy of identification. In addition, from the heatmap conducted by Grad-CAM, it is obvious that the SMLP~~ResNet18 proposed in this paper focuses more on the diseased area of leaves compared with the other networks and assigns fewer weights to the healthy area and background. In summary, the proposed model SMLP~~ResNet18 realizes a high accuracy with less parameters and increases the discriminating ability to detect diseased areas and mitigates the impact of background and redundant information. Hence, this proposed model can cope with the highly precise identification of various crops.
May. 01, 2022Vol. 42 Issue 5 1572 (2022)
A New Method for Direct Measurement of Land Surface Reflectance With UAV-Based Multispectral Cameras
Hua-sheng SUN, Yuan ZHANG, Yun-fei SHI, and Min ZHAO
At present, the multispectral remote sensing data obtained by UAV (Unmanned Aerial Vehicle), have been widely used in the quantitative monitoring of agriculture, forest, environment and other fields. However, the existing methods of converting the multispectral remote sensing data into land surface reflectance still have some defects, e.g. relying on reference boards, unable to adapt to varying solar illumination conditions, or the obtained results are inaccurate, etc., so they may affect the quantitative application effect of the remote sensing data. In order to solve this problem, a novel methodology for direct measurement of land surface reflectance with the multispectral camera is proposed in this study. The method has strong adaptability, and it can get accurate land surface reflectance even under the condition of variable illumination. The key problem that needs to be solved is how to use irradiance sensors to obtain accurate solar irradiance in a tilted state. A new method was proposed to separate the direct and scattering irradiance with two or more irradiance sensors oriented towards different directions to achieve this objective. Therefore, the digital numbers (DNs) recorded by the multispectral bands can be converted into accurate reflectance with the measured irradiance results. UAV-based remote sensing images obtained on the different dates under different illumination conditions were used to validate the actual effect through the validation scheme designed in this study. The experimental results showed that the maximum MAE (mean absolute error) and standard deviation of five multispectral bands (i.e. blue, green, red, red edge and near infrared) for all reference panels is 3.34% and 2.11%, respectively; and the maximum MAE and standard deviation of the three reference panels (i.e. black, gray and white) is 2.94% and 1.84%, respectively. Therefore, the proposed method can obtain accurate reflectance results, even under varying solar illumination conditions. It greatly simplifies the reflectance conversion process of UAV-based remote sensing images. The study results are significant to the UAV-based remote sensing system's design and the quantitative application of multispectral remote sensing data.
May. 01, 2022Vol. 42 Issue 5 1581 (2022)
De-hui LI, Tai-xia WU, Shu-dong WANG, Zhe-hua LI, Yi-wei TIAN, Xiao-long FEI, Yang LIU, Yong LEI, and Guang-hua LI
Red mineral pigments have been widely used in ancient paintings and ancient buildings by artists. It is of great significance to correctly identify different kinds of red pigments to monitor and restore cultural relics. Traditional pigment identification mainly relies on chemical analysis, which has a slow identification speed and small identification range and will cause permanent damage to cultural relics by sampling operation. Nondestructive identification of pigments by hyperspectral technology can solve these problems well. In this study, ten red mineral pigments, namely Cinnabar Ⅰ, Rouge, Vermilion, Zhi Xi, Cinnabar Ⅱ, Ochre, Ochre powder, Iron oxide red, Terra Rossa and Western red, were selected as the objects of study. The original digital (DN) images of the hyperspectral data of the 10 red pigments in the band of 350~2 500 nm were obtained by using a ground object spectrometer in an optical darkroom, and the reflectance data and spectral curves which can be directly used for spectral analysis were obtained by reflectance correction. Based on the characteristics of different spectral curves of 10 red pigments, the spectral characteristic bands of the distinguished pigments, namely target pigments, were obtained by two-step screening. By taking the extreme point of the spectral curve of the target pigment as the characteristic band, the primary spectral characteristic band of the target pigment can be screened. The reflectance of the other 9 pigments corresponding to the primary spectral characteristic band was differentiated from that of the target pigment in this band. As for the difference, the sum of squares was calculated after screening outliers. Different bands correspond to different sums of squares of differences, and the first 4 bands with larger sums of squares of differences were selected as the optimized spectral characteristic bands. Based on the normalized spectral index model formula (NDSI=(Ra-Rb)/(Ra+Rb), Ra and Rb are the reflectance values of target pigments at spectral characteristic bands a and b respectively), the normalized spectral index was constructed for 10 red pigments. Compare and analyze the spectral index of the target pigment and the other 9 kinds of red pigments in the same spectral characteristic band, and the difference between the spectral index of the target pigment and the spectral index of the other pigments was calculated to evaluate the different effect. For the four optimized spectral characteristic bands, six normalized spectral indexes could be constructed, and the normalized spectral index with the minimum and maximum distinctness was selected as the characteristic spectral index of the target pigment. The research result shows that the minimum discrimination between each target pigment and other pigments remains above 0.7 when the target pigments are distinguished by their respective characteristic spectral indices (more than 0.5 can be considered to be clearly distinguishable), indicating that the above method can accurately distinguish each red pigment, which is of practical significance for the rapid and accurate identification of cultural relic pigments.
May. 01, 2022Vol. 42 Issue 5 1588 (2022)
Yan-hua FU, Jing LIU, Ya-chun MAO, Wang CAO, Jia-qi HUANG, and Zhan-guo ZHAO
Soil is an important part of the natural ecosystem and an important material basis for human survival and agricultural production. With the rapid socio-economic development, the high-intensity industrial and agricultural production activities lead to various pollutants such as heavy metals entering the soil through atmospheric deposition and sewage irrigation and continuously enriching in the soil, causing soil salinization and soil heavy metal pollution, both of which are the main causes of global desertification and soil degradation. However, China has very limited arable land, and food security is especially important. Therefore, quickly and accurately invert the heavy metal content of saline land in a large area is an important research topic to ensure food security. This paper establishes a quantitative inversion model of the heavy metal content of manganese (Mn), cobalt (Co) and iron (Fe) in saline land with soil visible-near infrared spectral data in Zhenlai County, Jilin Province. Firstly, Savitzky-Golay smoothing, multiple scattering correction and continuous statistical de-transformation were performed on the raw spectral data respectively; then three spectral indices, namely, ratio (RI), the difference (DI) and normalized (NDI), were constructed based on the pre-processed spectral data, and the model training samples were determined by correlation analysis between the spectral indices and heavy metal contents. The radial basis neural network algorithm was used to model and invert the saline heavy metal contents. Finally, the sensitive band combinations with significant correlation between the spectral indices and the contents of Mn, Co and Fe were determined by the accuracy analysis method of the gradient cycle modeling such as correlation coefficient and the optimal inversion model based on the radial basis neural network algorithm was established for the heavy metal content of saline land. The results show that the correlation coefficients r>0.70 for Mn, r>0.80 for Co, and r>0.80 for Fe. The selected combinations of sensitivity indices are 108, 690, and 31 groups, respectively, and the optimal inversion models R2 for Mn, Co, and Fe based on the above significant combinations of sensitivity indices are 0.703 4, 0.897 6. The RMSEs were 53.007 3, 1.059 2 and 0.363 4, and the average relative accuracies were 88.64%, 90.36% and 91.78%, respectively. This study provides an effective method for accurate and rapid analysis of heavy metal content in saline soils, which is of great practical importance for achieving soil heavy metal pollution control.
May. 01, 2022Vol. 42 Issue 5 1595 (2022)
Mei-chen LIU, He-ru XUE, Jiang-ping LIU, Rong-rong DAI, Peng-wei HU, Qing HUANG, and Xin-hua JIANG
Milk contains many nutritional elements needed by the human body, such as fat, protein, calcium, etc. Therefore, analysing nutritional elements in milk is a key part of milk safety detection. Hyperspectral technology can effectively identify nutritional elements in milk by combining image and spectral data. In order to quickly and accurately predict protein content in milk, the Competitive Adaptive Reweighted Sampling (CARS) algorithm was used to select characteristic wavelengths. A method based on Sparrow Search Algorithm (SSA) to optimize Support Vector Machine (SVM) was proposed to predict milk protein content. The reflectance spectra of milk (400~1 000 nm) extracted by the hyperspectral spectrometer were used for the experiment. During Normalization (N), Standardization and Multiplicative Scatter Correction (MSC), the original milk data are used for spectral noise reduction to improve spectral utilization. The successive projections algorithm (SPA) and the competitive adaptive re-weighting algorithm were used to extract the feature wavelengths from the processed milk spectral data. The correlation coefficients between proteins and the spectrum were calculated and ranked by importance to obtain the important feature wavelengths. In the end, through SVM, the Genetic Algorithm (GA)-SVM, Particle Swarm Optimization (PSO)-SVM and Partial Least-Regression (PLS) algorithm was used to predict milk proteins and compare the prediction results. In order to improve the accuracy of protein prediction and model stability, SSA was proposed to optimize the kernel function G and penalty parameter C of SVM. Root Mean Squared Error (RMSE) was used as the fitness function, and the optimal regression parameters were selected through iteration to train the model. The results of milk data prediction showed that the optimal combination model was MSC-CARS-SSA-SVM. The determination coefficient R2 of the model test set was 0.999 6, the root means square error RMSE was 0.001 1, and the time was 4.112 1 seconds. The results show that the CARS algorithm can extract the characteristic bands and eliminate redundant information, thus improving the efficiency of the model and simplifying the algorithm's complexity. The SSA algorithm optimizes SVM's parameters and can quickly obtain the global optimal solution by iteratively updating the optimal position. Compared with SVM, GA-SVM, PSO-SVM and PLS, the prediction accuracy and model stability are significantly improved, which meets the accuracy requirements of milk detection, and is a feasible new method for fast detection of milk protein. It provides a theoretical reference for the optimization of spectral models and the improvement of prediction model accuracy.
May. 01, 2022Vol. 42 Issue 5 1601 (2022)
Jin WANG, Shu-tao CHEN, Si-cheng DING, Xue-wen YAO, Miao-miao ZHANG, and Zheng-hua HU
A field experiment was performed to investigate the relationships between the leaf respiration of soybean and vegetation indexes and leaf characteristics. The respiration and respiration coefficient of the first, second and third leaves from the top at the different growth stages were measured. The normalized difference vegetation index (NDVI), difference vegetation index (DVI), ratio index (RVI), enhanced vegetation index (EVI), photochemical reflectance index (PRI) and red edge chlorophyll indexes (RECI) were obtained from the hyperspectral method as well as the leaf characteristics of chlorophyll SPAD value, fresh mass, dried mass, water content, leaf area, specific leaf area and nitrogen content were also determined. The results showed that the respiration of a single leaf and respiration coefficient had obvious seasonal patterns. The seasonal mean respiration of the single first, second or third leaf from the top was (0.157±0.019), (0.162±0.014) and (0.142±0.010) mg·d-1, respectively. The seasonal mean respiration coefficient of the first, second or third leaf from the top was (0.638±0.072), (0.678±0.082), (0.642±0.076) mg·g-1·d-1, respectively. There were no significant (p>0.05) differences in the seasonal mean leaf respiration and respiration coefficient between the first, second or third leaf from the top. There were significant (ppppp<0.01) correlated with the air temperature and SPAD. A model based on these four factors explained 72.4% of the variation in the respiration coefficient. The present study showed that the leaf respiration of soybean could be linked with the hyperspectral vegetation indexes and the leaf characteristics. The seasonal variations in the leaf respiration and leaf respiration coefficient in the different positions could be effectively modeled with the hyperspectral vegetation indexes.
May. 01, 2022Vol. 42 Issue 5 1607 (2022)
Qing-qing PENG, Song-chao CHEN, Ming-hua ZHOU, and Shuo LI
It is vital to understand the characteristics of soils and their distribution in space and over time. Spectroscopy in the visible-near-infrared (Vis-NIR) can estimate soil properties (e.g., SOC). Compared with traditional laboratory physical and chemical analysis, spectral technology enables the practical acquisition of soil information rapidly. The development of a soil spectral library (SSL) can provide large amounts of soil data with variability and diversity for empirical calibration. Calibrations derived with these SSLs, however, at the very least, help to improve the robustness of spectroscopic models at regional and local scales due to high soil heterogeneity and model adequateness. Previous studies usually put several target samples into SSL, called spiking; however, the cost-efficiency of spectral techniques was offset more or less. Without spiking samples, we aim to explore the feasibility of developing a local model by constraining the SSL with spectral dissimilarities using classical distance methods. The response between the capacity of the local model with prediction accuracy was also compared and analyzed. In this study, we built a local test set (Test) with the amount of spectral variation from 97 cores, divided by one-tenth of each country from the global soil spectral library (677 cores), and the remaining 580 cores were used as the SSL. We used Euclidean distance (ED), Mahalanobis distance (MD) and Spectral Angle Mapper (SAM) to measure the spectral dissimilarity between Test and SSL and to generate the distance matrix. For each method, nine Local subsets were selected and developed by selecting the spectra of SSL, which were considered similar to the Test. The selection based on the first 0.04%, 0.05%, 0.1%, 0.2%, 0.3%, 0.4%, 0.5%, 1% and 5% of the distance matrix. The statistical models were built to predict SOC concentrations from the spectra by partial least-squares regression. We decomposed the spectra using principal components analysis (PCA) to identify those variables of Local derived from ED, MD and SAM. Our results showed that all the Local models developed by the three distance algorithms without spiking samples still can improve the accuracy compared to the global one, but the inflection points of a sample size of Local with accuracy were significantly different. The SAM considers the waveform and amplitude of the spectrum, so it has more advantages than MD and ED. Its Local, with the first 0.2% ratio, performed the best prediction accuracy, also required the least samples for modeling. We conclude that SAM is more suitable for developing local models from SSL. The first 0.2% of the distance matrix can be used as a reference for the capacity of the local model.
May. 01, 2022Vol. 42 Issue 5 1614 (2022)
Xia JING, Jie ZHANG, Jiao-jiao WANG, Shi-kang MING, You-qiang FU, Hai-kuan FENG, and Xiao-yu SONG
Rice is China's major grain food crop, grown mainly in the Yangtze River valley and southern China and on the Yunnan-Guizhou Plateau. The use of hyperspectral remote sensing technology to monitor rice yield before it matures is important. It can promptly adjust cultivation management methods and guide reasonable fertilization, and accurately grasp rice yield information to help the government make decisions in advance. In this study, the nitrogen fertilizer gradient experiment was carried on 2019—2020 at Zhongluotan experimental base in Baiyun District, Guangzhou City. The rice canopy hyperspectral data, crop population growth parameters (plant above-ground biomass (AGB) and leaf area index (LAI)) and crop nitrogen nutrient intakes at the rice differentiation and heading stage were obtained. Three machine learning algorithms, Bayesian Ridge Regression (BRR), Support Vector Regression (SVR), and Partial Least Square Regression (PLSR), were used to establish yield estimate models based on the different data sources, including rice canopy spectrum data, spectrum data combined with crop growth parameters, and spectral data, crop growth parameters, and crop nutrient intake data. The estimation accuracy of BRR, SVR and PLSR models, were evaluated and compared, then the best estimation model and optimal estimation growth period for rice yield were determined. The results showed that among the three methods, the BRR and SVR methods were more suitable for yield monitoring, with better performance in different periods and different parameter combinations (R2>0.82, NRMSER2 of 0.90 and the SVR model at the tasseling stage with R2 of 0.87. When full-band spectral information was used for yield monitoring, the best monitoring model for both periods was the BRR model with R2 of 0.90 and 0.92, respectively, compared with the BRR and SVR models, the highest R2 of the PLSR model was only 0.75 for different periods and different combinations of parameters; based on the 2020 data, when three different parameter combinations were used as inputs, the BRR model was the best in both periods, and the modeling accuracy was higher in the differentiation period than in the tasseling period (R2 increased by at least 0.02 and NRMSE decreased by at least 0.61%), and when the input parameter combinations were full-band spectra with crop population growth parameters and crop nutrient uptake, the accuracy of the BRR model for yield estimation reached Through the experimental study, it was concluded that the optimal monitoring period for yield is the differentiation period. The optimal monitoring model is the BRR model. The study results can provide a reference for early remote sensing monitoring of rice yield.
May. 01, 2022Vol. 42 Issue 5 1620 (2022)
Pei SHI, Zhi-wei JIN, Fen WANG, Hong-jie LUO, Jian-feng ZHU, Guo-zhen YE, and Yu-feng ZHANG
Black glazed ware is one of the most common varieties in the colored glazed ware of ancient China. Due to the easy availability of raw materials, it is fired everywhere, especially in the Song Dynasty. At present, α-Fe2O3, ε-Fe2O3, Fe3O4 has been found in ancient black glazes, but there are few reports on the influence mechanism of iron-rich raw materials on crystal types. Therefore, the Qingshitou and Hongshitou from the Dayu Town of Ruzhou and the Zijintu from Hangzhou were chosen as the study subjects. They were studied comprehensively by an X-ray fluorescence spectrometer (XRF), X-ray diffractometer (XRD), confocal laser Raman spectrometer (Raman) and scanning electron microscope (SEM). Firstly, the iron-rich raw material's chemical composition, phase and type of iron-containing phases were compared and analyzed by spectral information. And then, they were used alone as the raw material for glaze making to study the change mechanism of the iron phase after firing microstructure and spectral information. The results indicated that the contents of CaO, MgO and K2O in Qingshitou were high, which could reduce the high-temperature viscosity of glaze melt and increase its fluidity. It was conducive to particle migration and crystal nucleation and growth. The content of SiO2 in Hongshitou was only 61.36%, and it contained calcite crystal, so the melting temperature was low, and it was easy to form glass phase. At this time, iron existed in an ionic state. Besides, the contents of SiO2 and Al2O3 were high in the Zijintu, and the contents of CaO, MgO and K2O were low, so its melting temperature was high. Three kinds of iron-rich raw materials were melted into glazes. For the Qingshitou glaze, part of α-Fe2O3 had a decomposition reaction. The black magnetite (Fe3O4) was precipitated, as well as the concentration of α-Fe2O3 around the bubble increased continuously and escaped with the bubble rising to the glaze surface, resulting in the precipitation of brownish red crystal flowers. Based on this, Qingshitou was suitable as raw material for the black glaze. The Hongshitou glaze was mainly glass phase, and no obvious iron crystal was found. Hence, it was suitable as raw material for the celadon glaze. In the Zijintu glaze, the glass phase content was little, and the high content of SiO2 and large particle size of α-Fe2O3 were beneficial to the formation of rod-shaped ε-Fe2O3. Therefore, the glaze surface was dark brown with a metallic luster. It showed that Zijintu was suitable as raw material for the Zijin glaze. This study discussed the influence of iron-rich raw materials on the type of iron oxide crystallization, its glaze color and enamel, and revealed the physical and chemical process of iron oxide crystallization. It had important reference significance for studying ancient iron-based crystal glazes and the preparation of modern magnetic materials.
May. 01, 2022Vol. 42 Issue 5 1628 (2022)
Shi-wen YI, Jie LI, Jing-xuan WU, Wen-hao ZHANG, Peng ZU, Min LI, and Jia-wei LIN
High energy ball milling method was a common method in the process of material preparation, which produced crystal vacancy defects through the material running with high speed to achieve the doping of elements, so the chemical adsorption or chemical reaction has occurred. New phase formed, and it has a great impact on the performance of subsequent synthetic materials. Barium ferrite has been used in many functional materials because of its good magnetic properties. In the paper, barium ferrite precursor was prepared by the high energy ball mill method. Using XRD, SEM and FTIR methods, the changes in phase, microstructure and functional groups of barium ferrite precursor with different high energy ball milling times were investigated. By the second derivative infrared spectroscopy and smooth fitting calculation method, the phase changes were quantitatively analyzed in the process of high-energy ball mill of materiel. XRD and SEM results show that with the increase of ball milling time, the diffraction peak width of each phase of the barium ferrite precursor becomes wider, the powder is refined, the crystal lattice is gradually distorted, and crystal vacancy defects are produced, so that Ba dissolves into the Fe2O3 lattice to produce the solid solution of BaxFe2-xO3, and the adsorption “agglomeration” is produced phenomenon. When the milling time was longer than 40 h, the “nano-size effect” occurred, and magnetic Fe3O4 and BaxFe3-xO4 solid solutions were generated. The results of infrared spectrum analysis showed that the characteristic peaks of BaCO3 and α-Fe2O3 decreased and shifted significantly with the increase of ball milling time, indicating that the particle size of decreased and chemical reactions occurred with the increase of ball milling time. The smooth fitting spectrum and the second derivative spectrum of the infrared spectrum showed that the area of each absorption peak decreased obviously with the increase of the milling time. Compared with that of ball milling under 0h, after ball milling for 10, 20 and 40 h, the vibration absorption peak area of Fe—O bond at 473 cm-1 decreased by 48.84%, 65.97% and 93.54%, respectively, and at 540 cm-1, the absorption peak area of the Fe—O bond decreased by 37.11%, 51.76% and 82.85%, respectively. Similarly, the absorption peak area of in-plane bending vibration of the O—C—O bond at 856 cm-1 was 30.62%, 44.71% and 67.10%, respectively, and the peak area of C—O bond asymmetric stretching vibration at the wavenumber of 1 446 cm-1 decreased by 0.03%, 27.63% and 57.90%, respectively, compared with that of ball milling at 0 h. In this way, the phase changes of barium ferrite precursors during high energy ball milling were investigated, and the percentage changes of reaction product content were accurately determined based on quantitative analysis, which has important guiding significance for the research on the changes in subsequent materials synthesis and properties with the phase changes of barium ferrite precursor.
May. 01, 2022Vol. 42 Issue 5 1634 (2022)
Lu BAI, Xiong XU, Quan-zhen LIU, Yan-jun DU, and Dong-hong WANG
Based on three-dimensional excitation-emission matrix spectroscopy (3D-EEMs), combined with regional fluorescence integration (FRI) and characteristic fluorescence parameters, the spectral characteristics of dissolved organic matter (DOM) in four different types of natural water in Wuhan were studied. Meanwhile, the results of East Lake in Wuhan were compared with relevant data in the recent ten years. The results showed that five fluorescence components were detected, including protein-like fluorescence component(tyrosine-like(C1), tryptophan-like(C2)), fulvic acid-like fluorescent component(C3), soluble microbial metabolite component (C4) and humic acid-like component(C5). From the perspective of fluorescence characteristics, the fluorescence intensity of components C1, C2 and C3 are the highest in the sampling water of lakes with relatively poor water quality, mild to moderate eutrophication and severe pollution. The fluorescence components of DOM in the relatively clean source water, rainwater and the tap water (as the control) were similar. Only C5 components were different; In terms of the source of the DOM, the DOM of water in Wuhan has a significant mixed input feature, with the main terrestrial source and the supplementary endogenous source. The mean terrigenous components of the river, lake, rainwater, source water are 46.2%,56.4%,54.2% and 51.6%, respectively, and the mean proportions of endogenous source components are 12.3%, 10.1%, 10.4% and 9.7%, respectively. The correlation analysis showed that there was a strong correlation between C1, C2 and C3 components(R2>0.98), mainly from terrestrial sources, with homology; C4 and C5 components also have a strong positive correlation(R2>0.73) with total phosphorus (TP) and total organic carbon (TOC), respectively. Compared to the past 10 years data, the terrestrial components (C1, C2, C3) of DOM in Wuhan East Lake have gradually increased, but decreased sharply in 2020, while C4 and C5 components increased significantly.
May. 01, 2022Vol. 42 Issue 5 1642 (2022)
Jun-jie YANG, Miao-fen HUANG, Wei-jian LUO, Zhong-lin WANG, and Xu-feng XING
Currently, oil slick detection at a large scale by remote sensing is widely concerned. However, oil-in-water, which is subject to seawater and chemical dispersant's physical process, can also harm marine environment and organisms. The upward radiance of seawater is the key signal of watercolor sensors, so finding the approaches to detecting oil-in-water by analyzing the feature of the upward radiance spectrum for oil-in-water waters is also significant for the marine ecosystems. A simulation, which parameters were from the ground-based measurement at Dalian Port, was made by Hydro light for the computation of the underwater light field of seawater, which contains oil-in-water. To reveal the feature of the upward radiance as a function of wavelength, water depth and zenith angle, and to analyze the effect of oil-in-water on the upward radiance spectra and its response spectra in seawater medium. The simulation shows that oil-in-water mainly affects the visible spectrum. The peak of the upward radiance spectrum shifts from 417.5 to 442.5~472.5 nm and the value of the radiance decreases as the content of oil-in-water increases. It is the primary spectrum basis for detecting oil-in-water by the ocean color remote sensing techniques, for these responses belong to the detection domain of watercolor remote sensing. Besides, the upward radiance curves decrease with increasing water depth, then increase near the bottom. It indicates that the upward radiance just above the sea surface is contributed by the backscattering of water components at depth, the reflection of the bottom and the upward transmission through the air-water surface, following the radiative transfer model. It is different from the detection mechanism of oil slicks by changing the reflection ratio of the nature sea surface. Furthermore, compared with seawater's upward radiance, which contains oil-in-water, the reflection of direct solar radiation is powerful enough to shield the upward radiance. The swing capability of satellite-borne ocean color sensors can exclude the direct solar reflection to sense the upward spectral signals of oil-in-water. Meanwhile, the high signal to noise ratio of ocean color sensors and the transit time of ocean color satellites from 10 am to 2 pm also meet the detection requirement of dark pixels for waters containing oil-in-water. This paper indicates the spectral basis and the radiative transfer mechanism to detect oil-in-water by ocean color remote sensing techniques. It shows that the oil-in-water can be regarded as a new water component to develop the remote sensing inversion model to retrieve oil-in-water by the radiative transfer procedure of light in water media.
May. 01, 2022Vol. 42 Issue 5 1648 (2022)
Guang-tong TANG, Hui-bo YAN, Chao-yang WANG, Zhi-qiang LIU, Xin LI, Xiao-pei YAN, Zhong-nong ZHANG, and Chun LOU
Radiative heat transfer is the main mode of heat transfer in various combustion processes. The distribution of radiative spectra is complicated for different flames. In this work, the spectral intensities of a hydrocarbon diffusion flame invisible (200~900 nm), near-infrared (900~1 700 nm) and middle-infrared (2 500~5 000 nm) wavebands were measured by spectrometers. The spectral characteristics of the flame in air and oxy-combustion atmospheres were analysed. Based on spectral analysis, flame temperature was calculated, and thermal radiation from soot particle and gases in the flame could be quantitively evaluated. The results show that flame temperature in air combustion is lower than in oxy-combustion. Both soot and gas in flames play an important role in thermal radiation in air combustion, and gas is more important for thermal radiation in oxy-combustion. In visible and near-infrared wavebands, the spectral curve shows good continuity in air-combustion due to soot formation, but the radiative spectrum reduces in oxy-combustion. In the mid-infrared waveband, the gas radiation spectrum of air-combustion is obviously weaker than that of oxy-combustion.
May. 01, 2022Vol. 42 Issue 5 1654 (2022)
© Copyright 2018-2021 | Chinese Laser Press.
All Rights Reserved 沪ICP备15018463号-20