


 View fulltext

2022
Volume: 42 Issue 3
49 Article(s)

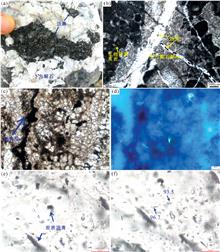
Shang-hua SI, Zhe-heng YANG, You-zhi CHEN, Li-jun SONG, Xiao-qing SHANG, Chuang ER, and Chao LIU
To determine the relationship between the thermal evolution degrees and Raman spectra of reservoir bitumens, bitumen from the reservoir in the Baiceng area of Southwest Guizhou Province was quantitatively analyzed using non-destructive Raman spectroscopy and fluid inclusion. Firstly, the homogenization temperature of fluid inclusions associated with the reservoir bitumen was obtained. The Raman spectrum of the bitumen was then obtained and compared with the maturity distribution standard for bitumen to determine the homogenization temperature, thermal evolution degree, and characteristics of the bitumen in the study. The results indicate that hydrocarbon reservoir charging events occurred in the Baiceng area of Southwest Guizhou in the Late Triassic (230 Ma) and Oligocene (30 Ma) and that the hydrocarbon-forming fluid had the characteristics of multi-stage hydrocarbon accumulation, these two oil and gas charging events are the ultimate source of reservoir bitumen in this area. Bitumen is the natural cracking product formed by the thermal metamorphism of oil. With the increase of burial depth, bitumen is continuously polymerized or carbonized. The formation of reservoir bitumen is accompanied by two stages of aqueous thermal fluid events, and the homogenization temperatures of aqueous inclusions are 93.5~96.7 and 101.2~103.7 ℃. The results show that the Raman shift range of D peak is 1 334~1 346 cm-1, the Raman shift range of G peak is 1 607~1 610 cm-1, the difference G-D is 264~275 cm-1, and the Dh/Gh value is 0.552~0.573. According to the bitumen maturity distribution chart, the bitumen in the reservoir has reached the over-mature stage. The energy intensity ratio of D peak to G peak (R1) is 0.573,the full width at a half ratio of D peak to G peak(R2) is 1.688~1.945, and the ratio of D peak to the (D+G) integral peak area (R3) is 0.68~0.72. The Raman spectrum analysis indicates that the fluid temperature of the regional paleo reservoir is 122.78~164.31 ℃. The reservoir bitumen in the Baiceng area of Southwest Guizhou is derived from allochthonous migration-type organic matter. The similarities in laser Raman spectrum characteristics indicate that the reservoir bitumen samples have the same origin. They are products of the transformation of oil and gas materials that escaped from the preexisting paleo reservoir along the ore-controlling structure in the study area. Finally, the relationship between the Raman spectrum and thermal evolution of bitumen is determined, providing a theoretical basis for studying the evolution of ancient reservoir oil into reservoir bitumen.
Mar. 01, 2022Vol. 42 Issue 3 783 (2022)
Ai-chen WANG, Bin-jie GAO, Chun-jiang ZHAO, Yi-fei XU, Miao-lin WANG, Shu-gang YAN, Lin LI, and Xin-hua WEI
Site-specific variable spraying is an effective approach to reducing pesticide use and improving the use efficiency for crop protection against disease, pests and weeds through chemical spraying, and target detection is a key procedure for site-specific variable spraying. Active illumination was adopted to detect green plant targets (crops and weeds), and the fluorescence spectral information of targets was analyzed. White, blue and red LEDs were utilized for illumination, and the spectra of green plants and others were collected in four circumstances, i.e., day-indoor, day-under sunshine, day-shadow, and night-dark environment. Classification models were built based on multi-wavebands spectral features using soft independent modeling of class analogy (SIMCA) and linear discriminant analysis (LDA) methods. Results showed that with the illumination of the three types of LEDs, the recognition rates for the prediction dataset using SIMCA models were all above 92%, and corresponding rejection rates were all 100%. The LDA models could predict all samples with 100% accuracy, performing better than SIMCA models. And the difference in the effect of the three types of LEDs was indistinguishable. -The objective function for classifying green plants and others was proposed, and the particle swarm optimization (PSO) method was used to select the optimal single waveband. The optimal waveband for the three types of LEDs (white, blue and red) was 731.1, 730.76 and 731.1 nm, respectively, and corresponding thresholding classification models were established. Results showed that the classification F1-scores for the three classification models were 76.71%, 80.52% and 78.48%, respectively. Under complex circumstances, the blue LED provided the best illumination for greed plant detection. The selected blue LED light source and optimal waveband are valuable for developing low-cost green plant sensors.
Mar. 01, 2022Vol. 42 Issue 3 788 (2022)
Jie WU, Chuang-kai LI, Wen-jun CHEN, Yan-xin HUANG, Nan ZHAO, Jia-ming LI, Huan YANG, Xiang-you LI, Qi-tao LÜ, and Qing-mao ZHANG
Elemental analysis is an essential requirement in the metallurgical industry, nuclear industry, pollution detection and environmental monitoring. As a new type of atomic spectrum analysis technology, LIBS has been widely concerned because of its real-time, fast, almost non-destructive and multi-element simultaneous analysis. However, its poor analytical sensitivity has restricted the development of this technology. LIBS-LIF can improve the sensitivity of analysis and efficiently detect the element types of samples through laser resonance excitation. The spectrometer can collect spectral information and a model can be established to predict the concentration of unknown samples. However, when the characteristic spectral lines of the matrix atom and the target atom are very close, the matrix spectral lines will be affected, and the unary calibration accuracy will decrease. In this paper, linear models of Ni and Cr elements in steel were established using linear fitting with one variable and linear fitting with multiple variables. Firstly, the peak spectral line in the sample spectral map is selected to find whether it is the characteristic spectral line corresponding to the element to be measured or the collective element. After selecting suitable characteristic spectral lines, the spectral intensities of multiple spectral lines and the concentrations of the elements to be measured in the sample were used as a multivariate linear fitting model, and the fitting coefficients corresponding to each spectral line were ranked from highest to lowest, and the contribution of the spectral intensities corresponding to each characteristic spectral line in the multivariate linear fitting model to the concentration prediction was taken as the criterion from highest to lowest, and the fitting dimension was increased continuously. The mean relative errors of the regression models for Ni and Cr elemental content were reduced from 38% to about 10% and 55% to within 25%, respectively, and the root mean square error values of the cross-validation of the linear regression models for Ni and Cr elemental content were reduced from 3.4% to 2% and 2.5%, respectively, with the increase of dimensionality. and 2.5% to 1.5% for Ni and Cr, respectively. In this paper, the method of selecting multiple spectral lines to establish a multiple linear regression model is relatively effective in reducing the influence of excitation interference, and it puts forward a feasible scheme for promoting the practical application of laser-induced fluorescence assisted laser-induced laser spectroscopy technology in element analysis.
Mar. 01, 2022Vol. 42 Issue 3 795 (2022)
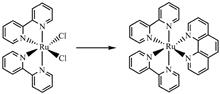
Zuo-qin LIANG, Xu YAN, Dong-dong SONG, Xiao-bo ZHANG, Jia-xuan ZHANG, Chang-qing YE, Shuo-ran CHEN, and Xiao-mei WANG
Triplet-triplet annihilation (TTA) upconversion is a spectral conversion technique with large anti-stoke shift under the incoherent low-power photoexcitation. And the excitation and emission wavelengths are adjustable. Therefore, TTA upconversion has an important application value in improving solar energy utilisation. Tremendous advances have been made on the sensitizers, but the research on the emitters is relatively backward. In this paper, 2-substituted anthracene derivatives (DTACl and DTACN) were used as the emitter doped with Ru(Ⅱ) polypyridine complex [Ru(bpy)2Phen]2+ (as the sensitizer) to set up the TTA upconversion models. The effects of anthracene 2-substituents on the luminescence efficiency, triplet-triplet energy transfer (TTET), TTA have systematically studied through the emission and upconversion spectra of the sensitizer the emitter. It is found that DTACl has higher fluorescence quantum yield, larger triplet quenching constant and higher TTA efficiency than DTACN. These results make the upconversion efficiency of [Ru(bpy)2phen]2+/DTACl higher than that of [Ru(bpy)2phen]2+/DTACN. Additionally, from the aspect of orbital energy level, the relationship between the triplet energy difference of the sensitizer and the emitter and the TTET efficiency, as well as the relationship between the singlet/triplet energy difference of the emitter and the TTA efficiency, were studied based on the emission spectra and the density functional theory calculation. The research results show that reducing the ability of the 2-substituted group to withdraw electrons can effectively improve the triplet energy level, which is conducive to the TTET efficiency due to the decrease of the triplet energy difference between the emitter and the sensitizer. At the same time, it is good for the TTA efficiency due to the increase of the emitter’s singlet/triplet energy difference. The triplet energy level has an important influence on the TTA upconversion efficiency. This work provides a simple and feasible method for designing new and efficient triplet emitters.
Mar. 01, 2022Vol. 42 Issue 3 802 (2022)
Ke-man SHAO, Gui-yu FU, Su-yan CHEN, Cheng-yi HONG, Zheng-zhong LIN, and Zhi-yong HUANG
Malachite green is an artificially synthesized triphenylmethane compound. The disadvantages of conventional detection methods for malachite green, such as complicated pre-treatment, long time-consuming and requiring the use of large instruments, result in the inability to detect promptly. So it is of great importance to invent a method that can detect malachite green residue effectively, rapidly and conveniently. Molecularly Imprinted Polymers (MIPs) are multiporous materials with specific recognition sites that allow the recognition and adsorption of specific target molecules. The rare-earth complexes emit fluorescence at 618 nm, and the maximum absorption wavelength of malachite green is also 618 nm, and the combination of the two produces fluorescence quenching effect. Thereby a rare-earth complex based molecularly imprinted fluorescent probe was developed to detect malachite green in aquatic products. The specific content of malachite green in aquatic products was calculated by detecting the degree of its fluorescence quenching at 618 nm. A malachite green molecularly imprinted polymer was prepared by precipitation polymerization method using cryptic malachite green as a template, methacrylic acid as a functional monomer, ethylene dimethacrylate as a crosslinking agent, modified silica as a core, and the rare-earth fluorescent complex Eu(MAA)3phen as a fluorochrome, in the following conditions∶template∶monomer∶crosslinker=1∶4∶10, Rare earth complexes=15 mg, acetonitrile 60 mL, Molecular imprinting of rare-earth complexes, which have been successfully synthesized, was verified by carrying out TEM and FT-IR scanning analysis, and the fluorescence lifetime when examined was found to be 1 094.11 μs. However, the fluorescence lifetime after the addition of malachite green was 587.49 μs. The decrease of fluorescence lifetime illustrated that the quenching of MIPs by malachite green belonged to the fluorescence resonance energy transfer fret. After verifying the selectivity and adsorption properties of MIPs, malachite green was examined. The linear range of the optimized polymer for malachite green was 0~20 μmol·L-1, the fluorescence quenching coefficient F0/F shows a good linear relationship with the malachite green concentration, and the linear equation is F0/F=1.008c+0.344(0.1~1 μmol·L-1, R2=0.991), F0/F=0.587c+0.570(1~20 μmol·L-1, R2=0.999) with a detection limit of 0.037μmol·L-1 (3σ/S, N=9), which was successfully applied as a fluorescent probe for the detection of malachite green in fish meat, with spiking recoveries in the range of 95.61%~102.51%. These results indicate that the developed MIP based probes can detect malachite green residues easily, rapidly and accurately.
Mar. 01, 2022Vol. 42 Issue 3 808 (2022)
Ying-ying LI, Zhi-qing ZHANG, Xiao-hong WU, and Hsitien Shen Andy
Generally, fossil resins emit distinct fluorescence under ultraviolet illumination. However, their phosphorescence remains to be characterized. In this paper, six Indonesian fossil resins similar to the Dominican blue amber, are further divided into three parts: white inclusions (Part Ⅰ), dark inclusions (Part Ⅱ), and basal body (Part Ⅲ). By the infrared spectrometer, three vibration peaks at 1 384, 1 377, and 1 367 cm-1 indicate that these Indonesian fossil resins were derived from the Dipterocarpaceae plant. Firstly, we investigated three-dimensional fluorescence contours from three parts in Indonesian fossil resins. The results show the emission wavelengths covering the 330~380 nm ultraviolet area (excited by 235 nm), the 388 nm (excited by 330 nm), and the 446, 474 and 508 nm in the blue-green area (all excited by 440, 415 and 395 nm). It suggested at least two fluorophores contributing to the visible-range fluorescence. The relative concentration of these two fluorophores varies from Part Ⅰ to Part Ⅲ. Additionally, Indonesian fossil resin (copal) radiated a bright greenish-yellow phosphorescence when irradiated with a 365 nm ultraviolet light. Part Ⅱ & Ⅲ have a strong phosphorescence covering 460~650 nm with an emission center at 537 nm, while Part Ⅰ is close to 430 nm. The lifetime of 537 nm emission lasts more than 100 ms, while that of 430 nm emission is about 50 ms. These luminescence differences indicate that Part Ⅱ & Ⅲ underwent more aromatization than Part Ⅰ in the fossilization process.
Mar. 01, 2022Vol. 42 Issue 3 814 (2022)

The study of electron transfer in life has attracted much attention, and the research on the electron transfer of proteins and enzymes has become a hot spot. However, electron transfer may be an effective way to explain this mechanism. The detailed mechanism of photoinduced heme protein reduction is still unclear. In this paper, UV-visible absorption spectroscopy, steady-state fluorescence spectroscopy and circular dichroism spectroscopy were used to study the effects of different UV wavelengths systematically, pH, amino acids,Glutathione and Imidazoleon the photoreduction of Cyt b5 in vitro near-physiological environment to clarify the photoreduction mechanisms of Cyt b5 which wasn’t proposed by the traditional methods. The results show that ferric cytochrome b5 can be photoreduced to the ferrous state by direct photoexcitation in the near-ultraviolet region. In this study, we studied the mechanism and facilitating conditions for photoreduction. Based on the sort band blue-shifted of 412 nm and absorbance intensity increase of Q band 556 nm, Cyt b5-FeⅢ in phosphate-buffered was photoreduced to Cyb5-FeⅡ similar to the action of a chemical reducing agent occurs. Considering that the fixed wavelength, pH values, amino acids and ligands of photoreduction were irradiated by 280 nm light, Cyt b5 had the strongest reduction degree. Under 280 nm alkaline conditions, Cyt b5 had the strongest reduction degree; glutathione and imidazole promoted the photoreduction reaction by providing electron and hydrogen donors; free Met in solution promoted the photoreduction reaction at the maximum rate happened. The photoreduction mechanism of Cyt c was intramolecular electron transfer, including the formation of porphyrin cation radical as an active intermediate excited by 280 nm light. In addition, results of fluorescence and CD spectra indicated that the protein-peptide chain structure, while the secondary structure of the protein changes, α-helix content decreased, β-sheet content increased.However, the secondary structure of Cyt b5 is still dominated by α-helix in the photoreduction process. Moreover, it provides a theoretical basis for the redox reaction and electron transfer mechanism in life.
Mar. 01, 2022Vol. 42 Issue 3 821 (2022)
The ionospheric characteristics such as total electron content and plasma bubble parameters can be retrieved by observing the ionospheric airglow with spaceborne imager. Atoms and molecules absorb solar radiation and excite to higher energy states in the daytime. At night, they radiate the energy in the form of airglow. The radiation intensity is related to the density of ionospheric components. Therefore, airglow is an excellent tracer for observing the ionosphere. In order to promote and optimize the design of space-borne imager and enrich the ionospheric detection methods, it is necessary to conduct imaging simulation analysis of global airglow. The main works of this paper are as follows: (1) the photochemical reaction process of 630 nm radiation at night is analyzed, and a simulation analysis method of airglow imaging is designed. The intensity distributions of airglow in four different seasons with high and low solar activity are obtained, which provide a theoretical basis for setting detection index; (2) the simulation research of space-borne imaging is carried out, including imaging chain and signal-to-noise ratio analysis. A typical imager parameter with a time-delay integral imaging method is used to carry out the simulation combined with the satellite orbit. The main conclusions are as follows: (1) the intensity of 630 nm at night is closely related to the solar radiation intensity in the daytime. The average night radiation intensity with high solar activity is 115 Rayleigh, and that with low solar activity is 50 Rayleigh, the radiation intensity and distribution are consistent with the actual observation results of GLO-1 and ISS-IMAP; (2) the observation width and horizontal resolution of typical parameter imager reach 245 km and 1 km. The signal-to-noise ratio is more significant than 10 for the intensity greater than 50 Rayleigh, it means the typical parameter imager can observe the global structure of ionospheric airglow with high solar activity. The research results in this paper provide a theoretical basis for space-borne ionospheric airglow detection and provide a reference for observing other wavelengths.
Mar. 01, 2022Vol. 42 Issue 3 828 (2022)
Ling-yue YANG, Sheng-wu YAN, Hao-tian WANG, Yu-ting ZHANG, Ren-yun WANG, Ming-xing YANG, and Chao-wen WANG
The Nanhong agate is one of the most common red agates in the Chinese jewelry market. The market of the Nanhong agate is thriving, and Nanhong agate imitations are flourishing, while few studies have been conducted on the differences of materials and spectral characteristics between the natural Nanhong agate and its imitations. In this paper, the conventional gemological instruments, Microscope, UV-Vis spectrometer, Raman spectrometer and Fourier infrared absorption spectroscopy(FTIR) were employed to study two kinds of the Nanhong agate imitations and the natural Nanhong agate. The results show that the two kinds of the Nanhong agate imitations are both composed of quartz, similar to the natural Nanhong agate, and have a similar refractive index, density, hardness, color, luster, and other physical properties relative to the natural Nanhong agate, with inertia under both short-wave and long-wave ultraviolet light. The first imitation (FZP-1) imitates a cherry red bracelet, exhibiting a light orangey-red as indicated from the spectrum of the UV-Vis showing a broadened absorption band between 240 and 570 nm. The FZP-1 displays granular texture and a pulp luff-like shape, with red dyestuff filling along the edge of the quartz granular, a typical structural characteristic of a dyed quartzite. The second imitation (FZP-2) imitates a persimmon red bracelet with a yellow orange red color as demonstrated by an absorption band from 300, 240 nm to 550, 540 nm under UV-Vis. The natural Nanhong agate(TR) showed an absorption band from 440 to 560 nm under UV-Vis. The FZP-2 shows a cryptocrystalline structure, whose banded and nail-like structures can be observed on the surface, and whose different colors are shown in different layers, indicative of dyeing and heating treatments of the FZP-2. The nature Nanhong agate exhibits cryptocrystalline texture and contains spot-like hematite, which is remarkably different from the internal structures of two imitates. The FTIR spectrum reveals quartz’s typical spectrum characteristics for both of the two kinds of Nanhong agate imitations and the natural Nanhong agate. The absorption peaks existed in the range of 1 100~1 250 and 600~800 cm-1 are attributed to the So—O—Si’s asymmetric and symmetric stretching vibration, respectively. The peaks at 300~600 cm-1 are assigned to the bending vibration of Si—O—Si. The peaks around 800 cm-1 in FTIR patterns are splitting in both samples, indicating a good crystalline degree of quartz. Peaks between 2 800~3 200 cm-1 are detected at the particle clearance in the FZP-1 under micro-infrared spectroscopy, which is related to organic dyeing agent, especially at 2 916 and 2 848 cm-1 to the stretching vibration of C—H. In addition to the peak position of quartz, the Raman spectrum of the FZP-1 show peaks at 915 and 1 337 cm-1, due to the bending vibration of the saturated C—H, which are related to organic dyeing agent, in good agreement with the result of micro-infrared spectroscopy. The peak at 502 cm-1 in the Raman spectrum indicates the existence of moganite in the ZFP-2. The ratios of relative content of moganite and quartz are calculated spanning 0.15~0.16, based on the ratios of characteristic peaks of moganite and quartz in the Raman spectrum, which is higher than the natural Nanhong agate. Rather than, the peaks relate to hematite is inexistent in both of the two kinds of imitations. The first and second imitations should be named as dyed quartzite and agate, respectively, according to the national standard of Gems-Nomenclature.
Mar. 01, 2022Vol. 42 Issue 3 835 (2022)
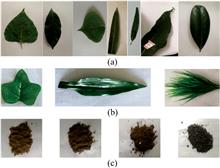
Min-jie DUAN, Yan-ming LI, Xin-yu LI, Jun-fei XIE, Qian WANG, Song-ting ZHAO, Rui XU, and Yue-rong WANG
Along with promoting the color extension green technology demonstration project in Beijing, color-leaf plants play an increasingly prominent role in urban landscape construction and improvement of the living environment, especially in recent years. If the regional distribution and growth characteristics of urban colorful leaf plants can be observed quickly and lossless by using hyperspectral technology, important theoretical basis and data support can be provided for further optimizing the layout of urban colorful leaf plants and accelerating the construction of urban color-leaf plants system. In recent years, the rapid development of hyperspectral remote sensing technology provides a lot of ground cover plant spectral information and improves the spectral resolution and response range. Plant spectrum has a series of characteristic absorption bands, which can indicate the differences between different tree species, and is the basis of hyperspectral tree species identification. This paper selected 15 species of colorful leaf plants with different color systems in Beijing as the research object. Moreover, the SR-3501 portable surface feature spectrometer was used to analyze the characteristics of the hyperspectral reflection curve of leaves of plants of different color families in autumn. The difference and variation of the characteristic bands and characteristic parameters of plants of different color families were further studied through the differential transformation and feature parameter extraction. The results showed that Euonymus japonzcus had the characteristics of typical green vegetation spectral curve, which were the changes of “peak” and “valley”; the spectral reflection characteristic of purple leaf plants was similar to that of green plants; the spectral reflection characteristic of red leaf plants was similar to that of yellow leaf plants. Based on spectral absorption characteristic parameters, the green/red peak position of different color plants showed a trend of red leaf plants>purple leaf plants>yellow leaf plants>green leaf plants, and green/red peak reflectivity, red valley location and red valley reflectivity were all represented by the yellow leaf plants>red leaf plants>purple leaf plants>green leaf plants. The characteristic spectrum parameters of the three sides of different color plants had certain regularity and can be used as the characteristic parameters to distinguish the different colored plants with green plants. In comparison, the red amplitude and red edge area, yellow amplitude and yellow edge area, blue amplitude and blue edge area could be used as the important spectral characteristic parameters to distinguish the purple leaf plants, the red leaf plants and the yellow leaf plants from green plants. This study provides a theoretical basis for applying the hyperspectral technique in the future observation of urban color leaf plant system construction.
Mar. 01, 2022Vol. 42 Issue 3 841 (2022)
En YANG, and Shi-bo WANG
Hyperspectral remote sensing is an effective method for coal mining area detection, and it is of great significance for coal resource surveys and environmental monitoring in the mining area. At the same time, reflectance spectrum characteristics of remotely measured objects such as coal, gangue, vegetation and water body in all directions are the basis of hyperspectral remote sensing in the coal mine. In this paper, the directional reflectance spectra of typical types of coal were studied. Four typical types of coal in the three major coal types anthracite, bituminous and lignite were collected from different mining areas in China. According to the increasing rank, these coals included No.1 anthracite, meager coal, gas coal and No.2 lignite. Spectral reflectance curves of each type of coal in all directions in hemispheric space were measured in the near-infrared band (1 000~2 500 nm) using the spherical coordinate device for directional reflection measurement in the laboratory. By waveforms of spectral reflectance curves acquired, it was found that near-infrared reflectance spectrum curves of the same coal in different reflection directions show similar waveforms. However, there are some differences in overall reflectance and local waveforms, and the rule is that the absorption valleys become more obvious with increasing overall reflectance. With increasing reflection angle, reflectance spectrum curves of all these four types of coal rise on the whole in the forward direction (180° azimuth), but the change is relatively small in the backward direction (0° azimuth). In each directional reflectance spectrum curve in the hemispheric space of each coal, five characteristic wavelength points, including 1 400, 1 700, 1 900, 2 200 and 2 300 nm were selected. By polar nephograms of the spatial distribution of reflectance at the five wavelength points, it was found that all these four types of coal show bidirectional reflection and prominent hot spots in the forward direction and relatively weaker hot spots in the backward direction. The hot spots in the backward direction of No.1 anthracite appear relatively more obvious than those of meager coal, gas coal and No.2 lignite. With decreasing coal rank, meager coal, gas coal, and No.2 lignite show the rule of relatively enhanced hot spots in the backward direction. The correlation between reflectance and reflection angle of backward and forward direction at the five wavelength points of each type of coal were analyzed. It was found that the correlations between reflectance and reflection angle are approximately linear and Gaussian functions in forwarding and backward direction respectively. Moreover, with decreasing coal rank, the peak of the Gaussian fitting curve moves to a larger reflection angle. This study provides the basis for the selection of the optimal detection geometry and reference for precise detection of coal resources in hyperspectral remote sensing of mining areas.
Mar. 01, 2022Vol. 42 Issue 3 847 (2022)
Wei-na DUAN, Xia JING, Liang-yun LIU, Teng ZHANG, and Li-hua ZHANG
Solar-induced chlorophyll fluorescence (SIF) can sensitively reflect crop disease stress information, but the geometric structure of canopy and other factors seriously affected the ability of SIF to capture changes in photosynthetic function and stress status of vegetation. Therefore, in this paper, the normalized difference vegetation index (NDVI) and MERIS terrestrial chlorophyll index (MTCI), which can sensitively reflect crop biomass, were integrated with SIFP (SIFP-NDVI,SIFP-MTCI,SIFP-NDVI*MTCI), and the remote sensing monitoring accuracy of SIF on wheat stripe rust before and after the integration was compared and analyzed. The results show that: (1) at the O2-B, O2-A and H2O absorption at 719 nm bands, integrated reflectance spectral indices of SIFP-NDVI, SIFP-MTCI and SIFP-NDVI*MTCI showed different improvements in correlation with disease index (DI) than SIFP. The O2-B band increased the most significantly, by 23.48%, 33.61% and 36.49% respectively, while the O2-A band increased the least by 2.39%, 2.14% and 1.51%, respectively. (2) If SIFP-NDVI and SIFP-MTCI were regarded as independent variables respectively, the averaged R2 value of the prediction model based on random forest regression (RFR) algorithm were increased by 1.15% and 4.02%, and the averaged RMSE value were decreased by 2.7% and 14.41%, respectively, compared to those with SIFP as the independent variable. (3) The prediction model based on SIFP-NDVI*MTCI gave the best performance with an R2 value 5.74% higher than that of SIFP, and an RMSE value 22.52% lower than that of SIFP. The results of this paper are of great significance to improve the accuracy of remote sensing monitoring of wheat stripe rust and have a certain reference value for disease monitoring of other crops.
Mar. 01, 2022Vol. 42 Issue 3 859 (2022)
Xu YANG, Xue-he LU, Jing-ming SHI, Jing LI, and Wei-min JU
Chlorophyll content is an important indicator of crop health, plant productivity, and environmental stress. Real-time, fast and accurate acquisition of leaf chlorophyll content of crops is of significant for monitoring crop growth. Remote sensing is an effective way to retrieve leaf chlorophyll content of crops at regional and global scales. However, previous studies retrieving leaf chlorophyll content of crops does not fully consider the impact of underlying surface background, limiting retrieval accuracy. To this end, this paper aims at the inversion of rice leaf chlorophyll content from Sentinel-2 remote sensing satellite data using a look-up table based approach. The look-up table was simulated using the PRAOSAIL radiation transfer model. The applicability of chlorophyll indices (CI) calculated from the reflectance of the green band and different red-edge bands and the spectral index (Zarco and Miller, ZM) constructed by two different red edge bands in inverting leaf chlorophyll content was evaluated using field measurements. The greenness index (G) was integrated with CI and ZM to constrain the impact of background on the inversion of leaf chlorophyll content. The main findings of this study are: (1) The accuracy of leaf element content inversion based on the spectral index constructed in different bands is different, and CI740 performed the best (R2=0.79, RMSE=9.02 μg·cm-2), followed by ZM (R2=0.71, RMSE=10.53 μg·cm-2), CI705(R2=0.69, RMSE=9.17 μg·cm-2), and CI783(R2=0.67, RMSE=10.84 μg·cm-2); (2) The inverted leaf chlorophyll content is significantly affected by the background, especially at the early stage of rice growth. The inverted leaf chlorophyll content was systematically lower than observations (mean relative error (MRE) in the range from -18.87% to -31.94%) owing to strong background interference; (3) CI/G and ZM/G can effectively eliminate the influence of background and improve the accuracy of rice leaf chlorophyll inversion. At the early stage of rice growth, inversion based on CI/G and ZM/G significantly improves agreement between inverted and observed leaf chlorophyll content (MRE in the range from 8.11% to 18.11%). These findings are of great significance for improving the inversion of leaf chlorophyll content under different leaf area index levels of rice from remote sensing data.
Mar. 01, 2022Vol. 42 Issue 3 866 (2022)
Qing-lin TIAN, Bang-jie GUO, Fa-wang YE, Yao LI, Peng-fei LIU, and Xue-jiao CHEN
The spectrum is a comprehensive reflection of the mineral’s physical chemistry characteristics, composition and structure, which has been used in mineral and rock identification. The traditional classification methods of the mineral spectrum require complex spectral pretreatment, and then some spectral features are analyzed by different methods to achieve the goal of fine classification. However, the pretreatment may cause a partial loss of the spectral information and reduce the classification accuracy. Besides, the operation process is complex, so the efficiency is low, making it difficult to cope with the growing demand for big data processing. Therefore, it is important to establish an accurate, efficient and automatic classification model for the mineral spectrum. As one of the widely used deep learning models, the convolutional neural network extracts data features layer by layer and combines them to form higher-level semantic information. It has a strong capability of model formulation and great potential for the analysis of spectral data. This paper proposes a novel mineral spectrum classification method based on a one-dimensional dilated convolutional neural network (1D-DCNN). The DCNN is used for spectral feature extraction. The backpropagation algorithm combined with the random gradient descent optimizer is used to adjust the model’s parameters, then output the classification result, which implements the end-to-end discrimination of mineral species. The 1D-DCNN includes one input layer, three dilated convolution layers, two pooling layers, two full connection layers and one output layer. It uses cross-entropy as the loss function, and dilated convolution is introduced to enlarge the receptive field of filters effectively avoid the loss of spectral feature details. The spectrum of four different minerals, muscovite, dolomite, calcite and kaolinite, are collected, and the data are augmented by way of adding noise to construct sufficient spectral samples, which are used for model training and testing. Then, we explore the impacts of different model parameters, such as the convolution type and the number of iterations, and then compare the proposed model with the traditional mineral spectrum classification methods to evaluate its performance. Experimental results indicate that the 1D-DCNN model can quickly and accurately classify mineral spectrum with the accuracy of 99.32%, which is superior to the backpropagation (BP) algorithm and support vector machine (SVM) methods, and it shows that the proposed method can fully learn mineral spectral features and implement a fine classification result, with good robustness and scalability. The proposed method can apply further to the spectra classification in coal, oil-gas, lunar soil and other fields.
Mar. 01, 2022Vol. 42 Issue 3 873 (2022)
Chun-juan WANG, Bin ZHOU, Yao-yao ZHENG, and Zhi-feng YU
In situ measurement of water spectrum is one of the indispensable basic works in the research of water optical properties and watercolor remote sensing inversion modeling. The conventional oblique observation method is restricted by its strict observation geometric conditions, it is necessary to constantly adjust the observation angle according to the position of the ship and the azimuth of the sun, especially for the spectral observation of river water, need to consider the river direction, shoreline shelter and other conditions. Therefore, only a few stations can be set for observation of discrete sample points, it is not easy to carry out rapid observation for continuous navigation in the river water with complex environments around the shoreline. The rapid observation for continuous navigation of the field water spectrum can obtain the reflectance spectrum of large samples of water from different local times, enrich the understanding of the bidirectional reflection characteristics of water, and establish more accurate inversion models, which plays an extremely important role in the study of watercolor remote sensing. Because of this, a rapid observation method for continuous navigation of reflectance spectrum of inland river surface water based on vertical observation geometry is designed in this study, and then obtained the full-wavelength remote sensing reflectance data of the whole river through Spatio-temporal matching technology. The experiments in some sections of XiXiao River in Hangzhou show that the correlation coefficient between remote sensing reflectance obtained by this method and the watercolor components such as chlorophyll concentration and turbidity measured synchronically is strong, the determination coefficients R2 are all greater than 0.855 at the characteristic bands selected in this study. The observation zenith angle of Sentinel-2 is close to 0, close to vertical observation. In this study, use the spectral response function of Sentinel-2B to perform equivalent spectral simulation of the measured spectrum and converts it into the equivalent remote sensing reflectance of the corresponding bands. The inversion result is modeled with the sensing reflectance data after atmospheric correction based on Sen2Cor. The analysis results show that the remote sensing reflectance data after atmospheric correction based on Sen2Cor is obviously overestimated. At the same time, use of Sentinel-2B’s atmospheric apparent reflectance to deduce the radiance, then used FLAASH atmospheric correction to obtain the remote sensing reflectance of Sentinel-2B. By modeling and analyzing the equivalent remote sensing reflectance, the remote sensing reflectance data after atmospheric correction based on FLAASH is also overestimated when it is less than 0.02 sr-1, but obviously underestimated when it is greater than 0.02 sr-1. Research shows that the large sample measured remote sensing reflectance data obtained by this method has the application potential to verify the authenticity of satellite reflectance products.
Mar. 01, 2022Vol. 42 Issue 3 878 (2022)
Xiao-yang HE, Ze LIU, Liang SUN, Jing LIANG, Xue-jie SONG, Cai-yin WANG, and Yan LIU
LED light source has many outstanding performances, including high color rendering, high luminous efficiency, long life and energy saving. It had been widely adopted LEDs lighting for clothing stores. However, there were many problems when choosing a lighting method for a clothing store. For example, the lighting cannot restore the original appearance of the clothing. This can cause consumers to have a weaker perception of the atmosphere and make consumers lose their desire for purchase. This paper was based on the adjustable LED light sources. For the indoor lighting occasions of clothing stores, four types of lighting environments with different physical parameters were designed using general lighting, key lighting, partial lighting and mixed lighting, respectively. With the help of the semantic differential scale of psychophysical experiments, subjective evaluation questionnaires were formed using 36 sets of word pairs. It was using 22 observers (11 males, 11 females) to simulate consumer’s subjective evaluation of preference, attractiveness, coziness and color fidelity of five colors of clothing (black, blue male’s clothing and white, red and yellow female’s clothing) corresponding to the every lighting environment. The difference coefficient was used to verify the stability and accuracy of the subjective evaluation data, and all the data was confirmed to be reliable and valid. The principal component analysis method was used to evaluate the effects of corresponding lighting methods. The basic dimensions of the lighting environment atmosphere of the clothing store had been evaluated as liveness, coziness and commercial. One-factor analysis of variance was used to determine further that liveness was the most important basic dimension of clothing stores. Moreover, this paper analyzed the effects of clothing color on observers’ color perception under the four LED lighting environments. The research results showed that the general lighting method was similar to the traditional light source in terms of lighting effects, and the consumer evaluation indicators were generally lower in clothing stores. Therefore, the general lighting method should not be used alone in clothing stores; the mixed lighting method was more suitable for illuminating black and blue male’s’s clothing and red females’ clothing than other lighting methods. The lighting effect produced was more attractive to consumers; Consumers preferred to illuminate yellow female’s clothing with the particle lighting method. However, the evaluation index of blue male’s clothing was very low under the particle lighting method by consumers. Blue male’s clothing should avoid using partial lighting method in clothing stores. The use of key lighting illuminated white females’ clothing that attracted consumers’ attention.
Mar. 01, 2022Vol. 42 Issue 3 884 (2022)
Chao-shuai HU, Yun-liang XU, Hong-yu CHU, Jun-xia CHENG, Li-juan GAO, Ya-ming ZHU, and Xue-fei ZHAO
The regulation of molecular structure and thermal conversion behavior of coal tar pitch is the key to preparing high-quality coal tar pitch-based carbon materials. In order to further clarify the relationship between pyrolysis behavior and molecular structure of coal tar pitch, 8 kinds of extracts derived from Medium temperature pitch (AGMP) were extracted by ultrasonic extraction with 8 kinds of organic solvents at room temperature in this paper. The PeakFit v4.12 software was used to perform peak fitting the infrared spectra of the extracts in four regions of 700~900, 1 000~1 800, 2 800~3 000 and 3 000~3 100 cm-1 to achieve the fine structure information about various functional groups. In addition, six molecular structure parameters (I1—I6) were introduced to characterize the relationship between molecular structure and pyrolysis activation energy of the extracts. FTIR spectra analysis shows that the 8 extracts are complex compounds composed of condensed aromatic ring structures mainly comprised of aliphatic hydrocarbon side chains containing oxygen and nitrogen and other heteroatoms. Moreover, due to the difference in the extractant’s structure, the extract’s molecular structure parameters are also slightly different. The extract obtained from the linear structure extractant has a higher content of chain hydrocarbons (I5), and the extract obtained from the ring structure extractant has more aromatic rings substituted structures (I6). Thermogravimetric analysis (TGA) was used to study the thermal weight loss behavior of 8 extracts at different heating rates (3, 6, 10, 15 K·min-1). Under the condition of equal conversion rate without considering the reaction mechanism, the pyrolytic activation energy (Ea) were calculated and analyzed using the Flynn-Wall-Ozawa method and Kissingr-Akahira-Sunose method. The results indicated that the eight extracts’ pyrolytic activation energies ranged from 78 to 116 kJ·mol-1, which are closely related to the structure and content of functional groups. The structural parameters of the extracts obtained by IR quantitative are correlated with the pyrolysis activation energy. The fitting results of the one-element linear equation Ea=f(Ii) between the structural parameters of the extracts and the pyrolysis activation energy found that the aromaticity index (I3) and the degree of branching (I5) are the two main indicators that determine the pyrolysis activation energy of the extracts. The fitting results of positive and negative correlation between the pyrolysis activation energy with every single index (Ii) indicate the difficulty of the structure being destroyed by pyrolysis. Considering the interaction of various infrared structural parameters, the fitting relationship model between the Ea of AGMP extracts and the infrared spectral structure indexes was shown as followed: Ea=-4 294.53I1+73 812.16I2+207 673.32I3-20 324.20I4-168.56I5+857.86I6. The results, which combined analysis of FTIR spectra, reveal more details about thermal characterization and kinetic characterization and they can be expected to lead to a well-understood coal tar pitch’s pyrolysis.
Mar. 01, 2022Vol. 42 Issue 3 889 (2022)
Fang-fang WANG, Xiao-dong ZHANG, Xiao-duo PING, Shuo ZHANG, and Xiao LIU
In order to explore the influence of acidification pretreatment on the extractable composition and macromolecular structure of coal, Gujiao coking coal in Shanxi Province was acidified and demineralized by HCl and HF, and different concentrations of tetrahydrofuran (THF) were selected for solvent extraction experiments of raw coal (RC) and acidified coal (DC). The extraction of raw coal and acidified coal were compared and analyzed using modern technical means such as GC-MS and FTIR. The results show that with the increase of solvent concentration, the extraction rate of raw coal and acidified coal tends to increase. After acidification, the minerals in coal decrease significantly, the solvent permeability increases, and the extraction rate increases. However, acidification pretreatment has no noticeable effect on the extraction rate of high-concentration THF because high-concentration THF solvent can extract dissoluble components from coking coal to a large extent, and acidification pretreatment has a relatively weak promotion effect on dissoluble components. Therefore, with the increase of solvent concentration, raw coal and acidified coal have no apparent effect. After acidification pretreatment, the value of the hydrogen-rich degree parameter (I1) of coal samples decreased significantly, which was 0.61 less than raw coal. With the increase of THF concentration, the I1 value of raw coal decreased first and then increased, while the I1 value of acidified coal increased first and then decreased, showing opposite trends. The aromatization degree parameter (I2) and oxygen enrichment degree parameter (I3) increase obviously, in which I2 value is twice that of raw coal, I3 value is 11.82, almost three times that of raw coal, and after THF extracts raw coal with different concentrations, the oxygen index I3 value increases first and then decreases, while acidified coal decreases. The fat structure parameter (I4) is obviously reduced, which is only 8% of the raw coal, and the I4 value of its raffinate is far lower than that of the raw coal raffinate. The relative content of heteroatom compounds in acidified coal extract is significantly reduced by 83.14%~89.64%, and the relative content of aliphatic hydrocarbons is significantly increased, which is 5~26 times of that in raw coal extract, mainly including straight-chain hydrocarbons such as eicosane, docosane and triacontane, among which C19—C23 accounts for 79.17% of the total components of the extract. Aromatic substances are not found in extracts and only in 100%THF extracts in raw coal, with little change in relative content. It is considered that acidification pretreatment greatly influences the fat structure and oxygen-containing compounds in coal but has a relatively small influence on the aromatic structure.
Mar. 01, 2022Vol. 42 Issue 3 896 (2022)
Jun WANG, Zhou-li WANG, and Jing-jing CHENG
The interaction between tartrazine and bovine serum albumin (BSA) was investigated by fluorescence spectrometry, synchronous fluorescence spectrometry, three-dimensional fluorescence spectrometry, ultraviolet spectrometry and molecular docking. The analysis of fluorescence spectrum of tartrazine-BSA showed that tartrazine could effectively quench the endogenous fluorescence of BSA, and the fluorescence quenching constant KSV decreased with the increase of temperature, so the quenching mechanism was static quenching on the basis of stern-volmer equation; According to the static quenching double logarithm formula, the binding constant (KA) was calculated to be 4.335×10⁷ L·mol-1 (293 K) and the number of binding point (n) was approximately equal to 1, which indicated that tartrazine had a strong binding ability with BSA and formed a binding site; The thermodynamic parameters obtained by van’t Hoff’s law (ΔH=-154.5 kJ·mol-1, ΔS=-387.8 J·mol-1·K-1, ΔGr) between tartrazine and BSA was calculated to be 3.310 nm based on the theory of Förster’s non-radiation energy transfer, which indicated that energy was likely to be transfered from BSA to tartrazine; With the increase of the concentration of tartrazine, the synchronous fluorescence intensity of Tyr and Trp residues decreased; The three-dimensional fluorescence spectra analysis showed that the intensities of peak 1 and peak 2 decreased significantly with the addition of tartrazine, and the emission wavelength of peak 2 changed, indicating that the peptide chain structure of BSA changed, and at the same time, the UV absorption peak of BSA increased gradually; The results of spectral analysis showed that the combination of tartrazine and BSA changed the conformation of BSA, thus changed the microenvironment around Trp and Tyr residues, resulting in the decrease of luminous efficiency; The results of molecular docking further illustrated that tartrazine was interacted with amino acid residues on subdomain Ⅲb of BSA and the amino acid residues around tartrazine mainly included: Phe506, Thr507, Ala527, Leu528, Met547, Gly571, Pro572, Leu574, Val575, Thr578; Tartrazine could interact with Thr507 and Thr578 residues by van der Waals force, with Thr507 by hydrogen bond and with other nonpolar amino acid residues by hydrophobic force. This research was helpful to understand the mechanism of interaction between tartrazine and BSA and reveal the distribution, metabolism and toxicological mechanism of tartrazine in vivo.
Mar. 01, 2022Vol. 42 Issue 3 904 (2022)
Jia-yi XU, Xue HUANG, Hua-ping LUO, Jin-xiu LIU, Yu-ting SUO, and Chang-xu WANG
Hyperspectral nondestructive testing technology is widely used in quantitative nondestructive testing of fruit. In this paper, the spatial characteristic spectra of jujube, grape and pear are taken as the research objectives, and the influencing factors and inversion methods of spatial characteristic spectra are explored, which provides a new idea for improving the accuracy of outdoor fruit nondestructive testing. The spectral library of three kinds of fruits was extracted, and the spatial characteristic spectra were calculated. The characteristic wavelengths were selected by Mahalanobis distance, concentration residual and competitive adaptive weight sampling algorithm. Model characteristic spectra of three kinds of fruits after pretreatment with quality parameters and positional parameters respectively.The modeling results are as follows: In the sugar model, the R of jujube, grape and pear were 0.853 3, 0.822 7 and 0.913 3 respectively; In the water model, the R were 0.741 3, 0.784 7 and 0.891 3 respectively; In the detection angle model, the R were 0.985 6, 0.992 7 and 0.974 7 respectively; In the azimuth angle model, the R were 0.941 8, 0.910 5 and 0.936 9 respectively; In the phase angle model, the R were 0.960 9, 0.957 0 and 0.956 3 respectively. In summary, the correlation of different fruit positional models was significantly higher than quality models. Therefore, the positional factor is the main reason affecting the characteristic spectrum. Therefore, the roujean model and waltall model are used to invert the characteristic spatial spectrum of different directions. The inversion results are as follows: roujean model is used when retrieving the spatial characteristic spectra of three kinds of fruits (in the order of jujube, grape and pear), R2 is 0.934 4, 0.928 1 and 0.830 6 respectively; R is 0.990 2, 0.983 9 and 0.969 1 respectively; RMSEP is 0.030 9, 0.048 7 and 0.062 7 respectively; the average model error is 7.27%, 11.02% and 8.61% respectively. The results showed that R2 was 0.943 3, 0.859 7, 0.839 0; R was 0.991 8, 0.971 8, 0.970 2; RMSEP was 0.036 6, 0.066 1, 0.068 7; the average model error was 6.19%, 15.40%, 7.84%. It can be seen that roujean model can well describe the characteristic spatial spectrum of jujube and grape, and also can better describe the characteristic spatial spectrum of pear; waltall model can well describe the characteristic spatial spectrum of jujube, and also can better describe the characteristic spatial spectrum of grape and pear. In conclusion, roujean model can be used to invert the characteristic spatial spectrum of grape and pear, and waltall model can be used to invert the characteristic spatial spectrum of jujube to improve the accuracy of outdoor fruit nondestructive testing.
Mar. 01, 2022Vol. 42 Issue 3 910 (2022)
Yan JIANG, He MENG, Yi-rong ZHAO, Xian-xu WANG, Sui WANG, En-yu XUE, and Shao-dong WANG
Forage is the material basis of animal husbandry production. The detection and evaluation of the nutritional value of forage raw materials and feed products are an important link in feed production. Facing the situation of low crude protein content in forage resources and relying on many imported feeds, soybean, as a high-quality, high protein legume forage, is an important resource for animal husbandry production and utilization. The feeding quality parameters of different forage soybean and different cutting periods can evaluate the feeding performance of forage soybean. However, the chemical method is mainly used for detection, which is cumbersome, long test cycle and is easy to cause operation error. Moreover, the rapid detection of main feeding quality indexes of forage soybean is still blank, which needs to be developed and utilized urgently. Because of the wide application of near-infrared spectroscopy in detection and feed analysis, the whole plant samples of different soybean varieties in different cutting periods were collected by near-infrared spectroscopy in the range of 950~1 650 nm. The content of crude protein (CP), neutral detergent fiber (NDF) and acid detergent fiber (ADF) was detected according to the national standard or industry standard chemical method. The 150 samples data were divided into calibration and verification set according to 3∶2. The prediction models of three main quality parameters CP, NDF and ADF content of forage soybean, were established by combining one or more of four different spectral pretreatment methods, including first-order derivative (NW1st), second-order derivative (NW2nd), standard normal variable transformation (SNV) and detrending (DE-trending), and partial least squares (PLS) regression algorithm. By comparing the coefficient of determination (R2) and root mean square error (RMSE) of calibration set and validation set in regression models, the results showed that the model established by NW1st+DE-trending+SNV+PLS had the best effect. The RC2 and RP2 of the calibration set and validation set in forage soybean CP content model were 0.96 and 0.95 respectively, the RC2 and RP2 of NDF content model were 0.90 and 0.89 respectively, and the RC2 and RP2 of ADF content model were 0.94 and 0.93 respectively. The accuracy and stability of the model were further confirmed by the test and analysis of the validation, and rapid analysis of near-infrared spectroscopy (NIRS) method for the qualitative detection of forage soybean was formed. With the increase of forage soybean quality parameter data, the quality detection model of forage soybean will continuously improve. This method expands the detection category and range of forage resource quality by near-infrared spectrometer and is accurate and efficient, which is conducive to the development and effective utilization of high-quality high protein forage resources.
Mar. 01, 2022Vol. 42 Issue 3 919 (2022)
Yu-zhe TANG, Mei HONG, Jia-yong HAO, Xu WANG, He-jing ZHANG, Wei-jian ZHANG, and Fei LI
Spectral index is an important means for real-time estimation of crop leaf chlorophyll. The comprehensive use of spectral technology for real-time and effective diagnosis of crop nutrients is conducive to accurate crop management, ensuring yield and reducing environmental pollution, improving fertilizer utilization, and providing a new way for quantitative estimation of crop biochemical components. However, the estimation results are not satisfactory due to the influence of environmental conditions and internal biochemical components. In order to further improve the anti-interference ability and sensitivity of spectral index in estimating chlorophyll content of crop leaves. In this study, field experiments with different nitrogen gradients were carried out in typical corn-growing areas of Inner Mongolia in 2020. The spectral reflectance and chlorophyll value of leaves were obtained at four key growth stages of corn. The relationship model between the spectral index and chlorophyll value of leaves was established based on area, and the spectral index was optimized and evaluated. It provides an important theoretical basis for the diagnosis of chlorophyll content in maize leaves and an accurate grasp of the nutritional status of crops in a larger area in the future. The results showed that the growth period significantly affected the relationship between area spectral index and leaf chlorophyll value. The published area-based spectral index had a poor estimation effect on leaf chlorophyll content at the seedling stage, but had the best estimation effect on the tasseling stage. In this paper, the area spectral index based on the optimization algorithm significantly improves the accuracy and stability of spectral index in Estimating Leaf Chlorophyll content. The optimized triangle vegetation index (OTVI), optimized chlorophyll absorption integral index (OCAI) and optimized bimodal area normalized difference index (ONDDA) based on the optimization algorithm have stronger performance than the published area spectral index at different growth stages, the coefficient of determination R2 is between 0.94 and 0.99. Compared with OTVI and OCAI, ONDDA is more stable in estimating the chlorophyll content of spring maize leaves at different growth stages. The coefficient of determination R2 of prediction model validation results is 0.94, and the validation error is the smallest, RMSE and RE% are 2.29% and 3.94%, respectively. The validation slope of the model estimated value and the measured value is 0.996, the closest to 1. In conclusion, ONDDA is a practical and suitable area spectral index for estimating leaf chlorophyll content at different growth stages.
Mar. 01, 2022Vol. 42 Issue 3 924 (2022)
Yu-ru KONG, Li-juan WANG, Hai-kuan FENG, Yi XU, Liang LIANG, Lu XU, Xiao-dong YANG, and Qing-qi ZHANG
Leaf area index (LAI) is an important parameter to evaluate crop condition and crop yield. In order to effectively utilize hyperspectral information and improve the estimation accuracy of LAI, the best band was selected, and the new two-band vegetation indexes were constructed. In this study, winter wheat was taken as the research object, the UAV hyperspectral data and ground LAI data were obtained at the booting stage. First, the successive projection algorithm (SPA), optimum index factor (OIF), and each band combination method (E) were used to screen the best band of UAV hyperspectral data, and then the selected best bands were constructed into the new two-band vegetation indexes (VI~~OIF, VI~~SPA, VI~~E). Then, the new two-band vegetation indexes and the conventional two-band vegetation indexes (VI~~F) constructed were compared and analyzed for correlation with LAI. Finally, support vector regression (SVR), partial least square (PLSR) and random forest for regression (RFR) were used to construct LAI estimation models. Meanwhile, comparing with the estimation accuracy of the conventional two-band vegetation indexes, the feasibility of LAI estimation was verified by the optimal regression model of the best new two-band vegetation indexes. The results were as follows: (1) The newly constructed two-band vegetation indexes VI~~OIF, VI~~SPA, VI~~E and VI~~F correlated with LAI were all at the significant level of 0.05, VI~~SPA and VI~~E correlated (r>0.65), among which RSI~~SPA and RSI~~E had the highest correlation coefficient with LAI (r>0.71) ; (2) The accuracy of LAI estimation of winter wheat based on SVR model, PLSR model and RFR model constructed by VI~~OIF, VI~~SPA, VI~~E and VI~~F were compared and analyzed. It was found that the VI~~SPA~~PLSR model had the highest accuracy and the best predictive ability, whose coefficient of determination (R2) and root mean square error (RMSE) were 0.75 and 0.90, respectively. The research results can provide technical support and theoretical reference for the band selection of UAV hyperspectral data and winter wheat LAI estimation.
Mar. 01, 2022Vol. 42 Issue 3 933 (2022)
Xiao-yan ZHANG, Xue-hui HOU, Meng WANG, Li-li WANG, and Feng LIU
For real-time monitor of wheat stripe rust and large-scale recognization of crop diseases using remote sensing technology, the relations of wheat spectral reflectivity and net photosynthetic rate with disease index were studied under stripe rust stress, and the variation of photosynthetic rate was estimated with spectral vegetation indexes. The stripe rust inoculation test was conducted in field plots during the 2018—2019 wheat growth period. The varieties of Jimai 22 and Luyuan 502 with larger sowing areas were used as test materials, and Jimai 15, sensitive to stripe rust, was used as control. The photosynthetic rate and spectral reflectivity of wheat flag leaves were determined, and the disease index was investigated every 7~10 days from heading stage to milk-ripe stage. It was found that the photosynthetic rate decreased significantly with the increase of disease degree. During the flowering stage, the photosynthetic rate of Jimai 22 was higher than that of Luyuan 502. During the grain filling stage, the reflectivity in the visible spectrum range was higher at the diseased part because of lower chlorophyll content leading to lower absorption but the higher reflex of light. However, in the range of reflection platforms, the spectral reflectivity of the diseased part was much lower than that of the healthy part. The indexes related to disease stress, crop growth and yields, such as photochemical reflectance index (PRI), plant senescence reflectance index (PSRI) and ratio vegetation index (RVI) were used to reflect the variation of the disease index. Compared with the healty part, the PRI and PSRI of the diseased part were high, and the change ratio of PSRI was higher; the RVI of diseased part was lower. At different growth stages of wheat, there were different correlations between photosynthetic rate and spectral reflectivity, and the vegetation index was also different. At the grain filling stage, the correlation between photosynthetic rate and spectral reflectivity of Luyuan 502 was positive in all spectrum ranges, and that of Jimai 15 was also positive in visible spectrum range, while that of Jimai 22 was negative. However, in the range of reflectance platform, that of Jimai 15 and Jimai 22 was opposite. The PSRI could be used to recognize disease degree and estimate the photosynthetic rate in the grain filling period of wheat. These results could provide theoretical bases for monitoring wheat growth status and disease occurrence at a large scale using remote sensing method and layed foundations for estimating wheat stripe rust occurrence and degrees using lossless monitoring spectral indicators.
Mar. 01, 2022Vol. 42 Issue 3 940 (2022)
Feng-hua YU, Dan ZHAO, Zhong-hui GUO, Zhong-yu JIN, Shuang GUO, Chun-ling CHEN, and Tong-yu XU
Conducting the unmanned aerial vehicle (UAV) hyperspectral unmixing of rice and obtaining the hyperspectral reflectance information of rice plants is of great significance for improving the accuracy of the inversion model of rice physical and chemical parameters. Most of the current research is based on the data of hyperspectral remote sensing images themselves for demixing. That is, unmixing of hyperspectral data is carried out by using algorithm model. In this study, the advantages of hyperspectral images and visible spectral images were complemented, and a hyperspectral unmixing method for UAV in rice field was based on the fusion of UAV high-definition images and hyperspectral images remote sensing images was proposed. This method solved the problem of the limitation of single data and enhanced the description ability of spectral data for ground objects. In order to better calculate the endmember abundance, the high-definition digital orthophotos of the target area were spatially aligned with the UAV hyperspectral remote sensing images, so that the pictures obtained by different sensors were aligned in geometric positions. The supervised classification method of the SVM classifier was used to classify the digital orthophoto of visible light, and the result of the classification was used to correspond to a pixel of the hyperspectrum to obtain the endmember abundance within a pixel. Suppose the endmembers of the water body in adjacent areas were the same, the linear unmixing model (LSMM) was used to unmix the mixed pixels in the adjacent area and finally the hyperspectral reflectance information of rice was obtained. The results showed that the spatial registration of the two images enriches the data source information, which was beneficial to the endmember abundance calculation of the pixels. Among them, the unmixing effect of rice endmember abundance above 70% was the best, the unmixing effect of abundance above 50% was general, and the unmixing effect was poor when the abundance was below 30%. Use the supervised classification method to classify the ground objects with an accuracy of 99.5%, and the classification accuracy of the object-oriented method was 98.2%, the supervised classification method was better than the object-oriented classification method. The final decomposition reflectance of the mixed pixel was higher than that of the original mixed pixel, which reduced the influence of the mixed part of the water body on the spectral data, and made the spectral reflectance of the rice after decomposition more accurate. This research could provide a theoretical basis for the inversion of the UAV imaging hyperspectral remote sensing of rice physical and chemical parameters.
Mar. 01, 2022Vol. 42 Issue 3 947 (2022)
Li-hong HU, Jin-tong ZHANG, Li-yun WANG, Gang ZHOU, Jiang-yong WANG, and Cong-kang XU
Pulsed-RF-glow discharge optical emission spectroscopy (GDOES) is a kind of atomic spectroscopy technology based on the principle of glow discharge, which is widely used to characterize the depth distribution of components in thin-film materials and functional multilayer structures. This technique has the advantages of low vacuum requirement, high sensitivity, and fast sputtering rate. Meanwhile, the instantaneous high-power mode adopted by the pulsed RF power supply makes the periodical bombardment of the sample surface by argon ions, which avoids the melting or carbonization caused by heat accumulation. Therefore, the pulsed-RF-GDOES can be used to analyse the thermal sensitive materials, soft or brittle materials, etc., extending the application range of glow discharge emission spectrum from conductive materials to semiconductor and insulator ones. It is an ideal technique for depth profiling of organic films. As a kind of multilayer composite material, aluminum plastic film is an important packaging material with temperature, weather, water, and acid-base resistance. It has been widely used in packaging food, electronics, and national defense cutting-edge products. In this paper, the depth profiles of high barrier aluminum-plastic films are measured using GDOES. The depth resolution, sputtering rate and signal-to-noise ratio of the measured GDOES depth profiles are quantitatively analyzed under different working parameters to obtain the optimized working parameters. The depth resolution, sputtering rate and signal-to-noise ratio of the GDOES depth profile are calculated quantitatively, with the aluminum signal having relatively high intensity as a calibration peak. The experimental results show that the thermal effect could be significantly reduced by applying the pulsed-radio-frequency power and the mixture gas of Ar and O2, thus expanding the adjustment range of the working parameters. The sputtering rate increases with increasing the sputtering power and gas pressure, the sputtering rate increases; The relationship between depth resolution and power values is a nonmonotonic function with some inflection points. When the sputtering power is 40 W, the depth resolution is optimized; When the sputtering pressure is higher than 950 Pa, the depth resolution is unchanged; With increasing the sputtering power, signal-to-noise ratio increases; with increasing the gas pressure, signal-to-noise ratio decreases. The depth resolution and signal-to-noise ratio are much better by using the mixture gas of Ar and O2 (4 Vol%) than that using the pure Ar gas. The optimized working parameters for the GDOES depth profiling of aluminum plastic film are mixture gas of Ar and O2, working pressure of 950 Pa, power of 40 W, pulsed frequency of 3 000 Hz, the duty cycle of 0.187 5.
Mar. 01, 2022Vol. 42 Issue 3 954 (2022)
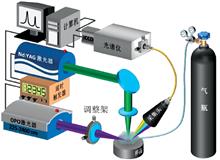
Jin-chang GUO, Yu SHI, Yu-fen GU, and Gang ZHANG
Laser gas nitriding technology can quickly generate a nitride layer on the surface of titanium alloy, improve the surface hardness and wear resistance of titanium alloy, and promote the application of titanium alloy. Fiber laser was used to nitride of Ti-6Al-4V alloy, the electrical conductivity of the spectral emission region was measured using the probe method to define whether a plasma was formed in the spectral emission region during the nitriding process. The emission spectra of nitriding process were collected using a spectrograph. The spectral emission region was photographed using a high-speed camera to study the effect of process parameters on spectral characteristcs, the temperature of spectral emission region the quantity of plasma. Experiments show that the spectral emission region can conduct electricity during the process of fiber laser gas nitride of Ti-6Al-4V alloy, which indicates that the metal vapor plasma was formed in the spectral emission region. This was completely different from the nitrogen plasma formed in the process of CO2 laser gas nitriding of titanium alloy. The number of metal vapor plasma was significantly affected by the process parameters during the process of fiber laser nitriding of Ti-6Al-4V titanium alloy. The metal vapor plasma can be produced in the spectral emission region when the laser power is higher, the scanning speed is lower, the defocusing is low, and the nitrogen content is high. The emission spectrum of the nitriding process is composed of continuous spectrum and liner spectrum. The continuous spectrum is mainly generated by thermal radiation, and the intensity of the continuous spectrum can represent the temperature of the spectrum emission region. The linear spectrum is mainly generated by the extranuclear electron transition of the plasma region, and the intensity of the linear spectrum can represent the quantity of the plasma. In the nitriding process, with the increase of laser power or the decrease of scanning speed, the continuous spectrum and linear spectrum were enhanced, indicating that the temperature of the spectral emission region increases and the number of plasma increases. As the defocus increases, the continuous spectrum and linear spectrum show a complex trend of decreasing first, then increasing and decreasing at last, which indicates that the temperature of the spectral emission region decreases first, then increase and decrease at last, and the number of plasma decreasing first, the increasing and decrease at last. Added a small amount of argon gas, nitriding process can be significantly influenced, the continuous spectra and linear spectra weakened dramatically, with the further increase of argon content, the linear spectrum and continuous spectrum continue to weaken, which indicated that the addition of a small amount of argon to nitrogen reduces the temperature of the spectral emission region and the number of plasma. With the further increase of the amount of argon, the temperature of the spectral emission continues to decrease, and the number of plasma continues to decrease.
Mar. 01, 2022Vol. 42 Issue 3 961 (2022)
Peng SONG, Yuan-min CAI, Xiao-jun GENG, Hua GUO, Han-wu JI, and Guo-qing ZHANG
In the non-line-of-sight wireless ultraviolet communication, particles in the atmosphere scatter ultraviolet light to help transmit information, which offers a broad prospect for applications in near-range covert communication. Haze particles, belonging to the aerosol category, are composed of dust, sulfide, organic hydrocarbon, and other particles in the air. Physical parameters of haze particles, such as size, concentration, and shape, greatly affect the transmission characteristics of wireless ultraviolet light scattering communications. In this work, we first established an ultraviolet multi-scattering model based on the Monte Carlo method. This model considers the effects of two physical quantities of haze particles-radius and concentration. Using this model, we simulated many photons passing through the multi-scattering transmission channel under various haze conditions. The relations of the path loss to particle radius and concentration level are evaluated and analyzed. The results show that: (1) Under the condition of wireless ultraviolet light short-range communication, higher haze concentration results in lower path loss and better system performance; (2) When the communication distance is longer than 500 meters, as the particle concentration continually increases, the system path loss generally decreases first and then increases; (3) With a fixed particle concentration, enlarging the particle radius causes the system path loss to drop initially, but as concentration continues to increase, the path loss rises again. In addition, the particle radius which produces the minimum path loss reduces monotonically as the transmission distance increases. Secondly, we incorporated the particle size distribution of the atmosphere into the model by segmenting the distribution to obtain different particle sizes and corresponding concentrations. Assuming that particles of different sizes and concentrations sequentially scatter photons, the model evaluates the probability of photons arriving at the receiver by passing them through each channel with a single particle size. Then, the model calculates the total probability of photons received and the path loss of the system when particles of all sizes are present. This way, our model creates a realistic multi-scattering transmission environment similar to the actual atmospheric channel where haze particles of all sizes exist simultaneously. Finally, we built an experimental platform to measure the system path loss to communication distance and transmission and receiving elevation angles under three different weather conditions: fine, severe haze, and extremely severe haze. Comparing the measured results of path loss to those from the simulation model, we found that the experimental and simulation results shared the same trend, the communication quality in haze weather is always better than good weather, and larger transmission and reception elevation angles always cause a higher path loss.
Mar. 01, 2022Vol. 42 Issue 3 970 (2022)
Xin YANG, Zhi-hang WU, Yin YE, Xiao-fang CHEN, Zi-ran YUAN, and Jing WANG
The agricultural watershed of the Dianbu River is one of the main water sources of Chaohu Lake. It is very important to understand the aquatic ecosystem of Chaohu Lake to study the composition and source of dissolved organic matter (DOM) in this watershed. In combination with the fluorescence excitation-emission matrix spectroscopy of the watershed, the study made some relative processing with the parallel factor analysis (PARAFAC) method, including the Raman and Rayleigh scattering removing, component extraction and so on for the measured fluorescence spectrum matrix. So we realized to analyze the DOM of the agricultural watershed of Dianbu River, including the excitation-emission matrix fluorescence spectrum characteristics analysis, the fluorescence component ratio analysis and the correlation analysis between the fluorescence characteristics and water quality parameters and explored the DOM components and sources of the watershed. The results showed that the DOM of the agricultural watershed in the Dianbu River contained two effective fluorescence components, namely, one kind of protein (tryptophan-like component) and one kind of humus (fulcrum acid-like component). The proportion of fluorescence components indicated that the tryptophan-like component was the main component of the DOM in the watershed. The fluorescence index FI, the autogenous indicator BIX and humification indicator HIX indicated that the DOM has strong autogenous properties and weak humification characteristics. What’s more, its DOM of endogenous mainly comes from the metabolic activity of plants and other water microbial within the lotus pond, DOM of exogenous input from sewage and aquaculture feed. The endogenous of DOM made the main contribution to the organic matter source in the water; the DOC is positively correlated with the tryptophan-like component C1 of DOM, and the protein-like fluorescence component can be used for dynamic DOC tracking of this watershed. The pH value was positively correlated with the fulcruid-like component C2, so the pH value and the fulcruid-like component increased simultaneously, indicating that the water alkalization in this basin was accompanied by the increase of humus like substances in dissolved organic matter. Dissolved oxygen (DO) was negatively correlated with tryptophan-like component C1, indicating that the tryptophan-like component was affected by the content of dissolved oxygen dissolved oxygen content in water. This study traced the fluorescence characteristics of DOM and its component source response mechanism in the small agricultural watershed of Dianbu River, which could better understand its function in the ecosystem and its environmental geochemical cycle process, thus providing a certain scientific basis for the comprehensive environmental management of the watershed.
Mar. 01, 2022Vol. 42 Issue 3 978 (2022)
Rui ZHAO, Hai-yan SONG, Yao ZHAO, Qin SU, Wei LI, Yi-shu SUN, and Ying-min CHEN
As an important component in soil, soil organic matter (SOM) is a critical nutrition index in the process of crop growth. Rapid and accurate detection of SOM content is of great significance for the fertilization management. In recent years, NIR has been widely used in the rapid detection of SOM. However, soil moisture is one of the important factors that affect the prediction results of SOM. In this study, 140 soil samples were collected in Shanxi Province, and the spectral information with different water content (0%, 5%, 10%, 15%, 17%) was collected by ASD spectrometer (350~2 500 nm). In order to improve the accuracy of the SOM prediction model, a characteristic wavelength integration algorithm (taking the integral absorbance value at characteristic wavelength as the independent variable) was proposed. The results show that: (1) the statistical parameters of the SOM prediction model established by this algorithm are better than the traditional characteristic wavelength modeling method; (2) the moisture correction model established by this algorithm can eliminate the influence of moisture, and the corrected spectra of wet soil samples are closer to the corresponding dry soil samples; (3) the prediction accuracy of wet soil samples is improved. The RP increased by about 0.09 and RMSEP decreased by about 1.72. The results show that the method can effectively reduce the influence of soil moisture on the spectral characteristics of SOM, improve the prediction accuracy of SOM with different water content, and provide theoretical support for the subsequent instrument development.
Mar. 01, 2022Vol. 42 Issue 3 984 (2022)
Xiang WANG, Gao-fang YIN, Nan-jing ZHAO, Ting-ting GAN, Rui-fang YANG, Zhi-song QIN, Ming DONG, Min CHEN, Zhi-chao DING, Pei-long QI, Lu WANG, Ming-jun MA, De-shuo MENG, and Jian-guo LIU
As an important -starting point in the marine ecosystem, phytoplankton primary production is the foundation of the marine food web and an important indicator for seawater quality. In this paper, in order to accurately measure, monitor, and predict spatiotemporal variations of phytoplankton primary productivity, and its kinetic response to external environmental conditions, a measurement technology based on chlorophyll fluorescence kinetics was studied, and a fast measuring instrument with a response time of 1.6 minutes and a precision of 4.86% was developed. The correlation coefficient between the measured phytoplankton primary productivity by the developed instrument and the measured photosynthetic oxygen evolution rate by the liquid-phase oxygen electrode was 0.991. The instrument was equipped on the China Marine Surveillance 101 experimental ship for the underway measurement and the vertical profiles measurement of phytoplankton primary productivity in the Yellow Sea and the Bohai Sea. Underway measurement results showed that the phytoplankton primary productivity in Bohai bay is 1.1~1.4 times higher than outside the bay, and vertical profiles measurement results showed a depth-dependent response of phytoplankton primary productivity on each site in the Yellow sea area. Compared with traditional methods, the developed instrument in this paper has the advantages of rapidness, stability, and no need for sample cultivation and can provide an advanced technical method for marine ecological environment assessment.
Mar. 01, 2022Vol. 42 Issue 3 990 (2022)
Jing-tao YAN, Li-jun MIAO, Jian-feng MAO, Jin SHI, Teng-chao HUANG, Shuang-liang CHE, and Xiao-wu SHU
Laser is a kind of common light source in modern optics. It is of great significance to analyze its spectrum width characteristics for research. Because the full width at half maximum (FWHM) of high-performance narrow-linewidth lasers is usually within tens of MHz, it is very difficult for them to directly meet the application requirements in the fields that need broadband source and give full play to their advantages in terms of cost and performance, which also limits the development of laser to a certain extent. If the laser is directly modulated to achieve linewidth broadening, it will cause serious frequency drift and destroy its important frequency stability. In order to obtain the wide spectrum without degrading wavelength stability, an external phase modulation method using Gaussian white noise (GWN) as a driving signal is reported. Based on the relationship between laser phase noise and spectral characteristics, the broadening effect of phase noise on the spectrum is clarified through theoretical calculation. The spectrum evolution process with different parameters of white noise is analyzed based on OptiSystem optical simulation tool and numerical simulation. The noise source with high power and wide bandwidth is needed for broadening and carrier suppression of high efficiency. The external phase modulation system uses a 10 GHz noise source. The signal is increased from -17 to 28 dBm by two preamplifiers and a high saturation output power amplifier to drive a lithium niobate (LiNbO3) electro-optic phase modulator with the half-wave voltage of 3.7 V. The low-pass filter and variable attenuator are added to the amplification link to adjust the signal parameters. The research object is a distributed feedback (DFB) semiconductor laser with an initial linewidth of 20 kHz. It can be seen by observing and comparing the laser spectra with and without modulation using an optical spectrum analyzer (OSA) that the experimental results are consistent with the theory and simulation. The maximum broadened component is up to 65 GHz and the carrier is also obviously suppressed. In addition, the laser frequency drift is evaluated based on the scanning Fabry-Pérot confocal cavity. It is proved that the external modulation does not affect the wavelength stability of the laser, so the phase modulation scheme of GWN can achieve superior spectrum broadening. Because the modulated spectrum has no sideband or minor peak and the broadened component is several times the modulation bandwidth, GWN has obvious advantages compared with others, such as sinusoidal signal and pseudo-random binary sequence (PRBS) signal. This promising method does not depend on the intrinsic linewidth of laser, and the work can be used as a reference for the research of phase modulation and spectrum broadening.
Mar. 01, 2022Vol. 42 Issue 3 665 (2022)
Wu-di PENG, Jia-lian NING, Zhi-li CHEN, Jin TANG, Li-xi LIU, and Lin CHEN
CS2 plays an important role in today’s chemical industry and other fields, while CS2 fire pollution accidents are extremely harmful. It is necessary to study the fire pollution characteristics of CS2 by studying the spectral radiation of CS2 combustion flame. Has set up a platform CS2 combustion flame spectrum test, this paper adopts from a complete set of VSR instrument calibration blackbody radiation sources, through infrared spectrum radiometer VSR test 5 cm, to 10 cm, 20 cm three scales CS2 combustion flame spectrum, and through the thermocouple tested the whole combustion flame temperature under different combustion period, and installed over the flame to monitor the quality of flame in the combustion product concentration of flue gas analyzer. The flame temperature during the whole combustion period of CS2, the flame spectrum and the composition information of combustion products at different combustion times and scales were measured. The test results show that the CS2 flame mainly contains high temperature gases such as SO2, CO2, CO and H2O, and the concentration of characteristic pollution product SO2 is obtained. Due to the limited measurement resolution of existing spectrometers and the limited flame scale measured in laboratory experiments, to achieve online fire monitoring, it is necessary to establish a flame spectral radiation model to retrieve the pollutant concentration-related information in CS2 fire. Based on the HITRAN database is near 2.7 μm for high temperature and water vapor emission peak, 4.2 μm for CO2 emission peak, around 4.7 μm is CO faint emission peak, near 7.4 μm for SO2 emission peak. We have gained CS2, SO2, CO2, CO and H2O gas in the absorption coefficient of the same temperature and calculate mixed gas transmittance and the emissivity, Combined with the gas radiation transfer equation and gas absorption coefficient equation, the flame spectral radiation model of CS2 combustion is established. The spectral radiation model was used to invert the characteristic pollutant SO2 under different combustion times and compared with the experimental data. The results show that this model has high accuracy and can to invert the concentration of combustion products quantitatively. The accuracy of inversion of SO2 concentration at the time of 20, 40, 60 and 80 s is 89.5%, 82.5%, 85.6% and 86.5%, respectively. It lays a foundation for remote sensing monitoring and inversion of the concentration of combustion products in CS2 large-scale fire.
Mar. 01, 2022Vol. 42 Issue 3 672 (2022)
Tong JI, Bo WANG, Jun-ying YANG, Qiang LI, Guo-xing HE, Dong-rong PAN, and Xiao-ni LIU
The desert grassland in Yanchi County of Ningxia belongs to the mid-temperate arid climate. Due to over-utilization, different degrees of degradation has occurred, and the proportion of degradation indicator species has increased, resulting in large differences in the composition of different desert grassland communities. How to distinguish between different desert grassland plants and determine the Dynamic degradation monitoring of indicator species is the key to understanding the degree of desert grassland degradation. At present, random forest (RF), support vector machine (SVM) and K-neighbor (KNN) classification models are widely used in the remote sensing classification of forest plants and crops. The classification and recognition effect is good, but few studies on the classification and recognition of grassland, especially the desert grassland. Therefore, in July, the ASD ground feature spectrometer was used in Ningxia Yanchi Erbukeng, Fengjigou, Gaoshawo and Mahuangshan. In the desert grassland, a total of 442 spectral data of 32 species of plants were collected for spectral feature analysis, and 7 vegetation indexes were selected: normalized vegetation index 705 (NDVI705), green channel vegetation index (GNDVI), photochemical vegetation index (PRI), soil Adjusted vegetation index (OSAVI), visual pressure resistance index (VARI), vegetation attenuation index (PSRI) and normalized water index (NDWI) as random forest model (RF), support vector machine (SVM) model, K-neighbor (KNN) the original variables of the model, classify and identify 32 species of desert grassland plants, and screen the best model by comparing the accuracy of the classification models. The research results show that: (1) The spectral reflectance of different plants is in line with the characteristics of green plants but there are obvious differences between the different bands of the original spectrum of each plant, and the difference in the water absorption bands of the original spectrum of plants is obvious, and there is a red edge blue shift phenomenon; (2) RF The classification accuracy of the three classification models, SVM and KNN for 32 species of plants reached 0.98, 0.94 and 0.98, respectively, and the recognition effect was good. However, the three classification models all made mistakes in the classification of Artemisia spp. Judgment; (3) NDWI and PRI are the key indicators to distinguish desert grassland plants in the importance of random forest model indicators, indicating that desert plant canopy water and carotenoid content are important factors affecting the spectral classification of desert grassland plants. The experiment uses a random forest model (RF), support vector machine (SVM) and K-neighbor (KNN) classification methods to establish a classification model for main plants, laying the foundation for remote sensing monitoring of desert grasslands.
Mar. 01, 2022Vol. 42 Issue 3 678 (2022)
Jing-ming SU, Min-jie ZHAO, Hai-jin ZHOU, Dong-shang YANG, Yan HONG, and Fu-qi SI
As a kind of ultraviolet-visible imaging spectrometer, the environmental trace gases monitoring instrument (EMI) is mainly used to realize the global daily atmospheric trace gas concentration inversion with high spatial resolution. During the on-orbit operation, the performance of EMI tends to decay with time due to the influence of the spatial environment. In order to effectively monitor its decay condition, the on-orbit temperature is analyzed by using the 0-level data of the load to the ground orbit to realize the long-term on orbit temperature monitoring. By calculating the mean value and standard deviation of the dark background image noise in the satellite points of each orbit, CCD (Charge-Couple Device Detectors) dark background noise variation trend monitoring with time was realized to evaluate further the damage of CCD pixel points caused by space particles. The on-orbit pixel performance and radiation flux of the CCD detectors were evaluated by the response of the internal white light source on the CCD with multiple on-orbit measurements. Using the 0-level solar Spectral data measured by EMI in orbit, combined with the second-order Gaussian Function model obtained from the laboratory test before launch, the Instrument Spectral Response Function (ISRF) is an inversion with the least square method. Real-time on-orbit updating of the instrument’s spectral response function is realized. The on-orbit relative decay factor of the Quartz Volume Diffuser (QVD) and the Reference Solar Diffuser (RSD) were calculated using the Solar spectrum measured many times by the QVD and RSD. The on-orbit decay correction of diffuse reflector plate is realized. The results show that the temperature is stable after the EMI load has been in orbit for two years, the mean annual increase rate of dark background in each channel is about 0.25%~1%, and the fluctuation range of standard deviation of dark background is within 1.5%. The on-orbit ISRF function varies by about 2.3%. The light path response of the internal white light source is less than 1%, and the annual decay rate of QVD is less than 1.75% for the UV2 channel, less than 1% for the VIS1 channel, and less than 0.5% for the VIS2 channel, respectively.
Mar. 01, 2022Vol. 42 Issue 3 686 (2022)
Ying-ying FU, Ping ZHANG, Da-wei ZHENG, Tai-feng LIN, Hui-qin WANG, Xi-hao WU, and Jia-chen SONG
Surface Enhanced Raman Spectroscopy (SERS) is one of the most sensitive analytical techniques currently available and has been widely used in life science, material science, environmental science and analytical chemistry. The performance of SERS base determines the application scope of SERS, are the key to promoting the development of SERS technology, the preparation of highly active SERS substrate has become a hot spot in the SERS research field. In order to obtain the best Raman signal, SERS active substrate with special characteristics is great demanded. Flexible SERS substrate has unique advantages such as good flexibility, 3D scaffold structure and controllable pore size on the surface, and it is a good application value in detecting compounds and bacteria. The surface of Nylon flexible film has the characteristics of the hierarchical and porous staggered structure. Au-Nylon flexible film substrate with high SERS activity was prepared by combining the solid phase extraction unit with the special material Nylon by changing the amount of gold sol and binding times of gold nanoparticles and film. The result showed that gold nanoparticles attach well to Nylon fibers, and the plasmon resonance absorption peak of the Au-Nylon flexible film substrate has blue moved, which was due to the intrinsic surface plasmon resonance coupling of gold and Nylon, forming Au nanoparticles and Nylon fiber complex. After the first treatment, Nylon fiber and its attached Au nanoparticles formed a new active retention layer, which contributes to making the gold particles better attached to the film’s surface during the second treatment, forming SERS “hot spot” effect and improving its SERS performance. The SERS performance of the Au-Nylon flexible film substrate was analyzed by using Crystal Violet (CV) as the SERS probe molecule. It was found that the SERS strength of the CV probe molecules on the Au-Nylon flexible film substrate varied as the number of filtration times and binding times of gold nanoparticles and film. For Au-Nylon flexible film substrate with an area of 1 cm2, When a single gold sol amount of 1 mL is combined with the film two times, and the total binding amount is 2 mL, the SERS signal of the CV probe molecules and the activity of SERS samples was the highest. The Au-Nylon flexible film substrate was used for SERS detection of the CV solution with a concentration of 2.5×10⁻⁵, 1×10⁻⁵, 1×10⁻⁶, 5×10⁻⁷ and 1×10⁻⁷ mol·L-1. Respectively, The Au-Nylon flexible film substrate enhancement factor reached 1.0×10⁴, and the detection limit was 1.0×10⁻⁶ mol·L-1. In addition, The Au-Nylon flexible film substrate had good uniformity with a relative average deviation of 11.8%. The Au-Nylon film substrate still had good SERS performance in microbial detection, and the SERS enhanced effect on Staphylococcus aureus was better than that of gold sol. It could be seen that the Au-Nylon flexible film substrate has good homogeneity and good SERS activity. The method has the advantages of simple and easy batch preparation, and it has good practical application value in both compound detection and microbial detection.
Mar. 01, 2022Vol. 42 Issue 3 692 (2022)
Zhong-bao LIU, and Jie WANG
With the development of observation apparatus, the spectra number rises constantly. How to further improve the classification performance deserves to be research. Because of this, the stellar spectra are taken as the research object, the high-performance hybrid deep learning network is proposed based on integrating the advantages of the BERT model in feature extraction and the CNN model in automatic classification, to verify the effectiveness of improving the spectra classification performance. Firstly, the stellar spectra are input into the the BERT model; And then the part in BERT model named Transformers are used to extract the features and based on which, the feature vectors are formed; Finally, the above feature vectors are input into the CNN model, and the stellar spectra classification results can be obtained with the help of softmax classifier. Python3.7 writes the models used in the experiment and the deep learning framework named TensorFlow is introduced. The K-, F-, G-type stellar spectra in SDSS DR10 are used for the experimental dataset, normalized by the min-max normalization method. The effectiveness of the BERT-CNN model is verified by comparing with the support vector machine models (SVM) and CNN. The performances of the above models are related to the parameters, and therefore, the ten cross-validation and the grid search method are used to obtain the optimal experimental parameters. There are two parts to the experiment. One is to evaluate the classification performances of BERT-CNN with precision P, recall R and F1 values. The proportion from 30% to 70% of the experimental dataset is respectively used for the training dataset, and the remainder is used for the test dataset. P, R and F1 values rise with the training size on the K-, F-, G-type stellar datasets. In the case of the same training size, the values of P, R and F1 arrive at the highest, followed by the performance on the G-type stellar dataset, the classification results on the F-type stellar dataset are much poorer. The other experiment is to evaluate the classification performances of SVM, CNN and BERT-CNN with accuracy. The classification performances of BERT-CNN on the K-, F-, G-type stellar datasets are all best, followed by CNN. The classification accuracies of SVM are much lower than the other two models. It indicates that the BERT-CNN model contributes to improving the spectra classification performance.
Mar. 01, 2022Vol. 42 Issue 3 699 (2022)
Hong-yan SONG, Hang ZHAO, Xia YAN, Xiao-feng SHI, and Jun MA
Polychlorinated biphenyls (PCBs) in marine pollution monitoring is widely attention. In this paper, surface-enhanced Raman spectroscopy (SERS) and density functional theory (DFT) methods were used to investigate the Raman spectra differences of four representatives PCBs (PCB15, PCB28, PCB47 and PCB77) and their adsorption properties on gold nanoparticles. The influence of different adsorption characteristics on SERS quantitative detection was also analyzed. Firstly, the Raman spectra and vibration mode contributions of PCBs were calculated and compared with the measured results to assign the Raman peaks. Then, the PCBs-Au adsorption system was constructed and its binding energy and molecular spatial structure changes before and after adsorption were calculated to predict the adsorption characteristics of molecules on the gold substrate. Finally, the gold colloid was used as the SERS enhanced substrate for SERS detection to reflect the influence of adsorption characteristics on quantitative analysis. The results showed that the calculated results agreed with the measured spectra. The common characteristic peaks of PCBs included bridge bond stretching vibration peak (around 1 290 cm-1), ring breathing vibration peak (around 1 000 cm-1), and ring stretching vibration peak (around 1590 cm-1). The difference of substituted position of Cl atom has a significant effect on Raman vibration, which eventually complicate the vibration peaks of the C—Cl bond and C—H bond. The adsorption capacity from high to low was PCB15 (-6.46 kcal·mol-1), PCB28 (-3.01 kcal·mol-1), PCB77 (-1.95 kcal·mol-1) and PCB47 (-0.31 kcal·mol-1), and the number of substituted chlorine and the ortho-substitution of Cl atom decrease the binding energy and the adsorption form of the molecule on the gold substrate. The increase of the number of ortho-substitutions of the bridge bond leads to the increase of steric hindrance, which hinders the adsorption of molecules. The adsorption characteristics affected the SERS quantification. There was a good linear relationship between the SERS peak intensity and concentration. Molecules with strong adsorption ability in a water environment are more likely to reach the saturation state first, and have the lowest detection concentration. The above conclusion laid a theoretical foundation for SERS technology to detect and identify PCBs in the marine environments and for quantitative analysis.
Mar. 01, 2022Vol. 42 Issue 3 704 (2022)
Nai-yun FAN, Gui-shan LIU, Jing-jing ZHANG, Rui-rui YUAN, You-rui SUN, and Yue LI
Thiobarbituric acid reactive substances (TBARS) is the main chemical information that can effectively characterize the lipid oxidation degree in meat. A combination of hyperspectral technology with 2DCOS was investigated to develop the quantitative analysis model for assessing TBARS contents. The hyperspectral images of Tan mutton were collected in the spectral range of 400~1 000 nm. The regions of interest were manually set on the hyperspectral image of the, sample and the raw spectra data were extracted by ENVI 4.8 software. Partial least squares regression (PLSR) was established to correlate the spectra data with measured TBARS values. The kennard-Stone (KS) method was used to divide the whole data set to validate the calibration model. Savitzky-Golay (SG), de-trending and SG+de-trending were used to correct raw data for eliminating the interference information. The TBARS contents were regarded as a perturbation. Two-dimensional correlation spectra and their slice spectra were analyzed to determine the key variables associated with perturbation. Variable combination population analysis (VCPA), competitive adaptive reweighted sampling (CARS) and successive projections algorithm (SPA) was used to select variables from full spectra and 2DCOS analysis. PLSR algorithm was used to establish the hyperspectral quantitative analysis model of TBARS contents based on key variables. The result showed the PLSR model established by de-trending pretreatment presented good performance (RC2=0.874, RMSEC=0.106 mg·kg-1, RP2=0.853, RMSEP=0.139 mg·kg-1). The auto-correlation peaks related to TBARS values were observed at 579, 699, 756 and 867 nm. The wavelengths in the spectra range of 579~867 nm were the research area for detecting of TBARS contents. VCPA, CARS and SPA extracted 7, 16, 20, 8, 24 and 14 key variables from full spectra and 2DCOS analysis, respectively. Based on the accuracy and reliability of the obtained model, the model developed based on effective wavelengths selected by CARS from 2DCOS analysis could assess TBARS contents in an accurate and non-destructive manner. The quantitative model was: Y(TBARS)=-0.15+2.99λ588-7.01λ593+7.45λ598-6.14λ603+7.06λ612-8.25λ622+2.64λ631-4.18λ636+13.91λ646-11.3λ655+12.64λ675-8.51λ684-7.81λ689+1.08λ703-2.54λ713+5.47λ727+6.62λ742+5.69λ751+2.48λ775-1.93λ780-6.95λ790+7.09λ799-3.56λ809+1.82λ819 (RC2=0.857, RMSEC=0.113 mg·kg-1). The research demonstrates that 2DCOS provide new insights into variable selection in spectra analysis. The combination of hyperspectral technology and 2DCOS is feasible for non-destructive monitoring of TBARS contents in mutton.
Mar. 01, 2022Vol. 42 Issue 3 713 (2022)
Wavelength Selection Algorithm Based on Minimum Correlation Coefficient for Multivariate Calibration
Jie-hong CHENG, Zheng-guang CHEN, and Shu-juan YI
In the quantitative analysis of near-infrared spectroscopy, as the instrument’s precision is getting higher and higher. The collected spectral data usually has a very high dimension. Therefore, wavelength selection is essential for eliminating noise and redundant variables, simplifying the model, and improving the model’s predictive performance. There are many methods for selecting characteristic wavelengths in NIR spectroscopy, but the problem of multicollinearity among variables is still a key issue that leads to poor model effects. Collinearity between variables can be analyzed by correlation coefficient. When the correlation coefficient is higher than 0.8, it indicates that there is multicollinearity. Therefore, this paper takes the correlation coefficient between variables as the selection criteria and proposes a wavelength selection method that minimizes the collinearity between the selected variables, called the Minimal Correlation Coefficient (MCC) method. This method is based on the correlation coefficient matrix of the spectrum data. It selects the wavelength with the smaller average and standard deviation of the correlation coefficients of other wavelengths as the candidate modeling wavelength set so that the linear correlation between the wavelengths in the set is minimized, and the model has eliminated Collinearity between variables. Then use the standard regression coefficient to select the wavelength that has a greater impact on the dependent variable to obtain the prediction model. In order to verify the effectiveness of the proposed algorithm the method is tested. Using two sets of opening NIRS data sets (diesel dataset and soil dataset), wavelength selection was carried out by MCC algorithm, and compared with several other commonly used wavelength selection methods, including successive projections algorithm (SPA), competitive adaptive reweighted sampling (CARS), random frog (RF) and iteratively retains informative variables (IRIV). The experimental results show that the MCC algorithm has good prediction performance, the model prediction accuracy based on MCC is better than that of SPA, CARS, RF, and is roughly the same as that of IRIV. Therefore, the minimum correlation coefficient method is an effective wavelength selection algorithm, which can reduce the dimension efficiently and improve the prediction precision of the model.
Mar. 01, 2022Vol. 42 Issue 3 719 (2022)
Ming-fang CUI, Jian-hua ZHU, Rui HU, and Shang-qian CHEN
Dongmendu Kiln was one of the earliest kilns among the ancient Xuanzhou kilns, which belonged to the celadon of Yue Kiln series. The porcelains of Dongmendu Kiln, with its distinctive local characteristics, had a special style. The research on the structural properties in the micro length scale and process features about the porcelains was still superficial for lack of evidence. So far, its process features were only evaluated from the external morphology of implements. Wavelength dispersive X-ray fluorescence (WDXRF) combined with optical microscopic analysis was applied to determine the elemental abundance patterns of the porcelain bodies and glazes excavated from Dongmendu Kiln. Meanwhile, XRD, FT-IR and TG-DSC analysis were used to test the porcelain body’s phases, major ingredients and fire characteristics. Based on the above comprehensive characterizations, the process feathers and attributes were concluded reasonably. Evidence revealed that porcelains produced in Dongmendu Kiln were the typical south porcelains because of high silicon and low aluminum contents. The porcelain body was made up of china stone, which was mixed with some ember clays in the local. The porcelain glazes exhibited the typical properties of Yue Kiln due to the high calcium contents. The presence of big particles in porcelain bodies and glazes indicated that the processing of raw materials was not elaborate. The phases of the porcelain body revealed that the sintering temperature was not high than 1200℃, or the holding time at high temperature was much shorter. Overall, the formulation process and fire level of Dongmendu Kiln were not high. It should be a typical kiln in the Tang and Song Dynasties of Xuanzhou, where civil ceramics were produced. The results had important scientific value on an objective understanding of the process level, characteristics and laws of the ancient porcelain in Anhui. It is of great academic significance to explore the connotation of ancient Chinese imperial kilns, the production layout of kiln industry, and to establish the historical position of Xuanzhou kiln in the development of Anhui porcelain industry and the exchange of porcelain technology between the south and the north. Further, it was also advantageous to promote the conservation and planning construction of Anhui ruins and heritage and protection of the regional culture.
Mar. 01, 2022Vol. 42 Issue 3 726 (2022)
Qiu-li PAN, Jin-fa SHAO, Rong-wu LI, Lin CHENG, and Rong WANG
The red and green colored porcelain is an important overglaze colored porcelain in the history of Chinese ceramics. It is significant to analyze the chemical composition and phase structure of the colored pigments to study the process of fired technologies. However, the traditional X-ray diffractometer with a 1 mm×10 mm line source is not easy to measure the porcelain sample of uneven surface and unevenly distributed color material. The capillary-focused X-ray diffractometer has a point X-ray beam to irradiate the sample. The capillary X-ray lens has a magnification of up to 3 orders of magnitude to the energy of Cu-Kα and has a low divergence of the X-ray beam. Therefore, it can measure the sample with a diameter of 100 micrometers and the conventional X-ray diffraction analysis of a sample with diameter of 3 mm, which is very suitable for the non-destructive analysis of the mineral structure of ancient ceramic samples. This article reports the results of the chemical composition and phase structure of the white glaze and red and green-colored pigments in the Qing Dynasty unearthed in Jingdezhen, Jiangxi province by the capillary focused microbeam X-ray fluorescence spectrometer, and the capillary focused X-ray diffraction spectrometer developed by our laboratory. It carried out the two-dimensional scanning analysis of the distribution of multi-element and mineral phases in the interest region (2 mm×2 mm) of the red and green colored porcelain. The results show that at first, Cu is the main coloring element of green colored pigments and the concentration of Cu in green colored pigments is 0.02%. Moreover, parts of Cu exist in the form of the Pb8Cu(Si2O7)3 crystal phase. Secondly, Fe is the main coloring element of red-colored pigments, and the contractions of Fe in red-colored pigments is 1.63%, and parts of Fe exist in the form of the Fe2O3 crystal phase; Thirdly, the concentrations of Pb in green and red-colored pigments is 41.49% and 6.29%, respectively. The main function of Pb is to lower the melting point of the colored pigments, and parts of the Pb combined with Cu and Si during the firing process at 700~800 ℃ to exist in the form of Pb8Cu(Si2O7)3 crystal phase. From the element 2D mapping and crystal phase mapping, it is obvious that the crystal phase of the coloring elements Cu and Fe in the colored pigments is inconsistent with the element distribution of Cu and Fe. It indicates that the Cu and Fe mineral crystal phases in the raw materials may disappear during the firing process, and the Fe2O3 crystal phases have been left or generated during the process of firing or cooling. The mullite crystal phase in the white glaze indicates that the white glaze fired at a high temperature. However, the formation temperature of the Pb8Cu(Si2O7)3 crystal phase is only about 750 ℃, which can further explain that the red and green colored pigments were fired at low temperatures. In general, the capillary-focused microbeam X-ray fluorescence spectrometer and the capillary-focused microbeam X-ray diffraction specrometer could have important application prospects in cultural relics’ scientific and technological research.
Mar. 01, 2022Vol. 42 Issue 3 732 (2022)
Bing HUANG, Xiao-hong WANG, and Ping JIANG
Near-infrared spectroscopy has been successfully applied to the rapid detection of cement raw meal composition, but Chinese cement companies use different raw materials when producing cement raw meal. The use of different raw materials for production has a certain impact on near-infrared spectroscopy modeling. In order to study the difference of near-infrared spectral modeling of cement raw meal produced in different regions, this paper studies the modeling of cement raw meal produced by cement production lines in different regions. 95 and 82 samples of cement raw materials from cement production lines in two different regions were selected respectively, 80 and 67 samples were selected as calibration sets, and 15 samples were selected as verification sets. Firstly, the samples from the two cement production lines are repeatedly loaded and tested three times, and the average spectrum is taken as the near-infrared spectrum of the samples. Then the near-infrared spectra of cement raw materials produced in two different regions are then pretreated by the S-G smoothing method. The partial least squares regression algorithm is used to establish the detection model, and the comparison shows that there are certain differences in the near-infrared spectra of cement raw meal in the two regions, and the accuracy of the model established by the same method is quite different. Using the CARS band selection method, the near-infrared spectra of two kinds of cement raw materials were selected. The near-infrared spectra bands of SiO2, Al2O3, Fe2O3 and CaO samples from production line 1 retained 85, 89, 55 and 67 variables respectively from 3113 variables. The near infrared spectral bands of SiO2, Al2O3, Fe2O3 and CaO in the cement raw meal samples of production line 2 are 51, 55, 55 and 55 variables respectively retained from 3113 variables, and the retained bands are different. Finally, the near-infrared spectrum detection models of SiO2, Al2O3, Fe2O3 and CaO in cement raw materials in the two regions were established respectively. Through comparison, it is found that the selected wave bands are different when the raw materials are different, and the prediction effect of the detection model is good. The RMSEP (predicted root mean square error) of production line I SiO2, Al2O3, Fe2O3 and CaO detection models are 0.109, 0.053, 0.034 and 0.185 respectively, while the RMSEP (predicted root mean square error) of production line Ⅱ SiO2, Al2O3, Fe2O3 and CaO detection models are 0.084, 0.024, 0.023 and 0.184 respectively. The results show that when the raw materials of cement raw materials change or the place of production is different, the cement raw materials cannot be detected only by the modified model, but the near-infrared spectral modeling needs to be carried out again, and the spectral band selection will also change. Using the band selection method to select the band of near-infrared spectrum of cement raw meal can improve the model accuracy of the detection model.
Mar. 01, 2022Vol. 42 Issue 3 737 (2022)
Ya-li DENG, Mei LI, Ming WANG, Hui HAO, and Wei XIA
Surface plasmon resonance is a label-free sensing technology. When the dielectric constant around the medium changes, the SPR resonance spectral characteristics will also change. Because the titanium dioxide (TiO2) covering layer can completely protect the metal layer, it can be converted into a 1 550 nm optical fiber sensor through the spectral intensity and reflection wavelength of SPR reflection at the near-infrared wavelength, and its redox reaction can also realize the effective use of detection gas. Due to the flammability and explosiveness of turbines and the wide application of converted hydrogen energy, it has special significance for researching low-concentration gas-phase detection technology. This paper proposes a replaceable silver/titanium dioxide composite film surface. Plasma resonance gas sensor studied the SPR sensor near 1 550 nm. Surface plasmon resonance spectral characteristics. The relationship between the resonance spectrum intensity of the four-layer structure model coupled with the Kretschmann prism and the thickness of the silver film, the thickness of titanium dioxide and the prism material was calculated by simulation, and the maximum sensitivity of the thickness of Ag and TiO2 layers were optimized. The best film thicknesses obtained were 45 nm Ag and 110 nm TiO2. The Ag/TiO2 film is designed as a replaceable one-time gas-sensitive film coated by evaporation and sputtering methods to prepare the SPR sensor used in this article. The Ag/TiO2 film is used to generate the SP resonance spectrum shift at the composite interface to test the gas. Spectral wavelength detection experimental system using Kretschmann refractive index conversion structure. Fix the light source and the incident angle, and measure the displacement of the wavelength. The 1 550 nm wide light source (wavelength range: 1 462~1 662 nm) is irradiated to the prism coating and the replaceable Ag/TiO2 sensitive film through the circulator and collimator. It then is reflected by the high reflector after the total reflection (TIR) The sensing film is reflected to the collimator again with the same TIR angle and light path, to be detected by the spectrometer. Experimental results show that the Ag/TiO2 composite film can convert the resonance wavelength to 1 550 nm near-infrared spectrum, enhancing the sensor’s spectral sensitivity, and the sensitivity under low concentration (14.7%~25%) microns can reach -8.305 nm·%-1. Moreover, it can detect different gases by replacing the gas-sensitive membrane with increasing biocompatibility and gas sensing capabilities.
Mar. 01, 2022Vol. 42 Issue 3 743 (2022)
Zhi-xing SUN, Zhong-gai ZHAO, and Fei LIU
The near-infrared spectrum contains the characteristic information of the hydrogen-containing groups of organic molecules in the substance, and it has the characteristics of high dimensionality and large redundancy. Traditional near-infrared spectroscopy techniques are based on shallow correction models, such as principal component regression, partial least squares regression, artificial neural networks, support vector regression etc., which cannot extract the deep information of the spectral data. This paper proposes a near-infrared spectroscopy modeling method based on stacked supervised autoencoders, which can fit the complex non-linear relationship between spectral data and target physicochemical values and extract the deep feature information of the data. First, the optimal preprocessing method is selected by comparing the effects of different spectral preprocessing on the model prediction results. Then the correlation coefficient method is used to extract the characteristic bands of the preprocessed spectrum. The method uses the processed near-infrared spectrum data as the input signal. Then use the target physicochemical values to perform supervised pre-training on multiple supervised autoencoders, and stack multiple pre-trained supervised autoencoders. The stacked supervised autoencoder is obtained, the pre-trained parameters are used as the initialization parameters of the stacked supervised autoencoder, and then the target physicochemical values are used to supervise and fine-tune the stacked supervised autoencoder. Finally the optimal parameters of the model are obtained. Established partial least squares regression prediction model, artificial neural networks prediction model, stack auto-encoder prediction model and stack supervised auto-encoder prediction model on the corn water content data and the total acid content data of yellow wine respectively, verifying the feasibility of stack supervised auto-encoder modeling. The root means square error and residual prediction deviation are employed to evaluate model performance. The accuracy of four modeling methods of partial least squares regression, backpropagation- artificial neural networks, stack auto-encoder, and stack supervised auto-encoder are compared and analyzed. The analysis results show that the model established by stack supervised auto-encoder has a good prediction effect. The two evaluation indexes of the corn water content data set reached 0.061 1 and 4.271; the two evaluation indexes of rice wine’s total acid content data reached 0.126 6 and 4.006, excellent for the other three methods.
Mar. 01, 2022Vol. 42 Issue 3 749 (2022)
Maturzi AIBIBAIHAN, Rong XU, Xiao-jin LI, Cong-zhao FAN, Zhi-yong QI, Jun ZHU, Guo-ping WANG, and Ya-qin ZHAO
Apocynum venetum L. was a commonly used medicinal material in Xinjiang, mainly used for hepatic yang vertigo, palpitation and insomnia, oedema and oliourine, and it also had a good therapeutic effect on hypertension and depression. In order to ensure safety and stability of clinical medication, four traditional identification methods and modern chromatographic and spectral techniques were commonly used to identify the quality differences of Chinese medicinal materials. In this study, 17 batches of A. venetum collected from different regions in Xinjiang were analyzed by Fourier transform infrared spectroscopy (FTIR ). The range of infrared spectrum was 4 000~400 cm-1, the range of secondary derivative spectra was 1 800~600 cm-1. After obtaining these fingerprints, the correlation coefficients were calculated by using the fingerprint spectrum (1 800~400 cm-1) with dense spectral bands. Then, the infrared fingerprints of A. venetum from different habitats were classified and compared by combining the infrared spectral absorption peak system clustering, the common peak rate and the variation peak rate double index sequence analysis. The results showed that the infrared spectra of A. venetum from different regions in Xinjiang were similar in shape and position of peaks, and all of them had absorption in wavenumber of 3 336, 2 920, 1 443, 1 375, 1 247, 1 103, 1 070, 833 and 601 cm-1. There were characteristic and strong peaks at 1 103, 1 070 and 1 656~1 609 cm-1. And the CO32- vibration peaks in 892 and 717 cm-1 only appeared in S4 from Karamay Dushanzi Districtand S5 in Wusu Ganjiahu nature reserve, which was related to the high degree of soil salinization. Except S5, the correlation coefficient of the other 16 batches of medicinal materials was higher than 0.960, indicating that A. venetum from different origins had a certain similarities. It was found that the peaks of the second derivative spectra were similar, but the number of peaks increases obviously in the range of 1 444~1 738 and 833~1 030 cm-1. SPSS 21.0 software was used to conduct cluster analysis with the absorption wave number of each medicinal material as the variable. S9 and S14, S2 and S10, S3 and S8, S12 and S13 were first clustered into one class; when the Euclidean distance was 15, the medicinal materials were divided into four categories: the medicinal materials with absorption peaks at 1 615 cm-1, the medicinal materials with absorption peaks at 1 646 cm-1, S1 with absorption peaks at 1 646 and 1 615 cm-1, and only S5 with absorption peaks at 2 962 cm-1 in all materials. When the European distance was 20, the medicinal materials were divided into S5 and other medicinal materials. The results of the double index sequence method showed that the common peak ratios of S9:S14, S2:S10, S3:S8 and S12:S13 were 100%, and the common peak ratios of A. venetum were ≥61.1%, and the variation peak ratios were ≤53.8%, it was considered that there was no obvious origin difference. The results of correlation coefficient analysis, cluster analysis and double index sequence analysis was complementary and verified, it indicated that these methods were reliable and effective, which can analyze and evaluate the A. venetum samples from different perspectives to provide a reference for ensuring the stability and controllability of medicinal materials.
Mar. 01, 2022Vol. 42 Issue 3 757 (2022)
Jun ZHOU, Yang YANG, Yao YAO, Zi-wen LI, Jian WANG, and Chang-jun HOU
Quantitative analysis of total acid and ethyl caproate content of key indicators in strong flavour Chinese spirits base liquor(SACSL)based on mid-infrared spectroscopy technology, data preprocessing using standard normal transformation (SNV) method, combined with combined interval partial least squares band selection method (SiPLS) and genetic algorithm (GA) to screen the characteristic absorption wavelength of each index, and finally use partial least squares (PLS) to establish an analysis model, through the determination coefficient R2, prediction standard deviation (RMSEP), performance and standard deviation ratio (RPD) and the actual production of independent test samples to evaluate the effect of the built model, and explore the effect of mid-infrared spectroscopy analysis technology combined with band screening for quantitative analysis of key indicators of SACSL. The results show that the effect of the model built using the mid-infrared full spectrum 397~4 000 cm-1 band is not ideal. The RMSEP values of the total acid and ethyl caproate models reach 0.156 and 0.981, respectively, the R2 is only 0.666 and 0.453, and the RPD value is 1.731 and 1.213, the overall fitting effect of the representative model is not ideal, the prediction error is large, and it cannot be applied to actual production. After the further screening of characteristic variables based on the optimization of the SiPLS band using GA, the effect of the built model has been significantly improved. The GA-BiPLS model with two indicators of total acid and ethyl caproate showed higher prediction accuracy, R2 is increased to 0.993 and 0.997, RMSEP value is reduced to 0.023 and 0.077, RPD value is increased to 11.739 and 15.455, and the number of variables is also reduced from 935 to 55 and 40, respectively, while retaining key information variables to reflect the base wine. While the index characteristics of total acid and ethyl caproate are absorbed, it effectively reduces the complexity of the model, and at the same time improves the calculation speed and prediction effect of the model, which fully reflects the application of band screening to the application of mid-infrared spectrum analysis technology to the quantification of key indicators of SACSL. The importance of analysis also illustrates the great potential of mid-infrared spectroscopy technology combined with chemometric methods in the quality analysis of liquor. Considering the complex composition of liquor, most of the key quality indicators are relatively low, and the fundamental frequency absorption intensity of the mid-infrared absorption region is dozens of times stronger than the frequency doubled and combined frequency absorption. Mid-infrared spectroscopy may be more suitable than other spectroscopy techniques. The rapid analysis of liquor liquid samplesprovide technical reference for the quality control of the liquor brewing process, and provide new ideas for the rapid analysis of liquor quality.
Mar. 01, 2022Vol. 42 Issue 3 764 (2022)
Ai-ling TAN, Zhen-yuan CHU, Xiao-si WANG, and Yong ZHAO
The chemical composition of pearl powder and nacre powder is similar, However, the medicinal value of nacre powder is far lower than that of nacre powder, and nacre powder is easier to prepare at low cost, which is often used by illegal businesses to fake or mix into nacre powder to enter the market and seek illegal interests. Therefore, identifying pearl powder adulteration and purity analysis is of great significance. This paper used Raman spectroscopy combined with deep learning technology to study the rapid identification and purity analysis of pearl powder adulteration. The pure pearl powder and nacre powder were mixed according to a certain proportion to make 270 samples with 9 kinds of purity of 0%, 25%, 50%, 75%, 80%, 85%, 90%, 95% and 100% respectively. Then the Raman spectrum of the samples was collected, and the parameters were set as follows: the resolution is 4.5 cm-1, the integration time is 3 000 ms, and the laser power is 20 mW. A Deep Convolutional Generative Adversarial Network (DCGAN) model was built to enhance the Raman spectra of the samples. Furthermore, K-nearest neighbor, Random forest, Decision tree, and one-dimensional convolution neural network (1DCNN) classifiers were used to identify the authenticity of a small proportion of adulterated samples with the purity of 85%, 90%, 95% and 100%. At the same time, a quantitative model for the purity prediction of 9 kinds of adulterated pearl powder samples was established by using a one-dimensional convolutional neural network. The results showed as follows: compared with the original spectral data, the Raman spectral data generated by the DCGAN data enhancement method was significantly better than the traditional data enhancement methods in the two evaluation indexes of peak signal-to-noise ratio and structural similarity. For the identification of pearl powder adulteration, the accuracies of the qualitative models established by DCGAN data enhancement method combing with four different classifiers have all reached 100%. For the quantitative detection of the purity of the pearl powders, the model established by DCGAN-1DCNN method has achieved the best performance. For the test set, the determination coefficient (R2) was 0.988 4 and the prediction root mean square error (RMSEP) was 0.034 8 as the loss value of 1DCNN network was 0.001 2. Raman spectroscopy combined with the DCGAN method provides a rapid and simple method for identifying and purity analysis of pearl powder adulteration. The data enhancement method of deep convolution generation countermeasure network has important research significance and application value in spectral analysis technology.
Mar. 01, 2022Vol. 42 Issue 3 769 (2022)
Yong-tian REN, Yi HU, Jun CHEN, and Jun CHEN
Gas monitoring is closely related to our lives, and hydrogen as an ideal research model has received widespread attention. Raman spectroscopy has the advantages of non-destructive and non-contact measurements. One of the main problems in Raman measurement for gases is the weak Raman scattering. In some specific scenarios, the signal acquisition time is required to be short, so the obtained Raman spectrum has a low signal-to-noise ratio. As a newly developed signal processing method, the compressed sensing method can compress and sample the signal, shorten the sampling time, and reduce the noise and improve the signal-to-noise ratio to better realize the restoration and reconstruction of the original signal. This study used hydrogen and deuterium mixed gas as the measurement object. Two compressed sensing methods were used to analyze the Raman spectra with different sparse matrices: One of the sparse matrices using the Lorentz function to design atoms of the dictionary of OMP (Orthogonal Matching Pursuit) algorithm, and another sparse matrix using Fourier transform filtering to construct the orthogonal basis dictionary of OMP. Through the processing of simulation data and actual measurement data, we compare the effects of the two methods of compressed sensing analysis with wavelet soft threshold, hard wavelet threshold and SG (Sawitzky-Golay) filter processing, and peak intensity, signal-to-noise ratio, and root mean square error. It is demonstrated that using the Lorentz function to design the dictionary of the OMP algorithm can reduce noise for gas Raman spectra.
Mar. 01, 2022Vol. 42 Issue 3 776 (2022)
© Copyright 2018-2021 | Chinese Laser Press.
All Rights Reserved 沪ICP备15018463号-20