Spectroscopy and Spectral Analysis
Co-Editors-in-Chief
Song Gao
Yu-ying HUANG, and Xin-yu ZHONG

Synchrotron radiation source is the radiation emitted along the tangent direction of the orbit when the charged particles move in the storage ring of the accelerator at speed close to the speed of light. Synchrotron radiation X-ray fluorescence analysis (SR-XRF) is an X-ray fluorescence spectrum analysis technique using synchrotron radiation X-ray as the excitation source.Synchrotron radiation X-ray fluorescence analysis includes a variety of methods, synchrotron radiation XRF can be used in the micro area and trace elements analysis, total reflection X-ray fluorescence synchrotron radiation (SR - TXRF) used in the surface and film analysis, synchrotron radiation X-ray fluorescence scanning and imaging methods (such as X-ray fluorescence CT, X-ray fluorescence full-field imaging, confocal X-ray fluorescence and grazing exit X-ray fluorescence, etc.) used for three-dimensional nondestructive analysis.X-ray fluorescence spectrometry provides a means of identifying an element, by measuring its characteristic X-ray emission wavelength or energy. The method allows the quantification of a given element by first measuring the emitted characteristic line intensity and then relating this intensity to elemental concentration. The synchrotron radiation X-ray fluorescence spectrum has high brightness, tunability, good coherence, collimation and polarization. It can be used to analyze the content and spatial distribution of elements in samples. In recent years, with the application of new technology, the upgrading of analysis software, and the development of quantitative analysis methods, synchronous X-ray fluorescence spectroscopy technology has been promoted. By adopting new X-ray optical elements and detectors, the resolution and detection efficiency has been greatly improved, and the development of related disciplines has been promoted.The development of synchrotron radiation X-ray fluorescence spectrometry and its application in China and overseas in recent yearsare introduced. At the same time, the typical beamline technology development and its applications in biomedicine, environmental science, geological science, archaeology, material science, physics and chemistry are described. The review has certain reference significance for experts and scholars in this field and related fields to understand the development status and application research results of synchrotron radiation technology in China and overseas.

Feb. 01, 2022
  • Vol. 42 Issue 2 333 (2022)
  • Zi-xiong WANG, Da-peng XU, Yi-fan ZHANG, and Jia-jia LI

    Surface-enhanced Raman scattering (SERS) technology has the characteristics of high efficiency, sensitive and non-destructive detection, etc., which can realize shallow concentration detection of analyte molecules and is widely used in the field of trace analysis. In production and life, some toxic substances or illegal additives are continuously accumulated in the body after being ingested or long-term exposure to the human body, eventually leading to poisoning or tissue and organ disease; excessive residues of harmful substances in the environment due to their toxicity or the damage to the ecosystem caused by the resistance of strains and pests, will seriously affect people's everyday life; some biomolecules are produced with diseases, which can be used as markers of diseases and can give body health diagnosis information; Some anti-cancer drugs are inherently toxic, so the dosage needs to be strictly controlled when used. Therefore, it is of great significance to use SERS technology for trace detection of analyte molecules in various fields. A brief introduction to the development of SERS technology, the mechanism of SERS enhancement, and the significance of detecting analyte molecules. Taking some analyte molecules in chemical analysis, environmental monitoring, Bio-medicine and food safety as the breakthrough point, used mainly introduced the preparation process of SERS substrate and the detection limit of detecting analyte molecules on the substrate elaborate the Raman enhancement mechanism. Detection of low concentration of analyte molecules mainly relies on the effective adsorption between SERS base and analyte molecules, through the local electromagnetic field generated by the base or the new chemical state formed between the base and analyte molecules, to enhance the Raman signal of analyte molecules. At the same time, it is pointed out that there are many challenges in the qualitative and quantitative analysis of analyte molecules: (1) SERS substrates mostly use gold, silver and copper as raw materials, which are costly and unstable, and their ability to detect analyte molecules decreases with the prolongation of time; (2) The analyte molecules are unevenly distributed on the surface of the substrate, resulting in significant differences between point-to-point, the concentration of analyte molecules cannot be accurately obtained by the intensity of the Raman characteristic peak, and the Raman signal is easily interfered by fluorescence and background noise; (3) Trace toxic analyte molecules cannot be detected, and continue to accumulate in the human body through the food chain or ecosystem, eventually causing irreversible damage to the human body. This review summarizes the common analyte molecules in different fields, provides the basis for analysis and comparison of analyte molecules in various fields by SERS technology, and provides a reference for the Raman enhancement effect of different SERS substrates. It is of great significance to promote SERS technology to detect analyte molecules in different fields.

    Feb. 01, 2022
  • Vol. 42 Issue 2 341 (2022)
  • Coal structure is the microscopic foundation of various coal-related research, and spectral analysis is widely used as an important method of coal structure research. Its progress in coal structure research is significant to the popularization, application and development of spectral analysis methods. The study of coal structure using spectroscopic analysis methods has become a routine method used in the coal chemical industry. Spectral analysis methods can quickly and non-destructively detect the molecular structure of coal and provide effective detection methods for changes in coal physical and chemical properties under different environmental conditions. This article introduces spectroscopic analysis methods from three aspects of coal quality, macromolecular structure, and elements in coal. It mainly reviews FTIR, Raman spectroscopy, and NMR. Its development history in the study of coal structure, the key research results obtained from its application and its significance. Synthesizing the various spectroscopic analysis methods and application status in coal structure research at home and abroad, it is found that the current research has not completely solved the problem of coal structure characteristics and property changes, lacks a summary of the common characteristics of coal structure spectral characteristics, and failed to form functional groups in coal. Unlike the database of different spectral information of elements, there is a problem that the characteristic spectral peaks and coal structure information are not equal. That is, there are characteristic peaks at a certain wavelength but cannot match the functional groups in coal, or the functional groups of coal are caused by element composition, bond energy, etc. to multiple wavelengths. Respond to the question. At this stage, the research on the structure of raw coal in its natural state is no longer sufficient to meet the problems caused by coal application. A single spectrum analysis method cannot fully analyze the coal structure characteristics, and there are few studies on the factors affecting the change of the coal structure spectrum characteristics, especially coal samples. In the future, the study of spectroscopic analysis in coal structure can start from the following aspects: the combination of spectroscopy and other methods to comprehensively describe the structure of coal, such as chemical methods, HRTEM, STM, MS and other methods are combined to analyze coal structure characteristics qualitatively and quantitatively; coal structure and spectral characteristics under various conditions. At this stage, spectral analysis methods should be used to study coal's structural characteristics and property changes under various conditions. Solve the problems of coal in practical application. Such as oxidation, hydrogenation, pyrolysis, combustion, low temperature, liquefaction, vaporization and other treatments of coal, the analysis of process changes and product characteristics. It helps to speculate on the structure of the maternal coal, understand the nature of the coal, control the produt of coal physical chemical process, and obtain fine chemicals of coal. In addition establish a coal spectroscopy analysis feature information database, and a visual data query platforms in the background of network big data. Implementing multi-condition simulation assumptions, demonstration and exploring coal structure dynamic changes under different conditions. By uses artificial intelligence and cloud computation to realize the processing and analysis of various spectral data of coal. Enhance the mining of spectral data information to improve the validity and applicability.

    Feb. 01, 2022
  • Vol. 42 Issue 2 350 (2022)
  • Jing-zhu WU, Xiao-qi LI, Li-juan SUN, Cui-ling LIU, Xiao-rong SUN, and Le YU

    With its unique technical advantages, such as transient, broadband, coherence, low energy, penetration and absorption, terahertz(THz) radiation has been highly regarded by governments, universities and research institutions worldwide and is becoming an emerging research hotspot in the fields of biomedicine, materials science and physics. Crop components such as water, protein, fat and starch are theoretically more abundantly absorbed in the THz spectra region; The low radiation properties of THz are safer for the detection of agricultural biological samples. The penetration characteristics of THz spectroscopy are unique for the detection of packaged and coated samples. Terahertz time-domain spectroscopy(THz-TDS) combined with imaging technology is used further to evaluate the histomorphology of crop samples for discrimination. Therefore, THz technology is becoming a promising cutting-edge analytical technology in crop quality inspection. In this review, the basic principles of THz-TDS and imaging technology are briefly described. The current research status of THz-TDS and imaging technology in the field of crop quality inspection is focused on the recent research progress and problems of the technology in the field of crop seed quality identification (e.g. variety, transgenic and vigor), crop composition analysis (e.g., sugars, moisture and starch), crop storage quality discrimination (e.g., freshness, deterioration and insect damage) and agricultural product safety detection (e.g., pesticide residues, illegal additives and foreign substances) are summarized, and the application prospects and development trends of THz technology in the field of crop quality inspection have prospected.

    Feb. 01, 2022
  • Vol. 42 Issue 2 358 (2022)
  • Hao-yu WAN, Zi-xiong ZHOU, Jun-biao WU, Matysik Jörg, Xiao-jie WANG, and [in Chinese]

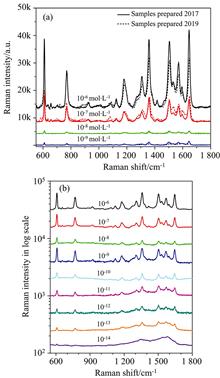
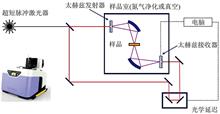
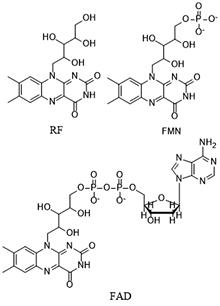
    Flavins are widely present in organisms and active centers of many electron-transfer reactions. Therefore, they play an important role in biological electron transport chains. Electron transfer caused by light excitation of flavins is the initial step of many living processes. Cryptochromes containing flavin as a cofactor undergo a series of electron-transfer steps to form spin-correlated radical pairs (SCRP) after light excitation. Cryptochromes are considered the most likely candidate for an avian magnetoreceptor, which initiated research on the dynamics of the electron transfer in the flavin system, especially on their spin dynamics. The study of electron transfer and related processes in flavoproteins will allow one to understand biochemical mechanisms and reveal the influencing factors of various living processes. Therefore, numerous research methods, including UV-Vis spectroscopy, fluorescence spectroscopy, transient absorption spectroscopy, electron paramagnetic resonance, photochemical induced dynamic nuclear polarization (photo-CIDNP) and other spectroscopic techniques. We review studies of domestic and foreign scholars on electron transfer of flavin systems, and discuss the recent progress in various major research methods. UV-Vis spectroscopy is mainly used to study electronic excitation, spin-dynamics, and electron transfer in the flavin systems. UV-Vis spectroscopy might identify the groups involved in electron transfer and perform quantitative analysis combined with theoretical predictions. Fluorescence spectroscopy can identify electronically excited species, observe the rise and decay of, for example, flavin and semiquinone intermediates during the reaction course, and identify their redox and protonation states. Transient optical spectroscopy is suitable for capturing short-lived species that appear in the reaction process. In particular, introducing femtosecond pump-probe technology greatly shortened the time-resolution of observation and can distinguish between singlet- and triplet-born radical pair dynamics. Photo-CIDNP nuclear magnetic resonance (NMR) allows -to observe the electron-nuclear spin dynamics directly. Such direct access to the bio-geomagnetic operational mechanism might pave the way for practical applications. Magnetic field-dependent photo-CIDNP NMR reveals the factors controlling the singlet-to-triplet interconversion and suggests a possible chemical mechanism of bio-geomagnetic navigation. The application of cavity absorption and single-molecule spectroscopy technically improves the sensitivity of the experimental device and reduces the detection limit. This article mainly introduces the various spectroscopic techniques to study the electron-transfer process of flavin systems and their research results. Finally, possible future developments in this field are briefly discussed.

    Feb. 01, 2022
  • Vol. 42 Issue 2 368 (2022)
  • Qing-bo LI, Yuan WEI, Hou-xin CUI, Hao FENG, and Jia-ye LANG

    The safety of surface water resources is of great strategic significance. It is related to national health, ecological environment stability and sustainable economic development. Total organic carbon (TOC) is a comprehensive index to reflect the content of organic matter in water. Hence, it has significant value in water environment supervision and treatment. This method is time-consuming and complex. UV-Vis spectroscopy technology has the advantages of fast detection speed and simple operation. Therefore it has a good application prospect in online detection of water quality. At present, the online detection methods of TOC in surface water mostly are indirectly calculated at home and abroad. These methods depend on the correlation between the concentration of COD and TOC, and they require high stability of water composition. Compared with the indirect calculation methods, the spectral quantitative analysis method has better robustness and accuracy. Moreover, this method is convenient for realizing unattended online monitoring of water quality. The experiment was equipped with TOC sample solutions, and a two-day experiment was designed. Six spectral data sets of the samples (denoted as D1, D2, …, D6) were collected in 4 time periods. Firstly, D1 was used as the training set to establish a partial least squares (PLS) regression model in the group experiment. This model was used to predict the TOC concentration of D2, and the mean absolute percentage error (MAPE) was less than 0.78%. In addition, D1 and D2 were collected in the same period. The results show that the established TOC quantitative analysis model has high accuracy. Then, to verify the robustness of the TOC model established by the PLS method to the change of instrument state, the spectral data collected in different periods were selected as the training set, the test set and the validation set. Furthermore, the cross experiments of different instrument states were performed. The MAPE of the predicted TOC concentration in the four experiments were 3.82%, 3.75%, 3.43% and 0.98%, respectively. The results show that the UV-Vis spectroscopy quantitative analysis model of TOC established by the PLS algorithm has good accuracy and robustness. The MAPE of predicted concentration in the grouping experiment and cross experiments of different instrument states are all less than 3.82%. These results are better than the conventional indirect calculation method. Moreover, the established spectral quantitative analysis model does not depend on the calculation relationship between COD and TOC. Thus, it has better adaptability than the conventional indirect calculation method when the water environment changes. Finally, the PLS algorithm has the advantages of a simple modeling process and fast operation speed. It provides convenience for the development and maintenance of submersible online detection equipment.

    Feb. 01, 2022
  • Vol. 42 Issue 2 376 (2022)
  • Zhao LI, Kun-yao WU, Ya-nan WANG, Jing CAO, Yong-feng WANG, and Yuan-yuan LU

    Using Al2(SO4)3·18H2O and urea as raw materials, the spherical α-Al2O3 powder was prepared by hydrothermal-pyrolysis method. Using self-made α-Al2O3, Y2O3 and CeO2 as raw materials, Y2.93Al5O12∶0.07Ce3+ yellow phosphors for white light LEDs were prepared by solid-phase method. Through X-ray diffraction (XRD), scanning electron microscope (SEM), X-ray energy spectroscopy (EDS) and fluorescence spectroscopy (PL) etc. to characterize the phase, morphology and photoluminescence properties of the product. The results showed that the hydrothermal-pyrolysis method prepared spherical α-Al2O3 powder with pure phase and good dispersibility. Using the α-Al2O3 as raw material, the synthesized α-Al2O3 could be effectively excited by 460 nm blue light, and the emission spectrum peaked at 550 nm. Broadband Y2.93Al5O12∶0.07Ce3+ phosphor with color coordinates (0.453, 0.531 9), The XRD pattern of Y2.93Al5O12∶0.07Ce3+ phosphor was refined with GSAS software. The refined pattern is completely consistent with the XRD test pattern. The four elements of Y, Al, Ce and O are evenly distributed in the yellow phosphor product. The excitation spectrum of Y2.93Al5O12∶0.07Ce3+ yellow phosphor consists of two parts. There are two pronounced absorption peaks at 340 and 460 nm. The 4f energy level of Ce3+ is split into two spectra due to spin-coupling. Branch terms 2F7/2 and 2F5/2, 2F5/2 is the base spectrum term. The excitation peak at 340 nm corresponds to the transition from 2F5/2→5D5/2, the excitation peak at 460 nm belongs to the transition from 2F7/2→5D3/2, and the excitation intensity at 460 nm is stronger than the excitation intensity at 340 nm. The emission spectrum obtained with 460 nm as the monitoring wavelength, the strongest emission peak is at 550 nm, Y2.93Al5O12∶0.07Ce3+ phosphor is a high-performance yellow phosphor suitable for white LEDs.

    Feb. 01, 2022
  • Vol. 42 Issue 2 381 (2022)
  • Yang YU, Zhao-hui ZHANG, Xiao-yan ZHAO, and Tian-yao ZHANG

    The spectral parameters of many substances within the terahertz band have fingerprint characteristics, which is the basis of the application of the terahertz technology in many fields such as security inspection. However, it is required that the upper and lower surfaces of samples should be parallel and smooth for the Duvillaret algorithm, which is commonly used to extract the optical parameters of materials in terahertz time-domain spectroscopy (THz-TDS). Moreover, surface roughness is inevitable, and laboratory sample preparation methods such as mold pressing can not be utilized to ensure the parallelism and smoothness of the surface in many potential practical applications, especially for solid samples. Therefore, a universal optical parameter extraction algorithm that is not easily affected by the surface roughness of samples is needed to increase the application ability of THz-TDS in different situations. In this paper, the optical path of the transmission of the terahertz wave through rough samples is analyzed, and a terahertz transmission model of rough samples, including roughness, refractive index and extinction coefficient parameters, is established. Under the condition of known roughness and average thickness, the applicability of the transmission model is verified by extracting the refractive index and absorption coefficient of rough samples with characteristic absorption peaks in the terahertz band. -----The α-Lactose and L-Histidine which have typical absorption features at terahertz frequencies are selected as experimental material. Pellets at the same concentration are prepared and further separated into the rough surface group and smooth surface group. The refractive index, as well as absorption coefficient, are calculated with both our proposed model and conventional Duvillaret algorithm. The comparison between the results is further analyzed for evaluating our method, the root-mean-square error (RMSE) between the two extraction methods and the standard value is calculated, and the extraction results of the transmission model, the Duvillaret algorithm and the standard value extracted from the parallel and smooth sample are compared at the same time. The comparison results show that, compared with the Duvilaret algorithm, the refractive index and absorption coefficient of the rough sample extracted by the transmission model method has smaller deviations from the standard value, which reduces the influence of roughness on the extraction result to a certain extent and has higher accuracy. Therefore, under the condition of known roughness and average thickness of the surface rough sample, this model can be used to more accurately extract the optical parameters of the substance in the terahertz time-domain spectroscopy system. The research results will greatly promote the practical application of terahertz optical parameter extraction technology.

    Feb. 01, 2022
  • Vol. 42 Issue 2 386 (2022)
  • Yan-yan LI, Hai-jun LUO, Xia LUO, Xin-yan FAN, and Rui QIN

    The localization of brain hematoma by using functional near-infrared Spectroscopy has always been a research hotspot in the field of nondestructive optical diagnosis. To achieve open and all-around accurate detection, this paper proposes a new method based on functional near-infrared spectroscopy, the Array scanning sensitivity method. Namely to establish an omni-directional array detector, unilateral array scanning tests to get the fluence rate of different probe locations. By calculating the detection sensitivity, we can get a full range of detection information. Firstly, establish the monolayer finite element model, set optical parameters, light source, detection position and boundary conditions. The simulation results are compared with Monte Carlo to verify the accuracy of the conditions. Secondly, build a brain model with hematoma based on the structure of the brain, the light source selects near-infrared light with a wavelength of 850 nm, the optical parameters of biological tissue at this wavelength are set, simulate the propagation of photons in normal brain tissue and brain tissue with hematoma, and multiple sets of luminous flux data are detected at different locations. After processing the data, it is found that the finite element simulation software can reflect the significant influence of hematoma on the transmission of light in images and data. To study the relationship between luminous flux and the location of the hematoma, the azimuth, horizontal position and depth of the hematoma were changed respectively. Multiple sets of luminous flux data were also detected, the relationship between sensitivity and hematoma location was established for analysis. The results show that the azimuth and horizontal position of the hematoma can be accurately detected by the array scanning sensitivity method, and the detection effect is the best when the hematoma is located between the source and the detection distance. The depth only affects the overall luminous flux, and the deeper the position, the smaller the sensitivity. It is concluded that the array scanning sensitivity method can be used to quickly and accurately locate hematoma in a certain depths of brain tissue, which provides a new way of thinking and an effective reference for detecting tumors and optical imaging in tissue by near-infrared spectroscopy.

    Feb. 01, 2022
  • Vol. 42 Issue 2 392 (2022)
  • Xue-hui SUN, Bing ZHAO, Zhen LUO, Pei-jian SUN, Bin PENG, Cong NIE, and Xue-guang SHAO

    Chemometrics has been widely applied in near-infrared (NIR) spectroscopic analysis for quantitative detection and discrimination. However, new methods are still needed to simplify data processing and modeling to speed up the analysis and improve the convenience in practical uses. As a new type of technique for spectroscopic measurement and computation, the multivariate optical computing (MOC) technique is employed in spectroscopic analysis. The technique uses multivariate information in the spectrum to achieve quantitative computation and discrimination through the designed filters. In this work, the filters for discrimination analysis of near-infrared spectroscopy was designed based on principal component analysis (PCA) and Fisher's discrimination criterion. The spectra of the calibration samples can be projected into a two-dimensional space by the two filters to achieve an optimized classification, and a confidence ellipse can be obtained for each class of the samples. The ellipse can be used as a model for the discriminating the prediction samples. The distance of a prediction sample to the model is a good measurement of its classification. The samples with a distance less or equal to 1 are classified into the same class of the model, but those with a distance larger than 1 is excluded from the class, and the larger the distance, the bigger the dissimilarity. The proposed method was tested with the NIR spectra of 460 samples of tobacco leaf in three different parts of the plant and 73 samples of the medicinal capsules (amoxicillin granules) produced by four producers. The true positive rate can be higher than 90%, except for the tobacco samples and even higher than 95% for the capsule samples. However, the false-positive rate of the tobacco samples is still not so satisfactory due to the similarity of the NIR spectra. Using near infrared spectroscopy, the proposed method may provide a good technique for quality control, product detection and production monitoring in different fields.

    Feb. 01, 2022
  • Vol. 42 Issue 2 399 (2022)
  • Qi-peng LU, Dong-min WANG, Yuan SONG, Hai-quan DING, and Hong-zhi GAO

    Partial least squares regression (PLSR) calibration model will be effect by the wavelength change of a single instrument at a different time and the wavelength consistency of multiple instruments. The process of near-infrared spectroscopy analysis, this problems can be unified as the effect of wavelength drift on chemometric calibration model. In this paper, taking the analysis of crude protein in wheat flour as an example, two calibration models I and II were established by partial least squares regression (PLSR) method within different spectral regions. Different types and amplitudes of wavelength shift information were generated by computer and superimposed into the spectra of the validation set to produce wavelength shift information relative to the spectra of calibration set, the effect of wavelength drift on PLSR calibration model was studied by adding different types and amplitude of wavelength drift information to the spectra of the validation set samples. The results show that the RMSEP of every model is no more than 0.3% and the corresponding Rp is no less than 0.98 when there is no wavelength drift information in the spectra of validation set samples. When the wavelength drift at different wavelengths is constant, the RMSEP increases as the wavelength drift amplitude increases, the RMSEP increases to 3.69% when the wavelength drift is -32 cm-1, and the Rp is almost constant; When the wavelength drift varies randomly at different wavelengths, the prediction results of model II based on long wavelength regions are almost not affected. The model II is corrected by a series of spectra added to the calibration set with different wavelength drift information, the RMSEP of the corrected model is 0.3%, The influence of wavelength drift information on RMSEP has been almost eliminated, but the number of regression factors used to establish corredted model increases significantly from 3 to 8, the robustness of the model varies greatly. In general, the RMSEP can be polished by correcting the prediction results to ensure the accuracy of the analysis results if the amplitude of wavelength drift is slight. This study provides an experimental basis for determining the design instrument parameters and operating procedures to improve the reliability of NIR analysis results.

    Feb. 01, 2022
  • Vol. 42 Issue 2 405 (2022)
  • Yao-qiang HU, Min GUO, Xiu-shen YE, Quan LI, Hai-ning LIU, and Zhi-jian WU

    Alcohol is a key technical indicator of liquor, a favorite of consumers as a daily drinking. A simple and fast detection method for ethanol in liquor can help to improve the efficiency of a liquor inspection. Spectroscopy with the advantages of rapid and non-destructive can provide help for the analysis of ethanol content. Based on the good absorption effect of water molecules on infrared light, this paper explored the feasibility of indirect analysis of ethanol content in liquor by near-infrared spectrophotometry. By studying the effect of the optical path on the UV-VIS-NIR absorption spectra of water and ethanol, it is found that water molecules have an independent absorption peak at 1 448 nm. This absorption peak has a mutational point under the optical path of 10 mm. However, when the optical path is reduced to 1 mm, the shape of the absorption peak becomes symmetric and smooth, bringing the possibility of quantitative analysis. The absorption peak of aqueous ethanol solution in the range of 1 000~1 800 nm regularly decreases with the increase of ethanol content. It shows that the force between ethanol and water molecules do not affect their absorption spectrum. The linear equation between absorbance and alcohol content is obtained: A=1.38-0.013m% (R2=0.996 7) by extracting the absorbance at 1 448 nm. However, the fitting effect has a large relative deviation when the alcohol content is lower than 20% or higher than 80%. A better linear fitting equation with an excellent fitting effect is obtained: A=1.40-0.014m% (R2=0.999 3) after adjusting the fitting range to 20%~80%. The reliability of this method was tested through some purchased bulk and brand liquors. The results obtained by this method show a small relative deviation with the alcohol content marked on brand bottles, which is within the allowable error range of absorption spectrum analysis. Moreover, there are large relative deviations in the test measurement results of part of bulk liquors, which may be caused by the weaker quality control of bulk liquor. To some extent, this method has good accuracy and precision in detecting the alcohol content of liquor. This method has the advantages of convenience, rapid, no auxiliary reagent and wide linear range. It can be used as a test method for quickly analyzing the alcohol content of liquor.

    Feb. 01, 2022
  • Vol. 42 Issue 2 410 (2022)
  • As a green and safe food and drug ingredient, stevia has broad application prospects. However, moisture absorption is a major problem it faces, which is also a common problem in most preparations raw materials. Research and analyze the process state of moisture absorption, then proposed targeted solutions have important theoretical significance and application value. Near-infrared spectroscopy analysis technology combined with chemometric methods were used to analyze the moisture absorption process of stevia in this study. On this basis, the External Parameter Orthogonalisation (EPO) algorithm was used to eliminate the influence of sample moisture, and to establish a rapid analysis method for Rebaudioside A (RA) content in stevia. The results showed that at the beginning of the moisture absorption process of stevia, water molecules were rapidly adsorbed on the surface of the stevia powder to form a monomolecular layer; after that, the surface adsorption sites became fewer, the moisture absorption rate became significantly slower, and water molecules would be adsorbed on top of the monomolecular layer at the same time; finally, the overall moisture absorption of stevia reached its saturated state, and the water content remained stable. After revealing the law of moisture absorption, the RA quantitative model was established using the spectrum preprocessed by the EPO algorithm, the root mean square error, coefficient of determination, and predicted relative standard deviation of the external test set of the model were 0.669 5%, 0.957 0 and 4.336 8, respectively. Compared with the model built before EPO treatment, there was a big improvement, indicating that the EPO algorithm could effectively remove the influence of moisture absorption. In this study, near infrared spectroscopy was used for the first time to characterize the water changes during the moisture absorption of stevia, at the same time, the EPO algorithm was used to effectively eliminate the influence of moisture absorption and realize the rapid determination of RA in stevia products, which provides a reference for its further research and use.

    Feb. 01, 2022
  • Vol. 42 Issue 2 415 (2022)
  • Yun-ting HUI, De-cheng WANG, Xin TANG, Yao-qi PENG, Hong-da WANG, Hai-feng ZHANG, and Yong YOU

    Sorghum-Sudan Grass is rich in crude protein and carbohydrate, suitable for silage treatment. High-quality seeds are a prerequisite for animal husbandry development, and germination rate is one of the most conventional indicators to test the seed quality. Therefore, testing and screening the germination rate of the seeds prior to sowing is essential. The germination test method is currently used to detect seed germination rate, which has a long cycle and high cost. In this study, a rapid and non-destructive method based on NIR was proposed to detect the germination rate of sorghum-sudangrass seeds. The near-infrared diffuse reflectance spectra of the seed samples were collected with 1-Der and 2-Der processing. Moreover, comparative analysis of the parameter values obtained for $R^{2}_{c},R^{2}_{p}$, RESEC and RMSEP was also performed. The support vector machine (SVM) was used for modeling, and the LIBSVM software package in Matlab was used to realize the SVM training and detection process to detect the seeds of sorghum-sudangrass seed with different germination rates. Using the Unity scientific 2600 XT Near-infrared spectrometer, 100 groups of sorghum-sudangrass seeds from different provinces were selected as samples. Before the experiment, the broken seeds and seeds that did not germinate were removed, and the germination test was carried out in the incubator. The germination rate of 100 samples was obtained, and the germination rate ranged from 41% to 64%. The seed samples were spectroscopically scanned and were randomly divided into calibration set (70 samples) and test set (30 samples). In this paper, the 1-Der and 2-Der method was used to preprocess the spectrum of sorghum-sudangrass seeds. SVM modeled the preprocessed data, and its parameters were analyzed. The results showed that the correlation coefficients of the training set ($R^{2}_{c}$) and test set ($R^{2}_{p}$) were 0.94 and 0.92 respectively, and the root mean square error of correction (RMSEC) and root mean square error of prediction (RMSEP) were 0.21 and 0.25 respectively, which reflected that the model was the best when the 1-Der was used to preprocess the seed data. When c=2 896.309 4, g=0.5, the detection accuracy of the test set was 96.666 7% (29/30) by using Rbf core functions of SVM modeling. These results suggested that the model was feasible to predict the seed germination rate, and could be used as one of the rapid and non-destructive detection methods for the preliminary detection of seed germination rate of sorghum-sudangrass could effectively promote the seed production.

    Feb. 01, 2022
  • Vol. 42 Issue 2 423 (2022)
  • Feng-rui WEN, Hai-ou GUAN, Xiao-dan MA, Feng ZUO, and Li-li QIAN

    During the storage and transportation of rice, mildew easily occurs in a suitable temperature and humidity environment will cause a lot of food waste and huge economic losses, which in turn affects food security. This paper proposed a method for detecting the mildew degree of rice-based on near-infrared spectroscopy image processing technology and neural network. First of all, through the agricultural multi-spectral cameras (Sequoia) and fixed light sources and other equipment, this research has constructed a near-infrared image data acquisition platform for moldy rice. The imaging data of the different mold states (three states: healthy rice, mild mold, and moderate mold) of three varieties of Muxiang, Zaoxiang, and Caidao in Heilongjiang area were acquired. Secondly, taking data samples of rice with different degrees of mildew as the research object, for the 160×160 pixel effective area of the infrared spectrum (NIR) image, applying digital image processing technology combined with spectral image analysis methods to study the various texture characteristics and spectral reflectance frequency characteristics of near infrared spectroscopy (NIR) images, optimizing the spectral characteristics of the mildew state of different rice varieties. The texture features (mean, standard deviation, smoothness, third-order distance, consistency, information entropy, average gradient, fractal dimension) of the near-infrared image are extracted, and the reflection value frequency of the NIR spectrum in the 0.2~0.8 interval when the interval step is 0.1, based on a total of 14-dimensional spectral image characteristic index. At last, based on the feature vector of the NIR image, using the feedforward neural network adaptive inference mechanism, a nonlinear mapping model between the degree of rice mildew and its near-infrared image characteristics was established. The network structure of the model is 14-60-3, and the network output code vector is analyze to the rice mildew grade, realizing the rapid detection method of rice mildew degree. The results show that this paper proposes that the detection model reaches the preset target accuracy of 0.06 when the number of learning times is 28 455, and the correlation coefficient between the extracted rice NIR image features and the model output is 0.85. In the simulation test, the average error between the network output value calculated by the detection model and the expected output value is 0.521 39, the variance is 0.137 82, and the standard deviation of the error is 0.371 23. The accuracy of detecting the degree of mildew of different rice is 93.33%. The research results are a new method for realizing the non-destructive detection of the degree of rice mildew and can provide technical support early and automatic and rapid detection of early mildew during rice storage.

    Feb. 01, 2022
  • Vol. 42 Issue 2 428 (2022)
  • Fu ZHANG, Xia-hua CUI, Ke DING, Ya-kun ZHANG, Yong-xian WANG, and Xiao-qing PAN

    Due to the impact of swine fever, the demand for eggs which is an important substitute for pork, has increased significantly, and the laying hens breeding industry has also gradually developed and expanded to meet people's demands. Therefore, it is of great significance for the development of layer breeding industry that how to judge gender at the stage of chick and even embryo development accurately and conveniently. To this, 96 fresh seed eggs with similar shell color and no cracks on the surface were selected, and the visible/near-infrared diffuse reflection spectrum was used as the research object, investigated the influence of data collection location and spectral pretreatment method on the qualitative model of gender identification of seed eggs. Diffuse reflectance spectral intensity was collected at three different positions on the surface: blunt end, sharp end and the equator. After correction, 440.27~874.6 nm was selected as the effective spectral band for analysis. The spectral intensity was calculated according to 2∶1 divided into a training set and test set, the proportion of the normalized (Normalize), the second Derivative (2nd Derivative), standard normal variable transformation (SNV), multiple scatter correction (MSC), to trend method (Detrend), spectral transformation method (Spectroscopic), a total of six kinds of pretreatment of PLS-DA model and LDA models' prediction accuracy were analyzed, then compared with the original data (Raw) prediction accuracy, the changes of accuracy were obtained. Through comprehensive analysis of spectral data collected 216, 240, 264, 288 and 312 h after incubation and egg gender information at different positions, it was found that the pretreatment effect was the best at 288 h after embryo development, and the accuracy of 35 models was effectively improved. The pretreatment effect at 264 h was the worst in the analysis time, and its treatment reduced the accuracy of 19 models. The pretreatment of 312 h reduced the discriminant accuracy of 12 models. Detrend and Spectroscopic, two kinds of pretreatment method, could significantly improve the effect of discrimination, but the Spectroscopic model may not be able to predict; SNV and MSC had the same effect on the model, Normalize's effect on the model could not be determined. The accuracy of 2nd Derivative treatment was uncertain, which is sometimes consistent with the effect of original data modeling. The comprehensive experimental results showed that the preprocessing used LDA model of 288 h embryo development data could effectively improve the discriminant accuracy of the model, among which the Detrend preprocessing of the data at the blunt end of the egg was good. The results provided a reference for establishing an early and rapid detection model based on visible/near-infrared gender information in egg species.

    Feb. 01, 2022
  • Vol. 42 Issue 2 434 (2022)
  • Lin-jiang XIE, Ming-jian HONG, and Zhi-rong YU

    In the analysis of near-infrared spectroscopy data, full-spectrum data has the characteristics of multiple wavelength points, large redundancy, and serious collinearity. This leads to some wavelength points that have no positive effect on the establishment of the correction model and even reduce the model's predictive ability. Wavelength selection has proven to be an important method to avoid above problems effectively. Aiming at the characteristics of near-infrared spectroscopy, a wavelength selection algorithm based on the combination of Direct Orthogonal Signal Correction (DOSC) and Monte Carlo (MC) is proposed. Unlike most methods of selecting wavelength according to its “importance”, MC-DOSC selects wavelength according to its “unimportance”. The “unimportance” of wavelength is measured by the weight W of DOSC. Specifically, first, normalize was the probability of wavelength being filtered to establish the probability model of wavelength selection, and Monte Carlo random sampling is used to obtain the set of N wavelength subsets. The selected wavelength point is used to establish a PLS model in each sampling process, and the corresponding cross-validation root mean square error (RMSECV) is calculated. After N times of random sampling, the wavelength subset corresponding to the PLS model with minimum RMSECV is selected as the candidate subset. The spectral data contained in the candidate subset is used as a new spectral matrix, and the above process is repeated until the RMSECV no longer drops. After the iteration stops, the candidate subset with the smallest RMSECV is taken as the best wavelength subset. And compared with the three algorithms of Monte Carlo Uninformative Variable Elimination (MCUVE), Genetic Algorithm (GA) and Competitive Adaptive Weight Sampling (CARS). Experimental results show that the algorithm can greatly reduce the number of wavelength points, and the prediction ability of the corresponding PLS model is also improved. In the experimental results of the corn data set, the number of wavelength points is reduced from 700 in the full spectrum to 15. The correlation coefficient of the prediction set is increased from 0.828 2 to 0.931 4, and the RMSEP is reduced from 0.109 8 to 0.071 3. In the experimental results of the gasoline data set, the number of wavelength points was reduced from 301 in the full spectrum to 31. The correlation coefficient of the prediction set was increased from 0.987 5 to 0.993 9, and the RMSEP was reduced from 0.255 to 0.178 8. The performance of this algorithm in the two data sets is better than the three algorithms compared.

    Feb. 01, 2022
  • Vol. 42 Issue 2 440 (2022)
  • Jiong YANG, Zhi-li QIU, Bo SUN, Xian-zi GU, Yue-feng ZHANG, Ming-kui GAO, Dong-zhou BAI, and Ming-jia CHEN

    Tracing the origin of unearthed jade is one of the keys to exploring Chinese jade civilization's origin and evolution. The progress of non-destructive testing technology has promoted the research on tracing the origin of unearthed jade in academic circles, but so far, non-destructive technology is still the bottleneck restricting the research on tracing the origin of unearthed jade. In this paper, the combination of portable Fourier transform infrared spectroscopy (p-FTIR) and portable X-ray fluorescence spectroscopy (p-XRF), were used to study the mineral phase and chemical composition of serpentine jade from Dawenkou Culture excavated by the Shandong Institute of Cultural relics and Archaeology. The results show that there are two genetic types of unearthed serpentine jade in Dawenkou Culture. Seven serpentine jades (M1005:3, M1006:4, M1013:12, M20:30, M11, T333:2B①:2, M49:04) belong to ultrabasic rock type. They have high contents of Fe, Cr and Ni, and contain more magnetite inclusions with strong magnetism. The Cr/Ni value is less than 1 and most of them are less than 0.7, which is consistent with the origin characteristics of modern Taishan jade that provides an important scientific basis for Taishan jade to be used in the Dawenkou Culture period 5500 years ago. The other four jades (M2004:1, B-ring, M25:26, M26) have low contents of Fe, Cr and Ni, which belong to the type of dolomite contact metasomatism in which their sources need to be further studied and confirmed. The above research results confirm that the combination of p-FTIR and p-XRF can realize the rapid identification of most unknown jade materials in archaeological sites and collections. It has the advantages of no sample preparation, mutual verification of mineral types and element compositions, and no fluorescence interference. It can trace the origin of some specific types of serpentine jade/materials, which is an advantageous technology mix for the research on the unearthed jade.

    Feb. 01, 2022
  • Vol. 42 Issue 2 446 (2022)
  • Shuo LI, Jun-xing WANG, Yue HE, Zheng-qiang LI, and Cheng-lin SUN

    Linear polymers are characterized by their high intensity and information-rich resonance Raman spectroscopy,which has applications in biology, photoelectric materials and medicine. However, β-carotene molecules with conjugated double bonds are the most representative of polyene molecules. It is worth researching the effects of π-electron and CC vibration interaction on absorption spectrum and Raman spectroscopy, and the effects of resonance enhancement effect and electron-phonon coupling on the relative intensities, frequency and line shape Raman spectra. The resonance Raman spectra and UV-visible spectrum of β-carotene in 1,2-dichloroethane solution are obtained from the 283 to 223 K temperature range. We research the effects of the resonance effect and electron-phonon coupling on absorption and Raman spectra. With decreasing temperature, the Huang-Rhys decreases, indicates the CC bond vibration weakened and the molecular system energy decreases, which cause the absorption spectra redshift; in addition, with decreasing temperature, the degree of structural order of molecule increases, indicates the electron-phonon coupling interaction increases, which enhance the effect of electronic energy gap on the CC vibration, so, the Raman frequency shifts to the lower wavenumber, namely, the Raman spectra redshift. Calculations show that as the temperature decreases, the Raman scattering cross-section of the CC bonds increases, the Raman bandwidths of the CC bonds narrow, the ratio of overtone to fundamental mode increases. We compare and analyze the effects of resonance effect and electron-phonon coupling on the Raman cross-section, linewidth and the intensity ratio of overtone to the fundamental mode of Raman spectra. Although both the resonance effect and electron-phonon coupling can influence the Raman spectra at different temperatures, the resonance effect is more significant than the electron-phonon coupling for the Raman spectra, and electron-phonon coupling is more negligible effective on harmonics. With the temperature decreasing, the redshift of the absorption spectrum makes the 514.5nm excitation light in the Raman spectra closer to the 00-absorption peak, which significantly enhances the resonance effect of the molecule and makes the Raman scattering cross-section, linewidth, and the intensity ratio of the frequency of the overtone to fundamental modes significantly change with the temperature. The researches of electron-phonon coupling and resonance effect provide some experimental and theoretical basis for studying the effects of temperature on the properties of linear polyenes such as carotene.

    Feb. 01, 2022
  • Vol. 42 Issue 2 454 (2022)
  • Yu HAN, Shao-zhong SONG, Jia-huan ZHANG, Yong TAN, Chun-yu LIU, Yun-quan ZHOU, Guan-nan QU, Yan-li HAN, Jing ZHANG, Yu HU, Wei-shi MENG, Huan-jun LIU, Yi-xiang ZHANG, and Jia-yi LI

    The yield of soybean will drop dramatically due to disease during its growth. If the disease is not identified in time and no corresponding pesticides are sprayed, severely diseased soybeans can even be wiped out. It is very important to identify the disease species and apply the insecticide rationally to prevent the further development. Currently, it will take two days to make the pathogenic and polymerase chain reaction (PCR) identification of soybean bacterial diseases. Therefore, the method of quickly detecting the types of soybean diseases has become one of the key links in the intelligent agricultural production of this crop. Raman spectroscopy is used to rapidly diagnose soybean diseases. The molecular space structure of N-acetylmuramic acid is constructed, density functional theory (DFT) with B3LYP/6-31+(d,p) basis set was used to do the theoretical calculation. Through theoretically calculating the Raman spectra of soybean bacterial spot disease marker N-acetylmuramic acid, the characteristic peaks of the vibrational Raman spectra and their corresponding molecular structures of N-acetylmuramic acid are identified. The calculated Raman spectra should be corrected using the correction factor, and the correction factor is 0.985 7. In addition, the experimental Raman spectra of N-acetylmuramic acid are obtained using micro-zone three Grade Raman spectroscopy technology. The process of smoothing, baselines removal and wavenumber range interception was used to preprocess the spectra. The comparative analysis of theoretical and experimental results determines the characteristic peaks of vibrational Raman spectra and the corresponding molecular structures. The peak wavenumber difference is mostly 0~10 cm-1. The experimental data is consistent with the theoretical calculation results. The results show that the N-acetylmuramic acid molecule, a marker of bacterial spot in soybean, contains 15 characteristic peaks in the range of 200 to 1 650 cm-1, which can be used as a diagnostic basis. The main peak assignment at 229 and 763 cm-1 were attributed to the methyl swing vibration and ring breathing vibration. The spatial structure parameters of 15 vibration peaks such as bond length, bond angle and dihedral angle are given to identify the structure of the N-acetylmuramic acid molecule. The results also proved that the Raman spectroscopy of soybean with a variety of biomolecules could be used to screen the Raman spectroscopy of N-acetylmuramic acid, and it could effectively identify bacterial disease. Raman spectroscopy rapid detection technology is a new method for soybean disease detection and diagnosis, which plays a part in protecting healthy products in the field of intelligent agriculture. The results should be better combine with machine learning methods in spectral analysis and identification. Exploring a fast, accurate and convenient method could obtain a lot of benefits in intelligent agriculture, which plays a vital role in promoting the development of agriculture in China.

    Feb. 01, 2022
  • Vol. 42 Issue 2 459 (2022)
  • Juan FU, Jia-mei MO, Yi-song YU, Qing-zong ZHANG, Xiao-li CHEN, Pei-li CHEN, Shao-hong ZHANG, and Qiu-cheng SU

    Natural gas hydrate is unconventional energy with huge energy and source potential. In 2017 and 2020, two exploratory trials of marine hydrate in the South China Sea were successful. The incident accelerated the development of China's natural gas hydrate project. Carbon dioxide replacement and recovery technology can develop natural gas energy sources in a dense solid phase stored in natural gas hydrates and store CO2 greenhouse gases in the ocean. The separation of CO2 from flue gas by forming hydrates is becoming a promising new separation technology. The microstructure and properties of CO2 molecules in gas hydrates are still unclear, and the practical application of CO2 technology has certain unknown effects. In this paper, 13C solid-state nuclear magnetic technology (NMR) and Raman spectroscopy (Raman) technology were used to characterize CO2 molecules from CH4 hydrates replaced by CO2 gas and the synthesized 13CO2-H2-CP hydrates. The content of CO2 molecules stored in hydrate crystals was tested, the distribution of CO2 molecules stored in the hydrate cage was analyzed, and the structureal characteristics of CO2 molecules in gas hydrates were obtained. The results show that: (1) The 1 277.5 cm-1 peak integration of the Raman Fermi low-frequency resonance is used in CH4 hydrates replaced by CO2 gas to obtain CO2 molecules occupied in the 51262 cages and CH4 molecules occupied in the 512 and 51262 cages. They are 0.978 2, 0.059 3, and 0.009 5, respectively. The hydration number of the hydrate formed is 7.61. The 1 381.3 cm-1 peak integration of the Raman Fermi high-frequency resonance is also used to obtain CO2 molecules occupied in the 51262 cages and CH4 molecules occupied in the 512 and 51262 cages. They are 0.984 3, 0.023 7, and 0.003 3, respectively. The hydration number of the hydrate formed is 7.70. The large cages (51262 cages) of the CO2 hydrate formed are almost filled with CO2 molecules. After the replacement, the addition of CO2 molecules in hydrate crystals will cause occupancies of CH4 in the large cages and small cages (512 cages) of the CH4 hydrate crystals formed by replacement to be greatly reduced. The hydration number of the CH4 hydrate formed by replacement is slightly lower than that of methane hydrate before the replacement. NMR is difficult to detect that the CO2 molecular signal was coming from the CO2 hydrate formed by unlabeled CO2 molecules. After CO2 gas replacement, the occupancy rate of CH4 in the small cage and the large cage is only 0.097 5 and 0.317 2, respectively. The occupancy rates obtained by the above two peak integration methods are not the same. The main reason for this difference is that NMR detected no unlabeled CO2 molecular signal. (2) The Raman Fermi low-frequency resonance 1 273.4 cm-1 peak integration method was used the synthesized 13CO2-H2-CP hydrates and the occupancy rates of H2, CO2 in 512 cages, and CP in 51262 cages were obtained with results of 0.124 8, 0.304 2, and 0.997 8, respectively. The hydration number from the hydrate formed is 9.16. The Raman Fermi high-frequency resonance peak integration method of 1 380.6 cm-1 was also used, and the occupancy rates of H2, CO2 in 512 cages, and CP in 51262 were obtained, respectively, which were 0.123 6, 0.577 1, and 0.985 1, respectively. The hydration number from the hydrate formed was 7.12. The results show that 13C-labeled CO2 molecules can obtain better solid-state NMR resolution in the synthesized hydrates. This paper confirms for the first time that the chemical shift of CO2 molecules from type Ⅱ small cages is 124.8 ppm, and it is calculated that the small cage occupancy rate of CO2 is 0.783 1, the large cage occupancy rate of CP is 0.971 8, and the hydration number is 6.70. The results show that the Raman high-frequency Fermi resonance peak (1 380.6 cm-1) is closer to the 13C-labeled NMR result. (3) This paper assigns the 13C NMR chemical shift of CO2. The results in this paper provide a reference for CO2 hydrate research used by 13C NMR technology. In addition, combined with the comparative analysis of Raman and 13C NMR, it provides another reference for the quantitative study of CO2 hydrate used by Raman technology.

    Feb. 01, 2022
  • Vol. 42 Issue 2 464 (2022)
  • Xing-hu FU, Zhen-xing WANG, Jia-xuan LI, Shuang-yu MA, Guang-wei FU, Wa JIN, Wei-hong BI, and Yan-hua DONG

    In this paper, nano-silver sol substrate and micro-cavity fiber surface-enhanced Raman scattering (SERS) substrate were prepared by chemical methods. The micro-cavity structure was obtained by etching with hydrofluoric acid (HF). The experiment adopts wet detection. Firstly, the nano-silver sol substrate is mixed with Rhodamine 6G (R6G) to find the bare fiber micro-cavity structure with the strongest enhancement effect. Based on this structure, fiber SERS substrate coated with silver nanoparticles was prepared by using the sol self-assembly method and the self-assembly time was controlled to prepare different fiber SERS substrates (Ag/Fiber-x, where x is the self-assembly time 10, 20, 30, 40, 50 and 60 minutes). Using 10-3 mol·L-1 R6G as probe molecule, the Ag/Fiber-x substrate was screened to obtain Ag/Fiber-30 with the strongest enhancement effect. The SERS performances of nano-silver sol and Ag/Fiber-30 substrate were studied by detecting R6G solutions of different concentrations. The experimental results showed that under the same experimental conditions, the detection limits (LOD) of nano-silver sol substrate and Ag/Fiber-30 substrate for R6G are 10-6 and 10-9 mol·L-1, respectively. The Raman intensity and concentration of the two substrates were logarithmically transformed and fitted at the Raman shift of 1 362 cm-1. The R2 of Ag/Fiber-30 substrate can reach 0.975 3, which was much higher than nano-silver sol substrate. The Raman signal reproducibility test results showed that the RSD values of two substrates at each characteristic peak are within a reasonable range, but the RSD value range of Ag/Fiber-30 substrate was small. The stability test results of two substrates showed that the comprehensive Raman strength of nano-silver sol substrate at 1 362 cm-1 decreased by 45.90% after 35 days. The comprehensive Raman strength of Ag/Fiber-30 substrate at 1 362 cm-1 decreased by 17.58% after 35 days. These results indicated that the Ag/Fiber-30 substrate has long-term stability. Simultaneously, the relative enhancement factor (REF) of two substrates were calculated. For R6G solution with a 10-6 mol·L-1concentration, the REF values of nano-silver sol substrate and Ag/Fiber-30 substrate were 3.49×10⁶ and 2.14×10⁷. It showed that for the same concentration of R6G solution, the Ag/Fiber-30 substrate has a stronger enhancement effect. It is an order of magnitude higher than the nano-silver sol substrate. By comparing the SERS performance of the two substrates, the results show that Ag/Fiber-30 substrate has higher sensitivity, better reproducibility and long-term stability. So, the fiber SERS substrate coated with silver nanoparticles has potential application value in trace detection, such as pesticide residue chemical analysis, biomedical detection and so on.

    Feb. 01, 2022
  • Vol. 42 Issue 2 470 (2022)
  • Xiao-ming WAN, Wei-bin ZENG, Mei LEI, and Tong-bin CHEN

    The arsenic (As) hyperaccumulator Pteris vittata has super As accumulation ability and huge biomass, thus being ideal plant material for the phytoremediation of As-contaminated soil. Phytoextraction technology based on As hyperaccumulator P. vittata has been applied to more than 20 soil remediation projects in China. So far, the reported P. vittata populations all showed strong accumulation ability of As, and this hyperaccumulation ability was able to be stably inherited from the progenitor. How can this fern pass As hyperaccumulation ability on to the next generation through spores (the germ cell of fern plants) with the size of several micrometers? Compared to the traditional chemical analysis methods, Synchrotron Radiation X-ray Fluorescence Microprobe Analysis and X-Ray Absorption Spectroscopy show high sensitivity and are easy to operate, recently widely used to study hyperaccumulating mechanisms. This study investigated the micro-distribution pattern of As in spores using Synchrotron Radiation X-ray Fluorescence Microprobe Analysis micro-speciation of As in spores using Synchrotron Radiation X-ray Absorption Spectroscopy. The distribution of As was compared to that of potassium, calcium, iron, sulfur, copper and zinc. It has been found that the distribution of As, sulfur, and calcium was similar. It was indicating the role of their interaction in the stable inheritance of As hyperaccumulation. The micro speciation analysis indicated that the main species of As in spores and sporangium was arsenite (AsⅢ). Considering that AsⅢ has higher mobility and toxicity than arsenate in most organisms, the results indicated high tolerance of P. vittata to As throughout its life cycle. Using X-ray Fluorescence Microprobe Analysis and X-ray Absorption Spectroscopy with high resolution, results provide basic information for understanding the genetic characteristics of arsenic hyperaccumulation ability of P. vittata.

    Feb. 01, 2022
  • Vol. 42 Issue 2 478 (2022)
  • Jian-han CONG, Yun-jing LUO, Xiao-hua QI, Ming-qiang ZOU, and Chen-chen KONG

    Based on gold nanoclusters (AuNCs) with good optical stability, biocompatibility and simple and non-toxic preparation method, this paper developed a highly selective, highly sensitive and visualized uric acid (UA) sensor. We synthesized BSA-AuNCs using bovine serum albumin (BSA) as a template. Under the catalysis of urate oxidase, UA produces stoichiometric hydrogen peroxide (H2O2), which causes the fluorescence of AuNCs to be quenched. In addition, we found that BSA-AuNCs mimic the peroxidase activity in this system, catalysing the substrate's oxidation 3,3',5,5'-tetramethylbenzidine (TMB) to ox-TMB by H2O2. At this time, the emission spectrum of BSA-AuNCs overlaps the absorption spectrum of ox-TMB, and a kind of fluorescence resonance energy transfer (FRET) occurs. BSA-AuNCs acts as a donor to transfer the excitation energy to the acceptor ox-TMB, which makes ox-TMB produce fluorescence. At the same time, the fluorescence intensity of BSA-AuNCs is significantly lower than when it exists alone, which significantly improves the sensitivity of UA detection. Under optimum conditions, it is found that the UA concentration has an excellent linear relationship between the quenching degree of 2~100 μmol·L-1, the linear equation is (F0-F)/F0=0.005 85cUA+0.103 64, the linear correlation coefficient is 0.995 4, and the detection limit is 0.26 μmol·L-1, which is far below the minimum limit of normal human UA levels (90 μmol·L-1). Meanwhile, the recovery of UA in blood samples was studied, and the recovery rate was 97.3% to 104.7%, indicating that this method is effective in clinical blood samples. The detection has tremendous application potential, and provides an excellent theoretical basis and methodological guidance for further clinical analysis.

    Feb. 01, 2022
  • Vol. 42 Issue 2 483 (2022)
  • Yuan LI, Yao SHI, Shao-yuan LI, Ming-xing HE, Chen-mu ZHANG, Qiang LI, and Hui-quan LI

    Zinc smelting leaching slag is the solid smelting waste produced by the hydro-zinc smelting process, accounting for more than 75% of the total output of zinc smelting solid waste. Because it contains Zn, Cu, Pb, Ag, Cd, As and other valuable metals elements, it has great potential in resource utilization. However, due to its unstable composition content and insufficient detection accuracy, it is not easy to guarantee the resource conversion efficiency of key elements. Therefore, accurate quantitative analysis of the key resource components of the leaching residue is of great significance in the green development of zinc smelting. In this paper, five target elements of Zn, Cu, Pb, Cd, and As are the analysis objects,the method of XRF working curve and the method of XRF combined with RBF neural network model used to quantitatively analyze the target elements of the leaching residue. The relative error and Relative standard deviation are used as evaluation indicators of the two methods to compare the performance of the two methods. First, the concentration gradient samples of zinc leaching residue collected in the industrial field were prepared by standard addition method, used as standard sample and detected by ICP-OES. Then the detection result of ICP-OES is used as the reference value for the quantitative analysis of the target element, the concentration gradient sample is detected by X-ray fluorescence spectroscopy (XRF), to establish the working curve of target elements, the working curve is used to analyze each target element quantitatively. At the same time, the XRF spectrum data is used to construct the input matrix, the target element concentration of the sample is used to construct an output matrix, and the RBF neural network is trained to construct the multi-element calibration model of the target element in the leaching residue. This model is used to realize the target element prediction of the leaching residue sample. Compared with the ICP-OES reference value, the average relative error and standard deviation of the working curve method are 8.5% and 4.0%, respectively; Compared with the ICP-OES benchmark value, the average relative error and standard deviation of the RBF neural network are 0.18% and 0.58%, respectively. The results show that both methods can achieve the quantitative analysis of target elements of the leach residue samples, but XRF combined with RBF neural network can achieve the accurate quantitative analysis and matrix correction of the leach residue samples. The accuracy and precision of the analysis results are better than the traditional working curve analysis methods.

    Feb. 01, 2022
  • Vol. 42 Issue 2 490 (2022)
  • Chuan-qi SHI, Yan LI, Shao-peng YU, Bao-zhong HU, Hui WANG, and Liang JIN

    In engineering construction, foundation pit drainage is a necessary measure to ensure the safety of the foundation pit. The water discharged into the urban inland river impacts the ecological safety of the inland rivers and downstream water. In this study, the drainage water from the foundation pit (W1), 100 m upstream of the drainage outlet (W2), the drainage outlet (W3), 50 m downstream of the drainage outlet (W4), 100 m downstream of the drainage outlet (W5) and 200 m downstream of the drainage outlet (W6) were collected in the process of construction in Eurasian Window Park reach of Hejia river, Harbin city. Three-dimensional fluorescence spectrum - parallel factor analysis method was used to determine the fluorescence spectrum characteristics of dissolved organic matter (DOM), analyze the composition and source of DOM, and explore the impact of foundation pit drainage on the urban inland water environment. The results showed that the humification index (HIX) of inland water was in the range of 0.337~0.381, and the humification degree was low. There was no significant difference in the HIX of W1, W3~W6, which was significantly lower than W2, indicating that drainage further reduced the humification degree of inland water. The fluorescence index (FI370) was in the range of 2.330~2.900, and the biological index (BIX) was 0.897~1.140. The FI370 and BIX of W1 and W2 were significantly higher than those of W3~W6.Both of them had strong autochthonous characteristics, which indicated that the drainage reduced the autochthonous characteristics of the downstream water. The water DOM identified two types of four organic components: visible fulvic-like component (C1), tryptophan-like component (C2), ultraviolet fulvic-like component (C3) and tyrosine-like component (C4), namely fulvic-like substance (C1, C3) and protein-like substance (C2, C4). There was a negative correlation between the two types of substance. The correlation between FI370 and four organic components was very significant, indicating that DOM's composition was simple. W2 had a relatively high DOM concentration, while the DOM concentration downstream of the outlet was low and stable. Protein-like substances occupied a relatively high proportion in the upstream water. In W4, there was no significant difference in the relative proportion of the four organic components. In W5 and W6, the relative proportion of fulvic-like substance increased later, which also indicated that the drainage of the foundation pit led to the decrease in the autochthonous characteristics of inland water. Except for the increase in pH value, the contents of dissolved oxygen (DO), total N, total P and other physicochemical indexes of downstream water samples decreased. pH value was positively correlated with fulvic-like substance and negatively correlated with protein-like substance, while DO, chemical oxygen demand and water nutrient indexes were contrary. The correlation between water DOM components and physicochemical indexes was different, directly or indirectly affecting the DOM composition. Therefore, in engineering construction, the drainage of the foundation pit reduced the DOM concentration and changed the DOM composition of urban inland water.

    Feb. 01, 2022
  • Vol. 42 Issue 2 498 (2022)
  • Feng SUN, Ruo-su WANG, Ya-xin LIANG, Jia-ru LIU, Xue YAO, and Fan ZHAO

    Shuining Temple in Bazhong is famous for its wide range of themes, diverse forms and exquisite carving. However, the wet environment, unstable cliff body and the semi-open preservation environment caused serious damage to the stone carvings of Shuining Temple, which affected the artistry of the stone carvings. Therefore, the protection and restoration work of the cliff statues of Shuining Temple is extremely urgent. In this paper, through the analysis of the pigments for the stone carvings in Shuining Temple, the information of the pigment is obtained, which, on the one hand, provides a scientific basis for the restoration of the pigments, and on the other hand, is conducive to the targeted protection of cultural relic workers, which is of great significance for the protection of cultural relics. This paper used superdepth three-dimensional video microanalysis, X-ray fluorescence spectrum analysis (XRF), X-ray diffraction experiment analysis (XRD) and laser Raman spectrum analysis to comprehensively analyze the main composition minerals of shuining Temple moyan pigment from the appearance, structure and composition of the material. The results showed that the main mineral of sample No.1 was yellow ochre, sample No.2 was leaden, sample No.3 was celadon, sample No.4 was lead sulfate, sample No.5 was lapis lazuli, sample No.6 was goethite, and dihydrite was the white powder layer under the pigment layer. Due to the long-term exposure of the statues to the damp and semi-open environments, a few pigments could not be directly detected as standard substances, so secondary analysis should be conducted according to relevant data. For example, the main component of yellow ochre detected due to long-term weathering was Fe2O3. K2PbO2 and PbO2 were decomposed under the environmental conditions of moisture and microbial presence. Goethite is produced by a chemical reaction of hematite or pyrite. In addition, by comparing the synthetic time of artificial lapis lazuli with the excavation age of the statue, and by detecting the element Fe, which implies that pyrite is the main component of Venus in natural lapis lazuli, we can judge that the pigment of this sample is made of natural lapis lazuli, which enriches the use cases of natural lapis lazuli.

    Feb. 01, 2022
  • Vol. 42 Issue 2 505 (2022)
  • Jing ZHAO, Bei MA, Ming LIU, Zhen-zhen LIU, Gang LI, Zhe LI, and Yi-min WANG

    Coronary heart disease (CHD) is a serious complication of hypertension disease (HD). But this complication can not get timely detected, which is likely to cause serious events and result in extremely high disability rates and mortality. Therefore, early screening is important to provide early intervention to prevent the occurrence of serious events. Tongue manifestation can reflect the condition of the heart. In this paper, we applied tongue hyperspectral imaging to the early screen of the HD complicated with CHD patients. Hyperspectral data of 154 samples were collected from the department of cardiology. The wavelength range of hyperspectral data is 377.38~1 049.1 nm. The correlated clinical diagnosis was also recorded. Hyperspectral data of the tongue was separated into five parts according to the Chinese medicine theory, which included tongue tip, tongue left, tongue middle, tongue right and tongue root. There are maximum and minimum values at 509.6, 561.2, 540.5 and 576.7 nm. Moreover, this is consistent with the light absorption characteristics of hemoglobin.Then different tongue parts of the two groups were compared. The T-test results showed that there were significant differences between tongue tip and tongue middle in the wavelength region of 500~600 nm. Backpropagation artificial neural network (BPANN) was employed as an identification method for the screening whether or not complicated with CHD. The optimal results of screening model are obtained with an accuracy of 84.78%, sensitivity of 86.95%, and specificity of 82.61%, respectively. Experiment results showed that there were significant differences between HD and HD-CHD hyperspectral data, and hyperspectral imaging of the tongue provides a possible way for screening HD complicated with CHD among HD patients.

    Feb. 01, 2022
  • Vol. 42 Issue 2 512 (2022)
  • Dan-ping WEI, and Guang-hui ZHENG

    In recent decades, reflectance spectroscopy technology has developed rapidly and has been widely used in soil science, especially soil property estimation. It can greatly reduce the manpower and material resources consumed by traditional chemical measurement methods as an effective method to estimate total phosphorus content in soil. In this paper, 147 soil samples were collected from 30 sampling sites in coastal soil of Jiangsu Province, China. The spectral data and total phosphorus content of the soil were measured, respectively. Three different sample set partitioning methods were performed on the original spectral data and six different spectral transformation results, including Random Sampling (RS), Kennard-Stone (KS) and Sample Set Partitioning Based on Joint X-Y Distance Algorithm (SPXY). In order to compare and analyze the influence of three sample set partitioning methods on the accuracy of estimation results, partial least square regression(PLSR) and support vector machine(SVM) methods were used to establish the estimation models of total phosphorus content in the soil. The results are as follows: (1) Under the condition of original spectral data, the RS method can obtain better results and more stable model accuracy in most cases for PLSR, which is superior to KS and SPXY. In the SVM model, the result obtained by SPXY method is the best, KS is the second, RS is the worst. (2) The appropriate spectral transformation methods for different sample set partitioning methods are also different. Among the three sample set partitioning methods, the optimal spectral transformations of PLSR and SVM are respectively the reciprocal of logarithm and the first derivative (KS method), the original spectrum and the first derivative (RS method), the first derivative and multiple scattering correction (SPXY method). Using the KS method to divide the sample set, PLSR and SVM model can obtain the optimal prediction results. Not all spectral transformation methods can improve the model accuracy. The prediction accuracy of the PLSR model is significantly reduced after partial spectral transformation. (3)Among all sample set partitioning methods, SVM has a better modeling effect than PLSR. Using the RS method to divide the sample set, the prediction accuracy of PLSR is higher than that of SVM. The results were reversed when KS and SPXY were used. According to the comprehensive results, the best estimation model for the study area was obtained using the KS sample set partitioning method, and the first derivative transformation method, combined with the SVM method, the R2 of the prediction result was 0.82. This study shows that reflectance spectroscopy can effectively predict the total phosphorus content of the soil in coastal areas and have a certain guiding significance for the efficient and rapid inversion of soil phosphorus.

    Feb. 01, 2022
  • Vol. 42 Issue 2 517 (2022)
  • Spectral characteristics are the inherent attributes of ground objects. Analyzing spectrum is help to improve the accuracy of ground objects recognition and a basis of quantitative remote sensing. However, limited by scale effect, the spectrum acquired in near-earth space is often quite different from that of remote sensing pixels. Therefore, revealing the spectral characteristics of typical wetland landscapes on the scale of remote sensing pixels is useful to improve the accuracy of large-scale wetland remote sensing classification and inversion of vegetation parameters. Based on the satellite-borne EO-1 Hyperion data, the reflectance of lotus field, reed land, woodland, paddy, highland, construction land, river, lake and pond were extracted from Lake Nanyang, one of the grass lake wetlands in North China Plain.The spectral characteristics of the pixel-scale ground objects were quantitatively analyzed by using the first derivative of the spectrum and calculating a variety of hyperspectral vegetation indexes. The results showed that: (1) The reflectance spectrumof eight wetland landscapes were significantly different, andthere were also differences in the 5 vegetation types. The reflectance of the lotus field was significantly higher than that of other landscapes in the whole wave-band range. It sreflective peak in the green band and absorptive valley in the red band was the most obvious. The reflectance spectrum of the reed field and paddy were similar in visible light and red edge region. The reflectivity curves of paddy and upland farms were different, and the green paddy's reflective peak was higher than that of upland. (2) The first derivative spectrum of eight landscapes were obviously different at the blue, yellow, and red edge regions, especially at the red edge.The red edge slope of the lotus field was the largest, and the red edge position was obviously blue shift (712 nm), indicates that it has high chlorophyll content and the best health condition. The red-edge slope of woodland was the second, but its red edge position was an obvious red-shift (722 nm). (3) Woodland hadthe highest vegetation index, the vegetation index of water bodies and construction mode rate landscapes land was low, and other. There was no significant difference in the mean values of indexes related to normalized difference vegetation index (NDVI) among reed land, paddy, upland and lotus fields, but only in the Enhanced Vegetation Index (EVI) and Chlorophyll Index RedEdge 710. It suggested that EVI and Chlorophyll Index RedEdge 710 index can more effectively indicate the difference of greenness and coverage between wetland vegetation types. The research has great significance for the high-precision classification wetland of and inversion of vegetation parameters.

    Feb. 01, 2022
  • Vol. 42 Issue 2 524 (2022)
  • Teng NIU, Jie LU, Jia-xin YU, Ying-da WU, Qian-qian LONG, and Qiang YU

    Water conservation in forest ecosystems has ecological functions such as regulating climate and maintaining ecological water balance. As an alpine region, the Qinghai-Tibet Plateau cannot manually observe water conservation on the spot due to its high altitude and harsh environment. In order to better obtain water conservation in alpine regions, remote sensing technology is introduced, and the value of water conservation in a specific area is obtained through remote sensing inversion. This study takes Nyingchi Bayi District as the study area. The study area uses four types of vegetation: Nyingchi Spruce, Alpine Quercus, Alpine Pine and Snow Rhododendron as the main tree species. Remote sensing images cannot directly obtain water conservation information, but the value of water conservation can be inverted by constructing a quantitative relationship between vegetation leaf spectral information and water conservation. To study the quantitative relationship between different vegetations and water conservation, collect 1 000 leaf samples and water conservation data from 10 sampling points for each vegetation, use ASD spectrometer to obtain hyperspectral data, select fitting parameters through correlation, and build a regression model of water conservation. The Sentinel-2 remote sensing image was used to invert the water conservation distribution of vegetation in the study area, and the inversion results were verified. The results show that the reflectance spectra of the four types of vegetation leave all show similar regularities. The difference is not obvious in the visible light band, and there are four obvious water absorption bands in the near-infrared to the mid-infrared band (700~1 400 nm), and the reflectivity in the red to near-infrared band highest. The spectral reflectance showed the order of Alpine Quercus>Alpine Pine>Lingzhi Spruce≈Snow Rhododendron. Through experiments, the vegetation canopy interception, litter water holding capacity and soil water content are obtained. The sum of the three represents the water conservation capacity of the vegetation, and the relationship between the spectral characteristics of the vegetation and the water conservation capacity is analyzed. Moreover, through the Pearson coefficient to evaluate the quantitative relationship between band parameters and water conservation, it is determined that the four parameters R540, R1 950, NDWI and NDVI are significantly related to water conservation. Based on the above parameters and the water conservation of the four types of vegetation, a regression model of water conservation was constructed. The vegetation water conservation in the study area was inverted through the model to verify the simulation accuracy. The overall inversion accuracy R2 is greater than 0.7, and the RMSE is less than 10. It shows that the prediction model has a good inversion effect, and the model can effectively estimate the water conservation of the forest ecosystem.

    Feb. 01, 2022
  • Vol. 42 Issue 2 530 (2022)
  • Yi-heng WANG, Kun SUN, Zhe WEN, Ying-bo SUO, Qu ZHANG, Ge-rong WANG, and Jin-hua WEI

    Spectral imaging technology is widely used in the field of non-invasive determination of physical and chemical parameters of plants, and scholars have also explored the correlation between pigments and color parameters. However, it has not been reported that the models fitted using color parameter values and spectral parameter values as independent variables and pigment content, respectively, are compared and optimized. In this experiment, five conifer species were used as research objects, and 11 spectral vegetation parameters, including blue edge amplitude Db, yellow edge amplitude Dy, red edge amplitude Dr, green peak amplitude Rg, red valley amplitude Rr, blue edge area SDb, yellow edge area SDy, red edge area SDr, ratio vegetation index RVI, difference vegetation index DVI, and normalized vegetation index NDVI, were screened as the basis of spectral analysis in this paper. The measured conifer color parameter values and spectral parameter values were used as independent variables, respectively. Stepwise multiple linear regression (SMLR) was used to estimate the pigment content to establish a model, with R2 and RMSE as evaluation criteria, and the parameter combinations with the highest model accuracy were compared and selected for practice. The results of the study indicate that: (1) There are differences in leaf pigment content, color phase parameter values, and reflectance spectral between tree species (pPinus koraiensis Sieb. et Zucc. was significantly lower in Pinus sylvestris var. mongolicaLitv., Pinus banksiana Lamb and Pinus densifloraSieb. et Zucc. (pL, a* and L, a*, b*, and S color parameters as independent variables, respectively, the fitted model R2 was the highest, 0.588 and 0.638, respectively. In contrast, carotenoids, chlorophyll a, and chlorophyll b were all combined with FD652, FD700, SDb, SDy, RVI, DVI, and NDVI spectral parameters as independent variables. The fitted model R2 was the highest, 0.779, 0.786, and 0.774, respectively. In this study, a hyperspectral camera, color difference instrument and UV-Vis spectrophotometer were used to realize rapid prediction of needle pigment content. Based on a significant correlation between color parameter value and spectral value and pigment content, the parameter combination with the highest accuracy of the established model was successfully selected. Different methods and parameter values could be selected according to the accuracy requirements and research conditions in predicting of needle pigment.

    Feb. 01, 2022
  • Vol. 42 Issue 2 537 (2022)
  • Qiu-mei XU

    When a metal surface is bombarded by slow, highly charged ions (SHCIs), atomic particles ejected from the sample, and then some of them in excited states undergo radiative de-excitation resulting in optical emission. SHCIs will capture one or more electrons from the surface into its excited state during the interaction. Then some exciting projectiles undergo radiative de-excitation and result in the optical emission. Previous reports showed that the nuclear stopping power is closely related to the sputtering yields. In order to arrive at a better understanding of the electronic excitation of the sputtered particles, a correlation between the ion-induced photon emission and kinetic energy and potential energy is required. We have investigated the interaction between 260~520 keV Krq+ (8≤q≤17) ions and an aluminum target in the present work. A spectrum in the wavelength range of 300~550 nm was obtained by 520 keV Kr13+bombardment. The spectral lines included the resonance transitions of sputtered Al atoms at 309.0, 395.9 nm, Al+ and Al2+ ions at 358.3 and 451.6 nm, and Kr+ ions at 430.0, 434.1, 465.8, 486.0 nm. The ratio of Y(309.0)/Y(395.9), Y(358.5)/Y(395.9), Y(452.8)/Y(395.9) are presented as a function of projectile kinetic energy and potential energy. The results showed that the ratios of Y(309.0)/Y(395.9), Y(358.5)/Y(395.9), Y(452.8)/Y(395.9) increased with the increase of the kinetic energy, while the ratio Y(309.0)/Y(395.9) decreased with the increase of the potential energy. It is concluded that, in the interaction between SHCIs and Al target, the kinetic energy (electronic stopping power) and the potential energy make Al atom excitation. Compared with the excited states Al(4s), the probability of higher excited state 3d increases with the increase of the electronic stopping power, decreases with the increase of the potential energy. In optical radiation, nuclear stopping power affects the sputtering yield, and the electronic stopping power and potential energy are closely related to the excitation probability. In the interaction of SHCIs with a metal surface, both kinetic energy and potential energy contribute to optical radiation. When the kinetic energy is the same order as the potential energy, the excitation probability originated from kinetic energy is two orders smaller than the potential energy.

    Feb. 01, 2022
  • Vol. 42 Issue 2 544 (2022)
  • Feng-xia CHEN, Tian-wei YANG, Jie-qing LI, Hong-gao LIU, Mao-pan FAN, and Yuan-zhong WANG

    As a famous wild edible mushroom, boletus has great edible and economic value. There are many kinds of boletus, and it is not easy to distinguish. An effective, rapid and credible species identification technology can be established to improve the quality of boletus.In this study, a total of 683 strains of 7 species of wild bolete from different regions of Yunnan were collected, the infrared and ultraviolet spectra of the samples were obtained, and the average spectral characteristics of different kinds of bolete were analyzed. Based on the single spectral data of multiple preprocessing combinations (SNV+SG, 2D+MSC+SNV, 1D+MSC+SNV+SG, MSC+2D) combined with two feature value extraction methods (PCA, LVs), the partial least squares discrimination analysis and random forest algorithm combined with data fusion strategy to identify the species of boletus.There is a certain degree of innovation. The results show: (1) The average spectral absorption peaks of different types of boletus in the mid-infrared spectrum and the ultraviolet spectrum have small differences, and the absorbance has subtle differences. (2) Appropriate preprocessing can improve spectral data information. The best preprocessing combination of mid-infrared spectral data and ultraviolet spectral data for partial least square discriminant analysis and random forest algorithm model is 2D+MSC+SNV, SNV+SG, 2D +MSC+SNV, 1D+MSC+SNV+SG. (3) The mid-infrared spectroscopy model is better than the ultraviolet spectroscopy model in the single spectrum model. The partial least squares discriminant analysis model of the best preprocessing combination of mid-infrared spectroscopy 2D+MSC+SNV has a correct rate of 99.78% in the training set and 99.12% in the validation set. The accuracy of the random forest model is 93.20% on the training set and 99% on the validation set. (4) The data fusion strategy improves classification accuracy. The accuracy of the low-level fusion partial least squares discriminant analysis model training set and validation set is 100%, 99.12%. The accuracy of the random forest model's training set and validation set are 92.32% and 99.14%. (5) Random Forest Algorithm Intermediate Data Fusion latent variable (LVs) training set 92.76%, validation set 96%; Intermediate Data Fusion principal components analysis (CPA) training set 97.15%, validation set 100%. (6) Partial Least Squares Discriminant Analysis Intermediate Data Fusion (LVs) training set is 100%, and validation set is 99.56%; the accuracy of intermediate data fusion (CPA) training set and validation set can reach 100%. Based on the discriminant analysis of the partial least squares method and random forest algorithm combined with data fusion strategy, the species identification of boletus is satisfactory. Partial Least Squares Discriminant Analysis Intermediate Data Fusion (CPA) can be used as a low-cost and high-efficiency technology for identifying boletus species.

    Feb. 01, 2022
  • Vol. 42 Issue 2 549 (2022)
  • Ge-lian GONG, Li-bing YOU, Cong-ying LI, Xiao-dong FANG, and Wei-dong SUN

    The sample's elemental and isotopic content information can be obtained by inductively coupled plasma mass and optical emission spectrometry analysis of excimer laser ablated products. Excimer laser ablation coupled mass and optical emission spectrometry are among the most important analytical techniques suitable for in situ microanalyses. Excimer laser ablation based sampling technique coupled with either ICP mass spectrometry or optical emission spectrometry techniques have witnessed widely applications in geology, materials science, environmental science, and even life science research. The combination of excimer laser ablation sampling technique and plasma analysis techniques fully demonstrates their respective advantages: the former's in-situ sampling solid surface feature satisfying both the needs of evaluating elemental or isotopic concentration with high space-resolution and avoidance of polluted problem during sample pretreatment, furthermore, high-energy laser of pulse width ranging from nanosecond to femtosecond, low thermal effect resulting from ablation of solid sample surface and leading to less elemental or isotopic fractionation effects in laser ablation products which can fully represent the original elemental or isotopic information in analytes; either ICP mass spectrometry or optical emission spectrometry-based techniques have been applied successfully to investigate elemental or isotopic information in analytes, and the tandem of laser sampling technique with ICP mass technique have already produced various in-situ elemental and isotopic concentrations data in solid surface samples with high quality; simultaneously integrated ICP mass spectrometry with optical emission spectrometry has been recently proposed for chemical analysis in analyte, aiming at improve elemental and isotopic analysis accuracy and precision based on ICP mass and OES techniques. This paper introduces our instrumental construction solution of excimer laser ablation coupled with plasma mass and optical emission spectrometry analysis techniques, and the technical problems and key experimental verification of independent research and relevant developments have been summarized and prospected.

    Feb. 01, 2022
  • Vol. 42 Issue 2 555 (2022)
  • The pterosaur fossils in the Hami area of Xinjiang are very important. The Hami Pterosaur Fauna is mainly buried in the Yardang of the Early Cretaceous lacustrine strata and enriched in tempestite. Once exposed up the ground, the fossils will undergo different degrees of natural weathering, especially when exposed to water or moisture. Due to the action of groundwater and intermittent runoff, serious salt efflorescence was found at the bottom of Yardang near the No.2 water source of Dahaidao, which caused the spalling of rock and the collapse of the upper Yardang. The weathering phenomenon of different layers from bottom to top are quite different, and the most intense weathering is found in the bottom rock. By sampling along Yardang stratigraphic section, the lithology and soluble salt types of each layer are determined by using scientific analysis technology, from a microscopic perspective to explain the mechanism of weathering of this Yardang. Polarized light microscopic observation and X-ray diffraction (XRD) results show that each stratum contains quartz, feldspar, calcite, and clay minerals. It is no difference in mineral composition, but there is a great difference in clay content. Accurate methods for identifying soluble salts types include ion chromatography (IC) to determine the content and types of soluble salt ions, Raman spectroscopy (Raman) and Fourier transform infrared spectroscopy (FTIR) to identify nitrate and sulfate, and the Scanning Electron Microscopy Energy Spectrometer (SEM-EDS) to distinguish chloride, nitrate, and sulfate. The results show that the soluble salts in the lowest stratum are mainly NaCl and Na2SO4, the middle stratum is NaCl and CaCl2, and the upper stratum is NaCl. The difference in salt type/content in rock layers is important for diverse weathering setting. Combined with the climate and geographical environment of this Yardang (extremely arid area, near the water source), this paper discusses the law of water and salt activities linked to the weathering setting, and illustrates the main weathering mechanism this Yardang. The weathering reasons of Yardang are that, the internal cause is the different lithology of each sedimentary layers, and the external cause is the comprehensive effect of water and salts (NaCl, Na2SO4, CaCl2). The strong water and salt activity caused the serious chemical weathering of Yardang with Hamipterus fossils. This weathering mechanism can also explain the strong weathering of Hamipterus fossils and their surrounding rocks after undergoing moisture erosion.

    Feb. 01, 2022
  • Vol. 42 Issue 2 561 (2022)
  • Yan JIANG, Ling-lin MAO, Jun WU, Xi YANG, Lu-lu DAI, and Ming-xing YANG

    At present, modern testing technology is developing rapidly, providing a non-destructive research method for the processing technology and production source of ancient jade. Using infrared spectroscopy technology and energy dispersive X-ray fluorescence spectroscopy (EDXRF), five pieces of turquoise beads unearthed from tomb M52 in Haochuan Cemetery, Suichang County, Zhejiang Province, were non-destructively tested, hoping to determine their possible source of origin. Infrared spectroscopy characteristics show that sharp infrared absorption bands can be seen at 3 468 and 3 514 cm-1, which are caused by ν(OH) stretching vibration; ν(MFe, Cu-H2O) stretching vibration is visible near 3 058 cm-1, 1 014, 1 066 and 1 134 cm-1 are ν3(PO4) stretching vibrations. Compared with the standard turquoise infrared spectrum, the peak at 1 637 cm-1 is missing. Here is the δ(H2O) bending vibration, which may be related to the long buried time of the sample. In addition to the natural turquoise absorption peaks, absorption peaks appear at 2 890 and 2 838 cm-1, which belong to the asymmetric stretching vibration peak and symmetrical vibration peak of methylene (—CH2), which can also be observed near 1 452 cm-1. Its deformation vibration peak, in addition, visible ν(C=C) stretching vibration near 1 552 cm-1. These two absorption peaks of organic matter combined with the unearthed location in the red paint mark inferred that there might be traces of raw paint residue. The two group peaks are consistent with the infrared spectroscopy characteristics of urushiol, and there is a possibility that the sample is buried for too long and the lacquer decays in the soil and stains the surface of the sample. The EDXRF data shows that the main element content of the five samples is slightly lower than the theoretical value, the silicon content is slightly high, and there are silicon-containing impurity minerals. The content of zinc and barium in the trace elements is high, and the content of Zn is 1 151~1 540 mg·kg-1. The content of Ba is 1 910~3 570 mg·kg-1. Compared with previous literature, the element order of turquoise produced in Shiyan, Hubei Province and surrounding areas is closer. It can be used as evidence for judging the source of five turquoise beads. Observation of the production process of five turquoise beads through photomicrography shows that all five samples have directional polishing traces, and a certain number of obvious polishing facets can be seen, and there are line cutting traces on the edges, which proves the good performance at the time. The ancestors of Sichuan culture already can process and polish beads that are not more than 1 cm in length and width; the way to process the bead shape is to divide the irregular jade material into multiple small surfaces and polish until it becomes a barrel bead shape, instead of directly polishing the curved surface; Obvious planes can be seen around the drill hole. The shape of the hole is relatively regular, almost circular, which shows that the ancestors of Haochuan Cemetery already had drilling technology at that time. Studies have shown that the turquoise in Haochuan may come from the mining belt in Shiyan, Hubei and its surrounding areas. Since the Haochuan culture in southwestern Zhejiang, pure turquoise has been used as lacquer inlay decoration. During the burying process, the lacquer adhesion to green The surface of turquoise caused a certain amount of pollution. The craftsmanship of inlaid jade lacquerware was inherited from the Liangzhu culture, and the ancestors of Haochuan Cemetery already possessed a certain degree of turquoise processing ability. It lays the foundation for the further study of the source of the jade material of Haochuan culture and has a certain reference significance for the origin and exchange of culture in Haochuan and surrounding areas in archaeology.

    Feb. 01, 2022
  • Vol. 42 Issue 2 568 (2022)
  • Yan-han WU, Quan-li CHEN, An-di ZHAO, Xuan LI, and Pei-jin BAO

    Using conventional gemological methods, energy dispersive X-ray fluorescence spectrometer,laser Raman spectrometer, Fourier transform infrared spectrometer and fluorescence spectrometer to study the gemological characteristics of filled morganite and to explore effective non-destructive identification method of filling treated morganites. The results show that the refractive index of filled morganites (1.57) is slightly less than that of natural morganites. The SG values of the filled morganites range from 2.71 to 2.76. The natural morganites do not emit light under neither long-wave or short-wave UV radiation, but filled morganites show weak to medium white fluorescence under UV radiation. And the fluorescence of some samples is distributed along the fractures. After zooming in, fine reticular open cracks can be seen on the surface of partially filled morganites, and traces of glue filling can be seen in the cracks. Energy dispersive X-ray fluorescence spectrometer (EDXRF) shows Si, Al, Rb, Cs and other elements in filled morganites and natural morganites. The difference of Raman spectra between natural morganites and filled morganites is not obvious, and the effect of laser Raman spectrometer on distinguishing natural morganite and filled morganite is not obvious. The FTIR spectra of natural morganites are mainly in 1 300~400 cm-1, which is attributed to the structural vibration of Si—O—Si ring, Be—O and Al—O; in the 4 000~2 000 cm-1 functional group region, there is 2 359 cm-1 absorption peaks produced by CO2, 3 110 and 3 168 cm-1 absorption peaks produced by NaH. In addition to the vibration absorption of morganite itself, the absorptions of (—CH3—), (—CH2—) are common at 2 870, 2 930 and 2 965 cm-1, filled morganites have the absorption caused by benzene ring exists at 3 035 and 3 057 cm-1. Three-dimensional fluorescence spectrometer analysis shows that the fluorescence of natural morganites is very weak, without a characteristic fluorescence center, and the relative intensity is less than 500; the fluorescence centers of filled morganites are mainly single fluorescence center about 410 nm and double fluorescence center of 440 and 465 nm, with relative intensities exceeding 2 000. The relative intensity of the fluorescence center of filled morganite is significantly higher than that of natural morganite, which is attributed to the aromatic compounds in organic gum added during the filling process. Through Fourier transform infrared spectrometer and fluorescence spectrometer test, the spectrum analysis can be used as an effective and rapid non-destructive detection method to distinguish natural morganites and filling treated morganites.

    Feb. 01, 2022
  • Vol. 42 Issue 2 575 (2022)
  • Shuang QIN, Ming-liang LI, Yu-jia DAI, Xun GAO, Chao SONG, and Jing-quan LIN

    The content of Fe will affect the hardness of the aluminum alloy, and further affect the working life of aluminum alloy devices. Therefore, the detection accuracy of Fe content in the aluminum alloy is very important. In this paper, the detection accuracy improvement of Fe element in the aluminum alloy by millisecond laser-induced breakdown spectroscopy (ms-LIBS) under spatial confinement combined with support vector machine (SVM) was employed. Under the confinement of the plate space, the millisecond laser-induced aluminum plasma spectrum achieves spectral enhancement and the plasma radiation spectrum stability was improved. The spectral enhancement factors of the four characteristic spectral lines Fe Ⅰ 345.99 nm, Fe Ⅰ 369.51 nm, Al Ⅰ 394.40 nm, and Al Ⅰ 396.15 nm are 2.20, 2.14, 2.28, and 2.41, respectively. The calibration models for quantitative analysis of Fe in aluminum alloy based on external standard method and SVM were established. The standard external method was used to calculate the R2, RMSEC, RMSEP, and ARE of the Fe element with the plate space constraint of 0.893, 0.261 Wt%, 0.156 Wt%, 40.977%, and R2, RMSEC, RMSEP, and ARE without the plate space constraint were 0.852, 0.337 Wt%, 0.274 Wt%, 42.947% respectively. Under the constraints, the RMSEC of the SVM model was 0.086 Wt%, and the RMSEP was 0.043 Wt%. The SVM method was used to calculate the R2, RMSEC, RMSEP, and ARE of the Fe element with the plate space constraint of 0.984, 0.086 Wt%, 0.043 Wt%, 3.715%, and R2, RMSEC, RMSEP, and ARE without the plate space constraint were 0.941, 0.134 Wt%, 0.051 Wt%, and 12.353%. The results show that under space constraints, the use of ms-LIBS combined with the SVM method can greatly improve the quantitative analysis accuracy and experimental repeatability of ms-LIBs, and effectively reduce the matrix effect of aluminum alloy, which can meet the trace elements of aluminum alloy Quick check.

    Feb. 01, 2022
  • Vol. 42 Issue 2 582 (2022)
  • Ming-liang LI, Yu-jia DAI, Shuang QIN, Chao SONG, Xun GAO, and Jing-quan LIN

    In order to improve the accuracy of quantitative analysis of aluminum alloy, a quantitative analysis model of Cu element in aluminum alloy was established by combining laser-induced breakdown spectroscopy with multivariate linear regression, median Gaussian kernel support vector machine regression and standardized partial least squares regression. Third order minimum background removal and wavelet threshold denoising were performed on the collected LIBS spectra to improve the SNR of LIBS spectra. The optimal training set and prediction set were selected from the processed data. The calibration model was established using multi variable linear regression method, medium Gaussian kernel support vector machine regression method and normalized partial least squares fitting regression method. Two characteristic lines of Cu Ⅰ 324.80 nm and Cu Ⅰ 327.43 nm and Libs spectral data in the range of 323~329 nm were used for quantitative analysis. The fitting coefficient (R2), root mean square error (RMSEC), root mean square error of prediction (RMSEP) and average relative error (ARE) of the three Libs quantitative analysis models were compared and analyzed. The results show that compared with the multivariable linear regression method and medium Gaussian kernel support vector machine regression method, the precision and accuracy of the standardized PLSR model are significantly improved for the quantitative analysis of Cu element in aluminum alloy, and the R2, RMSEC, RMSEP and ARE of the Libs calibration curves are 0.997, 0.014 Wt%, 0.129 Wt% and 3.053%, respectively. The results show that the standardized PLSR method has more advantages in improving the accuracy and generalization of the calibration model, and can effectively reduce the influence of parameter fluctuation and self-absorption effect on the quantitative analysis of aluminum alloy.

    Feb. 01, 2022
  • Vol. 42 Issue 2 587 (2022)
  • Jun LI, De-ming KONG, Xiao-dan ZHANG, Qin-yong MA, De-han KONG, and Ling-fu KONG

    Oil spill pollution on the sea surface is one of the most common marine pollutions, which usually exists in the state of non-emulsification, emulsification and other weathering, and the emulsification stage is more harmful to the ocean. Therefore, it is of great significance to quickly monitor the oil spill information and accurately identify and evaluate the emulsified oil spills pollution for the emergency treatment of oil spill and the restoration of the ecological environment. Laser-induced fluorescence (LIF) is recognized as one of the most effective detecting oil spills. LIF detection systems can be divided into the forms of coaxial transceiver and non-coaxial transceiver. Since there is no research on transmitting and receiving related problems in the detection of the emulsified oil spill by LIF system with coaxial transceiver, the optical parameters such as absorption coefficient and scattering coefficient of the emulsified oil spill are calculated by MIE scattering theory, and the Monte Carlo, photon transport model, is established to simulate the bidirectional reflectance and reradiation distribution functions (BRRDF) of the emulsified oil spill. The relationship between fBRRDFcos2θ and the transmitting and receiving angle of the emulsified oil spill is analyzed under multi parameters of concentration, thickness and oil type. Then the suitable conditions for detecting oil spill on the sea surface based on an LIF system with coaxial transceiver are obtained. The results show that the fBRRDFcos2θ is independent of the azimuth angle of transmitting and receiving. However, it is greatly affected by the zenith angle of transmitting and receiving, the variation law of fBRRDFcos2θ of the emulsified oil spill under various parameters has certain differences. The fBRRDFcos2θ of water-in-oil of heavy oil and oil-in-water of low concentration are more sensitive to the change of zenith angle, and the fBRRDFcos2θ of water-in-oil of light oil and oil-in-water of high concentration are insensitive to smaller angle (0°~45°), and then decrease rapidly. Therefore, when detecting the emulsified oil spill on the sea surface based on the LIF system with a coaxial transceiver, it is advisable to transmit and receive the zenith angle within the range of 0°~45°, and the maximum optical power can be received at 0°. In addition, to verify the correctness of the simulation, the fluorescence spectra of the emulsified oil spill were measured by the laboratory LIF system. The results show that this is consistent with the simulation results.

    Feb. 01, 2022
  • Vol. 42 Issue 2 592 (2022)
  • Zheng GONG, Jing-jun LIN, Xiao-mei LIN, and Yu-tao HUANG

    In order to solve the problem of low accuracy and poor repeatability caused by temperature change when LIBS technology is applied to the analysis of metallurgical process composition, the influence of temperature change on plasma is studied in this paper. The results show that the intensity of the characteristic lines of Al increases with the increase of temperature and reaches saturation at 700 ℃. When the temperature rises to 700, 500 and 200 ℃, Al I increases When the sample temperature is 700 ℃, the plasma electron temperature rises to 13122 K, and the electron density increases to 4.65×1016 cm-3 respectively. In the first stage, the sample stops heating and naturally cools down, and the plasma parameters drop rapidly with the sample temperature; in the second stage, when the sample temperature drops to about 660 ℃, the spectral intensity decreases slowly and becomes stable. At this time, the plasma electron The temperature was stable at about 16 000 K, and the electron density was 7.6×1016 cm-3; in the third stage, the plasma characteristic parameters continued to decrease until the sample temperature dropped to room temperature. When LIBS technology is applied to the detection of molten metal components, the best measurement point can be obtained by controlling the sample temperature, there by improving the detection accuracy of LIBS technology.

    Feb. 01, 2022
  • Vol. 42 Issue 2 598 (2022)
  • Based on the self-designed remote laser-induced breakdown spectroscopy (LIBS) system, the focusing characteristics of remote LIBS were analyzed, and the experimental method of quantitative analysis of nickel-base superalloy by remote LIBS was studied. In this LIBS system, the laser focusing and the plasma optical signal acquisition optical paths are coaxial and independently focused. Through automatic focusing, the remote analysis of 1~10 m can be achieved. The results show that affected by the depth of focus, the detectable range of plasma optical signal increases with the increase of working distance. That is, the requirement of the LIBS system for focusing accuracy decreases. At the same time, the decrease of power density caused by the increase of ablation spot size and the decrease of signal acquisition solid angle make the spectral line intensity attenuate in inverse proportion to the fourth power as the working distance increases. In this paper, the standard curves of Ni, Cr, Nb, Mo, Ti and Al in GH4169 nickel-based superalloy were established using the standard curve method without internal standard with internal standard. The goodness of fit of the standard curve with internal standard (0.999 7, 0.999 4, 0.999 87, 0.999 1, 0.998 1 and 0.999 7) was significantly better than that of the standard curve without internal standard (0.953 2, 0.876 6, 0.897 4, 0.914 5, 0.938 4 and 0.991 6). Finally, LIBS and XRF were compared. For major elements Ni, Cr, Nb and Mo, the relative standard deviations of the two methods were 1.75%~3.90% and 0.10%~0.52%, and the relative errors were 0.48%~0.92% and 0.64%~2.25%, respectively; for trace elements Ti and al, the relative standard deviations of the two methods were 5.58%, 5.86% and 2.39%, 5.64%, the relative error is 2.75%, 3.14% and 4.68%, 2.39% respectively. Due to the instability of plasma, the precision of the remote LIBS method is slightly lower than that of the XRF method. However, LIBS method can effectively reduce the measurement error through repeated measurements, which indicates that LIBS technology is feasible for remote on-line analysis of nickel-based superalloys.

    Feb. 01, 2022
  • Vol. 42 Issue 2 603 (2022)
  • Shi-yu DENG, Cheng-zhi LIU, Yong TAN, De-long LIU, Nan ZHANG, Zhe KANG, Zhen-wei LI, Cun-bo FAN, Chun-xu JIANG, and Zhong LÜ

    With the continuous improvement of the sensitivity, accuracy and easy use of spectral detection instruments in recent years, spectral technology has penetrated the identification and analysis of material components in all walks of life. Spectral observation of space targets is one of the important extensions of traditional optical observations. It has attracted much attention due to its non-contact and damage-free advantages. However, due to the limited observation conditions, the amount of spectral data of space targets is minimal. Traditional methods cannot achieve better results in classification analysis. In this paper, Firstly, the hyperspectral image of the space target is obtained through the spectroscopic camera terminal mounted on the 1.2 m space target optical telescope; Secondly, the one-dimensional spectral data of the space target is extracted through the astronomical photometric IRAF method; Finally, the combination of multiple deep learning methods, classify the spectral data of space targets. Accordingly, this paper proposes a combination of multiple deep learning methods to solve small sample data's spatial object classification problem. This method uses Density Clustering method to roughly classify spatial targets, one-dimensional Generative Adversarial Network method to generate spatial target data, one-dimensional Convolutional Neural Network method to finely classify spatial targets, the combination of three methods can achieve relatively good experimental results and overall accuracy is about 79.1% (Based on the combination of Density Clustering, Oversampling, one-dimensional Convolutional Neural Network methods; Based on the combination of K-means, one-dimensional Generative Adversarial Network, one-dimensional Convolutional Neural Network methods; Based on the combination of K-means, Oversampling, One-dimensional Convolutional Neural Network methods, the overall accuracy is about 78.4%, 77.9%, 77.2%). In the rough classification model, the overall accuracy of the Density Clustering method is about 0.67% higher than the K-means method; In the data augmentation model, the overall accuracy of the one-dimensional Generative Adversarial Network method is about 1.52% higher than the Oversampling method; In the fine classification model, the two-layer network of the one-dimensional Convolutional Neural Network method has an average accuracy of only about 0.003% higher than the three-layer network, but the calculation time is longer. The accuracy of the four combined methods are higher than the single method. The experimental results show that the combination method proposed in this paper can achieve fine classification and high accuracy when the small sample space target category is unknown. It provides a certain reference value for realizing the integrated analysis of the map under the minimal data volume of the space target.

    Feb. 01, 2022
  • Vol. 42 Issue 2 609 (2022)
  • Chun-hui FAN, Jin-huan ZHENG, Yu-fei WANG, Zhe SU, Long-jian LIN, and Chen YANG

    As clay minerals complex with high reactivity, Fe-Mn nodules in soil, with special geochemical characteristics, different from Fe-Mn nodules in the ocean, can always be found in drying-wetting cycle condition and water-air disturbing environment. Fe-Mn nodules, the new-formed component in the pedosphere, appear the various qualities in different regions. The investigation on adsorption behavior between soil Fe-Mn nodules and metals in the representative areas is helpful to understand further the micro-ecological property of Fe-Mn nodules and is significant for soil exploitation and utilization, conservation and improvement, and contamination remediation. It currently lacks the related research on soil Fe-Mn nodules in western China, while this paper might supply unclear information and improve the research level from a spectral aspect. Water-washing method was used and spectral analysis approaches of Inductively Coupled Plasma-Optical Emission Spectrometer (ICP-OES), Ultraviolet-Visible Spectroscopy (UV-Vis), X-Ray Diffractometer (XRD) and Fourier Transform Infrared Spectroscopy (FTIR) were applied to analyze the main elemental oxides and structure of Fe-Mn nodules in western China. Batch adsorption procedures were involved in study the reaction, and the effects of time, cadmium concentration and temperature were discussed. The kinetics equation and isotherms equations were used to fit the reaction, thermodynamic parameters were calculated, and the desorption experiments were studied. The dominant elemental oxides include Fe2O3, SiO2, Al2O3 and MnO, with the highest content of Fe2O3 followed by SiO2 in Fe-Mn nodules. Similar mineral components are found between Fe-Mn nodules and soil samples, and functional groups of —OH, Si—O—Si (Al) and Fe(Mn)—O appear in the FTIR spectrum. The adsorption is fast at the beginning of the reaction and then becomes slow gradually. The adsorption capacity (Q) reaches 4.96 mg·g-1 at 6 h, and changes little after 12 h. The increased concentration of cadmium leads to higher Q values, and temperature affects little the reaction. Pseudo-second order equation fit better with a higher coefficient of R2 (0.994 3), indicating the reaction rate might be controlled by chemical adsorption. The value of R2 (0.999 1) from the Langmuir equation, is higher than that from the Freundlich equation, suggesting the reaction belongs to the monolayer chemical adsorption. The reaction is spontaneous and endothermic, and complexation might be involved during the process. Positive S value suggests an increase in randomness during the interaction. The desorption efficiency is better with HCl solution (0.1 mol·L-1, prepared with tap water). The research is significant for mechanism analysis with spectral approaches in future.

    Feb. 01, 2022
  • Vol. 42 Issue 2 616 (2022)
  • Yi-chuan TANG, Yan-jie CUI, Jian-ying ZHANG, Sheng HE, Tao ZHOU, and Bing WU

    Trace oxygen has a noticeable influence on the purity assessment of high purity gold when the total elemental impurities deduction method was used to calculate the purity. However, the previous elemental impurities deduction method did not calculate the non-metallic elements such as oxygen, making the purity assessment not persuasive. The inert gas fusion infrared absorption method was established to measure the content of trace oxygen in high purity gold reference materials. The secondary ion mass spectrometry was used to compare the methods to ensure the reliability of the measurement results. The measurement parameters of the ONH analyzer were optimized, and the optimal working conditions were confirmed as follows: purge time 35 s, analysis delay 75 s, exhaust cycle 2, exhaust time 25 s, exhaust power 4 500 W, analysis power 4 000 W. Tin was selected as the flux, and the ratio of gold to tin was determined to be 5∶3 by oxygen release experiment. The secondary measurement of the gold sample showed that the residual oxygen was consistent with the blank, indicating that the addition of tin particles could promote the release of oxygen in gold, thus solving the problem of incomplete release of oxygen in gold. The tiny particles were deoxidized repeatedly to reduce the blank, and a stable blank was obtained. The limit of quantitation of the method reached 0.1 mg·kg-1. The calibration coefficient is 1.012, and the recoveries of oxygen are between 95% and 105%, which verifies the reliability of the measurement method and ensures the traceability of the measurement results. In the secondary ion mass spectrometer, Cs+ is used as the primary ion source, the aperture is 400 μm, the ion beam intensity is 3 nA, the beam spot size is about 20 μm, the grid scanning size is 10 μm, and the secondary ion aperture is 400 μm. After sputtering and ionization, 16O- and 18O- ion currents were collected. SRM685 high purity gold reference material was used as the measurement standard. The oxygen content was calculated through the cyclic measurement of the standard and sample by comparing the ion current intensities between standard and sample. The results of the two methods were (1.1±0.3) and (0.9±0.3) mg·kg-1 respectively. The uncertainty evaluation showed that the primary sources were the certified reference materials and measurement repeatability. The two results were consistent within the uncertainty range. Finally, the trace oxygen content in the high-purity gold reference material was (1.0±0.4) mg·kg-1. The accurate determination of trace oxygen in high purity gold was realized by the two established measurement methods, which provide effective methods for the determination of trace oxygen and the development of high purity gold and other high purity metal certified reference materials.

    Feb. 01, 2022
  • Vol. 42 Issue 2 622 (2022)
  • Liang XI, Fu-qi SI, Yu JIANG, Hai-jin ZHOU, Xiao-han QIU, and Zhen CHANG

    Imaging differential optical absorption spectroscopy technology (IDOAS) combines imaging spectroscopy and differential optical absorption spectroscopy. The acquired data of IDOAS instruments are so-called hyperspectral cube with two spatial dimensions and a spectral one. After DOAS analysis of the original data, two-dimensional trace gas distributions can be resolved. For ground-based IDOAS instruments, the imaging capability is achieved through the stepwise rotation of the motor in the horizontal direction, which can be used to identify the emission sources of polluting gases and monitor the transmission of pollution. However, similar to other imaging spectroscopy instruments, ground-based IDOAS instruments are also prone to stripe noise, producing corresponding pseudo-structures and affecting subsequent information extraction and data analysis. Several de-striping algorithms have been applied for space-borne and airborne sensors, including homogeneous reference area correction method, transmission model simulation method, frequency domain filtering method, polynomial fitting method, which are not fully applicable to ground-based instruments. Here we present a de-striping algorithm based on a weighted unidirectional variation model. This algorithm first obtains a weight matrix that characterizes the blocked area through adaptive threshold segmentation, then utilizes the unidirectionality and sparsity of the strip noise to establish the optimization model, which is solved iteratively by using the alternating direction method multipliers technique. To test the performance of the de-striping algorithm, simulated experiments were performed using various cases including sparse, dense, periodic, random, whole-line, partial, single-line, multi-line stripe noise. Corresponding results prove that this algorithm can effectively remove typical stripe noise, with good performances in visual and four full-reference evaluations. Ground-based IDOAS observations were carried out in Leshan, Sichuan province, in the summer of 2018. In this experiment, the IDOAS instrument provided a full-azimuthal coverage (360°) and a 30° vertical coverage around the measurement site. The acquisition time of a full-panoramic image was about 15 min when the integration time was set to 500 ms. The final panoramic views of NO2 and SO2 columns consist of 48 vertical and 360 angles on the horizontal axis. According to the real data results, the stripe noise changed greatly for different gases at different times. After de-striping by this weighted variation algorithm, the stripe noise in the NO2 and SO2 columns reduced greatly without over-smoothing. Experimental results of the real data demonstrate that this algorithm is suitable for de-striping of ground-based IDOAS data.

    Feb. 01, 2022
  • Vol. 42 Issue 2 627 (2022)
  • Tian-shun LIU, Peng-fa LI, Gui-long LI, Meng WU, Ming LIU, Kai LIU, and Zhong-pei LI

    The soil-borne disease of continuous cropping peanut is serious, but the internal relationship between the occurrence of soil-borne disease and soil factors, especially the dissolved organic matter (DOM) composition of rhizosphere soil, is still unclear. In order to explore the effect of peanut diseases on the rhizosphere soil DOM composition, the rhizosphere soils of healthy and diseased peanut plants were collected from multiple locations in Yu Jiang county. Three-dimensional excitation-emission matrix (3DEEM) and parallel factor method (PARAFAC) were used to analyze the variations of DOM compositions among rhizosphere soils of diseased and healthy peanut plants. Results showed no significant difference in the basic properties of rhizosphere soil between healthy peanut and diseased peanut. Five DOM components, including tryptophan-like (C1), fulvic-like (C2), microbial-humic-like (C3), humic-like (C4) and tyrosine-like (C5) were identified, and the variations of DOM fluorescence component composition in the rhizosphere soil between healthy peanut and diseased peanut were significantly different. The tryptophan-like (C1) in the rhizosphere soil of healthy plants accounted for 53.79%, which was significantly higher than 25.72% in diseased plants, while the opposite trend appeared in other components; The BIX and HIX of DOM in the rhizosphere soil of healthy peanut were (0.95±0.03) and (1.87±0.25), respectively, which were significantly higher than (0.82±0.02) and (0.98±0.09) of diseased peanut. Higher BIX and HIX values could be an intrinsic signature to rhizosphere environment keeping healthy. The Principal Co-ordinates Analysis showed that the healthy group and the diseased group could be effectively differentiated by the fluorescence components characterized with the application of 3DEEM-PARAFAC. A significant correlation was found between peanut biomass and each component of DOM by Correlation Analysis. Furthermore, peanut biomass showed a significantly positive correlation with BIX and HIX, while the Mcknight index was only closely related to some soil properties. The Variance Partitioning Analysis showed that the explanation rate of peanut biomass to the variation of DOM composition was up to 40%. However, Soil properties could not significantly explain the variation of DOM composition, indicating that peanut growth status is an important factor affecting the DOM composition of rhizosphere soil. In summary, there is a correlation between peanut health and DOM composition with fluorescence characteristics of rhizosphere soil, which can provide a theoretical reference to understand the pathogenesis of peanut soil-borne diseases and guide the establishment of relevant scientific control schemes.

    Feb. 01, 2022
  • Vol. 42 Issue 2 634 (2022)
  • Yang-biao XU, and Hai-shui WANG

    In the infrared spectroscopic study of aqueous protein solution, the characteristic peaks of solvent water and protein overlap partially or completely, which seriously affects the quantitative and structural analysis of protein. In this study, the solvent single beam spectra with arbitrary intensity were successfully synthesized by using two background samples. Therefore the solvent peaks in protein solution can be removed completely. The results of the hybrid spectrum were compared with those of the subtraction spectrum, and it was found that the hybrid spectrum has obvious advantages. The secondary structure information obtained from the second derivative of the hybrid spectra of BSA is in good agreement with that reported in the literature. Hybrid spectroscopy has also been used to study the thermal behavior of aqueous protein solutions. Without the interference of water peaks, the resolution of the amide Ⅰ and amide Ⅱ bands become easier. As the temperature increased, the peak position of the protein shifted. After high-temperature treatment, the bioactivity of BSA is lost.

    Feb. 01, 2022
  • Vol. 42 Issue 2 642 (2022)
  • Zhong-hua ZHANG, Wei-kuan JIA, Wen-jing SHAO, Su-juan HOU, Ze Ji, Yuan-jie ZHENG, and [in Chinese]

    In the visible spectrum range, the accurate recognition of target fruit is the fundamental guarantee for achieving orchard yield measurement and machine automatic picking. However, this task is susceptible to many interferences, such as the complex unstructured orchard environment, the close color between green apples and background leaves, etc., which significantly restrict the detection accuracy of target fruits and bring great challenges to recognition of machine vision. It targeted the different illumination environments and fruit postures under the complex orchard environment. An optimized convolution and one-stage (FCOS) fully neural network model for green apple recognition is proposed in this study. Firstly, the new model combines the feature extraction ability of convolutional neural network (CNN) based on FCOS, eliminates the dependence of previous detectors on anchor boxes, and switches to a novel manner of one-stage, full convolution and anchor-free for predicting the fruit confidence and boxes offsets, which greatly improves the recognition speed of the model while ensuring the detection accuracy simultaneously. Secondly, the bottom-up feature fusion architecture is embedded after the feature pyramid to provide more accurate positioning information for high -levels and thus further optimize the detection effect of green apple. Finally, the overall loss function is designed to complete the iterative training given three output branches of FCOS. To simulate the real orchard environment as possible, we collected green apple images in various environments with different lighting environments, illumination angle, occlusion type, camera distance for data sets generation and model training, and then evaluated the optimal model on validation set containing different scenes. The experimental results show that our proposed model's average precision (AP) is 85.6%, which is 0.9, 10.5, 2.5 and 1.9 percentage points higher than the state-of-the-art detection models Faster- R-CNN, SSD, RetinaNet and FSAF, respectively. In the aspect of model design, the model parameters of FCOS and the calculation of the whole detection process are 32.0 M and 47.5 GFLOPs (billion floating-point operations), respectively, which are 9.5 M and 12.5 GFLOPs lower than those of Faster R-CNN. Comparisons of experimental results show that the new model has higher detection accuracy and recognition efficiency in the visible spectrum, which can provide theoretical and technical support for orchard yield measurement and automatic picking. In addition, the new model can also provide theoretical references for other kinds of fruits and vegetables.

    Feb. 01, 2022
  • Vol. 42 Issue 2 647 (2022)
  • Hong-bo LIU, Xue-shun SHI, Xin-gang ZHUANG, Peng-ju ZHANG, Chang-ming LIU, and Heng-fei WANG

    At present, the highest international benchmark for optical radiation power is cryogenic radiometer, and it can detect radiation covering the vacuum ultraviolet to terahertz spectrum (115 nm~THz). Using the optical and electric alternative principle with the vacuum, low temperature and superconducting technology, it traced the radiation power to the electrical parameters with the high precision measurement, realized super wide spectrum of optical radiation absolute power measurement, the uncertainty reached 10-5. In the field of national defence military, and optical radiation measurement, photoelectric payload, quantitative remote sensing, high spectral imaging and optical radiation quantity traceability, and others have an irreplaceable role. As the core device of radiation absorption, the cavity of the cryogenic radiometer has a flat spectral absorption with an ultra-high absorption ratio of over 0.999. The absorptance is one of the main factors affecting the high accuracy measurement of the cryogenic radiometer. The scholars at home and abroad have carried out a large number of studies with the theoretical and simulation for the different cavities. However, the experimental measurement and comparison of absorption rates of the cavity with different structural parameters have not been reported. Therefore, to realize the requirement of the wide spectrum and high precision measurement of the radiometer, the research work of developing the cavity suitable for the radiometer has been carried out. We developed four different structures. The wall was 0.1 mm thickness with high conductivity oxygen-free copper (OFHC), the inner surface electroplated nickel-phosphorus (NiP) black coating. The Monte Carlo tracing algorithm was used to simulate the absorptivity of the cavity of four structures. The absorptivity of the cavity was measured by the alternative method, and the measuring device was set up, which was composed of the high stable light source and integrating ball system. By switching the standard whiteboard and the cavity, the absorption rate of the cavity was measured, and the influencing factors of the absorption rate were analyzed. By comparing the simulation and the experimental results, the rationality of the simulation parameter setting is verified. The experimental results show that: (1) comparing the simulation and the experimental result shows, the measurement method and result are verified; (2) the cryogenic radiometer cavity has achieved 0.999 962±0.000 005@632.8 nm; (3) the absorption of the cylindrical cavity with the inclined bottom is better than that of the conical cavity; (4)By designing the screw structure to increase the cavity surface area and the conical aperture to compare with the diaphragm structure, the absorptivity is not significantly increased.

    Feb. 01, 2022
  • Vol. 42 Issue 2 654 (2022)
  • Ze LIU, Yu-hui ZHANG, Jing LIANG, Zhi-sheng WANG, Nian-yu ZOU, and Yu-sheng LIAN

    Jewelry is a high-end consumer luxury product. The quality of shopping and the beautiful visual experience influence consumers' buying behavior and determine brand value enhancement. With the rapid popularity and application of LED light sources, lighting factors (color temperature, illuminance, color rendering index, etc.) have become more and more significant in creating the atmosphere of jewelry stores. This paper studied the atmosphere evaluation indicators under four color temperature conditions in jewelry stores. In this paper, an LED light source with adjustable color temperature was used to simulate the lighting environment of the jewelry store display stand. Reliability analysis was used to verify the stability of the subjective evaluation data, and principal component analysis, maximum variance rotation method, one-way analysis of variance and correlation analysis were used to study atmosphere indicators of jewelry stores under different color temperatures and the impact of color temperature on consumers' psychological perception. In the jewelry store, four basic perception dimensions have been extracted: the sense of integration, liveliness, aesthetics and uniformity. When the color temperature was 3 000 K, the sense of integration was the highest, but the liveliness was very low, which made the overall atmosphere more depressing. When the color temperature was 4 000 K, the average value of the four basic dimensions was generally higher. When the color temperature was 5 000 K, the sense of integration was lowest. When the color temperature was 6 000 K, the sense of integration was relatively low, while the liveliness, aesthetics and uniformity maintained a high average value. Color temperature significantly impacted factor 1 (sense of integration) and factor 2 (liveliness) of the basic perception dimension. When the color temperature was 4 000 K, the sense of integration and liveliness were more prominent, while the aesthetics and uniformity were not significantly affected by the color temperature. When the jewelry store chooses the color temperature of the lighting in the space, the color temperature of 4 000 K is given priority. There was a correlation between the four basic perception dimensions of the jewelry store and the subjective evaluation quantifier cool-warm, indicating that the change in color temperature can cause the observer to visually feel the change in the degree of coldness and warmth of the environment. The sense of integration had the strongest correlation with the cool-warm quantifier. The sense of integration in the jewelry store gradually increased as the color temperature decreased. This paper only changed the color temperature in the lighting parameters, but the observer's evaluation of uniformity and brightness was affected. It showed that the observer's subjective perception of brightness and light uniformity would also be affected by changes in color temperature.

    Feb. 01, 2022
  • Vol. 42 Issue 2 660 (2022)
  • Please enter the answer below before you can view the full text.
    9+2=
    Submit