


 View fulltext
Qi WANG, Shi-chao WANG, Tai-yu LIU, and Zi-qiang CHEN
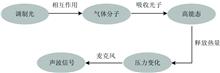
Photoacoustic spectroscopy gas detection technology is an important technology to realize trace gas detection by using photoacoustic effect. It has the advantages of high sensitivity, high selectivity, zero background signal and real-time online monitoring. It plays a vital role in the fields of environmental monitoring, mining and metallurgy, energy and electricity, medical and health care and so on. Considering the complexity of gas detection application environment, the actual detection environment is often the simultaneous existence of multiple component gases, and the content of each component gas needs to be monitored. At this time, the technology of simultaneous detection of multi-component gases is particularly important. This paper firstly introduces the basic principle and characteristics of photoacoustic spectroscopy gas detection technology and expounds on the application of photoacoustic spectroscopy technology with optical multiplexing method as the core in multi-component gas detection mainly from the perspective of the light source and photoacoustic cell, and analyzes the characteristics of quartz enhanced photoacoustic spectroscopy technology and its application in multi-component gas detection. Finally, the development trend of multi-component gas detection based on photoacoustic spectroscopy is summarized and prospected.
Jan. 01, 2022Vol. 42 Issue 1 1 (2022)
Yan-long TIAN, Yi WANG, Xiao WANG, Xue-jun GAO, Jia-cai ZHOU, Dao-li LU, and Bin CHEN
Near-infrared spectroscopy (NIRs) has been widely applied to rapid multi-component quality monitoring in the field of agriculture, pharmaceutical and food as a nondestructive testing method. Rapid and accurate detection of microbes is a challenging issue in clinical diagnosis, pharmaceutical and food processing technology. Biomacromolecules and water existing in cell walls, membranes and cells of microorganisms possess highly specific NIR spectra that can distinguish, identify and classify different microbes. In this paper, the research progress of NIRs in microorganism detection was reviewed by summarizing, sorting, analyzing and refining published literature. We first briefly introduced basic knowledge of microbiology and the fundamental NIRs for microbial detection. Then research progress at home and abroad of NIRs on microbe classification, foodborne microbial detection and microbial imaging detection was reviewed respectively. Finally, the existing problems and future application prospects of NIRs were also discussed to provide a reference for better use of NIRs in the field of microbial detection in the future.
Jan. 01, 2022Vol. 42 Issue 1 9 (2022)

Fu-shan CHEN, Gao-min WANG, Yue WU, Peng LU, and Zhe JI
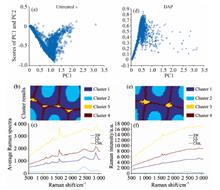
In light of the gradual depletion of fossil fuels and emerging environmental concerns, there is a hot topic to make use of lignocellulosic biomass to produce biobased value-added fuels, chemicals, and materials worldwide. However, bioconversion is normally hindered by the complex structure and heterogeneous components (cellulose, hemicelluloses, lignin and pectin) distribution in the cell wall assembly. Therefore, to overcome the recalcitrance, biomass pretreatment became an essential step towards low-cost biomass conversion. In this process, it is greatly importance to have a comprehensive understanding of the chemical composition, structural characteristics of cell walls and their deconstruction mechanism in biomass conversion for efficient utilization of agroforestry biomass. Raman spectroscopy has been used to investigate the structure of cell walls at a multi-scale due to its simple sample preparation, high sensitivity, and quantitative and qualitative analysis of the characteristics of samples in situ. Moreover, the chemical structure of the main components of cell walls and micro-zone distribution information can be provided by Raman spectroscopy combined with microtechnique to realize the dynamic change of composition of visualization research. Firstly, it introduces the working principle of Raman spectroscopy. On account that cellulose, hemicellulose and lignin have different Raman characteristic signals. The concentration and distribution of different components in a certain region can be calculated by integrating the characteristic Raman bands. Secondly, the research progress of Raman spectroscopy application in the field of biomass conversion was summarized. It is especially reviewed that the analysis methods for revealing the spatial distribution pattern and migration regularity of main components within cell walls during dilute acid, hydrothermal and alkali pretreatment processes. It provides an effective way to explore the dynamic dissolution mechanism of cell wall components induced by biomass pretreatments at cellular and subcellular levels. In addition, to solve the problems of excessive number of collected spectra and difficult analysis, this work mainly introduces two Raman data analysis methods, namely principal component clustering analysis and vertex component analysis, which are used to extract characteristic information and perform spectral classification, so as to further explore the spatial distribution and molecular structure of specific components. Finally, based on the above analysis, we also discuss the future challenges and prospects of Raman spectroscopy in the field of biomass conversion, which will provide technical reference for related research.
Jan. 01, 2022Vol. 42 Issue 1 15 (2022)
Cai-yun-fei CHEN, and Li-ping LI
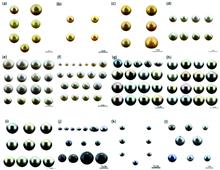
“Edison” pearls and “Gabriel” pearls are high-quality freshwater cultured pearls that have greatly enriched the market in recent years. They are similar to South Sea pearls and AKOYA pearls respectively. Nowadays, detecting color origin and variety of these pearls has become problematic for gem testing labs. This paper obtained the photoluminescence (PL) spectra of 132 pieces of various types of pearls in natural colors and enhanced colors including white, golden, black and silver-grey series from a Raman spectrometer. After comparing and analyzing the PL spectra of different types of pearls, important PL characteristics were identified. The ratio between the fluorescence background intensity and the main aragonite peak at 565 nm (F/A) in a PL spectrum is critical for distinguishing between different types of white pearls and identifying if the black, golden, and silver-grey pearls have been color enhanced. (1) The F/A values of South Sea white pearls are typically close to 1; the PL spectra and F/A value of white Edison pearls and Gabriel Pearls are very similar, most of which showed a peak at 631 nm, with F/A values clustering at 2; and white AKOYA pearls have significantly higher F/A value(>10). (2) The F/A ratios of South Sea golden pearls cluster at 1.6, with small variations, whereas the F/A ratios of dyed South Sea golden pearls and dyed “Edison” pearls are significantly higher (>4). (3) The South sea black pearls with dark grey body colors have no characteristic luminescence peaks, but as the deepening of color, a peak at 617 nm appears and gradually heightens. The South sea black pearls with black body colors have characteristic peaks at 617 and 650 nm, related to organic porphyrins. Most of the dyed and irradiated black samples did not show obvious fluorescence background enhancement. (4) The F/A values of naturally colored silver-grey AKOYA samples are less than 3, while the F/A values of dyed and irradiated silver-gray AKOYA samples are distinctively higher ranger (1.79~144), and there is a variation in different color treatment.
Jan. 01, 2022Vol. 42 Issue 1 20 (2022)
Fang YAN, Jun-lin ZHANG, Li-cheng MAO, Tong-hua LIU, and Bo-yang JIN
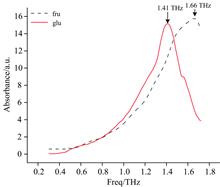
In this paper, the terahertz time-domain spectroscopy system (THz-TDS) was used to obtain the terahertz absorption spectra of two isomers of sugars D-(+)-glucose and D-(-)-fructose, and found that D-(+)-glucose and D-(-)-fructose have obvious differences in the terahertz absorption peak positions in the 0.3~1.72 THz frequency band. D-(+)-glucose and D-(-)-fructose can be distinguished by the two absorption peak positions of 1.41 and 1.66 THz. In order to study the formation mechanism of the absorption peak of D-(+)-glucose terahertz spectrum, the unimolecule configuration of D-(+)-glucose was first constructed, and the B3LYP functional in density functional theory was used to complete the D- (+)-Glucose unimolecule configuration optimization and frequency calculation. It is found that the quantum chemistry calculation results based on the D-(+)-glucose unimolecule configuration are quite different from the experimental spectrum. Then the D-(+)-glucose crystal structure configuration was constructed, and the generalized gradient was used to approximate the PBE functional in GGA. The structure optimization and frequency calculation of the D-(+)-glucose crystal structure configuration were completed using CASTEP software. It is found that the quantum chemistry calculation results based on the D-(+)-glucose crystal structure configuration are more consistent with the experimental spectrum. In the quantum chemistry calculation of the D-(+)-glucose crystal structure configuration, the hydrogen bond between the molecules and the effect of van der Waals forces are considered comprehensively, indicating that the absorption peak of D-(+)-glucose at 1.41 THz is formed as a molecule Weak interaction between. Secondly, the vibration mode of D-(+)-glucose at 1.41 THz absorption peak was identified by Materials Studio 2017 software, and it was found that the absorption peak of D-(+)-glucose at 1.41 THz was mainly the interaction between molecules, which further explained The absorption peak of D-(+)-glucose at 1.41 THz is mainly the weak interaction between molecules. Based on the quantum chemistry calculation results, use Multiwfn software to perform RDG calculation on D-(+)-glucose crystal structure, and use VMD software to determine the type, position and intensity of weak interaction between molecules in D-(+)-glucose crystal structure Conduct visualization research. The research results show that terahertz time-domain spectroscopy technology can keenly perceive the subtle changes in the structure of carbohydrates and correctly identify its isomers.
Jan. 01, 2022Vol. 42 Issue 1 26 (2022)
Qiu-hong CAO, Hong-mei LIN, Wei ZHOU, Zhao-xin LI, Tong-jun ZHANG, Hai-qing HUANG, Xue-min LI, and De-hua LI
With the growth of population and the rapid development of society, the problem of water shortage and water pollution have become increasingly serious. As an important aspect of water pollution assessment, water quality classification has a more prominent significance and role. Based on terahertz attenuated total reflection (THz-ATR) spectrum and pattern recognition technology, a water quality analysis model is proposed in this paper. The terahertz time-domain spectroscopy system and the attenuated total reflection module were used to measure the terahertz attenuated total reflection spectra of five water samples, including pure water, tap water, river water, seawater A and seawater B. The refractive index, absorption coefficient, real and imaginary parts of the dielectric constant of five water samples in the frequency range of 0.2~1.0 THz were obtained using the optical parameter extraction model. Principal Component Analysis (PCA) was applied to conduct refractive index reduction and feature extraction, and two-dimensional score charts of the first and second principal components and three-dimensional score charts of the first three principal components of the samples were made respectively. It can be seen that the principal component score chart based on the index of refraction can clearly distinguish different water samples. In order to further classify different water samples accurately, the data after dimension reduction is input into a support vector machine to construct a water sample classification model. Three-fifths of each water sample is randomly selected as the training set, and the remaining data is used as the test set. At the same time, three optimization algorithms, grid search (GridSearch), genetic algorithm (GA) and particle swarm algorithm (PSO) are introduced to optimize the parameters of the support vector machine. The results show that the optimal parameters c and g of the support vector machine based on the grid search algorithm are 1.414 2 and 2.0, respectively, with an accuracy of 99.0%; the optimal parameters c and g of the support vector machine based on the genetic algorithm are 1.675 4 and 5.966 5, respectively, which are accurate The rate is 99.5%; the optimal parameters c and g of the support vector machine based on particle swarm optimization are 3.154 9 and 12.589 respectively, and the accuracy rate is 100%. It can be seen that the optimal parameters obtained by different optimization algorithms are different, and all the SVM classification models constructed can achieve correct classification, and the classification accuracy is above 99.0%. The research results show that the PCA-SVM classification model based on the refractive index constructed by the particle swarm optimization algorithm has the best effect and can accurately identify different water samples, laying a foundation for water quality classification.
Jan. 01, 2022Vol. 42 Issue 1 31 (2022)

In this paper, spherical silver nanoparticles and multi-shaped silver nanoparticle were synthesized using the facile solvothermal method. The spherical silver nanoparticle has a narrow single LSPR peak around 400 nm, and a multi-shaped silver nanoparticles resonance region between 400~700 nm. A random laser was achieved in doped polymer film embedded multi-shaped silver nanoparticleson glass. It is experimentally shown that the spherical silver nanoparticles doped polymer film only has spontaneous emission peak, and dye doped polymer film with morphology of silver nanoparticles has a line width of 0.5 nm coherent random laser emission. The threshold is 1.9 mJ·cm-2. Due to multi-shaped silver nanoparticles exhibiting multiple plasmon resonances, spectrally overlapping with the emission of R6G, improving interactions with nearby molecules to stimulate more emission, which is beneficial to the formation of high gain. Further, by changing the pump position, the random lasing emission can be tuned in the range of 20 nm, wavelength ranging from 590.1 to 610.4 nm. It is likely the composition and distribution of silver nanoparticles at different locations are distinct, which change the interaction of surface plasmonic and the scattering ability of photons, leading to different gain effects and distinct closed optical oscillating paths. In addition, considering that multi-shaped silver nanoparticles have a broad localized surface plasmonic resonance region, we investigated whether multi-shaped silver nanoparticles can be used to achieve red random laser. Under the same preparation method, we embedded it into a polymer film doped with DCJTB. The results show that the coherent read coherent random lasing with a wavelength of 675 nm can be generated effectively, and the threshold value is only 0.98 mJ·cm-2. The results of this work are a great reference value in the research of wideband tunable random laser and random multicolor laser.
Jan. 01, 2022Vol. 42 Issue 1 38 (2022)
Zhen-hua AN, Dong-yan ZHAO, Yan YE, Rui YANG, Yu-bo WANG, Jin SHAO, Peng ZHANG, Yan-ning CHEN, Min ZHOU, Wen-he WANG, Zheng WANG, Hai-chao HUANG, Li-cheng WANG, Ming-chen ZHONG, Yan ZHEN, and Yong WAN
Nylons are widely used as engineering plastics. When used as packaging materials for power system chips, the aging of nylons in the natural environment may cause package failure, reliability deterioration of chips, or even chip failure, and finally, lead to great loss in the power industry. Therefore, aging evaluation of nylons has attracted great attention. Conventional aging evaluation methods include natural weathering and artificial accelerated aging. Both of these two methods are time-consuming. Furthermore, the effects of various environmental factors on aging of nylons can not be investigated. In this paper a novel in-situ aging evaluation method was proposed and the corresponding system was developed to study nylon 6 (PA6) and nylon 66 (PA66)’s aging stability. The system can combine environmental factors such as irradiation, temperature, humidity and oxygen. By measuring the generation of gaseous degradation products during aging process of nylons, the stability can be compared. The results show that the gaseous degradation products of PA6 and PA66 are mainly H2O and CO2, and CO2 is used as an indicator to evaluate the aging status. Nylons with different natural pre-aging times were detected. Longer pre-aging time responds to more generations of CO2, demonstrating poorer stability. Furthermore, this method was applied to study the effect of humidity on the aging of PA6 and PA66. It was proved that humidity accelerates nylon aging, and high temperature further promotes this acceleration effect. The novel in-situ aging evaluation method can evaluate aging stability of nylons under versatile environmental factors in only several hours. It is also expected to be a powerful and promising aging evaluation method for other polymer materials.
Jan. 01, 2022Vol. 42 Issue 1 43 (2022)
Li-wei ZHU, Jin-xin YAN, Juan HUANG, Tao-xiong SHI, Fang CAI, Hong-you LI, Qing-fu CHEN, and Qi-jiao CHEN
Buckwheat is rich in lysine, which is a lack in cereal crops, making it different from other cereal crops and has high economic value. Traditional determination of amino acids was time-consuming and expensive. In order to meet the needs of breeding of golden Tartary buckwheat, this study selected near-infrared spectroscopy combined with an artificial neural network algorithm to establish a near-infrared model for rapid determination of amino acid content in buckwheat leaves. A total of 255 samples with different amino acid contents were studied, and their chemical values were determined after scanning spectra. It was found that the content of threonine (Thr) in the samples ranged from 5.307 to 14.374 mg·g-1. Valine (Val) content ranged from 6.137 to 16.204 mg·g-1. The content of methionine (Met) ranged from 0.308 to 3.049 mg·g-1. The content of isoleucine (Ile) ranged from 5.259 to 14.134 mg·g-1. Leucine (Leu) content ranged from 9.730 to 26.061 mg·g-1. The content of phenylalanine (Phe) ranged from 5.936 to 17.223 mg·g-1. Lysine (Lys) content ranged from 6.640 to 17.280 mg·g-1. The content of glutamic (Glu) ranged from 10.984 to 27.740 mg·g-1. Aspartic (Asp) content ranged from 6.437 to 17.280 mg·g-1. Serine (Ser) content ranged from 3.467 to 8.312 mg·g-1. Arginine (Arg) content ranged from 4.937 to 14.772 mg·g-1. The content of Alanine (Ala) ranged from 3.329 to 6.885 mg·g-1. Histidine (His) content ranged from 1.946 to 4.798 mg·g-1. The content of glycine (Gly) ranged from 4.196 to 9.264 mg·g-1. Proline (Pro) content ranges from 1.024 to 5.672 mg·g-1. The content of tyrosine (Tyr) ranged from 0.176 to 1.173 mg·g-1. The content of cysteine (Cys) ranged from 0.422 to 1.926 mg·g-1. During each modeling, 50 samples were randomly selected and randomly divided into the training set and test set at a ratio of 4:1. After data normalization, the neural network structure 1102-9-1 was used for model construction. The simulation results of Arg and Asp near-infrared models were the best, the correlation coefficient (R2) between the predicted value and the real value was greater than 0.97, and the average relative error (RSD) was less than 10%. Simulation test process found, Val, Tyr, Ile, Ser, Ala, Thr, His, Phe, Gly and Lys of model prediction and the real value of R2 are greater than 0.90, the RSD is less than 10%, models are available; When the models of Met and Cys were tested in simulation, the R2 between the predicted value and the true value were both greater than 0.78, but the RSD was greater than 10%, so the model was not available. The results showed that golden Tartary buckwheat leaves had a high content of essential amino acids and had high application value. The analysis method of near infrared spectroscopy combined with an artificial neural network could be used to predict the amino acid content of buckwheat, which provided convenience for the breeding of high-quality buckwheat.
Jan. 01, 2022Vol. 42 Issue 1 49 (2022)
A Qualitative and Quantitative NIRs Study on Larch Wood Surface Color Change by UV Light Irradiation
Rui-yun FU, Xiao-hui FU, Wen-bo ZHANG, Dong-qing LI, Cheng GUAN, and Hou-jiang ZHANG
Among environmental degradation of wood, photodegradation originated mainly by ultraviolet light is the fastest and the strongest chemical reaction process. This work on the base of near-infrared spectroscopy (NIRs) technology studied color changes of Larch wood surface irradiated by UV light with 340 nm wavelength. At different times (180, 540, 900, 1 080 h), the wood surface colorimetric index was measured and NIRs information was collected after ultraviolet light. Qualitatively chemical group changes of the wood surface were discussed according to collecting NIRs 2nd derivative spectra and their difference spectra. Quantitatively, the prediction of color the UV-irradiated wood surface were constructed using partial least squares regression method combined with leave-one-out cross-validation process. The results can be drawn as follows: (1) The color changes for UV light irradiated larix wood surface showed that lightness (ΔL*) decreases, whereas a* and b* showed increasing then decreased slowly, indicating chromatic groups formed and then decreased with prolonged irradiation time. ΔE* increase with increasing irradiation time. (2) The amorphous, semi-crystalline and crystalline wood surface occurred at the wavenumbers of 6 996, 6 773 and 6 287 cm-1, respectively increased with prolonged UV-irradiation time. The wavenumber at 5 986 cm-1 assigned to lignin, however, decreased with increasing UV light irradiation time to some degree. Furthermore, the difference spectra between 1 080 h UV light irradiation and control found that the positive values representing cellulose and hemicellulose showed quantitative increment, the negative value representing lignin showed a quantitative decrement in relative content, respectively. (3) The color prediction models established by NIRs information in combination with measuring the L*, a*, b* showed that the determined coefficient (R2) and Ratio of performance to deviation (RPD) were 0.949 and 4.42, 0.928 and 3.73, 0.831 and 2.43 for L*, a* and b*, respectively. These results confirmed that the proposed models, especially L* and a* models, were perfectly suitable for the in-process inspections of the UV-irradiation wood surface color and chemical content changes.
Jan. 01, 2022Vol. 42 Issue 1 56 (2022)
Li-xi LIU, Lin CHEN, Zhi-li CHEN, Jin TANG, Wu-di PENG, Tian-you HU, and Hao-wen WANG
Low-carbon chemical fire accidents have a high risk and great harm. Exploring the flame spectrum characteristics of low-carbon chemicals is of great significance in detecting and identifying such fire hazards and pollution. However, domestic and foreign large-scale low-carbon chemical fire accidents produce toxic and harmful sulfur Research on SOX and NOX gases is rare. In this paper, by building an experimental platform for flame spectrum testing in the 1.2~12 μm infrared band, the flame spectrum test of carbon disulfide, 92# gasoline and alcohol at three different combustion scales of 5, 14 and 20 cm is carried out to explore the effect of flame combustion scale on high-temperature flame molecular radiation The influence of the spectrum. As the combustion scale increases, the flame radiation intensity increases, and the characteristic waveband appears to broaden. Analyze the different flame spectrum characteristics of liquefied natural gas (LNG), acrylonitrile, acetonitrile and 95# gasoline in the four typical chemicals at the 5 cm combustion scale. Using Fourier transform infrared spectrometer to measure the different temperatures of the high-temperature blackbody furnace, the flame spectrum signal is radiated calibration, and the accurate radiant calibration coefficient is obtained, thereby obtaining the radiance value emitted by the high-temperature flame molecules. Moreover, compared with the HITRAN database simulated atmospheric pressure 1 atm, temperature 1 300 K single SO2, H2O, CO2, NO2 molecular radiation spectrum for comparative analysis. Among them, the high temperature flame molecular spectrum mainly has 7.3~7.6, 8.7 and 4.0 μm SO2 bands, 1.8~2.1 and 6.4 μm H2O bands, 4.2~4.6 μm CO2 bands, and 2.5~2.9 μm H2O and CO2 common bands. The high temperature NO2 gas did not reach the detection limit of the infrared spectrometer, and the 6.0~6.4, 3.4 and 2.4 μm NO2 bands can be known through the HITRAN database simulation. In order to further distinguish the flame spectra of various chemicals, the calibrated flame spectrum signal is normalized, and the db2 wavelet basis function is used for 6-layer decomposition to obtain the approximate coefficients of the high frequency part and the detail coefficients of the low-frequency part, by comparing different chemistry, the approximation and detail coefficient difference of the high-temperature flame spectrum. The results show that the flame spectrum characteristics of carbon disulfide and the chemical flame spectrum characteristics of wavelet analysis can be used as an important basis for distinguishing low-carbon chemicals from oils and for subsequent remote sensing detection of low-carbon chemical characteristic pollutants, component concentration inversion and identification evaluation Its pollution hazards lay an important foundation.
Jan. 01, 2022Vol. 42 Issue 1 62 (2022)
Quantitative Inversion Model Based on the Visible and Near-Infrared Spectrum for Skarn-Type Iron Ore
Ya-chun MAO, Jian WEN, Yan-hua FU, Wang CAO, Zhan-guo ZHAO, and Rui-bo DING
Iron ore resources are an important component of the basic industries of China’s national economy and play a pivotal role in China’s economic development. In particular, the efficiency of iron ore grade determination has a significant impact on the efficiency of iron ore mining. At present, the method of iron ore grade determination is mainly based on chemical analysis. However, it not only has the problems of high cost and long assay cycle but also cannot achieve the in-situ determination of iron ore grade, which has a lag effect relative to the ore allocation process and cannot effectively reduce the loss depletion rate of ore mining, so the in-situ determination of iron ore grade based on visible and near-infrared spectral analysis is an effective way to solve this problem. This paper uses visible and near-infrared spectral data and chemical analysis data from 225 test samples of Hongling Skarn-Type iron ores as data sources. First, the original data were smoothed and analyzed for visible and near-infrared spectral characteristics of Skarn-Type iron ores, and then the smoothed spectral data were processed by using two pre-processing methods, including logarithm of reciprocal and multiple scattering correction (MSC). -Before and after pre-processing, the spectral data were processed using two-dimensionality reduction algorithms, including genetic algorithm (GA) and principal component analysis (PCA), and obtain the data sources were processed by six different pre-processing combination algorithms. The PCA dimensionality reduction algorithm was used to reduce the dimensionality of the spectral data before and after the pre-processing, and the dimensionality reduced were 3, 3 and 7 dimensions respectively; The GA dimensionality reduction algorithm was used to reduce the dimensionality of the spectral data before and after the pre-processing, and the dimensionality reduced were 477, 489 and 509 dimensions respectively. Finally, based on Random Forest (RF) and Extreme Learning Machine (ELM), a quantitative inversion model of iron grades in skarn-type ores was established, and the stability, accuracy and credibility of the model were evaluated in terms of coefficient of determination (R2), root means square error (RMSE) and mean relative error (MRE). The results show that the quantitative inversion model based on the ELM algorithm, using MSC-processed and PCA-dimensioned data, is the most effective, with R2 of 0.99, RMSE of 0.005 7 and MRE of 2.0%. The accuracy of the model for inversion of HongLing skarn-type iron ore grades has been significantly improved. This research provides an effective method for the real-time and rapid analysis of skarn-type iron ore grade, which is of great practical importance for efficient skarn-type iron ore mining.
Jan. 01, 2022Vol. 42 Issue 1 68 (2022)
Xin-xin XUE, Wen-bin WANG, Xue-hua LUO, Yong-fa ZHANG, and Chun-mei ZHAO
Nutrient deficiency is a vital limiting factor for crop yield and quality improvement. It has restricted the yield and quality of natural rubber for a long time because of the depletion of soil potassium (K) and magnesium (Mg) and their low plant availability in the Laterite soil of rubber plantations, South China. Rubber seedlings of “CATAS 7-33-97” was chosen as test material, the material composition characteristics of rubber leaves under K and Mg deficiency were studied by Fourier transform infrared spectroscopy (FTIR). The changes and differences of FTIR characteristic peaks of leaves were analyzed, and the material compositions and structures were discussed. It would provide some physiological evidence of rubber plants subjected to K and Mg deficiency stress. The results showed that: (1) the characteristic peaks of 1 554, 1 519 and 1 075 cm-1 disappeared due to K deficiency, implying that the structure of amide Ⅱ band, phenolic compounds and carbohydrate were broken. The relative absorbance of all characteristic peaks was increased compared with normal treatments, suggesting that protein and carbohydrate were accumulated in leaf to reduce their translocation efficiency. (2) The absorption peak at 1 554 cm-1 shifted 6 cm-1 to high frequency as 1 560 cm-1 when the plant was subject to Mg deficiency, which indicated that the structure of the protein amide Ⅱ band was changed. Meanwhile, Mg deficiency decreased the relative absorbance in the range of 1 550~1 350 cm-1, implying that Mg deficiency decreased the contents of polysaccharides and lipid compounds of the leaf cell wall. The three absorption peaks in the wave number of 1 550~1 350 cm-1 were more sensitive to Mg deficiency than other absorption peaks, indicating that the wave band could better represent the magnesium nutrition status of rubber plant leaves. (3) The relative absorbance and intensity of each absorption peak decreased obviously at both K and Mg deficiency. Absorption peaks at 1 554, 1 519 and 1 075 cm-1 disappeared similar to that K deficiency, which indicated that the chemical structure of protein amide Ⅱ band, phenols and carbohydrates was destroyed. Meanwhile, the absorption peak of 1 057 cm-1 shifted to the high frequency direction by 11 cm-1 to 1 068 cm-1, implying the molecular structure of pectin polysaccharides changed in rubber leaves. In conclusion, K deficiency caused a large accumulation of protein and carbohydrates in rubber leaves, and magnesium deficiency caused the decrease of polysaccharide and lipid compounds in the leaf cell wall. However, the contents of protein, lipid and carbohydrates decreased significantly when the plant was subjected to both K and Mg deficiency. The results showed that FTIR technology was feasible for qualitative analysis of the material components of rubber leaves under nutrient deficiency and could provide new ideas and methods for studying the mechanism of K and Mg nutrition and physiological metabolism of the rubber trees.
Jan. 01, 2022Vol. 42 Issue 1 74 (2022)
Wei LI, Xue-li ZHANG, Qin SU, Rui ZHAO, and Hai-yan SONG
Chlorpyrifos is one of the most widely used organophosphorus pesticides (OPs) in agricultural production. However, pesticide residues caused by excessive OPs pose a serious threat to the natural environment and human life and health. Therefore, it is of great significance to develop a rapid, accurate, convenient, and economic method for directly detecting OPs residues in agricultural products. Four groups of chlorpyrifos pesticide solutions with different volume concentrations (1:200, 1:500, 1:800, 1:1 000) were prepared, the control group was treated with pure water.Cabbage leaves were soaked in chlorpyrifos pesticide solutionsfor 3 minutes, 30 leaf samples were collected from each group, and 150 samples were collected from 5 groups. The spectrum information of Chlorpyrifos in cabbage leaves was obtained by visible near-infrared spectroscopy (NIR), and the qualitative analysis of chlorpyrifos pesticide residues in cabbage leaves was carried out. In modeling, 24 samples in each group, 120 samples of 5 groups are taken as modeling training set, 6 samples in each group and 30 samples of 5 groups are taken as prediction set. The near-infrared spectrum analysis will be interfered with by factors such as uneven leaf surface, more wrinkles and different color of cabbage leaves, which makes the establishment of prediction model more difficult. In this paper, an all-band average grouping integration preprocessing method is proposed. The spectral bands are averagely divided into n groups, and then each group of data is integrated as new data for neural network modeling. The experimental results show that the all-band average grouping integration preprocessing method proposed in this paper has the best modeling effect using the spectral reflectance first derivative (FD) when the group number is n=25. The modeling set recognition accuracy is 97.50%, and the prediction set recognition accuracy is 96.67%. The modeling effect is better than the commonly used spectral sensitive and characteristic band modeling method (with modeling set recognition accuracy 91.67%). The all-band average grouping integration preprocessing method can retain more characteristic bands of spectral data and reduce the dimension of spectral data, reducing the impact of single spectral data noise on the modeling effect. Selecting the appropriate grouping number could achieve good modeling and prediction effect. The results of this study can provide a reference for the application of visible near-infrared spectroscopy in the detection of chlorpyrifos pesticide residues.
Jan. 01, 2022Vol. 42 Issue 1 80 (2022)
Development and Application of Fluorescence Suppression Based on Multi Wavelength Raman Spectrometer
Ying ZHAO, Xiao-peng LI, Fei-peng CUI, Jia LIU, and Xiao-jia LI
Raman spectroscopy is a valuable method to explore the structural characteristics of molecular and crystal, which has been widely used in food safety, petrochemical and other fields due to its advantages of fast, non-destructive, small sample consumption, no pretreatment and adaptability. However, it is often interfered with by the fluorescence background when applied, which leads to the decrease of the Raman signal. The Raman signal would be submerged in the fluorescence background in the worst situation. In order to solve the problem that the fluorescence background interference in the application of Raman detection, this research have designed the optical path coupling design of multi-wavelength Raman spectrum with dichroic mirror in the instrument and developed a multi-wavelength fluorescence elimination Raman spectrum detection system combining near Red Raman spectrum and frequency shift differential Raman spectroscopy. The near-infrared Raman spectrum is designed with a 1 064 nm laser source, and the frequency shift differential Raman spectrum is composed of 784.5 and 785.5 nm laser sources. By comparing the intensity and peak stability of synchronous test and successive time-sharing test, the synchronous testing performance of multi-wavelength de fluorescence Raman spectrometer was verified; The single wavelength Raman, near-infrared Raman and frequency shift differential Raman spectra, were compared and analyzed. For acetone, acetonitrile and other samples with weak fluorescence background, single wavelength Raman spectroscopy can be used for the quantitative and qualitative analysis; Near-infrared Raman spectroscopy can be used for the quantitative and qualitative analysis of samples with similar fluorescence background and Raman signal intensity such as edible oil and red plastic particles; For the samples with strong fluorescence background such as red wine and brown plastic particles, the samples can be qualitatively analyzed by near-infrared Raman spectroscopy and differential Raman spectroscopy. The results showed that based on conventional single wavelength Raman spectroscopy technology, we combined the two fluorescence interference suppression technologies through the development of multi-wavelength de fluorescence Raman spectroscopy detection system. This research will expand the range of the application field and sample detection.
Jan. 01, 2022Vol. 42 Issue 1 86 (2022)
Xin-qiang WANG, Feng HU, Wei XIONG, Song YE, Shu LI, Yong-ying GAN, Shan YIN, and Fang-yuan WANG
Spatial heterodyne Raman spectroscopy is a hyperspectral detection technology that has emerged in recent years. It has the characteristics of non-contact, fast, simple, repeatable and no sample preparation required for Raman spectroscopy, but also the advantages of high resolution, high throughput and no moving can detect signals in the characteristic wavelength center range of the measured realize the direct measurement of weak Raman optical signals. Due to the weak signal to be measured, the machining accuracy of optical components, and the errors caused by device packaging and instrument installation, the interferogram received by the spatial heterodyne Raman spectrometer (SHRS) will have uneven light intensity distribution, interference fringe tilt or distortion. Therefore, the accuracy of the spectrum signal obtained by the ordinary spectrum recovery method is reduced or even hard to be identified. According to the error characteristics of the interferogram detected by SHRS, the two-dimensional Fourier transform is applied to the spectral restoration of the SHRS interferogram and a method of extracting the strongest line direction spectrum based on two-dimensional frequency domain spectrum resampling is proposed. The extraction process is to perform a two-dimensional Fourier transform on the collected interferogram of the target to obtain a two-dimensional spectrogram. By using the position information of the characteristic peaks of the two-dimensional spectrum signal of the single-wavelength or multi-wavelength light source collected by the same experimental system, the linear equation of the maximum direction of the light information intensity is obtained by fitting. According to the coordinate position of the intersection point of the straight line and each column of the target two-dimensional spectrogram, the pixels and the weight contributed by the resampling are determined. All columns of pixels is resampled along the fitted linear equation to obtain the final spectral signal. The method is applied to the clover interferogram data, and the recovered spectrum is compared with those obtained by other methods. The results show: compared with the one-dimensional row average spectroscopy method, the spectrum obtained by this method has a more obvious signal intensity in the center area of the detection eliminates the influence of the noise at the same time; compared with the direct extraction method of the two-dimensional spectrum center row, it slightly improves the recovered spectrum. However, due to the influence of the y component of the interference fringe, the final spectrum obtained by resampling along the strongest direction has a narrower half-width of the main peak and a smaller side frequency noise intensity. If the influence of the y component increases, the spectrum restoration effect of this method will become more obvious. This method is a useful supplement and an attempt for data processing of spatial heterodyne Raman spectroscopy.
Jan. 01, 2022Vol. 42 Issue 1 93 (2022)
Xiao-jing WU, Zi-xuan LI, Yan-dong ZHANG, and Long-jiu CHENG
A new green solvent, deep eutectic solvent (DES) performs well in many chemical processes. It should have broad application prospects in popular fields. The spectral analysis of DES is usually based on one-dimensional spectroscopy. However, the spectral data are inaccurate due to low resolution and overlapping peaks. Two-dimensional Raman spectroscopy (2D Raman) can significantly improve spectral resolution and find overlapping peaks. In addition, important conclusions such as the changing order of different spectral peaks and their interaction under external disturbance could be obtained to realize the accurate analysis of complex systems. In this article, DES has been synthesized from choline chloride (ChCl) and ZnCl2. Raman experiments of ChCl and DES have been carried out by micro confocal laser Raman spectrometer. It has been found that the overall intensity of each peak in DES is significantly decreased compared with that of ChCl, and the original spectral peaks remain, indicating that Zn2+ dose not damage the skeleton structure of ChCl. A new characteristic peak appears at 287 cm-1, which is speculated to be the stretching vibration of the Zn—Cl coordination bond, and the Raman experiment of DES is conducted with the temperature rising. The results have shown that, with the increase of temperature, the intensity of asymmetric stretching vibration peak of NC4 decreases, the peak width increases and the peak shape slows down. Furthermore, the intensity of stretching vibration peak of Zn—Cl decreases gradually, the position of the peak remains unchanged, and the peak shape overlaps obviously. 2D Raman studies the characteristic peaks of NC4 and Zn—Cl. The results reveal that the dissociation process of ChCl to Ch+ occurs in the solution, and Zn2+ forms various complexes with Cl-. There is a mutual transformation between $ZnCl_{3}^{-}$, $Zn_{2}Cl_{5}^{-}$ and $Zn_{3}Cl_{7}^{-}$. The peaks at different positions have different orders of temperature change. The characteristic peaks and clusters are assigned, and the sensitivity of each cluster to temperature is obtained. The structure optimization and parameter calculation of the speculated material structure are carried out, which confirm the possibility of its existence. Meanwhile, the feasibility of 2D Raman analysis results is also verified. These results will provide theoretical reference for the research of DES and further expand the application scope of two-dimensional spectroscopy.
Jan. 01, 2022Vol. 42 Issue 1 99 (2022)
Yong-qiang CUI, De-ming KONG, Qin-yong MA, Bei-bei XIE, Xiao-dan ZHANG, De-han KONG, and Ling-fu KONG
As the problem of marine oil spills becomes more and more serious, a variety of remote sensing technologies are used to monitor oil spills on the sea surface. Among them, Laser-Induced Fluorescence (LIF) technology is considered one of the most effective oil spill detection technologies. Based on LIF technology, Hoge et al. proposed an integral inversion algorithm based on Raman scattering light to evaluate the thickness of thin oil film, which has been widely used in oil spill detection on the sea surface. Given the large error of the algorithm, an inversion algorithm for evaluating the thickness of oil spills on the sea surface is proposed by using Raman scattering light and fluorescence signals. Firstly, the oil film thickness is inversed by Raman scattering light signal, and then the fluorescence feature spectrum of oil is calculated using the inversion result, and finally, the oil film thickness is inversed by using the fluorescence signal. The algorithm for inversion of oil film thickness using fluorescence signal is deduced, the approximation algorithm of oil fluorescence feature spectrum and the error analysis of oil film thickness inversion using fluorescence signal is given. Experiments verify the method, Crude oil and diesel are selected as the experimental oil and the laser with wavelength of 405 nm is used as the excitation source. The collection wavelength range is 420~700 nm. The background fluorescence and Raman scattering spectra of sea water, the fluorescence spectra of 2, 5, 10 and 20 μm oil films are collected. The collected data are divided into a training set and a test set. The fluorescence feature spectrum of the oil is obtained by gradient descent method using the training set data, and the oil film thickness is retrieved by the Raman integration method and the method in this paper respectively, using the test set. Using Raman integral method, the average errors for different thicknesses of crude oil are 12.6%, 4.6%, 4.4% and 2.3%, and the average errors for different thicknesses of diesel oil are 14.0%, 7.0%, 4.2% and 3.6%; Using this method, the average errors for different thickness of crude oil are 2.5%, 2.2%, 1.2% and 1.1%, and the average errors for different thickness of diesel oil are 3.0%, 2.4%, 2.7% and 1.6%. The experimental results show that the errors of the 2 μm oil film inversion results are reduced the most. The errors of the 2 μm oil film inversion results for crude oil and diesel oil are reduced from 12.6% and 14.0% to 2.5% and 3.0%. The errors of the oil film inversion results of other thicknesses are also greatly reduced. The errors of the oil film thickness inversion results are all less than 3%. The algorithm can effectively improve the accuracy of the oil film thickness inversion results.
Jan. 01, 2022Vol. 42 Issue 1 104 (2022)
Lin ZHANG, Bao-ying WEN, Wei-wei LIU, Wen-xiang FU, Jing-lin KONG, and Jian-feng LI
Nerve chemical agents have the characteristics of high toxicity, good volatility and fast action, which can cause great casualties in the case of low concentration, so it becomes difficulty to rapid detection in the field. The chemical poison Sarin (Isopropyl Mefluronate, GB) is a commonly used military neurotoxic agent, which can destroy the function of the nervous system by inhibiting acetylcholinesterase, and the degradation rate in the human body is very slow. Based on this, to avoid and reduce the pollution of such poisons and harm to personnel, it is urgent to develop a detection technology with high sensitivity, good accuracy, short response time and portability to detect GB. There are many methods for detecting chemical poisons and their simulants, including spectroscopy, chromatography, surface acoustic wave (SAW) sensors and so on. However, the above methods generally have long response time, poor accuracy, and low detection sensitivity. Therefore, the development of a highly sensitive, simple and fast spectroscopic technique to detect GB has become an important task in chemical weapons detection. Surface-enhanced Raman spectroscopy (SERS) is one of the effective methods to detect trace chemical agents in water due to its high sensitivity, simple operation and fast response time. In this paper, the purchased Ag nano-sol is centrifuged and then assembled on the surface of the silicon-based Au film to prepare a high SERS enhanced substrate to quickly detect the chemical toxicant simulant dimethyl methyl phosphate (DMMP). In the experiment, the detection conditions were optimized and screened by optimizing the ionic strength of the agglomerating agent, test methods and other conditions. By comparing different agglomerating agents HCl, KI, MgSO4, NaCl and NaOH, the optimal ionic strength is finally obtained, and it is determined that 1 mol·L-1 KI has the best effect as the agglomerating agent. In addition, different detection methods were optimized accordingly. By comparing the solid substrate method and the liquid sol method, it was finally found that the improved chip method can obtain better detection results. The final detection method is to mix 1 mol·L-1 of KI with the solution to be measured (DMMP), and then drop it on a pre-prepared SERS chip made of Ag nano-sol as a matrix, using a portable laser with a wavelength of 785 nm Raman directly performs detection, and it can measure as low as 10 μg·L-1. However, it is reported in the literature that the US military’s short-term (less than 7 days) drinking water maximum exposure safety guidelines stipulate that the limit of detection for neurochemical poisons is 10 μg·L-1. Therefore, using this SERS detection method meets the military’s response to chemical warfare or The need for terrorist attacks. The experimental results show that this method breaks through the limitation of the low sensitivity of portable Raman spectrometer, solves the problem of rapid detection of trace nerve agents on-site, and expands the application of SERS technology in the field of chemical reconnaissance.
Jan. 01, 2022Vol. 42 Issue 1 110 (2022)
Yang XU, Lei LEI, Jun YAN, Yu-yun CHEN, Xue-cai TAN, Yu-qian LIU, and Qi WANG
The use of glutaraldehyde in the fine chemical industry has resulted in a large number of glutaraldehyde products such as tanners, disinfectants, protein cross linkers, and tissue curing agents being discharged into water bodies, causing serious pollution to aquatic organisms and the eco environment and harm to the whole ecosystem. Therefore, it is essential to develop a rapid and simple detection technique for glutaraldehyde. Surface enhanced Raman spectroscopy (SERS), an established quantitative detection technique based on the scattering effect of light by the molecules to be measured, offers several advantages such as high sensitivity, low amount of sample required, and small water interference, which is highly functional and widely used in the field of analytical detection. The literature has reported no case for the quantitative detection of glutaraldehyde in environmental water bodies based on SERS technology. A surface-enhanced Raman spectroscopy method determining glutaraldehyde in water was developed based on the local surface plasmon resonance effect of gold nanoparticles, the enrichment and concentration of MIL-101(Cr), and the Schiff base reaction between PATP and glutaraldehyde. Au@MIL-101 was prepared by solution immersion method, and then the Au@MIL-101/PATP composite SERS substrate was obtained by modifying PATP on the surface of gold nanoparticles through the Au-S covalent bond. The substrate material is characterized by transmission electron microscope (TEM), energy dispersive spectroscopy (EDS), X-ray diffraction (XRD), X-ray photoelectron spectroscopy (XPS), and Raman spectroscopy. The effect of the density of Au nanoparticles in the composite substrate on the Raman enhancement effect was studied. The Au@MIL-101 material with chloroauric acid concentration at 0.6 g·L-1 has the best enhancement effect. The Schiff base reaction between GA and PATP produces a characteristic peak of at 1 621 cm-1. Good linearity between the ratio value of I1 078 to I1 621 and GA concentration was obtained in the range of 1×10⁻⁷~1×10⁻⁵ mol·L-1 with the detection limit of 3.5×10⁻⁸ mol·L-1. This method is applied to detect glutaraldehyde in river water and tap water. The recovery rates of standard addition in tap water and river water were 91.4%~111.8%, 89.8%~114.2%, and the relative standard deviations were 5.2%~14.5%, 8.6%~13.4%, respectively. This method has the advantages of simplicity, rapidity, and environmentally friendly, which provides a new way for detecting trace glutaraldehyde in water.
Jan. 01, 2022Vol. 42 Issue 1 115 (2022)
Yuan WANG, Zhen ZHANG, and Yuan GUO
Coherent Anti-Stokes Raman Spectroscopy (CARS) and Coherent Anti-Stokes Hyper-Raman Spectroscopy (CAHRS), as the high-order nonlinear spectroscopy techniques, have been used in many research studies fields such as dynamic process, gene expression spectrum screening, and high-resolution spectroscopy. However, it is difficult to make a quantitative analysis of the spectral signals that involved many high-order micro-polarizability tensors. It has reported that the CARS and CAHRS microscopic hyperpolarizability tensor elements can be decomposed into the product of the differentiation of Raman microscopic polarizability tensor α'i'j' and Hyper-Raman microscopic polarizability tensor β'i'j'k' which simplifies the difficulty of quantitative analysis of higher-order spectra to the analysis of lower-order spectra. In this paper, we use the bond additivity model (BAM) combined with the experimental correction to address the C2v symmetry molecular and present the simplified scheme for differentiation of Hyper-Raman microscopic polarizability tensor elements β'i'j'k'. The differentiation of Hyper-Raman microscopic polarizability tensor elements β'i'j'k' of the C2v molecular group is obtained and the expressions of β'i'j'k' for symmetric and antisymmetric vibrations of the C2v molecular group also are deduced. According to the experimental measurement of the Hyper-Raman spectral intensity ratio of different polarization combinations of the ρHR-SS and ρHR-AS, along with HV polarization combinations of the corresponding vibration modes, the ratio between β'i'j'k' of C2v molecular group modified by Hyper-Raman experiment is obtained. Finally, substituting the experimentally corrected differentiation of Raman microscopic polarizability tensor elements α'i'j' in the literature into the ratio above can obtain the proportional relationship between CARS the microscopic polarizability tensor elements and CAHRS of the C2v molecular group. This method can provide the basis for the quantitative analysis of high-order nonlinear spectral.
Jan. 01, 2022Vol. 42 Issue 1 124 (2022)
Wei-ji ZENG, Si-yu GOU, Jie-ru CAO, Tian-jiu JIANG, and Wei-hong BI
Using three-dimensional fluorescence spectroscopy technology, the relationship between three-dimensional fluorescence and toxicity of 5 strains of 4 microalgae species producing paralytic shellfish poisoning(PSP), which were Alexandrium minutum (Taiwan strain, AMSY), Alexandrium tamarense (Daya Bay strain, ATDY), Gymnodinium catenatum (Fangcheng Lane strain, GCFC), Alexandrium tamarense (Hong Kong strain, ATHK), Alexandrium catenella (South China Sea strain, ACSY), and 21 non-producing PSP microalgae species under different temperature conditions culture was studied. The results show that the toxin content of toxic algae per cell would change significantly under different temperature culture conditions and low temperature could promote the PSP production of toxic microalgae. By Db7 wavelet decomposition, the combined fluorescence spectrum of Ca3 scale components was selected as the characteristic spectrum and was used to establish the Fisher discrimination models, The combined fluorescence spectrum differences between toxic and non- toxic microalgae focused mainly on λex 400~425, 450~545 nm and λem 715~750 nm bands. Using the Fisher discrimination models to dentification the toxic and non-toxic microalgae, the identification rate reached 93.7% and 93.3%, respectively, and the comprehensive discrimination rate was up to 93.5%. The method could be used to rapidly identify toxic microalgae in sea water and provide the theoretical basis for further developing toxic microalgae identification instruments.
Jan. 01, 2022Vol. 42 Issue 1 130 (2022)
Ming-zhu TANG, Zhi-ying WANG, Yun-shan WANG, Wei-jun BAO, Gang YANG, and Yong SUN
Phosphogypsum (PG) is a solid by product generated from the wet phosphoric acid process. A broad spectrum of compositions, including phosphorus, fluorine, silicon, and other hazardous impurities in the PG matrix significantly affect the PG’s quality as the end-products, let alone its persistent ecological and environmental impacts caused by the huge quantity of storage and disposal. Therefore, identification of its impurity phases of PG becomes pivotal. Not only it provides the theoretical guidance for the separation processing but it also sheds insightful lightonits value-added utilization. Different spectral characterization techniques were deployed to unveil its impurity phases in the PG. The X-ray fluorescence spectroscopy (XRF) results show that the elements including P, Si, F and Al remain at a relatively higher level, while the elements such as Ba, Fe and Mg are present at the trace level. The X-ray diffraction spectroscopy (XRD) spectrum presents the dominant crystallite gypsum, whilethe crystal spectrum of other impurities is hardly observed. The electron backscatter diffraction (EBSD) by scanning electron microscope (SEM) results indicate the impurities in the form of silicon dioxide, sodium fluorosilicate, potassium fluorosilicate, calcium fluorophosphate, calcium fluoride, barium sulfate, iron sulfide, and aluminum oxide, etc. These compositions exist as the singular metallic oxides and present in the binary, ternary and multiple metallic oxides complex, making the impurities as a series ofthe composites in the crystallite PG framework. In order to investigate the surface binding energy of the prepared PG, X-ray photoelectron spectroscopy (XPS) was also employed. The results indicate the complexities of the impurities as in the form of calcium silicate,aluminum fluoride, magnesium fluoride, aluminum sulfate, aluminum phosphate, calcium phosphate, calcium hydrogen phosphate and calcium dihydrogen phosphate. In addition, the XPS result also shows the close featured positions, which underpins the characteristic peaks of calcium phosphate, calcium hydrogen phosphate, calcium dihydrogen phosphate and calcium fluorophosphates, indicating their relative similar surface bonding energy. To the best of the author’s knowledge, thecombined characterization techniques using both EBSD and XPS, have been rarely applied in the elucidation of complex phase of the impurities of PG generated from the phosphoric acid process. The inherent advantages of using this proposed hybrid spectrum technique withan accurate establishment of the structure-activity relationship between the impurity phases and calcium sulfate crystal, the comprehensive constructing impurity phases, will pave a new way for the impurity phase characterization, value-added conversion, and integrated utilization of PG.
Jan. 01, 2022Vol. 42 Issue 1 136 (2022)
The potential environmental effects of fecal water are determined by the composition changes of substances. Dissolved organic matter (DOM) is an important component of fecal water. In this study, the content of DOM in pig and dairy manure slurries was analyzed by batch mesophilic anaerobic fermentation with a total solid concentration (TS) of 4% and 8%, respectively. DOM’s fluorescence spectrum characteristics and component variation characteristics in raw and digested slurries were analyzed by three-dimensional fluorescence spectroscopy (3DEEM) and parallel factor analysis (PARAFAC). After mesophilic anaerobic fermentation, there sults showed that DOM content in slurries decreased significantly (ppp<0.01), but the humification degree of DOM in pig manure slurries was significantly higher than that in dairy manure slurries. The results can provide theoretical support for evaluating potential environmental effects of livestock manure slurries utilization in farmland.
Jan. 01, 2022Vol. 42 Issue 1 141 (2022)
Peng TIAN, Xue-song XIAO, Gui-tian SU, Han-feng DUAN, Yao-dong JIN, Yang-yang SONG, Tao HUANG, and Hang ZHANG
Ionic liquids have attracted extensive attention in the chemical industry and related fields due to their unique properties such as low melting point, negligible vapor pressure, wide electrochemical window, high thermal stability and good electrical conductivity. Ionic liquids have low vapor pressure and do not cause air pollution, but that does not mean they are completely environmentally friendly. Most ionic liquids are soluble in water and may enter the aquatic environment through accidental leaks or sewage. Hydrofluoric acid and phosphoric acid are easily formed in the aqueous solution of commonly used ionic liquids [BMIM][PF6] and [BMIM][BF4], which have certain corrosive properties. Therefore, classifying ionic liquids as green solvents also requires data on their toxicity, ecotoxicity studies of metabolism and degradation, or their impact on the environment. Therefore, the detection method of ionic liquid in different solvents is very important. The spectral analysis method of ionic liquid is simple and accurate. Ionic liquids are insoluble with many organic solvents to form homogeneous, stable solutions. The fluorescence detection method has the advantages of high sensitivity, good selectivity, wide linear range and less interference. We have studied the fluorescence spectra of OP-OAc ionic liquid in water, ethanol, acetonitrile and acetic acid. The study results show as follows: the fluorescence intensity of OP-OAc ionic liquid in different solvents is Iacetic acid>Iacetonitrile>Iethanol>Iwater; the order of maximum emission wavelength is λem, water>λem, ethanol>λem, acetonitrile>λem, acetic acid; their maximum emission wavelength is redshifted relative to the excitation wavelength; the fluorescence intensity of OP-OAc ionic liquid in water is highly correlated with its concentration, as the experiment shows that the fluorescence intensity of OP-OAc ionic liquid increases with the addition of methanol, ethanol and acetonitrile, the fluorescence intensity of OP-OAc ionic liquid is the strongest when the ratio of solvent to water is 8:2, and the fluorescence intensity decreases suddenly when the ratio of solvent exceeds 80%; the fluorescence intensity of OP-OAc ionic liquid in water is the highest when pH 10, and the fluorescence intensity is the lowest at pH 14.
Jan. 01, 2022Vol. 42 Issue 1 147 (2022)
When the intelligent algorithm is used to analyze the complex geological samples with serious overlapping spectral peaks, there are some problems such as big calculation, large error of weak peaks, convergence to local minimum or non-convergence. Because of its good convergence, the quantum genetic algorithm can decompose overlapping peaks in X-ray fluorescence spectra. A method of overlapping peak decomposition based on the GMM-ER model and quantum genetic algorithm with multi-fitness function is proposed. The overlapping peak model (GMM-ER) is first introduced based on K-series and L-Series of element characteristic X-ray. Then, based on the physical characteristics of the X-ray fluorescence spectrum, a multi-fitness function is introduced into the traditional quantum genetic algorithm. The simulated spectra are generated by the characteristic X-rays of Mn, Fe, Co and Ni. Then, based on the GMM-ER model, the simulated spectra are analyzed 10 times by traditional quantum genetic algorithm and improved multi-fitness quantum genetic algorithm, respectively. The experimental results show that the average decomposition accuracy of overlapping peaks is improved by 32.1%, and the optimal decomposition accuracy is improved by 73.9%. Using the improved algorithm, the decomposition accuracy of elements with a low content ratio is greatly improved, and the relative error range of element decomposition is reduced by 64.5% under the optimal decomposition accuracy. Moreover, the convergence speed of the improved algorithm is faster than that of the traditional algorithm. This method is suitable for the decomposition of seriously overlapped peaks and has a high resolution for weak peaks.
Jan. 01, 2022Vol. 42 Issue 1 152 (2022)
Xue-jing DAI, Cheng-qing TANG, Meng WANG, and Lin-dong TONG
It is an important basis for detecting cases to develop the latent fingerprints left on the substrates and make individual identification. Optical examination techniques which are nondestructive should be applied first when developing the latent fingerprints found at crime scenes. The practice shows that high contrast and fine ridge detailcan beobtained when applying optical examination techniques to develop the fingerprints on the most smooth substrates, while the physical and chemical methods are needed to develop the fingerprints on substrates of poor smoothness. Among them, the methods of powder dusting and fuming have been widely applied in the development of latent fingerprints. However, the long-term health of forensic technicians has been damaged seriously by most fluorescent powders and fuming materials.In addition,the most commonly employed fingerprint luminescent powders can fluoresce when excited with ultraviolet light. At the same time, the backgrounds can also fluoresce under the excitation of ultraviolet light, which results in low contrast between fingerprint and background. Therefore, it is an urgent task to find a low-cost, non-toxic, easy-to-operate, and widely used method for developing fingerprints. In this paper,the fluorescence characteristics of three non-toxic and inexpensive vegetable powders were studied to apply them to the development of fingerprints. Firstly, the fluorescence excitation spectrum and emission spectrum of three kinds of vegetable powders (broccoli powder, spinach powder and nori powder) were measured through fluorescence spectroscopy(FS). It was found that the fluorescence of broccoli powder was much stronger than that of spinach and nori powder by fluorescence measurement. Therefore, the broccoli powder was chosen to develop the latent fingerprints on trouble some substrates commonly encountered at crime scenes. The experiment results showed that: (1) All the three kinds of powders could fluoresce, and their peak fluorescence excitation wavelengths were all 417 nm, and the peak fluorescence emission wavelengths wereall 678 nm.Among the three kinds of powders, the emission intensity of broccoli powder was the highest. (2) In developing latent fingerprints on a range of highly patterned, colored non-porous and porous substrates,the broccoli powders could emit bright red fluorescence under violet 415 nm illumination. A narrow bandpass interference filter with a central wavelength of around 680 nm was used in front of the lens when photographing the fluorescent prints, and the results showed a high contrast between the fingerprint and the background with fine ridge detail and less interference. (3) Compared with the conventional luminescent powders, broccoli powder had higher development sensitivity. (4) Some backgrounds under violet 415 nm illumination could also fluoresce, but the background fluorescence was weak compared with the strong fluorescence of broccoli powders, revealing high contrast fingerprints with excellent ridge detail. (5) The fluorescence of the fingerprints on rough backgrounds created a sharp contrast, and the rough backgrounds did not interfere with fingerprint ridge, which was clear and coherent. (6) The commercially available broccoli powders used in the experiment had the characteristics of fine particles and strong adsorption ability, which could invoke favoured adhesion characteristics upon contact with fingerprint ridge residues, improving the sensitivity of fingerprint development.
Jan. 01, 2022Vol. 42 Issue 1 158 (2022)
Rong-ke YE, Qing-chen KONG, Dao-liang LI, Ying-yi CHEN, Yu-quan ZHANG, and Chun-hong LIU
To improve the accuracy of shrimp freshness discrimination, we proposed a shrimp freshness detection method based on a broad learning system in this paper. In this study, firstly, multivariate scatter correction (MSC), standard normal variate (SNV), and direct orthogonal signal correction (DOSC) were used to preprocess the raw hyperspectral data of shrimp with different days of refrigeration. And secondly, t-distributed stochastic neighbor embedding (t-SNE) was used to visualize the data after preprocessing, and the visualization results showed that the DOSC-processed data had the best clustering effect. Then, the spectral data after DOSC preprocessing were used for feature extraction using random forest (RF), principal component analysis (PCA), and two-dimensional correction spectroscopy (2D-COS). Finally, the shrimp freshness was modeled based on the characteristic wavelength, and the broad learning system (BLS) was used in shrimp freshness modeling for the first time in this paper and compared with the classical discriminant models such as partial least squares discrimination analysis (PLS-DA) and extreme learning machine (ELM). The results indicated that the RF method minimized the redundant information in the spectra, while the BLS had high accuracy and shorter discrimination time than the linear modeling method PLS-DA and the nonlinear modeling method ELM, and thus the combined RF-BLS model obtained the best freshness discrimination performance. The experimental results indicated that the hyperspectral imaging technology combined with broad learning system to identify shrimp freshness is feasible. The method proposed in this paper can provide a theoretical basis for developing an online shrimp freshness detection system.
Jan. 01, 2022Vol. 42 Issue 1 164 (2022)
Hai-jun ZHU, Hong-yu FU, Xue-hua WANG, Guo-xian CUI, Ai-long SHI, and Wei-chun XUE
Chlorophyll and leaf nitrogen content (LNC) are important indicators of crop growth. Real-time and accurate monitoring of Chlorophyll and LNC is helpful for field management and improvement of crop quality and yield. Currently, hyperspectral technology and empirical regression methods are widely used to construct crop biochemical parameter prediction models. However, there are still gaps in the research on predicting leaf biochemical parameters across periods. In this study, 120 leaf hyperspectral data, chlorophyll and LNC were obtained at five stages of early rice. Three different algorithms, namely, Partial Least Squares Regression (PLSR), Random Forest (RF), and Support Vector Regression (SVR) were used to establish inter-temporal prediction models for Chlorophyll and LNC in different growth stages. In addition, the intertemporal prediction model and the traditional non-intertemporal prediction model were evaluated. The results showed that the early rice chlorophyll inter-temporal prediction SVR model had the best prediction effect, with the inter-tillering prediction model having R2 of 0.54, the inter-booting prediction model has R2 of 0.36, the inter-heading prediction model has R2 of 0.30, inter-grouting prediction model has R2 of 0.55, and inter-mature prediction model has R2 of 0.74. The intertemporal prediction model of early rice leaf LNC was poor, and the LNC cannot be intertemporally predicted. Compared with the non-intertemporal prediction model, although the accuracy of the intertemporal prediction model has decreased, it can effectively overcome the shortcomings of poor universality of the empirical model, which is beneficial to realize the physiological characteristics of different growth stages of crops in the same life cycle. At the same time, we found that crop physiological indicators have inter-temporal predictability. This concept provides new ideas for the prediction of crop phenotype, internal crop quality and yield.
Jan. 01, 2022Vol. 42 Issue 1 170 (2022)
Lu QIAO, Song-lei WANG, Jian-hong GUO, and Xiao-guang HE
Soluble protein and glutathione (GSH) are important physiological and biochemical indicators of mutton, which are also significant in measuring the body’s antioxidant capacity. However, the traditional detection methods are complicated and time-consuming. This report applied visible-near-infrared (400~1 000 nm) hyperspectral imaging technology to achieve nondestructive and rapid detection of soluble protein and glutathione (GSH) content in mutton. Four methods are used to preprocess the original spectral information of the collected 180 mutton samples, and then use the competitive adaptive weighting algorithm (CARS), the wavelength space iterative shrinkage algorithm-iteration and retained information variable method (iVISSA-IRIV) method for characteristics band extraction. At the same time, the gray level co-occurrence matrix method (GLCM) is used to extract the texture information of the principal component image with the highest contribution rate. Finally, the optimized preprocessing method and the characteristic wavelength information are combined with multiple linear regression (MLR), and least squares support vector machine (LS-SVM) prediction models respectively, as spectral information and spectral-texture fusion information, to establish the prediction models of soluble protein and glutathione content of mutton. The results illustrate that the PLSR model of mutton soluble protein content established by the original spectrum without pretreatment has the best effect, and its Rc and Rp are 0.875 7 and 0.854 7, respectively; the PLSR model of mutton GSH content established by the spectra after pretreatment with SNV method work best, with Rc and Rp of 0.804 8 and 0.826 5, respectively. A total of 31 characteristic wavelengths were screened using iVISSA-IRIV, and the Rc and Rp of the established mutton soluble protein LS-SVM model were 0.914 6 and 0.881 8 respectively, which are the best. The meanwhile, 29 characteristic wavelengths were screened using iVISSA-IRIV, and the Rc and Rp of the established mutton GSH-MLR model were optimal, 0.844 6 and 0.870 5, respectively. The comparison of the spectral feature information and the fusion model of the map information revealed that the establishment of the iVISSA-IRIV-LS-SVM model was the best for the prediction of soluble protein in mutton, with Rc and Rp of 0.914 6 and 0.881 8, respectively. The MLR model established by fusion of the spectral feature information extracted by SNV-iVISSA-IRIV method with the texture information is the optimal model for predicting the GSH content of mutton, and its Rc and Rp are 0.849 5 and 0.890 4, respectively. The optimal iVISSA-IRIV-LS-SVM and iVISSA-IRIV-MLR models and imaging processing methods visually represented the spatial distribution of soluble protein and GSH contents of mutton samples in combination with pseudo-color images. The current study demonstrated that the spectral and textural information from hyperspectral images could predict soluble protein and GSH content of mutton.
Jan. 01, 2022Vol. 42 Issue 1 176 (2022)
Yuan ZHONG, Meng-wen QU, and Hsitien Shen Andy
Purple-brownish red garnet is the best-selling garnet variety, that from different origins often have various prices owing to particular hues and clarity, so it is necessary to determine the origins. Tanzania and Australia are two main provenances of purple-brownish red garnets, while Magodi, Zambia, is a newly discovered locality. We compared the chemical composition and spectroscopic characteristics of samples from these localities. LA-ICP-MS testing shows that all samples belong to the pyrope-almandine series. The linear discriminant analysis based on 17 chemical components can distinguish different localities with 96.7% cross-validation accuracy. MgO, FeO, MnO, Co, etc., have larger weights in discrimination than other components based on standardized canonical discriminant function coefficients. According to the distribution curve of rare earth elements, Australian garnets perform an obvious upward trend in heavy rare earth elements. The ratio between the total content of heavy rare earth elements and light rare earth elements was various among localities, 9-175 in Zambia, 50-164 in Tanzania and 191-334 in Australia. With the increase of MgO and the decrease of FeO, Raman peaks related to Si-O stretching vibration, Si—O bending vibration and [SiO4] rotation shift to the direction of high wavenumber. The offset of wavenumber is linearly correlated to the content of Mg and Fe. Thus, the Australian samples can be roughly distinguished by Raman peaks due to lower MgO content. Garnets from three origins also have a difference in hue. Ultraviolet-visible absorption spectra show that the hues are mainly affected by the absorption strength at 425 nm. The ratio between the absorbance at 368 and 503 nm can be used to distinguish three localities, of which Australia is more significant than 1.3, Zambia is between 0.8 and 1.3, and Tanzania is less than 0.8.
Jan. 01, 2022Vol. 42 Issue 1 184 (2022)
Shuang YE, Mei-hua CHEN, Gai WU, and Shuang HE
Based on the analysis of the spectral characteristics of round faceted color-treated purplish-red diamonds from the domestic market, the identification of this kind of diamonds is confirmed. The sample diamonds are purplish-red with different saturation, and the specific gravity of the hydrostatic weighing method is 3.52. Magnification observation shows that partial facets with the weaker luster of DR-2 and DR-3 have ablative areas that are not re-polished, and graphitization is also obvious along with internal stress fracture, both indicating that samples have been treated with high temperature and high pressure. Under the long-wavelength ultraviolet of 365 nm, the chalky fluorescence appearance of blue, orange-red, yellow and green is mixed, and the phosphorescence phenomenon is absent, which is different from the blue fluorescence or no fluorescence phenomenon of nature-colored purplish-red diamonds. Under GV5000, orange-red and blue mixed fluorescence is observed, and the phosphorescence phenomenon is absent. In the mid-infrared spectra, A center and B center, which show aggregation nitrogen correlation, are classified into IaAB type and have characteristic peaks related to H1a radiation annealing, while in the near-infrared spectra, characteristic peaks of H1b, H1c related to irradiation annealing and characteristic peaks of H2 center are shown. UV-VIS-NIR spectra shows obvious NV-, H2 and 806 nm absorption peak; 400~460 and 570 nm broadband reflectivity changes are associated with N3 and NV0 respectively. Obvious NV- is rarely found in natural purplish-red diamonds and H2 indicates diamonds may be treated with high temperature and high pressure. Furthermore, the low absorption of red light and blue light results in purplish-red appearance. Three-dimension fluorescence spectra and photoluminescence spectra show that N3, H3, H4, NV0 and NV- luminescence centers. N3 contributes blue fluorescence, H3 and H4 contribute yellow-green fluorescence, and NV0 and NV- contribute orange-red fluorescence. According to the comprehensive analysis, the three samples are all diamonds of natural origin that have undergone multiple treatments such as high temperature and high pressure, irradiation and annealing, etc., and the purplish-red color is mainly due to the joint contribution of N3, NV0 and NV-.
Jan. 01, 2022Vol. 42 Issue 1 191 (2022)
Feng-ping YU, Jing-jun LIN, Xiao-mei LIN, and Lei LI
Carbon (C) is a trace nonmetallic element in many components of alloy steel. Its content determines the main mechanical properties, grasp the content of element C accurately and timely plays a vital step in the process and sort of alloy steel. Double Pulse Laser-Induced Breakdown Spectroscopy (DP-LIBS) is an effective method for on-line rapid analysis of elements in alloy steel. It not only can deal sample real-time and simple sample pretreatment but also can enhance the intensity of signal and extent of ablation. In order to diminish the matrix effect and raise the precision in quantitative detection of trace element C in LIBS, a modified method of multi-element and multi spectral lines was used with an artificial neural network of back-propagation (BP-ANN). Thus a way of multivariable GA-BP-ANN was created. Firstly, the spectrum of alloy steel samples collected by DP-LIBS in an argon atmosphere, the atomic spectrum at C 193.09 nm was selected as the spectral analysis line of element C. Its intensity can correlate with the content of element C. In order to offer more spectral information and raise the accuracy of quantitative analysis, fifteen characteristic analysis spectral lines of the coexisting elements Fe, Cr, Mn and Si were selected simultaneously. The content of element Fe is rich and relatively stable in samples, which can be used as a standard internal element to reduce the fluctuation of spectral lines; then through the genetic algorithm (GA) searched, the ratios of C/Fe, Cr/Fe, Mn/Fe and Si/Fe were optimized; finally, the input of the three-layer BP-ANN was the intensity ratios of the multi-spectral line pairs selected by GA, and the output was the content of element C, the multivariable GA-BP-ANN calibration was established. In order to contrast the results of predicted, the traditional calibration curve and the univariate BP-ANN calibration methods with C/Fe as input were established. Predicted element C content in alloy steel with leave one sample, compared with the conventional calibration curve and the univariate BP-ANN methods, the average relative error of the predicted samples decreased from 14.78% and 14.75% to 8.29%, the coefficient of fitting determination between the predicted content and the certified content of element C increased from 0.967 4 and 0.974 4 to 0.989 3, respectively. The results showed that the predicted content of element C by the multivariable GA-BP-ANN calibration method was closer to the real content, which proved the feasibility of this method for the LIBS quantitative analysis of element C in alloy steel.
Jan. 01, 2022Vol. 42 Issue 1 197 (2022)
Stellar occultation technology measures the transmission spectra of light of stars through the atmosphere modified by extinction and refraction and obtain various atmospheric density information by using the absorption differences among components of different wavelengths. While the LEO(Low Earth Orbit) satellite and the star are located on both sides of the earth, the low-orbit satellite receives the transmission spectra at different tangent heights, which constitutes a stellar occultation technology observation. The observed height of the transmission spectra can range from the stratosphere to the low thermosphere, and different bands can be used for the inversion of the density of different atmospheric trace components. Stellar occultation technology has the advantages of multiple detection parameters, global coverage, high vertical resolution, and self-calibration. The Global Ozone Monitoring by Occultation of Stars (GOMOS) instrument onboard the European Space Agency’s ENVISAT satellite measures transmission spectra by stellar occultation technology to detect stratospheric ozone trends. GOMOS is precisely designed and high resolution, operating stably for a decade(2002—2012). With the detection wavelength spanning from ultraviolet to visible light, the spectral inversion and vertical inversion method is used to calculate the atmospheric composition density. GOMOS data provides reliable data support for long-term monitoring of changes from the stratosphere to the lower thermosphere. Using the dataset of GOMOS, this paper proposes a simple inversion method the onion-peeling method to retrieve the ozone density in the near-space region. Under the assumption of symmetrical and layered horizontally atmosphere, the onion-peeling method uses a single band spectrum to inversion, assuming that the atmospheric absorption effect of the spectra at this wavelength is entirely caused by ozone, which means the wavelength at which ozone absorption is chosen to occupy absolute advantage. After analysis and comparison, it is suitable to use the spectra of 290 nm to retrieve the density at the altitude during 50~100 km and the spectral of 600 nm to retrieve the density at the altitude during 15~50 km. According to Beer-Lambert’s law, ozone density is obtained by the onion-peeling method using the stellar transmission spectra from top to bottom at the tangent height. The results of this onion-peeling method are consistent with the results official released results of GOMOS.
Jan. 01, 2022Vol. 42 Issue 1 203 (2022)
Jia-nan LÜ, Jun-sheng LI, Guo-xia HUANG, Liu-juan YAN, and Ji MA
The interaction between chrysene (CHR) and herring sperm DNA (hsDNA) was studied by UV-Visible absorption spectra (UV-Vis) and resonance light scattering (RLS) Spectrometry. Ability binding with DNA of CHR was evaluated by calculating the saturation value binding with DNA of CHR. In addition, the effects of temperature, pH, sodium chloride, calcium chloride, vitamin C, sodium dodecyl sulfate on the interaction between CHR and DNA respectively were respectively investigated, which laid the foundation for establishing a method to eliminate CHR by DNA in the future. UV-Vis spectra showed that after DNA was added, the maximum absorption peak of CHR appeared hypochromic effect and accompanied by a red-shift, suggesting that CHR interacted with DNA in an intercalation mode. The RLS spectra showed that CHR had a stable RLS peak at 468 nm. When the concentration of CHR was 2.59×10⁻⁶ mol·L-1, the saturated concentration of binding with DNA was 3.08×10⁻⁶ mol·L-1, saturation value binding with DNA of CHR was 0.84 at 25 ℃, and saturation value binding with DNA of CHR was 0.94 at pH 7.40 at 30 ℃. Under this condition, sodium chloride, calcium chloride, vitamin C, sodium dodecyl sulfate also had different effects on the interaction of CHR with DNA. Saturated value binding with DNA of CHR were 0.84, 0.76, 1.25, 1.07 respectively. Their change rate of saturation value binding with DNA with CHR-DNA-30 ℃ as a standard are -10%, -19%, 33% and 14%, which showed that the presence of cationic can inhibit the combination of CHR with DNA, while a certain concentration of vitamin C and sodium dodecyl sulfonate had a synergistic promotion effect on the interaction of CHR with DNA. This study could provide a reference for establishing a new CHR removal method via DNA based on DNA-intercalation.
Jan. 01, 2022Vol. 42 Issue 1 210 (2022)
Ji-fu LIU, Ming-xing YANG, Yue SU, and Yue LIU
Located on the outskirts of Suizhou City, Hubei Province, the tomb of Marquis Yi of Zeng state is one of the major archaeological discoveries of the 20th century, among which more than 500 pieces of jade and stone tools have been unearthed. The comprehensive and scientific identification of these jade and stone tools with modern testing instruments will be of great academic significance for studying the level of jade used in Zeng during the Eastern Zhou Dynasty. In order to obtain the types and possible sources of archaic jade, this paper takes 319 jade articles as the research objects and adopts the research ideas and methods of gemology and spectroscopy to carry out non-destructive tests on these samples. The surface characteristics, erosion degree and types of samples were preliminarily judged by conventional gemological detection instruments such as tenfold magnifying glass and electronic balance. Fourier transform infrared spectrometer (FTIR) and X-ray fluorescence spectrometer (XRF) were used to analyze the mineral phase and chemical composition of unearthed jade samples quickly and nondestructive. The results show that the materials of unearthed jade can be well distinguished by conventional instrument test combined with infrared spectrum and X-ray fluorescence spectrum. Among the 319 jade articles unearthed from the tomb of Marquis Yi of Zeng, there are 264 tremolite, 43 marble, 8 mica, 1 quartzite, 1 fluorite and 2 crystal. XRF test results showed that tremolite accounted for 82.8% of all samples, and its main chemical composition ranged from MgO=20.03%~27.00%, SiO2=56.31%~61.17%, CaO=14.25%~19.91%, FeTO=0.19%~2.06%, and the calculated value of m(Mg)/m(Mg+Fe) ranged from 0.91~0.99. It can be seen that tremolite jade is the main material of archaic jade from the tomb of Marquis Yi of Zeng. Among them, most of the high-quality tremolite jades were unearthed in independent tombs, reflecting people’s level of using jade and their habits of using it at that time. According to the current research results, combined with the chemical composition analysis and some samples with characteristic weathering cortex and gobi material characteristics, it is speculated that part of archaic jade came from the ancient jade mine of Gansu province. The conclusion of this paper provides more data for further study on the jade system of Zeng state and the Jade Road in the Warring States period.
Jan. 01, 2022Vol. 42 Issue 1 215 (2022)
De-fang LUO, Wei-yang LIU, Jie PENG, Chun-hui FENG, Wen-jun JI, and Zi-jin BAI
Field in-situ visible-near infrared spectroscopy (VIS-NIR) can effectively improve the detection efficiency of soil properties, but due to the influence of in-situ soil moisture factors, the prediction accuracy of soil property models is difficult to reach expectations. How to effectively remove the influence of soil moisture on the spectrum prediction of other soil properties is a difficult problem for using field in-situ spectroscopy to predict soil properties with high precision. It is also a breakthrough for soil spectroscopy technology to shift from indoor to field. The effective solution to this problem can eliminate the process of soil sample collection and indoor pretreatment, and achieve field in-situ spectroscopy of soil properties. In this study, a total of 115 surface soil samples of 0~20 cm were collected by using the grid sampling method in the cotton field of the 12th group in the Alar reclamation area in southern Xinjiang. And use the SR-3500 portable ground object spectrometer to collect 231 sample points of field in-situ spectral data. The soil samples are air-dried, ground and sieved, and then their indoor spectrum and organic matter content are measured. 115 soil samples were divided into two subsets, i.e. the conversion subset (69 samples) and the prediction set (46 samples), with the Kennard-Stone algorithm. The external parameter orthogonalization (EPO), spectral direct standardization (DS) and piece-wise spectral direct standardization (PDS) were performed on spectra and the spectra with other three pretreatments including first-order differential of reflectance (R'), logarithm of reflectance (LOG(R)) and inverse reflectance (1/R), respectively. The random forest (RF) model is used to construct different combination models and evaluate the accuracy. The results showed: (1) The higher the soil organic matter content, the lower the soil spectral reflectance. The in-situ spectral reflectance of soil in the field is lower than the indoor spectral reflectance of soil; (2) The correlation between indoor spectral reflectance and soil organic matter content is greater than that of field in-situ spectra. The correlation between indoor spectra and soil organic matter content is significantly improved after first-order differential transformation. (3) The prediction accuracy of the soil indoor spectral reflectance model (R2=0.86, RPD=2.08, RMSE=1.55 g·kg-1, MAPE=0.14) is higher than the field in-situ spectral reflectance model (R2=0.71, RPD=1.49, RMSE=2.17 g·kg-1, MAPE=0.20). Among the moisture removal algorithm models, the EPO first-order differential model has the best moisture removal effect, with the coefficient of determination R2 increased from 0.71 to 0.83, RPD increased from 1.49 to 2.04, RMSE decreased from 2.17 to 1.58 g·kg-1, and MAPE decreased from 0.20 to 0.14. This study achieved the removal of the influence of soil moisture factors, improved the accuracy of field in-situ spectroscopy prediction of soil organic matter, and provided important reference value for the prediction of large-scale soil organic matter and the evaluation of soil fertility in southern Xinjiang cotton fields.
Jan. 01, 2022Vol. 42 Issue 1 222 (2022)
Qian-qian LONG, Ren-hao ZHOU, De-peng YUE, Teng NIU, Xue-qing MAO, Peng-chong WANG, and Qiang YU
Water conservation is an important part of the ecosystem service function. As a complex ecosystem, forests have different contributions to water conservation. The forest litter plays an important role in the water conservation function, for it directly covers the ground surface. Remote sensing and hyperspectral technology provide a solution for the long-distance detection of water conservation in planar areas. Especially in plateau areas, remote sensing is the most effective way to obtain surface information. In this paper, the hyperspectral data of main tree species were measured by ASD spectrometer in the Grand Canyon research area of Yarlung Zangbo. The litter samples were obtained by sampling on the plot and the water holding capacity of the samples was calculated. Use leaf spectrum information to construct vegetation index related to litter water conservation capacity, then establish multiple regression model of vegetation index and effective retention capacity, and invert the water conservation capacity distribution of main tree species in the Grand Canyon based on Sentinel-2 images. In the end, the accuracy of the inversion model is evaluated based on the verification points. The results showed that: (1) The reflectance of Quercusaqui folioides was the highest, the lowest was the Picea Linzhi, and the total reflectance trend of the three species was similar; (2) The effective interception amount of litter is sorted from large to small as follows: Picea Linzhi (48.36 t·ha-1)>Quercusaqui folioides (39.24 t·ha-1)>Pinus densata (32.32 t·ha-1). Picea Linzhi leaves are easy to decompose and store, Quercusaqui folioides’ leathery leaves and Pinus densata’s oily leaves are not conducive to decomposition. Therefore, the litter of Picea Linzhi has the highest effective interception amount. (3) Through the Person correlation coefficient analysis and the multiple linear regression model, it is found that the higher the wax parameters and attenuation degree of leaves, the weaker the water conservation capacity of litter; the better the vegetation growth trend, the higher the pigment and the water content of leaves, the stronger the water conservation capacity. (4) The results of the accuracy evaluation of the inversion model of the water conservation capacity of litter are good. R2 of the test points of Pinus densata, Picea Linzhi and Quercusaqui folioides is 0.943, 0.815 and 0.812, and RMSE is 1.597, 2.270 and 1.953. It shows that the model can be used for the prediction and distribution of the water conservation capacity of forest litter in Grand Canyon.
Jan. 01, 2022Vol. 42 Issue 1 229 (2022)
Zhi-jun YANG, Meng-ai MAO, Yi-cong HUANG, and Jia-wei ZHANG
Based on the possibility to provide scientific clues for the inversion of diamond formation environment and the design of the diamond synthesis process, the paper studied the relationship between the surface morphology, the content of impurity nitrogen and hydrogen and the degree of order in structure of natural placer diamonds from the western Yangtze Craton by using the optical microscope, infrared spectroscopy and Raman spectroscopy. The results show that the surface morphology on diamond includes micro-morphology related to crystal growth, ablation morphology depend on crystal orientation, ablation morphology independ on crystal orientation, and morphology related to stress deformation. The diamonds mainly belong to type IaAB and the nitrogen content in them is 22.90~752.40 μg·g-1. The concentration of sp3 hybridized C—H bond is higher than of sp2 hybridized C—H bond in most of the samples, that indicated the existence of hydrogen was conducive to transformation from the A nitrogen center to B nitrogen center in diamond and the sp3 hybridized C—H bond may result in the formation of corrosion pits and affect slightly the others morphology of the diamond surface. All of the surface morphologies would lower the degree of order of diamond. The degree of surface order was the highest in diamond with halo and the lowest in diamond with growth lamella.
Jan. 01, 2022Vol. 42 Issue 1 236 (2022)
Guo-hua LIU, Qi-hua LI, Jin-ping OU, Heng XU, Peng-cheng ZHU, and Hao-ran LIU
Formaldehyde (HCHO) greatly influences the human body, climate, and environment and is also an important intermediate product of the atmospheric photochemical reaction. As an important industrial area in Southwest China, Chongqing is the municipality with the largest population and the largest area in China. The backward energy structure and environmental protection facilities and the special terrain and climate characteristics, lead to serious air pollution. Therefore, it is of great significance to study the variation of formaldehyde concentration in Chongqing. In December 2018, a ground multi-axis differential absorption spectroscopy monitoring system (MAX-DOAS) was built in Phoenix Building, Jiangbei District, Chongqing, China. Combined with the spectral processing software QDOAS, the differential slant column concentration (DSCD) of formaldehyde is retrieved by nonlinear least square fitting algorithm, and the atmospheric quality factor (AMF) is obtained by geometric approximation method. Then the slant column concentration (SCD) of formaldehyde is converted into the column concentration (VCD). The analysis showed that the daily and weekly average changes of formaldehyde were similar. The minimum and maximum average concentrations of formaldehyde VCD were 0.982×10¹⁶ and 9.221×10¹⁶ molule·cm-2, respectively. The average daily variation is obvious, higher in the morning and evening and the lowest at noon. It can be seen from the average weekly variation of formaldehyde VCD that the basic trend is consistent with the average daily variation. However, there was no obvious weekend effect and no obvious weekly cycle. Compared with the ground-based MAX-DOAS data and the TROPOMI observation of the satellite product (ozone monitoring instrument), the consistency between the two is good, and the correlation coefficient is 0.84. However, the value of TROPOMI was 21.5% lower than that of MAX-DOAS. The results show that the ground-based MAX-DOAS can provide an effective means for the real-time and rapid monitoring of urban regional pollution gases such as HCHO and the research and analysis of the change law, and can also effectively verify the satellite data sources.
Jan. 01, 2022Vol. 42 Issue 1 243 (2022)
Li-min LU, Bin SHI, Tian-yu TANG, Xian-hao ZHAO, Xiao-nan WEI, and Yan-lin TANG
Epinephrine is a neurotransmitter and hormone transmitter. Studying the spectra and energy levels of the epinephrine molecules may help to understand their chemical stability and pharmacological effects. Based on density functional theory (DFT), the structure of epinephrine was optimized by using Software Gaussian 09 at the level of B3LYP/6-311G(d, p) in this article. On this basis, the first 20 excited states of epinephrine molecule were calculated by using the time-dependent density functional theory (TD-DFT) at the level of PBE/def2tzvp in the gas phase, and ultraviolet spectrum was drawn by using Multiwfn3.7 (dev) software and the properties of excitation are analyzed. The main transitions corresponding to the UV spectrum of adrenaline molecules are those from the ground state to the first, second, fourth, eighth, 15th and 16th excited states respectively. The oscillator strength of other excited states is lower than the threshold value of 0.03. The theoretical calculation showed two absorption peaks in the ultraviolet spectrum of epinephrine, which are located at 206.23 and 273.92 nm respectively. The peak at 206.23 nm is mainly formed from the ground state transition to the 16th excited state, and the peak at 273.92 nm is mainly formed from the ground state transition to the 2nd and 4th excited states. They are mainly produced by the transition from π band to π* band on the benzene ring, and they are in good agreement with the experimental spectrum. The analysis of the excited state properties of adrenergic molecules shows that the absorption peaks are generated in the adjacent orbital transitions of the highest occupied orbital and the lowest vacant orbital. Then, the PBE method based on density functional theory was used to calculate the infrared frequency and draw the infrared spectrum of adrenergic molecules at the base group level of 6-311g (d, p). The vibration analysis shows that the characteristic absorption peak is generated by the phenol hydroxyl O—H vibration at 3 738 and 3 662 cm-1, and the alcohol hydroxyl O—H vibration generates the characteristic absorption peak at 3 715 cm-1. Point 2 854 cm-1 is the characteristic absorption peak generated by the stretching vibration of the C18—H20 bond of methyl, point 1 516 and 1 439 cm-1 are the characteristic absorption peaks of the stretching vibration of the benzene ring, at 1 279 and 1 057 cm-1 respectively were the characteristic absorption peak of the stretching vibration of the C6—O10 and C12—O23 bond, and point 620 cm-1 is the characteristic absorption peak of the oscillation of the N22—H17 bond. The vibration analysis is consistent with the characteristic absorption peaks of various functional groups in the introduction to spectroscopy. By comparing the experimental infrared spectrum of epinephrine, it was found that the characteristic absorption peaks of each group in the theoretical spectrum were relatively obvious, and they were generally in good agreement with the experimental spectrum. Due to the hydrogen bond formed between the adrenergic molecular dimer and the polymer, the hydrogen bond formed between the molecules weakens the strength of the O—H bond. It reduces the stretching vibration frequency of the hydroxyl O—H that can form the inter-molecular hydrogen bond, which results in a wide peak of the experimental spectrum between 3 500 and 2 500 cm-1.
Jan. 01, 2022Vol. 42 Issue 1 248 (2022)
Ying LI, Zhen-yu ZHOU, Yi-min YANG, and Wu-gan LUO
It is a fundamental assignment and an essential work to identify stone tools in the paleolithic archaeology study because the material is an essential factor influencing manufacturing technology, the shape and the type of tools, the stone industry, and the cultural features of one site. However, archaeologists may misjudge the stone tools material only from morphology, especially when identifying natural glasses, such as tektite and obsidian, which have a similar appearance. Many examples manifest that it is unreliable only to use the manual inspection to indentify the stone material. Hence, using scientific instruments to obtain more information to identify the materials is a more reliable way. Dingsishan site, as a significant stone age site in the Lingnan area, provides valuable information about the characteristics and connotation of prehistoric culture in Guangxi, and allows the exploration of the prehistoric cultural exchanges between Guangxi and surrounding areas. However, the explorers doubted the rature of black stone artifacts unearthed in the Dingsishan site. So in this article, Raman spectroscopy, Fourier Transform Infrared spectroscopy (FT-IR), and Energy Dispersion X-ray Fluorescence Spectrometer (ED-XRF) were used to analyze the material of black stones. Eleven black stones were excavated from the Dingsishan Assemblage in Yongning County, Guangxi, and two black stones were collected from Baise, Guangxi. The Raman spectroscopy results indicate that samples are amorphous SiO2. Moreover, all the samples have a strong peak at 380 cm-1, which may be caused by pyrite. The FT-IR results reveal that all samples have no prominent absorption peaks at 750~500 cm-1 and no shoulder peaks at 1 200~900 cm-1, indicating no plagioclase or quartz in the samples, which is consistent with the characteristics of tektite. The chemical composition results indicate that SiO2 and Al2O3 mainly compose the samples. Additionally, the samples have high iron and alkaline earth oxide (RO) contents and low alkali (R2O) contents. Furthermore, the ratio of R2O/RO is less than 1, and the ratio of K2O/CaO is about 1. All these chemical composition features are in accord with the composition characteristics of the tektite. Based on the above results, it can be determined that the 13 black stones analyzed in this article are tektite. This article can provide more references about the raw material sources and the activity range of prehistoric people. Dingsishan site, as one of the most critical Stones Age assemblages in South China, the follow-up stone source study in this assemblage can provide more information for the exchange system among south China and their surrounding areas (Southeast Asia).
Jan. 01, 2022Vol. 42 Issue 1 253 (2022)
Xin-wei LIU, Mei-hua CHEN, Gai WU, Si-ming LU, and Ying BAI
Synthetic CVD single crystal diamond is one of the hot spot issues in superhard materials and gemology. Whereas most large single-crystal diamonds synthesized by CVD methods often come with a brown hue. CVD diamonds are often treated by the high temperature and high pressure (HPHT) method to improve the color and transparency. In this paper, based on the previous HPHT experiments, three samples with obvious positive effects are selected, utilizing a series of spectrum tests like UV-Vis absorption spectroscopy, infrared spectroscopy, photoluminescence spectroscopy, three-dimensional fluorescence spectroscopy, laser Raman spectroscopy and X-ray rocking curves to compare. Results indicated that brown and dark brown samples annealed at high temperatures work well. The absorption coefficient of the UV-Vis absorption spectrum of the sample decreases obviously, and transparency has improved significantly. Mid-infrared and near-infrared spectroscopy of CVD diamonds before and after HPHT-processing shows that the absorption peak at 1 332 cm-1 is related to the N+ center, a common feature of CVD brown diamonds. The absorption peak at 3 124 cm-1 is related to the NVH0 defect center, common in CVD diamonds and HPHT treated diamonds. Meanwhile, a set of absorption peaks at 2 700~3 200 cm-1 was observed, associated with C—H stretching vibration. High temperature has a great influence on the H groups in CVD diamonds. After HPHT treatment at 5~6 GPa 1 500~1 700 ℃, in near-infrared band shows a set of absorption peaks at 4 337, 6 352, 7 354, 7 540, 7 804 and 8 535 cm-1. Therefore, the appearance of these peaks can indicate that the sample has been treated at a high temperature. This study can provide bases for the identification of CVD diamonds, and HPHT treated CVD diamonds. The results of photoluminescence spectroscopy and three-dimensional fluorescence spectroscopy shows that the concentration of NV- center decreases while the concentration of SiV- center increases. Only when the temperature is above 1 500 ℃ at 5~6 GPa, thethree-dimensional fluorescence spectra of the samples were enhanced at λex/λem=500 nm/575 nm while the fluorescence peak disappeared at λex/λem=490 nm/550 nm. In a sense, the peak changes can indicate that the sample was treated at a high temperature. The phase analysis results show that the Raman shift FWHM at 1 332 cm-1 and XRD rocking curve FWHM decreases after HPHT-processing, which shows good consistency. The crystallization quality of brown CVD diamonds gets better after HPHT-processing.
Jan. 01, 2022Vol. 42 Issue 1 258 (2022)
Cheng JIANG, Gui-qian TANG, Qi-hua LI, Bao-xian LIU, Meng WANG, and Yue-si WANG
Aerosol vertical profile is a necessary means to evaluate the source and transport of pollutants. Aerosol pollution has a direct impact on the environment and human health. In April—May 2019, we observed the vertical profile of atmospheric spectra in the Beijing area in spring using the ground-based Multi-axis differential optical absorption spectroscopy (MAX-DOAS) of the Institute of Atmospheric Physics, Chinese Academy of Sciences (39.98°N, 116.39°E). MAX-DOAS can effectively monitor aerosols by virtue of its real-time, online and continuous advantages. MAX-DOAS is based on the optical estimation method (OEM), and the least square spectral fitting method, the radiation transmission model SCIATRAN is used as the forward model, and the HEIPRO algorithm is used to invert the vertical profile of the aerosol extinction coefficient. The aerosol optical depth (AOD) was obtained by integrating the aerosol extinction coefficient in its path. The AOD observed by ground-based solar photometer and particle mass concentration observed by high tower was compared with the AOD and aerosol extinction coefficient observed by MAX-DOAS respectively, to verify the applicability of the MAX-DOAS algorithm. The results show that the correlation coefficient of AOD measured by MAX-DOAS and solar photometer is 0.92 with a slope of 0.89. The Pearson correlation coefficient between the extinction coefficient of three-layer aerosol and the mass concentration of PM2.5 reaches 0.69 (60 m), 0.77 (160 m) and 0.75 (280 m) respectively from low to high. In addition, the average aerosol extinction coefficient was compared with the average PM2.5 mass concentration of the corresponding three layers (60, 160 and 280 m), and the trend was consistent. Similarly, to verify whether MAX-DOAS can accurately identify the long-distance transport of pollutants, we determine the sand and dust weather through Angstrom exponent and determine the static and stable weather by calculating the gradient Richardson number and boundary layer height. It is analyzed that MAX-DOAS can respond quickly to sand and static and stable weather under special weather conditions. The average extinction coefficient of aerosols was used to explore, and it was found that the vertical profile of aerosols showed an exponential decay trend with height increasing. The average extinction coefficient of aerosols at the height of 1.5 km was about 50% of that near the ground, while the extinction coefficient above 1.5 km decreased rapidly with height increasing. When the height reached about 2 km, the average extinction coefficient of the aerosol decreased to 0.1 km-1. The above results show that MAX-DOAS has high applicability in detecting atmospheric aerosol vertical profiles.
Jan. 01, 2022Vol. 42 Issue 1 265 (2022)
Pei-chao ZHENG, Yuan-jiang LUO, Jin-mei WANG, Qiang HU, Yang YANG, Xue-feng MAO, Chun-hong LAI, Chu-hui FENG, and Yu-tong HE
Strontium element is an indispensable trace element in the human body, and strontium rich mineral water is an important means of supplementing strontium in the human body. At present, the conventional analytical methods used to detect strontium elements in strontium-rich mineral water, such as AAS, AFS, IC, ICP-AES/MS, etc., have the advantages of high detection sensitivity and good detection stability. However, these instruments are bulky, expensive, and energy-intensive, moreover some require inert/special gases, which are not suitable for field, real-time and online continuous monitoring. Therefore, it is of great significance to develop a miniaturized, low-cost and rapid spectral detection technology for the effective measurement of strontium. In recent years, Solution cathode glow discharge-atomic emission spectrometry (SCGD-AES) is a rapidly developing for detecting metal elements in an aqueous solution. Here, the SCGD-AES system was established to measure the concentration of strontium in strontium-rich mineral water. The experimental parameters such as discharge current, sample flow rate and pH on the SBR of strontium were investigated, and the optimal experimental parameters for quantitative analysis of strontium were as follows: 1.85 mL·min-1 for the sample flow rate, 75 mA for the discharge current, and the electrolyte acidified to pH 1.0 by HNO3. 460.77 nm was selected as the strontium analytical spectrum line, and the strontium solution was determined under the above optimal working conditions. The emission spectral stability of strontium was 0.52% (n=21). The strontium concentration shows a linear relationship with its emission intensity in the range of 0.1~20 mg·L-1, and the linear correlation coefficient is 0.999 6. The detection limits of strontium were 29 μg·L-1 for the homemade SCGD-AES. The established SCGD-AES detection system measured three types of strontium-rich mineral water in the market, and the results were agreed with the results of inductively coupled plasma-atomic emission spectrometry. In addition, the recoveries of bottled mineral water are 98.8%~107.6%. The results show that SCGD-AES is an effective method for the determination of strontium in strontium-rich mineral water.
Jan. 01, 2022Vol. 42 Issue 1 272 (2022)
Hong-qiu ZHU, Fei CHENG, Hao-nan HU, Can ZHOU, and Yong-gang LI
In the process of collecting spectrum signals, the spectrum data is often interfered with by the optical system and electronic circuit of the instrument, which results in noise and characteristic peaks of the light source, and seriously interferes with the spectrum characteristic of the real spectrum signal. Therefore, it is necessary to use a reasonable preprocessing method to retain the useful signal in the spectrum signal, filter the noise signal as much as possible and filter the light source characteristic peak to improve the robustness and accuracy of the quantitative analysis of spectral information. Spectrum online detection system requires minimizing the influence of human parameter selection on the denoising effect. Singular value decomposition (SVD) is often applied to the denoising caused by the system circuit. The selection of the order of singular value denoising is very important to improve the signal-to-noise ratio. However, the selection of parameters mainly depends on empirical debugging and experimental verification. Therefore, this paper proposes a spectral signal denoising algorithm based on singular value reconstruction of signal component frequency. The algorithm firstly reconstructs the single singular value component signal of the original spectral signal. Then, the Fast Fourier Transform (FFT) of each singular value component signal is performed to obtain the frequency value corresponding to the maximum amplitude of each signal. Finally, according to the singular value decreasing mode, the first-order hysteresis difference of the corresponding component signal frequency value is carried out, and the frequency difference spectrum is obtained. The results show that the first peak value of the difference spectrum is the effective order of singular value decomposition denoising. Random noise of different intensity is added to the UV-Visible spectrum signal measured online of a solution containing a variety of metals, and the signal to noise ratio and root mean square error are compared. The results show that the proposed algorithm’s signal-to-noise ratio and root mean square error are 22.05%, 10.88% and 74.28%, 41.29% higher than those of SG filter and wavelet transform respectively. The proposed algorithm is fully data driven, which not only suppresses the noise effect in processing the real UV-Vis spectrum signal, but also effectively filters out the characteristic peak of the light source of the micro spectrometer, so it has a good application prospect in the quantitative analysis of UV-Vis spectrum signal.
Jan. 01, 2022Vol. 42 Issue 1 277 (2022)
Xiao-kang ZHAO, Xin ZHAO, Qi-bing ZHU, and Min HUANG
The essence of using near-infrared spectroscopy to realize non-destructive detection of agricultural products and food quality is to establish a machine learning model between sample spectral information and sample quality parameters. In order to obtain a machine learning model with good generalization performance, a large number of labeled samples are usually required. However, it is relatively easy to obtain spectral information of samples, but labeling samples quality parameters often involves a large amount of time and economic costs and is destructive. Active learning is a method to reduce the number of labeled samples in training set by selecting the most valuable samples for labeling instead of random selection. Therefore, active learning can control which samples are added to the training set, and the model no longer passively accepts samples for modeling. There have been many active learning algorithms in classification tasks. There are relatively few researches in regression tasks. Moreover, most of the existing active learning algorithms for regression tasks are supervised. That is, a small number of labeled samples are needed to train the initial model. In this paper, a training sample selection strategy based on unsupervised active learning is proposed. Firstly, the method divides the diversity of unlabeled (standard value) spectral datasets through hierarchical agglomerative clustering to obtain different clustering clusters. Then, the locally linear reconstruction method selects the most representative samples in each clustering cluster to form a training sample set and establish the partial least squares regression model based on the training set to predict the unlabeled samples. In this paper, partial least squares prediction models for soluble solids content and firmness prediction were constructed to evaluate the proposed method’s performance, using the near infrared spectrum data of three varieties of apples from two years. The experimental results show that the method proposed in this paper is superior to the existing sample selection strategy, which can effectively improve the model accuracy and reduce destructive physical and chemical experiments in model training. Meanwhile, compared with random sampling (RS), traditional Kennard-Stone (KS) and joint x-y distances (SPXY), the proposed method achieved the optimal performance. The root mean square error of the soluble solid content prediction models based on the unsupervised active learning algorithm proposed in this paper, which selects 200 samples as the training set, is reduced by 2.0%~13.2% compared with the other three algorithms, and the root means square error of the firmness prediction models is reduced by 1.2%~15.7%.
Jan. 01, 2022Vol. 42 Issue 1 282 (2022)
Qing-liang JIAO, Ming LIU, Kun YU, Zi-long LIU, Ling-qin KONG, Mei HUI, Li-quan DONG, and Yue-jin ZHAO
The techniques of Spectral Pre-Processingis important in qualitative spectral analysis. They were aiming at the problems of poor preservation of weak peaks in denoising algorithms, over-deduction of real spectral in baseline correction algorithms, inaccurate location of spectral peaks method, and error accumulation caused by serial use of various preprocessing algorithms. In this paper, we design a convolutional neural network (CNN). This CNN consists of two modules: baseline correction and denoising module and peak detection module, which are connected and output independently. In the ideal conditions, according to the spectrumlinear function, the ideal spectrum can be obtained by fitting the spectral peak location. Therefore, connecting the output of the spectral peak detection module to the baseline correction and denoising module can improve the accuracy of baseline correction and denoising effectively; and high-quality spectrum is the basis ofspectral peak detection. Hence the interconnection of two modules can improve the quality of the reconstructed spectrum effectively.The spectral baseline correctionand denoising module is a feed forward network consisting of several convolution layers, activation functions and batch normalization layers.The characteristic peak detection module is a multi-scale feature fusion network, that uses different-sized convolution kernels to divide the feature spectrum into different scales. The module fuses feature of different sizes to estimate the location of the characteristic spectral peak. During the training of the proposed CNN, the spectrum obtained by spectrophotometers with different temperatures, humidity and preheating times were used as input samples. The spectrum obtained from standard instruments of the National Institute of Metrology was used as output samples.In the experiment, noise with different SNR and Gaussian baselines with different peak values were added to the synthesized spectrum applied to evaluate the superiority of proposed CNN in denoising, baseline correction and spectral characteristic peak detection. Then the near-infrared spectrum of the corn, which was added noise and baseline, were taken as samples. Moreover, they, which were preprocessed using preprocessing algorithms, were applied to estimate the concentration of water and oilin corn by partial least squares. The estimated concentration compares with the real concentration, which is measured with a standard instrument, to prove the advantage of the proposed CNN. Experiments show that theproposed CNN can achieve good results in both single-task and multi-task preprocessing. Moreover, the spectrum preprocessed by the proposed CNN can get the most accurate results in quantitative analysis, which demonstrates that the proposed CNN has strong practical value.
Jan. 01, 2022Vol. 42 Issue 1 292 (2022)
Sheng-yuan REN, Ming-yong JING, Hao ZHANG, Xiao-bo WANG, and Lin-jie ZHANG
Atom-based quantum precision measurement of time, frequency, length, magnetic field and other physical quantities has attracted widespread attention in recent years. As a precision microwave measurement sensor, Rydberg atoms have the advantages of good traceability, high detection sensitivity and spatial resolution. In this paper, the cesium Rydberg atoms at room temperature are used to realize high-resolution vector measurement of microwave electric field based on the characteristic of the electromagnetically induced transparency spectroscopy. The microwave electric field with the frequency of 5.365 GHz couples the Rydberg transition of 51D5/2-52P3/2. The electromagnetically induced transparency spectrum of a 6S1/2-6P3/2-51D5/2 ladder system will split because of the Autler-Townes effect. The intensity of the microwave electric field is obtained by calculating the splitting separation. The spatial resolution reaches 1/31 of the measured microwave wavelength. A new method for measuring the polarization direction of microwave electric field is proposed, which solves the problem that the complementary angle cannot be identified in the measurement of the polarization direction of microwave electric field. Through the near-field vector measurement of the scattering field of a radio frequency identification tag, the effective angular resolution of the tag is achieved and reaches 1.64°. The measurement results are in good agreement with the simulation results of the finite element analysis method. This paper present the valuable explore for the microwave electric field spatial high-resolution imaging, offer the evaluation tools for the design and identification of radio frequency identification tags, and electromagnetic compatibility testing.
Jan. 01, 2022Vol. 42 Issue 1 298 (2022)
Yan LIN, Jun-hong SU, Yan-lin TANG, and Dan YANG
Vitamin C is an acidic hexose derivative, which has two isomers of L-type (ascorbic acid (AA)) and D-type (dehydroascorbic acid (DHA)). DHA is the first stable oxidation product of AA and is the reversible oxidized form of AA. Therefore, any discussion of the nature and measurement of AA will involve the nature of DHA in the same system. The ultraviolet spectrum is a visual representation of how easy and difficult the electron transition is. Unreasonable theoretical calculation method and molecular model construction will lead to misjudgment of the maximum absorption peak of vitamin C, and thus can not accurately characterize the excitation properties of vitamin C. In order to accurately explore the antioxidant mechanism of vitamin C, based on density functional theory (DFT) and time-dependent density functional theory (TD-DFT), the molecular structure, ultraviolet spectrum and electron excitation characteristics of ascorbic acid (AA) and dehydroascorbic acid (DHA) of vitamin C were calculated and analyzed at the level of pbepbe/6-311++g(2d,2p) and B3LYP/6-311++g(2d,2p) in liquid phase environment in this paper. The results showed that the pbepbe/6-311++g(2d, 2p) method is the more accurate method to calculate the ultraviolet absorption spectrum of AA. Compared with AA, the ring structure of DHA has a significant plane distortion than AA. According to the analysis of the spectral contribution shows that the ground state transition to S1, S2, S3, S4, S14, S18 excited state is the main reason for AA ultraviolet spectrum, the absorption peak of AA at 200.171 5 nm contains the electronic excitations of n→π* and n→σ* electronic transitions, the absorption peak at 266.924 8 nm contains n→π* and π→π* transitions. The reason for the ultraviolet spectrum of DHA is mainly due to the ground state transition to S6, S9, S12, S13, S15, S16, S17, S19, S20 excited state, the strongest absorption peak of DHA is located at 181.024 8 nm, which has the transition characteristics of n→σ* and n→π*. The weak absorption peak at 231.346 39 nm refers to the n→π* transition, and the absorption peak at 282.466 8 nm mainly corresponds to the n→π* transition. By analysing the hole-electron distribution and its derivatives, it is possible to qualitatively identify the characteristics of the 7 excited states that play a major role in the AA absorption peak and the 9 excited states that make major contributions in the DHA absorption peak. Among them, the S4, S13, S14 excited states that make major contributions to the AA ultraviolet spectrum and the S6, S9, S17, S20 excited states that make major contributions to the DHA ultraviolet spectrum have obvious charge transfer, the centroid center of the hole and the center of the electron centroid are separated, which can be referred to as the charge transfer excitation, the separation of electrons and holes in other excited states is very small, which can be referred to as local excitation.
Jan. 01, 2022Vol. 42 Issue 1 304 (2022)
Hong-sheng SUN, Xin-gang LIANG, Wei-gang MA, Yu-feng ZHANG, Chao QIU, and Yue-gang MA
Emissivity is an important parameter to characterize the thermophysical properties of materials. For non-conductive materials, high-temperature furnace heating or radiant heating is generally used in emissivity measurement. The problem in high-temperature furnace heating method is that tested materials may chemically react with the material of the heating container, thereby destroying the original characteristics of the materials. There will be problems of non-uniform heating of samples in the radiant heating method. The tested materials are usually heated unidirectionally and still in the radiant heating method, so there will be samples non-uniform distribution of sample temperature gradient. Based on laser rotating heating and sample/black body integrated design, this paper proposes a new method. The samples are spinning while measuring, measuring the emissivity of non-conductive materials at high temperature, and establishing a corresponding measurement model. This method break through the limitations of traditional measurement methods, in which the samples are still while measuring. The sample and black body are designed integrally, and the micro-area spectral radiation imaging method is adopted to measure the spectral radiation energy and temperature of the black reference body and the sample at the same time. The heat conduction equation under the laser rotating heating state is established, and the temperature distribution of typical sample materials is simulated. The results show that the temperature field distribution of the rotating sample is relatively uniform. The relationship between the temperature field distribution and the infrared spectral emissivity measurement error is analyzed. The lower limit of the material thermal conductivity applicable to this test method is shown. Based on this method, a corresponding measurement device was built to test the spectral emissivity of a typical material silicon carbide at 1 000 K. The spectral emissivity of each specific high-temperature point was tested at 4 μm, and the silicon carbide material was measured at The characteristics of the spectral emissivity wavelength change and temperature change rule characteristics of the infrared band. The results are compared with the foreign measurement results, and the results are relatively consistent, which verifies the feasibility of the laser rotating heating spectral emissivity test method. The characteristics of the spectral emissivity wavelength change and temperature change rule characteristics of the silicon carbide material in the infrared band are obtained. The results are compared with the foreign measurement results, and the results are relatively consistent, which verifies the feasibility of the laser rotating heating spectral emissivity test method. With this method, the physical and chemical characteristics of the sample are not destroyed, the sample heats up quickly, the temperature field in the measurement area is uniform, the upper limit of the measurement temperature range is high, and the temperature unevenness caused by the laser static and unidirectional heating is reduced effectively. The sample’s temperature and spectral radiation energy can be measured at the same time, so the standard high temperature black body does not need to be designed separately. This method solves the existing high-temperature non-uniform heating and radiant energy synchronous comparison measurement in non-conductive materials emissivity measurement. It can be applied to measure the high-temperature spectral emissivity of various non-conductive materials.
Jan. 01, 2022Vol. 42 Issue 1 310 (2022)
Shen-he REN, Ming GAO, Ming-jun WANG, Yan LI, and Lei-li GUO
An altitude cirrus cloud is mostly composed of ice particles, which affects laser signal transmission over ground to air links. Basing on, the distribution and scattering characteristics of ice crystal particles in high altitude cirrus cloud sand by cirrus clouds considering the spherical curvature of the Earth and multiple scattering, the laser transmission and attenuation characteristics of spherical boundary clouds, are studied in this paper using the spherical model of the discrete ordinate method (CDISORT). The laser transmittance differences between the plane-parallel model and the quasi-spherical model in the ice cloud atmosphere under different solar zenith angles are compared. The laser signal propagation’s attenuation and transmittance characteristics are compared through cirrus clouds at three wavelengths(0.65, 1.06, 3.8 μm)are calculated numerically. The results show that when the solar zenith angle is small, the relative error of the laser transmittance between the two models is very small when the solar zenith angle is less than 80°, the relative error between the two models at the laser wavelength of 0.65 μm is only 1.72% when the radiation transfer equation of the spherical atmosphere is calculated according to the plane-parallel atmosphere model, however, when the solar zenith angle is greater than 80°, the relative error of the laser transmittance between the two models in the ice cloud atmosphere increases, the relative error between the two models at the laser wavelength of 0.65 μm is 69%; The laser attenuation caused by propagation through the clouds is related to the effective radius, transmission distance, and laser wavelength when a single scattering of a cirrus cloud is considered, as the optical thickness increases and the laser transmittance’s change with the cloud layer decreases, the maximum transmittance is achieved at the laser wavelength of 1.06 μm and the minimum transmittance is achieved at the laser wavelength of 3.8 μm; The laser transmittance at the wavelengths of 0.65 and 1.06 μm increases with the effective radius of cloud particles, but at the wavelength of 3.8 μm, it does not increase under the same constraints, the laser transmittance of cloud decreases with the increase of relative azimuth, and different cirrus dispersion models have different effects on the laser transmittance. The results of the characteristics of laser transmission through cirrus clouds presented in this works provide an important theoretical basis for engineering applications, including ground-to-air link satellite-borne, airborne laser communication, laser radar detection, at the same time, it can lay a research foundation for the application of laser remote sensing, guidance and early warning of ground to air link.
Jan. 01, 2022Vol. 42 Issue 1 316 (2022)
Qing YU, Xiao-li CHEN, Qi-long ZHANG, Hua LIU, Xian-jiong YANG, Hong XU, Ya-li HUANG, Xing FENG, Carl REDSHAW, and [in Chinese]
The real-time detection and monitoring of hypochlorites (ClO-) in water is highly challenging. An excellent colorimetric “naked-eye” probe photoacid (PAH) was synthesized. PAH was comfirmed using High-Resolution Mass Spectrometry (HRMS), 1H NMR and 13C NMR. The interaction between PAH and ClO- was investigated via UV-Vis absorption spectrophotometry under different pH conditions. The results indicated that PAH was completely soluble in water, PAH displayed a yellow solution in a phosphate buffer with a pH of 2.0 to 5.0, and the maximum absorption peak was at 424 nm. PAH displayed a purple solution in a phosphate buffer with a pH of 6.0~12.0, and the maximum absorption peak was at 532 nm. After adding ClO- to different pH systems, PAH discoloration and the UV-Vis absorption peak disappeared. The probe PAH exhibited specific selectivity and sensitivity for ClO- detection with a low detection limit in the pH 5.0 phosphate buffer. After PAH reacted with ClO-, the absorption peak of the probe at 424 nm gradually decreased, and a new absorption peak appeared at 532 nm. The probe displayed a vivid color-tunable process from yellow to purple then to colorless with a fast response time for ClO- detection. However, other common 33 substances such as metal ions(Li+, Co2+, Cr3+, K+, Cd2+, Pb2+, Ca2+, Hg2+, Ba2+, Cu2+, Mg2+, Ni2+, Zn2+, Al3+ and Fe3+), anions ($NO_{2}^{-}$, I-, AcO-, $ClO_{4}^{-}$, $SO_{4}^{2-}$, CN-, Br-, $CO_{3}^{2-}$ and F-), reactive oxygen species (ROO·, ·OH, H2O2, · $O_{2}^{-}$, tBuOOH, tBuO· and 1O2) and reactive nitrogen species (ONOO- and NO·), did not cause changes in the color of the probe solution and the UV-Vis absorption spectrum. The above species had only a limited effect on detecting the ClO- anion. When they coexisted with ClO-, the probe also showed a similar solution color change, and the absorption peak at 424 nm disappeared. Meanwhile, the probe PAH could quantitatively detect the content of ClO- with a detection limit of 5.39 μmol·L-1 (y=1.586 78-0.524 51x, R2=0.998 52). Furthermore, ClO- concentration in the water system (84 disinfectant and tap water) was analyzed. The average concentration of ClO- ion in the tap water measured by three parallel tests was 7.96 μmol·L-1 with high recoveries rate. It showed that PAH could also be utilized to detect ClO- quantitatively in real water systems.
Jan. 01, 2022Vol. 42 Issue 1 322 (2022)
© Copyright 2018-2021 | Chinese Laser Press.
All Rights Reserved 沪ICP备15018463号-20