


Please enter the answer below before you can view the full text.


2025
Volume: 52 Issue 17
24 Article(s)

Prediction and Correction of Aberration Mode Coefficients Based on Linear Quadratic Gaussian Control
Bang Zhao, Lingxi Kong, Yong Cheng, Ruifeng He, Shuai Wang, Kangjian Yang, and Ping Yang
ObjectiveAdaptive optics technology provides core assurance for high-resolution optical systems by real-time detecting and correcting dynamic wavefront distortions. Since the concept of adaptive optics was first proposed by Babcock in 1953, this technology has been successfully extended to fields such as astronomical observation, laser beam purification, and assisted medical treatment, achieving a significant improvement—approximately 2-fold—in indicators like the concentration of far-field spot energy (β factor). However, constrained by high-order residual aberrations, existing systems still struggle to achieve near-diffraction-limited performance. Research indicates that such residual aberrations mainly stem from high-frequency, high-order aberrations induced by vibrations of the optical platform—vibrations caused by components such as coolers, fans, etc. For instance, Rousset et al. found that high-frequency narrowband aberrations induced by vibrations of electronic components in the very large telescope (VLT) lead to a decrease in the Strehl ratio of imaging spots; Kulcsár et al. further revealed that 55 Hz narrowband disturbances excited by the cooling system of the Gemini South Telescope (GST) exhibit significant coupling effects in Zernike high-order modes (e.g., defocus and coma), severely impairing the system’s imaging quality. Effectively suppressing such high-frequency, high-order aberrations has become a key challenge in enhancing the performance of adaptive optical systems.MethodsTo achieve effective correction of high-frequency, high-order aberrations, this paper proposes a linear quadratic Gaussian (LQG) control architecture based on full-mode prediction. This method innovatively introduces a full-mode wavefront aberration coefficient prediction model. Firstly, dynamic equations for Zernike modes are established through online spectral analysis and parameter identification. Secondly, the Kalman filter is employed to perform multi-step-ahead prediction of full-mode coefficients; when combined with optimal voltage calculation, this forms a closed-loop correction mechanism, which can enhance the adaptive optical system’s capability to correct high-frequency, high-order aberrations. It is expected to achieve near-diffraction-limited correction for such aberrations.Results and DiscussionsTo verify the superiority of the proposed method over proportional-integral (PI) control in correcting high-frequency, high-order aberrations, comparative experiments between the LQG and PI control methods were conducted on 25 Hz defocus aberrations (Fig. 3). When the PI control method was used to correct 25 Hz defocus aberrations, the correction effect was not significant: the root mean square (RMS) value of the input aberration only decreased from 0.371 μm (before correction) to 0.189 μm, and the peak-to-valley (PV) value decreased from 1.949 μm to 0.850 μm. In contrast, the LQG control method exhibited excellent correction performance for 25 Hz defocus aberrations: the RMS value of the input aberration significantly decreased from 0.554 μm (before correction) to 0.056 μm, and the PV value decreased from 2.271 μm to 0.295 μm (Table 1).To further validate the method’s effectiveness in correcting higher-frequency and higher-order aberrations, correction experiments were conducted on 180 Hz defocus and coma (Fig. 4). Under a sampling frequency of 500 Hz, using the proposed method to control deformable mirror (DM2) reduced the input aberration to nearly 1/10 of its initial value (Tables 2 and 3).To confirm the LQG method's correction effect on mixed high-frequency, high-order aberrations, experiments were performed on mixed high-order aberrations (180 Hz defocus, 180 Hz astigmatism, and 180 Hz coma) (Fig. 5). The LQG method achieved a spectral suppression amplitude of more than 23 dB for all mixed high-frequency, high-order aberrations (defocus, astigmatism, and coma) (Table 4).ConclusionsExperimental results demonstrate that the LQG modal coefficient prediction correction method exhibits excellent suppression effects on both single-order and mixed-mode aberrations. It can extend the control bandwidth of adaptive optical systems to more than 1/3 the sampling frequency, overcoming the traditional limitation of 1/20 the sampling frequency. This holds promise for achieving near-diffraction-limited correction of high-frequency, high-order aberrations in adaptive optical systems.
Sep. 10, 2025Vol. 52 Issue 17 1705001 (2025)
Yutao Liu, Xingqi Wang, Xueting Dang, Shi Qiu, and Xinghu Fu
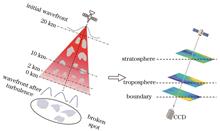
ObjectiveTraditional microwave communication has a limited bandwidth. Although satellite-ground laser communication has significant advantages, atmospheric turbulence causes the laser to experience spatial phase distortion, severely restricting communication performance. Currently, the multi-layer atmospheric turbulence phase screen method is an important approach for studying the atmospheric turbulence effect in satellite-ground links. However, the existing numerical simulation methods of multi-layer atmospheric turbulence phase screens for satellite-ground links have deficiencies. They are unable to accurately depict the variation characteristics and the dynamic evolution process of satellite-ground atmospheric turbulence at different altitudes. This research aims to construct an accurate dynamic atmospheric turbulence model for satellite-ground links, effectively evaluate its impact on the characteristics of laser transmission, and promote the practical application of satellite-ground laser communication technology.MethodsGiven that the impact of atmospheric turbulence on the laser is concentrated in the altitude range of 0?20 km, this area is divided into the boundary layer, troposphere, and stratosphere. According to the non-Kolmogorov turbulence power spectrum, the H-V 5/7 model, and the model of the spectral index varying with altitude, the atmospheric refractive index structure constants and the turbulence spectral indexes at different altitudes are calculated. The power spectrum inversion method with low-frequency harmonic compensation is applied to generate a three-layer atmospheric turbulence phase screen with a non-Kolmogorov spectrum, simulating the turbulence effects in different atmospheric layers. Meanwhile, based on the principle of Fresnel diffraction and considering the factors such as the coherent length of atmospheric turbulence, a three-layer atmospheric turbulence beam transmission model for satellite-ground links is constructed. Considering the dynamic characteristics of atmospheric turbulence in reality, the rotation truncation phase screen method is adopted. By controlling the variables such as the distance between the center of the sub-phase screen and the center of the large phase screen, the size of the sub-phase screen, and the included angle between adjacent sub-phase screens, and combining with the average wind speeds in different atmospheric layers, the initial phase screen is rotated and truncated to obtain a sequence of dynamic atmospheric turbulence phase screens, constructing a three-layer dynamic atmospheric turbulence phase screen model for satellite-ground links.Results and DiscussionsThe simulation results show that the order of sub-harmonic compensation affects the simulation accuracy of the atmospheric turbulence phase screen. The phase structure function with the 10th-order sub-harmonic compensation is close to the theoretical value and can effectively represent the spatial phase disturbance caused by atmospheric turbulence (Fig. 6). A radius-variable rotation truncation method is proposed, which improves the periodic change phenomenon of the light intensity scintillation index and can accurately simulate the variation characteristics of the light field in a relatively long time sequence (Fig. 8 and Fig. 9). In addition, the light intensity scintillation index of the Gaussian beam after being modulated by the three-layer dynamic atmospheric turbulence phase screen for satellite-ground links has a high degree of agreement with the theoretical value, and the model can accurately represent the average atmospheric wind speed, enabling accurate simulation of laser transmission between the satellite and the ground (Fig. 11 and Fig. 12).ConclusionsIn present study, a three-layer dynamic atmospheric turbulence model for satellite-ground links based on the non-Kolmogorov power spectrum is constructed. Verified by various methods, this model has a high accuracy in simulating the atmospheric turbulence effect for satellite-ground links. Specifically, after the compensation of the 10th-order low-frequency harmonic, the variation trend of the phase structure function is highly consistent with the theoretical result. After being modulated, the Gaussian beam shows obvious light intensity scintillation, and the light intensity scintillation indices under different zenith angles are consistent with the theoretical values. The radius-variable rotation truncation method can accurately simulate the changes in wind speeds in different atmospheric layers, enabling accurate simulation of laser transmission between the satellite and the ground. In conclusion, this model can effectively depict the dynamic evolution process of satellite-ground atmospheric turbulence and accurately evaluate its impact on the characteristics of laser transmission, providing an important theoretical and technical support for the development of satellite-ground laser communication technology.
Sep. 13, 2025Vol. 52 Issue 17 1706001 (2025)
Qianwu Zhang, Zhiyu Li, Kun Chen, Xiaofang Zhang, Yanyi Wang, Yating Wu, and Bingyao Cao
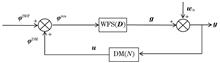
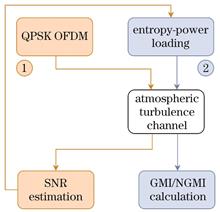
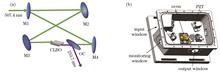
ObjectiveThe performance of free-space optical (FSO) communication is significantly affected by atmospheric turbulence, along with other factors such as misalignment, weather conditions, and transmission distance. Turbulence-induced signal fluctuations degrade the high-capacity advantage of FSO systems, necessitating robust compensation techniques. To address this challenge, we propose an entropy-power loading method for mitigating atmospheric turbulence effects in FSO systems. This approach combines channel estimation, probabilistic shaping (PS)-based entropy allocation, and water-filling power distribution to enhance generalized mutual information (GMI) and system robustness. Furthermore, to optimize bit transmission efficiency, we introduce a normalized GMI (NGMI) threshold into entropy-power loading, formulating a joint-parameter entropy-power loading strategy. We aim to demonstrate that this method can effectively compensate for turbulence-induced degradation and improve spectral efficiency and link reliability in FSO communication.MethodsThis study proposes an atmospheric turbulence compensation method based on entropy-power loading. Initially, a Gaussian white noise channel model was established to numerically investigate the correlation between source entropy, signal-to-noise ratio (SNR), and GMI performance. We then developed an entropy-power loading algorithm, whose core innovation involved employing the golden section method to optimize the probabilistic shaping coefficient λ, thereby maximizing GMI for each subcarrier under its pre-estimated SNR conditions. For experimental verification, we constructed an atmospheric turbulence simulation platform using a spatial light modulator (SLM) with dynamically loaded random phase screens. The implementation process involves: (1) conducting preliminary communication to estimate the SNR of each OFDM subcarrier; (2) computing the corresponding symbol order, probabilistic shaping coefficient, and power allocation for each subcarrier via entropy-power loading; (3) modulating the bit stream into OFDM symbols; and (4) transmitting and receiving optical signals through a complete system comprising a laser, Mach?Zehnder modulators, signal generators, and so on. Additionally, the relationship between source entropy, SNR, and NGMI performance was studied via numerical simulation, and an NGMI threshold was incorporated into entropy-power loading to improve the system’s bit transmission efficiency. Finally, the improved method was implemented on the experimental platform for verification.Results and DiscussionsUsing 256QAM as an example, we investigated the relationship between source entropy (H), SNR, and GMI via numerical simulation, with H stepped at 0.1 bit intervals and SNR at 0.5 dB intervals. The results were visualized in a 3D graph (Fig. 3(a)). For clarity, projections at SNRs of 10 dB, 15 dB, and 20 dB were presented, revealing that GMI is a unimodal function of H (Fig. 3(b)). We determined the maximum GMI and optimal λ for various SNRs and QAM orders, as shown in Fig. 4. Performance evaluations over 50 turbulence realizations indicate that entropy-power loading performs best under both strong and weak turbulence conditions. Specifically, entropy-power loading offers mean GMI gains of 43.5 bit and 58.0 bit over bit-power loading under strong and weak turbulence conditions, respectively, translating to gains of 0.35 bit/symbol and 0.47 bit/symbol across 123 subcarriers (Fig. 6).Numerical simulations investigating the relationship between source entropy (H), SNR, and NGMI reveal that NGMI is a monotonically decreasing function of H at a given SNR (Fig. 7). Incorporating an NGMI threshold into the maximum GMI strategy enables simultaneous optimization of GMI and NGMI, outperforming conventional strategies. Figure 8 presents NGMI performance with and without the threshold via numerical simulation, demonstrating that joint-parameter entropy-power loading effectively meets NGMI requirements, especially at higher SNRs.Figure 9 shows that the GMI performance of PS-256QAM with joint-parameter entropy-power loading slightly underperforms that of PS-256QAM with GMI maximization strategy between 3 dB and 22 dB but surpasses that of fixed-order 256QAM, reaching maximum GMI above 22 dB. Verification in a real OFDM-FSO system with an NGMI threshold of 0.92 shows that joint-parameter entropy-power loading averages 15.9 bit and 13.2 bit lower GMI than GMI maximization entropy-power loading under strong and weak turbulence, respectively, but still outperforms bit-power loading by 27.6 bit and 44.8 bit (Fig. 10). NGMI performance (Fig. 11) indicates that joint-parameter entropy-power loading performs best under both strong and weak turbulence.ConclusionsThe GMI-maximizing entropy-power loading strategy outperforms bit-power loading and fixed-order 64QAM modulation in GMI performance under both strong and weak turbulence. Additionally, based on the constraint relationship between GMI and NGMI, NGMI control is achieved by introducing an NGMI threshold. Experiments show that when the NGMI threshold is set to 0.92, the GMI performance of joint-parameter entropy-power loading is slightly lower than that of the GMI-maximizing strategy but still superior to bit-power loading and fixed-order 64QAM modulation. Moreover, the NGMI performance of joint-parameter entropy-power loading is optimal. In summary, joint-parameter-based entropy-power loading balances GMI and NGMI and outperforms bit-power loading and fixed-order QAM modulation in both metrics. The proposed method can effectively improve the channel capacity and robustness of optical communication systems under atmospheric turbulence.
Sep. 10, 2025Vol. 52 Issue 17 1706002 (2025)
Yongkang Zhang, Yi An, Zhiyong Yang, Yan Chen, and Haochen Sun
ObjectiveWith the continuous advancement of industrial intelligence, intelligent robots have been widely applied in inspection scenes of key infrastructures, such as power, transportation, and energy. By performing 3D reconstruction of multi-view inspection scenes, intelligent robots can obtain accurate environmental perception capabilities, enabling autonomous operations. However, in complex inspection scenes, the existing methods often fail to extract sufficient features from weakly textured and edge regions, resulting in a low reconstruction accuracy and compromising the overall quality of the reconstruction. To address these issues, this study proposed AFE-MVSNet, a multi-view 3D reconstruction network based on adaptive feature enhancement in inspection scenes, which aims to improve the reconstruction performance in complex areas, particularly those with weak textures and edges.MethodsAFE-MVSNet consists of two main components: an adaptive feature enhancement network (AFENet) and a multi-scale depth estimation process. First, AFENet, built on a feature pyramid network, extracts multi-scale features and incorporates attention mechanisms at each upsampling stage to enhance fine details, such as edges and textures. To further improve feature representation in weakly textured and edge regions, AFENet incorporates an adaptive perception module for features (APMF) based on deformable convolutional network that dynamically adjusts kernel sampling positions and weights to enlarge the receptive field. Second, the multi-scale depth estimation network adopts a cascaded structure that refines the depth maps from coarse to fine through cost-volume construction and depth prediction at each stage. The final depth maps are fused with the corresponding color images to generate 3D colored point clouds. To enhance training, a focal loss function is used to emphasize challenging regions, thereby improving the ability of the network to learn from hard-to-extract features and the reconstruction performance.Results and DiscussionsTo validate the effectiveness of AFE-MVSNet in inspection scenes, a inspection scene dataset was constructed and a transfer learning strategy was adopted. The model was pre-trained on the DTU public dataset and then fine-tuned on the inspection scene dataset to enhance its reconstruction performance in real-world environments. AFE-MVSNet was compared with several mainstream methods on both the DTU and inspection scene datasets. The experimental results demonstrate that AFE-MVSNet significantly outperforms the existing methods in weakly textured and edge regions. It achieves an overall reconstruction error (OA) of 0.309 mm on the DTU dataset and an end-point error (EPE) of 1.006 m on the inspection scene dataset, surpassing the baseline network and its performance before fine-tuning. In addition, ablation experiments were conducted on the APMF module, attention mechanism, and focal loss function to verify the effectiveness of each component.ConclusionsTo address the poor reconstruction performance in weakly textured and edge regions of inspection scenes, this study proposed AFE-MVSNet, a multi-view 3D reconstruction network based on adaptive feature enhancement. The network aims to improve the reconstruction quality in complex areas. The main technical contributions of this study are: 1) To enhance feature representation in weakly textured and edge regions, the adaptive feature enhancement network (AFENet) was proposed, which integrates attention mechanisms to improve the extraction and representation of texture features in inspection scenes. 2) To strengthen the perceptual ability in complex areas, an adaptive perception module for features (APMF) was designed based on deformable convolutional network. This module adaptively adjusts the sampling positions and weights of the convolution kernels to enlarge the receptive field. 3) To improve the learning ability of the network, a focal loss function was introduced to enhance its ability to learn from hard-to-extract feature regions, thereby improving the reconstruction performance. 4) To improve the reconstruction ability, a inspection scene dataset was constructed. The network was first pre-trained on the DTU public dataset and then fine-tuned on the inspection scene dataset to enhance its ability to learn features. The experimental results validate the effectiveness of AFE-MVSNet in inspection scenes. The reconstructed 3D point cloud models exhibit well-preserved, weakly textured areas and clearly defined object edges. The proposed network provides a theoretical foundation for intelligent robotic applications in inspection tasks, and has significant potential for real-world engineering applications.
Sep. 03, 2025Vol. 52 Issue 17 1709001 (2025)
Jiahui Xie, Haiyang Song, Meifeng Ye, Jian Li, Shiyuan Zhu, Jijun Feng, and Zhen Xu
ObjectiveDeep ultraviolet (DUV) lasers are increasingly used in laser cooling, ultraviolet lithography, and optical storage. For atomic manipulation experiments such as laser cooling, with the continuous enrichment of quantum manipulation methods, deep ultraviolet lasers have been more and more used. In the study of mercury atomic optical lattice clocks, the 1S0→3P1 transition wavelength for laser cooling is 253.7 nm. The cooling light needs to provide a laser power of around 100 mW. In addition, in the clock transition frequency probe, the intensity noise of the detection light is introduced into the clock frequency detection, resulting in the reduction of the signal-to-noise ratio of the clock frequency detection fluorescence signal. Therefore, a stable cooling light source plays a crucial role in the preparation of cold atoms and the detection of clock frequency.MethodsNonlinear frequency conversion is one of the main ways to achieve the transformation of visible light to deep ultraviolet light, and it is currently a practical and reliable way to obtain deep ultraviolet lasers. In the high-power environment, the damage of nonlinear crystals has become a key factor affecting the lifetime of all-solid-state deep ultraviolet lasers. Compared with commonly used nonlinear crystals such as BBO (β-BaB2O4), the CLBO (CsLiB6O10) crystal takes the advantages of high damage threshold, small walk-off angle, and low absorption, which can effectively enhance the stability in long-term operation of deep ultraviolet lasers. However, due to the defects of the Cs atoms in the crystal, the CLBO crystal is hygroscopic at room temperature, so it is necessary to control the temperature of the crystal to 150 ℃ or even higher to reduce the influence of water molecules around the crystal. Therefore, placing the CLBO crystals in oxygen can extend their lifetime. In the experiment, the frequency of the 1014.8 nm laser is stabilized by using a transfer cavity and an optical-phase-locked loop. The resonant frequency doubling of the external cavity based on nonlinear crystals is one of the ways to achieve stable and reliable deep ultraviolet lasers. The specific process is to quadruple the output light of the high-power infrared laser to obtain the required wavelength. The first stage of frequency doubling can be achieved by single-pass frequency doubling with a periodically polarized crystal, and the second stage of frequency doubling can be achieved by resonant frequency doubling. Finally, the 253.7 nm laser is obtained by these technical methods.Results and discussions The frequency drift of the seed light in 10 h is within 20 MHz (Fig. 4). Considering the frequency drift of the wavelength meter, the seed light exhibits very good frequency stability. On the other hand, the stable seed light also plays a positive role in improving the locking effect of the frequency doubling cavity. The 253.7 nm ultraviolet (UV) laser power for a 507.4 nm laser with a single pass through the CLBO crystal is measured. The nonlinear coefficient Enl=1.15×10⁻⁴ /W of the CLBO crystal is obtained by fitting (Fig. 5). Under a 1.1 W input power of fundamental light, up to 198 mW power of deep UV laser output at 253.7 nm is demonstrated by cavity-enhanced frequency doubling, and the frequency doubling conversion efficiency is 18% (Fig. 6). The fineness of the bow-tie cavity is 220, and the total loss of the cavity is about 2.8%. When the power of fundamental input light is 1.1 W, the light-field pattern matching rate is 91%. Through spatial filtering, the beam quality factors of the deep ultraviolet laser reach Mx2=1.59 and My2=1.15. The relative intensity noise of the 253.7 nm laser is -90 dBc/Hz at 1 Hz. It is lower than -100 dBc/Hz at above 10 Hz (Fig. 7), mainly due to the high stability of the seed laser. The total operation time is more than 150 h. When the DUV laser continuously operates under an output power of 125 mW for 48 h, the peak-to-peak power fluctuation is 9.8%, and the root mean square (RMS) is 3.1% (Fig. 8). This highly stable deep ultraviolet laser has great significance for the preparation, cooling and fluorescence detection of mercury atom optical lattice clock.ConclusionsIn this paper, a 253.7 nm deep ultraviolet laser system based on CLBO crystal frequency doubling is implemented for laser cooling of mercury atoms. The output of the 253.7 nm laser based on CLBO crystal frequency doubling comes true. Through the power stabilization of green light, the heating of CLBO crystals, and the sealing and inflation of the cavity, the long-term continuous and stable output of the deep ultraviolet laser is realized. In addition, the transfer cavity frequency stabilization and the optical phase-locked loop are used to reduce the frequency drift and the noise of the seed laser. The PDH (Pound-Drever-Hall) technology is used to improve the stability of the frequency doubling cavity operation. During the 48 h operation, the UV power shows good long-term stability. Due to the damage of the output coupling mirror, the frequency doubling efficiency is reduced. Therefore, the low-damage output coupling mirror can be replaced to improve its continuous operation capability. Through spatial filtering, we also get Gaussian spots with better beam quality. This kind of deep ultraviolet laser system with high power, low noise and high stability can better meet the needs of mercury atom cooling experiments and improve the continuous operation ability of cold atom experiments.
Sep. 14, 2025Vol. 52 Issue 17 1701001 (2025)
Lanping Zhang, Hualing Wu, Quanwei Jiang, Linhui Guo, Chengqian Wang, Songxin Gao, and Guobin Fan
ObjectiveBlue laser diodes operating at 450 nm can be used as direct application laser sources due to their special wavelength and high material absorption, making them effective for laser welding and printing. Improving the power and brightness of laser diodes (LDs) is a research hotspot. A fiber-coupled blue laser diode with a core diameter of 220 μm was designed, with an output power exceeding 1000 W. The chip achieved a mean time between failures (MTBF) of over 1293 h, and the laser module had an MTBF of more than 1115 h. These results can support direct application laser systems based on blue fiber-coupled laser diodes.MethodsThe 200 μm core diameter fiber-coupled LD was achieved using a “(10+10)+(10+10)” multi-step single-chip configuration. Ten single chips were spatially assembled along the fast axis, with 2 channels spatially stacked along the slow axis. Additionally, polarization beam combining of the 2 channels was performed along the slow axis. In total, 40 single chips were coupled into a 105 μm fiber. To enhance power and brightness, 7×1 pumping fiber beam combining technology was utilized to obtain a 220 μm fiber-coupled LD. To improve the reliability of the LD module, the operating current was set to 2.4 A, even though the COS (chip on submount) could operate at a maximum current of 3 A.Results and DiscussionsA blue fiber-coupled laser diode with a 220 μm core diameter was successfully developed, achieving a practical output power of 850 W. The module’s reliability was improved through a series of measures including chip derating, redundancy design, optimal design of the opposing optical path, chip burn-in, and reduced humidity in the air surrounding the chip. The electro-optical efficiency of the blue light chips was approximately 38%. After collimation with fast-axis collimators (FAC) and slow-axis collimators (SAC), the efficiency was about 95%. The spatial splicing efficiency (accounting for light blocking and leakage) was approximately 97%, the polarization beam combining efficiency was around 97%, and the fiber coupling efficiency was roughly 97%. Overall, the optical efficiency was approximately 86%, with an overall electro-optical efficiency of about 33%. In addition to using a 7×1 pump combiner for efficient beam combining, a 19×1 pump combiner can also be employed. Using a 55 μm fiber-coupled LD as the input arm or sub-beam of the fiber combiner, this sub-beam adopts the method of “fast-axis spatial splicing + polarization combining,” stacking 10 single emitters in the fast-axis direction with a step difference of 0.38 mm. The focal lengths of the FAC and SAC are 0.3 mm and 9 mm, respectively, while the aspherical focusing lens has a focal length of 8.5 mm.ConclusionsA 105 μm fiber-coupled LD module was designed and developed based on a spatial splicing method, with a power exceeding 150 W@NA=0.19. Using 7×1 fiber-pumped beam combining technology, a 220 μm fiber-coupled LD was developed, with an output power of 850 W@NA=0.22, which significantly improved the filling ratio and utilization rate of the fiber bundle parameter product. Meanwhile, the reliability of individual chips was enhanced through aging screening, derating, redundant design, optical feedback isolation protection, and reduced ambient humidity. The rated operating current of the chips was reduced from 3 A to 2.4 A, resulting in a chip MTBF of over 1293 h and an 850 W LD module MTBF of more than 1115 h, greatly improving the light source reliability. A series of blue laser effect experiments were conducted using this light source, verifying its practicality. This research provides technical support for the space-based application of a specific laser system and lays a solid foundation for further engineering and practical implementation of high-brightness blue light sources.
Sep. 10, 2025Vol. 52 Issue 17 1701002 (2025)
Wen Guan, Yutao Xu, Jijun Feng, Jiaming Wan, Shurui Yang, Liqing Chen, Guzhi Bao, Lisha Zhou, Yanling Meng, Lin Li, Liang Liu, and Tang Li
ObjectiveMagnetic field measurement technologies are widely required in aerospace, navigation, geophysical prospecting, and medical diagnostics, with each application imposing distinct demands on the stability, accuracy, and dynamic range of magnetic sensors. Conventional magnetometers such as fluxgate and superconducting quantum interference device (SQUID) magnetometers have achieved significant maturity, yet their inherent limitations including zero drift and environmental sensitivity restrict practical deployments in long-term, unmonitored environments. In contrast, the cold atom magnetometers, using laser-cooled atomic ensembles, with unique properties such as negligible interatomic interactions and ultra-long coherence time, have emerged as competitive candidates for next-generation precision magnetometry. This work proposes a novel magnetometry approach that integrates cold atoms within a diffuse light integral sphere and utilizes the nonlinear magneto-optical rotation (NMOR) effects for high-sensitivity magnetic field detection. Quantum sensors constructed using cold atoms exhibit advantages of minimal drift and long-term stability, which possess considerable application prospects in the domain of precision measurement.MethodsThe experiment employs a cold atom source in an integral sphere, eliminating the need for strict magneto-optical trap (MOT) generated magnetic fields, thereby avoiding remanent magnetic field interference. The integral sphere is covered within a three-layer permalloy magnetic shield to suppress geomagnetic fluctuations. Cold atoms are prepared by injecting frequency-detuned cooling laser beams into the integral sphere, producing a uniform diffuse light field via multiple internal reflections, effectively cooling cesium atoms. The NMOR measurement system utilizes three distributed Bragg reflector (DBR) lasers: one for generating the cooling and probe light at 852 nm, the second as the repump light at the same wavelength, and the third as the pump laser at 895 nm. The pump laser is intensity-modulated by an acousto-optic modulator (AOM). A balance detection scheme involving polarizing beam splitters and a lock-in amplifier is used to detect the minute changes in the probe light polarization state which are induced by the cold atom ensemble spin precession under an external magnetic field. During the experimental operations, the periodic pump pulses synchronize the atomic spin polarization. When the modulation frequency of the pump light matches the Larmor precession frequency of atomic spins, the system achieves the maximum polarization, and the NMOR signal amplitude reaches the peak value. The resonance condition is exploited to determine the external magnetic induction intensity (B) through the relationship B=ω/γ, where ω is the measured Larmor frequency and γ is the gyromagnetic ratio.Results and DiscussionsThe experimental setup realizes a cold atom magnetometry based on NMOR in a diffuse light field. The time sequence includes a 47.5 ms cooling stage followed by a 5 ms probing stage per cycle. The periodic modulation of the pump light mitigates spin depolarization and decoherence effects (Fig. 5 and Fig. 6), significantly improving the atomic polarization stability and the signal strength over multiple pumping cycles. A linear correlation between the applied magnetic induction intensity and the experimental result is obtained across a magnetic induction intensity range of up to 5 μT, with a linear fit coefficient R2 exceeding 0.999 (Fig. 7). The residual magnetic induction intensity inside the magnetic shield is determined to be approximately less than 0.07 μT. Noise analysis identifies the primary limitations arising from the residual field gradient (approximately 0.2 μT) within the shield, the magnetic noise from the external field source, and the laser frequency/power noise affecting the probe signal stability. The time-domain and frequency-domain noise characteristics of the magnetometer are evaluated along both x and y axes under an applied static magnetic induction intensity of 1.86 μT (Fig. 8 and Fig. 9). The system achieves a sensitivity of 30 pT/Hz1/2 at 1 Hz and a long-term Allan deviation of 20 pT over 1000 s (Fig. 10). Optimization strategies including increasing cold atom density, improving magnetic shielding, enhancing current source stability, and reducing laser noise are identified for future refinement.ConclusionsThis study presents the experimental implementation of NMOR magnetometry using cold atoms within a diffuse light integral sphere. The system achieves a magnetic induction intensity sensitivity of 30 pT/Hz1/2 and a 1000 s stability of 20 pT. The integration of the NMOR technique with a diffuse cold atom source paves the way for developing high-precision, low-drift, and long-term stable quantum magnetometers. Future work will focus on enhancing cold atom density, magnetic shielding effectiveness, and detector sensitivity, as well as minimizing laser noise to further elevate measurement sensitivity and dynamic range, ultimately enabling field-ready portable quantum magnetometers.
Sep. 13, 2025Vol. 52 Issue 17 1701003 (2025)
Xiangyue Li, Qingshuai Su, Fang Wei, Chen Chen, Haoyang Pi, Huimin Wu, Kangwen Yang, Qing Ye, Yi Yan, and Haiwen Cai
ObjectiveWith the development of satellite internet backbone network communications, the intersatellite coherent laser communication technology is gradually developing in the direction of multi-node and multi-system compatibility. Therefore, it is necessary to develop the dense wavelength division multiplexing (DWDM) technology to meet the growing demand for high-throughput data transmission, while ensuring flexible interconnection and efficient intercommunication of intersatellite laser communication terminals. The core component of the DWDM technology is a tunable narrow-linewidth laser, whose wavelength must be aligned with the International Telecommunication Union (ITU) grid. Therefore, the laser must have a narrow linewidth, a wide range of wavelengths, and precise tuning and locking capabilities to flexibly match the transmit-receive wavelengths of different satellites.MethodsThe widely-tunable distributed Bragg reflector (DBR) laser is combined with a high-Q silicon nitride (Si3N4) micro-ring resonator (MRR) to form a self-injection locked laser with wide tunability. The MRR acts as a wavelength locker and a narrowband feedback filter at the same time, and wavelength locking and linewidth narrowing are realized synchronously based on the all-optical feedback method. The performance test of the laser spectrum, laser wavelength, frequency noise, and linewidth of the wavelength-locked self-injection locked (WL-SIL) laser is done.Results and DiscussionsThe WL-SIL laser achieves wavelength tuning from 1528.38 nm to 1570.84 nm, with a wavelength tuning range of more than 42 nm, covering the entire C-band, supporting 107 ITU channels, and the frequency deviation from the ITU channels is less than ±1.5 GHz. In addition, within the wide tuning range of 42 nm, the side mode suppression ratio (SMSR) is always better than 40 dB, and the intrinsic linewidth is narrowed to 1.88 kHz, meeting the needs of high-coherence application scenarios. The innovation of this solution is to use Si3N4 MRR to simultaneously achieve the functions of wavelength locking and linewidth narrowing. Through the independent temperature control technology, the resonance peak of the MRR can be accurately aligned with the ITU-grid, and the narrowband optical feedback from the MRR locks the output frequency of the DBR laser to the resonance frequency, which can achieve high-precision wavelength locking.ConclusionsIn this paper, we propose and realize a self-injection locked DBR semiconductor laser based on a high-Q Si3N4 MRR, successfully addressing limitations in the conventional wavelength locking schemes such as restricted tuning range, excessive system complexity, and linewidth compression challenges. By self-injection-locking the DBR laser into a Si3N4 MRR with an ultrahigh Q-factor of 1.16×10⁶, we simultaneously achieve broadband wavelength locking and linewidth narrowing via a fully optical feedback mechanism. Experimental results show that the tuning range of the laser wavelength covers the entire C-band, supporting 107 ITU channels with frequency deviations all below ±1.5 GHz. Furthermore, the SMSR remains superior to 40 dB across a tuning range exceeding 42 nm, while the intrinsic laser linewidth is compressed to the kHz level. These advancements effectively meet the requirements for high-coherence application scenarios.
Sep. 13, 2025Vol. 52 Issue 17 1701004 (2025)
Yenan Zhang, Jiangfeng Wang, Jiangtao Guo, Xinghua Lu, Wei Fan, and Xuechun Li
ObjectiveWith the goal of achieving laser inertial confinement fusion (ICF), countries around the world have established a series of high-power laser facilities, among which typical representatives include the National Ignition Facility (NIF) in the United States, the Laser Megajoule (LMJ) Facility in France, and the ShenGuang (SG) Facility in China, etc. The NIF achieved its first successful ignition in December 2022, obtaining a target gain of 1.5 times, marking a significant advancement in the application of fusion energy. Due to the thermal effect of large-aperture chip amplifiers, the repetition rate of such devices is extremely low, with intervals between each shot being several hours, which cannot meet the demands of future fusion power stations. To solve this issue and increase the repetition rate of large-scale high-power laser devices, researchers have proposed various configurations of high-power lasers devices including gas-cooled multi-slabs designs and activated mirror designs, and have built multiple systems, making continuous new progress in output power and repetition rate. Shortening the thermal recovery time of the SG-II upgrade device and developing a high-repetition-rate high-energy laser amplifier have great significance of achieving inertial fusion energy. In this paper, a new upgrade design of SG-II is proposed. With the new design, the thermal recovery time is greatly reduced and the laser gain remains the same. Another advantage of the new design is the need of nitrogen for cooling is decreased as well.MethodsThe basic idea of the new design of the SG-II main laser amplifier is combining the gas-cooled multi-slab configuration with the existing chip amplifiers in the SG-II. Without changing the structure of the SG-II upgrade device and utilizing the existing nitrogen purging system of the main amplifier, a group of thinner neodymium glass slabs is set to replace the existing thicker single neodymium glass. Nitrogen is used for purging and cooling between the slabs. The structure is showed in Fig. 7. When performing energy storage extraction and laser amplification, the laser beam passes through the multiple neodymium glass slab groups. While achieving the same gain, the multi-slab gas-cooled configuration adopted by the slab groups effectively improves the cooling efficiency and reduces the thermal recovery time. Based on the configuration of the amplifier, an ANSYS instantaneous analysis model is established to simulate and analyze the cooling process of the neodymium glass in the amplifier. To achieve the simulation analysis of the thermal recovery process, the required boundary conditions include the internal heat source of neodymium glass (thermal deposition distribution), heat dissipation conditions (surface heat exchange coefficient), and solid mechanical constraints (side fixation). The finite element analysis software can be used to obtain the temperature, stress, and deformation distributions inside the neodymium glass. Then, through calculation, the thermal wavefront of the neodymium glass can be obtained. The calculation model is shown in Fig. 2.Results and DiscussionsTo obtain the most efficient design, different slab group structures, different purging time, and different nitrogen flow rates under the same configuration are compared with those in the existing main amplifier in the simulation experiment. From the comparison in Figs. 8(a) and (b), the slab group with 4 pieces of 10 mm thick neodymium glass has the highest efficiency. The thermal recovery time of temperature and wavefront is 20.7% and 17.1% of those of the existing structure, respectively. From the comparison in Figs. 9(a) and (b), when the slab group has a thickness of 10 mm and 4 neodymium glasses, the thermal recovery time for the two methods of continuous cooling and intermittent purging is basically the same. This result indicates that the internal thermal recovery is nearly achieved within two cooling cycles due to the advantage of the short heat conduction path. After ensuring the structure of slab group, the other key factor influencing the thermal recovery time is the flow of nitrogen. The results from Fig. 10, Fig. 11(a), and Fig. 11(b) show that increasing the nitrogen flow rate has a marginal effect on the improvement of cooling efficiency. Further increasing the nitrogen flow rate on the existing basis of 230 L/min has a relatively small effect on shortening the thermal recovery time. Based on the analysis above, the total nitrogen consumption is approximately 42.5% of that of the existing structure.ConclusionsA new optimized design for the main amplifiers in the SG-II is proposed and its effectiveness is verified through simulation experiments. By replacing the existing thicker neodymium glass slabs by slab groups containing multiple thinner neodymium glass slabs, the thermal recovery time is reduced significantly. Through simulation analysis, the influence of slab group design, purging time and nitrogen flow rate on the thermal recovery time is analyzed and compared. The results show that for a group of 4 neodymium glass slabs with a thickness of 10 mm, the design in which the nitrogen flow rate in the internal gap of the slab group remains consistent with that (230 L/min) on the outside has obvious advantages. When this slab group is adopted, the internal temperature difference and the thermal recovery time of the wavefront are reduced to 20.7% and 17.1% of those of the existing structure, respectively, and within a single thermal recovery cycle, the nitrogen usage is reduced to approximately 42.5% of the existing structure. This method provides a guiding approach for improving the repetition rate of the existing large-scale laser drivers and offers an optimization idea for the thermal recovery time for the subsequent construction of new devices.
Sep. 13, 2025Vol. 52 Issue 17 1701005 (2025)
Chenglong Jiang, Yanbin Wang, Xuanfeng Zhou, Wenjian Xiao, and Yun Ye
ObjectiveLaser interference and damage can severely disrupt the operation of optoelectronic imaging systems. However, simulating far-field laser effects under laboratory near-field conditions remains challenging owing to differences in wavefront curvature, beam divergence, and atmospheric-induced distortions. Traditional beam-expanding systems fail to replicate both the wavefront curvature and effective beam size of far-field laser propagation. This paper proposes a novel near-field equivalent far-field (NEFF) laser spot design method using symmetric lens arrays to precisely emulate far-field laser characteristics in controlled laboratory environments. This approach addresses the critical need for high-fidelity experimental validation of optoelectronic system vulnerability to laser interference over long ranges.MethodsThe proposed method is based on Gaussian beam propagation theory and matrix optics. A four-lens symmetric optical system is designed to match both the wavefront curvature radius (R) and effective beam waist radius (ω) of far-field laser. The ABCD matrix formalism is applied to derive the lens focal length and spacing relationships to achieve parameter equivalence. Establishing the equivalence conditions using Gaussian beam q-parameter analysis. A four-lens system with a co-focal architecture is configured to balance the wavefront curvature and beam divergence (Fig. 1). A 532 nm laser testbed with adjustable lens spacing is implemented to simulate far-field distances (Fig. 3). The near-field simulation and true far-field interference patterns are quantitatively compared using metrics such as mean square error (MSE), peak signal-to-noise ratio (PSNR), structural similarity index measure (SSIM), and visual geometry group-16 (VGG-16) similarity indices (Table 5).Results and DiscussionsThe proposed NEFF system demonstrates exceptional equivalence in terms of static and dynamic laser characteristics. For a 3-km far-field scenario, the system achieves a wavefront curvature error rate under 10% and beam size accuracy exceeding 99% (Table 2). Near-field simulation laser spots [Figs. 4(a)-(d)] closely replicate the far-field irradiation effects, including diffraction rings and point-array structures [Figs. 4(e)?(h)]. Quantitative analysis reveals that PSNR exceeds 17.28 dB and the VGG-16 similarity exceeds 0.64 across varying irradiance levels (Table 5). By adjusting the lens spacing, the system can simulate far-field distances ranging from 100 m to 10 km (Table 4). ZEMAX simulations confirm that long-focal-length lenses can minimize wavefront distortion (Fig. 5). The error sensitivity analysis (Table 2) reveals that a 10% focal length deviation causes a curvature error of under 6.5% when using 1000-mm lenses.ConclusionsThis study presents a breakthrough in near-field emulation of far-field laser effects through a symmetric lens array design. The NEFF system achieves dual-parameter equivalence with high fidelity, enabling cost-effective laboratory evaluation of optoelectronic systems under realistic long-range laser interference scenarios. The key innovations include the following:1) A scalable optical architecture capable of simulating far-field distances from 100 m to 10 km with compact physical dimensions.2) Experimental validation showing >99% beam size accuracy and PSNR of >17 dB compared with true far-field irradiation.3) Demonstration of robustness to fabrication errors through error sensitivity analysis.Future work will integrate dynamic phase modulation to simulate atmospheric turbulence effects, further enhancing the applicability of the system in defense and space communication research.
Sep. 13, 2025Vol. 52 Issue 17 1701006 (2025)
Hongbing Zhou, Rumao Tao, Xi Feng, Yu Qin, Yuefang Yan, Chenxu Liu, Min Li, Honghuan Lin, Zhitao Peng, Jianjun Wang, Lixin Yan, and Feng Jing
ObjectiveCoherent beam combining (CBC) is one of the most promising techniques for breaking through the output power limit of single channel lasers and has been one of the research hotspots in high-energy laser technology. Traditional CBC includes two schemes, tiled aperture and filled aperture schemes. Tiled aperture CBC has the ability to steer the beam by phase control, but its theoretical efficiency is relatively low in the presence of diffraction sidelobes, while filled aperture CBC can achieve high efficiency but is difficult to achieve beam self-steering. CBC based on multi-plane light conversion (MPLC) is an emerging technology that eliminates the diffraction sidelobes of tiled aperture scheme, and the pointing angle of the combined beam can be adjusted by controlling the piston phases of the sub-beams, thereby achieving efficient beam self-steering without additional optical systems such as deformable mirrors. CBC by MPLC can overcome the limitations of low energy ratio of the main lobe in tiled aperture CBC and the inability of filled aperture CBC for self-steering, and is expected to propel the development and realization of larger-scale and higher-power coherent laser sources. However, there is limited theoretical research, and no numerical analysis of the beam self-steering in filled aperture CBC systems has been reported. In this study, simulations were conducted to verify the CBC of multiple laser channels and high-dimensional mode multiplexing. Moreover, theoretical equations for beam self-steering were derived, and the steering performance under different mode bases was studied.MethodsThe principle and method of CBC by multi-plane light conversion were introduced, and the theoretical simulation model was constructed. In the implementation of CBC by MPLC, the design of phase masks at each plane is critical. The input modes of MPLC are the laser array with various phases, and the output modes are supposed to be fundamental Gaussian mode or designed to be high-order modes according to the applications. Based on the wavefront matching method, the input modes are forward propagated while the desired output modes are backward propagated, and the phase mask can be calculated and updated in an iteration process. Numerical simulations were conducted for three different application scenarios: single-mode CBC, high-dimensional mode multiplexing, and beam self-steering. Meanwhile, analytical equations of tilted Gaussian beam decomposed by orthogonal set of Laguerre?Gaussian modes were theoretically derived, demonstrating the feasibility of achieving beam self-steering in mode multiplexing MPLC by phase-only control.Results and DiscussionsSimulation results for 16-beam single-mode CBC showed that the system combining efficiency was close to 100%, and the beam quality factor was 1.03 (Fig. 3), thus achieving high-quality filled-aperture CBC. In addition, high-dimensional mode multiplexing can be achieved by phase encoding the input beam array, where different phase distributions are mapped to different high-order modes in the process of MPLC design. A simulation of 16 beams combining into 16 Hermite?Gaussian modes was carried out, with an average coupling efficiency of up to 97.4% for each mode (Fig. 5). Finally, the application of beam self-steering was analyzed, and the steering performances of three systems were compared: traditional filled-aperture CBC, single-mode CBC based on MPLC, and mode multiplexing CBC based on MPLC. As shown in Fig. 7, traditional filled-aperture CBC could not achieve beam-steering via phase-only control, single-mode CBC based on MPLC had limited beam-steering capability, while mode multiplexing CBC based on MPLC had good beam-steering capability.ConclusionsIn this work, various CBC scenarios, including single-mode combination, high-dimensional mode multiplexing, and beam self-steering, were simulated and analyzed based on the theoretical model of MPLC coherent combination. The simulation results demonstrate the simple design and excellent performance of the MPLC coherent combining system, which integrates the advantages of traditional schemes to generate high-efficiency, high-quality filled-aperture beams. Moreover, the MPLC-based CBC system can synthesize high-order modes and achieve self-steering of the combined beams through phase-only control, thus expanding the application range of filled-aperture coherent laser systems. Self-steering performance depends on high-dimensional mode multiplexing MPLC, so both the quantity and quality of multiplexed modes should be enhanced by optimizing mode mapping relationships and optical parameters. At the same time, it is necessary to improve control algorithms and accuracy to promote the realization of wide-angle beam steering.
Sep. 03, 2025Vol. 52 Issue 17 1701007 (2025)
Naiyu Zhang, Bocang Qiu, Yonggang Zou, Jie Fan, Fang Gang, and Xiaohui Ma
ObjectiveHigh-power single-mode distributed-feedback (DFB) semiconductor lasers operating at 1.06 μm are essential for applications such as free-space optical communication, laser ranging, biomedical systems, and frequency doubling. These applications necessitate sources with stable wavelength emission and high single-mode output power. Conventional approaches often utilize low-order buried gratings, which require complex epitaxial regrowth processes, increasing costs and risking contamination or oxidation issues, particularly with Al-containing materials. Furthermore, fabricating these fine gratings typically involves expensive electron-beam lithography (EBL), prone to stitching errors in long cavities. Sidewall-grating structures, fabricated directly onto the ridge-waveguide sides without regrowth, offer a promising alternative. Specifically, high-order sidewall gratings are compatible with cost-effective stepper photolithography, enhancing reliability and reducing manufacturing expenses. Despite successful demonstrations in other material systems, research on 1.06 μm sidewall-grating DFB lasers remains limited. This work aims to investigate and demonstrate a simplified, cost-effective fabrication route for high-power, single-mode 1.06 μm DFB lasers by employing a ninth-order sidewall grating, fabricated using stepper lithography, integrated onto an optimized high-efficiency epitaxial structure. The objective is to achieve robust single-mode operation with high output power and slope efficiency, validating this approach as a practical alternative to traditional methods.MethodsAn optimized double-asymmetric large-optical-cavity (LOC) epitaxial structure with a single In0.26GaAs strained quantum well was designed for low internal loss and high efficiency. For longitudinal-mode control, a ninth-order sidewall grating was implemented. The grating parameters—including period (Λ=1.42 μm), duty cycle (50%), etch depth (H=1.25 μm), wider ridge segment (w1=4.0 μm), and narrower ridge segment (w2=2.0 μm), resulting in a corrugation D=1.0 μm—were determined using Lumerical Mode FDE simulations. These simulations were employed to analyze effective-refractive-index dependencies, ensure single-lateral-mode conditions (verified by mode profiles, Fig. 4), and achieve a target coupling-strength?length product of κL≈0.75 for a 3000 μm cavity. An asymmetrically placed λ/4 phase shift (at 1/3L from the rear facet) was incorporated to suppress spatial hole burning. Devices were fabricated on MOCVD-grown wafers. Stepper photolithography defined the grating pattern, followed by ICP etching for the ridge and gratings. Standard P- and N-electrode metallization, wafer thinning, annealing, and facet coatings were performed. Chips were mounted P-side down on AlN heat sinks. SEM analysis confirmed the fabricated grating dimensions and etch quality.Results and DiscussionFabry?Pérot (FP) lasers fabricated from the same wafer validated the epitaxial quality, exhibiting a low internal loss αi=0.85 cm?1, high internal quantum efficiency ηi=0.92 (Fig. 6), and a slope efficiency (SE) of 0.88 W·A-1 for 3 mm cavities [Fig. 7(a)], with emission around 1.063 μm [Fig. 7(b)]. The ninth-order sidewall-grating DFB lasers demonstrated stable CW single-mode operation. At 20 °C, a maximum single-mode output power of 355 mW was achieved with a corresponding side-mode suppression ratio (SMSR) of 44.3 dB. The threshold current was approximately 0.1 A, and the SE was 0.45 W·A?1 [Fig. 8(a),(c)]. The lasing wavelength tuned with current and temperature, with a temperature coefficient of 0.079 nm ℃?1 [Fig. 8(b),(c)]. Far-field divergence angles were 30.08° (fast axis) and 6.87° (slow axis) at 1 A, indicating stable fundamental lateral-mode operation [Fig. 8(d)]. The lower SE of the DFB laser compared to the FP laser is primarily attributed to scattering losses from the high-order grating. Nevertheless, the results confirm the viability of the cost-effective high-order sidewall-grating approach using stepper lithography.ConclusionsWe have successfully designed and demonstrated high-power, single-mode 1.06 μm DFB semiconductor lasers utilizing a ninth-order sidewall-grating structure fabricated via cost-effective stepper photolithography. The lasers were based on an optimized double-asymmetric LOC single-quantum-well epitaxial structure designed for low internal loss and high efficiency. The fabricated DFB lasers exhibited stable single-mode operation with a maximum single-mode output power of 355 mW and a high SMSR of 44.3 dB. The slope efficiency was 0.45 W·A?1. Verification measurements on FP lasers from the same wafer confirmed the high quality of the epitaxial material, showing a low internal loss of 0.85 cm?1 and high internal quantum efficiency of 0.92. This study validates the high-order sidewall-grating approach, combined with careful epitaxial and device design (including an asymmetric phase shift), as a viable and economically advantageous pathway for producing high-power, single-frequency semiconductor lasers at 1.06 μm. While grating-induced scattering losses currently limit the slope efficiency compared to FP devices, future work focusing on optimizing grating-fabrication techniques to reduce these losses, along with enhanced thermal management, could further improve the output power and overall performance, broadening the applicability of these devices.
Sep. 15, 2025Vol. 52 Issue 17 1701008 (2025)
Li Yuan, Yuxing Han, Miao Teng, Fanyu Kong, Chaoyang Wei, and Yunxia Jin
ObjectiveCalcium fluoride (CaF2), as an important material in the ultraviolet-infrared (UV-IR) broad-spectrum optical material system, exhibits ultra-high transmittance (average transmittance of >94%) in the spectral range of 0.13?8 μm. Combined with its extremely low intrinsic absorption coefficient and low refractive index, these properties make it the core material of high-power laser windows and micro- and nano-photonics devices, and its damage characteristics are the key basis for the processing of high-precision micro- and nano-structures. However, the laser damage threshold of CaF2 crystals under high-frequency femtosecond lasers is still insufficient. On the one hand, the UV lasers commonly used in conventional tests exhibit significant spectral response differences compared to the current mainstream near-infrared(NIR) lasers, resulting in limited applicability of the data. On the other hand, even in the near-infrared band, the asymmetric nature of the actual damage morphology generates measurement errors, leading to large errors in the threshold calculation. These two shortcomings limit the accurate calibration of laser processing parameters.MethodsIn this study, the laser damage characteristics of CaF2 crystals are evaluated using a dual-mode system of traditional standard irradiation and dynamic direct writing. Based on the traditional test standard, a five-level energy step of 0.9?2.2 μJ and 10?104 pulse numbers are selected for the experiments, and the dynamic direct writing experiments simulate the actual processing scenarios by the parameter combinations of 0.52?2.04 μJ energy step and 5?200 μm/s scanning speed. The samples are placed in a scanning electron microscope for observation after the damage test. The surface morphology of CaF2 crystal samples after laser damage is investigated by scanning electron microscope, the damage size after laser damage is accurately measured, and the laser damage threshold of CaF2 crystals is calculated by the linear regression method.Results and DiscussionsIn this study, the key damage mechanism of CaF2 crystals under the action of a high repetition rate femtosecond laser is revealed by comparing the damage characteristics under conventional single-point irradiation with those under the dynamic direct writing mode. In the conventional single-point irradiation experiments, the damage point morphology shows significantly asymmetric chipping characteristics (Fig. 2). Due to the fuzzy boundary of the cracked area, the artificial selection of the damage diameter (inner or outer circle) leads to the deviation of the threshold calculation results as high as 136% (Fig. 4), which highlights the limitation of the traditional method. To overcome this problem, this study innovatively proposes a dynamic direct writing linewidth method: continuous damage lines are inscribed by controlling the scanning speed (5?200 μm/s), and the linewidth of the steady-state scanning region is accurately measured by using a scanning electron microscope (Fig. 5). The experiments show that the linewidth in the low-speed (<40 μm/s) region is stable and the edges are smooth without chipping, while the edges in the high-speed (>40 μm/s) region show a jagged chipping morphology (Fig. 6). Based on the linewidth data in the low-speed region, the damage threshold of CaF2 is obtained by fitting a linear regression model to be (4.52±0.08) J/cm2, which reduces the error to 8% compared with the traditional method (Fig. 8). The results provide an important parameter basis for the ultra-precision processing of similar optical materials.ConclusionsIn this paper, the multipulse and direct-writing damage behavior of CaF2 crystals is investigated under a high-repetition-rate femtosecond laser irradiation with a central wavelength of 1030 nm and a pulse duration of 290 fs. In the traditional damage test, the central damage radius of CaF2 crystals does not change significantly with the increase of pulse number, but the edge of the damage point is irregular, and the inaccuracy of measuring the diameter can easily lead to the error of damage threshold calculation, and the error can be up to 3.4 J/cm2. In the case of the damage under direct writing, the width of the damage line basically does not change when the direct writing speed is lower than 40 μm/s and the edge is regular. When the writing speed is greater than 40 μm/s, the edge of the damage line appears to be cracked, and the cracking phenomenon is intensified as the writing speed increases. The damage threshold of CaF2 crystals is calculated to be (4.52±0.08) J/cm2 by substituting the width of the damage line at low speeds (direct writing speeds of 5?40 μm/s) for the diameter of the damage under the conventional damage, which reduces the error of the threshold calculation from 136% in the conventional methods to 8%, and the critical speed threshold of 40 μm/s for suppressing crack propagation is determined. This study provides a high-precision parametric benchmark for the ultra-precision machining of CaF2 optical components and the reliable design of high-power laser systems, and offers a new method for the threshold evaluation of similar brittle crystals.
Sep. 13, 2025Vol. 52 Issue 17 1703001 (2025)
Xiaoyan Zhou, Futao Lu, Qida Yu, Bo Ni, and Guili Xu
ObjectiveThe perspective-n-point (PnP) problem is a critical research task in computer vision, with extensive applications in robotics, augmented reality, autonomous driving, and other domains, holding significant academic and practical value. Traditional PnP methodologies typically rely on precise 3D models and impose stringent requirements on the accuracy of 3D coordinates. This dependency leads to significant degradation in estimation precision when input 3D models undergo scale variations. Although substantial progress has been made in conventional approaches, their core assumption—that the object’s 3D model must be fully accurate and of known scale—often fails in practical scenarios, constituting a key bottleneck that limits algorithmic robustness and precision. Furthermore, most traditional methods are predicated on idealized projection models, neglecting the influence of projection noise. Consequently, they lack rigorous analysis of the statistical properties of the estimator, resulting in systematic bias in the estimation results. To address these limitations, this study proposes a linear methodology that mitigates interference from imprecise 3D model inputs and achieves unbiased, precise estimation results.MethodsThis study incorporates imprecise 3D models into the framework and proposes a statistically grounded consistent PnP solver. The methodology proceeds as follows: First, both the unknown scaling factor and camera pose are treated as parameters to be jointly estimated. By refining the measurement model and employing variable elimination, a system of linear equations is formulated based on the original projection model, from which the least-squares solution is derived. Subsequently, a generalized eigenvalue problem is solved to obtain a consistent estimate of the projection noise variance, which is used to eliminate the estimator’s bias, yielding debiased and accurate estimates of the scaling factor and camera pose. Finally, Gauss?Newton iteration is applied to refine the solution, further enhancing estimation precision.Results and DiscussionsIn synthetic data experiments, results show that as the standard deviation of input noise increases, the proposed method consistently maintains minimal errors with a slower growth rate compared to other state-of-the-art approaches (Fig. 2). When benchmarked against APnP, our method achieves lower errors in both pose estimation and scaling factor recovery (Fig. 3). Error statistics reveal that the proposed method improves the accuracy of rotation matrix and translation vector estimation by at least 8.67% and 11.71%, respectively (Table 1), while simultaneously achieving the shortest computation time, improving operational efficiency by at least 14.36% (Table 2).In real data experiments using the KeypointNet dataset, the proposed method exhibits superior alignment with ground truth and significantly outperforms APnP in error metrics (Fig. 4). For experiments on the ETH3D Benchmark dataset, four representative images were selected as test cases (Fig. 5). Results indicate that the proposed method achieves the lowest errors and shortest runtime among comparative methods (Fig. 6), with a minimum of 10.06% improvement in rotation matrix accuracy and at least 14.19% enhancement in translation vector estimation across relevant scenarios (Tables 3?4). Furthermore, in extreme scaling factor experiments, the proposed method exhibits the lowest error margins compared to other methods (Fig. 7), confirming its robust performance under extreme scaling conditions.ConclusionsTo address the dual challenges of input 3D model inaccuracy and estimator bias in PnP problems, this study proposes a novel solver capable of resolving both issues simultaneously, aiming to enhance pose estimation accuracy while optimizing computational efficiency. The methodology employs linearization techniques to streamline the solving process, significantly improving computational performance. Furthermore, grounded in statistical principles, a bias elimination mechanism is introduced to mitigate deviations induced by projection noise, further refining pose estimation precision.For rigorous validation, the proposed method is benchmarked against state-of-the-art PnP algorithms. Comprehensive experiments on both synthetic and real-world datasets demonstrate that it achieves superior accuracy with the lowest error margins and highest computational efficiency, conclusively validating its methodological advancements.
Sep. 10, 2025Vol. 52 Issue 17 1704001 (2025)
Xiaoshan Li, Jiani Su, Yuejing Qi, Zhipeng Wu, and Junhua Zhao
ObjectiveLithography is a key technology in integrated circuit manufacturing. Before each exposure, the mask must be precisely aligned with the pattern formed by the previous lithography to ensure minimal positional error between different layers. The alignment process is jointly completed by the alignment system of the lithography machine and the alignment marks on the wafer, which directly affects the chip overlay accuracy and production yield. The continuous reduction of feature size leads to higher requirements for alignment accuracy, and the alignment marks are prone to asymmetric deformation due to process influence, resulting in alignment position deviation. The asymmetry of marks is an important factor affecting alignment accuracy, and selecting alignment marks with good process adaptability in advance is the key to ensuring alignment accuracy. Therefore, by establishing a simulation evaluation model for alignment marks, the variation laws of alignment position deviation (APD) and wafer quality (WQ) with deformation size, groove depth, and duty cycle are analyzed for marks that undergo asymmetric deformation at different positions. The principle of selecting marks based on process adaptability is also given, which provides support and reference for the design optimization of alignment marks and the evaluation of alignment accuracy.MethodsAt advanced nodes, due to the alignment mark period to incident wavelength ratio being less than 10, the grating is in a resonance region with a complex diffraction behavior, and an accurate model is established using a rigorous coupled wave analysis. For asymmetric deformation alignment marks, the rigorous coupled wave analysis alone cannot accurately construct their surface shape function, and it is necessary to use a joint layer approximation method to divide them into several layers with equal thickness. When there are enough layers of division, each layer can be approximated as a rectangular structure. At this time, the rectangular grating of each layer can be calculated separately, and the reflection coefficient and diffraction efficiency can be solved by combining the boundary conditions of each layer. Then, using the reflection coefficients of positive and negative diffraction beams, the APD is calculated.Results and DiscussionsUsing APD and WQ of the alignment mark as evaluation parameters, the appropriate number of layers for the mark is determined. First, the variation of APD and WQ with deformation amount, groove depth, and duty cycle under different asymmetric deformation conditions is analyzed. The simulation results of changing the magnitude of deformation indicate that the absolute value of APD is positively correlated with the magnitude of deformation, and the sensitivity of APD measured at different wavelengths and polarization states to changes in deformation varies. Under the same amount of deformation, when asymmetric deformation occurs at the top, the APD changes the most and the sensitivity is the highest, followed by that at the bottom, and that at the sidewall is the smallest (Figs. 8-10). Second, the simulation results of changing the groove depth show that when the groove depth is 1/2 of the incident wavelength, the WQ curve shows a valley with a value close to 0, and the APD shows a jumping extremum. In contrast, when the groove depth is 1/4 of the incident wavelength, a peak appears in the WQ curve and there is no fluctuation in APD (Fig. 11). Third, the simulation results of changing the duty cycle show that when the duty cycle of the alignment mark is selected around 0.5, the APD value is lower and the WQ is larger (Fig. 12).ConclusionsIn this study, a method is proposed for calculating APD using positive and negative diffraction order reflection coefficients based on the principle of self-referencing interference. APD and WQ are used as evaluation parameters to analyze the variation of APD and WQ with deformation amount, groove depth, and duty cycle under different positions of asymmetric deformation. When asymmetric deformation occurs at the sidewall, the APD is least affected by the deformation amount and the sensitivity is the lowest, followed by that at the bottom, and that at the top is the highest. When the asymmetric mark is at the sidewall, the APD is least affected by the duty cycle and the sensitivity is the lowest, followed by that at the top, and that at the bottom is the highest. When asymmetric deformation occurs at the top, bottom, or any position on the sidewall, the APD is not significantly affected by the depth of the groove. Therefore, the APD at different positions is influenced by parameters such as deformation amount, groove depth, duty cycle, etc., and changes with the different positions of deformation, while WQ is less affected by the position of deformation and the magnitude of deformation. The alignment system of the lithography machine needs to be configured with multiple measurement wavelengths to avoid the measurement signals with extreme APD values and improve the process adaptability of groove depth. When the duty cycle is selected around 0.5, the APD value is low and the WQ is large. The methods and the simulation results proposed in this article provide support and reference for the design optimization of alignment marks and the evaluation of alignment accuracy.
Sep. 13, 2025Vol. 52 Issue 17 1704002 (2025)
Zhipeng Lü, Wei Wang, and Yelong Wei
ObjectiveLaser trackers are highly precise, efficient, and reliable measurement instruments. Due to constraints of object size, measurement range, and observation environment, laser trackers need to collect observation coordinates from different stations, which must then be registered into a unified geographical or instrumental coordinate system (Fig. 1). The accuracy and reliability of registration during station transfer are crucial for subsequent data processing. Considering random errors in both original and target coordinate systems, the symmetric similarity transformation model is suitable for data modeling. The total least-squares (TLS) estimator can provide optimal parameter estimates for such a model. Unfortunately, unfavorable observation conditions often lead to outliers, which can render registration parameter estimates unreliable and affect subsequent data processing.MethodsTo overcome the adverse effects of outliers, a robust version of the TLS estimator was studied in detail. In this work, the symmetric similarity transformation model was adopted to model observed coordinates in both original and target coordinate systems. During the implementation of the TLS estimation algorithm, constraint equations in the symmetric similarity transformation model were converted into pseudo-observation equations, which reduced algorithm design complexity and improved numerical stability. Note that “total residuals” are more suitable for predicting observed residuals. Therefore, we applied a weight selection iterative method for the TLS problem based on “total residuals”. Meanwhile, the IGGⅢ equivalent weight scheme was chosen for re-weighting operations. It ensures robustness by setting a down-weighting area and a rejection area, and inherits the high normal validity of the TLS estimator by setting a constant weight area. The proposed robust TLS (RTLS) estimator maintains robustness in both observation and structure spaces, and is expected to perform well against unpatterned outliers.Results and DiscussionsFour parameter estimation methods—least squares (LS), robust LS (RLS), TLS, and RTLS—were compared in both simulation and field experiments. In the simulation experiment, two contamination models were adopted: 1) random errors were added to coordinates in both original and target systems, followed by random introduction of three outliers into specific coordinates; 2) a Gaussian mixture model was used to simulate observation errors (Table 1). Results from 100 Monte Carlo simulations include sequences and means of registration parameter absolute deviations, as well as registration accuracy (Fig. 2, Fig. 3, and Table 2). Both LS and TLS lack robustness, with outliers distorting their estimates. Regrettably, RLS is also susceptible to outlier influence. Considering the coupling effects of random errors and outliers, RTLS exhibits the optimal statistical performance.Field data, collected by two Leica LTD840 laser trackers during the Hefei Light Source renovation project, were used to verify the proposed RTLS algorithm (Table 3). Here, an outlier of 0.006° was added to the horizontal angle observation of P4 at Station A, and an outlier of 0.2 mm was added to the ranging observation of HCG08 at Station B. Since no true values of registration parameters exist, the posterior unit weight standard deviation was used for accuracy evaluation (Table 4). Absolute point errors from the four methods are shown in Fig. 4. With contaminated coordinates, the registration accuracy of LS and TLS degrades significantly. The RLS estimator assigned co-factor factors of 1010 and 175828.3 to the 8th and 13th observation equations, respectively; in contrast, RTLS assigned 1010, 1010, and 36.4 to the 7th, 8th, and 13th observation equations. RLS fails to adequately recognize outlier effects, whereas RTLS effectively identifies contaminated observation equations and mitigates or eliminates their adverse impacts on laser tracker station transfer registration.ConclusionsThe accuracy and reliability of laser tracker registration decisively influence subsequent data processing. However, unfavorable observation conditions make outliers unavoidable. The coupling of outliers and random errors distorts estimates from methods such as LS, RLS, and TLS. The proposed RTLS estimator is proven to reduce or even eliminate outlier adverse effects while retaining the high normal validity of TLS. Future research can focus on robust estimation for multi-station registration.
Sep. 10, 2025Vol. 52 Issue 17 1704003 (2025)
Ning Xiong, Tao Wang, and Lailin Ji
ObjectiveFemtosecond laser technology is widely used in many fields, but its wavelength coverage is limited and its output wavelength cannot be flexibly adjusted. As a third order nonlinear effect, stimulated Raman scattering (SRS) requires no strict phase matching, can effectively suppress wavefront distortion, enhance beam quality, and has a simple experimental setup. It has great potential in expanding wavelength coverage and special wavelength applications. However, the SRS process of femtosecond pulses in crystals is highly transient, with relatively few research. In the generation of femtosecond laser based supercontinuum, most materials have low Raman gain, and main researches focus on the impact of self-phase modulation (SPM) on spectral broadening, neglecting the SRS process. During supercontinuum generation, multiple nonlinear effects interact. The SRS process causes frequency jumps, creating Stokes and anti?Stokes waves in the long and short wavelength directions, respectively, which expands the supercontinuum width. Moreover, SRS can suppress wavefront distortion, potentially improving the beam quality of a supercontinuum light source. It is meaningful to seek high Raman gain materials for supercontinuum generation and to study the impact of the Raman effect on spectral broadening. Ba(NO3)2 crystals, with the high Raman gain coefficient, offer a good platform for this research. This paper constructs a supercontinuum generation model in Ba(NO3)2 crystals through numerical simulation, exploring the influence of SRS and other nonlinear effects on spectral evolution during pulse propagation. By combining theoretical analysis with experimental results, it explains the spectral broadening mechanism and provides theoretical and experimental evidence for femtosecond pulse spectral broadening during propagation in Ba(NO3)2 crystals.MethodsThe scholarly inquiry integrates both theoretical and experimental methodologies. Theoretically, based on the nonlinear Schr?dinger equation, a supercontinuum model of the Ba(NO?)? crystal is built. The split step Fourier method is used for solution, and the Raman response function of the Ba(NO3)2 crystal is established by combining its spontaneous Raman scattering characteristics with nonlinear response curves to simulate spectral evolution. The impact of SRS on spectral broadening is determined by comparing spectral broadening situations with and without the Raman effect. Experimentally, a 200 fs pulse width, 1026 nm center wavelength femtosecond laser pumps the Ba(NO3)2 crystal to achieve a supercontinuum output. The output spectrum is collected by controlling pump power, adjusting polarization, and using long pass filters and spectrometers. Experimental spectra are compared with theoretical ones to better clarify the SRS influence mechanism.Results and DiscussionsThe research combines simulation and experiment to study the Raman effect in supercontinuum generation in Ba(NO3)2 crystals. Simulation shows that when the pump light power exceeds the Raman threshold, the SRS effect is significant. Pump light energy transfers to the Stokes light, producing the first and second order Raman shift peaks at 1150 nm and 1306 nm. Further analysis reveals the third and weak fourth order Raman shifts, expanding the long wavelength spectral coverage by about 150 nm compared to no Raman effect cases. Meanwhile, the competition between SRS and other nonlinear effects inhibits short wavelength spectral distortion, making the spectrum flatter. Experiments show that the maximumly broadened output spectrum covers about 400 nm (1.2?1.6 μm), with simulation and experimental spectra highly consistent in peak position and broadening trend, proving the model validity. Further analysis of experimental results indicates that the higher order Raman shift gains decrease, causing spectral region intensity lower than the theoretical value. Specifically, when the pump light power exceeds the Raman threshold of the Ba(NO3)2 crystal, the clear Raman shift peaks appear in the spectrum. As propagation distance increases, the spectrum broadens further toward longer wavelengths, and the spectrum between the center wavelength and first order Raman peak becomes flatter, effectively suppressing long wavelength spectral distortion.ConclusionsThis paper systematically reveals the role and the dynamic characteristics of SRS in supercontinuum generation during femtosecond pulse pumping of Ba(NO3)2 crystals through theoretical modeling and experiments. Simulations show that when the pump light power exceeds the Raman threshold, SRS transfers pump energy to Stokes light (1150 nm and 1306 nm) via pump photon coupling with lattice vibration energy levels. This extends the long wavelength spectral coverage to about 400 nm, a 150 nm increase compared to that in the absence of Raman effects. The dynamic competition between SRS and other nonlinear effects also flattens the spectrum between the center wavelength and the first order Raman peak by inhibiting short wavelength spectral distortion. The combination of theory and experiment confirms the femtosecond-scale nonlinear dynamics of Ba(NO3)2 crystals, providing a new approach for supercontinuum generation in crystals. Due to the damage threshold of the Ba(NO3)2 crystal, the current spectral broadening is still limited. However, selecting other Raman materials (e.g., diamonds) with stronger Raman characteristics, higher damage thresholds, and better thermal conductivity can further expand the spectral broadening range and intensity.
Sep. 13, 2025Vol. 52 Issue 17 1708001 (2025)
Ji Shen, Xinglai Lu, Liang Chen, Hao Chen, Han Wang, Zhangwei Wang, and Nianwen Cao
ObjectiveTo enhance the observational capability of the vertical profiling network in Zhejiang Province, the Zhejiang Meteorological Bureau has deployed multiple Raman-Mie aerosol LiDARs. However, the quality of current aerosol retrieval products from these LiDARs still needs improvement, and there is limited application and analysis of existing LiDAR data in Zhejiang, making it difficult to fully support refined meteorological services and pollution prevention efforts.This study aims to optimize the aerosol retrieval algorithm for Raman-Mie LiDARs, improve the quality of aerosol products, and enhance their operational application. Given the general lack of auxiliary observations for aerosol LiDARs deployed in Zhejiang, especially the difficulty in accurately obtaining the LiDAR ratio for Mie data retrievals, this study proposes a method to derive aerosol LiDAR ratios based on Raman channel data during nighttime and early morning periods. This provides an effective support for improving the retrieval accuracy of aerosol optical properties based on Mie channel data.In addition, by integrating meteorological elements and air mass backward trajectory data, a comprehensive analysis is conducted on a LiDAR observation case from January 6 to January 10, 2024. This provides a technical support for studying the formation mechanism of regional aerosol pollution and for developing pollution control strategies.MethodsConsidering the higher quality of Raman channel data during nighttime and early morning and the fact that these data are more suitable for extracting true signals using wavelet transform, this study prioritizes the use of wavelet transform to process Raman data collected at night and in the early morning. High-precision aerosol backscatter coefficient profiles are retrieved from these processed Raman data.Based on these profiles above, a range of LiDAR ratios from 1 to 120 (with a step size of 1) is set. Multiple LiDAR ratios are then individually applied to retrieve the aerosol backscatter coefficient profiles from the corresponding Mie channel data at the same time. Using the retrieved aerosol backscatter coefficient profile based on Raman data as a reference, the mean relative error (MRE) is calculated for each retrieval based on Mie data. The LiDAR ratio corresponding to the minimum MRE is regarded as the optimal value for that time.Furthermore, the optimal LiDAR ratios determined for multiple time points during the night and early morning are averaged. The mean LiDAR ratio from 00:00 to 06:00 is applied to retrieve the aerosol optical parameters from Mie data during 06:00—12:00 of the same day, while the mean LiDAR ratio from 18:00 to 24:00 is used for retrievals during 12:00—18:00. In this way, the retrievals of aerosol extinction coefficient and backscatter coefficient profiles for both daytime and nighttime are achieved.Results and DiscussionsA comparative analysis of wavelet denoising effects on Raman signals shows that using the wavelet basis function of sym7 with a decomposition level of 3 results in smoothed Raman signals while preserving more detailed information (Fig. 3 and Fig. 4). This way achieves a better balance between smoothness and effective information retention in the denoising of Raman signals.In the optimized method for aerosol optical parameters retrieved from Mie channel data, multiple LiDAR ratios are preset to retrieve the corresponding aerosol backscatter coefficient profiles (Fig. 5). These profiles are then compared with those retrieved from Raman data, and the MRE between them is calculated (Fig. 2). The retrieval result based on Mie data with the lowest MRE is considered optimal, and the corresponding LiDAR ratio is taken as the optimal value for that time (Fig. 6).Time series plots of aerosol extinction coefficients, backscatter coefficients, and depolarization ratios reveal that the near-surface aerosol extinction coefficients are relatively high between 18:00 on January 6 and 18:00 on January 7, 2024, and between 18:00 on January 9 and 08:00 on January 11, 2024. In both periods, the extinction coefficients generally exceed 1 km?1 and the corresponding depolarization ratios (mostly below 0.2) are low, indicating heavy aerosol pollution near the surface and predominantly spherical aerosol particle shapes (Fig. 8).A correlation analysis between the near-surface aerosol extinction coefficient retrieved by the optimal LiDAR ratio and the ground-based PM2.5 mass concentration shows a correlation coefficient of 0.7, indicating a high level of consistency (Fig. 10). By combining the meteorological elements with the air mass backward trajectory data, it is found that during the periods from 18:00 on January 6 to 18:00 on January 7, 2024 and from 18:00 on January 9 to 08:00 on January 11, 2024, wind speeds are relatively high, mostly exceeding 2 m/s, and the prevailing wind direction is northwesterly (Fig. 11). All air mass backward trajectory clusters from January 6 to January 10, 2024, originate from the northwest. The mass concentration weighted trajectory values in the eastern Shandong, the northeastern Anhui, and parts of Jiangsu are relatively high, all exceeding 75 μg/m3, indicating that the northwesterly winds transport aerosol pollutants to the Huzhou area (Fig. 12).ConclusionsThis study takes full advantages of the high-accuracy aerosol optical parameters retrieved from Raman channel data during nighttime and early morning, providing a more reasonable LiDAR ratio selection strategy for retrieving aerosol properties from Mie channel data. The proposed method markedly improves the accuracy of aerosol retrievals based on Mie LiDAR data and effectively addresses the inherent limitations of single-instrument configurations and the absence of complementary observational data. It also presents a practical technical pathway for promoting the application of similar LiDAR systems in regional aerosol pollution monitoring.Using the optimized method, the near-surface aerosol extinction coefficients retrieved from Mie LiDAR data exhibit a strong correlation with ground-based PM2.5 mass concentrations, thereby confirming the reliability of the retrieval results.
Sep. 14, 2025Vol. 52 Issue 17 1710001 (2025)
Yici Chen, Jinyi Wu, Yifan Liu, Boqi Chen, Feifei Song, Xuan Li, Haoyang Pi, Zhaoyong Wang, Liang Wang, Qing Ye, Haiwen Cai, and Ronghui Qu
ObjectiveShip-information monitoring is vital to marine ecological protection, fishery resource management, and sea-area safety maintenance. The current mainstream ship-monitoring methods include automatic identification systems, optical cameras, infrared thermal imaging, radar monitoring, and remote-sensing technologies. However, these technical methods present the disadvantages of active monitoring, being affected by light, limited monitoring range, susceptibility to electromagnetic-wave interference, and high cost. By contrast, distributed acoustic sensing (DAS) offers unique advantages. It can use the existing submarine communication optical cables, offers passive monitoring, resists electromagnetic interference, supports large-scale networking and long-distance monitoring, and costs lower than remote-sensing technology. Diane et al. used a submarine communication cable to obtain the direction and speed of a ship. Liu et al. used a sensitized optical cable suspended in water to obtain ship voiceprint information and proposed an array-orientation method based on adaptive phase-difference correction. These studies achieved significant advancements in ship-speed estimation, trajectory tracking, and voiceprint recognition. However, DAS has not been used to analyze ship hydrodynamic pressure field (SHPF) in ship monitoring, and the inherent parameters of ships (such as length) have not been obtained. This study proposes DAS combined with a submarine photoelectric composite cable to synchronously monitor the hydrodynamic pressure field and acoustic field of an overtopped ship. Additionally, ship information is derived by combining the signal characteristics of SHPF, acoustic-field information, a signal-enhancement algorithm, and Doppler-frequency shifts.MethodsIn this study, a phase-sensitive optical time-domain reflectometer (Φ-OTDR) combined with a submarine photoelectric composite cable was used to synchronously monitor the SHPF and acoustic field of an overtopped ship to perceive ship information. First, based on potential flow theory and the spatial response characteristics of an optical fiber, a response model of the optical fiber to SHPF was established, and the ship-overtopping time and duration were obtained based on the characteristics of the hydrodynamic pressure field. Subsequently, a signal-enhancement algorithm was used to improve the signal-to-noise ratio of the ship’s acoustic signal, and high-definition spectrum features were successfully extracted. Next, a Doppler-frequency-shift distribution model was established along the axial direction of the optical cable. Based on the least-squares fitting method, the ship speed was inverted using the experimental spectrum information, and the ship length was estimated by combining the ship-overtopping duration. This method successfully combines an existing submarine photoelectric composite cable and a Φ-OTDR to quantitatively acquire ship speed and length, thus providing a new approach for ensuring marine information security.Results and DiscussionsThe proposed method realizes SHPF monitoring, acquires the high-definition spectrum characteristics of ship spectra, and quantitatively acquires ship speed and length. The SHPF curves obtained from theoretical simulation and experiment are consistent (Fig. 9). The center of the hydrodynamic pressure curve of the ship exhibits a symmetrical distribution with a prominent negative pressure peak. Based on the characteristics of the SHPF, the ship-overtopping time and duration can be estimated. Using the obtained high-definition ship-spectrum feature map (Fig. 8), a signal with a center frequency of 21.29 Hz was selected for further processing. The ship speed was obtained via inversion using the least-squares method. The absolute error is only 0.09 m/s, and the relative error is 2.22%. The absolute error of the ship length estimated using the ship-overtopping duration is 4 m, and the relative error is 3.88%.ConclusionsIn this study, DAS and existing submarine photoelectric composite cables were used to simultaneously monitor the hydrodynamic-pressure-field and acoustic-field signals of ships. This approach is an improvement over the previous method, where DAS detects only a single physical field (acoustic field) signal of ships. Thus, it allows more ship parameters to be obtained from SHPF and acoustic-field signals. A response model of an optical fiber to an SHPF was established, and the accuracy of the theory was verified experimentally. The ship-overtopping duration was estimated using the zero-crossing negative pressure peak of the hydrodynamic pressure field. A model depicting the Doppler-frequency shift along the optical cable was established, and high-definition ship spectrum characteristics were obtained using a signal-enhancement algorithm. The ship speed was inverted using the least-squares method, and the ship length was obtained by combining the ship-overtopping duration. In this study, DAS was successfully used to synchronously detect SHPF and acoustic-field signals as well as to quantitatively acquire ship speed and length, thus expanding the information-perception ability of DAS in ship monitoring.
Sep. 04, 2025Vol. 52 Issue 17 1710003 (2025)
Yuhang Gao, Pei Wang, Changdong Shi, Jing Ren, Hanlong Li, Mingtai Zhang, Lingyun Zhang, Wenxin Chen, and Jingdong Sun
ObjectiveTerrestrial laser scanning (TLS) generates high-resolution three-dimensional point cloud data, yielding precise tree structures and facilitating a deeper understanding of dynamic changes within forest ecosystems. Point cloud registration is a crucial foundation for forestry applications. This study proposes a marker-free registration method for forest point clouds based on tree branching structures, which reduces the time and labor required in traditional manual registration.MethodsThis study proposes an innovative automatic registration method based on tree branching structures. First, during the preprocessing stage, ground points were filtered out, and data volume was reduced through random sampling. A graph-based connectivity method was used to separate woody points from leaf points. Subsequently, a digital terrain model (DTM) was constructed for the scene, and the bottom points were selected for density-based clustering. Two collaborative detection methods were then employed to identify tree trunks, which were used as seed points for single-tree segmentation based on comparing shortest paths. For each individual tree, key points were detected through hierarchical clustering, and key point sets were constructed. Coarse registration was performed using the four-point congruent sets (4PCS) algorithm, followed by fine registration using the point-to-plane iterative closest point (ICP) algorithm to improve registration accuracy.Results and DiscussionsTo validate the proposed method, experiments are conducted using forest point cloud data from Yeyahu National Wetland Park, Haidian Park, and the Tongji Tree dataset, which vary in terms of tree numbers and scene sizes. The Yeyahu and Haidian datasets form the experimental group, while the Tongji Tree dataset is used as an open-source reference. The experimental results show that the proposed method achieves a root mean square error (RMSE) of approximately 2.4 cm and a mean absolute error (MAE) of approximately 2.1 cm (Table 2). The registration results of this method are compared with those of the Super4PCS method, and registration overlap is used as a supplementary metric to evaluate registration performance (Table 3). Compared with other key point detection methods such as SIFT, Harris 3D, and ISS (Fig. 8), the proposed method demonstrates superior performance. It achieves an average overlap of 0.980 across five plots (see Table 4), with an average registration time of 9.74 s (Table 4). The proposed key point extraction method significantly outperforms other methods in terms of registration accuracy and efficiency.ConclusionsThis study proposes an automatic marker-free registration method for terrestrial LiDAR forest point clouds that leverage tree branching structures. The approach involves hierarchical clustering of branches to construct key points sets, followed by coarse registration using the 4PCS algorithm and fine registration of the forest point cloud scene using the point-to-plane ICP method. Experimental results indicate that using tree branch structures as key features enables high accuracy and efficiency in marker-free registration. The presence of sufficient branching features in overlapping areas is critical to ensure registration accuracy and effectiveness.
Sep. 04, 2025Vol. 52 Issue 17 1710004 (2025)
Qiuping Lan, Tian Xia, Hong Mei, and Jia Li
ObjectiveTraditional simultaneous localization and mapping (SLAM) back-end optimization methods typically rely on public landmarks and closed-loop detection to enhance global consistency. However, in scenarios with limited feature information or closed-loop failures, the effectiveness of optimization is often constrained. To address this issue, this study proposes a SLAM back-end optimization method based on 2D vector map constraints. The 2D vector map provides globally consistent feature point information, which can be introduced as a priori constraints in the back-end optimization process. This approach effectively compensates for the limitations of traditional methods in feature-sparse or closed-loop failure scenarios. By associating geometric features such as building contour corner points in the vector map with LiDAR sensing data, the method provides stronger global constraints for the optimization process. This enables more accurate position estimation and adjustments to the mapping results, thereby improving both the accuracy of localization and the consistency of the constructed map.MethodsBased on a graph-based optimization algorithm for laser SLAM, this study proposes an improved graph optimization algorithm that incorporates vector maps as constraints. The standard graph-based SLAM optimization algorithm was extended by incorporating vector-building contours as nodes in the factor graph and associating them with radar perception map nodes. First, a hierarchical factor graph model was constructed to divide the optimization problem into two layers: local and global. In the local optimization layer, the factor graph consisted of LiDAR odometry, IMU, vector map a priori, and frame-to-submap alignment factors. The vector map a priori factor provided additional prior information for local optimization, enhancing the local accuracy of position estimation by extracting the building contour corner points and correlating them with the corresponding LiDAR data. In the global optimization layer, the factor map further incorporated a loopback factor and a submap-to-submap alignment factor. The loopback factor was employed to correct cumulative errors when a closed loop was detected. The submap-to-submap alignment factor optimized the relative positional relationships between submaps by aligning the point-cloud data of different submaps to construct a globally consistent point-cloud map. During the optimization process, the Levenberg?Marquardt (L?M) algorithm was employed to iteratively optimize the factor map. The maximum likelihood estimation of the reference state of the point cloud map and submaps was solved for each frame by adjusting the states of the position nodes through the minimization of the error function. Through this hierarchical optimization strategy, the consistency of the global map was enhanced while maintaining the accuracy of local position estimation, resulting in a highly accurate and robust back-end optimization.Results and DiscussionsExperiments were conducted to verify the robustness, stability, and accuracy of the proposed algorithm under various conditions by designing scenarios with fewer constraints (single building) and more constraints (multiple buildings) within a campus environment. Each scenario was further categorized into loopback and non-loopback conditions. The position errors of the proposed algorithm were compared with those of Lio-Sam and Lego-Loam. The experimental results demonstrate that the accuracy of position estimation is significantly enhanced by incorporating vector map constraints. In the scenario with fewer constraints, the loopback condition exhibits a smaller position error at the starting point, which gradually accumulates as the travel distance increases. This error is corrected upon loopback. The trajectory error of the algorithm proposed in this study is slightly higher than that of Lio-Sam and Lego-Loam, indicating that the vector constraint further improves accuracy, even though the loopback mechanism is effective in reducing error (Fig. 6). The algorithm proposed in this study, under loopback conditions, reduces the RPE by 6.3% and the APE by 11.7% on average compared with Lio-Sam and reduces the RPE by 7.3% and the APE by 20.9% on average compared with Lego-Loam. In contrast, under non-loopback conditions, the proposed algorithm shows an average reduction of 8.4% in RPE and 16.3% in APE compared with Lio-Sam and an average reduction of 11% in RPE and 23.8% in APE compared with Lego-Loam (Fig. 13(a) and (b), respectively). In the scenario with more constraints, the trajectory errors of Lio-Sam and Lego-Loam under non-loopback conditions increase significantly with the travel distance, whereas the trajectories generated by the proposed algorithm are effectively corrected at corner positions owing to the constraining effect of the vector corners, thereby improving the overall accuracy (Fig. 12). The proposed algorithm, under loopback conditions, reduces the RPE by 14.1% and the APE by 13.5% on average compared with Lio-Sam, and reduces the RPE by 17.8% and the APE by 25.3% on average compared with Lego-Loam. In contrast, under non-loopback conditions, the proposed algorithm achieves an average reduction of 15.6% in RPE and 28.4% in APE compared with Lio-Sam and an average reduction of 19.9% in RPE and 36.5% in APE compared with Lego-Loam. The error reduction under multiple-building constraints is significantly greater than that in the single-building scenario with fewer constraints, indicating that the optimization effect of vector constraints becomes more pronounced with an increased number of constraints (Fig. 13(c) and (d), respectively).ConclusionsThis study proposed a SLAM back-end optimization method based on 2D vector map constraints, which significantly enhances the bit position estimation accuracy and the global consistency of the map by embedding vector corner points as strong constraints in the factor graph optimization model. Compared with traditional back-end optimization methods, the approach presented in this study demonstrates greater robustness and stability in weak-feature scenarios characterized by sparse features and closed-loop failures. Experimental results indicate that the accuracy of position estimation is significantly enhanced by incorporating vector maps as a priori constraints, and the problem of odometer drift is effectively addressed. In the loopback measurement area, the vector constraint further enhances position estimation accuracy based on the loopback mechanism. In contrast, in the non-loopback measurement area, the optimization effect of the vector constraint is more pronounced, effectively reducing error accumulation. The method presented in this study offers a new technical approach for high-precision laser map construction and provides a reliable solution for SLAM system optimization in weak-feature scenarios. Future research may further explore the application of this method to map updating, using optimized map construction results to supplement the vector map with local details, thereby enhancing the richness and practical utility of the map.
Sep. 04, 2025Vol. 52 Issue 17 1710005 (2025)
Guanghui Zou, Wenlu Wang, Zenghui Wang, Yufeng Li, Runhua Li, and Yuqi Chen
ObjectiveCopper alloys represent a crucial category of industrial materials extensively employed in manufacturing applications. By introducing various metallic elements into a pure copper matrix, these alloys can be engineered to achieve diverse microstructures and enhanced properties. The mechanical characteristics and functional performance of copper alloys are fundamentally governed by their compositional elements, elemental distribution patterns, and internal microstructural features. For example, trace additions of elements such as tin and antimony can significantly improve the physical properties of these alloys. While traditional metallographic analysis methods remain effective for alloy classification, they suffer from practical limitations including time-consuming procedures and operational inefficiency. Laser-induced breakdown spectroscopy (LIBS) has emerged as an innovative solution, offering rapid analytical capabilities through plasma spectroscopy. This technique combines micro-destructive sampling with simultaneous multi-element detection, finding widespread applications in fields ranging from metallurgical analysis to environmental monitoring and biomedical research. The integration of LIBS technology with pattern recognition algorithms shows a particular promise for alloy classification tasks. However, current implementations of machine learning models in LIBS spectral analysis often function as opaque “black boxes,” exhibiting critical limitations such as poor model interpretability, training data overfitting, and inadequate generalization performance when handling new spectral data. To address these challenges, interpretable deep learning approaches are being developed. These next-generation algorithms employ explainable artificial intelligence (AI) techniques to demystify modelling decision-making processes, thereby enhancing classification accuracy while maintaining computational efficiency. This dual focus on performance optimization and decision transparency represents a significant advancement in analytical methodology for material characterization. In this study, target-enhanced orthogonal dual-pulse LIBS (DP-LIBS) is combined with interpretable deep learning algorithms for the rapid and accurate classification of copper alloy samples.MethodsIn the experiment, DP-LIBS is utilized to collect spectral data from copper alloy samples. This approach achieves enhanced spectral line information while ensuring minimal sample damage, resulting in richer feature information. The application of interpretable deep learning algorithms aids in understanding the decision-making process of the classification model, thereby improving the execution efficiency of the algorithm. Each spectral dataset covers wavelengths ranging from 196.8 nm to 500.1 nm, containing a total of 6144 spectral features. For data processing, spectral wavelength features are selectively extracted based on their quantified contribution to classification outcomes, enabling dimensionality reduction of the spectral dataset. This process is achieved through attribution analysis using the integral gradients method, which systematically evaluates the influence of individual wavelength features on model predictions. Then, the decision logic of the classification model is clarified by quantifying the impact of individual spectral wavelengths on the categorical predictions through an attribution analysis. Critical spectral bands are identified by ranking features according to computed importance metrics, while redundant or non-informative wavelength regions are eliminated. The application of interpretable deep learning algorithms aids in understanding the decision-making process of the classification model, thereby improving the execution efficiency of the algorithm.Results and DiscussionsSignificant enhancement in spectral signals and richer spectral line information are observed by DP-LIBS excitation. Compared with those under the LIBS condition, the signal intensities of Cu I 324.75 nm, Cu I 327.40 nm, and Zn I 334.50 nm spectral lines are enhanced under the target-enhanced DP-LIBS condition by a factor of 37.4, 34.8, and 31.8, respectively (Fig. 3). The choice of optimizer for the convolutional neural network (CNN) classification model significantly impacts training speed and network performance. Four optimizers are tested during training. The Adam optimizer demonstrates the highest accuracy and optimal performance (Fig. 5), making it the best choice for the DP-LIBS system. Through integral gradient analysis, the feature points of samples 1?3 with top 100 integral gradient (IG) values are mapped to local regions of the experimental spectra, highlighted in red in the correspondence diagrams (Fig. 6). These high-intensity points reflect spectral features that contribute most significantly to prediction outcomes. The feature-spectra alignment diagrams illustrate the specific spectral details prioritized by the classification model during internal data processing. To validate the performance of the IG-based feature selection algorithm, comparisons are made with manual feature extraction and principal component analysis (PCA) for dimensionality reduction. Classification accuracies for manual feature selection, PCA, and IG-based methods are 84%, 92%, and 99%, respectively. The IG-based method reduces redundant memory usage by 83% and compresses training time by 91% compared to the pre-screening approaches (Fig. 7). This analysis substantiates that interpretable feature selection transcends conventional dimensionality reduction by synergistically enhancing both computational efficiency and physical interpretability.ConclusionsThis study presents a novel methodology for rapid and precise classification of copper alloy specimens by integrating DP-LIBS with interpretable deep learning algorithms. The DP-LIBS technique substantially amplifies elemental signal intensities, yielding enhanced spectral signatures with richer characteristic information. Feature importance analysis through interpretable deep learning reveals that not only the elemental emission lines but also the selected baseline-derived spectral features significantly influence model performance, thereby elucidating the CNN internal decision-making mechanism for the input feature processing. Subsequent feature selection guided by importance metrics prior to model retraining markedly improves the computational efficiency. The proposed approach maintains high classification accuracy while substantially reducing computational resource demands, simultaneously providing explicit explanations of internal data processing dynamics. Demonstrated generalizability and micro-destructive sampling compatibility make this methodology particularly suitable for rapid alloy classification in micro-ablation scenarios.
Sep. 13, 2025Vol. 52 Issue 17 1711002 (2025)
Wen Li, Anni Li, Zhuofan Yu, Xueke Luo, and Sijia Hao
ObjectiveMethanol, as one of the organic solvents, is commonly used for the detection of organic pollutants by ultraviolet (UV)fluorescence spectroscopy. However, the effect of methanol as an intermediate solvent on the fluorescence spectral intensity of benzene has not been reported in the literature. It has been experimentally shown that methanol molecules affect the spectral detection results of benzene, so it is of great significance to study the fluorescence spectral properties of organic solvents with different methanol volume fractions. In this paper, the fluorescence spectra of benzene and toluene are analyzed based on the principle of fluorescence detection by measuring the methanol-water solutions of benzene and toluene with different methanol volume fractions. The fluorescence spectra of the two substances are analyzed in terms of the solvation effect, the coplanar arrangement (π-π interaction) and vibrational relaxation (non-radiative jump) of the molecules, and the fluorescence burst effect at high polarity ratios, and the fluorescence spectra of benzene and toluene under different methanol volume fractions are investigated. The effects of methanol volume fraction on the fluorescence spectra of benzene and toluene solutions are investigated at the level of coplanar arrangement (π-π interaction) and vibrational relaxation (non-radiative jump) of molecules and fluorescence burst effect at high polarity ratios. The experiments verify that the fluorescence intensities of benzene and toluene are affected by different methanol volume fractions, which provides a theoretical basis and practical reference for the fluorescence spectroscopic detection of benzene with methanol as the intermediate solvent, and provides a new perspective for the fluorescence detection method.MethodsThe assay method used in this experiment is the fluorescence method, which is an analytical method commonly used for detecting and measuring fluorescence signals in samples. After the fluorescent substance in the liquid is excited by the incident light, the fluorescence intensity can be observed in all directions of the solution. In this paper, the fluorescence spectra of benzene and toluene are analyzed based on the principle of fluorescence detection by measuring the methanol-water solutions of benzene and toluene with different methanol volume fractions, and the effects of methanol on the fluorescence spectral intensities of the benzene and toluene solutions are investigated at the level of intermolecular coplanar arrangement and vibrational relaxation. The fluorescence spectra of the benzene and toluene solutions with different methanol volume fractions are tested for the influence of fluorescence spectroscopy detection and the results are analyzed.Results and DiscussionsIn this paper, the fluorescence spectra of benzene and toluene are analyzed based on the principle of fluorescence detection by measuring the methanol-water solutions of benzene and toluene with different methanol volume fractions. The fluorescence spectra of the two substances are analyzed from the dimensions of the solvation effect, the intermolecular coplanar arrangement (π-π interaction) and the vibrational relaxation (non-radiative jump), and the effect of the fluorescence burst at a high polar ratio, to study the effect of solvents on fluorescence intensities of benzene and toluene with different methanol volume fractions. The fluorescence spectrum detection experiments are carried out. The analytical results show that the fluorescence spectral intensities of benzene and toluene have an overall increasing trend with increasing the methanol volume fraction when the mass concentration of benzene is 100, 200, and 300 mg/L, the mass concentration of toluene is 1, 20, and 40 mg/L, and the methanol volume fraction is from 0% to 70% with a good linearity. At the higher methanol volume fractions (>70%), the fluorescence intensities of benzene and toluene show a decreasing trend with increasing the methanol volume fraction. In the range of 0%?90%, the change of the fluorescence intensities of benzene and toluene shows an overall nonlinear relationship. The experiments verify that different solvents with different methanol volume fractions have different effects on the fluorescence intensities of benzene and toluene, which provides a theoretical basis and practical application reference for the fluorescence spectroscopic detection of benzene with methanol as the intermediate solvent, and provides a new perspective for the fluorescence detection method.ConclusionsIn this paper, the effect of methanol volume fraction on the fluorescence spectral intensities of benzene and toluene solutions is investigated, and the influence mechanisms are comprehensively analyzed. By the fluorescence spectroscopy analysis, the effect of methanol volume fraction on the fluorescence spectra of benzene and toluene is mainly the change of fluorescence intensity. The analysis results show that the fluorescence intensities of benzene and toluene have an overall increasing trend with the increase of methanol volume fraction when the methanol volume fraction is 0%?70% with a good linearity, while the fluorescence intensities of benzene and toluene show a decreasing trend with the increase of methanol volume fraction at higher methanol volume fractions (>70%). In this paper, the effect of different methanol volume fractions (0%?90%) on the fluorescence intensity of benzene is investigated in terms of solvation effect, intermolecular hydrogen bonding, and molecular aggregation, and it is found that the hydroxyl group of methanol can interact with the electron clouds of benzene and toluene through hydrogen bonding to form a stable solvated structure. This process not only reduces the benzene-benzene and toluene-toluene-stacking interactions and improves the molecular dispersion, but also restricts the vibrational and rotational degrees of freedom of the molecules, which suppresses the vibrational relaxation and leads to the enhancement of the fluorescence intensity. However, at higher methanol volume fractions (>70%), the solvation effect and hydrogen bonding further affect the electron cloud distribution of benzene molecules due to the enhanced solvent polarity, while the aggregation of benzene and toluene molecules occurs, which leads to the enhancement of the fluorescence burst effect and a decrease in the fluorescence intensity. This phenomenon is different from the traditional linear effect, revealing a synergistic mechanism of solvation, non-radiative jump, and fluorescence burst effect. The analytical study of these influencing trends and laws provides reference for the future fluorescence spectroscopic detection and analysis of benzene using methanol as intermediate solvent, especially in the fields of organic pollutant detection, petrochemical and food detection, which has important practical application value.
Sep. 13, 2025Vol. 52 Issue 17 1711003 (2025)
Zhou Yan, Shuai Kun, Chunxian Tao, Dawei Li, Xiaofeng Liu, Yuanan Zhao, and Jianda Shao
ObjectiveThe development of picosecond (ps) petawatt laser systems proposes higher requirements on the laser damage resistance of multilayer dielectric (MLD) high-reflectivity (HR) coatings. As a post-processing technique, laser conditioning (LC) has demonstrated great potential in enhancing the laser damage resistance of optical components. However, there are no studies to report the LC-induced improvements in the ps laser-induced damage thresholds (LIDTs) of MLD HR coatings. Considering the ps short-pulse damage mechanism linked to the electronic non-linear dissociation process, this work extends the sub-ns LC from crystals to MLD coatings. Focusing on HfO2/SiO2 HR coatings deposited by the electron beam evaporation technique, this study investigates the effects of 500 ps LC on their 1, 10, and 20 ps laser-induced damage resistance. Based on the ionization rate equation and the two-temperature model (TTM), the mechanism of the LIDT improvement under 10 ps and 20 ps laser irradiation is analyzed. This study provides new insights for enhancing the ps laser damage resistance of MLD HR coatings.MethodsA sub-ns LC setup operating at 1064 nm with a pulse duration of 500 ps is used to condition the HfO2/SiO2 MLD HR coatings. The 1-on-1 LIDTs of the coatings before and after LC are compared under 1, 10, and 20 ps laser irradiation at 1053 nm. The damage morphologies are preliminarily observed using optical microscope (OM), followed with the high-resolution characterization by focused ion beam scanning electron microscope (FIB-SEM). The LIDT is defined as the maximum fluence when no nanoscale defect-induced damage is observed. To analyze the defect parameters, the Krol defect density statistical model is applied to fit the damage probability curves, and then the defect density, mean damage threshold, and threshold standard deviation are extracted. Additionally, finite element simulations are conducted to study the mechanism of improvement in LIDT by combining the ionization rate equation and the TTM.Results and DiscussionsFocusing on HfO2/SiO2 HR coatings deposited by electron beam evaporation, this study investigates the effects of 500 ps LC on the 1, 10, and 20 ps laser-induced damage resistance. The results demonstrate that the conditioned samples exhibit a negligible LIDT variation under 1 ps laser irradiation, while achieving 8% and 9% improvements in LIDTs under 10 ps and 20 ps laser irradiation, respectively. Meanwhile, the damage morphologies and defect density remain statistically unchanged before and after LC. Under 1 ps to 20 ps laser irradiation, the damage initiation process in HR coatings involves the combined effects of electric field intensity (EFI) and defects. Although LC does not eliminate defects, it “passivates” defects-induced damage capability under 10 ps and 20 ps laser irradiation. The effect of LC on LIDTs in the case of 1 ps laser irradiation is not significant, which is attributed to the higher defect density and the coupled non-linear ionization processes induced by the 1 ps laser. Based on the ionization rate equation and the TTM, the mechanism of the LIDT improvement under 10 ps and 20 ps laser irradiation is analyzed: LC optimizes the distribution of localized defect energy levels, reducing the transition probability of electrons under 10 ps and 20 ps laser irradiation, and thereby improves the laser-induced damage resistance of coatings.ConclusionsThis study investigates the optimization effects of 500 ps LC on the LIDTs of HfO2/SiO2 HR coatings under 1, 10, and 20 ps laser irradiation. By integrating the ionization rate equation with the TTM, the influencing mechanism of 500 ps LC on the damage resistance of HR coatings under 10 ps and 20 ps laser irradiation is revealed. The main conclusions are as follows:1) By using 500 ps LC, the LIDTs of HR coatings under 10 ps and 20 ps laser irradiation are improved by 7% and 9%, respectively. However, 500 ps LC shows a negligible improvement in the LIDTs of HR coatings under 1 ps laser irradiation.2) Under 10 ps and 20 ps laser irradiation, the average LIDT of defects in the conditioned HR coatings increases, while the defect density and the damage types remain unchanged. This indicates that LC does not eliminate defects but enhances their damage resistance.3) LC optimizes the localized defect energy level distribution in the material. This optimization reduces the migration probability of defect-state electrons under 10 ps and 20 ps laser irradiation, thereby improving the damage resistance of the HR coatings at these pulse durations.4) Under 1 ps laser irradiation, during the damage initiation process, a significant increase in defect density is responsible for the enhanced coupling of nonlinear ionization processes among defects. Consequently, the “passivation” effect of LC on defects fails to influence the 1 ps LIDTs of the HR coatings.
Sep. 13, 2025Vol. 52 Issue 17 1703101 (2025)
© Copyright 2018-2021 | Chinese Laser Press.
All Rights Reserved 沪ICP备15018463号-20