


Please enter the answer below before you can view the full text.


2024
Volume: 53 Issue 6
26 Article(s)

Zhaoyong MAO, Nan LIU, Gangqi CHEN, Dongdong HOU, and Junge SHEN
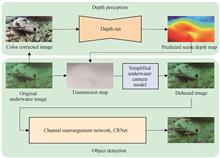
The core of an Autonomous Underwater Vehicle (AUV) lies in its ability to accurately perceive objects and the surrounding environment. With advancements in underwater optical vision sensor technology, optical imaging for environment perception is now feasible. Despite progress in object detection, underwater images' inherent degradation poses challenges. High underwater pressure complicates distance information acquisition, leading to limited training datasets. Moreover, the degradation and blurriness of underwater images often obscure object features. To enhance AUVs' capabilities in distance perception and scene reconstruction, research is increasingly focusing on precise localization and depth scene construction in underwater scenarios. To this end, this paper introduces an underwater visual perception system which incorporates color correction and depth information dehazing to overcome these challenges. Specifically, we propose an improved color correction method that combines white balance and adaptive histogram equalization for effective white balance and histogram adjustments to original images. This approach effectively mitigates the common issue of red artifacts in underwater images, thus rendering the images more realistic. Additionally, our method leverages white balance adjustments to enhance overall image contrast, thereby improving feature clarity. Moreover, to address the challenge of data insufficiency in underwater distance perception tasks, we have developed an improved fusion enhancement method. Through this approach, we establish an underwater monocular image dataset. Specifically, we collected a large number of underwater images from the Internet and enhanced them using the aforementioned image enhancement method. Building upon this, we integrated a monocular depth estimation network into our framework, where the depth estimation network is trained on the collected underwater images in an unsupervised manner. This approach provides depth map information, which is essential for subsequent image dehazing within the framework. Furthermore, to address the mis-detection issue in object detection caused by image degradation, we developed a novel underwater dehazing method. Note that the depth information generated by the monocular depth estimation network provides a more accurate modeling than prior knowledge, thus further enhance the dehazing performance. This method not only enhances image quality but also effectively clarifies degraded and blurry images, when it is incorporated into the proposed underwater imaging perception framework. To achieve more precise object localization, we propose a novel channel reordering network based on center point detection. This method effectively incorporates fine-grained features from the shallower layers of the convolutional neural network into the deeper layers. It should be noted that this anchor-free method effectively enhances feature extraction for small and dense objects. The efficacy of this method was demonstrated through extensive experiments on multiple datasets, including recovery experiments on underwater images. Extensive experiments were conducted to validate the method's ability to restore true terrestrial colors and to accurately perceive relative distances in underwater scenes. Additional experiments validated the method's high-precision object perception capabilities both within and across domains, achieving high performance levels on the URPC-Color and the URPC-Dehaze datasets. Furthermore, a comparison was made with various advanced one-stage models on the URPC dataset. Our method achieves an in-domain object detection accuracy of 78.2%, representing a 4.6% improvement over the baseline CenterNet. Moreover, category-wise accuracy performance shows that our method surpasses all other methods by a large margin, further indicating its effectiveness in underwater scenarios. In cross-domain detection experiments, our method achieves competitive results with an 81.5% object detection accuracy on the UTTS dataset. This further indicates the cross-domain capabilities of our method in underwater scenarios. The color correction and dehazing experiments highlighted the method's ability to enhance image quality and more effectively perceive scene depth and object information.
Jun. 25, 2024Vol. 53 Issue 6 0610001 (2024)
Lili ZHANG, Danfei HUANG, Junzhao GAO, Dong SONG, Jinghui HONG, Yong ZHANG, Hongyu TANG, and Lechao ZHANG
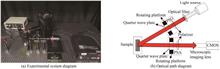
At present, microscopic observation of pathological sections is still the gold standard for pathological diagnosis of cancer. The complex production process and manual detection process of pathological sections make pathological detection subjective and inefficient. Polarization imaging technology is sensitive to sub wavelength structures, and exploring an objective and efficient method for identifying cancerous tissue using polarization images has unique advantages in enhancing pathological diagnostic capabilities.In this article, based on the Muller matrix measurement scheme of double wave plate rotation method, a backscatter polarization imaging system is built and upgrated equipped with a tunable zoom microscope lens to meet the requirements of different resolution fields. The slice data of unstained lung cancer and basal cell cancerare collected, and the Muller matrix is obtained from 30 polarization intensity images based on the Fourier coefficient relationship. In order to enhance the interpretability and strong correlation of the original data analysis paradigm in which the meaning of the Mueller matrix elements is unclear and the interpretation of the information for a single polarization parameter is limited, we report a polarization multi-parameter feature recognition and texture feature analysis method for cancerous tissue. To overcome the limitation that a single Muller matrix image cannot accurately and comprehensively identify the structure of pathological tissue, we introduce rotation invariants to obtain a high-dimensional polarization parameter set, then select regions of interest randomly and generate polarization multi-parameter feature curves to achieve multi-dimensional feature extraction and visualization of pathological regions, solving the problem of direct use of Muller matrix affected by direction. At the same time, in order to further obtain organizational information from derived parameters, 4 texture attributes from gray level co-occurrence matrix and 6 texture attributes from Tamura are calculated to assist in quantitative analysis.The proposed method is experimental verified, the following results are obtained: the characteristic curves of polarization parameter set obtained from 20 random samples in the normal and cancerous regions of lung cancer have a very high degree of overlap respectively, indicating that the polarization characteristics of the same type of tissue are generally similar, but appear to be significantly different in comparison, which perfectly conforms the previous analysis of a single parameter. The visualized polarization multi-parameter feature curve displays the complete polarization characteristics of normal and cancerous tissue of lung cancer in a very concise and clear manner, while also clearly showing the difference in curve trends between normal and cancerous tissue. This method is also applicable to basal cell carcinoma. The information distribution characteristics of normal and cancerous tissue of lung cancer are analyzed by fixing the texture dimension and polarization dimension respectively. When the texture feature is fixed, each polarization parameter has different degrees of discrimination effect. For example, when the contrast attribute is fixed, all the polarization parameters except for the parameter indicating linear polarization ability have good discrimination for lung cancer tissue and can be used as auxiliary tools for quantitative analysis; when the polarization dimension is fixed, the distribution of values for different textures on normal and cancerous tissue is different. For example, for the parameter indicating the angle of phase delay, the texture contrast, correlation, energy, and homogeneity of cancerous tissue are generally higher than those of normal tissue, and their corresponding six Tamura features have good discrimination, all of which have the potential to be used for quantitative analysis.According to the above research process and results, the fitted polarization multi-parameter feature curve restores the original high-dimensional polarization parameter set to two demensions, which can visually and efficiently identify the distribution of polarization differences between normal and cancerous tissue, and can intuitively obtain the information about the differences between different types of tissues in various polarization dimensions. At the same time, the results of texture analysis of lung cancer show that when the texture dimension is fixed, a single texture attribute can be a common quantitative indicator for multiple polarization images; when the polarization dimension is fixed, different texture attributes are expected to be multiple auxiliary quantitative indicators for a single polarization dimension. This method is fast and efficient, providing a new idea for auxiliary pathological detection and demonstrating good application prospects in clinical practice.
Jun. 25, 2024Vol. 53 Issue 6 0610002 (2024)
Fan YANG, Zhishe WANG, Jing SUN, and Zhaofa YU
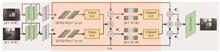
The fusion of infrared and visible images aims to merge their complementary information to generate a fused output with better visual perception and scene understanding. The existing CNN-based methods typically employ convolutional operations to extract local features while failing to model the long-range relationships. On the contrary, the Transformer-based methods usually propose a self-attention mechanism to model the global dependencies, but lack the supplement of local information. More importantly, these methods often ignore the specialized interactive information learning of different modalities, which produces limited fusion performance. To address these issues, this paper introduces an infrared and visible image fusion via interactive self-attention, namely ISAFusion. First, we devise a collaborative learning scheme that seamlessly integrates CNN and Transformer. This approach leverages residual convolutional blocks to extract local features, which are then aggregated into the transformer to model the global features, thus enhancing its powerful feature representation abilities. Second, we construct a cross-modality interactive attention module, which is a cascade of Token-ViT and Channel-ViT. This module can model the long-range dependencies from token and channel dimensions in an interactive manner, and allow feature communication between spatial locations and independent channels. The generated global features markedly focus on the intrinsic characteristics of different modality images, which can effectively strengthen their complementary information to achieve better fusion performance. Finally, we end-to-end train the fusion network through a comprehensive objective function encompassing the structural similarity index measure SSIM loss, gradient loss, and intensity loss. This design can ensure the fusion model preserves similar structural information, valuable pixel intensity, and rich texture details from source images. To verify the effectiveness and superiority of the proposed method, we carry out experiments on the three different benchmarks, namely TNO, Roadscene, and M3FD datasets. Meanwhile, seven representative methods, namely U2Fusion, RFN-Nest, FusionGAN, GANMcC, YDTR, SwinFusion, and SwinFuse, are selected for the experimental comparisons. Eight evaluation metrics, such as average gradient, mutual information, phase congruency, feature mutual information with pixel, edge-based similarity measurement, gradient-based similarity measurement, multi-scale structural similarity index measure, and visual information fidelity, are used for the objective evaluation. In the compared experiments, ISAFusion can achieve more balanced fusion results in retaining the typical targets of the infrared image and rich texture details of the visible image, which presents a better visual effect and is more suitable for the human visual system. Meanwhile, from the objective comparison perspective, ISAFusion achieves better fusion performance than other comparable methods in the three different datasets, which is consistent with the subjective analysis. Furthermore, we also conduct experiments to evaluate the operational efficiency of different methods, and experimental results demonstrate our methods is only behind of YDTR, indicating its competitive computation efficiency. To sum up, compared with other seven state-of-the-art competitors, our method presents better image fusion performance, stronger robustness and higher computational efficiency. In addition, we carry on ablation experiments to verify the effectiveness of each designed component. The experimental results indicate that removing any of the components will degrade the fusion performance more or less. More specifically, we find that discarding the position embedding generates a positive effect on the fusion performance. The qualitative and quantitative ablation studies demonstrate the rationality and superiority of each designed component. In the further, we will exploit a more effective CNN-Transformer learning scheme to further promote the fusion performance, and extend it for other fusion tasks, such as multi-band, multi-exposure, multi-focus image fusion, and so on.
Jun. 25, 2024Vol. 53 Issue 6 0610003 (2024)
Wei WANG, Xiangpeng FENG, Geng ZHANG, Xuebin LIU, and Siyuan LI
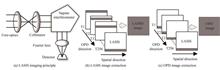
After spectral reconstruction of large aperture static interferometry remote sensing data, a spectral image data cube can be generated that contains both spatial information about the ground objects and interference information. Considering the large volume of large aperture static interferometry remote sensing data and the scarce bandwidth of space-to-earth links, it is necessary to find suitable compression methods to compress this data. Starting from the mechanism of large aperture static interferometry imaging, based on the principles of large aperture static interferometry spectral imaging and the redundant information in the data, a compression algorithm called Spectral-Interference-Optical Path Difference Redundancy Removal (SIORR) is proposed. This algorithm fully considers the similarities between the interference curves of similar ground points and the redundancy between multiple frames. The SIORR algorithm can be divided into three parts. First, it analyzes and processes the interference curves in the hyperspectral data. In large aperture static interferometry spectral imaging remote sensing images, due to the continuity of spatial distribution of adjacent ground objects, the differences between interference curves of the same category are small. By constructing a table of typical interference curves to encode representations of different categories of interference curves, indexes of matching items and necessary correction information are recorded. Each table item not only represents a specific interference curve but also serves as a reference for compressing that type of curve. During the actual compression process, each interference curve in the original data is matched with an item in the curve table, and data compression and recovery are achieved by recording the index of the matching item and necessary correction information. Subsequently, during the interferometric imaging process, there is a high similarity between different optical path difference images, specifically reflected in the texture features of the remote sensing images. By using a prediction method to remove inter-frame correlations and utilizing the high correlation between different optical path difference images, while also avoiding the decrease in correlation caused by large differences in optical path difference, this algorithm adopts a grouping strategy. Every ten different optical path difference images are grouped together, and one is selected as the reference frame. Based on this reference frame, the other nine images are predicted. After these two processing steps, the correlation between different optical path difference images in large aperture static interferometry spectral imaging data has been reduced to about 0.5, while effectively reducing the quantization bit rate of pixel data points. After processing, the main information is stored in the image residuals and curve table suitable for compression, and the errors introduced by lossy compression are relatively small, thus the interference curves restored by the spectral curves are also closer to the original spectral curves. In lossy compression, spectral data is protected. Finally, the JPEG2000 image compression algorithm is used for lossless or lossy compression. Experimental results show that for large aperture static interferometry data, the proposed SIORR algorithm can achieve a 3.1× compression ratio in lossless compression. In lossy compression, the average peak signal-to-noise ratio is about 3 dB higher than that of other comparative algorithms. The spectral angle and relative quadratic error of the spectral curves of images restored by the SIORR algorithm are better than those processed by other comparison algorithms. The remote sensing images restored by the SIORR algorithm are also better than those of other comparison algorithms. Under lossless compression conditions, the SIORR algorithm can effectively increase the compression ratio. In lossy compression, compared to other algorithms, the SIORR algorithm has a higher image peak signal-to-noise ratio, and the interference curves and spectral curves are closer to the original curves, effectively protecting the spectral information. The SIORR algorithm not only has better compression effects but also has lower complexity and is easier to port, making it more suitable for compression processing of large aperture static interferometry remote sensing images.
Jun. 25, 2024Vol. 53 Issue 6 0610004 (2024)
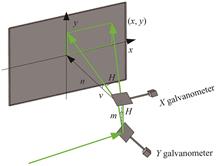
Hongtao ZHANG, Fang TANG, Kun WU, Yiran ZHU, and Maosheng HOU
Laser scanning projection technology can accurately project the patterns of workpiece, text about the processing and other information on the target location based on the CAD model, so the technology is widely used in the advanced manufacturing and intelligent assembly. However, there are theoretical projection distortion errors in the laser scanning projection system, and the distortion errors seriously affects the accuracy of the shape and position of the projected patterns. In order to ensure the accuracy of the projected patterns, it is necessary to predict and correct the distortion errors of the laser scanning projection system accurately and efficiently. Nevertheless, the distortion correction methods for 2D galvo scanner projection system are only commonly reported in the research such as LiDAR and laser marking and other technologies. For the distortion prediction and correction methods of 2D galvo scanner projection system, which are studied in this paper, there is rarely reported both domestically and internationally. In view of this, the particle swarm optimisation BP neural network approach is used in this study for the prediction and correction of distortions in laser scanning projection graphics. In recent years, Elman neural networks have been used in some related studies to correct the distortion error of 2D galvo scanner. Therefore, the Elman neural network algorithm by the same training and test process is adopted in the comparative experiment, and then the two sets of prediction accuracy are compared.In this study, the particle swarm optimization algorithm is studied to optimize the weights and thresholds of BP neural network, and the problems of easily falling into local extremes and overfitting are solved. At the same time, particle swarm optimization BP neural network is also used to predict the distortion errors of the projection pattern in the laser scanning projection system, thus the prediction accuracy of the studied PSO-BP neural network algorithm can be proved. In this study, it is necessary to determine the training data set and test data set of the neural network, obtain the coordinate values with distortion errors which calculated by the coordinate transformation formula, and then calculate the corresponding distortion error Δx as the training data set. The binocular vision measurement system is used to obtain the actual coordinate values with distortion errors, and the corresponding distortion error Δx is calculated as the test data set. Then the number of hidden layers, N, is changed by many times, multiple root mean square error values of prediction accuracy are obtained by the studied method according to different number of hidden layers. When the root mean square error is the smallest, the selected value of N is determined as the number of hidden layers of the particle swarm optimization BP neural network. The neural network is trained by the training data set, and in order to verify the generalization ability of the trained neural network, the test data set is used to test the neural network to avoid the overfitting problem. The particle swarm optimised BP neural network model established in this paper is trained by both training and test datasets, and the Root Mean Square Error (RMSE) of the prediction accuracy can reach 0.017 6 mm, and the calculated time is only 22.4 s. Meanwhile, in the comparison experiments with Elman neural network, the RMSE of Elman's algorithm is 0.682 6 mm. The particle swarm optimization BP neural network algorithm improves the prediction accuracy by approximately 97.419% which compared to the Elman neural network algorithm.In the paper, a distortion errors prediction method for laser scanning projection system based on particle swarm optimization BP neural network model is proposed, through the validation experiments with the Elman neural network, the results show that the root-mean-square error of the PSO-BP prediction model is 0.017 6 mm, and the calculated time is only 22.4 s, but the root-mean-square error of the Elman algorithm is 0.682 6 mm.The particle swarm optimization BP neural network algorithm improves the prediction accuracy by about 97.419% compared with the Elman neural network algorithm. Compared with the traditional Elman neural network algorithm, it can predict the distortion errors of the laser scanning projection system more accurately, and can be applied to the developed laser scanning projection system to solve the problem of accurate correction of the distortion errors. The studied method can also significantly improve the shape accuracy and position accuracy of large-scale projection, can enable the developed laser scanning projection system to perform more precise digital assembly and intelligent positioning operations.
Jun. 25, 2024Vol. 53 Issue 6 0611001 (2024)
Zihan WU, Guohui YUAN, Haohao ZHAO, Liang SUN, and Zhuoran WANG
In recent years, Light Detection and Ranging (Lidar) technology has gained significant attention due to digital advancements and its widespread applications in various domains such as active target detection, industrial manufacturing, robotics, and autonomous driving. The increasing demand for high-precision measurement technology has led to the Frequency-Modulated Continuous Wave (FMCW) approach emerging as a promising tool for achieving enhanced accuracy and resolution at lower received optical power, enabling direct detection target position and velocity. FMCW offers several advantages, including improved anti-interference ability, cost-effectiveness, wider measurement range, and faster measurement accuracy. However, it is essential to note that FMCW laser ranging relies on the ideal linear frequency modulation assumption, which can be distorted by strong nonlinearity and thermal effects of the tunable laser itself, resulting in substantial distortion of ranging results within a narrow frequency range. This issue becomes particularly critical for high-performance Lidar systems.In this manuscript, we propose a nonlinear correction system for tunable semiconductor laser frequency scanning, using a 1 550 nm DFB laser modulated with sawtooth waves to create beat signals. An iterative algorithm is employed initially to prevent lock loss due to large frequency differences, followed by an Electro-Optic Phase-Locked Loop(EO-PLL) which adjusts the pre-distortion current to effectively suppress nonlinearity and achieves linear light tuning. The impact of this linearization on FMCW Lidar resolution is confirmed through experiments measuring the thickness of target objects.Following the nonlinear correction of the semiconductor laser's frequency sweeping, the power spectra of the beat signal are compared in three scenarios: the initial state, pre-distortion, and EO-PLL. It can be observed that the initial beat signal has a wider frequency spectrum with many other frequency components. After pre-distortion correction, the spectrum slightly narrows, and the introduction of EO-PLL further compresses the spectrum, greatly suppressing the frequency sweeping nonlinearity. Additionally, the time-frequency diagram of the beat signal is obtained through the short-time Fourier transform. Before the nonlinear correction, the frequency of the beat signal fluctuates greatly within one period. However, after the introduction of EO-PLL, the frequency of the beat signal stabilizes at the pre-set reference signal frequency of 350 kHz. Moreover, we analyze the output optical frequency of the laser. It is evident that the output optical frequency of the laser before correction exhibits serious nonlinearity, with a Root Mean Square Error (RMSE) of 5.2 GHz. However, after being controlled by EO-PLL, the RMSE of the optical frequency difference is reduced to 23.7 MHz, shrinking to 0.033 9% of the original residual nonlinearity. Furthermore, we expand the frequency excursion to obtain better resolution and compare it with previous results. In the ranging experiment, the discrepancy between the measured target thickness and the actual thickness across various distances ranges from 0.05 to 0.15 mm, demonstrating that the nonlinear correction is effectively achieved.This paper presents a tunable semiconductor laser FMCW ranging system, which incorporates a high-order EO-PLL to achieve a linear optical frequency output by modulating the current slope of the semiconductor laser. The manuscript verifies the reliability and accuracy of the nonlinear correction algorithm by analyzing distance information from static targets. By comparing beat signals corrected under different frequency excursions, it is found that residual nonlinearities are greatly suppressed. Experimental results demonstrate how this technology can significantly improve the performance of FMCW laser ranging systems. This research holds both theoretical and practical importance, contributing to enhanced national competitiveness in relevant research fields.
Jun. 25, 2024Vol. 53 Issue 6 0614001 (2024)
Yingkai CHEN, Chen LE, Yonghong ZHENG, Haijun ZHU, Zhentao ZHONG, Jiangtao LIU, Yang LIU, Yongzheng LI, Linfeng GUO, and Xiaomin XU
As low-cost and compact Brillouin optical time domain reflectometers are increasingly being used in the field of general engineering structural monitoring, improving the performance of these reflectometers is essential, which is beneficial for their functionality and accuracy in monitoring and therefore is conducive to their large-scale application. In this paper, the Brillouin optical time domain reflection structure based on local excitation is used to improve the performance of the ultra-low cost Brillouin optical time domain reflectometry without increasing the operation time and other redundant optoelectronic devices to maintain the ultra-low cost structure.The front end of the experimental device is composed of laser, semiconductor optical amplifier, Erbium-Doped Fiber Amplifier (EDFA) and three couplers. A beam of continuous light output by the laser is divided into 90% and 10% by the coupler1. 90% of the light enters the upper branch and is modulated to a width of 100 ns and a period of 40 μs after passing through the Semiconductor Optical Amplifier (SOA). 10% of the light enters the middle layer and the lower layer branch, the middle layer is used as the continuous pump light of pulsed light, and the lower layer is used as the reference light path. Probe light and pump light enter 90% port and 10% port of 10∶90 coupler3 respectively, and the two beams are fused and injected into 3 km Fiber Under Test (FUT). Stimulated Brillouin scattering Stokes light generated in the optical fiber to be tested enters EDFA for amplification through the 3rd ports of the circulator, and is filtered out of Amplifier Spontaneous Emission (ASE) noise by the Dense Wavelength Division Multiplexer (DWDM) and converted into 10.8 GHz Radio Frequency (RF) signal by the Photo Detector (PD). After amplification and filtering, the RF signal is down converted to a signal of about 600 MHz by Voltage Controlled Oscillator (VCO), and finally collected by a data acquisition card with a sampling rate of 5 GSa/S.In the Brillouin optical time domain reflectometry system, the sensing distance and temperature measurement accuracy are directly related to the signal-to-noise ratio. The higher the signal-to-noise ratio is, the longer the sensing distance is, and the higher the temperature measurement accuracy is. Therefore, in order to verify the signal-to-noise ratio of the locally excited system, we first carried out the normal temperature experiment to detect the temperature measurement accuracy and detection distance of the terminal. At room temperature, a roll of optical fiber to be measured is measured by using the traditional Brillouin optical time domain reflectometry structure and the locally stimulated Brillouin optical time domain reflectometry structure. Connect port 2 of the circulator to 3 km of corning bare fiber to be tested. The pulse power modulated by the traditional structure SOA is 1.98 mW, the light intensity injected into the fiber to be measured from the circulator 2 port is 1.801 mW, and the reference light intensity is 764 μW. The light intensity of the middle continuous light of the new structure is 163 μW. The SOA modulation pulse power is 1.97 mW, and the reference light intensity is 680 μW. The light intensity of the fused light injected into the fiber to be tested through the two ports of the circulator is 1.803 mW, and the power of the two injected fibers is basically the same, so the difference in the results is not caused by the difference in the input power. The comparison results of Brillouin Frequency Shift (BFS) along the optical fiber are obtained after Short Time Fourier Transforming (STFT) of two groups of time domain data collected. The experimental results show that the data signal-to-noise ratio measured by the Brillouin optical time domain reflectometry system with the new structure is significantly better than that of the traditional coherent detection BOTDR system. The signal fluctuation of Brillouin optical time domain reflectometry system with traditional structure becomes larger at 1 900 m of the optical fiber to be tested, which indicates that the signal-to-noise ratio has deteriorated. The Root Mean Square Error (RMSE) of the BFS measured by the traditional structure is 2.61 MHz from 200 m to 1 950 m, and 8.16 MHz from 1 950 m to 2 350 m. The RMSE of the new structure is 2.36 MHz from 200 m to 1 950 m, and 3.01 MHz from 1 950 m to 2 350 m. It can be seen that the results of the first 1 950 m are basically similar because the pulse loss is not large and the energy is enough to support a more accurate measurement. After 1 950 m, the pulse light energy gradually decays, leading to the continuous increase of RMSE. After using the locally stimulated Brillouin structure, the pulse energy is supplemented, which can be used for longer distance measurement.In order to explore whether the middle path light intensity will affect the locally stimulated Brillouin system, we increased the continuous pump light in the middle layer to about 1 mW, and then detected at room temperature again. The results show that compared with no middle path light, increasing the middle path light can also significantly increase the signal-to-noise ratio of the system.We carried out an experimental study on the effect of the down path light on the structure. Since multiple couplers are used for light splitting, the intensity of the reference light inevitably decreases. Therefore, we magnify the reference light (lower light) of the new structure to the same as the old structure, which is 764 μW. Measure again. The results show that compared with the new structure without increasing any light intensity, increasing the lower light can also slightly improve the signal-to-noise ratio, but the effect is slightly worse than increasing the middle light. It can be seen that increasing the light intensity of each layer can help to improve the signal-to-noise ratio, but the signal-to-noise ratio cannot be improved indefinitely.In addition, we conducted temperature experiments using 2.7 km of Changfei optical fiber. The first 2 250 m of optical fiber is set at normal temperature, 250 m of optical fiber is heated in 50 ℃ water bath, and 200 m of optical fiber is reserved at the end to prevent reflection. The experimental results show that the RMSE of the traditional structure after 2 250 m is 4.41 MHz, that is, the temperature fluctuation is ±3.39 ℃ (temperature coefficient 1.3 MHz/℃), which is greatly limited in practical application. After using the local stimulated Brillouin structure, the temperature fluctuation is reduced to ±1.27 ℃, which can meet the actual demand.
Jun. 25, 2024Vol. 53 Issue 6 0614002 (2024)
Zihan ZHANG, Zhencheng CHEN, Wang CHEN, Xuehui TANG, Tianji LEI, Chu TAN, Fuyin ZHU, Aiwen LIAO, Changlin XIAO, Shimin YIN, and Cheng FANG
A flow cytometer is a cutting-edge technology that blends the technical aspects of lasers, electrophysics, optoelectronic measurement, computer technology, cell fluorescence chemistry, and monoclonal antibodies. Flow cytometers make use of laser light to stimulate the fluorescent dye inside cells to measure and analyze the latter's sizes, shapes, colors, and fluorescence. It offers a swift solution to multi-parameter quantitative analyses and sorting of fluid-state cells or bioparticles, which explains its extensive utility in life science research and clinical diagnostics. Seeing that the light power stability, wavelength stability, and photodetector noise rate of the flow cytometry significantly affect the experiment's accuracy, this study adopted a semiconductor laser as the driving light source for the flow cytometer to ensure a stable, low-noise laser light source. Semiconductor lasers' compact size, long lifespan, high brightness, high electro-optical conversion efficiency, and excellent directivity make them widely applicable for not only optical measurement and storage but also for military purposes, communication, and medical diagnostics. Despite the versatility, semiconductor lasers also feature an excitation method that involves current injection, which, when taken into account with its material characteristics, outputs light with features that are highly sensitive to the injected current and operating temperature. Research indicates that temperature rise can drastically reduce carrier concentration, significantly increase threshold current, decrease electro-optical conversion efficiency, and convert most electrical energy into wasteful heat, reducing the output light power to a minimal level. For instance, every milliampere of current change can cause an approximate 0.02 nm drift in the output light wavelength, and each degree Celsius temperature change can result in an approximate 0.1 nm drift in the output light wavelength. Additionally, prolonged operation in high-temperature environments will considerably diminish the lifespan of semiconductor lasers. In response to these current and temperature stability issues commonly associated with semiconductor lasers, a novel design of a drive system specifically tailored for flow cytometers is proposed. With an STM32 as the central control core, the drive system communicates with the flow cytometer's main computer via RS232 serial communication. The temperature control component employs a MAX8521 professional temperature control chip, coupled with an external hardware PI circuit and its internal H-bridge drive to swiftly and accurately control the thermoelectric cooler. This concerted configuration enables the system to maintain a constant working temperature for both the laser and photodiode. The driving component incorporates a deep negative feedback circuit for light power in conjunction with a PID algorithm, forming a dual closed-loop power control system. This arrangement ensures that the laser drive current closely aligns with the anticipated value, thereby providing precise and stable control of the laser's output power, minimizing laser output noise, and reducing potential wavelength drift. The experimental results demonstrate the system's slow temperature adjustment speed, with temperature fluctuations maintained within ±0.016 ℃ and a temperature control instability of just ±0.055%. The laser's output characteristics remained relatively stable, exhibiting a ±0.078% long-term light power output instability, a 0.109% photodetector noise rate, and a 637~638 nm stable output light wavelength. When applied to the flow cytometer for CV quality control experiments, the instrument resolution's full peak width variation coefficient was consistently less than or equal to 1.70%, surpassing the requirements set by the YY/T0588-2017 flow cytometer industry standard. In conclusion, the proposed system demonstrates exceptional precision in temperature control, maintains a stable and low-noise light power output, and minimizes light wavelength drift. It yields impressive CV test results through flow detection, fulfilling the requirements of flow cytometer detection, thus giving it substantial practical value.
Jun. 25, 2024Vol. 53 Issue 6 0614003 (2024)
Bofeng GAO, Lu WANG, He ZHANG, and Chong ZHANG
At present, the most widely used mode-locked pulse fiber lasers mainly use saturable absorber as nonlinear optical element to achieve passive mode-locking. In the past few years, saturable absorber based on zero-dimensional quantum dots have been rapidly developed, which is also related to the excellent nonlinear optical effects of quantum dots themselves. Quantum dots such as PbSe, TiN, CdTe and graphene have been widely used in ultrafast Er-doped fiber lasers. Among various types of quantum dots, PbS quantum dots have the characteristics of small carrier effective mass, large optical permittivity, large exciton Bohr radius and low band gap energy. These characteristics make PbS quantum dots saturable absorber have the advantages of adjustable absorption peak, large third-order nonlinear polarizability and large modulation depth. The optical properties of PbS quantum dots are very sensitive to their size and shape, and the synthesis of high-quality PbS quantum dots with good size and shape distribution is of great significance in the whole experimental research. PbS quantum dots has been studied in the fields of dual wavelength soliton mode-locking, wavelength tunable pulse, ultrafast stretch pulse and high power ultra-shorts pulse. However, in the field of fiber lasers, the prepared quantum dots material is mostly deposited directly onto the jumper head for use, and it is difficult to ensure the repeatability and consistency of the device while the nonsaturable loss is large. To solve this problem, we use the two step spinning coating method to form the quantum dots and use them as saturable absorber to achieve mode-locking in fiber lasers, and achieve good results.We prepare PbS quantum dots by optimized hot-injection method. In the whole process, we use the Schlenk line technology to maintain an anhydrous and anaerobic environment and react under the protection of argon all the time.The prepared quantum dots solution is directly poured into low-temperature methanol in the preparation process to achieve rapid cooling effect, which makes the prepared quantum dots diameter more uniform and stable. After centrifugation and purification, the quantum dots are obtained and then dissolved in toluene and preserved. Transmission electron microscopy is used to characterize PbS quantum dots, and then the diameter distribution of quantum dots is measured by ImageJ software. The average diameter is (6.74±0.03) nm. Next, we prepare PbS quantum dots film by two-step spiral coating method, cut the film into 3×3 small pieces, remove them with tweezers and place them into the flange to obtain PbS quantum dots saturable absorber. Then the modulation depth, nonsaturable loss and saturated intensity of the fitted films are measured by a twin-detector measurement device, and the repeatability and consistency of the films are tested. These films have modulation depths ranging from 25.5% to 32.6%, nonsaturable loss ranging from 6.42% to 11.58%, and saturated intensity ranging from 4.76 MW/cm2 to 7.14 MW/cm2, which has good repeatability and consistency. Finally, we put PbS quantum dots saturable absorber into a self-constructed fiber laser cavity to achieve mode-locking, and find that stable self-starting mode-locking can be achieved starting at a pump power of 47 mW. It is proved objectively that PbS quantum dots saturable absorber has good mod-locking quality during laser evolution by spectrum, pulse trains, frequency spectrum, auto-correlation trace and the relationship of the average output power and single pulse energy with the change of the pump power.In this paper, PbS quantum dots film is prepared by optimized hot-injection method, and then the PbS quantum dots film is prepared by two-step spiral coating method. The PbS quantum dots film is used as saturable absorber in fiber laser to achieve stable mode-locking. The modulation depth and saturated intensity of the prepared films are about 26.46% and 6.75 MW/cm2, respectively, and the nonsaturable loss is 6.42%. The films have better repeatability, consistency and small nonsaturable loss. The fiber laser use the thin film as a saturable absorber can start self-mode-locking at the output power of 47 mW pump source, and achieve long-term stable mode-locking laser output. The experimental results show that PbS QDs SA has good repeatability and consistency, and achieves mode-locked laser output with center wavelength of 1 564.1 nm, repetition frequency of 19.53 MHz and signal-to-noise ratio of 61 dB in fiber lasers, which lays a foundation for the practical application of PbS QDs SA in fiber lasers in the future. It is expected to be an ideal choice for mode-locked photonic devices.
Jun. 25, 2024Vol. 53 Issue 6 0614004 (2024)
Jin ZHANG, Tao JIANG, Guoguo XIN, Yu DANG, and Gaofeng WU
In the Su-Schrieffer-Heeger model, the topological properties and optical evolution dynamics of two-site lattice chains have been extensively studied, providing a theoretical basis for investigating the topological properties of even-length unit cell lattice chains. However, research on the topological properties of odd-site unit cell lattice systems with three or more energy bands is relatively limited. This is because symmetry breaking exists in three-site systems, making it challenging to directly apply theoretical methods developed for even-band systems. Therefore, this study aims to explore topologically protected optical transmission behaviors missing in the classical two-site model using a one-dimensional trimer lattice model, establishing a framework for topological photonics theory applicable to odd-band systems.This model will employ theoretical methods such as coupled mode equations and band theory for investigation. By integrating the one-dimensional trimer lattice model with a waveguide array using coupled mode theory, the model will simulate the evolution process of light beams in the waveguide array. This will involve substituting plane waves into coupled mode equations, adjusting coupling coefficients, and observing localized optical phenomena and intensity distribution during beam transmission. Eigenenergies and wave functions of the model will be computed using band theory, facilitating the generation of real-space band diagrams and probability distribution maps of wave functions. Through analysis of these data and images, a deeper understanding of the mechanisms behind topological oscillating light beams and asymmetric edge states observed in the one-dimensional trimer lattice model can be obtained. Furthermore, by computing topological invariants and statistically analyzing the distribution of edge states, phase diagrams of the system can be plotted, comprehensively displaying the distribution of topological edge states across the entire parameter range. Introducing defects midway through the long-distance evolution of light beams will be conducted to validate the robustness of topological edge states in the model.Based on a one-dimensional trimer lattice model, the evolution of light beams in the waveguide array and the intrinsic band structure are analyzed, thereby discovering topologically protected Rabi-like oscillatory light transmission and asymmetric edge states. The research simulates the evolution of light beams in the one-dimensional trimer lattice model under both spatial inversion symmetry and symmetry-breaking conditions. The results indicate that under symmetric distribution, Rabi-like oscillatory transmission occurs, with this topological oscillation state localized at the left and right edges of the waveguide array, exhibiting symmetric distribution and stable transmission under short-term evolution. However, upon introducing symmetry breaking, the system exhibits asymmetric topologically protected light transmission phenomena. Further analysis of the energy spectrum and eigenstate distributions reveals the physical mechanisms behind the generation of Rabi-like oscillation edge states and asymmetric edge states, showing a close correlation between the oscillation and the incident position and phase of the light beam. Phase diagrams plotted clarify the regions where topological edge states exist under different parameter conditions. By introducing defects, the robustness of topological localized oscillatory light beams against perturbations is verified, demonstrating the system's stable topological properties even under symmetry breaking.The conclusions drawn from the above analysis are as follows in the optical evolution of the one-dimensional trimer lattice model, Rabi-like oscillation phenomena, not previously observed in two-band systems, are present. By adjusting the incident position and phase of the light beam, the oscillation of light beam transmission can be controlled. This study also demonstrates that even under symmetry breaking, the trimer waveguide array retains stable topological properties, with asymmetric edge states robustly transmitting. This finding not only provides a theoretical reference for odd-site unit cell systems but also offers new insights into the design and optimization of optical devices, opening up possibilities for potential applications in optical transmission, information processing, and sensing.
Jun. 25, 2024Vol. 53 Issue 6 0626001 (2024)
Hongyu YAN, Yu ZHAO, Yuanyuan CHEN, Hao LIU, Jie WANG, Rui ZHANG, and Zhibin WANG
An adaptive baseline correction method was proposed by combining Particle Swarm Optimization (PSO) and asymmetrically reweighted Penalized Least Squares (arPLS) through fitness function to reduce or eliminate the influence of continuous background radiation, random noise, and sample matrix effect on the characteristic spectrum in the in-situ analysis of long-range Laser-Induced Breakdown Spectroscopy (LIBS). The PSO-arPLS approach is intended to increase the remote LIBS's analytical capacity.The method adds the regular function to the loss function, turning the limited problem into an unconstrained problem, and uses the“asymmetric weighting”approach to accomplish the adaptive baseline correction goal. PSO and arPLS were combined by fitness function and applied to an aluminum-based alloy with trace metal elements as the research sample. Particle swarm automatically discovered the optimal parameters of arPLS fitting baseline to achieve the balance of weight vector and smoothing parameters in baseline signal. The spectral Signal-to-Noise Ratio (SNR) and noise reduction effect of the short-wave and long-wave spectral segments were examined, using the gathered 6061 series aluminum base alloy LIBS as an example. PSO-arPLS was then compared with the conventional airPLS and asPLS calibration methods. Finally, the kernel Support Vector Machine (SVM) model is trained using the original LIBS data set of aluminum base alloy and the data set after baseline correction using the aforementioned three methods, and the confusion matrix of the model is analyzed to confirm the validity of the suggested baseline correction method.The results demonstrate that the suggested PSO-arPLS approach can not only reduce the spectral baseline fluctuation but also increase the spectral SNR and boost the spectral dynamic range when compared to conventional airPLS and asPLS calibration methods. PSO-arPLS can effectively preserve the LIBS signal with spectral characteristics after correction. In contrast, the fitting baselines proposed by airPLS and asPLS methods lead to serious loss of LIBS characteristic peak region and low fitness for eliminating LIBS noise. Therefore, when correcting LIBS spectra with low SNR, the baseline trend can basically overlap with the uncharacterized peak region, and the PSO-arPLS method also shows a good effect in noise elimination. Continuous background radiation is successfully monitored, and the fitted baseline lies within the cross-range of the characteristic spectrum and noise signal. In conclusion, the PSO-arPLS algorithm performs well in noise reduction and corrects the low SNR LIBS spectral baseline region, which nearly overlaps with the non-characteristic peak region.Three different types of aluminum-based alloys doped with comparable trace elements were employed as research objects in this paper. Under the same experimental conditions, the fitting baseline was utilized to analyze and evaluate the variation trend of the spectral SNR addressed by the airPLS and asPLS algorithms. A cubic kernel SVM fine classification model for aluminum-base alloys was created to confirm the efficacy of the suggested approach. The independent test set's confusion matrix classification had 100% accuracy. The kernel SVM model was trained using the original LIBS data set and the suggested baseline corrected data set, and the model's confusion matrix was examined. The outcomes demonstrate that the PSO-arPLS technique could more effectively classify and identify the LIBS data. The 11.8% increase in classification accuracy further demonstrates the PSO-arPLS method's beneficial effects on data analysis. PSO-arPLS approach has strong noise robustness and can overcome the effects of continuous background radiation and LIBS noise at a great distance. Additionally, the proposed method for LIBS adaptive baseline correction can be used in real-world industrial contexts and significantly enhances remote LIBS's capacity for qualitative analysis.
Jun. 25, 2024Vol. 53 Issue 6 0630001 (2024)
Ruijie WU, Tiegen LIU, Kun LIU, Junfeng JIANG, Shuang WANG, Zhenyang DING, and Zhiyuan LI
In severe cold climates, the bearing capacity of ice body depends on its thickness. As a carrying medium, the ice body with enough thickness expands the human activity area. However, when the bearing capacity of the ice body is insufficient, brittle failure will occur, leading to serious consequences such as casualties and property damage. Therefore, the research on the strain of the ice body measurement technology is of great significance to ensure the reasonable bearing capacity of the ice body. The traditional electromechanical strain measurement systems have some disadvantages, such as large volume and difficult sensor installation and disassembly. The current measurement methods of spectroscopy mainly focus on theoretical simulation and exploration of ideas, while there are few specific plans and experimental studies. In this paper, the Single-mode No-core Single-mode (SNS) fiber optic sensor for strain measurement of ice bodies is proposed. SNS fiber optic sensor is implanted into ice bodies in a layered freezing manner. When the strain of ice changes, it modulates the sensor, causing the wavelength of the interference spectrum to shift. By monitoring the spectral wavelength, ice strain measurement is achieved. By utilizing the similar temperature sensitivity of adjacent spectral troughs, the wavelength difference between adjacent troughs can be applied to strain measurement, which is not affected by changes in ice body temperature. The length, width, and height of the ice body are 250 mm×150 mm×16 mm. When the temperature of ice body increases from -20 ℃ to 0 ℃, the wavelength shifts of Dip1 and Dip2 in the spectrum are very close. The temperature sensitivities of Dip1 and Dip2 are 9.8 pm/℃ and 9.5 pm/℃, respectively, with a relative difference of only ~2.5%. Therefore, by using the wavelength difference between Dip1 and Dip2 as the measurement factor for ice bearing capacity, temperature independent bearing capacity measurement can be achieved. Establish an experimental system to study the strain response of ice under different bearing capacities. Place weights at the center of the upper surface of the ice body, to apply bearing capacity to the ice body. The weights are loaded from 0 g to 600 g. Results show that when the bearing capacity of the manufactured ice body exceeds 500 g, its strain significantly increases. When the bearing capacity exceeds 600 g, the ice body undergoes brittle fracture, and the sensor effectively extracts the strain signal during the ductile-brittle transition process of the ice body within this range. The melting experiment shows that the sensor can monitor the complete strain change process during the natural melting of ice, and the measurement results are not affected by the temperature changes inside the ice. For existing ice body in actual testing environments, fiber optic cannot be pre-embedded inside. Improvement is needed for the layered freezing method. Firstly, determine the location to be monitored on the ice surface, known as the monitoring point. Place the fiber optic in a natural straight state on the ice surface, aligning the SNS sensor on the fiber optic with the monitoring point. Place ice block on the fiber optic on both sides of the SNS sensor to secure the fibers. During the fixation process, slowly inject water into the gap between the ice block and the ice surface, and naturally freeze for 5 min. The ice block and ice surface are completely frozen, thus achieving the fixation of the fiber optic. Afterwards, slowly inject water into the ice body until the ice blocks are submerged. After 1 h of natural freezing, the injected water is frozen together with the original ice body, thus completing the implantation of optical fibers into the existing ice body. It should be noted that the ice body itself is a 3D structure, and when a single sensor is implanted, only the strain information of the monitoring point where the sensor is located can be obtained. To accurately describe the overall strain of the ice body as much as possible, research can be conducted through fiber optic measurement schemes with good reusability such as fiber Bragg grating.
Jun. 25, 2024Vol. 53 Issue 6 0606001 (2024)
Qingzhe WU, Meng LI, Dan XU, and Xuyou LI
The Panda-type polarization-maintaining fiber, as a typical stress-type fiber relied on stress birefringence, is utilized for maintaining the polarization state of the transmitted light. An ideal polarization performance is achieved by increasing refractive index difference along two orthogonal axes resulting from stress formed into the fiber core. The Panda-type polarization-maintaining fiber has been widely used in fiber optic gyroscopes, telecommunications, fiber optic sensors, and high-speed optical communication systems owing to its advantages of high polarization extinction ratio, low polarization mode dispersion, and low insertion loss. Currently, improving the birefringence of Panda-type fiber is a significant research direction. Various studies have focused on changing the core shape of the fiber, such as using elliptical, leaf-shaped, and square-shaped cores to enhance birefringence, but with limited effects. An alternative method is to change the shape of stress regions to improve the birefringence of the fiber, such as Knot-type polarization-maintaining fibers and elliptical cladding polarization-maintaining fibers. Remarkably, the Knot-type polarization-maintaining fiber exhibits the best polarization-maintaining performance due to its larger effective stress regions. The most commonly used fiber has a cladding diameter of 80 μm to achieve miniaturization of fiber coils. However, for high-precision satellite positioning, unmanned aerial vehicles, and automotive navigation, research on 60 μm thin-diameter polarization-maintaining fiber is urgently needed. As the cladding diameter decreases, the study of coating thickness becomes challenging because thinner coating layers are difficult to maintain the excellent transmission performance of the fiber. In this paper, the COMSOL finite element analysis software is utilized to propose a method to enhance the birefringence of Panda-type fiber by adjusting the material properties of the stress regions. By changing thermal expansion coefficients of materials from 2×10⁻⁶ K-1 to 7×10⁻⁶ K-1, the Young's modulus from 2×10¹⁰ Pa to 12×1010 Pa, and the Poisson's ratio from 0.1 to 0.5, the impact of the stress regions on effective refractive indices of the fast and slow axes of the fiber core is enhanced, and thus improving the birefringence of the fiber. For the miniaturization of fiber coils, this study simulates the effect of reducing the outer coating diameter from 165 μm to 135 μm on the fiber's transmission performance. Furthermore, a complete physical model of a 32-layer, 82-turn fiber coil is built, where point loads applied to the boundaries of each turn of the fiber is used to simulate the real internal stress during fiber winding. The stress of each turn in the fiber core is then extracted as the basis for judging the output error of the fiber coil. To reduce the error caused by winding tension, the study discovers an optimal ratio of thickness between the inner and outer coatings by analyzing different material properties and effects. This improved thickness ratio reveals an excellent suppression effect of winding tension by approximately 10% compared to the original fiber. The simulation calculates the Young's modulus and Poisson's ratio of the double-coatings, with the inner coating's Young's modulus varying from 1.56 MPa to 15.6 MPa and the outer coating's Young's modulus varying from 1 GPa to 4.68 GPa. Both the inner and outer coatings have Poisson's ratios ranging from 0.25 to 0.45, and the conclusion is drawn that the material properties of the coatings also have a significant effect on suppressing winding tension. In summary, this paper proposes methods to enhance the birefringence of Panda-type polarization-maintaining fiber by changing the structure and material parameters of the stress regions. Additionally, it demonstrates that reducing the coating thickness of the fiber effectively enhances birefringence performance under low-temperature environments. Finally, to reduce the error caused by fiber winding tension, it suggests optimizing the thickness ratio of the fiber coatings and the material parameters of the coatings.
Jun. 25, 2024Vol. 53 Issue 6 0606002 (2024)
Haohao FAN, Qiang ZHAO, Dawei DU, Peng SUN, Wenfeng LIIU, Yanlong LI, and Mingtao CHEN
The lateral creep of hydrate-bearing layers associated with natural gas hydrate decomposition can easily cause geo-engineering security risks. The triaxial shear instrument is an experimental apparatus for simulating lateral creep of the lateral creep of hydrate-bearing layers. To obtain the displacement of this creep accurately and in real time, a kind of displacement sensing scheme based on fiber Brag grating peak counting of strain shift curve with high noise resistance is proposed. The sensor is mainly composed of fiber Bragg grating, cantilever, transmission system, gear, rack, base and metal-tube. Inside of the transmission system is composed of gears with different teeth and installed on the base with bolts. Using the rack as the probe to engage with the input gear of the transmission system, another side of output shaft is fixed with the gear securely. One end of the cantilever beam press is fixed to the side plate of the base, while the other end presses against the gear. One end of the fiber Bragg grating is encapsulated in a metal tube using epoxy resin, and the tube is welded vertically to the free end of the cantilever beam press plate using a laser, while the other end is fixed in a similar manner on the side plate of the base after a pre-tension is applied. The interval between two metal tubes is 41 mm. The rack and transmission system are used to convert the lateral displacement of the hydrate-bearing layers into the rotation of the output gear. During the rotation of gear, the tooth of gear pulls on the free end of the cantilever to produce periodic stretching and resetting of the fiber Bragg grating. The average and minimum wavelength shift of the reflection center is 1405 pm and 1263 pm, respectively. By calculating the product of the number of peak jumps in the wavelength drift curve of the reflection center of the fiber Bragg grating and the standard step length of the rack passing between adjacent peak jump, we can determine the lateral displacement of the geological layer. Furthermore, we can build a linear relationship between the frequency of peak jumps and speed. The coefficient of sensor's transmission system is 2 mm/r and tooth number of gear is 20, respectively. In the measuring range of 40 mm, displacement sensor has a resolution up to 0.1 mm, maximum error of only 16 μm, and the range is adjustable through the rack length. The sensor displays excellent repeatability and multi-parameter detection capabilities, greatly enhancing the sensor's noise immunity. When the rack is pushed at three different speeds for 6 mm, it is found that the wavelength drift for the same number of gear teeth is only 28 pm, which is significantly smaller than the minimum wavelength drift of the reflection center 1 263 pm. In situations where the displacement change speed far exceeds temperature variations, temperature only offsets the entire wavelength drift curve of the reflection center. This offset is directly related to the temperature sensitivity of the fiber Bragg grating and range, temperature does not impact the wavelength drift of the reflection center resulting from displacement or the displacement of the rack between adjacent peaks. In this case, the fiber Bragg grating is only affected by noise sources like vibration and demodulation instrument error. The minimum optical signal-to-noise ratio achieved is 43.966 dB, meeting the requirements for hydrate-bearing layer creep monitoring and enabling simultaneous measurement of displacement and velocity. It's worth noting that when the displacement change speed matches the temperature change specifically, when the temperature changes rapidly form 0 ℃ to 20 ℃, the optical signal-to-noise ratio decreases from 43.966 dB to 14.497 dB, greatly impacting displacement measurement accuracy. Therefore, it's essential to incorporate a free-state fiber Bragg grating for temperature compensation, ensuring the sensor maintains a high noise resistance. At this point, the sensor utilizes two fiber Bragg gratings to achieve three-parameter measurement of displacement, speed, and temperature, while maintaining a high cost-efficiency. Finally, four kinds of displacement sensors' performance are compared, with displacement sensor base on fiber Brag grating peak counting of strain shift curve standing out for its superior anti-noise and multi-parameter detection capabilities.
Jun. 25, 2024Vol. 53 Issue 6 0606003 (2024)
Qian DENG, Guoyu ZHANG, Yao MENG, Gaofei SUN, and Zongyu DU
Micro-nano satellite is a new kind of micro-satellite and is widely used. Nano sensor adapted to it should have the characteristics of small size, high precision and high detection sensitivity. Therefore, the optical system of nano star sensor should achieve large relative aperture and high imaging quality while miniaturization. Aiming at the requirement of nano star sensor optical system, the field of view and focal length of optical system are calculated by the system design accuracy index of star sensor. From the detection magnitude and SNR, the sensitivity model of star sensor and the diffraction efficiency formula are used to calculate the optical system's entry pupil aperture and detection band. A star sensor optical system with full field of view of 17°, focal length of 25 mm and relative aperture of 1:1.086 is designed. According to the negative dispersion characteristics of diffractive elements, the number of lenses is reduced by using a hybrid lens instead of a set of conventional material positive and negative lenses, and the total length of the optical system is shortened from 48 mm to 36.4 mm. In order to illustrate the advantages of this structure, various imaging indexes are compared. The results show that the addition of diffraction surface makes the point diffusion function tend to normal distribution, which is conducive to improving the accuracy of centroid extraction. The optical modulation transfer function at Nyquist frequency increases above 0.4. The maximum dispersion spot size of the optical system is 4.333 μm, and the value is 7.277 μm without addition. The energy concentration in 33 pixels is more than 90 %; without joining, the value is 80 %; the vertical color difference of the full field of view is less than 0.6 μm, while the value is more than 1.1 μm without addition, so the angle measurement error caused by the color deviation of the center of mass is controlled within 4.75". The diffraction efficiency of the diffraction element in the range of 520~780 nm is calculated by the scalar diffraction theory. The ghost image in the field of view of the system is analyzed by the stray light analysis software ASAP. The results show that, the ratio of luminous flux under the path of the image spot and the brightest ghost spot is greater than 3.94×10⁴ in the primary diffraction, and the ratio of luminous flux under the path of the image spot and the brightest ghost spot is greater than 3.17×10⁴ in the multi-level diffraction. There is no difference in the distribution position of the main ghost image in the two cases, only in the luminous flux value. According to the theoretical calculation of the maximum luminous flux of the system ghost image, when the limit magnitude is 6.5 and the signal-to-noise ratio is 8.1, the luminous flux ratio of the detection target under the image spot path and the luminous flux under the brightest ghost image spot path should be at least greater than 1.42×10⁴. Therefore, the results of ASAP ghost tracking verify that the hybrid system meets the requirement of a signal-to-noise ratio greater than 8.1 when the limit magnitude is 6.5. The results show that when the deviation of aperture number is less than ±2, curvature radius, thickness, eccentricity is less than ±0.02 mm, inclination is less than ±0.02°, refractive index deviation is less than ±0.005, Abbe number deviation is less than ±0.5, the dispersion spot radius has an 80% probability better than 6.98. It has a 90% probability better than 7.53 μm, which can meet the requirements of energy concentration greater than 90% in 3×3 pixels.
Jun. 25, 2024Vol. 53 Issue 6 0622001 (2024)
Chunyan ZHANG, Jiayin CHE, Junshun ZHANG, Xin KANG, Weiyan LI, and Yanjun CHEN
The study of strong field physics provides an important scientific foundation for the development of attosecond optics. The interaction of strong laser fields with atoms and molecules produces rich ultrafast dynamic processes, such as above-threshold ionization, High-Order Harmonic Generation (HHG), non-sequential double ionization, and so on. People have further applied these processes to ultrafast detection, developing techniques such as attoclock that can be used to study tunneling time, high-order harmonic spectroscopy that can monitor scattered electron trajectories, attosecond streaking that can measure Wigner time delay. Compared with atoms, molecules have more degrees of freedom and will exhibit many new effects under the action of strong laser fields, such as two-center interference, excited-state effect, permanent dipole effect, and so on. These effects are often coupled with each other and difficult to distinguish. Research has found that compared to linearly-polarized laser fields (where the polarization direction of the laser field is in one direction), two-dimensional polarized laser fields (where the polarization directions of the two fields are perpendicular to each other) exhibit higher resolution, allowing people to detect and control ultrafast electron motion in atoms and molecules at the attosecond time scale. This paper introduces the research on the resolution of electron ultrafast dynamics, detection of molecular spatial structure, and synthesis of attosecond pulse chains using strong field ionization and HHG of atoms and molecules in strongly orthogonal Polarized Two-Color (OTC) laser fields and elliptically polarized laser fields. The specific content is summarized as follows: This paper introduces the use of the strong field ionization photoelectron momentum distribution (PMD) of atoms in OTC fields to distinguish the contributions of long and short electron orbitals (corresponding to re-scattered ionization and direct ionization electrons, respectively) to ionization. By comparing the real-time ionization probability curve obtained by numerically solving time-dependent Schr?dinger equation (TDSE) and a modified strong field approximation model considering Coulomb effect, the concept of Coulomb-induced ionization time lag is proposed from a semi-classical perspective. The lag concept can be used to explain the asymmetric structure of atomic PMD in OTC fields. Besides, the left-right asymmetric structure of polar molecule PMD in linearly polarized laser fields can also be explained by the interaction between this time lag and permanent dipole. This time lag also can cause significant changes to the time-domain properties of HHG electron orbitals. By studying the tunneling ionization process of atoms in a strong elliptically polarized laser field, a strong field response time theoretical model (Tunneling-Response-Classic-Motion, TRCM) is constructed. The TRCM model provides the physical definition and quantitative mathematical description of Coulomb-induced ionization time lag. This model assumes that the electron is still located in a high-energy bound state of a field-free Hamiltonian after tunneling, and approximately satisfying the virial theorem. The virial theorem equates the Coulomb effect felt by electrons at tunneling exit point to a velocity opposite to the direction of the tunneling. Electrons need a period of time to obtain impulse from the external laser field to counteract the Coulomb induced velocity in order to ionization. The required time describes the strong three-body interaction time between Coulomb, electron, and external field near the tunneling exit point, characterizes the response time of electrons to light during the strong field photoemission process, and also characterizes the ionization time lag induced by Coulomb effect. By combining the virial theorem and impulse theorem, an analytical expression of this lag time can be obtained, and a one-to-one mapping relationship between the observable of the attoclock experiment (PMD offset angle) and this lag time can be further established. With this mapping relationship, we can quantitatively reproduce a series of attoclock experimental curves in recent years, and provide consistent physical explanations for different experimental results. The adiabatic version of the angle and time mapping of TRCM model can be used to quantitatively calculate the ionization lag time of polar molecules under the action of an elliptically polarized laser field, and the influence of the permanent dipole effect on ionization can also be distinguished based on the relative lag time of the laser sub-cycles. In OTC field, the TRCM model can also provide analytical expressions for the feature quantities of atomic PMD. This provides a theoretical reference for extracting ultrafast electron time-domain information through OTC fields. In addition, the anisotropy of polar molecule PMD under the action of OTC fields can be explained by the interaction between Coulomb-induced ionization time lag and asymmetric ionization phenomenon caused by the permanent dipole. In addition, the complex electron dynamics of polar molecule in laser sub-cycles is distinguished based on the weight ratios of different quadrants of PMD. On the other hand, the strong field ionization process in two-dimensional laser fields can be used to detect the structural information of molecules. Related work has investigated the ionization of symmetric molecules in the OTC fields and found that PMD exhibits significant asymmetry at specific molecular orientation angles (angle between molecular axis and laser fundamental field), which is related to two-center interference. This asymmetry of orientation dependence can be utilized to detect molecular structural information. Besides, HHG from a two-dimensional laser field can be used to obtain attosecond pulse chains. The HHG study of symmetric molecules in OTC fields has found that at a specific orientation angle, harmonic radiation exhibits significant asymmetry within one cycle. This asymmetry reflects the influence of molecular two-center interference on ionization and recombination processes. By utilizing this phenomenon, an attosecond pulse chain containing only one pulse per-cycle can be synthesized. Furthermore, under the action of elliptically polarized laser fields, the HHG of symmetric molecules has also been investigated, and the results show that symmetric molecules in small elliptically polarized laser fields can produce high elliptically polarized harmonics. This phenomenon can be used to synthesize elliptically polarized ultra-short ultraviolet pulses. The introduction of the related works provides a theoretical reference for the detection and control of ultrafast electron dynamics in atoms and molecules using two-dimensional laser fields.
Jun. 25, 2024Vol. 53 Issue 6 0653203 (2024)
Yifei FU, Di ZHAO, Pengbo LI, and Fuli LI
The process of high-harmonic generation is a mature and feasible plan to build coherent quantum light sources. It is widely used in the emerging X-ray quantum optical field and is expected for its deep application. X-ray is theoretically proved better than the currently widely used microwave and visible light band due to its high precision, high diffraction limit, robustness, penetration and focusing ability. Developing quantum optical models, quantum information units and quantum optical components in X-ray bands, could help to their promote precision and miniaturize development. Recent research combines quantum optics with X-ray, producing new types of light sources such as X-ray free electronic lasers, quantum systems, single photon, pulse, and high harmonic generation of coherent quantum light resource under the X-ray regime. The cross between X-ray optics and quantum optics is attracting more and more attention from researchers, becoming a research field with significant breakthroughs and application prospects.The atomic system used in X-ray frequency band quantum optical experiments is the Fe Mossbauer nuclear ensemble, because it has narrow nuclear resonance width narrow(4.7 neV) and long coherence time due to its abundance of cooperative effects. In recent years, researchers have achieved the proof of spontaneous generation coherence under the ensemble, as well as the multi-layer nuclear ensemble model scheme with strong coupling properties. On the other hand, researchers have achieved multiple paths of maintaining the transition in X-ray nuclei such as electromagnetic induced transparency, acoustic induced transparency, and optomechanically induced transparency. In the past five years, the methods above have been optimized, filling the gap in the regulation of X-ray quantum system.X-ray quantum optics requires high-quality X-ray light sources. At present, the scheme of super-fine magnetic field regulation single photon storage has achieved energy and phase storage. In addition, the waveform modulation of X-ray single photon mainly adopts the equivalent scheme of using the mechanical movement of the resonance absorber to phase modulate the pulse, and has pioneered the realization of strong controllability and high precision desktop single photon pulse source.The current XFEL light source generally has coherence problems, however, high-harmonic generation have inherent coherence, which is expected to produce a new generation of attosecond X-ray sources. The current research on high harmonic generating X-ray pulses is mature in the water window energy level. At the same time, various optimization schemes of intensity, photon energy, and phase matching have been proposed. On the other hand, the strong coherence of high-order harmonic X-ray sources makes them firece competitors in ultrafast spectroscopy and ultrafast dynamics detection that can replace XFEL and other X-ray sources. Recently, the theory of high-order harmonics has been advanced to the full quantum stage, and it has been proven that the spectral characteristics of high-order harmonics are strongly correlated with the quantum characteristics of the driving light. It is pointed out that HHG can be used to generate highly coherent, attosecond pulses with properties such as beam gathering and entanglement.In summary, looking back at the past 30 years, X-ray quantum optics has produced many achievements with stage significance in the construction of atomic systems, light sources and photons, pulse regulation etc., marking that the physical regime at the X-ray level is gradually entering the exploration of non-classical effects and the design and regulation scheme at the quantum optical level. With the breakthrough of high harmonic in light sources, theory and applications, we believe that X-ray attosecond light source based on HHG process has a broader prospect in X-ray quantum optics because of its coherence and ultrafast advantages.
Jun. 25, 2024Vol. 53 Issue 6 0653204 (2024)
Chenyang CHI, Yingchun GUO, and Bingbing WANG
High-order Harmonic Generation (HHG) is an important phenomenon caused by the interaction between lasers and atoms or molecules. It is of great significance to attosecond physics. The mechanism of HHG is well understood in terms of the “three-step” model. Applying an external static electric field is an important method for modulating high-order harmonic generation. The external static electric field can cause atoms or symmetric molecules to generate even-order harmonics. Even-order harmonics have different characteristics from odd ones. For instance, the yield of even harmonics exhibits a linear relationship with the intensity of the external static electric field within a specific field intensity range. This property can be utilized to measure the waveform of terahertz electromagnetic fields. The external static electric field is also often used to extend the plateau of high-order harmonics and generate shorter attosecond pulses. The high-order harmonic spectrum of polar molecules in the presence of an external electric field is found to exhibit a double-plateau structure related to the orientation of the molecules, making it possible to measure the orientation degrees. All of these applications inspire a deep understanding of how external static electric fields affect high-order harmonic generation.In this paper, Lewenstein's strong field approximation method is used to obtain the high-order harmonic spectrum of the O2 molecule in a linearly polarized laser field combined with an external static electric field. The polarization direction of the linearly polarized laser field is at a 45 degree angle to the molecular nuclear axis. The amplitude of the external static electric field is one-tenth of the laser amplitude. Two types of external static electric fields are examined in this paper. One type is a parallel static electric field whose field direction aligns with the direction of the laser polarization; The other type is a vertical static electric field whose field direction is perpendicular to the direction of the laser polarization. The harmonics we calculate have the same polarization directions as the laser.Lewenstein's theory allows us to consider the molecular harmonic spectrum as a coherent superposition of four channels which characterized by the different ends of the molecule from which the electron ionizes and the various ends from which the ionized electron recombines. The different ends refer to the two oxygen atomic centers. We explain the double-plateau phenomenon and the generation of even harmonics by analyzing the coherent superposition between channels characterized by different ionization ends, and the two-center interference by analyzing the coherent superposition between channels characterized by different recombination ends. In order to understand the superposition between channels, we examine the amplitude of every harmonic for each channel, and estimate the phase difference of every harmonic of the relevant coherent channels in terms of its emission time obtained by the classical three-step model, so as to obtain a clear physical explanation of the calculated results.The analysis reveals the reason for the double-plateau structure of the harmonic spectrum. When the parallel electric field is applied, the adjacent positive and negative half-periods of the driven field along the laser polarization direction are no longer symmetric, hence the asymmetric adjacent positive and negative half-periods have different effects on the electrons so that the ionization channels of the two ends have different cutoff harmonic orders. Finally, the two-plateau structure is produced by the coherent superposition of the two end ionization channels. When a vertical static electric field is applied, the driving field in the laser polarization direction remains symmetric, thus eliminating the presence of a double-plateau on the harmonic spectrum.The intensity of even harmonics depends on whether the same-order harmonics generated from the ionization channels at two ends cancel out through destructive interference. When there is no external static electric field, the phase difference of even harmonics from the ionization channels at two ends is π. This implies there are no even harmonics in the spectrum. When a parallel static electric field is applied, the laser field along its polarization direction is no longer symmetric. Compared with the case of no external static electric field, the emission time of each harmonic changes. Therefore, the phase difference of even harmonics produced by the ionization channels at two ends is no longer π, it varies irregularly with the harmonic order, similar to that of the odd harmonics. As a result, the strengths of odd harmonics and even harmonics are on the same scale. It can be concluded that the generation of the harmonic is closely related to its classical emission time. When a vertical static electric field is applied, the electric field remains symmetric along its polarization direction. This external static electric field does not alter the driving field along the laser polarization direction and therefore does not change the classical emission time of the harmonics. However, it does impact the relative strength of harmonics at different classical emission times. As a result, the phase difference of even harmonics produced by ionization channels at two ends approaches π, resulting in weaker even harmonics being produced. Our work contributes to a comprehensive understanding of how an external static electric field influences high-order harmonics and provides valuable insights for effectively utilizing such fields to control high-order harmonic generation.The results show that1) when the direction of the static electric field is parallel to the direction of laser polarization, the harmonic spectrum exhibits a double-plateau structure, the cutoff frequency increases, and the intensity of even and odd harmonics are on the same scale; 2) when the direction of the static electric field is perpendicular to the direction of the laser polarization, the harmonic spectrum shows a single plateau structure, and the intensity of the even harmonics is approximately two orders of magnitude smaller than that of the odd harmonics; 3) the external static electric field has minimal impact on the position of the two-center interference minimum on the harmonic spectra.
Jun. 25, 2024Vol. 53 Issue 6 0653205 (2024)
Ying YUE, Fulong DONG, Difa YE, and Jie LIU
The strong coupling of laser field with atoms and molecules can lead to the shift or even splitting of their energy levels. Observing the spectral changes through laser pump-probe experiments provides insights into the electron dynamics within atoms and molecules. Since the 1960s, ultrafast and intense laser technologies have continuously evolved. Especially in the early 21st century, scientists achieved the synthesis of ultrashort pulses reaching attosecond durations through high harmonic generation of noble-gas atoms under strong laser irradiation. The emergence of attosecond pulses allows for studying the ultrafast electronic dynamics of atoms and molecules within their natural time scales. Attosecond Transient Absorption Spectroscopy (ATAS) utilizes an isolated attosecond Extreme Ultraviolet (XUV) pulse as the probe light and another Infrared (IR) laser pulse with varying time delays as the pump light to obtain attosecond time-resolved electronic dynamics. In recent years, ATAS has found wide applications in various atomic, molecular, and solid-state systems. Among all these applications, how to accurately calibrate the delay-zero from experimental data is an important yet non-trivial task. Recently, HERRMANN J et al. have introduced a novel method to serve this purpose, taking full advantage of the multiphoton transitions in attosecond transient absorption spectroscopy. In their experiment, they observed quarter laser cycle (4ω) oscillations in the transient absorption spectrum of helium, originating from four-photon coupling between high-order odd harmonics in the Attosecond Pulse Train (APT). By utilizing this highly nonlinear 4ω signal to extract and calibrate the delay-zero, and comparing it with solutions of the time-dependent Schr?dinger equation, the accuracy and effectiveness of this method were confirmed. In our work, we further extend this method to ATAS using isolated attosecond pulses as the probe light. Here, we have observed 2ωIR, 4ωIR, and 6ωIR signals and, more importantly, we have found that the high-frequency signals are almost precisely located at the delay-zero, which provides a robust way for future experimental determination of the delay-zero. Specifically, we have employed a three-level model, which consists of the three lowest-energy states of the helium atom: the ground state 1s2, the first excited state 1s2s, and the second excited state 1s2p, to simulate the ATAS of helium atoms. The dynamics of this system can be described by the discrete Schr?dinger equation. We numerically solve the time-dependent Schr?dinger equation using standard fourth or fifth-order Runge-Kutta algorithms. This approach allows us to capture the population dynamics of the states and subsequently calculate the time-dependent dipole moment of the system. By performing a Fourier transform of the dipole moment, we obtained the response function S(ω,τ) representing the strength of absorption across different spectral regions and its variation with the relative delay time between the pump and probe pulses. We plot the ATAS, focusing on the resonance peak corresponding to the 1s2p state and the positions of further emitting two (ω=Δga-2ωIR) or four (ω=Δga-4ωIR) IR photons. In addition, we have conducted wavelet analysis on the response function S(τ) at these three specific positions to identify the main oscillation frequencies of the signal and their occurring time intervals. The results demonstrate that the absorption spectrum primarily oscillates at some certain periods corresponding to half, quarter, and one-sixth of the IR laser cycle, yielding oscillation frequencies of 2ωIR, 4ωIR, and 6ωIR, respectively. At ω=Δga-2ωIR, we observe that the center point of the 4ωIR signal is close to the zero of the time delay. Therefore, in experiments, we can measure the transient absorption spectrum, extract the 4ωIR signal at this position, determine its center point along the delay axis, and subsequently calibrate the delay-zero. Similarly, in case the IR laser is more intense and the signal at ω=Δga-4ωIR is prominent, we can also utilize the 6ωIR signal of the absorption spectrum to determine the position of the delay-zero. With extensive numerical simulations, either in resonance or with detuning, and for different carrier-envelope phases, we find that the 6ωIR signal at ω=Δga-4ωIR is the most robust, which makes it the best choice for calibrating the delay-zero. In summary, we have conducted a detailed wavelet analysis of the response function at some typical frequencies of the attosecond transient absorption spectrum of helium atoms. The results show that the center of the high-frequency oscillations provides a feasible approach for experimentally determining the delay-zero and is thus helpful to the correct interpretation of the experimental data, particularly in extracting time-related information such as response times of atoms and molecules to external stimulus, lifetimes of transient quantum states, to name only a few. We hope the theoretical predictions are observable in ATAS experiments and can be further extended to other types of pump-probe techniques.
Jun. 25, 2024Vol. 53 Issue 6 0653206 (2024)
Zhenhuang CHEN, Baochang LI, Chi ZHANG, Jiahao YOU, and Cheng JIN
The interaction between ultrafast femtosecond laser pulse and an intense gas medium gives rise to High-order Harmonic Generation (HHG), which finds crucial applications in tracking ultrafast electron dynamics, molecular orbital and structural imaging, as well as observing ultrafast processes. Moreover, HHG holds significant potential in synthesizing even shorter attosecond-level pulses. Previously, single or bichromatic coherent synthesized waveform has been commonly employed to excite HHG in the gas medium for generating attosecond pulses. With advancements in relevant technologies, the coherent synthesis of multicolor lasers has gradually matured. Utilizing synthesized multicolor waveforms, HHG can be induced within a gas-filled waveguide to generate an Isolated Attosecond Pulse (IAP). Previous studies have demonstrated that, compared to two-color and single-color waveforms, optimized three-color synthesized waveform in the gas-filled waveguide can effectively extend the cutoff frequency of HHG, enhance harmonic yield, and generate high-quality IAP. However, these studies have not indicated whether arbitrarily three-color synthesized waveforms can also generate isolated attosecond pulses within the waveguide. Specifically, whether the instantaneous phase-matching mechanism of isolated attosecond pulses is correlated with the selection of three-color waveforms remains unexplored. Furthermore, it remains uncertain whether any three-color laser waveforms within the waveguide can produce isolated attosecond pulses superior to the three-color optimized waveforms, including their pulse widths and energies. In order to answer these questions, a three-color optimized waveform is selected in this paper and it is compared with two other unoptimized waveforms. Five different sets of three-color waveforms are also compared to examine the impact factors of forming an isolated attosecond pulse, i.e., the interplay of the single-atom response of different optical waveforms and the macroscopic phase-matching conditions. The comparison between optimized and unoptimized three-color waveforms reveals that the effective generation of IAP occurs only when a single emission peak occurring in the single-atom response is consistently maintained or when redundant emission peaks in the single-atom response are suppressed under appropriate phase-matching conditions during the propagation of HHG in the waveguide. Further comparison of different single-atom responses of three-color waveforms and macroscopic phase-matching conditions with the eventual formation of IAP confirms the aforementioned conclusion, indicating that both factors determine whether three-color waveforms can generate isolated attosecond pulses within the gas-filled waveguide, which are the single-atom response and the macroscopic phase-matching. By comparing the electric fields of three-color waveforms, it is preliminarily proved that the single-atom response depends on the synthesized electric field waveform, which dominates ionization and movement of the electron in an external field. While the macroscopic phase matching has been confirmed in other studies to be related to the propagation process of high harmonics in the waveguide. Finally, the ratio of the attosecond pulse intensity to the attosecond pulse width is used as a quantitative index to analyze the outcome of attosecond pulses. The three-color waveform consisting of the fundamental laser (1 600 nm), its second harmonic field (800 nm), and its fourth harmonic field (400 nm) is considered to be the optimal waveform for generating the IAP within the waveguide. These findings emphasize the important role of reasonably optimized light combinations in the process of producing the IAP by three-color waveforms through the gas-filled waveguide. It also shows that not any three-color waveforms can produce the IAP in the gas-filled waveguide. The compromise or the competition of the single-atom response due to the waveform and the macroscopic phase matching caused by the waveguide affects the final production of the IAP. This study provides the theoretical support for generating isolated attosecond pulse of shorter duration and higher intensity based on the technologies of the multicolor waveform synthesis and the gas-filled waveguide. On the other hand, this work also provides insights into the development of alternative “gating” schemes for generating isolated attosecond pulses, laying the theoretical foundation for experimental work with the ultimate goal of generating useful attosecond pulses for wide applications.
Jun. 25, 2024Vol. 53 Issue 6 0653207 (2024)
Ligang YANG, Jinxu DU, and Guoli WANG
Strong field physics has evolved throughout the decades, and numerous unprecedented physical phenomena have been observed. High order harmonics generation, as an essential phenomenon in strong-field physics, has resulted in significant improvements in related research and applications since their first experimental discovery in 1987. After the first experimental observation of attosecond bursts from gas harmonic generation in 2001, a variety of gating techniques were used to obtain shorter and shorter isolated attosecond pulses, and attosecond pulses provide an important tool for observing ultrafast electron dynamics in matter on the atom's time scale. In addition to the intensity and width of the attosecond pulses, the research also focuses on the modulation of their polarization state. Because polarization-state controllable attosecond pulses can provide more degrees of freedom for manipulating ultrafast processes, they have important applications in chiral identification, magnetic circular dichroism, and spin currents. Two-color ω+2ω laser is a very common type of driving field used in the harmonic and attosecond pulse generation. The intensity of harmonics can be improved and the harmonic cut-off can be extended effectively by using linear polarization two laser pulses with parallel polarization direction. The elliptically polarized attosecond pulse can be generated by using two pulses with orthogonal polarization or with a certain angle.In recent years, homochromatic dual laser pulses (ω+ω) have attracted attention in the study of molecules and atoms in the strong laser fields. The two laser beams are obtained by splitting a linearly polarised laser beam into two by means of a commonly used interferometer or waveplate. The time delay, phase delay, intensity ratio and the polarization angle between two beams can be easily modulated by additional optical elements such as waveplates and irises. When two laser pulses are polarized in parallel directions, the central frequency of the synthesized laser electric field changes with time delay, which can be used to control the photon energy of the harmonics. When the polarization directions of the two pulses have an angle of entrainment, the polarization state of the combined laser field changes as the time delay changes. The polarization direction of the laser electric field changes continuously with time every half cycle at specific time delays. In this work, the possibility of using homochromatic twisted double laser pulses to generate twisted linearly polarized attosecond pulse trains with controllable time-dependent polarization directions is discussed theoretically, by means of a strong-field approximation model. The results show that when two beams of same-frequency linearly polarized laser pulses are polarized in orthogonal directions with suitable time delays (correspond to a phase difference of nπ, n is an integer), linearly polarized attosecond pulse trains in the entire x-y plane can be generated from high order harmonics, by varying the intensity ratios between two laser pulses. The laser carrier envelope phase, on the other hand, the laser carrier envelope phase does not significantly affect this modulation, the polarization direction of the attosecond pulse change no more than 7 degrees at all phases for all intensity ratios. In addition, we find that under appropriate laser intensity ratio, polarization angle between two laser pulses laser polarization can also be used as an effective parameter to control the polarization of attosecond pulses. Compared with the intensity ratio, the laser polarization angle between two laser pulses should be easier to accurately control in the experiment, so it can be used as a supplementary parameter of the intensity ratio to fine-tune the time-dependent polarization direction of the attosecond pulse. The present work provides a simple and easy-to-use scheme for generating controllable twisting attosecond pulses in the direction of polarization.
Jun. 25, 2024Vol. 53 Issue 6 0653208 (2024)
Yingxiao LI, and Zhinan ZENG
The fabrication of defect-free Extreme Ultraviolet (EUV) lithography mask blanks for future nodes remains a pressing challenge, driving the demand for high-sensitivity mask inspection tools for smaller defects. A typical EUV lithography mask blank is composed of more than 40 molybdenum/silicon (Mo/Si) bilayers coated on low thermal expansion glass, even minor imperfections in the EUV mask blank may lead to significant negative effects on the printing process. Such imperfections also called defects can be generally categorized into two types: amplitude defects and phase defects, posing extreme difficulty for non-EUV inspection systems. Therefore, in recent years, Actinic Blank Inspection (ABI) tools utilizing Microscopic Scattering Dark-field Imaging (MS-DFI) system have gained prominence; however, challenges for smaller nodes persist. These have spurred exploration of alternative sources, notably the High-Harmonic Generation (HHG) source.This work investigated the detection capabilities with HHG source using the rigorous finite-difference time-domain (FDTD) method. Normalized scattering signal intensity of different orders of HHG source are compared in order to identify the wavelength promising for enhanced detectability. The wavelength range we choose is 13.5~38 nm (i.e., 59~21th order).To investigate the basic features of different defects, three structural models have been employed. Surface defect model refer to the amplitude defect. Phase defects are divided into two categories: shallow defect model and deep defect model. The simulation results indicate that for surface defect, defects with specific diameters exhibit pronounced signals at wavelengths distinct from 13.5 nm. For defects below 10 nm, the scattering signal intensity of all wavelengths diminishes with decreasing defect size. However, the decline rate for sources around 30 nm is much slower than that for 13.5 nm, their intensity can be even higher for a defect of 2 nm diameter than that of 13.5 nm. The example is the 38 nm wavelength source: as the defect diameter decreases, the normalized signal intensity at 13.5 nm significantly diminishes, while that of 38 nm becomes comparable to that of 13.5 nm. For 2 nm defect, the normalized signal intensity of 38 nm is even higher than that of 13.5 nm. Additionally, because the 38 nm wavelength is longer than 13.5 nm, the yield of the 38 nm source in HHG can be much higher than that of 13.5 nm. This suggests that for smaller defects, the longer wavelength of 38 nm might be a better choice.To investigate the signal intensity of phase defect, penetration depth of various wavelengths in the EUV mask blank are first calculated employing the transfer matrix. The superior penetration depth of 38 nm wavelength leads us to inquire about its capability to detect phase defects. So, the scattering signal intensity at 13.5 nm and 38 nm wavelength are compared using the same defect parameters. The results of shallow defect suggest a stronger dependence of signal intensity on FWHM width than on height, indicating that width might be a more important factor in this context. And it also implies that the aspect ratio (the ratio of the width to the height of an object) could potentially play an important role in signal intensity. The signal intensity of shallow defects at 38 nm wavelength exhibits a flatter distribution compared to that of 13.5 nm. This characteristic endows the 38 nm wavelength with enhanced detectability for defects across different heights and widths, particularly when the signal intensity at 13.5 nm is decreased. For example, shallow defects with heights between 7~20 nm and widths between 20~80 nm can be detected much more efficiently by the longer wavelength source of 38 nm.For deep defects, the results suggests that the scattering signal primarily originates from the top 20 bilayers' deformation. like the 13.5 nm signals, the scattering intensity of the 38 nm source signals is highly dependent on defect heights. In both simulations, for particles located 40 bilayers beneath the mask surface, there's a pronounced drop in signal intensities for defect heights less than 10 nm. Moreover, the signals for these defects diminish nearly an order of magnitude for every 1 nm reduction in height. These fully planarized defects, which cause no surface protrusion, pose significant detection challenges. By comparing the signals at 13.5 nm and 38 nm for deep defects of the same height and width, we found that the benefits of using a 38 nm wavelength for deep defects are relatively modest. Nevertheless, considering the ease and potentially higher efficiency of generating a 38 nm wavelength HHG source, this result is still valuable, particularly for defects where the 38 nm signal is comparable to that of 13.5 nm.
Jun. 25, 2024Vol. 53 Issue 6 0653209 (2024)
Wenyang ZHENG, Candong LIU, Ya BAI, Peng LIU, and Ruxin LI
The absorption and emission of light by matter plays a crucial role in the development of science and technology. High Harmonic Generation(HHG) presents an extremely nonlinear optical radiation induced by the interaction of intense laser fields with matter. Over the past two decades, HHG in gaseous materials has been extensively studied and regarded as a vital tool for advancements in ultrafast science. The fundamentals of gaseous HHG can be explained by the semi-classical three-step model, the understanding of microscopic processes in HHG has laid the foundation for atto-second physics and metrology, including the ability to probe atomic structure and dynamics and molecular systems. Recently, there have been reports of HHG occurring in various solid-phase materials, the targets of solid-state high harmonic studies have been extended from bulk metals, semiconductors, and insulators to low-dimensional nanostructures. Two-dimensional materials can neglect the propagation effects in the direction of laser propagation, and thus become ideal materials for the study of high-harmonic carrier dynamics. An important phenomenon of HHG in solids is the anisotropy. Due to the modulation of the lattice symmetry, the harmonic signals generated by the driving light polarized along the different directions of the crystal are quite different, it has shown potential applications such as reconstructing crystal band structure, measuring Berry curvature, and investigating topological phase transitions. In this paper, we have investigated the process of HHG from monolayer h-BN by using the tight binding energy band and solving the two-band SBEs. We show that the yield of harmonics displays a periodicity of 60° as the azimuthal angle between the h-BN and driving field are varied, consistent with the symmetry of the laser and the crystal. Notably, an intriguing pattern in the orientation-dependent HHG is observed. Specifically, we decompose the high harmonics into components parallel and perpendicular to the driving light, the parallel component of the odd-order harmonics in the cut-off region exhibits an angular shift of 30° compared to the other orders, and this angular shift is independent of the change of driving light intensity. Comparison of the harmonic spectra of the driving light polarization along the zigzag direction and the armchair direction reveals that the harmonic spectrum has a sharp decrease (cut-off region) for harmonics above H17 when the driving field is along the zigzag direction. The harmonic intensities below the H17 are stronger in the zigzag direction than in the armchair direction, and the sharp decrease in the zigzag direction harmonics at the H17 results in the harmonic intensities being less than those in the armchair direction harmonics. Therefore, we believe that the angular shift of the intensity modulation of odd-order harmonic parallel components are related to the cut-off of the zigzag directional harmonic spectrum. Furthermore, we found the energy at which this angle shift occurs is strongly correlated with the bandgap energy of h-BN, especially when close to the M-momentum channel bandgap. Through detailed analyses, we determine that the phase shift in the intensity modulation of H17 arises due to the interference of different momentum channels and the interference of different polarity half-periods. We believe that this phenomenon is not coincidental, that the effect of energy band structure on harmonics is significant. The angular shift of odd-order harmonics holds important potential for developing techniques to probe the energy band structure of solids through HHG.
Jun. 25, 2024Vol. 53 Issue 6 0653210 (2024)
Lihui MENG, Pengfei LAN, and Peixiang LU
The advent of attosecond pulses via High-order Harmonic Generation(HHG) allows the study of electron dynamics with unprecedented temporal resolution. It provides a valuable research tool for ultrafast science, chemistry and so on. However, the low conversion efficiency of HHG restricted the development of attosecond measurement. Titanium-sapphire(Ti∶Sa) femtosecond lasers are the usually adopted to produce HHG. But the Ti∶S laser is typically limited to the about 10 watt level of average power due to the thermal lens effect introduced during the amplification process and thus the average power of the produced HHG is also limited. This limitation has led to the exploration of alternative laser sources to drive HHG, such as high-power ytterbium-doped lasers. Over the last two decades, there has been significant progress in the development of HHG, with a gradual increase in average power and maximum photon energy. This paper reviews some representative work about high-average power HHG sources and discuss the applications and prospects of high-repetition-rate HHG in various experimental scenarios.First, we discuss the Femtosecond Enhancement Cavity (fsEC) technology. It uses coherent interference to enhance laser intensity within the cavity and has enabled the production of HHG sources at a repetition rate of hundreds of megahertz. Then we introduce the HHG driving scheme based on high power Yb-doped laser, including the direct drivers, nonlinear post-compression drivers, Optical Parametric Chirped Pulse Amplification (OPCPA) drivers and short wavelength drivers. So far, the HHG source has average power levels exceeding 10 mW. On the other hand, the high-energy cutoff has been extended up to 620 eV at a repetition rate of 100 kHz. Furthermore, the development of HHG sources expands the capabilities of attosecond science by enabling high-repetition-rate attosecond pulse generation and facilitating attosecond time-resolved spectroscopy. We introduce the generation and measurement of attosecond pulses at high repetition rates. Finally we briefly discuss the applications of high-repetition-rate HHG in coherent diffraction imaging, XUV-IR pump-probe experiments and coincidence detection measurement.In summary, this paper provides a comprehensive overview of the advancements in high-average-power HHG sources, including the transition to high-power ytterbium-doped lasers as driving sources and the development of high-repetition-rate HHG driving schemes. Then we also discuss the applications of the high-repetition-rate HHG in various experiments. It is expected to provide powerful research tools for condensed matter physics, biomedicine and material chemistry.
Jun. 25, 2024Vol. 53 Issue 6 0653202 (2024)
Chen QIAN, and Ruifeng LU
High Harmonic Generation (HHG) in solids often carries the microstructure information of crystal materials, and is a practical means to detect the electronic properties and dynamics in crystals. The anomalous dependence of solid HHG on the ellipticity of driving laser has received much attention. As is well known, gas HHG is produced by the recollision of electron with parent nucleus, the recollision probability decreases greatly with the increase of ellipticity, so the harmonic intensity driven by linearly polarized light is always larger than that driven by elliptically polarized light. A large number of experiments and theories have shown that the anomalous ellipticity dependence appears in the HHG from graphene and surface states of topological insulators with Dirac-cone structure, which is different from the gas HHG. YOSHIKAWA N et al. think that the ellipticity dependence of HHG in graphene is determined by the comparison of bandgap and Rabi frequency. However, in Bi2Se3, a topological insulator with a similar Dirac cone on two-dimensional surface state, BAYKUSHEVA D et al. believe that the mechanism of its anomalous ellipticity dependence is different from that of graphene. Topological insulators require strong Spin-Orbit Coupling (SOC) as a prerequisite, however, the SOC in graphene is weak. They conclude that the anomalous ellipticity associated with band topology is dependent on the strong SOC and protection of time-reversal symmetry. Therefore, both Dirac cone and SOC effect have influence on the harmonic ellipticity dependence, and there may be competition between them, thus the mechanism of the anomalous ellipticity dependence of Dirac system remains unclear.In this paper, the HHG of the graphene and surface states of topological insulators under different laser ellipticities is simulated by solving semiconductor Bloch equations. The anomalous ellipticity dependence of HHG from graphene and surface state of topological insulator is theoretically verified. We investigate the microscopic dynamics of the electron transition near the Dirac cone under different laser ellipticities and the transient changes of the harmonic radiation in k space. The gapless and linear-dispersion Dirac cone in linear polarization will form a forbidden transition path in k space, which is the micro-mechanism of the lower HHG yield of Dirac system driven by linearly polarized laser than the elliptical case. By adding SOC to a tight-binding model of graphene to open the bandgap around its Dirac cone, we find that the enhancement of SOC does not induce the anomalous ellipticity dependence of HHG. In addition, the laser intensity can change the profile of harmonic ellipticity dependence, but it cannot determinate the appearance of anomalous ellipticity dependence, which can be attributed to the gapless and linear-dispersion Dirac cone in essence. This work clarifies the physical origin of anomalous ellipticity dependence in the Dirac system and establishes a direct link between the Dirac cone and the anomalous ellipticity dependence of HHG in solids, which is conducive to promoting optical characterization of Dirac materials and the detection of ultrafast nonlinear optical properties of Dirac electrons by the HHG. The abnormal ellipticity dependence of Dirac material breaks through the monotonic decrease of harmonic intensity in gas with the increase of laser ellipticity, which is expected to be applied to the development of new optical sensors or optoelectronic devices.
Jun. 25, 2024Vol. 53 Issue 6 0653201 (2024)
© Copyright 2018-2021 | Chinese Laser Press.
All Rights Reserved 沪ICP备15018463号-20