


Please enter the answer below before you can view the full text.
7+1=
The surface temperature retrieval of high-temperature objects shielded by strong diffusive mist plays a critical role in aerospace, metallurgical and many other industries. Traditional radiation temperature measurements under extreme conditions usually cause substantial errors because of the strong extinction and scattering by mist during light propagation. The current infrared temperature retrieval methods often use single-channel or double-channel non-imaging temperature measurement strategies. In such methods, the temperature is corrected using either pre-measured or real-time mist parameters, and the results are analyzed and evaluated according to radiative transfer theory. Based on the calculated spectral radiation characteristics of mist, this paper proposed an infrared imaging temperature measurement method. A temperature retrieval model is also built based on radiative transfer theory while the adjacent effect is considered. The exact surface temperature distribution can be retrieved while the parameters of the diffusive mist medium remain unknown. During a typical temperature retrieval process, the radiative temperature distribution is firstly calculated according to the infrared images in three different channels calibrated by the pre-acquired calibration and emissivity data. Then the exact temperature is retrieved according to this non-linear temperature retrieval model. A three-channel infrared temperature retrieval system is designed, with its three channels centered at 8.8, 10.7, and 12.0 μm, respectively. Three identical long-wave infrared focal plane detector is applied, which can simultaneously photograph the high-temperature object. Besides, an experimental verification device is assembled to test the performance of the three-channel infrared system based on a high-temperature blackbody and a home-made mist generator. The results prove that long-wave infrared shows a higher interference resistance capacity than mid-wave infrared. This three-channel device and the temperature retrieval model reduce the image distortion caused by mist and show an average temperature retrieval error of ca. 7% at 1 000, 1 100, and 1 200 ℃ conditions. This method is suitable for both high-temperature blackbody and graybody, while the pre-acquisition of the mist parameters is not required. The temperature retrieval method based on multi-spectral infrared imaging proposed in this article shows universal applicability and considerable innovativeness.
Lignin degradation is an important way to the utilization of biomass resources. Lignin is a three-dimensional networked macromolecular structure with many functional groups. When different methods are used to degrade lignin, detecting the content of phenolic hydroxyl groups in degraded lignin can more intuitively show the degradation efficiency of this method and can reflect the specific structure of lignin and the activities of hydrolysis, oxidation and reduction. Designing or comparing a measurement method that can efficiently and quickly determine the concentration of phenolic hydroxyl groups in degraded lignin is critical for analyzing the structure and function of small lignin molecules after depolymerization. According to the classification of instruments, the recent detection methods of phenolic hydroxyl groups after the degradation of lignin, such as titration methods, ultraviolet spectroscopy (ultraviolet spectrophotometry and Folin-Ciocalteu reagent, etc.), high-performance liquid chromatography, nuclear magnetic resonance (phosphorus spectrum, carbon spectrum, hydrogen spectrum, fluorine spectrum, etc.), gas chromatography-mass spectrometry, and gas chromatography (measurement of 1-acetylpyrrolidine by ammonolysis and methanol by periodate oxidation) were reviewed. Moreover, the application conditions, sample requirements and key factors of each quantitative analysis method were analyzed. Based on the efficient, convenient and economical detection method of phenolic hydroxyl, the future development direction prospected.
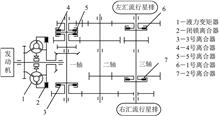
In mechanical transmission, the wear debris produced from different friction couplings is uniformly mixed in lubrication oil, which is a slow degradation process that can be observed by oil spectral analysis. The wear debris in a sample can be categorized into 15 groups of concentration (e.g., Fe, Cu and Mo) in parts per thousand using MOA II (atomic emission spectroscopy) during the sampling epochs. Its level is one of the most common data types used to monitor and evaluate the underlying health state. However, not all the oil spectral data can show the same degradation pattern. Only parts of the spectral oil data can provide useful information for degradation degree characterization. Using all the spectral oil data for condition monitoring will result in unreasonable degradation modeling for condition monitoring and unscheduled maintenance afterwards. Therefore, this article proposes a selection of degradation data based on information entropy to determine the appropriate degradation data for degradation modeling and remaining useful life prediction. Compared with the experiential selection method, the proposed method can characterize the degradation information contained in the multiple spectral oil dataset, leading to a quantitatively selecting the degradation data. The proposed method was verified through a case study involving a degradation dataset of multiple spectral oil data sampled from a power-shift steering transmission (PSST). The result shows that the proposed method can better characterize the degradation degree, which leads to an accurate estimation of the failure time when the transmission no longer fulfills its function.
The residual life prediction of wet clutch based on oil spectrum data significantly impacts on the condition monitoring and reliability of integrated transmission device. Aiming at the problems of high randomness of oil spectral data and single performance index and large error of existing methods, the prediction of clutch remaining life is carried out using the advantages of real-time and accuracy of binary Wiener process. Firstly, combined with the wet clutch life test, the indicator elements Cu and Pb and the failure threshold of the remaining life prediction of the clutch are extracted through the oil supplement and change correction of the spectral data of the whole life cycle; Secondly, the correlation characteristics of indicator elements are analyzed by MATLAB copula function, and the correlation function of residual life is derived; Thirdly, according to the inverse Gaussian principle, the performance degradation mathematical models of the unary and binary Wiener processes of the above two indicator elements are established; Finally, the maximum likelihood estimation method is used to estimate the parameters, and the univariate and binary performance degradation mathematical models are used to predict the remaining life of the tested clutch. By comparing the predicted results with the experimental results, the deviation of residual life prediction of binary Wiener process is 6%~22% in the range of 150~240 h; Compared with the univariate Wiener process, the accuracy of residual life prediction is improved by more than 9%. The results show that the binary Wiener process model and its prediction method have the advantages of real-time solid prediction and high prediction accuracy. At the same time, this method can be extended to related fields such as on-line monitoring of equipment status and residual life prediction.
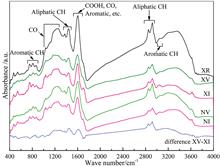
Jurassic high-quality coal resources provide the abundant material basis for clean and efficient coal utilization to oil and gas. Microlithotype composition of Jurassic high-quality coal resources is characterized by enrichment of inertinite. The macromolecular structure of vitrinite and inertinite largely determines coal's physical and chemical properties and process performance, and then determines comprehensive utilization efficiency and added value of coal resources. Thus, raw coal (XR), vitrinite-rich coal (XV, NV) and inertinite-rich coal (XI, NI) samples were collected and prepared from Xiaobaodang and Ningtiaota coal mining area in the Jurassic coalfield of northern Shaanxi Province. Fourier transform infrared spectroscopy (FTIR), X-ray photoelectron spectroscopy (XPS), and solid nuclear magnetic resonance spectroscopy (13C NMR) were used to quantitatively characterize the differences in molecular structures of different maceral enrichments combined with the results of coal quality analysis. The results showed that the aromatic ring substitution degree of aromatic structure in XI and NI coals is low, mainly in the form of three adjacent hydrogen atoms and four to five adjacent hydrogen atoms. Other functional groups less replace hydrogen atoms on benzene ring. At the same time, the vibration of aromatic C=C skeleton in the structure is obvious, and stretching vibration intensity of methylene in aliphatic structure is reduced. Methyl content is slightly higher than that of vitrinite-rich coals, and the relative content of the C=O group is slightly higher, indicating that inertinite-rich coal has more aromatic structures connected by oxygen-containing bridge bonds. Aliphatic chain and aliphatic ring groups fall off, fracture and aromatic enrichment, and branched-chain is relatively small, and the length is short. In addition aromatic carbon rate, aromaticity, aromatic condensation degree and maturity are high. The relative content of “C—C, C—H” and “C—O” in the surface structure of XV and NV coals is higher than that of inertinite-rich coals, which reflects that the structure should contain more aliphatic side chains replaced by aromatic rings. The oxygen species in the surface structure of XI and NI coals are mainly “C—O”, and “C=O” and “COO—” are significantly higher than those of vitrinite-rich coals. The aromatic carbon ratios of XV and XI coals are 57.91 % and 66.02 %, respectively. XV and XI coals' aliphatic methyl carbon ratios are 10.02 % and 7.84 %, respectively. The protonated aromatic carbon is twice as much as the non-protonated aromatic carbon. The relative content of carbonyl and carboxyl carbon of XV coal is high. The ratios of bridge carbon and per carbon of XV and XI coals are 0.25 and 0.40, respectively. The average number of condensation rings of aromatic nucleus structure is 2.68 and 3.03, and the average sizes are 0.448 nm and 0.676 nm, respectively. The aromatic nucleus in the XI coal structure is mainly naphthalene and anthracene, and the branched-chain degrees are 0.22 and 0.19, respectively. It is indicated that XV has more aliphatic side chains and saturated ring structures than XI coal and has great hydrocarbon generation potential.
Comparison of Raman spectra at multi-excitation wavelengths (325, 405, 514, 633 and 785 nm) for coal-based graphite, and evolution of the spectra at 514 nm with the number of aromatic layers were detail studied. Moreover, the Raman mapping test studied the surface defects distribution of coal-based graphite block. The results show disordered graphite has a smaller size and arbitrary orientation than graphite crystallites. With the increase of stacking degree and average stacking layers, the Raman spectrum characteristics of graphite microcrystal edge appear. When the disordered structure of coal-based graphite transforms to order, the defects gradually disappear, and the D3 and D4 peaks in the first-order gradually become invisible or disappear, but the overtone peaks appear weakly, especially as the intensity of the 2D1 peak increases. Further extending the meaning of ID1/ID2 parameter to defect type and average orientation, the ID1/ID2 ratio of anthracite is the largest. With the increase in crystallite size (d002<0.344 nm), the ID1/ID2 of 3D ordered graphite was the smallest. The FWHM of the G peak always decreases with the decrease of disorder at different excitation wavelengths. D1 peak and 2D1 peak show a strong dispersion effect, and the intensity of each peak grows with the increase of excitation energy. Under UV excitation, the peak position difference of D1 and G peaks is significantly smaller than that under visible light excitation. With the increase of excitation wavelength, the D1 peak moves towards the low wavenumber direction, and the dispersion of the 2D1 peak is about twice the intensity of the D1 peak. During the graphitization process of high rank coal, the non-oriented aromatic carbon experienced a series of physical and chemical structure evolution to produce various intermediate phases, and the residual coal macerals (vitrinite and inertinite) and new graphite components (pyrolytic carbon, etc.) coexist. (IG-ID1)/(PG-D1)≥0.3, ID1/IG<0.4, AD1/A(D1+G)<0.45 were used as the boundaries of graphite and semi-graphite. The surface uniformity of the sample was characterized by planar scanning area imaging. The confidence interval of the frequency distribution of 0.9 was used to comprehensively determine the surface graphitization degree of the sample, which was 84.16%~86.40%, and the average was 85.49%, which was similar to the estimated value of XRD parameters.
Humic acid-enhanced urea (HAU) can be produced by adding humic acid (HA) into melted urea during urea production. Field studies have proved that HAU showed a better urea hydrolysis rate, crop yield, and nitrogen use efficiency than normal urea (U). However, the main reaction between HA and U during the production of HAU has not been reported yet. In this study, HA, derived from weathered coal, was used to produce HAU, and the added amount of humic acid was 5%, 10%, and 20%, respectively (named HAU5, HAU10, HAU20). The paper collected and analyzed the infrared spectra and their second derivative infrared spectra of HAU5, HAU10, HAU20, and U. HAU20 and U were characterized using X-ray photoelectron spectroscopy (XPS), and oxygen 1s near-edge X-ray absorption fine structure (NEXAFS). The urea in HAU20 was removed by dissolving HAU20 with absolute ethanol, and FTIR and XPS characterized the residue(UHA). The result showed that: (1) FTIR spectra and the second derivative spectra showed that the vibration intensity of primary amine C—N in HAU was lower than that in U, and the vibration intensity decreased with the increase of the addition amount humic acid. There were more secondary amine nitrogen, and non-carbonyl oxygens in HAU20 were separated from the XPS N(1s) spectra and O(1s) NEXAFS spectra, respectively, and prominent amide characteristics were shown from the result of FTIR spectra for UHA, which indicated that HA reacted with urea during the HAU production. (2) the percentage of carboxyl carbon in HAU20 or UHA was lower than in HA. FTIR spectra showed that C—O—H in-plane bending vibration from carboxylic acid detected in HA did not exist in UHA, the C=O stretching vibration position from carboxyl groups in UHA was shifted, and the characteristics of primary amine nitrogen for UHA were obvious. The above indicated that the carboxyl groups of HA participated in the reaction of HA and urea. The structure for R—CO—NH—CO—NH2 in HAU will be produced after the dehydration reaction between the carboxyl group of HA and the amide group of urea. Therefore, the results from the spectral analysis used in this study clarified the main reaction modes of humic acid and urea during the production of HAU, which will provide basic information for the reveal of the synergistic mechanism of HAU and the development of value-added urea.
Remote Sensing Technology is an important and useful method to monitor the Earth's surface by receiving the electromagnetic waves reflected or radiated from the targets, and optical and thermal remote sensing is the most common remote sensing methods. Polarization is a ubiquitous optical phenomenon which has commercial and technological applications.After decades of development, polarization remote sensing has become a widely applied technology in Earth observation. Depending on intensity information, traditional optical remote sensing has many disadvantages on target identification and information extraction, but it could be modified by appending polarization information to it, so that, the features and characteristics of the targets could be obtained from polarization information. Soil is a complex substance that plays an important role in the ecosystem. Hence itself is helpful to apply remote sensing on the soil to monitor the environment and treat pollution. Ideally, the soil do not obviously reflect or absorb electromagnetic waves in any range of wavelength, while the moisture, organic matters and roughness usually influences the spectrum characteristic of soil.According to recent studies, it is significant that petroleum an influences the polarized spectrum characteristics of the soil. Especially in the red and infrared spectral regions, the spectral response of petroleum is so pretty obvious, that the pollution on the Earth's surface could be detected by remote sensing of a wide range and multiple periods.In addition, it is reasonable for us to assume thatthe influence on viewing effect of petroleum might vary in different soil types. In this paper, the petroleum-polluted soils were respectively sampled from a wetland and a cropland in Zhenlai Petroleum Factory, located in Jilin Petroleum Field. By multiangle measurement, we managed to compare the polarized spectrum characteristics of each kind of soil sample and analyze the influences on themwith quantitative and qualitative methods. The results suggest it is obvious the polarized spectrum characteristics of wetland soil differ from another one, because of the difference in moisture and structure, together with the existence of petroleum, for which the measured polarized reflectance value has a significant shift from the predicted polarized reflectance value.
“Alpine-oasis-desert” is a unique natural landscape in arid areas, its internally distinct ecosystems are prone to different fluctuations under global change. As an important indicator to evaluate the quality of the ecological environment, vegetation net primary productivity ( NPP ) is of great significance to the overall understanding of regional changes. The generation of remote sensing images allows large-scale and long-term regional NPP estimation. The maximum light energy utilization efficiency under different plant covers classified by land-use type data also improves the accuracy of NPP estimation. Therefore, this paper selects the Yarkand River Basin with a typical alpine-oasis-desert ecosystem as the study area, using remote sensing image data and meteorological data for many years, selecting the CASA model based on light utilization rate simulate and analyze the NPP status of each ecological area. The following conclusions were drawn: (1) The annual average value of NPP in the Yarkand River Basin showed a fluctuating upward trend after 2 000, and about 85.9 % of the regions showed an upward trend. In the water area and the residential location of the oasis area, the NPP decreased. (2) The variation of NPP in the basin strongly correlations with precipitation, and its spatial distribution characteristics have an opposite correlation with NPP and temperature. (3) NPP in the Yarkand River Basin showed the highest in the oasis, followed by the desert-oasis transition zone, and the lowest in the alpine and desert regions. The fluctuation of NPP in the regions with relatively more fragile ecosystems (desert and alpine) was more substantial than that in the oasis and desert-oasis transition zone. The research results will provide theoretical support for restoring regional ecological environment protection, the response to climate change, the coordinated development of human beings and nature, and the promotion of multi-ethnic common prosperity.
Polymethoxy dimethyl ether (PODE) is a potential diesel alternative fuel. However, currently, most of the research on PODE is concentrated on the engine bench tests, and corresponding basic spray combustion research is few which restricts the improvement of its efficient and clean combustion performance in power plants. The property of hydroxyl groups is active, and the area where they exist in large quantities is usually considered a high-temperature reaction area. By measuring the hydroxyl spectral band, important parameters such as flame structure, combustion reaction location and heat release rate can be obtained. Environmental oxygen concentration has a great influence on flame structure, and it is also an important parameter in controlling combustion reaction rate and pollutant emission. Therefore, on an optical constant volume combustion bomb, firstly used the self-luminescence measurement of hydroxyl spectral band to research the effects of oxygen concentration (15%~80%) on the lift-off length of PODE spray flame, then the integral value of hydroxyl self-luminescence spectrum intensity was converted to the point value by using Abel inverse transformation method to research the effects of oxygen-enriched concentration (40%~80%) on the hydroxyl distribution of PODE spray flame. The results show that: as the oxygen concentration increases from 15% to 40%, the flame lift-off length of PODE decreases rapidly. But further increase to 80%, the flame lift-off length decreases gradually until it is unchanged; The flame lift-off length of PODE is significantly smaller than diesel under the same oxygen concentration. At the distribution feature surface of hydroxyl spectral after inversion, the high-intensity area of PODE hydroxyl spectral is mainly concentrated in the thin layer of the spray edge diffusion flame under oxygen-enriched conditions; Meanwhile, the significant increase in local temperature makes the hydroxyl spectral intensity reach the maximum near the downstream of the premixed reaction zone. With the increase of oxygen concentration, the high-intensity area of hydroxyl spectral gradually migrates to the upper and middle areas of the flame. Its distribution appears to be shorter in the axial direction and narrower in the radial direction. When the flame reaches a quasi-steady state, compared with 40% oxygen concentration, the spectral intensity of hydroxyl at 60% and 80% oxygen concentration is significantly weaker in the middle and lower reaches of the flame, which indicates that the high concentration area of fuel upstream of the spray is more quickly to participate in the intense combustion reaction.
In the process of flux-cored wire pulsed TIG arc additive manufacturing, the phenomenon of the arc riding on both sides of the formed part was found. The arc was called the inverted Y-shaped arc. The inverted Y-shaped arc had a heating effect on both sides of the forming part, and its deviation caused uneven healing on both sides of the forming part, which affected the stability of the cladding process. The electron density of the trailing part of the inverted Y-shaped arc was calculated using Stark broadening according to spectral data measured by the point matrix method. Under the experimental conditions of this study, some areas (about 2 mm outside sidewall, about 1.5 mm below 0 positions in Z direction) conformed to local thermodynamic equilibrium. The electron temperature was calculated using the Boltzmann diagram method of spectral diagnosis, and the complete arc temperature field was obtained by fitting the data of each point. The temperature field parallels to, and perpendicular to the moving direction of the welding torch in the deposition process was analyzed. The results showed that the maximum temperature of the inverted Y-shaped arc at the tungsten electrode tip was about 14 000~16 000 K, distributed in the range of 0.5~1.5 mm below the tungsten electrode the temperature of the trailing part of the arc was about 5 000~8 000 K. In the direction perpendicular to the moving direction of the welding torch, when the tungsten electrode axis coincided with the center of the deposited layer, the normal inverted Y-shaped arc and the temperature field were symmetrically distributed along the tungsten electrode axis. When the tungsten electrode axis shifted by 1 mm to the left of the center of the deposited layer, the inverted Y-shaped arc shifted to the left, and the temperature field also shifted to the left. The temperature on the left side of the deposited layer was significantly higher than that on the right. In the direction parallel to the moving direction of the welding torch, the temperature field distortion of the inverted Y-shaped arc was small. During the deposition process, the welding wire was fed in from the front (left) side of the tungsten electrode, which disturbed and absorbed the arc's heat. As a result, the size and temperature of the arc's front (left) side were smaller than those of the rear (right) side, and the arc contraction. By analyzing the electrical signals of the two cases where the tungsten electrode axis coincided with the deposited layer center and shifted by 1mm to the left of the deposited layer center, it was indicated that the mean voltage, the base voltage average and the peak voltage average of the former were less than those of the latter. Based on the analysis by combining the electrical signal and the Gaussian heat source model, it was found that the temperature and heat flux of the normal inverted Y-shaped arc were smaller than those of the offset inverted Y-shaped arc at the same position on the left side of the formed part. In contrast, the opposite results were obtained at the same position of the right side of the formed part, which was consistent with the temperature field distribution obtained by spectral diagnosis. The results of this study were of great significance for establishing a new heat source model and process monitoring in the arc additive manufacturing process.
As the political center of China and a super large city of Beijing, Tianjin and Hebei, the urbanization process of Beijing has been rapid in the past 40 years, and the pollution problems of atmospheric particles and dust particles are prominent. It is of great practical significance to play the role of green space dust retention. This paper combines hyperspectral technology and remote sensing technology to retrieve the urban scale green space dust distribution. This study selected Euonymus japonicus, a common green space vegetation in Beijing, as the research object. The dust retention capacity, spectral reflectance and leaf area of leaf samples were obtained through outdoor sampling and indoor experiments. The original spectral curve and the first derivative of reflectance before and after dust retention were compared, and the effects of different dust retention on spectral reflectance were analyzed, To explore the band which is highly sensitive to dust retention of leaves. Using the spectral response function, the narrow band spectral reflectance data collected on the ground are transformed into the wide band spectral reflectance data of remote sensing satellite. The regression model of vegetation index ratio and dust retention capacity of corresponding satellite band is established. The regression model with the best fitting effect is selected as the dust retention inversion model. Combined with the green space range extracted from the GF-2 image, the dust retention distribution of Beijing urban green space was obtained using the dust retention inversion model. The spatial autocorrelation model is used to test the spatial aggregation characteristics. The results show that: in the 740~1 870 nm band, the spectral reflectance after dust retention is significantly lower than before dust retention. Dust retention has no obvious effect on the position of the red edge, yellow edge and blue edge but has pronounced effect on the “red edge amplitude” and “red edge area”. EVI index calculated by Sentinel-2 image has the highest correlation with dust retention. The coefficients of determination (R2) of the linear and quadratic regression models are 0.705 and 0.751, respectively. Based on the Sentinel-2 images on April 7, 2021, and June 3, 2021, the distribution trend of green space dust retention in the Beijing urban area is as follows: the city center is higher than the suburbs, the north is higher than the south, and the East is higher than the West. The central, northern and eastern parts of Beijing are prone to dust pollution. The pollution distribution is aggregated and not completely random.
To realize more precise irrigation management during the growing period of Hami Melon in the field. The traditional methods for measuring leaf moisture content are inefficient, complicated and destructive, which is not conducive to obtaining moisture content of Hami melon leaves in the field. In this study, the leaf samples of cantaloupe in four periods of growth (M1), flowering (M2), fruit (M3) and maturity (M4) were obtained by spectral technology, and the moisture content of the leaf samples was measured by drying method. The influence of the choice of kernel function and the number of hidden neurons on the precision of the ELM model is discussed. Then SiPLS and its combined algorithm with CARS, GA and SPA were used to extract the characteristic wavelengths with a high correlation with leaf moisture content. GA and PSO algorithms are used to optimize the connection weights (W) between the input layer and the hidden layer of the ELM model, and the threshold (B) of the hidden layer of the ELM model, the optimal and stable W and B values are obtained further to improve the stability and prediction accuracy of the model. Finally, four feature wavelength extraction algorithms are combined with ELM, GA-ELM and PSO-ELM to analyze the model, and the Correlation Coefficient between the correction set and the prediction set is taken as the evaluation index of the model. Through the comparison and analysis, the inversion estimation model of cantaloupe canopy leaf moisture content was optimized. The results show that the number of SiPLS and its combination with CARS, GA and SPA are 273, 20, 32 and 6 respectively, accounting for 15.6%, 1.2%, 1.9% and 0.03% of the total spectrum variables. Taking the selected characteristic wavelength as the independent variable and the moisture content of the leaves as the dependent variable, the prediction model of ELM is established, but the prediction accuracy is not very ideal. Therefore, GA and PSO are introduced to optimize the randomly generated W and B values in ELM. Finally, it is found that the precision of predicting water content of cantaloupe canopy leaves based on the ELM model optimized by GA and SiPLS-CARS is the best. Therefore, the optimal modeling method of leaf moisture content retrieval is SiPLS-CARS-GA-ELM, RC value is 0.928 9, RP value is 0.903 2, the precision of the model is high, which can be used to detect the leaf moisture content in cantaloupe canopy, the research provides the theoretical basis for the field irrigation management.
Lettuce leaf greenness is important in the physiological and sensory evaluation of crop quality. Based on the comparison of existing methods for greenness discrimination, combined with the application status and prospects of hyperspectral detection and analysis technology in the detection of plant physiological information, the research on the application method of hyperspectral technology in the greenness discrimination of lettuce leaves was carried out. The quantification of sensory evaluation of the vegetable quality and developing a multifunctional synchronous collection device for physiological information based on hyperspectral technology provide necessary theoretical support. Lettuce is the subject of study. Cultivation experiments were conducted under three different light environments, and relative chlorophyll content (SPAD) was used as a parameter to respond to greenness. Acquisition of dynamic hyperspectral and SPAD data throughout the life cycle of lettuce. Study of hyperspectral response characteristics to leaf greenness. The variation pattern of the hyperspectral curve was analyzed. Finally, a relationship model between hyperspectrum and SPAD was developed. The Savitzky-Golay convolution smoothing (SG) method was used to reduce the noise of the original hyperspectral data. The smoothed data was combined with the three preprocessing methods of multivariate scattering correction (MSC), standard normal variable transformation (SNV) and first derivative (FD), and finally adopted competitive adaptive reweighted sampling (CARS) and extraction effective vegetation index (VI) two methods for sensitive wavelength extraction. Combine the two methods of partial least squares (PLS) and least squares support vector machine (LSSVM) for modeling, and use the coefficient of determination (R2) and root mean square error (RMSE) as evaluation indicators to select the optimal greenness prediction model. The results showed that the hyperspectral curves of lettuce under different light environments showed a consistent overall trend but different reflectance values during the whole life cycle of lettuce at 10, 20 and 30 days. The lettuce reflectance values in the visible light range of 450~680 nm exhibited higher natural light exposure than the supplemental light treatment, while the hyperspectral response characteristics in the NIR range of 730~850 nm were exactly opposite to the visible light range. The combination of SG+FD pre-treatment and CARS sensitive wavelength extraction method based on SG+FD can achieve the most effective extraction of chlorophyll content feature information, and the extracted sensitive wavelengths accounted for 64.59% of the total wavelengths, which increased the number of extracted sensitive wavelengths by 63.34% compared with the original hyperspectrum (1.25%). The LSSVM method was identified as the optimal modeling method, and the model built based on the combined SG+FD+CARS+LSSVM method was the optimal lettuce greenness prediction model with the training set $R^{2}_{c}$=0.920 7, RMSEC=1.161 0, and the prediction set $R^{2}_{p}$=0.828 8, RMSEP=2.400 8, indicating that the model had high accuracy. The purpose of greenness judgment of lettuce leaves can be realized.
With the decline in the availability of petrochemical resources, lignocellulosic biomass as a renewable resource has been getting more and more attention. The atmospheric liquefaction technology has been used widely, which is one of the effective ways of biomass components utilization. In this paper, to optimize the liquefaction conditions, a single-factor method was used to study the effects of liquefaction temperature, mixing ratio of a compound liquefying agent, liquid-solid ratio, catalyst dosage and reaction time on the liquefaction yield of corn stalk. The thermo-gravimetric analyzer (TGA), gas chromatography and mass spectrometry (GC-MS) and nuclear magnetic resonance (NMR) spectra were adopted to detect the volatile degradability and components of the biofuel. The results indicated that the optimum conditions were determined as liquefaction temperature 170 ℃, diethylene glycol (DEG)/1,2-propanediol (PG)=1:2, a liquid to solid ratio of 5:1, phosphoric acid dosage 10% and reaction time 45 min. Under this condition, the liquefaction yield was up to 99.50%. The results of TGA showed that the biofuel contained more than 80% of compounds with a carbon number less than 25, and the final carbon content after pyrolysis was about 15%. GC-MS presented that 39 kinds of organic compounds were tested in biofuel, among which alcohols were the most, phenols were the second, and their relative contents were 70.70% and 25.63%, respectively. There were also some organic acids (2.80%), ethers (0.64%), esters (0.10%) and ketones (0.13%). Its components were complicated, and high oxygen content, so its stability was limited. 1H- and 13C-NMR explained that different chemical shifts δ corresponded to different types of protons and carbon atoms. The distribution of hydrogen and carbon in the biofuel was clarified, conducive to the further exploration of its molecular structure. Hence, theoretical foundation and technical support could be provided for the existing related liquefaction technology and then promote the efficient utilization of biomass resources and the development of biomass-based products.
Soil organic matter is an important indicator that characterizes soil fertility information, and realizing its rapid and accurate detection can provide effective data support for precision agriculture regional management. The particle size of the soil has a great influence on the spectrum prediction of SOM content and instrument development. To analyze the impact of different particle sizes on SOM prediction, five soil samples with the uniform particle size of 1~2, 0.5~1, 0.25~0.5, 0.1~0.25, <0.1 mm, and mixed particle sizes of <1 mm were prepared, and the visible-near infrared (300~2 500 nm) spectral data was collected. Monte Carlo cross-validation was used to eliminate abnormal samples of different particle sizes, and the spectral data were smoothed and de-noised by the Savitzky-Golay convolution smoothing method. The spectral reflectance differences of samples with different particle sizes were compared, and three spectral transformations were performed on the smoothed original spectrum R, including reciprocal IR, logarithmic LR, and first derivative FDR. The correlation between SOM content and the reflectance of different transformed spectra was analyzed. The characteristic wavelength of the FDR transformed spectral data was extracted based on the Competitive Adaptive Reweighted Sampling (CARS) algorithm. Moreover, combined with the partial least squares regression (PLSR) to establish the corresponding prediction models of SOM content. The results show that the average spectral reflectance and coefficient of variation of soil samples with different particle sizes gradually increase with the decrease of particle size, and the difference is obvious in the wavelength range greater than 540 nm. With the decrease in particle size, the correlation between SOM content, particle size, and spectral reflectance in the whole band range become more obvious. FDR transformation can significantly change the correlation between SOM content and spectral reflectance. The CARS algorithm was used to extract the characteristic wavelengths from the FDR transformed spectral data, and the number of characteristic wavelengths was screened out and reduced to 13.1% of the total number of bands, which reduced the overlap of spectral data and the interference of invalid information. Comparing the results of different SOM prediction models, the FDR transformed spectrum had good modeling accuracy. Especially when the particle size was less than 0.1 mm, the model's $R^{2}_{p}$, RMSEP and RPD value was 0.91, 2.20 g·kg-1, and 3.33. Among the SOM content prediction models constructed based on CARS characteristic variables, the prediction model with particle size <0.1 mm has the best effect. Its $R^{2}_{p}$ reached 0.78, RMSEP was 3.00 g·kg-1, and RPD was 2.00, which can achieve reliable prediction of SOM content, and there is still room for optimization of models under other particle sizes. This research can provide a reference for the rapid and accurate prediction of SOM content in the field environment and the design of instruments.
Kidney stones are a common and frequently-occurring disease of the urinary system worldwide, and their recurrence rate is still high. It is generally believed that the supersaturation of salts in urine and the lack of substances to inhibit the formation of crystals in the urine are the main causes of kidney stones. The etiology of kidney stones is complex. At present, a variety of theories about the etiology of kidney stones have been put forward, mainly from the aspects of heredity, disease, metabolism and eating habits, to study the etiology of kidney stones to infer the causes of different kinds of stones, and then make targeted treatment plans. However, the clinical effect of internal medicine treatment of kidney stones is still limited. Actively exploring the growth mechanism of stones will undoubtedly be of positive significance to the scientific treatment of kidney stones. It is important to observe the internal structure of the stones and infer the formation and growth track of the stones according to these structural characteristics. It is difficult to obtain the internal structure of kidney stones by traditional research methods, so there are few reports on the microstructure of kidney stones. The appearance of high-resolution microCT, especially synchrotron X-ray microCT, can undoubtedly provide advanced detection means for this research. As the third generation of high-quality synchrotron radiation source, Shanghai synchrotron radiation facility (SSRF) has the advantages of high photon flux, collimation, polarization, coherence and wide spectrum. The synchrotron radiation X-ray detector can realize the fast and non-destructive detection of accurate and sensitive tissue structure information. It can reproduce the three-dimensional microstructure inside the sample on the premise of maintaining the integrity of the sample. Thus, this new detection method overcomes the limitations of traditional two-dimensional slicing technology, such as destroying the integrity of tissue structure and being, unable to accurately obtain the three-dimensional spatial information as well as matrix composition of tissue structure. In this study, the X-ray microCT technique at SSRF was used to analyze the microstructure of kidney stones from 32 patients. The research results showed that there were obvious differences in the internal structure of kidney stones, which could be divided into six types: Ⅰ the two-phase compact type; Ⅱ the crystalline type; Ⅲ the continuous multilayer deposition type; Ⅳ the discontinuous multilayer deposition type; Ⅴ the mosaic porous type; Ⅵ the composite type. The results of this study would contribute to reveal the growth mechanism of kidney stones further, and provide a new scientific perspective and basis for more accurate treatment of kidney stones.
The geographical distribution of medicinal plants significantly affect the quality and safety of Chinese medicinal materials. From the biological point of view, Chinese medicinal materials are formed during the long-term ecological adaptation of species affected by a specific ecological environment. The climate, soil, hydrology, and other ecological factors required for the growth of medicinal materials are closely related to their growth and quality and have fingerprint characteristics of geographical information. In recent years, the rapid development of the Chinese medicine industry has brought about a surge in demand for Chinese medicine resources. However, at the same time, there are also many potential safety hazards. The difficulty in distinguishing and tracing the origin of Chinese medicinal materials has become one of the main bottlenecks restricting the development of traditional Chinese medicine. In this study, 75 A. argyi samples from 5 major producing areas of 4 provinces in China were analyzed by FTIR for characteristic analysis and data mining. Spectral signal preprocessing methods include Gaussian filtering, multivariate scattering correction, standard normal transformation, first/second derivative, etc. and pattern recognition techniques include BP neural network model, random forest, K-nearest neighbor, Bayesian algorithm, particle swarm optimization support vector machine, etc. were applied to explore the feasibility of traceability for A. argyi. The results indicate that the algorithms of K-nearest neighbor, Bayesian, and particle swarm optimization support vector machine show the ideal recognition effect, with an accuracy of 100%. Considering the comprehensive factors of running time, identification accuracy, and model stability, the algorithm of K-nearest neighbor is determined as the best method to trace the origin of A. argyi. In general, FTIR technology combined with appropriate chemometrics methods can be used to trace the origin of A. argyi successfully. The results of this study can provide technical support for the evaluation and quality control of A. argyi, and also contribute useful reference for the isotropic research of other medicinal materials.
In this study, ultra-high performance liquid chromatography-quadrupole electrostatic field orbital trap mass spectrometry ( UHPLC-QE-MS ) non-targeted metabolomics method was used to observe the changes of endogenous metabolites in serum of CCI rats, screen out the serum differential metabolites of chronic sciatica rats, and analyze the effect of chronic pain on differential metabolites. Twelve SPF SD male rats were randomly divided into the normal control group and a chronic constriction injury ( CCI ) group, with 6 rats in each group. A chronic compression injury model of the left sciatic nerve was established in the CCI group. The normal control group had the same steps except no sciatic nerve ligation. After 14 days, abdominal aorta blood was collected, and serum was separated, and then the metabolites in rat serum were detected by metabolomics. The differential metabolites were screened by UHPLC-QE-MS combined with PCA ( principal component analysis ), and the enrichment analysis of differential metabolites was performed by Metabolic Analyst 5.0. The enrichment analysis results showed that compared with the normal control group, the serum organic acids, organic heterocyclic compounds, fatty acyl, carbohydrates, nucleic acids, organic nitrogen compounds, hydrocarbons and other nine metabolites of CCI model rats were statistically different. The serum metabolomics method based on UHPLC-QE-MS can effectively distinguish the normal group and the CCI group, and the screened differential metabolites are helpful in studying the mechanism of chronic pain and drug targets.
The Clarion-Clipperton Zone (CCZ) in the equatorial eastern Pacific is the most economically potential nodule metallogenic belt globally. There are huge amounts of Mn, Co, Ni, Cu, Zn and Li metal resources in the CCZ. Previous studies focus on chemical and mineralogical analysis, lacking high-resolution spectroscopy analysis of micro-layers and metal distributions, thus resulting in a weak understanding of the enrichment mechanism of metals. In this study, high resolution scanning electron microscopy (SEM), X-ray diffraction (XRD), micro-area X-ray fluorescence surface scan (u-XRF) and laser ablation inductively coupled plasma mass spectrometry (LA-ICP-MS) were used to analyze the micro-lamina of nodules. The result shows that the nodule consists of hydrogenic and diagenetic alternating rhythms. The hydrogenic layer comprises Fe-vernadite, yields low Mn/Fe ratio, Li, Ni, Cu, Zn contents, and high Co, Fe, Ti contents. The hydrogenation layer adsorbs high Co, Ti and V contents due to the coulomb adsorption of FeOOH and surface oxidation of the high valence phyllomanganate octahedral layer. The diagenetic layer is birnessite, showing a high Mn/Fe ratio, Li, Ni, Cu and Zn contents. Its absorptive capacity of metals increases with Mn/Fe ratio and reaches its peak when Mn/Fe>8.The author proposes that the relative Mn and Fe fluxes during nodule accretion control the nodule's mineral type and chemical composition, and the metal flux may also affect the metal composition of the nodule.
In ocean color remote sensing research, it is the key to obtainingthe accurate remote sensing reflectance spectrum (Rrs(λ)) data to retrieve marine biogeophysical parameters from ocean optical satellite data.In practice, Rrs is calculated according to the radiance received by the remote sensing instrument after the correction of atmospheric absorption and scattering and the correction of solar distance and solar elevation angle.Therefore, the atmospheric correction of satellite data is one of the key factors for obtaining accurate water remote sensing reflectance spectral data, which is also an important problem in the research of ocean color remote sensing.Jiaozhou Bay is a semi-closed bay in the west of the Yellow Sea of China and an important representative of the northern temperate zone bay ecosystem. A large range of Marine ranching areas are planned in this sea area, and the water's bio-optical properties are complex. Landsat is the Landsatellite program of NASA in the United States. It was initially developed to observe the land. However, its advantage of high spatial resolution (30 m) is outstanding in Marine remote sensing monitoring, which makes it become one of the data sources that can not be ignored for satellite remote sensing to monitor rivers, lakes, inland bays and other water bodies. Based on the Quality Assurance system-QA Score, we evaluate the results of five atmospheric correction algorithms in processingLandsat8/OLI data in Jiaozhou Bay.Those five atmospheric correction algorithms are NASA's (National Aeronautics and Space Administration) standard near-infrared atmospheric correction algorithm (Seadas adopted it as the Default atmospheric correction algorithm, recorded as Seadas Default in this paper). Acolite default atmospheric correction algorithm-Dark Spectrum Fitting (recorded as Acolite DSF in this paper), and the Exponential extrapolation method of Acolite, which is recorded as Acolite SWIR, Acolite Red/NIR, Acolite NIR/SWIR respectively according to the different bands used in the Exponential extrapolation algorithm. The analysis results show that the probability (83.95%) of QA score of Rrs(λ) data obtained by Seadas Default atmospheric correction algorithm in Jiaozhou Bay is much higher than that of Acolite DSF(49.66%), Acolite SWIR(4.13%), Acolite Red/NIR (7.25%), and Acolite NIR/SWIR (1.38%). The atmospheric correction algorithm of Acolite DSF is superior to that of Acolite SWIR, Acolite Red/ NIR and Acolite NIR/SWIR. Finally, MODIS/Aqua satellite data were used to compare and analyze the Rrs(λ) data at 443, 483, 561 and 655 nm obtained by Seadas Default and Acolite DSF atmospheric correction algorithm respectively. The results show that the atmospheric corrected Rrs(λ) results obtained by the Seadas Default algorithm are better than that obtained by the Acolite DSF algorithm at all the bands. Based on the results of this study, we suggested that the NASA standard near-infrared atmospheric correction algorithm would be the first choice when applying Landsat8/OLI data to do remote sensing application research in Jiaozhou Bay and its adjacent waters areas.
In order to explore the application of handheld X-ray fluorescence spectrometer in research and protection of grottoes, based on lithofacies analysis and former geological data, we apply handheld X-ray fluorescence spectrometer to carry out high-density XRF tests on sandstone with a total thickness of 42 m from the feet to the chest of Leshan Giant Buddha in Sichuan Province at an average interval of 0.5 m and makes a curve of element content and ratio change. The research results show that the main elements such as Si, Ca, Al and Fe in the handheld XRF test results agree with the lithofacies analysis results and natural layer division results, reflecting the content changes quartz, calcite and limonite and the sericitization of debris. Element ratio can reflect the difference in weathering resistance between thick and massive rock mass. Si/(Si+Fe+Al) reflects the variation of cement content and its dissolution. (K2O+CaO)/Al2O3 indicates the change of chemical weathering resistance. The decoupling of S element content with Fe and Mn indicates the development of dissolved pores, which comprehensively reflects the development of cement composition, porosity and bedding of Leshan Giant Buhhda rocks. The two high values of Cl are highly consistent with the banded stagnant water area in the chest and the unconfined water area in the feet of the Leshan Giant Buddha. Therefore, the application of handheld X-ray fluorescence spectrometer in the analysis of stone cultural relics shows the following three advantages. (1) For large and immovable stone cultural relics, handheld X-ray fluorescence spectrometer provides an efficient and non-destructive analysis method of petrochemical composition. The major elements can be in good consistence with the lithofacies analysis results of rock strata on rock mass in grottoes and the natural layer division results, which is helpful for the division of rock strata of stone cultural relics and the comparison of stone cultural relics in different regions. (2) Handheld X-ray fluorescence spectrometer can satisfy the high-resolution XRF scanning with a test interval of less than 0.1 m for the stone cultural relics in the same thick-massive rock stratum. The fluctuation of element ratio and the change of coupling relationship between elements reflect the internal difference in the weathering resistance of massive rock mass in cement composition, porosity and dissolved pore development. (3) The elemental concentration variations of Cl accurately indicate the rock strata with high water content, useful for the evaluation of water stagnation and seepage situation and the key prevention areas. It supports the comparative study of the locations and mechanisms of the stone cultural relics damages under different climatic and hydrological conditions.
Using conventional gemological methods, energy dispersive X-ray fluorescence spectrometer, laser Raman spectrometer, Fourier transform infrared spectrometer and fluorescence spectrometer to compare the spectral characteristics of natural and filled amazonite and to explore the effective and non-destructive identification method of filled amazonite. The results showed that the refractive index of filled amazonite is consistent with that of natural amazonite, which is 1.52~1.53. The luster of filledamazonite is weaker glass to wax, which is weaker than natural amazonite. Enlarged observation shows that the surface is concave in the partially filled amazonite samples, and the luster is different from the surrounding. There may be bubbles in the cracks. So the weak luster and magnified observation can help distinguish natural amazonite from filled amazonite. The main elements are the same either in nature or in filled amazonite, including Al, Si, K and Rb. No abnormal chemical elements belonging to the filling material have been detected. The infrared reflection spectrum in the fingerprint area is the absorption of the group vibration of amazonite. In the functional group area, natural amazonite does not absorb obviously, while the filled amazonite has two characteristic absorption peaks that 2 844 and 2 912 cm-1, produced by the vibration of (—CH2—). The laser Raman spectra of natural and filled amazonite are the same in the 100~1 500 cm-1 band, which are all the Raman peaks produced by the group vibration of amazonite. The fluorescence background of filled amazonite in the 100~3 700 cm-1 band is stronger than natural amazonite. When organic filling material in surface fissures is detected, the fluorescence background will be stronger, and the Raman peaks will appear different from natural amazonite. There is no typical difference between natural and filled amazonite, and natural amazonite different fluorescence characteristics by themselves. The three-dimensional fluorescence spectrum cannot distinguish natural amazonite from filled amazonite.
Hematite and goethite, the two most common iron oxides in nature, are widely distributed in sediments. Their relative content relationship can reflect the sedimentary environment and provide provides a basis for origin discrimination. Due to the complex operation and low efficiency of traditional methods, it is difficult to quickly and accurately determine iron the species and content of iron oxide within the sediments. Recently, diffuse reflectance spectroscopy(DRS) based on ultraviolet-visible-near infrared spectrophotometer has been widely used in sediments because of its simple operation, fast test and low detection limit. A set of Last Glacial yellow silt, sometimes mixed with red and gray and known as “mottled clay”, is widely developed in the late Quaternary basins of Fujian and Guangdong Provinces in the coastal areas south China. This layer was often attributed to exposed weathering of the underwater sediments during the global low sea-level period. However, there is no transition between mottled clay and its underlying deposit, which is difficult to explain by weathering. Moreover, marine fossils rich in the underlying layer are not found in the mottled clay layer, indicating great differences in the sedimentary environment and provenance between these two layers. In order to further determine the sedimentary environment and origin of the mottled clay, four Quaternary drill cores in the Pearl River delta with the method of DRS are analyzed from the perspective of iron mineral characteristics in this study. The results show that the peak value of hematite within the mottled clay is higher than that of goethite, suggesting that the sample is rich in hematite and relatively low in goethite. This trend is opposite to that of the underlying sediments. Hematite is formed in a dry, warm and onshore oxidation environment, where as goethite is the product of long-term wet and underwater reduction conditions. Hence, the mottled clay had not undergone long-term hydration transformation and is therefore not formed by weathering of in-situ underwater deposition but constitutes a subaerial exotic dust accumulation. The small coefficient of variation of the two iron mineral peak values and the similar DRS first derivative curves from the top to bottom of the mottled clay layer in every drill coreindicate that the composition of the mottled clay in different depths is uniform, and the samples had suffered a sufficient mixing and sorting before accumulation. It gives new evidence for the determination of mottledaeolian clay. It can be seen that the DRS method provides not only technical support for iron oxide identification of sediment but also contributes new ideas for the determination of sedimentary environment and origin.
Murals are an important decorative element of temple architecture and an important component of Tibetan Buddhism art. Tashilhunpo Monastery was built in the 12th year of the reign of Ming Emperor Zhengtong (1447AD), which treasures unique and resplendent paintings that plays an important role in Tibet. It is the largest temple in later Tibet, belonging to the Gelug sect of Tibetan Buddhism. Tashilhunpo Monastery has been serving for spreading Buddhist culture since its establishment and has undergone frequent large-scale construction. Investigating the painting materials and techniques now becomes one important part of cultural heritage protection. A total of 8 samples were collected from the typical murals on the north wall of the fourth floor of Maitreya Hall and the west side of the South Hall of Exoteric Buddhist Seminary. Pigments, the ground layer and the inside structure of the painting were studied by three-dimensional video Microscopy, scanning electron microscopy in combination with energy dispersive X-ray microanalysis, polarizing microscope, X-Ray Diffraction, microscope and laser Raman technique. The results show that three layers of the wall painting cross-section correspond to a ground layer, a yellow preparation layer, and a paint layer. Natural and synthetic pigments are both used in the paintings, including cinnabar (HgS), orpiment (As2O3), charcoal (C), antlerite (Cu3(SO4)(OH4)), C. I. Pigment Red 14 (C24H17ClN4O4), synthetic ultramarine blue (Na8(Al6Si6O24)Sn), Phthalocyanine green G (C32H3Cl13CuN8-C32HCl15CuN8). Pigment red 14 and phthalocyanine green are organic synthetic pigments, while synthetic ultramarine blue is inorganic synthetic pigments. As a mineral pigment, antlerite has been used in easel paintings, murals, manuscripts and other artistic works in Europe, but the history of usage has not been found in China. This discovery expands the knowledge of green pigments.The study demonstrated that loess and aga soil was the base of the wall paintings and painted with kinds of color finally according to the religious ritual. Furthermore, the research findings show traditional materials for Tibetan murals and modern synthetic materials, indicating that several wall paintings have been repaired or repainted later. The results make up for the murals research vacancy of Tashilhunpo Monastery and provide important evidence for the complement and improvement of its repair history.
Studying, the nature and composition of saline soil, are significant to the ecological environment. Most traditional methods for determining salt content are based on chemical analysis. Due to their high cost and low efficiency, the feasibility of applying them to large areas of land is greatly reduced. An extreme learning machine (ELM), as a machine learning system based on a feedforward neural network, has been successfully used as a spectral processing method in many studies. In order to improve the traditional salt content detection methods of saline-alkali soils, this paper uses spectroscopy combined with an improved extreme learning machine (ELM) model to study saline-alkali soils, further expanding the application scenarios of spectroscopy analysis methods. We obtain the corresponding spectral reflectance and salt content data according to the 62 surface samples collected in Zhenlai County and then propose the multi-layer extreme learning machine model optimized by improved particle swarm optimization (PSO) algorithm with improved particle swarm optimization (PSO) algorithm with random values(RVIPSO-MELM) model. Firstly, we use the principal component analysis(PCA) to extract the characteristics of the spectral data and then adopt the ELM algorithm to establish a classification model for the spectral data. Finally, to improve the accuracy and speed, an improved particle swarm optimization algorithm is applied. This model combines the advantages of both multi-layer ELM with random values (RV-MELM) and the multi-layer ELM model optimized by an improved PSO algorithm (IPSO-MELM), using the heuristic algorithm to search for the optimal value and also having randomness, which improves the speed of model optimization. The parameters are optimized and selected to improve the performance of the model. Moreover, the model can be extended to multiple layers, and the two methods of selecting parameters between hidden layers, calculated by empirical formulas or improved heuristic algorithm, are discussed about the model's performance and optimize the time. The practical results show that it is a more realistic method to select the parameters of the first layer to use the improved particle swarm optimization algorithm and determine the parameters of the subsequent hidden layers by using the empirical formula calculate. Before the heuristic search for the optimal value, the Monte Carlo method is applied to determine a better initial value, enabling the model to maintain a high accuracy rate and further improving the optimization speed. Compared with traditional methods, this spectral analysis combined with the ELM model saves time and economic costs, giving it a certain promotion significance.
If the waste textiles are classified, recycled and disposed of according to their components, many textile raw materials can be saved. At present, the manual sorting method is often used in the recycling process of waste textiles. This method is costly and inefficient. Near-infrared spectroscopy analysis is one of the most rapidly developing technologies in the 21st century. It can quickly determine the components of the sample and the content of each component without destroying the sample. Using this technology to analyze the waste textiles and prejudge the components and contents of various components of waste textiles can be helpful for the large-scale fine classification and recycling of waste textiles. In the multi-model method, the final predicted value is obtained by a weighted average of the predicted values of each sub-model. The near-infrared spectroscopy analysis model established by this method generally has good stability. In this paper, taking the nylon content of waste textile samples as an example, a near-infrared spectral analysis model for predicting the nylon content is first established using the multi-model method. The method is as follows: The reflectance vectors are divided into 15 groups according to their wavelengths. A sub-model of near-infrared spectral analysis is established with each data group. The final predicted value of the nylon content is obtained by a weighted average of the predicted values of sub-models. Then, based on the multi-model method, according to the approximately linear relationship between the predicted values and the experimental values of the nylon content, by replacing constants with variables and by standardizing the variables, a new model for predicting the nylon content by near-infrared spectral analysis is presented, and the model is convenient for optimization. After optimization, the parameters of each sub-model are reduced by 6. This can prevent overfitting of the model.The above two models are compared with the common model established by the partial least squares method. The results of cross-validation show that: the average of the goodness of fit of the (optimized) new model is 0.820 7. The average goodness of fit of the model built using the multi-model method alone is 0.769 1. The average goodness of fit of the model built by the partial least squares method is 0.746 7. Therefore, the prediction effect of the model built by the multi-model method is better than that of the model built by the partial least squares method. The prediction effect of the new model is better than that of the other two models. The main innovation of this paper is the establishment and optimization of the new model. The modeling method in this paper is expected to predict the content of other components in waste textile samples.
At present, the detection of dry rot and potato scab was completed by manual visual inspection, and the detection results were subjective. This experiment studied the spectral detection method for classification and recognition of normal, dry rot and scab of potato. 116 potato samples were collected in the experiment, and the spectrum collection range was 860~1 745 nm. After the first derivative (FD) processing, the principal component analysis (PCA) classification recognition effect was better, and FD was used as the spectral preprocessing method. The shape of the spectral curve was determined by the extreme points on the spectral curve, the midpoint between the extreme points and the slope line between the extreme points. The shape change of the spectral curve represented the change of the internal substance and had fingerprint characteristics. The mode eigenvector was composed of the spectrum corresponding to the key points or the line slope between the extreme points. The average spectra of the key points of the three samples were used to form the standard pattern feature vectors. By calculating the Mahalanobis distance between the feature vectors composed of the key points of the tested samples and the standard pattern feature vectors, the minimum Mahalanobis distance was used to determine the attribution of the samples, and the error recognition rate tested the recognition performance of the model. There were 13, 12 and 15 key points in normal, dry rot and scab samples, respectively. The pattern feature vector was composed of the reflectance corresponding to each key point, and the error recognition rate of the three types of samples was zero. By removing redundant key points and integrating them into a standard pattern feature vector, the error recognition rate of normal and scab samples was zero, that of dry rot samples was 14.3%, and all were scab samples. The feature vector data points increase the fit degree between disease samples and reduces the discrimination between two types of disease samples. Using the slope between two points at the wavelength of 911, 1 269 and 1 455 nm to form the pattern feature vector, the error recognition rate of normal and scab samples was zero, and the error recognition rate of dry rot samples was 2.4%. Linear discriminant analysis (LDA) and Bayesian classifier (BC) were used to build the classification model by using the scores of the first two principal components as the parameters. Different classification models were provided. The effectiveness of the classification model based on the pattern feature vector was compared and verified. The error recognition rate of the two recognition methods was zero. The experimental results show that the pattern feature vectors representing the structural features of spectral curves could be used as the classification parameters, and the distance method could be used for modeling, which had the same recognition accuracy as the standard recognition methods.
Nitrogen and phosphorus are essential nutrients for the growth and reproduction of aquatic organisms and affect the primary productivity of the water body. The eutrophication level of the water body is closely related to the fractions of nitrogen and phosphorus. With the change in the water environment, the sediments will release nitrogen and phosphorus into the water body, causing secondary pollution. At the same time, quantitative identification of the contribution of external nitrogen and phosphorus pollution sources can effectively manage and control the nitrogen and phosphorus pollution load in the water body. Pihe River and Shiting River are important tributaries of Tuojiang River and affect the water quality of the Mother River of the Yangtze River. In this paper, the distribution characteristics of total nitrogen (TN), total phosphorus (TP) and various fractions of nitrogen and phosphorus in the water body and surface sediments of Pihe River and Shiting River in the upper reaches of Tuojiang River in the dry season and wet season were studied by molybdenum blue/ascorbic acid spectrophotometry and continuous extraction method.The behavior characteristics and release risk of nitrogen and phosphorus in rivers with different land-use types were compared. The APCS-MLR receptor model was used to identify and quantify the sources of nitrogen and phosphorus pollution. The results showed that: ① nitrogen and phosphorus in the water and surface sediments in the study area were at different pollution levels. The main contributors of TP in the dry season were particulate inorganic phosphorus (PIP) and particulate organic phosphorus (POP), while in the wet season, it was particulate inorganic phosphorus (PIP) and dissolved inorganic phosphorus (DIP). The main contributors of TN in the two water periods were nitrate-nitrogen ($\mathrm {NO^{-}_{3}}-N$) and organic nitrogen (ON). In surface sediments, the main contributor of TP was calcium-bound phosphorus (HCl-P), and the main contributor of TN was acidolysis nitrogen (HN). In dry season and wet season, the average ratio of bioavailable phosphorus (BAP) in TP of surface sediments of Pihe River (19.7% and 23.0%) was higher than that of Shiting River (11.0% and 12.5%), indicatinga a higher risk of phosphorus release. It was found that the nitrogen and phosphorus pollution degree in the dry season was higher than that in the wet season, and the nitrogen and phosphorus pollution degree in Shiting river was higher than that in Pihe River. ② APCS-MLR model extracted four pollution source factors in the Pihe River, including urban domestic sewage, leachate generated by domestic garbage accumulation, decomposition of animal and plant residues and aquaculture wastewater. Among them, urban domestic sewage contributed the most to nitrogen and phosphorus pollution in the Pihe River (50.9% in dry season and 54.8% in wet season). At the same time, wastewater generated in industrial production, degradation of animal and plant residues and the weathering of agricultural waste, agricultural wastewater from farmland drainage channels and an unreasonable application of pesticides and fertilizers were five pollution source factors, among them, the wastewater produced in industrial production contributed the most to the nitrogen and phosphorus pollution of Shiting river (58.7% in dry season and 55.8% in wet season). Therefore, the relevant local departments should strengthen the management and control of high contribution pollution sources to reduce the basin's nitrogen and phosphorus pollution load.
Salt lake is a natural complex system coexisting with water and salts. Borate species in salt lakes and their distributions are complicated than the pure borate solution. Generally, polyborates can be formed in brine by polymerization during the concentration process. Thus, borates in concentrated brine have a severe supersaturation behavior, which cannot favour the salt lake resource separation between boron and other slats. Therefore, the study of the poly borates distributions in the salt lake brine and their transformation mechanisms is of great importance. Laser Raman spectroscopy is characteristic of in-situ, non-destructive and weak water interference and thus has been widely used to determine borate structure in aqueous solutions. Recently, the modern Quantitative Raman technology with Chemometrics has become an efficient method to accurately acquire the number of matters in a complex system. It shows great advantages in solving spectral problems such as spectral overlap, background interference and baseline drifting and has been widely and deeply applied in the analysis field. Based on the Chemometrics, this paper has studied the quantitative analysis of monoboartes in aqueous solutions by Raman technology, with the three regression models as internal standard, multi-linear regression and partial least squares regression. Also, it has evaluated the three models by using the external standard sample. It was found that both multi-linear regression and partial least squares models had a more accurate amount prediction of the sample, with a relative error of less than 1%. However, the former model shows better values at lower boron concentration. Furthermore, based on the multiple linear regression models, we also explored the borate species and its distribution in the oilfield brine in the west of Qaidam Basin by Raman spectroscopy. The results showed that only the boric acid peak at 875 cm-1 was detected in the oilfield brine during the evaporation process. The amount of boric acid predicted by the multiple linear regression models agrees well with the boric acid concentration measured using the titration method. The relative error between them is less than 5%. It indicates that the major form of borate in the oilfield is boric acid, and other borate species can be ignored, which explains why the boric acid solid is the only borate saltthroughout the whole oilfield brine crystallization process. The results of this study could provide fundamental information and theoretical guidancefor the future exploration of the quantitative analysis of the borate speciation in the brine under dynamic environmental conditions.
Mineral elements are one of the important indexes for quality evaluation of Traditional Chinese medicine(TCM), which are closely related to the synthesis and play of the effective substances of Chinese medicinal materials. The content of mineral elements in TCM is affected by its germplasm, harvesting period, medicinal site, origin and other factors. Cistanche deserticola Y.C.Ma is one of the famous tonic herbs and medicine-food homology in China, and its mineral element content has attracted more and more attention. The contents of 4 major mineral elements and 8 trace mineral elements in different parts of three types of C. deserticola were analyzed by ICP-AES. The results show that: (1) K, Ca, Mg, Na, Fe, Mn, Cu, Zn, Cr, As, Pb and Cd were all contained in the three types of C. deserticola, but the contents of different types were significantly different. The mineral element content of yellow flower type is lower than that of white and purple flower types. The contents of K, Ca, Mg, Na and Cu in the white flower types were higher than those in the purple flower types, while the contents of Zn, Cr and Cd were lower than those in the purple flower types. (2) There were significant differences in the distribution characteristics of 12 mineral elements in C. deserticola, and K, Ca, Mg, Na and Cu were mainly distributed in the upper part. (3) The ratios of mineral elements in different parts of deserticola were significantly different. K/Na of three types of deserticola were lower > middle > upper. The Mg/Fe ratio was the highest in the middle of purple and white flowers and the highest in the upper part of yellow flowers. The Zn/Mn ratio was the highest in the middle of purple and yellow flowers but the highest in the lower part of white flowers. Cu/Cr ratio was highest in the upper part of white and yellow flower types and highest in the middle of purple flower types. This study will provide data support for the breeding and quality control of C. deserticola.
The judgment and assessment of preprocessing scheme for 3D fluorescence spectroscopy Optimized still depend on the total extraction volume. Since the release of the DOM during extraction with the discrepancy between components, the studies might be more reasonable if we had considered the extraction of DOM components. This paper aims to clarify the differences in the extraction of DOM components and total and whether it is necessary to set the separate extraction time. Two common extraction methods, oscillating and centrifuging, were used. The time was set as the upper limit of the high-speed centrifuge and the constant temperature shaking box. PARAFAC and FRI were used to characterize the DOM compositional characteristics at different extraction times. According to the correlation and principal component analysis, it was found that there were different interactions between the components, and the optimal preprocessing time was screened out on the condition that the regional integral value and Fmax reached the maximum. The humus-like components were strongly positively correlated with the total (p<0.05), and the protein-like components were less correlated with the total using FRI analysis. The humic acid-like components were strongly positively correlated with the total.The fulvic acid-like fractions were weakly correlated with the total amount using PARAFAC analysis (p<0.05). There were differences in the extraction of total and components, which required separate pre-treatment time settings. The choice of extraction time is premised on the economy and stability of the distribution, the reby choosing the maximum of fluorescence regional integration or fluorescence intensity score (Fmax). The results showed that the optimal extraction times for entirety, humic acid-like, fulvic-like, complexine-like, tryptophan-like substances and microbial metabolites were 12, 21, 12, 12, 12, and12 h, respectively. PARAFAC analysis showed that the optimal extraction times for entirety, C1, C2, and C3 were 12, 21, 12, and 39 h, respectively. In summary, the two extraction methods have their advantages. The same extraction time can be used for the components and the overall time under the centrifugal treatment. The regional integral and Fmax values under the shaking treatment showed more oscillation than the centrifugation, and the extraction effect is relatively stable. The research results can provide a data basis and guidance for optimizing the preprocessing scheme when measuring DOM by three-dimensional fluorescence spectroscopy.
The silica-magnesium gel impregnated modified Chinese fir has improved physical and mechanical properties. Exploring the fixing performance and mechanism of silica-magnesium gel in Chinese fir has significance for subsequent research and innovation. It is uses silica-magnesium gel as the modifying agent and fast-growing Chinese fir as the base material.Modified Chinese fir was prepared after dipping and drying. FTIR and XPS were used to analyze the chemical composition and combination of naturalChinese fir and modified Chinesefir and discussed the distribution of silica-magnesium gel in wood and the permeability of modified Chinese fir. The experimental results showed that the physical and mechanical properties of the modified Chinese fir impregnated with silica-magnesium gel hadbeen significantly improved, and the density was above 0.5 g·cm-3, the compressive strength and bending strength were increased by 99.73% and 58.48% compared with the natural Chinese fir.The end surface hardness was increased from 3 659 to 5 843 N, and it reached the performance index of medium wood. The results of EDS proved that the medicament was well filled in the cell cavity of the fir, and the main elements such as Si, O, Na, Mg and the impregnating medicament silica-magnesium gel were consistent and evenly distributed. Layered XPS tests were performed on the Chinese fir before and after impregnation. The O/C of the modified Chinese fir increased, and the content of each element at different depths was very close. The silica-magnesium gel was evenly distributed in the Chinese firand had good permeability.After leaching, the Si element content changed little, while the sodium element decreased, which may be caused by the dissolution and loss of some sodium salts, and the element content changes at different depths tend to be consistent. The resistance of the modified Chinese fir compared with sodium silicate, the loss rate of silica-magnesium gel was reduced to 10.8% in 96 h, and the effect was good. The FTIR test results of modified Chinese fir, natural Chinese fir, sodium silicate solution and leachate showed that the sodium silicate solution had the effect of destroying and leaching out the lignin and hemicellulose of Chinese fir, improving the permeability of Chinese fir and making it easier to interact with the medicament forms a chemical bond. The XPS spectrogram analysis of C, O, and Si elements showed that C(1s) shifted to low binding energy after modification, and the properties were more stable. The O—H binding was greatly reduced, and the Si—O binding increased. The silica-magnesium gel can form a stable in Chinese fir with a Si—O—C chemical structure, and the agent can achieve high-efficiency fixation on the cell wall. The research results provide new ideas for the loss detection and fixation research of modified wood and provide certain theoretical support for the follow-up study of modified Chinese fir impregnated with silica-magnesium gel.
Agricultural irrigation is effective for the reutilization of reclaimed water, and the natural advantages and operational feasibility have been generally approved. Agricultural irrigation with reclaimed water can achieve acceptable ecological, social and economic benefits, while organic matters in the soil might lose or change during the irrigation process, and the related issue has received insufficient attention. Dissolved organic matter (DOM) was selected as the analysis target, and the scientific issue was to reveal the variation mechanism of DOM spectral information in leachate released from the irrigated agricultural soil. Samples of reclaimed water (from wastewater treatment plant) and surface water (from the river, for contrast) were used, and a one-dimensional undisturbed soil column was applied to study the irrigation effect on soil and soil leachate. The electronic scanning microscopy (SEM), ultraviolet-visible spectroscopy (UV-Vis) and three-dimensional excitation-emission matrix fluorescence spectroscopy (3D-EEMs) were involved in reveal the fundamental information of DOM released from soil irrigated with water samples. The results show: that soil aggregates appear lose structure and rough surface after irrigation, and small soil particles gather and stick together. The contents of organic matter decrease with the increased soil depth, and DOM content reaches maximal at 10~20 cm of the soil layer. The concentrations of organic matter (0~30 cm of soil layer) and DOM (0~20 cm of soil layer) increase after irrigation, suggesting the interception effect of water organic compounds by soil samples. The UV-Vis spectra of leachate are similar, and the unsaturated double-bond conjugate structures cause the absorption regions at 240~270 nm in DOM. The lower aromatization degree and more straightforward structure of DOM can be detected in soil leachate irrigated with reclaimed water, and the content of fulvic acid is higher than that of humic acid. The only fluorescence peak of DOM appears in theEx/Em=260~270/420~430 nm, regarded as a humus-like component. Compared to the previous results, it is deduced that amino acid-like and protein-like components might be adsorbed and retained in soil. Bio-source (endogenous) DOM plays a more important role than exogenous DOM in soil leachate. The achievements are significant to estimate further the circulation, transportation and ecological effect of DOM or organic matters in the reclaimed water-irrigated agricultural soil systems.
In this paper, we developed a simple design and a detection method for AND logic gates by using aptamers, Cetyltrimethyl Ammonium Bromide (CTAB), and melamine and cyromazine to control the aggregation and dispersion of gold nanoparticles (AuNPs). First, Based on the fact that aptamer T31 can specifically bind with melamine, and CTAB immediately resulted in the aggregation of AuNPs, an AND gate was fabricated to find whether there was melamine. It also has a detection limit of 0.24 mg·L-1 by the naked eye to detect melamine, and the limit of detection (LOD) by a spectrophotometer is 85 μg·L-1. Second, with the adsorption of aptamer Tcy1 on AuNPs and the strong coordination of Tcy1 with cyromazine, the addition of cyromazine and CTAB immediately resulted in the aggregation of AuNPs, giving rise to another AND gate. It also has a detection limit of 0.17 mg·L-1 by the naked eye, and the limit of detection (LOD) is 9.0 μg·L-1 by spectrophotometer. So, these logic gates can be used to detect melamine and cyromazine in raw milk.
As a new member of carbon nanomaterials, carbon quantum dots (CDs) with many advantages such as high optical stability, low toxicity, superior water solubility, diverse raw materials and preparation approaches, have shown application prospects in the fields of analytical detection, biomarker, photocatalytic degradation and environmental monitoring widely. The investigation on CDs has attracted significant interest. In general, the exceeding content of Fe3+ ion in water would be harmful to daily drinking and industrial production. It is of great significance to determine the content of Fe3+ in water accurately and quickly. At present, some techniques are used for the detection of Fe3+ ions, which include voltammetry, fluorescence spectrum, electrochemical and flame atomic absorption spectrometry. The fluorescence spectrometry has shown the merits of fast response and facile process, which makes it much better than other ways. In this paper, the CDs with bluish-green emission were prepared by hydrothermal treatment of persimmon leaves. The X-ray diffraction, high resolution transmission electron microscopy, Fourier transform infrared spectroscopy, ultraviolet visible absorption spectroscopy and fluorescence spectroscopy were used to characterize CDs’ structure, morphology, and spectroscopic properties. The CDs exhibit uniform spherical particles with an average diameter of 5.9 nm and abundant oxygen-containing functional groups on the surface. The UV absorption at 277 nm should be attributed to then→π* transition of the C=O group. CDs’ emission wavelength and intensity are closely dependent on the excitation wavelength. Excited with 410 nm long, the emission maxima are 498 nm and it shows the strongest intensity. The fluorescence lifetime is about 4.59 ns. Moreover, the as-prepared CDs show high selectivity for Fe3+ ion compared to other metal ions, which can be used as a fluorescent probe to detect the trace concentration of Fe3+ in water. The dependence of fluorescence quenching rate F0/F with Fe3+ concentration has a good linear relationship (R2=0.992), and the quenching constant, and detection limit value is 8.84×10³ L·mol-1 and 0.21 μmol·L-1, respectively. The detection limit value of 0.21 μmol·L-1 is smaller than those reported in recent literature. Consequently, this work provides a preparation process with natural raw materials, simple operation and low-cost, and develops a new pathway for the fluorescence detection of trace metal iron ions in water.
Broadband light interferometric microscopy is widely used for high precision profile measurement in the industry field. Vertical scanning interferometry (VSI) is usually used to measure the submicron to millimeter level features, and phase shift interferometry (PSI) to measure the nanoscale features. Among them, the precision of PSI is of nanoscale order, while its measurable range is limited because the phase changes corresponding to the height variations of the sample surface should be limited within the scope of 2π.A large amount of phase unwrapping algorithms are developed to extend the range of PSI. However, they are only suitable to smooth surfaces. When the height fluctuations exceed the limited range determined by the focal depth or the coherent length of the light source, the interference fringes will be blurred. Even the contrast will be lost. Thereafter, great measurement errors will be introduced to the calculated results. This paper proposesa high precision and large range broadband light interferometric microscopy measurement method based on the phase unwrapping and stitching algorithm. The fringe modulation value quantified the fringe quality at a given focal plane, the areas with the high modulation values generally correspond to the regions of interests (ROI) with high contrast and clear image. The ideal regions (IRs) are defined as the ROI with a modulation value greater than a given threshold within the current focal plane. Meanwhile, the problem regions (PRs) are defined as the ROI with a modulation value lower than the given threshold. Only the true phase distribution in IRs is calculated with the phase unwrapping algorithm. By vertically moving the focal plane of the objective with a translation stage at a reasonable step length, the IRs of the adjacent focal plane will be partially overlapped. According to the differences between the phase of the overlapped IRs of the adjacent focal plane, the corresponding unwrapped phase of the adjacent plane can be stitched together with high precision. Finally, the complete profile distribution of the sample is restored according to the stitched true phase with high precision. The proposed method for broadband light interferometric microscopy avoids the error caused by the phase unwrapping in the PRs. Through simulation and experiments results, we demonstrate that the proposed method maintains the nanoscale precision of PSI in broadband light interferometric microscopy and extends its range from hundreds of nanometers to several micrometers. Moreover, its accuracy does not depend on the displacement precision of the focal planes by translation stages. Theoretically, the range of our proposed method can be extended to the total working distance of the microscopic objective.
Numerous kinds of diseases and insect pests affect citrus’ growth, but most of the current detection methods are for a single condition. It is important for the accurate application of pesticides in orchards and the healthy development of the citrus industry that the development of a detection method based on hyperspectral imaging and machine learning to achieve rapid and accurate detection of multiple pests and diseases on citrus leaves. Naturally onset citrus leaves in orchards were used as research objects, including normal citrus leaves (50 pieces), ulcer disease leaves (50 pieces), soot disease leaves (103 pieces), nutrient deficiency disease leaves (60 pieces), and red spider leaves (56 pieces) and herbicide damage leaves (85 pieces), hyperspectral data in the 350~1 050 nm band were collected. First-order derivation (1stDer), multivariate scattering correction (MSC) and median filtering (MF) were used to preprocess the original (Origin) hyperspectral data, principal component analysis (PCA) and competitive adaptive weighting (CARS) algorithms were used to extract characteristic wavelengths from the prepossessed hyperspectral data. Characteristic wavelengths obtained by CARS were 10, 5, 12 and 10 respectively, and the 4 sets of characteristic wavelengths obtained by PCA were all 7, ranging in the 700~760 nm band. The limit gradient boosting tree (XGBoost) was used for the full band (FS), and the support vector machine (SVM) was used for the characteristic wavelength to establish a multi-classification model of citrus diseased leaves. The classification models established by XGBoost are Origin-FS-XGBoost, 1stDer-FS-XGBoost, MSC-FS-XGBoost and MF-FS-XGBoost, and the overall classification accuracy (OA) obtained from the detection of 6 kinds of diseases and insect pests leaves was 94.32%, 93.60%, 95.98% and 96.56% respectively; the classification models established by SVM are Origin-CARS-SVM, 1stDer-CARS-SVM, MSC-CARS-SVM, MF-CARS-SVM, Origin-PCA-SVM, 1stDer-PCA-SVM, MSC-PCA-SVM and MF-PCA-SVM, model OA was 93.63%, 90.26%, 87.90%, 91.95%, 87.53%, 90.82%, 83.50% and 90.98% respectively. The experimental results demonstrate that the recognition rate of the XGBoost model with FS as input was better than the SVM model with characteristic wavelength as input. The OA of the MF-FS-XGBoost model was 96.56%, the Recall was 95.91%, and the model training time was 63 s. The overall performance was the best; the CARS-SVM modeling effect was better than PCA-SVM. After pre-processing by all three methods, the recognition rate of the CARS-SVM model was above 87%, and the recognition rate of the PCA-SVM model was above 83%. The results show that hyperspectral imaging technology combined with machine learning methods can classify and identify multiple species of citrus pests and diseases, providing a theoretical basis for rapid and non-destructive detection and control of citrus pests and diseases.
There are three forms of mercury in water: elemental mercury, inorganic mercury and organic mercury. Methylmercury is the main organic mercury form, and is much higher than that of elemental mercury and inorganic mercury. Cold vapor atomic fluorescence spectrometry(CVAFS) is the recommended method for measuring methylmercury in the water. CVAFS is an element analysis method developed from atomic emission and absorption spectrometry. After years of development and improvement, it has become one of the most commonly used technologies for element analysis. It is widely used in environmental protection, life science, geology and other fields with the characteristics of high sensitivity and low detection limit. However, affected by the background noise of the excitation light source, electronic components of the detection instrument and the separation effect of the chromatographic column, the signal of CVAFS will haveproblems such as baseline drift and signal tailing, which will seriously influence the peak area calculation of the CVAFS’s data and the quantitative analysis of trace methylmercury. Baseline drift is the most critical problem. At present, improving analogue device parameters and digital baseline estimation are two important ways to solve baseline drift. In terms of improving the parameters of the analogue device, there are hollow cathode mercury lamps and closed-loop controlled hot cathode low-pressure mercury lamps with disadvantages such as complex experimental equipment and high cost. The digital baseline estimation includesthe least square method, difference fitting method and so on, as all of them have weaknesses like unstable baseline estimation and inaccurate content calculation. Thus, a digital baseline estimation method based on wavelet transform was proposed. Firstly, by analyzing the microscopic signal of CVAFS and baseline drift of methylmercury, the mathematical model of the signal of CVAFS and baseline drift wasestablished. Secondly, according to the characteristics of the signal of the CVAFS model and wavelet transform, an appropriate mother wavelet model was established. The mother wavelet model was convoluted with the baseline drift model, and the convolution result was always zero. Theoretically, it indicated that the baseline drift wouldbe eliminated after wavelet transform. Thirdly, taking 100 pg standard sample methylmercury as an example, the experiments verified that wavelet transformation could eliminate baseline drift and solve the problem of signal tailing. Finally, under the condition that the relative standard deviation (RSD) of the instrument is 1.29%~3.40%, the experiments were repeated for 5 times for standard methylmercury solutions of 0, 10, 20, 50, 100, 500 and 1 000 pg, and the calibration curves of the average peak area before and after wavelet transform were established respectively. The calibration curve’s correlation coefficient (R2) is increased from 0.994 to 0.997 after the wavelet transform. The experimental results showed that this method could effectively eliminate the influence of baseline drift and signal tailing and improve the system’s measurement accuracy.
The detection and control of the content of heavy metal elements in the soil are of great significance to the restoration of agriculture and the ecological environment. This study used external cavity confinement combined with traditional laser-induced breakdown spectroscopy (LIBS) to obtain soil spectral data. Then machine learning was used to analyze the content of heavy metal elements Ni and Ba in the soil. During the experiment, the delay time was set to 0.5~5 μs, Ni Ⅱ 221.648 nm and Ba Ⅱ 495.709 nm were selected as the target characteristic spectrum to study, and calculated the influence of delay time on the signal-to-noise ratio (SNR), spectral intensity and enhancement factor under two LIBS conditions. Experimental results show that cavity confinement LIBS (CC-LIBS) can increase the target element’s spectral intensity and SNR. As the acquisition delay time increases, the number of plasmas decreases, and the spectral intensity and SNR gradually decrease, then become stable; when the delay time is set to 1 μs, the SNR of the characteristic spectrum of Ni and Ba elements reaches the best under CC-LIBS conditions, which is determined to be the optimal experimental condition for LIBS at this time. Obtain the spectral data of 9 soil samples containing Ni and Ba through optimal conditions. Since there were 12 248 data points for each set of collected spectral information, the principal component analysis algorithm (PCA) was used to reduce the dimensionality of the spectral data under CC-LIBS conditions. After retaining more than 95% of the original soil information, 9 principal components were selected as the quantitative analysis model’s input variables to improve the model’s calculation speed. The Lasso, AdaBoost and Random Forest models in machine learning were used to model and predict the spectral data after PCA dimensionality reduction to realize the quantitative analysis of soil heavy metal elements Ni and Ba. The experimental results show that the Random Forest model has the best prediction performance in the training and test sets compared with Lasso and AdaBoost models. Under the Random Forest model, the correlation coefficient R2 of the Ni element in the test set is 0.937, and the root mean square error (RMSEP) is 3.037; the R2 of the Ba element in the test set is 0.886, the RMSEP is 90.515. This paper is based on the research of cavity-confinement LIBS technology combined with machine learning to provide theoretical support and technical guidance for the high-precision detection of heavy metal elements.
Protein powder is an essential nutritional supplement for bodybuilders, and the market demand is increasing. Some unscrupulous businessmen are adding cheap powder to protein powder for sale to profit. The traditional protein powder adulteration detection method is time-consuming, laborious, complicated and expensive. Hyperspectral technology has the advantages of easy operation and rapid detection without damaging the experimental sample. Therefore, this paper proposes the use of hyperspectral technology to achieve protein powder adulteration detection. In the experiments, three types of adulterants (corn flour, rice flour and wheat flour) with 5%~60% mass percentages and 5% concentration interval were added to the protein powder, and the spectral information of all samples was collected. In the qualitative discrimination of the three types of adulterants (corn flour, rice flour and wheat flour) in the protein powder, the spectral data were firstly processed using the pre-processing methods of convolutional smoothing (SG), normalization (Normalize), multiple scattering correction (MSC), baseline correction (Baseline) and standard normal transformation (SNV), and then the spectral data were established based on principal component regression ( PCR), backpropagation neural network (BPNN), and random forest (RF) models, among which the RF model built under the MSC preprocessing method based on full-band spectra is the best, and its overall accuracy reaches 100%. Its corresponding RP and RMSEP are 0.997 9 and 0.018 9, respectively. In the quantitative analysis of different adulterant concentrations in protein powder, the spectra of the three types of adulterated samples were pretreated with SG, Normalize, MSC, Baseline and SNV, respectively, and LSSVM models were established. The performance between the models under different pretreatment methods was compared. The best LSSVM prediction models were used for corn flour, rice flour and wheat flour adulterated in protein powder preprocessing methods were None, Baseline and Normalize, and then, the continuous projection algorithm (SPA) and competitive adaptive reweighting algorithm (CARS) were used to screen them and build LSSVM models. The RP corresponding to the SPA-LSSVM models for the three types of adulterated samples were 0.989 0, 0.986 0 and 0.997 9, and the RP of the CARS- LSSVM model corresponds to RP of 0.991 0, 0.994 6 and 0.999 1, so the CARS-LSSVM model for the three types of adulterated samples has a better prediction. Research shows that hyperspectral technology can achieve qualitative and quantitative detection of protein powder adulteration and simple operation, rapid and non-destructive detection.
Dental caries are closely related to pulp infection status and vitality, and the depth of caries determines the clinical treatment. However, the detection and diagnosis methods of dentin caries, such as visual examination and probe, are easily affected by subjective factors. X-ray assistive examination for caries has low sensitivity and some defects, and its reliability and effectiveness still need to be improved. Terahertz time-domain spectroscopy can image different physical parameters, which has great potential in the physical and nondestructive detection of dentin caries. This study aimed to explore terahertz spectral images of dentin caries. Experiment by transmission and reflection type scanning terahertz platform, to 15 containing dentine caries in vitro teeth grinding slice scanning, through the data of two-dimensional reconstruction, won the terahertz transmission and reflection of different parameters in the image. Terahertz images and laboratory studies of dental decay light image and X-ray image contrast, the proposed merger under light microscopy, THz image caries damage area is under evaluation.The results show that the terahertz image is consistent with the light mirror image and has higher sensitivity than the X-ray image.Under the reflection mode, the sample thickness, surface roughness and system noise greatly influence the experimental results due to the weak THz reflection signal. The image can only identify the contour of the sample but cannot be used to distinguish enamel, dentin and dental caries.In the transmission mode, both the frequency domain 1.4 THz phase difference imaging and the time domain imaging corresponding to the minimum signal can be used to distinguish enamel, dentin and dental caries, and the time imaging corresponding to the minimum signal can be used to distinguish the three, among which the time imaging corresponding to the minimum signal has the best effect.Measured under the light dentine caries damage area and terahertz time-domain signal of transmission mode for the minimum time corresponding image of dentine caries damage area matching samples Wilcoxon signed-rank and inspection. The results (p>0.05) still cannot think of two methods in the area of dentine caries loss difference, two methods of measuring the difference due to system error.Therefore, we can think that the diagnostic information such as the range and size of dentin caries can be obtained through the time-image corresponding to the minimum value of time-domain signal in the terahertz transmission mode.This study shows that terahertz imaging technology can provide a more accurate and effective diagnostic method without ionizing radiation for the early diagnosis of dentin caries and provide some morphological basis for clinical digitalization and minimally invasive caries removal.
Visible and near-infrared spectral reflectance is the basic database for research and application in color science and technology and remote sensing object classification and recognition.The principal component analysis (PCA) is widely used in spectral data analysis, spectral reconstruction, hyperspectral data dimension reduction, and remote sensing image classification. In this paper, a database of spectral reflectance from visible light to near-infrared of 150 leaves of 48 plants, including Salix, Cinnamomum camphora (L.) Presl, Dracaena marginata, and Jacaranda mimosifolia, etc. Which are common in park greenery of Yunnan, isestablished. The wavelength range from 400 to 1 000 nm with 4 nm intervals. The PCA wascarried out on the visible and from visible to near-infrared wavebands respectively.The measurement results show that the spectral reflectance of different vegetation leaves according to the same hue of red, green and yellow are the same, For the same plant,in the visible waveband, the spectral reflectances are quite different because of the different content of chlorophyll, lutein, carotene and anthocyanin in the body.The spectral reflectance of all plant leaves in the near-infrared waveband is only different in amplitude, while the spectral reflectance of the same plant does not change with wavelength.The PCA shows that the cumulative contribution rates of the first three principal components in the visible and visible near-infrared wavebands reached 98.62% and 94.97% respectively.The database and results of PCA provide support for the spectral reconstruction of natural objects, the multispectral imaging technology and the classification and recognition of the target of remote sensing images.
Sika deer antler caps are of great medicinal and economic value. Because of its hard texture, the finished product is generally presented as powder. It is difficult for consumers to determine the authenticity of sika deer antler cap powder from its appearance, which leads to endless series of counterfeit and adulterated products. Therefore, this paper proposes a FTIR technology and machine learning method to identify counterfeited and adulterated sika deer antler cap powder. This method can identify counterfeited sika deer antler cap powder by horse stag deer antler cap powder, sika deer bone powder, and adulterated sika deer antler cap powder by beef bone powder. This research’s sika deer antler caps, stag deer antler caps and sika deer bones are from five regions of the three provinces of Heilongjiang, Jilin and Liaoning. The samples are divided into 360 portions, including 120 portions of sika deer antler caps, 120 portions of red deer antlers caps and 120 portions of sika deer bones. The beef bone powder is purchased in Changchun Nanguan District Farmers’ Market. Adulterate the beef bone powder into 120 portions of sika deer antlers powder with 5%, 10%, 20%, 30%, 40%, and 50% for every 20 portions. Sample spectral data were collected by mid-infrared spectroscopy, preprocessed by multiple scattering correction (MSC), and sampled by the K-S method. After the training and test sets were divided by 2:1, Normalization and principal component analysis (PCA) dimension reduction was conducted on spectral data. According to the principle of cumulative contribution rate of the number of principal components≥85% and principal component characteristic value≥1, the first 7 principal components were selected to form the spectral data after dimensionality reduction. The recognition models of support vector machine (SVM), random forest (RF) and Extreme learning machine (ELM) were established by using full-spectrum (FS) data and PCA dimensional-reduction spectral data as model inputs. The results showed a difference between the authentic and counterfeit and adulterated products in the waveband of 1 300~1 800 and 2 800~3 600 cm-1. The difference between the pure sika deer antler cap powder and sika deer antler cap powder of the adulteration rate ≥10% was the most obvious. FS-SVM, PCA-SVM and FS-RF models all have excellent recognition effects in identifying fake and adulterated sika deer antler hat powder. The recognition rate of the training and test set is 100%, and the recognition rate of other models is less than 98%. From the perspective of simplified models, the modeling time of FS-SVM and FS-RF is 4 859.36 and 1 818.96 s respectively, while the modeling time of PCA-SVM is only 19.91 s. Therefore, PCA-SVM has the best overall effect among the six recognition models. The research shows that the method based on mid-infrared spectroscopy combined with support vector machine modeling can be used as a fast, accurate and non-destructive identification method for counterfeiting and adulteration of sika deer antler cap powder.
Chemical oxygen demand (COD) is an important indicator of organic pollution in water. How to quickly and accurately test the COD content of water is particularly important. The application of machine learning in the field of water quality inversion is increasing, and more research results have been obtained. Hyperspectral remote sensing has the advantages of high spectral-spatial resolution and multiple imaging channels, so it has great potential in retrieving water’s COD. This study uses different hyperspectral pre-processing methods to process the original hyperspectral data. It uses the hyperspectral data before and after processing to compare the inversion performance of different machine learning models and different hyperspectral pre-processing methods on the COD content of water. Firstly, 1 548 groups of COD content and corresponding hyperspectral data (400~1 000 nm) samples were collected by ZK-UVIR-I in-situ spectral water quality on-line monitor in Baodai River. In order to reduce the interference of spectral noise and eliminate the influence of spectral scattering, Savitzky-Golay (SG) smoothing, Multiplicative scatter correction (MSC) and SG smoothing combined with MSC methods were used to pre-process the original spectra. Secondly, the sample set is randomly divided into training set and test set, where the training set accounts for 80% and the test set accounts for 20%. A COD hyperspectral inversion model based on the four machine learning methods of linear regression, random forest (random forest), AdaBoost, and XGBoost was established for the pre-processed training set full-band spectrum. Moreover, three indexes of determination coefficient (R2), root mean square error (RMSE) and relative analysis error (RPD) were selected to evaluate the accuracy of the hyperspectral inversion model. The results show that random forest, AdaBoost and XGboost are all the better than linear regression. The prediction ability of the inversion model established by XGboost is the best whether the spectral data is processed or not, with R2 of 0.92, RMSE of 7.1 mg·L-1, and RPD of 3.4. Considering that the original spectrum may be redundant, the dimensionality reduction of the spectrum after SG smoothing and MSC processing is performed by principal component analysis (PCA), and the top ten principal components with a cumulative contribution rate of 95% are selected as the input variables of the model. XGBoost established the inversion model, and the results show that after PCA, the accuracy of the inversion model is improved, the RPD is 3.8, and the training time of the model is shortened from 72 seconds to 2.9 seconds. The above research can provide new methods and ideas for establishing hyperspectral inversion models of this water area and similar water areas.
To predict the luminescence spectrum of phosphor-coated white LEDs more conveniently and efficiently, GaN Blue LED chip and YH-S525M green phosphor and YH-C640E red phosphor from Hangzhou Yinghe Optoelectronic Materials Co., Ltd. were selected for preparing experimental samples. The monochromatic fluorescence spectra were measured respectively. The emission peak wavelength of the blue-chip is 453 nm, the emission peak wavelength of red and green phosphor is 631 and 526 nm respectively. The red and green phosphors were mixed with AB glue and coated on the blue-chip. The mass ratio of red and green phosphors was set as 1:3, 1.2:3, 1.4:3, 1.6:3, 1.8:3 and 2:3. The concentration of red phosphors was set as 7%, 9%, 11%, 13%, 15% and 17%. 3~5 samples were prepared under each proportion and concentration, and the luminescence spectrum of each sample was measured by HAAS-2000 high-precision fast spectral radiometer of Hangzhou Yuanyuan chromatography Co., Ltd. A total of 36 groups of SPD (spectral power distribution) data were obtained by normalizing the relevant data. The white light spectrum was regarded as the linear superposition of blue, green and red monochromatic fluorescence spectra. The corresponding emission spectrum was directly selected for blue and red peak terms, while two Gauss linear equations were used for fitting the green peak term, and the intensity determined the coefficient. Therefore, a prediction model of the white light spectrum was established. The circular search algorithm calculated the optimal values of the model parameters under 36 groups of experimental conditions, and the model’s goodness of fit was tested. R2 ranged from 99.33% to 99.88%. Then, the partial least squares regression method was used to establish the regression equation between the mass ratio, concentration of phosphors and the model parameters. Finally, a new method that can accurately predict white LEDs’ emission spectrum coated with red and green phosphors was obtained. The SPD of a group of newly prepared samples was used to test the prediction effect. The goodness of fit of the predicted spectrum is 99.62%, which proves that the prediction effect of this method is good. Based on the physical mechanism of phosphor-coated LEDs, the mathematical relationship between the mass ratio, concentration of phosphors and the white light spectrum is established more simply and effectively. Meanwhile, the interaction between the two phosphors was analyzed, and the broadening effect of the green phosphor spectrum was introduced to the prediction model. There is good universality, and this method provides a new idea for optimising the light source parameters of the phosphor-coated LEDs.
The paper investigated the inverse method for the surface materials and the proportions of the space object from long distances based on the scattering spectra. The research results shall provide the data references for space debris detection and forecasting. Firstly, based on the long-distance object detection physical model of scattering spectra, we first constructed the object parameter inverse physical model based on scattering spectra and provided the inverse algorithm for object surface material and its proportion based on the least norm theory method. By combining with the lighting characteristics, object material surface optical reflection characteristics, incidence, reflection and detector angle data, etc., using the multimodal fusion model of the bidirectional reflectance distribution function (BRDF) and characterizing the optical reflection characteristics of the complex material surface. We took the corresponding area in the BRDF as the parameter to be inverted and obtained the inversion algorithm of the object surface materials and its proportion information. Secondly, we performed the experimental validation by building an indoor scattering spectrum detection and acquisition system to perform the scattering spectrum detection and data acquisition of single material and multiple materials with different scales. We intercepted the effective wavelength range of 400~800 nm by preprocessing the scattering spectrum data. Combined with theoretical analysis and inversion algorithm, we took the samples with 4 kinds of materials and performed the material and its proportion inversion with equal proportional and non-equal proportion combination for the samples. The minimum, maximum and average errors of the equal proportion inversion are 0.8%, 13.6% and 4.9%. Moreover, the minimum, maximum and average errors of the non-equal proportion inversion are 6%, 12% and 9.25%. Therefore, according to the above testing results, the maximum average error for inversion is 9.25%. Once considering the error influence of 2.89% from the incidence light source, the maximum average error for inversion will be lower than 6.36%. So we suggested the average inversion error will be less than 10%. Thereby the accuracy of the inverse method is verified. Finally, take one failed satellite as an example. The proposed method was used to invert the materials and proportions of its on-orbit scattering spectra. Its surface materials consist of solar arrays, insulation film and carbon fiber plates, which matches well with the real situation. In summary, this paper has provided a new technical approach for the inversion identifying of space object materials and their proportions from long distances.
The analytical method of trace gold in geochemical samples by graphite furnace atomic absorption spectrometry(GFAAS) has been widely used. However, it is hard to figure out the appropriate matching parameters in practice in terms of the configuration of its determination conditions and temperature-rising program parameters. Due to this reason, it is of great practical significance to work out effective parameters quickly and accurately. The single factor test is carried out with lamp current, ashing temperature, and atomization temperature as independent variables and its parameters are set to be 6~8 mA, 300~500 ℃ and 2 200~2 400 ℃ respectively; The Box-Behnken test is done according to the Response Surface Methodology (RSM). The influence of three-factor and three-level surface design on the response value (absorbance) is analyzed; the significance level table is prepared, and the response surface test is completed; a prediction model of the quadratic polynomial regression equation is built analyze the significance. F=43.95, p<0.000 1 means that the model has high significance with its correlation coefficient of 0.985 1.Thefact that the correction coefficient of determination is 0.962 6 indicates that the model can explain more than 95% of the changes in response values; the response surface and contour map are drawn to regress and fit the test data. Judgement and analysis are made according to the shape of the response surface and the steepness of the contour. These optimal parameters as lamp current 7.12 mA, ashing temperature 412.32 ℃, and atomization temperature 2 311.61 ℃ are worked out. The results suggest that under an optimized condition, the average absorbance of national first-class reference material GBW07246a is 0.101 2, basically consistent with the predicted value of 0.108 0, and the relative error remains 6.30%; six national first-class reference materials, including GBW07243b are selected for 12 repeated tests, and the standard curve is drawn, and the results are read. The logarithmic deviation between the average value and the standard value of each reference material is less than 0.05, the relative standard deviation (RSD, n=12) is less than 10%, and both the accuracy and precision comply with GB/T 27417—2017 (Guide for confirmation and verification of chemical analysis for conformity assessment), indicating that the parameters of conditions for the determination of trace gold by graphite furnace atomic absorption spectrometry based on RSM model are accurate and reliable, which proves the correctness and feasibility of this model and achieves a good optimization result. This method is expected to be applied to determine and analyze other elements and in the method research of instrument analysis platform to find the optimal analysis and test conditions.
Isotope analysis has attracted much attention in various industrial fields dominated by the nuclear industry, and it has promoted the development of geology, materials science, chemistry and other related disciplines. In recent years, the optical isotope analysis method has attracted increasing attention. Mass spectrometry methods, such as multi-collector inductively coupled plasma mass spectrometry (MC-ICP-MS), thermal ionization mass spectrometry (TIMS) and isotope ratio mass spectrometry (IRMS), are the standard methods of isotopic analysis. However, they typically require complex sample pretreatment procedures and frequent instrumental maintenance. In this regard, optical isotope analysis methods possess their unique advantages.They can even meet the on-site real-time and rapid isotope analysis, which has already shined in nuclear industry isotope analysis and traditional stable isotope analysis. With the further development of key components of spectroscopy instruments and data processing methods, the performance of spectroscopy analysis, such as sensitivity, resolution and precision, has been greatly improved, so that optical isotope analysis methods have been developed rapidly and applied to the isotope analysis of environmental and geological samples. This article reviews the progress of the optical isotope analysis methods, classified into emission spectroscopy (atomic emission spectroscopy, molecular emission spectroscopy and Raman spectroscopy) and absorption spectroscopy (atomic absorption and molecular absorption) from the perspective of the principle of spectroscopic analysis. It mainly focuses on the basic principle, development history and important progress of these methods, and the advantages, and limitations compared with mass spectrometry are also briefly described. It also discussed the prospects of optical isotope analysis,especially the technical difficulties that still need to be broken through. This review will provide a reference for understanding the development of optical isotope analysis.
With the deepening of industrialization and urbanization, urban soil heavy metal pollution is becoming more and more serious. At the same time, traditional laboratory chemical analysis methods such as inductively coupled plasma mass spectroscopy have long analysis cycles and are prone to secondary pollution of the environment by experimental waste reagents. Portable X-ray fluorescence spectrometry is a testing method that can be used for rapid and non-destructive analysis directly in the field, and matrix effect is the most important factor affecting the testing accuracy and precision. The more commonly used calibration method is the traditional linear regression method, which is influenced by outlying values and still has large deviations in the processed data. The study attenuated the matrix effects during testing by adding the data of the major elements to the correction equation of the elements to be tested. In this study, heavy metals of Cr, Ni, Cu, Zn and Pb in soil samples from each campus of Jilin University was rapidly tested by portable X-ray fluorescence spectrometry under in situ to investigate the major elements that had the greatest influence on the matrix effect of each heavy metal element. The original Sherman equation was adjusted by combining the partial least-square method and the multiple linear regression method, and the new equation was used to correct for the matrix effect of each heavy metal element under the data of inductively coupled plasma mass spectrometry a reference. The differences between the data processed by this method and the traditional linear regression method were compared by statistical parameters, and the correlation between elements and samples was also analyzed by correspondence analysis. The results show that the major elements are the important factor affected by the matrix effect, and the matrix effect correction equation based on different major elements is effective, with applicability Cr>Pb>Zn>Ni>Cu. The quality of the corrected data was significantly improved, the coefficient of determination increased, the regression images were concentrated, the mean absolute error and root mean square error was further reduced. The correction effect was better than the traditional linear regression method. The matrix effect correction method mainly reduces the overall average error and discrete degree of the data by reducing the deviation of outlying values. The processed data meet the quantitative analysis requirements and can be extended to portable X-ray fluorescence spectrometry for rapid large area testing of heavy metals to detect environmental quality. At the same time, correspondence analysis is an analysis method between multi-dimensional data dimensions and multi-dimensional data dimensions. It has excellent results for classification and correlation analysis between multiple variables.
The returning of crop residues to agricultural soils are of great significance to the development of Green Agriculture and soil fertility improvement. In China, there are various types of crop residues with high abundance. It is essential to characterize phosphorus (P) speciation in typical crop residues to predict the crop availability after returning them to the agricultural fields. To date, liquid-phase phosphorus-31 nuclear magnetic resonance (31P-NMR) spectroscopy is a state-of-the-art technique for characterizing P species at the molecular level. However, there were limited investigations on the characterization of P speciation in crop residuals by 31P-NMR spectroscopy. Moreover, spectral peaks of different P forms, generally assigned based on the published literature, were significantly affected by sample properties (i.e pH), which resulted in large uncertainty and limited P forms to be identified. Therefore, with spiking experiments, this study used 31P-NMR spectroscopy to characterize molecular P species in different parts (straw, chaff and seed) of the typical crops, including corn, wheat, rice, cotton, soybean and peanut. The results showed that the total P content in all investigated crop residues was seed > chaff > straw. NaOH-EDTA extractable P ranged from 73% to 139% of total P, with an average value of 105%. Based on the spiking experiments, inorganic P forms (orthophosphate, pyrophosphate, tripolyphosphate) and organic P forms (phytate, α and β-glycerophosphate, adenosine monophosphate) were detected in the investigated samples. Additionally, as one type of orthophosphate diesters, deoxyribonucleic acid was first detected in this study. In all investigated straw and chaff samples, the major P species were orthophosphates, comprising 49.3%~71.6% of the NaOH-EDTA extracted P, while P in the seeds was mainly phytate (48.5%~82.9%). With correction for diester degradation, orthophosphate diester (17.1%~33.5%) was more than orthophosphate monoester (9%~13.5%) in crop straw samples. In contrast, the orthophosphate monoester and orthophosphate diester percentages in chaff samples were 8.8%~23.2% and 8.8%~24.6% respectively, and orthophosphate monoester was the main component in seed samples (57.6%~82.9%). It showed that the investigated crop residues, especially straw, probably release orthophosphate and orthophosphate diesters as labile P forms for subsequent crop uptake after returning to the soil. These results provide a significant scientific basis for crop residue returning and P fertilization management in agricultural lands.
As a Cenozoic antibody, chicken egg yolk immunoglobulin (IgY) has the characteristics of safety, stability and no drug residue. It has an inhibitory effect on a variety of pathogenic microorganisms. IgY is one of the ideal substitutes for antibiotics. However, it cannot be used on an extensive scale application to a certain extent because of its high production cost and low antibacterial activity caused by protease decomposition. Therefore, it is of great significance to improve its economic benefit and bioavailability using modification. In this study, catechin interacted with IgY to prepare its complex. It provides support for improving the antibacterial properties of IgY and preparing safer and more efficient antibacterial agents. The interaction mechanism between catechin and IgY was studied via UV-Vis, FS and FT-IR. The antibacterial properties of the IgY-catechin complex were studied by using IgY and a mixture of IgY and catechin as control. With the increase of catechin concentration, the UV-Vis absorption peak value of IgY gradually increased and showed a blue shift. The quenching type of IgY by catechins is mainly static quenching. The IgY and catechin combine to form a complex with a number of binding sites close to 1. The interaction types were van der Waals force and hydrogen bond. Compared with IgY, the content of β-folded and β-corner in the secondary structure of the IgY-catechin complex had no significant change, while the content of α-helix was increased and irregular convolution was decreased. It indicated that the conformation of protein was changed due to the introduction of catechin. Compared with IgY and a mixture of IgY and catechin, the antibacterial rate of IgY-catechin complex against Staphylococcus aureus was increased by 135.8% and 9.95% on average, respectively. When the concentration was greater than 0.05 mg·mL-1, the antibacterial rate against Escherichia coli was increased by 15.74% and 13.27%, respectively. Catechins and IgY could form a complex, which showed better antibacterial properties than IgY and mixture of IgY and catechin. This study is helpful in understanding the effects of catechins on the structure and function of IgY. It can also provide theoretical support for preparing safer and more efficient antibiotic substitutes. In addition, this study can supply theoretical guidance for the property changes of IgY during food processing.
To effectively realize the early warning of apple spoilage during storage, a 2D hyperspectral information representation method based on the mean fusion variance of the hyperspectral image pixel grey value is proposed, and the early warning model of apple samples based on Bhattacharyya distance (BD) is constructed. Firstly, to obtain effective spectral information, the hyperspectral image’s region of interest (ROI) was selected. At the same time, through the comparative analysis of 6 kinds of original spectrum preprocessing methods, and the full-band (371.05~1 023.82 nm) spectral curves represented by the pixel mean and variance were smoothed Savitzky-Golary (SG) for noise reduction, respectively. Secondly, the successive projection algorithm (SPA) combined with the two physical and chemical indexes of sample hue angle and water loss rate was used to extract the feature wavelengths spectrum information, and 7 (pixel mean representation) and 8 (pixel variance representation) common feature wavelengths in the two representation methods were extracted. Then, by analyzing the change of the sample hue angle with the storage time, the storage data corresponding to the data point with a significant turning point was determined and combined with the actual observation during the storage period of the sample, the 21st storage day was preliminarily defined as the spoilage benchmark of apple samples. In addition, according to the characteristic absorption wavelength of the chlorophyll of the apple samples (675 nm or so), the average spectral reflectance change trend graph was drawn, and it was found that the changing trend rose to the highest point on the 21st day, which was consistent with the hue angle analysis result. It shows that the apple samples were indeed spoilt from the 21st day. Thus the spectral information of the 21st storage day corresponding to feature wavelengths can be used as the spectral feature vector of the spoilage benchmark day. Finally, the early warning models of Bhattacharyya distance spoilage based on the mean pixel representation, variance representation and the fusion of the two representation variables were established, respectively. The results show that the early warning models based on the spectral representation information of the pixel mean fusion variance have further reduced volatility compared with their respective early warning models and can better reflect the degree of spoilage of the apple samples during storage. Therefore, the spectral feature information fused with the mean and variance of pixel grey value can more comprehensively characterize the quality changes of apples during storage, and the robustness and generalization ability of the early warning model is strong. The research results provide a new idea for using hyperspectral image information to early warning apple storage spoilage.
With the continuous improvement of living standards, residents’ requirements for urban vegetation are also increasing. Urban vegetation has become one of the important criteria to measure the livability of cities and plays a very important role in assessing and protecting urban biodiversity. Therefore, rational planning of urban vegetation is an important means of solving environmental problems and improve the quality of life. To sum up, monitoring urban vegetation becomes the main task, and the extraction of urban vegetation becomes the top priority. At present, the problems of urban vegetation extraction mainly focus on two aspects. Vegetation extraction is affected by region and species. On the other hand, Vegetation extraction is affected by topography and the shadow of buildings. In order to solve the above problems, this paper proposes a red edge-near infrared vegetation index model based on DEM. In this experiment, worldView-3 remote sensing images with red-edge bands and high spectral and spatial resolution after radiation calibration and atmospheric correction were first selected. Then, according to the high sensitivity of the Red Edge band to vegetation and the good correlation between the spectral data within the red edge and the parameters reflecting vegetation growth, the DEM model and the spectral difference between the red edge were adopted to remove the shadow of terrain and buildings effectively. Finally, the red-border spectrum-near-infrared spectrum is constructed based on the feature space within the visible band, and the red-border near-infrared vegetation Index model is constructed. At the same time, the urban vegetation extraction is compared and analyzed with NDVI and EVI. The analysis methods are qualitative and quantitative. The former is to extract vegetation images for visual analysis by using a real vegetation image reference map and model. The latter is a quantitative analysis using user accuracy, producer accuracy, overall accuracy and Kappa coefficient. The result of the qualitative experiment shows that the DEM model can effectively remove the shadow of buildings and terrain by combining with the different information of the red edge band between shadow and vegetation. After removing the shadows, NDVI and EVI were used to extract urban vegetation from the images, which made the buildings and road pixels confused in the vegetation, resulting in the problem of misclassification and omission. However, RENVI can effectively eliminate the confusion between shadow pixels and vegetation pixels, accurately extract urban vegetation, reduce redundancy, and increase vegetation index information. The quantitative experimental results show that the RENVI model can accurately extract urban vegetation compared with NDVI and RVI. The overall accuracy of the 3 images is 89%, 81.4% and 91.8% respectively, and the Kappa coefficient is 0.852 8, 0.791 3 and 0.905 2 respectively. In summer, this method can effectively improve the extraction precision of urban vegetation and obtain a better visual effect of extraction.
Agriculture is not only the basic pillar of national economic development but also the basic social development industry. With the progress and development of agricultural remote sensing technology in China, many remote sensing satellites, such as Gaofen-1, 2 and 6, have been launched, providing important technical support for agricultural situation monitoring, crop growth and agricultural industrial structure adjustment in China. Agricultural remote sensing has become an important means of agricultural science and technology innovation and precision agriculture. LAI is an important key index that can be used to measure vegetation canopy’s physiological and biochemical characteristics. LAI can not only be used to evaluate the initial energy exchange on the surface of the vegetation canopy but also provide corresponding quantitative structural data and reflect the spectral energy information of the vegetation canopy. At the same time, the leaf area index is a key input to the production model of the terrestrial ecosystem and land use process in the context of terrestrial climate change. In addition, when it is found that the vegetation canopy is directly or indirectly affected by human activities and climate change, LAI is also a very important measurement standard for terrestrial ecosystems to cope with climate change. There are few kinds of researches on leaf area index inversion of GF-6 WFV remote sensing image, and the traditional spectral vegetation index model has a weak mechanism and stability. This article is based on GF-6 WFV remote sensing image in the Luancheng county as the experimental zone. Through spectral vegetation index and the measured leaf area index structure of 5 kinds of traditional spectral vegetation index model and 15 kinds of red edge of ratooning buds to participate in the spectrum of the vegetation index model inversion leaf area index, evaluating model using R2 and RMSE. At the same time, using the actual leaf area index was not involved in the modeling, model and using the MODIS LAI product authentication model. The experimental results showed that: (1) Correlation analysis showed that, on the whole, 20 spectral vegetation indexes were significantly correlated with LAI, with the correlation coefficient above 0.4, and the spectral index correlation of red-edge participating structures was higher than that of non-red-edge participating structures, among which NDSI had the best correlation. (2) Fitting analysis showed that, on the whole, 20 spectral vegetation indexes had a better fitting effect with LAI, among which NDS13 had the highest fitting accuracy, R2 was 0.803, and RMSE were 0.301 2. R2 and RMSE was 0.803 and 0.301 2, respectively. (3) As seen from the spatial distribution of inversion maps, the inversion results were in line with the actual local situation. (4) The verified model of measured LAI showed that the overall LAI fitting of measured LAI and NDSI3 model inversion is good, with R2 and RMSE of 0.804 and 0.312 5 respectively, indicating that this model can effectively invert the growth status of maize at the milk stage. (5) The verification model of MODIS LAI products indicated that the LAI of MODIS mean it is higher than the LAI of GF-6, mainly due to the serious mixing of MODIS image pixels and the low spatial resolution. In summary, GF-6 WFV has a strong ability to invert LAI, and the spectral vegetation index model with red edges in its image can effectively invert LAI at the milk stage, providing a basis for maize growth potential monitoring.
Shadows, mixed pixels and spectral variations are common in remote sensing images in mountainous karst areas due to complex terrain and broken surface. Dimidiate pixel model (DPM) based on multispectral remote sensing is difficult to accurately extract rocky karst desertification (KRD) information in areas with significant spectral variations and shadows. The mixed pixel decomposition technology of hyperspectral remote sensing can decompose complex mixed pixels into the mixed ratio corresponding to the pure landmark spectrum and each landmark spectrum, which provides the possibility for obtaining higher precision rocky desertification information in complex mountainous areas. However, due to the changes in many factors such as illumination, environment and atmosphere, the end members will vary to varying degrees, which will result in significant errors in the process of mixed pixel decomposition. Secondly, it is difficult to directly obtain the pure landmark spectrum from mountain images with complex terrain and strong surface heterogeneity and establish a spectrum library to deal with spectral variation. Therefore, the focus of current studies is how to deal with spectral variation and terrain effect in this case and obtain effective and accurate information extraction of rocky desertification. In order to solve the above problems, the generalized linear mixed model (GLMM), which simulates the reflectivity change of ground objects caused by illumination conditions and considers the spectral variation at each wavelength interval, was adopted to reduce the influence of spectral variation and terrain effect in the process of information extraction of rocky desertification in karst areas. First of all, the typical representative spectra of main ground objects (vegetation, bare rock and bare soil) in the karst area were extracted from GF-5 hyperspectral images. Then the spectral variation of each pixel under different illumination was simulated based on the extracted landmark spectrum, and the most suitable spectral combination was selected to decompose the pixels to get the best unmixing effect. In order to verify the reliability of the method, the visual interpretation results of high-resolution images were used as a reference to verify the prediction results of the method, and the fully constrained least squares linear spectral unmixing (FCLSU) DPM without considering end-member variation were selected for comparison. The results showed that it was necessary to consider shadows, mixed pixels and spectral variation in karst mountainous areas with highly complex terrain. The total accuracy of GLMM in rocky desertification information extraction reached 84.89%, significantly higher than that of the other two methods (59.68% and 67.34%). The accuracy of GLMM in the illumination area and shadow area was similar to that of GLMM in the illumination area and shadow area. However, the other two were quite different, and the shadow area was lower than the illumination area, which reflects that GLMM can effectively reduce the influence of terrain effect and improve the accuracy of information extraction of rocky karst desertification.
As an important nutritional component in milk, fat is an important index to evaluate milk quality. Hyperspectral image technology can provide tens to thousands of bands of data and can reflect the subtle spectral differences of different components in milk. On the other hand, there is often a strong correlation between adjacent bands, which increases the amount of calculation and easily causes problems such as dimension disaster. Therefore, it is very important to select bands for hyperspectral data. This paper proposes a PLS-ACO feature band selection method combined with a genetic algorithm to form a new feature band selection method of PLS-ACO-GA. The two methods proposed in this paper are based on ant colony optimization. The absolute value of the regression coefficient of the PLS regression model is the main basis for evaluating the importance of wavelength, which is used as the heuristic information of ant colony optimization. Ant colony optimization is used for intelligent search, combined with genetic algorithm to produce more excellent characteristic band combinations. To avoid that pls-aco algorithm only obtains the optimal local solution. The optimal band combination can better reflect the information of fat composition in milk. By calculating the wavelength contribution rate, the optimal band combination is selected and compared with the spectral feature selection methods of genetic algorithm, cars algorithm and basic ant colony optimization. Finally, the prediction effects of the PLS regression model under different feature selection methods are compared. PLS-ACO, PLS-ACO-GA, CARS, GA and ACO screened 18, 16, 40, 43 and 42 characteristic bands in the spectrum of milk samples, respectively. The PLS prediction model after the PLS-GA-ACO screening band has the best effect. The prediction sets R2P and RMSEP are 0.997 6 and 0.062 2 respectively, followed by PLS-ACO, and the prediction sets R2P and RMSEP are 0.997 0 and 0.077 8 respectively. PLS-ACO and PLS-ACO-GA reduce the number of characteristic bands and improve the accuracy of the model. MLR, RFR and PLS regression prediction models are established based on PLS-ACO-GA data after characteristic band selection. The R2P and RMSEP of the MLR prediction model are 0.997 6 and 0.062 3 respectively. R2P and RMSEP of the RFR regression model were 0.999 9 and 0.003 0 respectively, and R2P and RMSEP of the PLS regression model were 0.997 6 and 0.062 2 respectively. RFR model performs best among the three regression prediction models. The results show that hyperspectral technology can detect the fat content in milk, which provides a new, rapid and non-destructive method for the detection of fat content in milk.
Panax notoginseng powder is the main consumption and commodity form of panax notoginseng. There are shoddy or even adulterated phenomena in the market. As panax notoginseng powder is a powdery material, it is not easy to distinguish with the naked eye. In order to identify the quality grade of panax notoginseng powder, visible near-infrared hyperspectral imaging technology was used to identify the panax notoginseng powder with different quality grades. The taproots of panax notoginseng of 30 heads, 40 heads, 60 heads and 80 heads were ground into powder to prepare samples. The hyperspectral image of 384 samples of four quality grades was acquired by using a visible near-infrared hyperspectral imaging system(400.68~1 001.612 nm). Region of interest (ROI) was extracted from the hyperspectral image, and the average spectral value of samples was calculated. 384 samples of panax notoginseng powder were divided into training sets and test sets in a ratio of 2∶1. The original spectra of panax notoginseng powder were preprocessed using multiplication scatter correction (MSC), Savitzky-Golay (SG) and standard normal variable (SNV), and the support vector machine (SVM) was employed to form the classification models based on MSC, SG and SNV. By comparing the classification accuracy of SVM models based on MSC, SG and SNV, it was found that SNV had the best effect on preprocessing. Iterative reserved information variable (IRIV), variable combined cluster analysis (VCPA) and variable combined cluster analysis and iterative reserved information variable (VCPA-IRIV) were adopted to extract feature wavelengths from the spectra after SNV pretreatment, and the SVM was employed to form the classification models based on feature spectra and original spectra. By comparing the range of feature wavelengths and the classification accuracy of SVM models based on IRIV, VCPA and VCPA-IRIV, it was found that VCPA-IRIV, which combines VCPA and IRIV, had the best effect on feature selection. VCPA-IRIV extracted 18 feature wavelengths to participate in the modeling instead of the full spectra, and the algorithm can reduce the complexity of the model while maintaining the model’s classification accuracy. In order to improve the classification accuracy of the model, the gravitational search algorithm (GSA) was introduced to search the optimal parameters(c,g) in the SVM model and compared with Grid Search (GS). The results indicated that the VCPA-IRIV-GSA-SVM model has the best classification effect, and the classification accuracy of the test set reached 100%. Thus, it is feasible to use visible near-infrared hyperspectral imaging technology to identify the quality grade of panax notoginseng powder. This method references the quality grade identification of panax notoginseng powder in the market.
There are much rare wood in the Pterocarpus genus. Rosewood is very similar to different tree species. Traditional wood identification methods are mainly based on wood anatomy, and the wood species are judged by observing the structural characteristics of wood slices. Although this method has a high identification accuracy, its identification process is relatively complex, and the technical difficulty is relatively high. Corresponding to wood anatomy is the identification method of wood tree species using image or spectral information. Although this kind of method has a relatively simple identification technology, it often fails to achieve a good identification effect in identifying similar wood species belonging to the same genus. This paper proposes a wood species identification method based on the fusion of spectral features and texture features of wood section. This method has a simple identification process, a high degree of automation, and a high identification accuracy. First collected by digital camera and a spectrometer wood, slice image information and spectral information, and then respectively using texture feature extraction method and spectrum feature extraction method to extract the characteristics of two kinds of the feature vector, then using the feature level fusion method based on canonical correlation analysis to these two characteristics vector fusion, finally using support vector machine (SVM) for the fusion of feature vector classification recognition. In order to verify the effectiveness of the method, three sections of 5 species of Rosewood species commonly found in the market were taken as research objects to identify these wood species. The experimental results show that the highest recognition accuracy is 80.00% when texture features are used alone, 94.40% when spectral features are used alone, and 99.20% when fused features are used. In this paper, these 5 wood species were mixed with 30 other wood species, and the number of mixed wood samples could reach 1 750. The experimental results show that the method can identify 35 wood species, including Rosewood, and the accuracy rate is 98.29%. To sum up, the texture features and spectral features of wood can effectively complement each other to further improve the recognition accuracy. At the end of this paper, the proposed method is compared with the current mainstream method, and the results show that the wood species identification method described in this paper is higher than the current mainstream method.
Based on fiber grating to achieve picosecond-level delay, a microsecond-level cascade structure combining fiber grating and single-mode fiber is proposed. This structure can achieve a narrow wavelength with a center wavelength of 1 550~1 553 nm and a spacing of 1 nm. The reflective delay line has four different delays: 1, 1.5, 2 and 2.5 μs. The single-wavelength-reflected chirped Bragg fiber grating is connected with a 103 m single-mode fiber to form a delay unit, and then an optical circulator cascades the four delay units and uses a fiber reel with an inner radius of 3 cm to integrate the transmission fibers of the four delay units. With the help of the mirror function of the fiber grating, the optical signals of different wavelengths are controlled to pass through different transmission distances to achieve the purpose of corresponding time delay. In this article, through the simulation analysis of the reflection spectrum of the chirped fiber Bragg grating, it can be found that the side lobes of the adjacent reflection spectrum will overlap. Therefore, six apodization functions are used to filter the side lobes. The results show that: the apodization function has different filtering effects on the side lobes of the reflection spectrum. The Cauchy apodization function can filter the side lobes and has the least impact on the reflection spectrum envelope. After Cauchy apodization, the reflectance of optical signals of different wavelengths can reach 1 in the range of the corresponding center wavelength of 1 nm, and the reflectance in other ranges is 0. Because the use of fiber reel to integrate the delay unit transmission fiber will produce a certain loss, the bending loss is simulated and analyzed. The results show that when the bending radius is the same, the loss is proportional to the working wavelength; when the working wavelength is the same, the bending loss is inversely proportional to the bending radius. When the bending radius is greater than 2.9 cm, the bending loss curve changes smoothly and tends to zero. Therefore, when the inner radius of the optical fiber winding reel is 3 cm, it is ensured that the volume is reduced without excessive loss. The waveforms of signals with a frequency of 2 000 Hz after different transmission distances are tested by a TDS784D oscilloscope. The results show that the signal parameters remain unchanged after 3 m and 5 km transmission lines. After long-distance transmission, the original signal characteristics can still be maintained. Therefore, the use of a 103 m transmission line can achieve the delay. The W-GGL optical power meter measured the output power at different frequencies. Compared with the output power of straight fiber, when the bending radius is 2~3 cm, the deviation is large, when the bending radius is equal to 3 cm, the deviation is 0.18 dBm, and when the bending radius is greater than 3 cm, it will approach infinitely. Therefore, the inner radius of the winding reel is set to 3 cm conforming to the loss range of the optical fiber delay line.
With the continuous development of ground remote sensing technology, more and more crop canopy spectral sensors are applied to agricultural production, among which the Greenseeker plant spectral detector is widely used. Greenseeker can obtain crop canopy spectral information, normalized vegetation index (NDVI) data and divide fertilization management zoning. Targeted variable rate fertilization can be realized according to fertilization management zoning. The fuzzy c-means (FCM) algorithm is common for dividing fertilization management zoning, but the FCM algorithm has certain limitations. In the calculation process, the iterative calculation will be carried out continuously with the increase of data, which will affect the speed of fertilization management zoning. Based on the FCM algorithm, a model-based fuzzy c-means (MFCM) algorithm is proposed. In dividing the fertilization management partition, this algorithm does not have to iteratively calculate all the data every time a group of data is obtained, which can improve the speed of dividing the fertilization management partition. The NDVI data of soybean and maize were obtained through the established crop canopy spectral information collection platform. The fertilization management zoning was divided by the MFCM algorithm, and the division effect was evaluated by evaluation index contour coefficient (SC) and adjusted rand index (ARI). The results show that with the increased NDVI data, the MFCM algorithm can partition fertilization management partition faster than the FCM algorithm. The MFCM algorithm is 0.02~0.15 seconds faster; the MFCM algorithm is 0.07~0.51 seconds faster in dividing maize fertilization management zoning. By calculating the indexes SC and ARI to evaluate the effect of dividing fertilization management zoning, it is found that when dividing different NDVI data, the maximum difference of SC value is 0.022, indicating that the effect of dividing fertilization management zoning by the two algorithms is not different; The ARI value is sensitive to data changes. It can be maintained above 0.7 after the NDVI data volume reaches 6 000, but it will decrease significantly when the NDVI data changes.
On the regional scale, the late frost damage to winter wheat after jointing showed a spatial difference which determines that the sub-regional measures against the frost damage should be implemented. Broad-waveband spectral indices based on the Sentinel-2 satellite were proposed in this study to predict yield reduction rates of winter wheat. It is of great significance to disaster assessment and production management decision-making. Based on the artificial frost simulation experiments, the canopy reflectance data measured by ASD FieldSpec® 3 spectroradiometer were simulated to the Sentinel-2 wavebands using spectral resampling. And then, the nineteen published spectral indices and three new forms of wavelength random combinations (simple ratio, simple difference, and normalized difference) were used to construct the linear regression models with winter wheat yield reduction rates. In every form, broad-waveband spectral indices with the top three coefficients of determination were selected as the candidate indices. Aiming at the frost event in the Shangqiu area, all candidate indices were calculated using the Sentinel-2 reflectance data and used to predict winter wheat yield reduction rates, which were validated by the measured yields of the ground sampling points. The results indicated that: (1) With the decrease of the treatment temperatures, canopy reflectance shows a decreasing trend in the near-infrared region, but increased in the visible and short-waveband infrared regions. (2) Most of the nineteen published spectral indices were significantly (p<0.001) correlated with yield reduction rates, regardless of whether the canopy reflectance data were before or after resampling. The twelve candidate spectral indices screened out have good linear regression accuracy for predicting the yield reduction rates of winter wheat and the coefficient of determination above 0.631 in the calibration and the validation datasets. (3) The accuracy of candidate spectral indices calculated from sentinel-2 satellite data showed that the three spectral indices, including the band B9 failed to pass the significance test, and the other nine spectral indices all passed the extremely significant test. The two spectral indices (B8a-B12 and B8-B12) based on the combinations of the B8, B8a, and B12 had good accuracy. The coefficient of determination was 0.543 and 0.492, the root means square error was 8.510% and 8.971%, respectively. Further, B8a-B12 and B8-B12 were found to conform to the simple difference form, which was considered the optimal combination of the broad-waveband spectral indices predicting yield reduction rates of winter wheat. The research results revealed that the response mechanism of canopy reflectance at early spike development stage of winter wheat under different low-temperature stress, indicating that Sentinel-2 broad-waveband spectral indices have good accuracy in predicting the yield reduction rate of winter wheat. It is feasible to predict yield reduction rate at a regional scale after frost and has a guiding role in formulating frost disaster measures in different regions.
The purpose of grafting is to improve the ability of plants to resist soil-borne diseases and abiotic stresses. The early detection of the grafting healing state of melon is an important demand for the current industrial development of nursery plants. Based on the standard normal variable transformation savitzky Golay smoothing second derivative (SNV-SG-SD) preprocessing, this paper proposes a competitive adaptive reweighting (DIS-CARS-SPA) feature extraction algorithm fusing grafting difference information. Establishes a radial basis function support vector machine (GS-RBF-SVM) classification model based on grid optimization, The early classification detection of melon grafting healing state based on hyperspectral imaging was realized. Firstly, hyperspectral images of grafted survival seedlings and non-survival seedlings with pumpkin as rootstock and melon as scion were collected within 1~7 days of the healing period. Nine spectral preprocessing methods, two feature extraction algorithms and five optimization algorithms, and four kernel function support vector machine (SVM) classification models were used for analysis. The results show that the best is SNV-SG-SD spectral preprocessing, DIS-CARS-SPA feature extraction and GS-RBF-SVM classification model. Further analysis using the model shows that the classification accuracy of different types of binary classification on the same day can reach more than 99% on any day within 1~7 days of the healing period. More than 90.17% of the grafted seedlings survived on different days; More than 97.03% of the grafted non-survival seedlings could be classified on different days. On different days and types of 14 classifications, it can reach 96.85%, which is 0.59% higher than the cars-spa feature extraction method without fusion of grafting difference information and 3.37% higher than the method without only preprocessing feature extraction. The results show that the proposed method can not only realize the two classifications of grafted survival seedlings and non-survival seedlings on the same day but also the two classifications of the same type on different days and the multi-classification of different types on different days. In practical application, it can advance the classification time to the first day after grafting (3~4 days for naked-eye observation and 1~2 days for machine vision technology). At the same time, the third day is the difference between mutation days of grafted survival seedlings and non-survival seedlings. The state of grafted survival seedlings can be divided into three stages: weak, medium strong, and the state of non-survival seedlings can be divided into two stages: weak weaker. This conclusion can provide effective guidance for the production of grafted melon seedlings and has a certain theoretical and practical value.
Cervical cancer is the fourth incidence rate of cancer in women. If we can diagnose cervical cancer and cervical intraepithelial neoplasia early, we can greatly improve survival. The existing diagnostic techniques have the problems of high false-positive rate, low specificity, low sensitivity, time-consuming and high price. Raman spectroscopy is a new and reliable technology which can analyze the molecular structure of substances and the chemical composition of human tissues. In medical research, Raman imaging has been successfully applied to nasopharyngeal carcinoma, gastric cancer, lung cancer, esophageal cancer, renal tumor, cerebral cancer, etc. This review summarizes the key research of Raman spectroscopy in cervical cancer in the recent five years. Raman technology has been used in the study of cervical cancer for decades. In the past five years, we have studied the influence of inflammatory factors on the diagnosis, the differentiation of cervical squamous cell carcinoma and adenocarcinoma. This review summarizes the literature in recent five years from histology in vivo, histology in vitro, cytology and blood. It also summarizes the data processing methods, excitation wavelength, Raman wave number, and representative substances. The existing literature has proved that the specificity and accuracy of Raman spectroscopy in the diagnosis of cervical cancer can reach more than 90%, which is no less than the traditional hematoxylin-eosin (HE) staining. Compared with HE staining, Raman technology has the advantages of no staining, no fixation, less demand for professionals, faster and so on, which provides another feasibility for the diagnosis of cervical cancer. However, more research and evidence are needed to fully demonstrate the role of Raman spectroscopy in the diagnosis of cervical cancer before it is used in the clinic. We are also looking forward to more samples and more research.
In this study, the chlorophyll fluorescence analysis was used as a technical means to study the effects of PAHs (Phe) stress in soil on chlorophyll fluorescence characteristics and light energy distribution parameters of Glycine soja. The results showed that Phe stresses can decrease PSⅡ activity center and the electron transfer ability, resulting in the decrease of the light energy utilization ability, especially for the use of the strong specular ability. Under 200 mg·kg-1 Phe stress conditions, Fv/Fm, qP, ENR and NPQ were changed, and slow light inhibition occurred in G. soja leaves, which reduced the electron transport capacity and photosynthetic reactivity of the photosynthetic electron transport chain. Under the control of different light intensity and the increase of concentration of Phe stresses that G. soja leaves chlorophyll fluorescence response curve ФPSⅡ and qP parameters showed a trend of decrease, increase of NPQ launched the PSⅡ cycles way excitation energy dissipation of excess radiation, in order to maintain the normal physiological function of photosynthetic institutions. Those parameters such as Fm, Fv/Fm, Fv/Fo and PIABS decreased with the increasing concentration of Phe, which means that the soils Phe stressing subdued the photochemical activity of PSⅡ of those G. soja. Based on the study of electronic supply and transmission capacity at electronic donor side and receptor side of the PSⅡ found that on 0.3 ms (K point) of the OJIP curve of Phe stressed G. soja leaf, the fluorescence intensity increased the activity of OEC decreased. Phe stressing also caused the increase of the fluorescence intensityat the J point and I point on the OJIP curve of Phe stressedG. soja leaf. It showed that the Phe stressing reduced the electronically acceptability at the electronic receptor side of PSⅡon the leaves of G. soja, and made the electronic from QA to QB transfer blocked. The optical energy absorption and distribution parameters of seedling leaves of G. soja were influenced by Phe stressing. With the increase of soil Phe concentration, theratio of optical energy absorbed by PSⅡ reaction center and used for electron transfer after Q-A and the energy absorbed by each unit reaction center and used for electron transfer was reduced in the leaves of treated G. soja. It means that the proportion of optical energy captured by the reaction center and used for the photochemical reaction was reduced, and the proportion used through the invalid heat dissipation was increased. It could be concluded that there were three important reasons that generated the reduction of activity of PSⅡ reactive center of G. soja leaves under the soil Phe stress, which was the damage of OEC at electron donor side of PSⅡ, the electron transfer ability reducing at the electron acceptor side of PSⅡ and the change of the distribution and utilization of optical energy. This studise on the chlorophyll fluorescence analysis technique could provide guidance for the effect mechanism of plant photosynthesis to PAHs (Phe) stress.
Micro-XRF analysis technology is one of the non-destructive analysis methods that use tiny X-Ray beams to irradiate samples and then analyze fluorescence spectra and observe the components of the samples. It has the characteristics of high sensitivity, high efficiency and high accuracy. In this experiment, The Micro-XRF spectrometer (M6 JETSTREAM) was used to scan the core samples of the ZK3801 drilling in Dongguashan copper mine, Anhui province. It can analyze the distribution characteristics and combination relationships of 17 elements in different parts. The results show that (1)The high-value spatial distribution regions of Cu and Fe do not overlap basically, and the distribution ranges of S and Fe are highly overlapped, Ni, Bi, Pb, Zn, Si and Na are closely related to Cu, while Ti, Al and K have a weak correlation with Fe; (2)In the vertical direction, as increasing depth, the content of Fe increases gradually, while the content of Cu and other elements shows a decreasing trend; (3) The element distribution is modified by the middle Carboniferous submarine jet sedimentation and mineralization and magmatic-hydrothermal mineralization;(4) The ore minerals of the drill hole are mainly pyrrhotite, chalcopyrite and pyrite, with a certain combination law in the vertical direction. The gangue minerals are mainly quartz, garnet and diopside; Analyzing the spatial distribution of elements, correlations, and mineral combinations and distribution relationships can provide new understanding and new evidence for the enrichment and migration of elements, mineralization mechanisms, genetic models, and environmental, geological processes. Moreover, combined with the distribution pattern of the geochemical halo of the deposit, trace elements can be used as indicator elements to find the main mineral species and provide a basis for deep prospecting. Additionally, it can filter out the information and location that we are interested in quickly. It can provide powerful technical support for different scales and different levels of requirements for screening various fine parameters in the later stage.
The gemological and spectroscopic properties of the Madagascar scapolite is studied based on analyses of fifteen samples using EMPA, FTIR, Raman spectroscopy, UV-Vis Spectroscopy, fluorescence spectroscopy and some gemological instruments. The gemological characteristics of Madagascar scapolite are consistent with the theoretical values of scapolite; The samples are uniform in color and have a glassy luster. The raw stone crystal is relatively intact. Longitudinal stripes and maroon impurities are commonly seen on the surface of them. Iridescence can be seen on the surface of some samples, and a variety of inclusions can be seen inside the samples, such as biotite and colorless crystal inclusions. The infrared spectrum analysis shows that absorption peaks of 1 039, 1 105, 1 196 cm-1 in the fingerprint area are attributed to the Si(Al)—O group. 752 cm-1 peak is due to Si—Si(Al) stretching, 551, 687, 624 cm-1 peaks are due to O—Si (Al)—O bending vibration. Bending vibration of Si—O—Si associated with Na(Ca) —O stretching jointly results in a 459 cm-1 peak. 416 cm-1 is due to the bending vibration of Si—O—Si. Absorption peaks related to functional group area are mainly due to different vibrational modes and frequencies of CO2-3 (2 499, 2 629, 2 964 cm-1) and O—H(3 530 and 3 592 cm-1), which are diagnostic for the identification of scapolite. The Raman Spectroscopic analysis indicates that the bending vibration of bridge oxygen produces 459 and 538 cm-1 peaks; Al—O vibration leads to a 775 cm-1 peak. The vibration of SiO4 tetrahedron unit generates 1 114 cm-1. UV-Vis spectrum shows 379 and 420 nm, which are caused by electron transfer between Fe2+ and Fe3+ in tetrahedron position. The yellow color of Madagascar scapolite is due to transition metal elements. The intensity of the 420 nm peak directly affects the color depth of scapolite. Analysis of 3D luminescence shows a relatively uniform luminescence phenomenon, which shows two fluorescence peaks, one strong and one weak, mostly centered at 302 nm(λex)/343 nm(λem). The EMPA analysis result indicates that the sample belongs to Dipyre in the scapolite series. The Ma value is around 66%~69%, and the average value is 68.1%, and with the increase of the Ma value, the refractive index decreases. As a nondestructive testing technique, spectrum testing is suitable for identifying gem varieties. It is of great significance for the identification of Madagascar scapolite. It provides data support for the traceability of origin and the differentiation of scapolite varieties.
In the atmospheric visibility observation, most of the related research focus on daytime observation, while the researches on nighttime observation are rare, and the research on the continuous observation of day and night are rarely reported. At present, there is no automatic atmospheric visibility observation instrument developed by the definition of visibility at home and abroad. In order to solve this problem, based on CCD digital camera technology, the principle of artificial observation optics is simulated, and a method of continuous observation of atmospheric visibility is proposed. This method is based on the visibility calculation formula of the target. It modifies the system parameters in the day and night mode, which can effectively eliminate the observation error caused by the external environmental factors and the internal factors of the camera system. In order to verify the effectiveness of the algorithm, three sets of principle prototypes based on the method are built for different situations such as sky occlusion, semi occlusion and open space (different situations will affect the brightness of the observation environment, to test the system’s resistance to stray light and adaptability to different environments). They are using the built digital photography visibility system (DPVS) to observe the actual atmospheric visibility at a minute level in the Beijing area. Observation experiments show that the observation system based on this method has a wide observation range and can effectively adapt to all kinds of complex weather conditions. It has a good observation effect in different weather conditions such as rain, snow and haze, and the DPVS system can respond quickly and correctly no matter the visibility changes rapidly or slowly. Through the comparative analysis of the observation results of DPVS, scatterometer and transmission instrument, it is found that there is a high correlation between DPVS and the observation results of the former two instruments: 0.973 1, and the observation performance is similar, with the average relative error of -1.54% and the root mean relative square error of 8.82%. The maximum relative error of this algorithm is -14.11%. According to the World Meteorological Organization (WMO) MOR, if the maximum relative error of the visibility meter is less than 20% within the full range, it is considered a standard visibility meter and can be used in actual observation. The DPVS system based on this algorithm meets the observation standard and can be practical. Moreover, the observation cost of the DPVS system is much lower than that of the scatterometer and transmission instrument, so it has a good prospect and application value.
NO2-N is an important parameter in water bodies and can quickly detect organic pollution parameters. It is of great significance to the assessment of water quality. However, traditional methods are complicated in operation, subject to many interference factors, long measurement time, cannot reflect water quality changes in time, and cannot provide timely and effective early warning. For sudden water pollution incidents, because of the shortcomings of traditional methods, it is of great significance to explore accurate, real-time, and environmentally friendly detection methods for the NO2-N content in environmental water bodies and drinking water. This experiment is to study the use of superior grade pure reagents to prepare 10 concentrations of NO2-N nitrogen standard solutions (0.02, 0.04, 0.06, 0.08, 0.1, 0.12, 0.14, 0.16, 0.18 and 0.2 mg·L-1), using the OCEAN-HDX-XR micro-fiber spectrometer to scan 10 times the transmission spectrum of the NO2-N solution of each concentration in the range of 181.1~1 023.1 nm. Take the average value as the original transmission spectrum of the NO2-N solution of each concentration, and then take the NO2-N content of the solution as the dependent variable and the original transmission spectrum as the independent variable. Use the method of variable feature importance in random forest regression to screen the feature variables. Based on the cross-validation method, the number of the most stable model variables is selected, and the NO2-N optimization random forest inversion model is established. The results of the study are as follows: (1) The variable explained rate (Var Explained) of the random forest model established by the whole band (Var Explained)=76.49%, and the mean squared residuals (Mean of squared residuals)=0.000 688; In the sensitive band of salt inversion, 195.1 nm has the highest importance value, and the leave-one-out crossover method is used to find that the random forest model has the lowest root mean square error when 19 spectral characteristic variables are used to screen the optimized random forest established by spectral characteristic variables Variable Explained rate (Var Explained)=83.45%, Mean of squared residuals (Mean of squared residuals)=0.000 552. Variable screening effectively reduces the amount of spectral data and provides a basis for the establishment of the optimization model; (3) Model verification of the established model, including the full-band random forest model test set R2=0.820 3, RMSE=0.03, test set R2=0.979 3, RMSE=0.01, optimized random forest model test set R2=0.873 4, RMSE=0.022, test set R2=0.979 8, RMSE=0.008, after comparing the full-band random forest model with the optimized random forest model, it is found that the optimized random forest model test set and test The interpretation and accuracy of the set model are higher than the full-band random forest model, indicating that the optimization method can not only effectively reduce the spectral dimension, but also has positive significance for finding the sensitive band of NO2-N spectrum and establishing a high-precision NO2-N inversion model. . Based on the above test results, an inversion method for optimizing the hyperspectral water quality NO2-N parameters of the random forest model is proposed, which provides a new method for the dynamic detection of water quality NO2-N parameters.
Paraloid is the trade name of a series of acrylic resins. Paraloid products are one of the most useful materials in cultural relics conservation, which is usually applicable to a wide range of artifacts for consolidation, sealing and bonding. Among these products, Paraloid B-72 is the most representative one, widely used in art conservation at home and abroad. There are many reports on application cases, performance evaluation and aging mechanism research of Paraloid B-72. However, the other Paraloid products are obtained less attention due to limited domestic applications, and the aging performance research has not yet been conducted. This paper systematically evaluated the UV aging performance of Paraloid B-72, Paraloid B-44, Paraloid B-48N and Paraloid B-67. By using infrared spectroscopy to track the molecular structure changes during the 3864 h UV test, the aging mechanisms of these Paraloid products were further discussed and semi-quantitatively characterized. The results show that among the four Paraloid acrylic resins, the color and gloss of B-72 do not change significantly before and after aging test, while B-48N and B-67 color change greatly, and the gloss of B-44 decreased the most. During the aging process, the chain scission reaction and a certain degree of cross-linking reaction occur inside the acrylic resins, which is manifested in the weakening of the absorption of main functional groups and the increase of the carbonyl index (CI). According to the semi-quantitative results of the relative intensity of the main functional group absorption peak C=O, it can be reflected that B-72 has the best photostability. B-48N and B-44 perform slightly better than B-67. B-67 may be due to the low tertiary hydrogen bond energy on the isobutyl group, which is easy to absorb UV spectral energy and produce free radical oxidation reactions. Therefore, B-67 has the worst light aging resistance. In the comprehensive evaluation of the light aging performance of four Paraloid acrylic resins, B-72 has the best light stability, followed by B-44 and B-48N, and B-67 is the least suitable conservation material for outdoor cultural relics. The conclusions of this study are expected to provide some scientific suggestions for the first-line cultural relics conservators when choosing Paraloid acrylic resins as the conservation material.
High purity tungsten is an indispensable material in military defense, nuclear industry, semiconductors and other fields for its high melting point, high density and corrosion resistance. Its physical and chemical properties are greatly affected by the content of impurity elements. With the rapid development of new material research, the manufacturing of some key components puts forward higher requirements on the purity of tungsten, and this demand corresponds to strict detection of types and contents of trace impurity elements in high purity tungsten. Inductively coupled plasma mass spectrometry (ICP-MS) is an inorganic mass spectrometry technique with a low detection limit and rapid determination of multiple elements. However, some elements encounter serious mass spectrometry interference problems. Nb and Re in high purity tungsten determined by ICP-MS are interfered with by the doubly charged ions and hydride ions respectively, which are difficult to be eliminated by reaction cells and other techniques. In this paper, the tungsten matrix was separated from the solution by precipitation method using lead acetate as a precipitator to eliminate mass spectral interference. The interference intensity of tungsten matrix on Nb and Re, and the correction effect of standard internal elements on residual matrix and signal drift were mainly investigated. The experimental conditions, including sample dissolution solvents, the dosage of precipitator, acidity, temperature and aging time, were also discussed. The results showed that tungsten matrix solution with a concentration of 1 mg·mL-1 had a significant positive interference effect on the determination of Nb and Re, and interference intensity enhanced with the increase of tungsten mass concentration. When tungsten concentration in solution was less than 2 μg·mL-1 the mass spectral interferences produced by tungsten could be ignored (considering the requirement for a determination limit of 0. 10 μg·g-1). Through various condition tests, the final conditions were as follows: sample was dissolved by mixed acid of nitric acid and hydrochloric acid, 600 μL ammonia (1+1) and 1.0 mL acetic acid-ammonium acetate buffer solution were added, 2.7 mL lead acetate solution with a concentration of 10 g·L-1 was dripped at 250 ℃, and then the solution was heated for 5 min, and entire separation process was about 10 min; Cs was chosen as the standard internal element. The detection limit of Nb and Re was 0.007 and 0.036 μg·g-1, the relative standard deviation was 12% and 4.8%, and the spiked recovery rate was 108% and 105%, respectively. This method is simple and fast, and the precision and accuracy of results meet actual requirements for the analysis of high purity tungsten.
Zirconium, hafnium and niobium are important elements in analysing multi-objective geochemical samples. It is difficult to completely remove these high field strength elements in traditional wet pretreatment, resulting in low results. Moreover, traditional wet digestion has many disadvantages, such as high acid and alkali, long pretreatment process and environmental pollution. LIBS has a unique advantage in analysing geochemical samples, especially for those elements that are not completely digested under conventional conditions. In this study, the zirconium, hafnium and niobium elements in soil samples were quantitatively analyzed by laser-induced breakdown spectroscopy. Firstly, the output energy of the laser, the longer time of acquisition by the spectrometer and the diameter of the laser spot were optimized. Comparing the accuracy of the laser output energy from 0.0 to 4.4 mJ in determining zirconium, hafnium and niobium in soil samples, when 1.6mj is selected, the best experimental results can be obtained. Secondly, the influence of the extended collection time of the spectrometer on the determination of zirconium, hafnium and niobium in soil samples is analyzed, and the results show that 0.5 μs is the best acquisition delay time condition. Finally, the measurement results are obtained by comparing different laser spot diameters, and 50 μm is selected, the stability of the measurement is the best. At the same time, this experiment also carried out a comparative experimental study from the measurement mode and sample preparation pressure. The results show that the stability of the LIBS signal and the accuracy of quantitative analysis is the best when using laser-induced breakdown spectroscopy to measure Zr, Hf and Nb in soil samples under the sample preparation pressure of 2 000 kN and dynamic mode. Under the optimal experimental conditions (laser output energy 1.6 mJ, spectrometer acquisition time 0.5 ms and laser spot diameter 50 μ m). The dynamic model was used to detect Zr, Hf and Nb in 9 national first-class reference materials. The measured values are consistent with the recommended values. The precision of 3 national first-class reference materials is less than 11%, which can meet the analysis requirements of geochemical samples. Based on the above conditions, this paper established a laser-induced breakdown spectroscopy (LIBS) method to analyze the content of Zr, Hf and Nb in soil samples, which solved the problems of incomplete digestion and low determination results of Zr, Hf and Nb in wet digestion. It has high analysis efficiency, simple operation and no pollution. It also provides a choice for the development of solid sampling technology.
Thiourea is a potential protein adulteration compound with high nitrogen content and high toxicity. Conventional laboratory testing methods are complicated in-process and low inefficiency and cannot meet the port’s demand for rapid quality screening of large batches of bulk milk powder samples. In order to solve the problem of the lack of rapid real-time evaluation methods for port sampling supervision, this research uses a self-built portable point scanning Raman hyperspectral imaging system to develop a simple and efficient on-site visualized rapid detection method of thiourea in milk powder to ensure accurate supervision of bulk milk powder in the import and export process. In the study, thiourea milk powder mixtures with different additive concentrations (0.005%~2.000%) were used as samples. Whittaker smoothing method and adaptive iteratively reweighted penalized least squares (airPLS) were used to eliminate random background noise signal and fluorescent background interference of spectral data.. After peak identification, the single-band data at the characteristic displacement of thiourea is binarized to obtain a binary heat map of the region of interest of the mixed sample. The qualitative identification and positioning analysis of thiourea in milk powder can be carried out through the presence or absence and coordinates of the thiourea pixel in the binary map. Further analysis of the relationship between the number of thiourea pixels in the region of interest and the concentration of addition showed that with the increase of the concentration of addition, the number of thiourea pixels increased linearly, and the coefficient of determination (R2) of linear fitting was 0.991 3, the lowest detectable concentration of thiourea is 0.05%. Under the addition levels of 0.25%, 0.60%, 1.20%, and 1.50%, the number of pixels and the linear fitting relationship is used to predict the concentration of thiourea in milk powder. The results show that the relative error range of the predicted concentration is -9.41%~4.01%, the relative standard deviation is less than 7%. The point scanning Raman hyperspectral imaging system can complete the detection of a single sample within 10 minutes, combined with the software control system, real-time qualitative, quantitative and pollution distribution analysis of thiourea particles in milk powder. The method has the advantages of being simple and efficient, high sensitivity and stability, and good accuracy. It provides a technical supervision method for the real-time and rapid detection of adulterated thiourea in bulk milk powder at the port site and can significantly improve the quality evaluation of the supervision link of the bulk sample at the port, provide technical support for the rapid customs clearance of imported milk powder.
Drug quality is related to people’s health and national lifeblood. The rapid development of the economy and society plays an extremely important role in the rapid and effective identification of drug quality. Spectral analysis technology has high accuracy, fast analysis speed and no pollution to samples, and is widely used in the chemical industry, petroleum, medicine and other important areas of people’s livelihood. In order to solve the problems of low accuracy, low identification speed and poor stability of the traditional drug identification model, the spectrometer was used to collect near-infrared spectroscopy data of drugs to achieve the purpose of pollution-free drugs. Then, random forest and CatBoost were combined to classify and identify drugs quickly and accurately. The proposed method firstly uses Random Forest (RF) to screen the effective characteristic wavelength of the spectrometer’s spectral data to eliminate the irrelevant wavelength in the drug spectral data and screen out the characteristic wavelength that can best characterize the sample properties. Then Extreme Learning Machine (ELM) was used as CatBoost weak classifier to analyze the feature wavelengths of the screening for drug attribute identification. Since ELM only contains one hidden layer and no iterative optimization is required to ensure the faster running of the identification model, CatBoost can improve the model’s identification accuracy by integrating a weak classifier. In order to effectively evaluate the performance of the drug identification model proposed in this paper, the spectral data of drugs of different sizes were constructed by randomly selected training sets, and experiments were carried out independently. The mean value of 10 running results was taken as the final result. In addition, Back Propagation with CatBoost, Support Vector Machine (SVM), BP, ELM, Summation Wavelet Extreme Learning Machine (SWELM) and Boosting were compared to evaluate the performance of the proposed model further. As can be seen from the classification results of training sets of different sizes, with the increase of training sets, the highest classification accuracy is 100%, and the prediction standard deviation tends to be 0. The experimental results show that the RF-CATBoost identification model proposed in this paper has higher classification accuracy, faster speed and stronger robustness than the comparison method on drug data sets of different sizes and can be widely used in the accurate identification of drug categories, to achieve effective supervision of drug quality.
Infrared (IR) spectroscopy is an important tool for the qualitative analysis of liquid matters. IR spectroscopy of liquid samples is commonly prepared by liquid film method and tested by transmission (TR) method, while the salt window required is expensive, prone to force or moisture cracking. The incomplete surface cleaning or scratches can easily cause test interference; moreover, installing the demountable liquid cells is troublesome, and mixing the trapped air into the sample will also cause test interference. In this paper, a simple method for measuring IR spectra of liquid substances is studied. The differences between the improved TR method, samples prepared by smearing method of directly coating liquid onto a single-use compressed potassium bromide (KBr) disc, and the attenuated total reflection (ATR) method in IR spectra of liquid substances are compared. 6 kinds of liquid reagents with different volatility, hygroscopicity and corrosivity were selected as the research objects, and their IR spectra were tested by both the improved TR method and ATR method. The IR spectra measured by the two methods were compared with those in the SDBS spectral database. The influence of scanning times and resolution on ATR spectra was also studied. The results show that the two methods are accurate in the IR qualitative analysis of liquid samples. The improved TR method simplifies the sample preparation process, avoids the problem of cleaning salt window, and reduces the cost, but water interference is still difficult to avoid. In contrast, the ATR method requires no sample preparation, is more simple, convenient and faster, and the interference of water is negligible. Although the overall intensity and fineness of the spectra tested by the ATR method are not as good as tested the TR method, the high-quality spectra can be obtained by improving the resolution and increasing the scanning times. The amount of liquid should be increased when using the improved TR method and ATR method for volatile liquids. The improved TR method is recommended for strongly acidic and/or corrosive liquids. For hygroscopic liquids, the spectra measured by the ATR method are easier to analyze. In contrast, except for strongly acidic and/or corrosive liquids, the other liquid substances can be rapidly and accurately tested by the ATR method.
Taking the coal and rock samples retrieved from the Huainan Xieqiao Mine and the Paner II Mine as the research object, the sample reflectance spectrum curve was collected by a ground spectrometer, and the sample’s oxide content, moisture, ash and volatile content were simultaneously detected to reflect the sample’s reflection. The rate spectral curve and the sample component content are used as independent variables, and the sample type is used as the dependent variable to establish a coal and rock identification model to classify coal and rock. This paper mainly adopts three models, which are principal component analysis combined with support vector machine (PCA-SVM), principal component analysis combined with BP neural network (PCA-BP) model and kernel principal component analysis combined with support vector machine (KPCA-SVM) model. The results show that among the three models based on visible light near-infrared spectroscopy, nuclear principal component analysis combined with support vector machine model has the highest recognition accuracy, the average accuracy of modeling is 95.5%, and the average accuracy of verification is about 90.56%; three based on sample components. In the model, the kernel principal component analysis combined with the support vector machine model has the highest recognition accuracy, the average accuracy of modeling is 98.5%, and the average accuracy of verification is about 95%.
Spinel[(Mg,Fe,Zn,Mn)(Al,Cr,Fe)2O4] is a magnesium aluminum oxide mineral used for gemstones and glass-ceramics. In recent years, a natural spinel has been found as a gemstone with the color of cornflower blue.It has been loved by collectors and designers and has an increasing price. The cobalt spinels are often cornflower blue and transparent. It shows weak to medium green fluorescence under long-wave ultraviolet and no fluorescence at short-wave. The cobalt spinel with alexandrite effect displayed cornflower blue color in sunlight and purplish-red color in incandescent light. Three natural cobalt spinel samples with spectral characteristics and coloration were investigated with EPMA, FTIR, Raman spectrometer, UV-VIS-NIR spectrometer, and cathodoluminescence spectrometer, and these testing results were compared with those of ordinary spinel without alexandrite effect. The results show that the alexandrite effect and cobalt spinel belong to magnesium spinel. The cobalt spinel was composed of MgO and Al2O3, with an average content of 71.37% and 25.77%, respectively; The contents of transition metals such as Zn, Fe, Co and V were relatively high, and with an average content of 1 333.85, 831.53, 99.52 and 58.26 μg·g-1, respectively. It was found that their infrared spectra and Raman spectra are the same as those of ordinary spinel: the infrared spectrum at 517, 589, and 704 cm-1 are red-shifted, and the red shift range is 5~33 cm-1, and the Raman peaks are concentrated at 300~800 cm-1. Compared the UV-Vis-NIR-spectra with the results of chemical analysis and cathodoluminescence test, it is suggested that the color of natural cobalt spinel is due to the combined action of electronic transitions in Co2+, Fe3+ and V3+ contained in the lattice. The spin-forbidden transition 4T1g(4F)→4T1g(4P) of Co2+ makes the orange-yellow region (550~630 nm) produce absorption bands, while the transition 3T1g→3T1g(3P) of V3+ and the transition 4A2→E2 of Cr3+ makes the blue-purple region (400~490 nm) absorption lines are generated to uniformly transmit the red and blue light so that it produces alexandrite effect. Discolored cobalt spinels are often cornflower blue in sunlight and purplish-red in incandescent lamps. This research confirmed the spectral characteristics and coloration mechanism of natural cobalt spinels and the alexandrite effect of cobalt spinels. This study provided a basis for their scientific identification of natural cobalt blue spinels and is beneficial for readers to distinguish natural cobalt blue spinels from ordinary blue spinels and synthetic cobalt blue spinels. It has important theoretical research and commercial application value.
Bioleach deep dehydrated sludge was used as the main material, four kinds of agricultural and forestry organic wastes were used as conditioners for mixed composting. Four treatment groups (T1: sludge+bagasse, T2: sludge+straw, T3: sludge+rice bran, T4: sludge+sawdust) were set for mixed composting. UV-vis spectroscopy (UV-Vis), Fourier transform infrared spectroscopy (FTIR), and three-dimensional fluorescence spectrum (3D-EEM) were used to study the structural characteristics and component content evolution of dissolved organic matter (DOM) in co-composting. The UV-vis results showed that the aromaticity and unsaturation of DOM increased in all treatment groups, and the T3 treatment group showed the largest increase. SUVA254 and SUVA280 of four composting treatment groups showed an increasing trend. The change range of the T3 treatment group was higher than the other three treatment groups, indicating that the degree of aromatization deepened, the molecular weight of DOM gradually increased. E253/E203 and E253/E220 increased significantly at the end of composting, indicating that the aliphatic chain on the benzene ring in DOM was oxidized, decomposed, and transformed into functional groups such as carboxyl group and carbonyl group. A226~400 increased with composting, whileE250/E365 decreased, indicating that the conjugation degree increased. FTIR results show that the content of polysaccharides and aliphatic substances decreased during composting, and unsaturated organic substances such as aromatic compounds increased. The transformation degree of the T4 treatment group was better than the other three treatment groups. Emission fluorescence spectra showed that the fluorescence peak position shifted from 334nm to around 422nm with composting, which indicated that the substances with low conjugation degree were continuously degraded, and aromatic groups were continuously condensed to form humic-like matters. In the synchronous fluorescence spectrum, with composting time, the fluorescence peak of protein-like substances changed from strong to weak, the fluorescence peak of humic-like matters changed from weak to strong, A250~308 decreased, A308~360 and A363~500 increased, which also indicated that protein-like substances were degrading, while humic acid-like substances and fulvic acid-like substances increased. Combined with the parallel factor (PARAFAC) model to analyze the three-dimensional fluorescence spectrum, DOM was divided into three components. According to the analysis and judgment of the excitation and emission wavelength positions, the three components are fulvic acid-like substances, humic acid-like substances and tryptophan-like substances. The percentage of C1 (fulvic acid-like substances) and C2 (humic acid-like substances) components showed an increasing trend, while the percentage of C3 (tryptophan-like substances) components showed a decreasing trend, indicating that protein-like substances decreased. At the same time, humic-like matters increased, and the humification degree of T3 and T4 treatment groups were good. Comprehensive analysis showed that rice bran and sawdust as conditioners had better compost maturity.
Based on the relationship between the three-dimensional fluorescence spectrum and the characteristic fluorescence peaks of organic matter, this study proposed to use the three-dimensional fluorescence spectrum for clustering and then for different kinds of water samples, using UV-Vis full-band absorption spectrum data to establish the COD prediction model technical route. The parallel factor analysis (PARAFAC) algorithm and fluorescence volume integration (FRI) algorithm were compared and analyzed, and then the fuzzy c-means(FCM) algorithm was used for clustering, and the COD prediction model of different water samples was established. The water samples in this study were collected from the rural areas around Changshu City, Jiangsu Province, and 100 experimental water samples were collected from the effluent of different distributed rural domestic sewage treatment plants. The measured three-dimensional fluorescence spectrum of water samples was pretreated by de-scattering, and then the fluorescence characteristic data were extracted by the PARAFAC algorithm and FRI algorithm, respectively. Then, the FCM clustering algorithm was used for similarity clustering. Finally, the partial least squares (PLS) algorithm was used to establish the regression and prediction model between the UV-Vis full-band absorption spectrum and COD of water samples, and the prediction accuracy was evaluated by the coefficient of determination and the root mean square error(RMSE). The results showed that the prediction models’ mean determination coefficients(R2) were 0.632, 0.819 and 0.906, respectively, after the fluorescence feature information was extracted using FRI and PARAFAC algorithms. RMSE were 27.857, 23.621 and 13.071, respectively. The regression and prediction accuracy was significantly improved after clustering, and the modeling established after the extraction of fluorescence feature information using the PARAFAC algorithm had the highest prediction accuracy, which was 0.274 higher than theR2 of the unclassified prediction model. The proposed COD prediction model based on a three-dimensional fluorescence spectrum combined with UV-Vis full-band absorption spectrum and using the combined algorithm of “PARAFAC-FCM-PLS” can effectively improve the prediction accuracy of COD and provide a new idea for high precision online monitoring of water quality.
Angiotensin-Ⅰ Converting Enzyme (ACE) is a zinc-containing carboxydipeptidase that regulates blood pressure through renin-angiotensin and kallikrein-kinin systems. The ACE inhibitory peptide (ACEIP) derived from food protein could inhibit the activity of ACE, which is beneficial to antihypertension. In this paper, the inhibition mechanism of the inhibitory peptide LKP from bonito fish on ACE was studied by using fluorescence spectra, ultraviolet absorption spectra, circular dichroism (CD), and isothermal titration calorimetry (ITC) and molecular docking. The fluorescence spectra showed that LKP could effectively quench the endogenous fluorescence of ACE, and the quenching mechanism was static quenching by the formation of a relatively stable complex LKP-ACE. The microenvironment around the tryptophan and tyrosine residues in ACE was localized, decreased the hydrophobicity, and enhanced the polarity. The results of UV and CD showed that the combination of LKP and ACE would lead to the conformation change of ACE. After the addition of LKP, the secondary structure of ACE became looser, and the structural changes of a tightness, loosening and slightly tighter have taken place during the interaction process. The thermodynamic parameters such as enthalpy change (ΔH), entropy change (ΔS), stoichiometric ratio (n) and binding constant (Ka) of the interaction between LKP and ACE were obtained by the ITC method. The results showed that the binding reaction of LKP and ACE was a spontaneous endothermic process driven by entropy, and the binding force was mainly hydrophobic. The stoichiometric ratio (n) value was determined to be about 1, which was enhanced with increasing temperature. At 288, 293 and 299 K, the binding constants Ka of LKP and ACE were 2.2×10³, 0.9×10³ and 5.3×10³, respectively, indicating the affinity of LKP and ACE was relatively low. The results of molecular docking showed that the amino acid residues Gln281 and Lys511 in the S1 pocket of the ACE active center could form two hydrogen bonds with LKP, and hydrophobic interaction could have occurred between His353 and His513 and LKP, LKP bond to ACE mainly through hydrophobicity, and hydrogen bonds stabilized the spatial structure of the protein. This study provides certain help for exploring the interaction between ACE inhibitory peptide and ACE and offers some theoretical basis for the development of new hypertension drugs.
The determination of trace elements in Geological Samples by Atomic Absorption Spectrometry is simple, rapid, accurate and economical, which has been widely used in geological laboratories. However, the complex pre-processing process and testing process will inevitably introduce uncertainty. According to the general requirements for the competence of inspection and calibration laboratories, the uncertainty of measurement results should be properly evaluated. In this study, the concentration of Cu, Pb, and Zn in the national standard rock sample and a core sample from the Qujia gold mine in Jiaodong were determined by Atomic Absorption Spectrometry after electric heating plate digestion. Three times the standard deviation of the blank samples test results was calculated as the detection limits. The results of the standard samples and core samples are by the requirements of DZ/T 0130.3—2006 on the accuracy and precision of the test. The bottom-up method was used to evaluate the uncertainty of results in the laboratory. The sources of measurement uncertainty were determined, including sample weighing, constant sample volume, sample digestion, preparation of standard series, least-square fitting and repeated measurement. The value and expanded uncertainty of six uncertainty components were accurately calculated. Among them, the last four components are the main sources of uncertainty. The results show that the uncertainty of the measurement results ofcopper, lead, and zinc in the standard samplesaresmaller than the uncertainty given in the standard certificate, the concentration of Cu, Pb, and Zn in the core sample is (4.965±0.383), (36.415±2.449), (30.818 0±0.736) μg·g-1, respectively. The uncertainty of six sources is compared, and some improvements are put forward when the content of Cu, Pb, and Zn in rock samples is measured by this method: adjusting the sampling mass or constant volume to improve the concentration and absorbance of elements in the solution to be measured, adjusting the concentration of standard series to make it close to the concentration of elements in the solution to be measured, increase the measurement times of standard point and the solution to be measured, the pipette with small relative standard uncertainty should be used as much as possible if necessary in order to reduce the measurement uncertainty. Evaluating measurement uncertainty as an effective tool to guide the improvement of analytical methods and test process is of great significance in the accurate determination of trace elements in rock samples.
A nonlinear reconstruction method based on nonlinear spectral dictionary learning was proposed to solve the ill-posed problem of spectral image reconstruction from a single RGB image. In order to adapt to the linear and nonlinear data, the method firstly improves the nonlinear principal component analysis algorithm based on a modified self-association neural network model. It uses to learn the low-dimensional spectral dictionary from the training spectrum set, which is used in the inverse equation of spectral reconstruction to alleviate the ill condition. In addition, based on the spectral dictionary, the damped Gaussian Newton method combined with the truncated singular value decomposition regularization method is used further to alleviate the ill-posed problem of the nonlinear inversion, and the spectral image can be reconstructed from a single RGB image. In the experiment, two different spectral training sets, Munsell and Munsell+Pantone, were used to learn the spectral dictionary. Meanwhile, CAVE and UEA spectral image libraries were used for the spectral reconstruction tests. Compared with the existing methods, it is found that the average root means square error of CAVE and UEA spectral images reconstructed by this method under different spectral training sets were the lowest, which were 0.212 4, 0.255 4, 0.229 4 and 0.294 9 respectively. The standard deviations of root mean square error was close to the effect of the best method, which was 0.068 5, 0.084 7, 0.066 8 and 0.087 0 respectively. The results show that the method for reconstructing the spectral image from a single RGB image has advantages in accuracy and stability.
Yue kiln celadon is the earliest celadon manufactured with a precise fire system in China, and the use of porcelain saggers to firing Mi’se celadon is the unique firing technique of the Yue kiln. In order to reveal the processing feature of porcelain sagger and its influence on celadon of Tang and Five Dynasties, saggers, which were unearthed at the Housi’ao kiln site in the Shanglin Lake of the Yue Kiln, were characterized via a variety of testing methods. In this paper, energy dispersive X-ray fluorescence spectrometer (ED-XRF), super depth of field microscope, scanning electron microscope (SEM) and other mondern test methods, were applied on the porcelain sagger, common sagger, common celadon and Mi’se celadon which unearthed from Housi’ao kiln site of Shanglin Lake, to realize the understand of element composition, microstructure, water absorption, etc. Meanwhile, a spectrophotometer has also conducted the tests of surface chroma on the common celadon and Mi’se celadon of Tang and Five Dynasties. The results of the analysis showed that the base of the common sagger was similar in composition to that of the porcelain sagger in the Tang and Five Dynasties, using local alluvial clay-like raw materials with a SiO2 content of approximately 75% and an Al2O3 content of approximately 16%, similar to that of the celadon body. In contrast, the TiO2 and Fe2O3 contents of the porcelain sagger in Tang and Five Dynasties were higher than those of the celadon body and fluctuated slightly, indicating a more rigorous process of washing the celadon body. The presence of a large number of inclusions of coarse particles with an average size of around 530 μm and a regular particle gradation in the common sagger was a type of high-silica material that was deliberately selected and added to increase the service life of the common sagger, increasing the permeability, mechanical strength and thermal stability of the sagger and thus extending the service life of the sagger; the porosity of the porcelain sagger in Tang and Five Dynasties was 1.61% and the water absorption rate was 0.73%, lower than the common sagger 8.18%, 4.28%, while the bulk density of 2.22 g·cm-3 higher than the common sagger 1.99 g·cm-3, and thermal conductivity than the common sagger, conducive to reducing the temperature difference between the inside and outside of the sagger, to alleviate the temperature lag phenomenon. In addition, the use of a porcelain sagger with a lower porosity and the sealing of the mouth rim at the Housi’ao site in Shanglin Lake effectively reduced the degree of secondary oxidation of the fired celadon glaze during the cooling process, improved the stability of the atmosphere within the sagger and the Fe2+ content of the celadon glaze layer, and improved its colour stability and appearance. At the same time, the slightly thicker glaze layer on the Mi’se celadon reduced the influence of the body on the appearance of the product and increased the refractive index and brightness of the glaze, placing it in a more bluish-green area in the CIE chromaticity space than common celadon.
The optical enhancement effect and catalytic activities produced by surface plasmon resonance (SPR) of metallic nanostructures have become one of the hot fields in surface scientific research. The SPR and electrochemical control combine to induce and catalyze the unconventional reactions, and electrolyte solutions with different pH values affect the SPR photocatalytic reaction by changing the adsorption form of surface adsorbed molecules. In this study, the adsorption and reaction behaviors of the isomers of hydroxythiophenol were served as probes modified on the Ag electrode and were investigated by the combination of electrochemistry and surface-enhanced Raman spectroscopy (SERS). The results revealed that the SPR-catalyzed dehydroxylation reaction of hydroxythiophenol with different hydroxyl substituent positions exhibited different sensitivity to the pH value of the solution. The C—O bond peak intensity of o-hydroxythiophenol (OHTP) was related to the pH value of the solution. The O end was easier to interact with metal and adsorb on the surface, and it improved with increased pH. Under alkaline conditions, the dehydroxylation reaction of p-hydroxythiophenol (PHTP) was completely inhibited, and it could occur in both meta-hydroxythiophenol (MHTP) and OHTP. MHTP held the highest SPR catalytic dehydroxylation reaction efficiency in neutral (pH 7) solution, which was about 1.36 times that of acidic (pH 2) and 2.70 times that of alkaline (pH 12). OHTP exhibits the highest reaction efficiency in alkaline (pH 12) solution, which was about 13.71 times that of acidic (pH 2) and 4.95 times that of neutral (pH 7). SPR-catalyzed dehydroxylation was mainly contributed by two approaches non-deprotonation conditions and Ag—O formation. The dehydroxylation reaction of MHTP and OHTP under acidic conditions was mainly due to the undeprotonated hydroxyl reaction, and the formation of Ag—O mainly caused the alkaline conditions after deprotonation. Under neutral conditions, both contributions occurred simultaneously. For MHTP, due to the steric hindrance, only part of the molecules was deprotonated to form Ag—O, which promoted the catalytic dehydroxylation of SPR. Therefore, the simultaneous action of the two effects in the pH 7 solution led to the highest catalytic efficiency. For OHTP molecules, the O terminal in the deprotonated state was more likely to interact with the electrode surface, and the degree of deprotonation of the hydroxyl group as the pH increases was more thorough, more conducive to the dehydroxylation reaction. The dehydroxylation reaction in the pH 12 solution mainly occurred in Ag—O, where the efficiency was the highest. The study of the isomer structure and the pH of the medium on the SPR-catalyzed dehydroxylation reaction was of great significance for broadening the types of SPR catalytic reactions and analyzing the mechanism at the molecular level.
Continuing current is an important sub-physical process of lightning discharge. It refers to the process in which the local charge center in the thunder cloud discharges to the ground through the original channel after the return stroke. It is also usually overlapped by the M-component, which is the phenomenon that the brightness of the glowing channel increases suddenly. Since the continuing current was discovered in the 20th century. Many kinds of research were made by domestic and foreign researchers. The present studies mainly reveal the macroscopic characteristics of the discharge and luminescence using electromagnetic and optical observations. There is a lack of studies on the microcosmic luminescence information and the physical characteristics used by spectral observation. There are few studies about the temperature in the discharge channel of the continuing current. However, the temperature is not only a basic parameter to analyze the physical properties of the continuing current discharge channel but also a concerned parameter to prevent lightning disasters caused by the continuing current. Based on the spectra of a first return stroke and the following continuing current process overlapped with three M-components for cloud-to-ground lightning recorded by a slit-less high-speed spectroscope, the spectral evolution properties during the entire discharge process have been analyzed. The temperatures in the channel core and the corona sheath have been calculated, and the variations of both along the channel height have been studied. The results show that in the stage of the return stroke, the channel optical radiations are mainly the NⅡ lines with higher excitation energy. In the continuing current process, the channel optical radiations are mainly the NⅠ and OⅠ lines with lower excitation energy. The intensity of the ionic lines is strongest at the initial stage of the return stroke, while the intensities of the Hα and the neutral atomic lines are strongest at M1, and the continuum spectrum is strongest at M2. Four lines of OⅠ 777.4, NⅠ 746.8, 821.6 and 868.3 nm in the near-infrared band were observed throughout the discharge process. During the continuing current, the temperatures in the channel core are 42 060~43 940 K, which are 6 020~7 900 K higher than the temperature in the channel core of the corresponding return stroke. The temperatures in the outside corona sheath are 16 170~20 500 K. The temperatures of the channel core, and the corona sheath both remain unchanged with time. The temperature of the channel core decreases with the increase of the channel height, while the temperature of the peripheral corona sheath increases with the increase of the channel height.
Rare earth-doped luminescent materials have always been a hot spot in the field of scientific research and are widely used in the fields of white light LEDs, temperature sensing, display imaging, new energy and lasers. The matrix structure has a significant influence on the photoluminescence properties of rare-earth ions. Among many luminescent matrix materials, borate has the advantages of a wide range of light transmission, high optical damage threshold, better thermal stability and chemical stability. Alkaline-earth and rare-earth metal borates Sr3Y2(BO3)4 have excellent optical properties, and the study of its luminescence properties is of great significance. The rare-earth ion Eu3+ ions have a 4f6 electron layer, which is a typical down-conversion luminescence center ion, and is often selected as an activator of red luminescent materials. Dy3+ ions have a 4f9 electron layer, a typical down-conversion luminescence center ion. Under the excitation of ultraviolet light, there is a strong fluorescence emission in the blue and orange light areas. This paper synthesised, Sr3Y2(BO3)4∶Eu3+/Dy3+ phosphors by high-temperature solid-phase method. XRD and SEM characterized the structure and morphology of the samples. XRD results showed that when sintered at 1 000 ℃ for 5 hours, 20% excess of H3BO3 is the best preparation conditions, and doping with a small amount of Eu3+ ions and Dy3+ ions did not change the lattice structure of Sr3Y2(BO3)4. The SEM image shows that the average grain size of the Sr3Y2(BO3)4 matrix is 2~4 μm, compared with the SEM image of the 10% Eu3+ single-doped sample and 5% Eu3+/5% Dy3+ double-doped sample, the morphology and size of the matrix Sr3Y2(BO3)4 did not change significantly. The luminescence results of Sr3Y2(BO3)4∶Eu3+ samples show that the main luminescence of Eu3+ mono-doped Sr3Y2(BO3)4 phosphors at concentrations of 5%, 10% and 15% under excitation at 395nm and 466 nm is located at 593 and 613 nm. For red light emission, the peak intensity increases first and then decreases with the increase of Eu3+ concentration. When the doping concentration is 10%, the luminescence intensity is the highest, indicating a concentration quenching phenomenon. The CIE chromaticity coordinates results show that the excitation wavelength changes from 395 to 466 nm, and the emission color of Sr3Y2(BO3)4∶Eu3+ phosphor changes from orange-red to red. After the introduction of Dy3+, the emission spectrum of Sr3Y2(BO3)4∶Eu3+/Dy3+ samples showed the 486 nm blue emission (4F9/2→6H15/2) and 576 nm orange emission (4F9/2→6H13/2) of Dy3+, And with the increase of Dy3+ ions concentration, it has an inhibitory effect on the 5D0→7F1, 2, 3, 4 transition of Eu3+. The CIE coordinates results show that by adjusting the ratio of doped ions Eu3+ and Dy3+, the color of Sr3Y2(BO3)4∶Eu3+/Dy3+ phosphor can be changed from the red area to the orange area, indicating that it has a good application prospect in the display.
Laser produce plasma extreme ultraviolet (EUV) source, which has the advantages of small size, high stability and adjustable output wavelength, plays a significant role in applying EUV lithography. Laser produces plasma Bi EUV source has a wide spectrum in the wavelength range of 9~17 nm, which can be used to apply extreme ultraviolet metrology in the development of extreme ultraviolet lithography. Therefore, EUV emission and debris characteristics from laser-produced Bi plasma were carried out. When the 1 064 nm pulse laser irradiated the Bi target, a natural dip displays at 12.3 nm in the EUV spectrum, corresponding to the L-edge absorption in silicon. Meanwhile, two strong peak emissions are located at 11.8 and 12.5 nm, respectively. Firstly, we studied the emission characteristics and intensity of the spectrum near the 11.8 and 12.5 nm dependence on laser power density. When the laser power density is adjusted by changing the focus spot size by fixing the laser energy, the emission intensity of two peaks increases first and then decreases with an increase in the laser power density. The maximum emission intensity of two peaks was formed when the laser power density of 2.0×10¹⁰ W·cm-2. This is attributed to the final output EUV emission is determined by the balance of the laser energy loss used to support plasma expansion and reabsorption of the EUV emission by the plasma. When the laser power density is adjusted by changing laser energy by fixing the focus spot size, the emission increases with an increase of laser power density due to the ablation material and high stage ions increases. Secondly, we studied the effect of dual pulse on the emission intensity of the 11.8 and 12.5 nm peaks. The experiment results show that the emission intensity of two peaks increases gradually when the laser energy increases from 20~140 mJ. Moreover, the intensity decreases when the laser energy larger than 140 mJ due to the EUV emission being absorbed by the thick plasma at a larger plasma density. In addition, it is found that the dip generated in the spectrum at a 13~14 nm wavelength with a single pulse laser disappeared when using the dual pulse method. Finally, we measured the angular distributions of ions emission from a 1 064 nm laser-produced plasma. The results indicated that the kinetic energy of Bi ions decreases when the detection direction moves from the normal direction of the target surface to the direction along the target surface due to the plasma preferential expansion perpendicular to the target surface. Moreover, the kinetic energy of Bi ions decreases linearly with the decrease of laser pulse energy. This research is expected to provide technical support and lay a solid foundation for the metrology field needed in the development of EUV lithography.
Since the outbreak of novel coronavirus pneumonia (COVID-19), many research institutes and enterprises at home and abroad have been accelerating the research of COVID-19 (SARS-CoV-2) antibody drugs. However, the research on effective drugs was limited by the drug polymorphisms. The environment of drug production, storage and use also affected the stability of the drug. As a fast, non-destructive testing method, infrared spectroscopy can reflect the differences in drug structure, crystal form and even manufacturing technique to the vibration spectrum, which greatly improves the efficiency of R&D (research and development). In this paper, three clinical trials were considered effective drugs for the treatment of COVID-19: Chloroquine diphosphate, Ribavirin and Abidol hydrochloride. Their far-infrared spectrum (1~10 THz) and mid-infrared spectrum (400~4 000 cm-1) were measured by Fourier transform infrared spectrometer (FTIR). In the far-infrared spectrum, the characteristic peaks of Ribavirin were around 2.01, 2.68, 3.37, 4.05, 4.83, 5.45, 5.92, 6.42 and 7.14 THz; the characteristic peaks of Chloroquine phosphate were near 1.26, 1.87, 2.37, 3.06, 3.78, 5.09 and 6.06 THz; the characteristic peaks of Abidol hydrochloride were located near 2.24, 3.14, 3.72, 4.25 and 5.38 THz. Based on density functional theory, the B3LYP hybrid functional and 6-311++G (d, p) basis sets were selected to analyze the vibrational modes corresponding to all characteristic peaks in the spectrum using Crystal14 and Gaussian 16 software, and the accurate identification of the vibration spectrum was realized. The vibrational modes originated from the molecules’ collective vibration in the far infrared region. In the mid-infrared band, below 2 800 cm-1, the vibrational modes mainly came from the in-plane and out-of-plane bending and rocking of the group; Above 2 800 cm-1, the vibrational modes transited to the in-plane stretching of C-H, O-H and N-H bonds. Taking the crystal structure with periodic boundary conditions as the initial configuration of the theoretical calculation would make the calculated spectrum more consistent with the experimental one, especially in the far-infrared band and the low-frequency band of mid-infrared (400~1 000 cm-1). This study was of great significance to deeply understand the pharmaceutical characteristics, drug interactions, control of drug production process, and guide the storage and use of antiviral drugs such as Chloroquine phosphate, Ribavirin and Abidol hydrochloride.
Nitrite (HONO), as one of the sources of OH free radical in the atmosphere, plays an important role in the oxidative capacity of the atmosphere. Moreover, previous studies have shown that HONO plays an important role in generating atmospheric haze in winter. The conversion of NO2 is considered one of the important sources of HONO. Therefore, researching the vertical distribution characteristics of HONO in the atmosphere has an important role in studying the formation and control of atmospheric pollution. Because of the important role of HONO in the atmosphere, currently, the methods of chemiluminescence and spectroscopy, as well as indirect methods, are mainly used to measure HONO in the atmosphere. MAX-DOAS method is a passive remote sensing technology that can quickly and effectively obtain the three-dimensional distribution of pollutants in the atmosphere. In this paper, the MAX-DOAS instrument was used for stereo detection of HONO and NO2 in the winter atmosphere of the Science Island of Hefei in December 2017. The vertical distribution characteristics of those are obtained through the PriAM algorithm. The research results show that during the observation period, the NO2 vertical mixed concentration (VMR) and vertical column concentration (VCD) in the range of 10m near the ground were in the range of 0.51×10¹¹~20.5×10¹¹ molecules·cm-3 and 6.0×10¹⁵~5.5×10¹⁶ molecules·cm-2, respectively.The concentration was mainly concentrated within 1 km, and evenly mixed near the ground. However, the VMR and VCD of HONO were between 0.03×10¹⁰~5.1×10¹⁰ molecules·cm-3 and 3.5×10¹⁴~7.0×10¹⁵ molecules·cm-2, respectively. The upper level of concentration was within 100m, and its concentration decreased significantly with the increase in height. The HONO/NO2 ratio was between 0.17%~16.0% (VMR) and 1.0%~25.0% (VCD), indicating that HONO was mainly derived from NO2 conversion during the study period. Under a typical polluted episode (2017.12.26—2017.12.31), HONO/NO2 was greater than 5%, and the concentration of HONO increased (greater than 0.26×10¹¹ molecules·cm-3), indicating that the conversion of NO2 to HONO became strong. By combining the wind field changes to study the source of NO2 during the pollution period, it was found that the transmission in the urban area of Hefei, northern and northwestern Anhui has a significant effect on NO2 and HONO.
In order to realize the rapid and nondestructive detection of key nutrients protein and polysaccharide of Lanzhou lily, near infrared spectroscopy (NIRS) of 59 Lanzhou lily powder samples were collected in the range of 12 000~4 000 cm-1. Firstly, ten pretreatment methods of SG, Normalize, SNV, MSC, Detrend, OSC, SG+1D, SG+Normalize, SG+SNV and SG+Detrend were used to process the original spectral data, and the optimal pretreatment method was SG+Detrend, Detrend was the best pretreatment method for polysaccharide. Then, CARS, SPA and PCA were used to screen the characteristic wavelength of the preprocessed spectral data. Finally, the SPA algorithm was used to determine the best extraction method for protein and polysaccharide’s characteristic wavelength. The results showed that the correlation coefficient Rp of the prediction set was 0.810 6, and the root mean square error of the prediction set RMSEP was 1.195 3 in the protein PLSR model established by SG+Detrend_SPA treatment. In the polysaccharide PLSR model established by the Detrend SPA treatment, the correlation coefficient Rp of the prediction set was 0.810 9, and the root means square error RMSEP of the prediction set was 2.094 6. Considering the limitation of precision of the classical PLSR nondestructive prediction model, SOM-RBF neural network nondestructive prediction model is proposed in this paper. Firstly, the SOM network is used to cluster the data samples, and then the number of clustering categories and clustering center obtained is used as the number of hidden layer nodes and the data center of hidden layer nodes of the RBF network to optimize the structural parameters of RBF. In the established protein SOM-RBF neural network model, the correlation coefficient Rp of the prediction set is 0.866 6, and the root means square error of the prediction set RMSEP is 1.038 5. In the SOM-RBF neural network model established for polysaccharides, the correlation coefficient Rp of the prediction set was 0.868 1, and the root means square error RMSEP of the prediction set was 1.799 4. Comparing-PLSR and SOM-RBF prediction results, the SOM-RBF neural network model was determined as the optimal modeling method. Finally, the optimal model was established based on SG+Detrend_SPA_SOM-RBF in protein detection. The correlation coefficient of the prediction set of the model was 5.6% higher than that of PLSR, and the root means square error of the prediction set was 0.156 8 lower than that of PLSR. In the detection of polysaccharides, the optimal model was established based on Detrend_SPA_SOM-RBF, and the correlation coefficient of the model was 5.72% higher than that of PLSR, and the root means square error of the model was 0.295 2 lower than that of PLSR. The results showed that NIR and SOM-RBF techniques could be used for the rapid and non-destructive detection of key nutrients, proteins and polysaccharides, and the results could provide a theoretical basis for the future rapid and non-destructive detection of nutrients in Lily of Lanzhou.
With the rapid development of the marine transportation industry and the offshore oil exploitation industry, oil spill pollution is becoming increasingly serious, posing a great threat to the marine environment and ecological balance. Therefore, the treatment and improvement of oil spill pollution have become an urgent and important work in marine environmental protection engineering. The identification of oil spills in different states is the basis and key to solving the problem of oil spill pollution. The oil spill on the sea mainly includes two different stages: non-emulsification and emulsification. The former is in the form of oil film with different thicknesses, while the latter is in oil spill emulsion with different oil-water ratios. The oil spill in different states has different element compositions: the oil film is a pure oil molecule, the emulsified oil spill is an oil-water mixed structure, and the fluorescent group is formed. Under the action of the laser, it has its own characteristic fluorescence spectrum information, and different states show obvious fluorescence spectrum differences. The shape feature of the spectral curve is an external manifestation of fluorescent substances’ physical and chemical properties, so analyzing and comparing certain spectral parameters from the shape feature of the spectrum can achieve the purpose and effect of substance classification and species identification. In order to realize the rapid classification and identification of different states of oil spills on the sea, the LIF detection system was built to collect the fluorescence spectra of common oil products in different states. The comparison of the spectral curves shows that the spectrum in the emulsification stage will show a series of characteristics, such as the increase in the number of fluorescence peaks, the change of fluorescence intensity, the shift of fluorescence peak position and so on. According to the principle of apparent statistics, the mean value, standard deviation, kurtosis coefficient, spectral linewidth, curve slope and other characteristic parameters of the spectrum are extracted, and these characteristic values are used for cluster analysis. The results show that the cluster analysis results of oil spills based on laser-induced fluorescence spectrum are consistent with the actual oil spill status. Based on the premise of known oil species, the classification method can better identify different oil spill states on the sea. Therefore, this method can provide a new idea for identifying oil spills on the sea and lay a foundation for the improvement of LIF technology detection quality and application level.
Spectral calibration is determining the central wavelength of each channel of a spectrometer. To obtain the spectral radiance, it is usually necessary to calibrate the spectrometer and map the output value of the spectrometer to a physical quantity radiance. Different spectrometers, The spectral response is different, so it is necessary to determine the spectral response of each channel during the spectral calibration process. The spectral imager can be regarded as a composition of multiple spectrometers, and the center wavelength and spectral response of all points need to be calibrated. Since the birth of the first imaging spectrometer, its calibration method has been gradually fixed. A monochromator with the higher spectral resolution is required, and its spectral bandwidth is much smaller than the spectral response bandwidth of the spectral imager so that quasi-monochromatic light can be considered a pulse function. According to the characteristics of the pulse function, changing the wavelength of the quasi-monochromatic light and scanning the response wavelength range of the spectral imager is a process of sampling the spectral response function at intervals.. Therefore, the spectral imager’s central wavelength and spectral response function can be directly obtained from the spectral calibration data. With the development of technology, the sensitivity of the detector is getting higher and higher, and the resolution of the spectral imager is getting higher and higher. Higher requirements are put forward for the quasi-monochromatic light required for the spectrum calibration. However, the narrower the bandwidth of the quasi-monochromatic light, the lower its energy, and it takes longer to obtain data that meets the signal-to-noise ratio, which reduces the efficiency of calibration. In this paper, we combined the characteristics of quasi-monochromatic light’s spectral line type and spectral response function approximating to Gaussian function. Through theoretical analysis, a method of spectral calibration using wide-band quasi-monochromatic light is proposed, which can effectively reduce the calibration step of spectral calibration improves the efficiency of calibration and is suitable for the rapid calibration of spectral imagers. This method is used for the spectral calibration of a space-borne hyperspectral imager. The spectral imager uses a prism to split light and has the characteristics of non-linear dispersion. The spectral resolution varies from 2 to 18 nm, and there is a large curve of spectral lines. As a result, the center wavelength of each pixel is different, and spectral calibration is required for each pixel. To avoid the discontinuity of the central wavelength of the adjacent field of view caused by the calibration of the separate field of view, the quasi-monochromatic light spot emitted by the monochromator illuminates the entire slit, and a cylindrical lens and ground glass are placed between the slit and the monochromator. The cylindrical lens is used to converge the light perpendicular to the slit direction to improve the energy utilization; the ground glass is used to homogenize the light, and the presence of ground glass greatly reduces the energy entering the spectral imager. Combining the method proposed in this paper increases of the accuracy the bandwidth of monochromatic light, and the increase of energy have finally completed the rapid calibration of the spectral imager. The mercury lamp verifies that the spectral calibration accuracy is 0.23 nm.
The discharge of DBD in unburned gaseous fuel or the combustible mixture will produce a lot of active free radicals, which can promote combustion and improve the combustion characteristics of fuel. In this paper, the effect of DBD excited methane on gliding arc flame is studied by using the key active particles (CH and OH) produced by DBD to enhance combustion. Therefore, a self-designed DBD-Gliding arc dual-mode plasma exciter is used to excite argon, methane and air mixture by using a coaxial Dielectric barrier discharge structure. The argon, methane and air mixture after excitation is fed into the gliding arc end for ignition. The volume flow ratio of argon to Air-methane in the inlet passage can reach Ar∶(CH4+Air)=1∶30 by adjusting the Airflow rate to 4.76 L·min-1 and adding methane to 0.5 L·min-1, the mixture of argon, methane and methane can be discharged and burned uniformly and stably when the equivalent ratio of chemical combustion isϕ=1. The discharge voltage in the DBD segment varies from 15 to 20 kV, and the discharge frequency varies from 6 to 10 kHz. The voltage and frequency in the gliding arc discharge segment remain constant at 4 kV and 10 kHz, respectively, the type and spectrum intensity of free radicals in gliding arc flame were measured by a high-speed optical fiber spectrometer, and the effect of methane excited by discharge parameters on free radicals (CH and OH) in-flame was analyzed. The results show that the increase of DBD voltage and frequency can promote the coupling reaction in the flame and can effectively increase the content of active particles in the methane gliding arc flame. The OH group and CH group play an important role in the combustion chain reaction. The OH and CH groups in the flame increase with the increase of DBD discharge voltage and frequency. After DBD discharge, the spectrum intensity of the active particles increases, and the characteristic spectrum is more obvious than that of a single-mode. After the methane is excited by DBD, the flame composition changes, and the methane combustion reaction at the exit of the gliding arc is sufficient. The higher the flame temperature, the more likely it to produce an OH group. Compared with the single-mode GAD, the Double mode discharge can promote the chain chemical reaction process and fuel combustion.
Melamine is an illegal food additive in beans and dairy products. As a cheap substitute for protein, melamine was illegally added into milk powder and other foods, causing serious social harm and greatly threatening the safety of people’s lives and property. At present, spectral technology has become an effective means to identify and quantitatively detect illegal food additives, which provides a reliable research method and identification basis for the quality supervision department. The timeliness, non-destructive and accuracy of spectral detection technology improve the detection efficiency of melamine in food and promote the development of accurate and automated food quality detection. In recent years, a large number of studies have focused on the spectral detection of melamine, such as the development of new enhanced substrates or sensors to reduce the detection limit of melamine and improve the detection accuracy; Develop more portable automatic spectrum rapid detection equipment, reduce the detection cost and improve the detection efficiency. These spectral technologies have their advantages, but it is difficult to form a standardized and unified detection specification, making all kinds of spectral detection technologies only stay in the experimental stage and can not be applied to actual combat. On the other hand, with artificial intelligence and pattern recognition technology, spectral data analysis methods have made great progress in recent years. Various spectral preprocessing and data modeling methods have been proposed, which greatly improves the sensitivity and stability of spectral detection technology. The application status of spectral techniques (Raman spectroscopy, near-infrared spectroscopy, fluorescence spectroscopy, spectral imaging, etc.) in the detection of melamine in recent ten years was reviewed. The detection limits, quantitative ranges and sample pretreatment methods of different instruments were summarized; The applicability of various spectral preprocessing and spectral data modeling methods in different spectral data is analyzed, the advantages and disadvantages of these methods and the suitable instruments are summarized, and their application prospects and research trends have prospected.
With the complete construction of the All-Roundly Well-off Society in China, residents have higher and higher requirements for the quality of life, especially for food safety. However, food quality and safety accidents such as “deteriorated meat”, “adulterated meat”, “added meat” and “water-injected meat” frequently occurring to threaten the life safety of Chinese residents seriously and hinder healthy development of the market. The quality test method of red meat is a physical and chemical experiment that seriously damages the samples and is only applicable to the spot check of the market supervision department. Hyperspectral technology is a kind of in-situ non-destructive, high-throughput and, fast intelligent detection technology which provides effective technology for solving the low operational feasibility of traditional detection methods. It greatly promotes the development and improvement of the quality and safety supervision system of red meat in China. This paper aims to review the research progress of hyperspectral technology in non-destructive detection of red meat quality. Firstly, the advantages and disadvantages of the red meat quality model based on the Hyperspectral technique are summarized. Its advantage is high resolution and a combination of image and spectrum, which will provide better data for the model. Then, the key algorithms in the model are analyzed: (1) Due to regions of interest obtained manually, automatic separation of regions of interest will be one of the focus of research; (2) The spectral preprocessing algorithm is mainly selected by observing the spectral signal or extrapolating by model, so there is no standard general preprocessing algorithm; (3) The combination of spectrum and image features can more comprehensively describe the quality of red meat and provide a batter basis for modeling; (4) The linear model is more mature and stable, but the research potential of nonlinear model is better for the complex environmental factors in red meat quality detection. Finally, the future development direction and research focus of hyperspectral technology in red meat quality prospect. Finally, the key research direction of hyperspectral non-destructive detection for red meat quality is concluded as improving algorithm automation, making full use of spectrum information and strengthening the application of the nonlinear model based on the summary of the research results in recent years.
As an important -starting point in the marine ecosystem, phytoplankton primary production is the foundation of the marine food web and an important indicator for seawater quality. In this paper, in order to accurately measure, monitor, and predict spatiotemporal variations of phytoplankton primary productivity, and its kinetic response to external environmental conditions, a measurement technology based on chlorophyll fluorescence kinetics was studied, and a fast measuring instrument with a response time of 1.6 minutes and a precision of 4.86% was developed. The correlation coefficient between the measured phytoplankton primary productivity by the developed instrument and the measured photosynthetic oxygen evolution rate by the liquid-phase oxygen electrode was 0.991. The instrument was equipped on the China Marine Surveillance 101 experimental ship for the underway measurement and the vertical profiles measurement of phytoplankton primary productivity in the Yellow Sea and the Bohai Sea. Underway measurement results showed that the phytoplankton primary productivity in Bohai bay is 1.1~1.4 times higher than outside the bay, and vertical profiles measurement results showed a depth-dependent response of phytoplankton primary productivity on each site in the Yellow sea area. Compared with traditional methods, the developed instrument in this paper has the advantages of rapidness, stability, and no need for sample cultivation and can provide an advanced technical method for marine ecological environment assessment.
As an important component in soil, soil organic matter (SOM) is a critical nutrition index in the process of crop growth. Rapid and accurate detection of SOM content is of great significance for the fertilization management. In recent years, NIR has been widely used in the rapid detection of SOM. However, soil moisture is one of the important factors that affect the prediction results of SOM. In this study, 140 soil samples were collected in Shanxi Province, and the spectral information with different water content (0%, 5%, 10%, 15%, 17%) was collected by ASD spectrometer (350~2 500 nm). In order to improve the accuracy of the SOM prediction model, a characteristic wavelength integration algorithm (taking the integral absorbance value at characteristic wavelength as the independent variable) was proposed. The results show that: (1) the statistical parameters of the SOM prediction model established by this algorithm are better than the traditional characteristic wavelength modeling method; (2) the moisture correction model established by this algorithm can eliminate the influence of moisture, and the corrected spectra of wet soil samples are closer to the corresponding dry soil samples; (3) the prediction accuracy of wet soil samples is improved. The RP increased by about 0.09 and RMSEP decreased by about 1.72. The results show that the method can effectively reduce the influence of soil moisture on the spectral characteristics of SOM, improve the prediction accuracy of SOM with different water content, and provide theoretical support for the subsequent instrument development.
The agricultural watershed of the Dianbu River is one of the main water sources of Chaohu Lake. It is very important to understand the aquatic ecosystem of Chaohu Lake to study the composition and source of dissolved organic matter (DOM) in this watershed. In combination with the fluorescence excitation-emission matrix spectroscopy of the watershed, the study made some relative processing with the parallel factor analysis (PARAFAC) method, including the Raman and Rayleigh scattering removing, component extraction and so on for the measured fluorescence spectrum matrix. So we realized to analyze the DOM of the agricultural watershed of Dianbu River, including the excitation-emission matrix fluorescence spectrum characteristics analysis, the fluorescence component ratio analysis and the correlation analysis between the fluorescence characteristics and water quality parameters and explored the DOM components and sources of the watershed. The results showed that the DOM of the agricultural watershed in the Dianbu River contained two effective fluorescence components, namely, one kind of protein (tryptophan-like component) and one kind of humus (fulcrum acid-like component). The proportion of fluorescence components indicated that the tryptophan-like component was the main component of the DOM in the watershed. The fluorescence index FI, the autogenous indicator BIX and humification indicator HIX indicated that the DOM has strong autogenous properties and weak humification characteristics. What’s more, its DOM of endogenous mainly comes from the metabolic activity of plants and other water microbial within the lotus pond, DOM of exogenous input from sewage and aquaculture feed. The endogenous of DOM made the main contribution to the organic matter source in the water; the DOC is positively correlated with the tryptophan-like component C1 of DOM, and the protein-like fluorescence component can be used for dynamic DOC tracking of this watershed. The pH value was positively correlated with the fulcruid-like component C2, so the pH value and the fulcruid-like component increased simultaneously, indicating that the water alkalization in this basin was accompanied by the increase of humus like substances in dissolved organic matter. Dissolved oxygen (DO) was negatively correlated with tryptophan-like component C1, indicating that the tryptophan-like component was affected by the content of dissolved oxygen dissolved oxygen content in water. This study traced the fluorescence characteristics of DOM and its component source response mechanism in the small agricultural watershed of Dianbu River, which could better understand its function in the ecosystem and its environmental geochemical cycle process, thus providing a certain scientific basis for the comprehensive environmental management of the watershed.
In the non-line-of-sight wireless ultraviolet communication, particles in the atmosphere scatter ultraviolet light to help transmit information, which offers a broad prospect for applications in near-range covert communication. Haze particles, belonging to the aerosol category, are composed of dust, sulfide, organic hydrocarbon, and other particles in the air. Physical parameters of haze particles, such as size, concentration, and shape, greatly affect the transmission characteristics of wireless ultraviolet light scattering communications. In this work, we first established an ultraviolet multi-scattering model based on the Monte Carlo method. This model considers the effects of two physical quantities of haze particles-radius and concentration. Using this model, we simulated many photons passing through the multi-scattering transmission channel under various haze conditions. The relations of the path loss to particle radius and concentration level are evaluated and analyzed. The results show that: (1) Under the condition of wireless ultraviolet light short-range communication, higher haze concentration results in lower path loss and better system performance; (2) When the communication distance is longer than 500 meters, as the particle concentration continually increases, the system path loss generally decreases first and then increases; (3) With a fixed particle concentration, enlarging the particle radius causes the system path loss to drop initially, but as concentration continues to increase, the path loss rises again. In addition, the particle radius which produces the minimum path loss reduces monotonically as the transmission distance increases. Secondly, we incorporated the particle size distribution of the atmosphere into the model by segmenting the distribution to obtain different particle sizes and corresponding concentrations. Assuming that particles of different sizes and concentrations sequentially scatter photons, the model evaluates the probability of photons arriving at the receiver by passing them through each channel with a single particle size. Then, the model calculates the total probability of photons received and the path loss of the system when particles of all sizes are present. This way, our model creates a realistic multi-scattering transmission environment similar to the actual atmospheric channel where haze particles of all sizes exist simultaneously. Finally, we built an experimental platform to measure the system path loss to communication distance and transmission and receiving elevation angles under three different weather conditions: fine, severe haze, and extremely severe haze. Comparing the measured results of path loss to those from the simulation model, we found that the experimental and simulation results shared the same trend, the communication quality in haze weather is always better than good weather, and larger transmission and reception elevation angles always cause a higher path loss.
Laser gas nitriding technology can quickly generate a nitride layer on the surface of titanium alloy, improve the surface hardness and wear resistance of titanium alloy, and promote the application of titanium alloy. Fiber laser was used to nitride of Ti-6Al-4V alloy, the electrical conductivity of the spectral emission region was measured using the probe method to define whether a plasma was formed in the spectral emission region during the nitriding process. The emission spectra of nitriding process were collected using a spectrograph. The spectral emission region was photographed using a high-speed camera to study the effect of process parameters on spectral characteristcs, the temperature of spectral emission region the quantity of plasma. Experiments show that the spectral emission region can conduct electricity during the process of fiber laser gas nitride of Ti-6Al-4V alloy, which indicates that the metal vapor plasma was formed in the spectral emission region. This was completely different from the nitrogen plasma formed in the process of CO2 laser gas nitriding of titanium alloy. The number of metal vapor plasma was significantly affected by the process parameters during the process of fiber laser nitriding of Ti-6Al-4V titanium alloy. The metal vapor plasma can be produced in the spectral emission region when the laser power is higher, the scanning speed is lower, the defocusing is low, and the nitrogen content is high. The emission spectrum of the nitriding process is composed of continuous spectrum and liner spectrum. The continuous spectrum is mainly generated by thermal radiation, and the intensity of the continuous spectrum can represent the temperature of the spectrum emission region. The linear spectrum is mainly generated by the extranuclear electron transition of the plasma region, and the intensity of the linear spectrum can represent the quantity of the plasma. In the nitriding process, with the increase of laser power or the decrease of scanning speed, the continuous spectrum and linear spectrum were enhanced, indicating that the temperature of the spectral emission region increases and the number of plasma increases. As the defocus increases, the continuous spectrum and linear spectrum show a complex trend of decreasing first, then increasing and decreasing at last, which indicates that the temperature of the spectral emission region decreases first, then increase and decrease at last, and the number of plasma decreasing first, the increasing and decrease at last. Added a small amount of argon gas, nitriding process can be significantly influenced, the continuous spectra and linear spectra weakened dramatically, with the further increase of argon content, the linear spectrum and continuous spectrum continue to weaken, which indicated that the addition of a small amount of argon to nitrogen reduces the temperature of the spectral emission region and the number of plasma. With the further increase of the amount of argon, the temperature of the spectral emission continues to decrease, and the number of plasma continues to decrease.
Pulsed-RF-glow discharge optical emission spectroscopy (GDOES) is a kind of atomic spectroscopy technology based on the principle of glow discharge, which is widely used to characterize the depth distribution of components in thin-film materials and functional multilayer structures. This technique has the advantages of low vacuum requirement, high sensitivity, and fast sputtering rate. Meanwhile, the instantaneous high-power mode adopted by the pulsed RF power supply makes the periodical bombardment of the sample surface by argon ions, which avoids the melting or carbonization caused by heat accumulation. Therefore, the pulsed-RF-GDOES can be used to analyse the thermal sensitive materials, soft or brittle materials, etc., extending the application range of glow discharge emission spectrum from conductive materials to semiconductor and insulator ones. It is an ideal technique for depth profiling of organic films. As a kind of multilayer composite material, aluminum plastic film is an important packaging material with temperature, weather, water, and acid-base resistance. It has been widely used in packaging food, electronics, and national defense cutting-edge products. In this paper, the depth profiles of high barrier aluminum-plastic films are measured using GDOES. The depth resolution, sputtering rate and signal-to-noise ratio of the measured GDOES depth profiles are quantitatively analyzed under different working parameters to obtain the optimized working parameters. The depth resolution, sputtering rate and signal-to-noise ratio of the GDOES depth profile are calculated quantitatively, with the aluminum signal having relatively high intensity as a calibration peak. The experimental results show that the thermal effect could be significantly reduced by applying the pulsed-radio-frequency power and the mixture gas of Ar and O2, thus expanding the adjustment range of the working parameters. The sputtering rate increases with increasing the sputtering power and gas pressure, the sputtering rate increases; The relationship between depth resolution and power values is a nonmonotonic function with some inflection points. When the sputtering power is 40 W, the depth resolution is optimized; When the sputtering pressure is higher than 950 Pa, the depth resolution is unchanged; With increasing the sputtering power, signal-to-noise ratio increases; with increasing the gas pressure, signal-to-noise ratio decreases. The depth resolution and signal-to-noise ratio are much better by using the mixture gas of Ar and O2 (4 Vol%) than that using the pure Ar gas. The optimized working parameters for the GDOES depth profiling of aluminum plastic film are mixture gas of Ar and O2, working pressure of 950 Pa, power of 40 W, pulsed frequency of 3 000 Hz, the duty cycle of 0.187 5.
Conducting the unmanned aerial vehicle (UAV) hyperspectral unmixing of rice and obtaining the hyperspectral reflectance information of rice plants is of great significance for improving the accuracy of the inversion model of rice physical and chemical parameters. Most of the current research is based on the data of hyperspectral remote sensing images themselves for demixing. That is, unmixing of hyperspectral data is carried out by using algorithm model. In this study, the advantages of hyperspectral images and visible spectral images were complemented, and a hyperspectral unmixing method for UAV in rice field was based on the fusion of UAV high-definition images and hyperspectral images remote sensing images was proposed. This method solved the problem of the limitation of single data and enhanced the description ability of spectral data for ground objects. In order to better calculate the endmember abundance, the high-definition digital orthophotos of the target area were spatially aligned with the UAV hyperspectral remote sensing images, so that the pictures obtained by different sensors were aligned in geometric positions. The supervised classification method of the SVM classifier was used to classify the digital orthophoto of visible light, and the result of the classification was used to correspond to a pixel of the hyperspectrum to obtain the endmember abundance within a pixel. Suppose the endmembers of the water body in adjacent areas were the same, the linear unmixing model (LSMM) was used to unmix the mixed pixels in the adjacent area and finally the hyperspectral reflectance information of rice was obtained. The results showed that the spatial registration of the two images enriches the data source information, which was beneficial to the endmember abundance calculation of the pixels. Among them, the unmixing effect of rice endmember abundance above 70% was the best, the unmixing effect of abundance above 50% was general, and the unmixing effect was poor when the abundance was below 30%. Use the supervised classification method to classify the ground objects with an accuracy of 99.5%, and the classification accuracy of the object-oriented method was 98.2%, the supervised classification method was better than the object-oriented classification method. The final decomposition reflectance of the mixed pixel was higher than that of the original mixed pixel, which reduced the influence of the mixed part of the water body on the spectral data, and made the spectral reflectance of the rice after decomposition more accurate. This research could provide a theoretical basis for the inversion of the UAV imaging hyperspectral remote sensing of rice physical and chemical parameters.
For real-time monitor of wheat stripe rust and large-scale recognization of crop diseases using remote sensing technology, the relations of wheat spectral reflectivity and net photosynthetic rate with disease index were studied under stripe rust stress, and the variation of photosynthetic rate was estimated with spectral vegetation indexes. The stripe rust inoculation test was conducted in field plots during the 2018—2019 wheat growth period. The varieties of Jimai 22 and Luyuan 502 with larger sowing areas were used as test materials, and Jimai 15, sensitive to stripe rust, was used as control. The photosynthetic rate and spectral reflectivity of wheat flag leaves were determined, and the disease index was investigated every 7~10 days from heading stage to milk-ripe stage. It was found that the photosynthetic rate decreased significantly with the increase of disease degree. During the flowering stage, the photosynthetic rate of Jimai 22 was higher than that of Luyuan 502. During the grain filling stage, the reflectivity in the visible spectrum range was higher at the diseased part because of lower chlorophyll content leading to lower absorption but the higher reflex of light. However, in the range of reflection platforms, the spectral reflectivity of the diseased part was much lower than that of the healthy part. The indexes related to disease stress, crop growth and yields, such as photochemical reflectance index (PRI), plant senescence reflectance index (PSRI) and ratio vegetation index (RVI) were used to reflect the variation of the disease index. Compared with the healty part, the PRI and PSRI of the diseased part were high, and the change ratio of PSRI was higher; the RVI of diseased part was lower. At different growth stages of wheat, there were different correlations between photosynthetic rate and spectral reflectivity, and the vegetation index was also different. At the grain filling stage, the correlation between photosynthetic rate and spectral reflectivity of Luyuan 502 was positive in all spectrum ranges, and that of Jimai 15 was also positive in visible spectrum range, while that of Jimai 22 was negative. However, in the range of reflectance platform, that of Jimai 15 and Jimai 22 was opposite. The PSRI could be used to recognize disease degree and estimate the photosynthetic rate in the grain filling period of wheat. These results could provide theoretical bases for monitoring wheat growth status and disease occurrence at a large scale using remote sensing method and layed foundations for estimating wheat stripe rust occurrence and degrees using lossless monitoring spectral indicators.
Leaf area index (LAI) is an important parameter to evaluate crop condition and crop yield. In order to effectively utilize hyperspectral information and improve the estimation accuracy of LAI, the best band was selected, and the new two-band vegetation indexes were constructed. In this study, winter wheat was taken as the research object, the UAV hyperspectral data and ground LAI data were obtained at the booting stage. First, the successive projection algorithm (SPA), optimum index factor (OIF), and each band combination method (E) were used to screen the best band of UAV hyperspectral data, and then the selected best bands were constructed into the new two-band vegetation indexes (VI_OIF, VI_SPA, VI_E). Then, the new two-band vegetation indexes and the conventional two-band vegetation indexes (VI_F) constructed were compared and analyzed for correlation with LAI. Finally, support vector regression (SVR), partial least square (PLSR) and random forest for regression (RFR) were used to construct LAI estimation models. Meanwhile, comparing with the estimation accuracy of the conventional two-band vegetation indexes, the feasibility of LAI estimation was verified by the optimal regression model of the best new two-band vegetation indexes. The results were as follows: (1) The newly constructed two-band vegetation indexes VI_OIF, VI_SPA, VI_E and VI_F correlated with LAI were all at the significant level of 0.05, VI_SPA and VI_E correlated (r>0.65), among which RSI_SPA and RSI_E had the highest correlation coefficient with LAI (r>0.71) ; (2) The accuracy of LAI estimation of winter wheat based on SVR model, PLSR model and RFR model constructed by VI_OIF, VI_SPA, VI_E and VI_F were compared and analyzed. It was found that the VI_SPA_PLSR model had the highest accuracy and the best predictive ability, whose coefficient of determination (R2) and root mean square error (RMSE) were 0.75 and 0.90, respectively. The research results can provide technical support and theoretical reference for the band selection of UAV hyperspectral data and winter wheat LAI estimation.
Spectral index is an important means for real-time estimation of crop leaf chlorophyll. The comprehensive use of spectral technology for real-time and effective diagnosis of crop nutrients is conducive to accurate crop management, ensuring yield and reducing environmental pollution, improving fertilizer utilization, and providing a new way for quantitative estimation of crop biochemical components. However, the estimation results are not satisfactory due to the influence of environmental conditions and internal biochemical components. In order to further improve the anti-interference ability and sensitivity of spectral index in estimating chlorophyll content of crop leaves. In this study, field experiments with different nitrogen gradients were carried out in typical corn-growing areas of Inner Mongolia in 2020. The spectral reflectance and chlorophyll value of leaves were obtained at four key growth stages of corn. The relationship model between the spectral index and chlorophyll value of leaves was established based on area, and the spectral index was optimized and evaluated. It provides an important theoretical basis for the diagnosis of chlorophyll content in maize leaves and an accurate grasp of the nutritional status of crops in a larger area in the future. The results showed that the growth period significantly affected the relationship between area spectral index and leaf chlorophyll value. The published area-based spectral index had a poor estimation effect on leaf chlorophyll content at the seedling stage, but had the best estimation effect on the tasseling stage. In this paper, the area spectral index based on the optimization algorithm significantly improves the accuracy and stability of spectral index in Estimating Leaf Chlorophyll content. The optimized triangle vegetation index (OTVI), optimized chlorophyll absorption integral index (OCAI) and optimized bimodal area normalized difference index (ONDDA) based on the optimization algorithm have stronger performance than the published area spectral index at different growth stages, the coefficient of determination R2 is between 0.94 and 0.99. Compared with OTVI and OCAI, ONDDA is more stable in estimating the chlorophyll content of spring maize leaves at different growth stages. The coefficient of determination R2 of prediction model validation results is 0.94, and the validation error is the smallest, RMSE and RE% are 2.29% and 3.94%, respectively. The validation slope of the model estimated value and the measured value is 0.996, the closest to 1. In conclusion, ONDDA is a practical and suitable area spectral index for estimating leaf chlorophyll content at different growth stages.
Forage is the material basis of animal husbandry production. The detection and evaluation of the nutritional value of forage raw materials and feed products are an important link in feed production. Facing the situation of low crude protein content in forage resources and relying on many imported feeds, soybean, as a high-quality, high protein legume forage, is an important resource for animal husbandry production and utilization. The feeding quality parameters of different forage soybean and different cutting periods can evaluate the feeding performance of forage soybean. However, the chemical method is mainly used for detection, which is cumbersome, long test cycle and is easy to cause operation error. Moreover, the rapid detection of main feeding quality indexes of forage soybean is still blank, which needs to be developed and utilized urgently. Because of the wide application of near-infrared spectroscopy in detection and feed analysis, the whole plant samples of different soybean varieties in different cutting periods were collected by near-infrared spectroscopy in the range of 950~1 650 nm. The content of crude protein (CP), neutral detergent fiber (NDF) and acid detergent fiber (ADF) was detected according to the national standard or industry standard chemical method. The 150 samples data were divided into calibration and verification set according to 3∶2. The prediction models of three main quality parameters CP, NDF and ADF content of forage soybean, were established by combining one or more of four different spectral pretreatment methods, including first-order derivative (NW1st), second-order derivative (NW2nd), standard normal variable transformation (SNV) and detrending (DE-trending), and partial least squares (PLS) regression algorithm. By comparing the coefficient of determination (R2) and root mean square error (RMSE) of calibration set and validation set in regression models, the results showed that the model established by NW1st+DE-trending+SNV+PLS had the best effect. The RC2 and RP2 of the calibration set and validation set in forage soybean CP content model were 0.96 and 0.95 respectively, the RC2 and RP2 of NDF content model were 0.90 and 0.89 respectively, and the RC2 and RP2 of ADF content model were 0.94 and 0.93 respectively. The accuracy and stability of the model were further confirmed by the test and analysis of the validation, and rapid analysis of near-infrared spectroscopy (NIRS) method for the qualitative detection of forage soybean was formed. With the increase of forage soybean quality parameter data, the quality detection model of forage soybean will continuously improve. This method expands the detection category and range of forage resource quality by near-infrared spectrometer and is accurate and efficient, which is conducive to the development and effective utilization of high-quality high protein forage resources.
Hyperspectral nondestructive testing technology is widely used in quantitative nondestructive testing of fruit. In this paper, the spatial characteristic spectra of jujube, grape and pear are taken as the research objectives, and the influencing factors and inversion methods of spatial characteristic spectra are explored, which provides a new idea for improving the accuracy of outdoor fruit nondestructive testing. The spectral library of three kinds of fruits was extracted, and the spatial characteristic spectra were calculated. The characteristic wavelengths were selected by Mahalanobis distance, concentration residual and competitive adaptive weight sampling algorithm. Model characteristic spectra of three kinds of fruits after pretreatment with quality parameters and positional parameters respectively.The modeling results are as follows: In the sugar model, the R of jujube, grape and pear were 0.853 3, 0.822 7 and 0.913 3 respectively; In the water model, the R were 0.741 3, 0.784 7 and 0.891 3 respectively; In the detection angle model, the R were 0.985 6, 0.992 7 and 0.974 7 respectively; In the azimuth angle model, the R were 0.941 8, 0.910 5 and 0.936 9 respectively; In the phase angle model, the R were 0.960 9, 0.957 0 and 0.956 3 respectively. In summary, the correlation of different fruit positional models was significantly higher than quality models. Therefore, the positional factor is the main reason affecting the characteristic spectrum. Therefore, the roujean model and waltall model are used to invert the characteristic spatial spectrum of different directions. The inversion results are as follows: roujean model is used when retrieving the spatial characteristic spectra of three kinds of fruits (in the order of jujube, grape and pear), R2 is 0.934 4, 0.928 1 and 0.830 6 respectively; R is 0.990 2, 0.983 9 and 0.969 1 respectively; RMSEP is 0.030 9, 0.048 7 and 0.062 7 respectively; the average model error is 7.27%, 11.02% and 8.61% respectively. The results showed that R2 was 0.943 3, 0.859 7, 0.839 0; R was 0.991 8, 0.971 8, 0.970 2; RMSEP was 0.036 6, 0.066 1, 0.068 7; the average model error was 6.19%, 15.40%, 7.84%. It can be seen that roujean model can well describe the characteristic spatial spectrum of jujube and grape, and also can better describe the characteristic spatial spectrum of pear; waltall model can well describe the characteristic spatial spectrum of jujube, and also can better describe the characteristic spatial spectrum of grape and pear. In conclusion, roujean model can be used to invert the characteristic spatial spectrum of grape and pear, and waltall model can be used to invert the characteristic spatial spectrum of jujube to improve the accuracy of outdoor fruit nondestructive testing.
The interaction between tartrazine and bovine serum albumin (BSA) was investigated by fluorescence spectrometry, synchronous fluorescence spectrometry, three-dimensional fluorescence spectrometry, ultraviolet spectrometry and molecular docking. The analysis of fluorescence spectrum of tartrazine-BSA showed that tartrazine could effectively quench the endogenous fluorescence of BSA, and the fluorescence quenching constant KSV decreased with the increase of temperature, so the quenching mechanism was static quenching on the basis of stern-volmer equation; According to the static quenching double logarithm formula, the binding constant (KA) was calculated to be 4.335×10⁷ L·mol-1 (293 K) and the number of binding point (n) was approximately equal to 1, which indicated that tartrazine had a strong binding ability with BSA and formed a binding site; The thermodynamic parameters obtained by van’t Hoff’s law (ΔH=-154.5 kJ·mol-1, ΔS=-387.8 J·mol-1·K-1, ΔGr) between tartrazine and BSA was calculated to be 3.310 nm based on the theory of Förster’s non-radiation energy transfer, which indicated that energy was likely to be transfered from BSA to tartrazine; With the increase of the concentration of tartrazine, the synchronous fluorescence intensity of Tyr and Trp residues decreased; The three-dimensional fluorescence spectra analysis showed that the intensities of peak 1 and peak 2 decreased significantly with the addition of tartrazine, and the emission wavelength of peak 2 changed, indicating that the peptide chain structure of BSA changed, and at the same time, the UV absorption peak of BSA increased gradually; The results of spectral analysis showed that the combination of tartrazine and BSA changed the conformation of BSA, thus changed the microenvironment around Trp and Tyr residues, resulting in the decrease of luminous efficiency; The results of molecular docking further illustrated that tartrazine was interacted with amino acid residues on subdomain Ⅲb of BSA and the amino acid residues around tartrazine mainly included: Phe506, Thr507, Ala527, Leu528, Met547, Gly571, Pro572, Leu574, Val575, Thr578; Tartrazine could interact with Thr507 and Thr578 residues by van der Waals force, with Thr507 by hydrogen bond and with other nonpolar amino acid residues by hydrophobic force. This research was helpful to understand the mechanism of interaction between tartrazine and BSA and reveal the distribution, metabolism and toxicological mechanism of tartrazine in vivo.
In order to explore the influence of acidification pretreatment on the extractable composition and macromolecular structure of coal, Gujiao coking coal in Shanxi Province was acidified and demineralized by HCl and HF, and different concentrations of tetrahydrofuran (THF) were selected for solvent extraction experiments of raw coal (RC) and acidified coal (DC). The extraction of raw coal and acidified coal were compared and analyzed using modern technical means such as GC-MS and FTIR. The results show that with the increase of solvent concentration, the extraction rate of raw coal and acidified coal tends to increase. After acidification, the minerals in coal decrease significantly, the solvent permeability increases, and the extraction rate increases. However, acidification pretreatment has no noticeable effect on the extraction rate of high-concentration THF because high-concentration THF solvent can extract dissoluble components from coking coal to a large extent, and acidification pretreatment has a relatively weak promotion effect on dissoluble components. Therefore, with the increase of solvent concentration, raw coal and acidified coal have no apparent effect. After acidification pretreatment, the value of the hydrogen-rich degree parameter (I1) of coal samples decreased significantly, which was 0.61 less than raw coal. With the increase of THF concentration, the I1 value of raw coal decreased first and then increased, while the I1 value of acidified coal increased first and then decreased, showing opposite trends. The aromatization degree parameter (I2) and oxygen enrichment degree parameter (I3) increase obviously, in which I2 value is twice that of raw coal, I3 value is 11.82, almost three times that of raw coal, and after THF extracts raw coal with different concentrations, the oxygen index I3 value increases first and then decreases, while acidified coal decreases. The fat structure parameter (I4) is obviously reduced, which is only 8% of the raw coal, and the I4 value of its raffinate is far lower than that of the raw coal raffinate. The relative content of heteroatom compounds in acidified coal extract is significantly reduced by 83.14%~89.64%, and the relative content of aliphatic hydrocarbons is significantly increased, which is 5~26 times of that in raw coal extract, mainly including straight-chain hydrocarbons such as eicosane, docosane and triacontane, among which C19—C23 accounts for 79.17% of the total components of the extract. Aromatic substances are not found in extracts and only in 100%THF extracts in raw coal, with little change in relative content. It is considered that acidification pretreatment greatly influences the fat structure and oxygen-containing compounds in coal but has a relatively small influence on the aromatic structure.
The regulation of molecular structure and thermal conversion behavior of coal tar pitch is the key to preparing high-quality coal tar pitch-based carbon materials. In order to further clarify the relationship between pyrolysis behavior and molecular structure of coal tar pitch, 8 kinds of extracts derived from Medium temperature pitch (AGMP) were extracted by ultrasonic extraction with 8 kinds of organic solvents at room temperature in this paper. The PeakFit v4.12 software was used to perform peak fitting the infrared spectra of the extracts in four regions of 700~900, 1 000~1 800, 2 800~3 000 and 3 000~3 100 cm-1 to achieve the fine structure information about various functional groups. In addition, six molecular structure parameters (I1—I6) were introduced to characterize the relationship between molecular structure and pyrolysis activation energy of the extracts. FTIR spectra analysis shows that the 8 extracts are complex compounds composed of condensed aromatic ring structures mainly comprised of aliphatic hydrocarbon side chains containing oxygen and nitrogen and other heteroatoms. Moreover, due to the difference in the extractant’s structure, the extract’s molecular structure parameters are also slightly different. The extract obtained from the linear structure extractant has a higher content of chain hydrocarbons (I5), and the extract obtained from the ring structure extractant has more aromatic rings substituted structures (I6). Thermogravimetric analysis (TGA) was used to study the thermal weight loss behavior of 8 extracts at different heating rates (3, 6, 10, 15 K·min-1). Under the condition of equal conversion rate without considering the reaction mechanism, the pyrolytic activation energy (Ea) were calculated and analyzed using the Flynn-Wall-Ozawa method and Kissingr-Akahira-Sunose method. The results indicated that the eight extracts’ pyrolytic activation energies ranged from 78 to 116 kJ·mol-1, which are closely related to the structure and content of functional groups. The structural parameters of the extracts obtained by IR quantitative are correlated with the pyrolysis activation energy. The fitting results of the one-element linear equation Ea=f(Ii) between the structural parameters of the extracts and the pyrolysis activation energy found that the aromaticity index (I3) and the degree of branching (I5) are the two main indicators that determine the pyrolysis activation energy of the extracts. The fitting results of positive and negative correlation between the pyrolysis activation energy with every single index (Ii) indicate the difficulty of the structure being destroyed by pyrolysis. Considering the interaction of various infrared structural parameters, the fitting relationship model between the Ea of AGMP extracts and the infrared spectral structure indexes was shown as followed: Ea=-4 294.53I1+73 812.16I2+207 673.32I3-20 324.20I4-168.56I5+857.86I6. The results, which combined analysis of FTIR spectra, reveal more details about thermal characterization and kinetic characterization and they can be expected to lead to a well-understood coal tar pitch’s pyrolysis.
LED light source has many outstanding performances, including high color rendering, high luminous efficiency, long life and energy saving. It had been widely adopted LEDs lighting for clothing stores. However, there were many problems when choosing a lighting method for a clothing store. For example, the lighting cannot restore the original appearance of the clothing. This can cause consumers to have a weaker perception of the atmosphere and make consumers lose their desire for purchase. This paper was based on the adjustable LED light sources. For the indoor lighting occasions of clothing stores, four types of lighting environments with different physical parameters were designed using general lighting, key lighting, partial lighting and mixed lighting, respectively. With the help of the semantic differential scale of psychophysical experiments, subjective evaluation questionnaires were formed using 36 sets of word pairs. It was using 22 observers (11 males, 11 females) to simulate consumer’s subjective evaluation of preference, attractiveness, coziness and color fidelity of five colors of clothing (black, blue male’s clothing and white, red and yellow female’s clothing) corresponding to the every lighting environment. The difference coefficient was used to verify the stability and accuracy of the subjective evaluation data, and all the data was confirmed to be reliable and valid. The principal component analysis method was used to evaluate the effects of corresponding lighting methods. The basic dimensions of the lighting environment atmosphere of the clothing store had been evaluated as liveness, coziness and commercial. One-factor analysis of variance was used to determine further that liveness was the most important basic dimension of clothing stores. Moreover, this paper analyzed the effects of clothing color on observers’ color perception under the four LED lighting environments. The research results showed that the general lighting method was similar to the traditional light source in terms of lighting effects, and the consumer evaluation indicators were generally lower in clothing stores. Therefore, the general lighting method should not be used alone in clothing stores; the mixed lighting method was more suitable for illuminating black and blue male’s’s clothing and red females’ clothing than other lighting methods. The lighting effect produced was more attractive to consumers; Consumers preferred to illuminate yellow female’s clothing with the particle lighting method. However, the evaluation index of blue male’s clothing was very low under the particle lighting method by consumers. Blue male’s clothing should avoid using partial lighting method in clothing stores. The use of key lighting illuminated white females’ clothing that attracted consumers’ attention.
In situ measurement of water spectrum is one of the indispensable basic works in the research of water optical properties and watercolor remote sensing inversion modeling. The conventional oblique observation method is restricted by its strict observation geometric conditions, it is necessary to constantly adjust the observation angle according to the position of the ship and the azimuth of the sun, especially for the spectral observation of river water, need to consider the river direction, shoreline shelter and other conditions. Therefore, only a few stations can be set for observation of discrete sample points, it is not easy to carry out rapid observation for continuous navigation in the river water with complex environments around the shoreline. The rapid observation for continuous navigation of the field water spectrum can obtain the reflectance spectrum of large samples of water from different local times, enrich the understanding of the bidirectional reflection characteristics of water, and establish more accurate inversion models, which plays an extremely important role in the study of watercolor remote sensing. Because of this, a rapid observation method for continuous navigation of reflectance spectrum of inland river surface water based on vertical observation geometry is designed in this study, and then obtained the full-wavelength remote sensing reflectance data of the whole river through Spatio-temporal matching technology. The experiments in some sections of XiXiao River in Hangzhou show that the correlation coefficient between remote sensing reflectance obtained by this method and the watercolor components such as chlorophyll concentration and turbidity measured synchronically is strong, the determination coefficients R2 are all greater than 0.855 at the characteristic bands selected in this study. The observation zenith angle of Sentinel-2 is close to 0, close to vertical observation. In this study, use the spectral response function of Sentinel-2B to perform equivalent spectral simulation of the measured spectrum and converts it into the equivalent remote sensing reflectance of the corresponding bands. The inversion result is modeled with the sensing reflectance data after atmospheric correction based on Sen2Cor. The analysis results show that the remote sensing reflectance data after atmospheric correction based on Sen2Cor is obviously overestimated. At the same time, use of Sentinel-2B’s atmospheric apparent reflectance to deduce the radiance, then used FLAASH atmospheric correction to obtain the remote sensing reflectance of Sentinel-2B. By modeling and analyzing the equivalent remote sensing reflectance, the remote sensing reflectance data after atmospheric correction based on FLAASH is also overestimated when it is less than 0.02 sr-1, but obviously underestimated when it is greater than 0.02 sr-1. Research shows that the large sample measured remote sensing reflectance data obtained by this method has the application potential to verify the authenticity of satellite reflectance products.
The spectrum is a comprehensive reflection of the mineral’s physical chemistry characteristics, composition and structure, which has been used in mineral and rock identification. The traditional classification methods of the mineral spectrum require complex spectral pretreatment, and then some spectral features are analyzed by different methods to achieve the goal of fine classification. However, the pretreatment may cause a partial loss of the spectral information and reduce the classification accuracy. Besides, the operation process is complex, so the efficiency is low, making it difficult to cope with the growing demand for big data processing. Therefore, it is important to establish an accurate, efficient and automatic classification model for the mineral spectrum. As one of the widely used deep learning models, the convolutional neural network extracts data features layer by layer and combines them to form higher-level semantic information. It has a strong capability of model formulation and great potential for the analysis of spectral data. This paper proposes a novel mineral spectrum classification method based on a one-dimensional dilated convolutional neural network (1D-DCNN). The DCNN is used for spectral feature extraction. The backpropagation algorithm combined with the random gradient descent optimizer is used to adjust the model’s parameters, then output the classification result, which implements the end-to-end discrimination of mineral species. The 1D-DCNN includes one input layer, three dilated convolution layers, two pooling layers, two full connection layers and one output layer. It uses cross-entropy as the loss function, and dilated convolution is introduced to enlarge the receptive field of filters effectively avoid the loss of spectral feature details. The spectrum of four different minerals, muscovite, dolomite, calcite and kaolinite, are collected, and the data are augmented by way of adding noise to construct sufficient spectral samples, which are used for model training and testing. Then, we explore the impacts of different model parameters, such as the convolution type and the number of iterations, and then compare the proposed model with the traditional mineral spectrum classification methods to evaluate its performance. Experimental results indicate that the 1D-DCNN model can quickly and accurately classify mineral spectrum with the accuracy of 99.32%, which is superior to the backpropagation (BP) algorithm and support vector machine (SVM) methods, and it shows that the proposed method can fully learn mineral spectral features and implement a fine classification result, with good robustness and scalability. The proposed method can apply further to the spectra classification in coal, oil-gas, lunar soil and other fields.
Chlorophyll content is an important indicator of crop health, plant productivity, and environmental stress. Real-time, fast and accurate acquisition of leaf chlorophyll content of crops is of significant for monitoring crop growth. Remote sensing is an effective way to retrieve leaf chlorophyll content of crops at regional and global scales. However, previous studies retrieving leaf chlorophyll content of crops does not fully consider the impact of underlying surface background, limiting retrieval accuracy. To this end, this paper aims at the inversion of rice leaf chlorophyll content from Sentinel-2 remote sensing satellite data using a look-up table based approach. The look-up table was simulated using the PRAOSAIL radiation transfer model. The applicability of chlorophyll indices (CI) calculated from the reflectance of the green band and different red-edge bands and the spectral index (Zarco and Miller, ZM) constructed by two different red edge bands in inverting leaf chlorophyll content was evaluated using field measurements. The greenness index (G) was integrated with CI and ZM to constrain the impact of background on the inversion of leaf chlorophyll content. The main findings of this study are: (1) The accuracy of leaf element content inversion based on the spectral index constructed in different bands is different, and CI740 performed the best (R2=0.79, RMSE=9.02 μg·cm-2), followed by ZM (R2=0.71, RMSE=10.53 μg·cm-2), CI705(R2=0.69, RMSE=9.17 μg·cm-2), and CI783(R2=0.67, RMSE=10.84 μg·cm-2); (2) The inverted leaf chlorophyll content is significantly affected by the background, especially at the early stage of rice growth. The inverted leaf chlorophyll content was systematically lower than observations (mean relative error (MRE) in the range from -18.87% to -31.94%) owing to strong background interference; (3) CI/G and ZM/G can effectively eliminate the influence of background and improve the accuracy of rice leaf chlorophyll inversion. At the early stage of rice growth, inversion based on CI/G and ZM/G significantly improves agreement between inverted and observed leaf chlorophyll content (MRE in the range from 8.11% to 18.11%). These findings are of great significance for improving the inversion of leaf chlorophyll content under different leaf area index levels of rice from remote sensing data.
Solar-induced chlorophyll fluorescence (SIF) can sensitively reflect crop disease stress information, but the geometric structure of canopy and other factors seriously affected the ability of SIF to capture changes in photosynthetic function and stress status of vegetation. Therefore, in this paper, the normalized difference vegetation index (NDVI) and MERIS terrestrial chlorophyll index (MTCI), which can sensitively reflect crop biomass, were integrated with SIFP (SIFP-NDVI,SIFP-MTCI,SIFP-NDVI*MTCI), and the remote sensing monitoring accuracy of SIF on wheat stripe rust before and after the integration was compared and analyzed. The results show that: (1) at the O2-B, O2-A and H2O absorption at 719 nm bands, integrated reflectance spectral indices of SIFP-NDVI, SIFP-MTCI and SIFP-NDVI*MTCI showed different improvements in correlation with disease index (DI) than SIFP. The O2-B band increased the most significantly, by 23.48%, 33.61% and 36.49% respectively, while the O2-A band increased the least by 2.39%, 2.14% and 1.51%, respectively. (2) If SIFP-NDVI and SIFP-MTCI were regarded as independent variables respectively, the averaged R2 value of the prediction model based on random forest regression (RFR) algorithm were increased by 1.15% and 4.02%, and the averaged RMSE value were decreased by 2.7% and 14.41%, respectively, compared to those with SIFP as the independent variable. (3) The prediction model based on SIFP-NDVI*MTCI gave the best performance with an R2 value 5.74% higher than that of SIFP, and an RMSE value 22.52% lower than that of SIFP. The results of this paper are of great significance to improve the accuracy of remote sensing monitoring of wheat stripe rust and have a certain reference value for disease monitoring of other crops.
Hyperspectral remote sensing is an effective method for coal mining area detection, and it is of great significance for coal resource surveys and environmental monitoring in the mining area. At the same time, reflectance spectrum characteristics of remotely measured objects such as coal, gangue, vegetation and water body in all directions are the basis of hyperspectral remote sensing in the coal mine. In this paper, the directional reflectance spectra of typical types of coal were studied. Four typical types of coal in the three major coal types anthracite, bituminous and lignite were collected from different mining areas in China. According to the increasing rank, these coals included No.1 anthracite, meager coal, gas coal and No.2 lignite. Spectral reflectance curves of each type of coal in all directions in hemispheric space were measured in the near-infrared band (1 000~2 500 nm) using the spherical coordinate device for directional reflection measurement in the laboratory. By waveforms of spectral reflectance curves acquired, it was found that near-infrared reflectance spectrum curves of the same coal in different reflection directions show similar waveforms. However, there are some differences in overall reflectance and local waveforms, and the rule is that the absorption valleys become more obvious with increasing overall reflectance. With increasing reflection angle, reflectance spectrum curves of all these four types of coal rise on the whole in the forward direction (180° azimuth), but the change is relatively small in the backward direction (0° azimuth). In each directional reflectance spectrum curve in the hemispheric space of each coal, five characteristic wavelength points, including 1 400, 1 700, 1 900, 2 200 and 2 300 nm were selected. By polar nephograms of the spatial distribution of reflectance at the five wavelength points, it was found that all these four types of coal show bidirectional reflection and prominent hot spots in the forward direction and relatively weaker hot spots in the backward direction. The hot spots in the backward direction of No.1 anthracite appear relatively more obvious than those of meager coal, gas coal and No.2 lignite. With decreasing coal rank, meager coal, gas coal, and No.2 lignite show the rule of relatively enhanced hot spots in the backward direction. The correlation between reflectance and reflection angle of backward and forward direction at the five wavelength points of each type of coal were analyzed. It was found that the correlations between reflectance and reflection angle are approximately linear and Gaussian functions in forwarding and backward direction respectively. Moreover, with decreasing coal rank, the peak of the Gaussian fitting curve moves to a larger reflection angle. This study provides the basis for the selection of the optimal detection geometry and reference for precise detection of coal resources in hyperspectral remote sensing of mining areas.
Along with promoting the color extension green technology demonstration project in Beijing, color-leaf plants play an increasingly prominent role in urban landscape construction and improvement of the living environment, especially in recent years. If the regional distribution and growth characteristics of urban colorful leaf plants can be observed quickly and lossless by using hyperspectral technology, important theoretical basis and data support can be provided for further optimizing the layout of urban colorful leaf plants and accelerating the construction of urban color-leaf plants system. In recent years, the rapid development of hyperspectral remote sensing technology provides a lot of ground cover plant spectral information and improves the spectral resolution and response range. Plant spectrum has a series of characteristic absorption bands, which can indicate the differences between different tree species, and is the basis of hyperspectral tree species identification. This paper selected 15 species of colorful leaf plants with different color systems in Beijing as the research object. Moreover, the SR-3501 portable surface feature spectrometer was used to analyze the characteristics of the hyperspectral reflection curve of leaves of plants of different color families in autumn. The difference and variation of the characteristic bands and characteristic parameters of plants of different color families were further studied through the differential transformation and feature parameter extraction. The results showed that Euonymus japonzcus had the characteristics of typical green vegetation spectral curve, which were the changes of “peak” and “valley”; the spectral reflection characteristic of purple leaf plants was similar to that of green plants; the spectral reflection characteristic of red leaf plants was similar to that of yellow leaf plants. Based on spectral absorption characteristic parameters, the green/red peak position of different color plants showed a trend of red leaf plants>purple leaf plants>yellow leaf plants>green leaf plants, and green/red peak reflectivity, red valley location and red valley reflectivity were all represented by the yellow leaf plants>red leaf plants>purple leaf plants>green leaf plants. The characteristic spectrum parameters of the three sides of different color plants had certain regularity and can be used as the characteristic parameters to distinguish the different colored plants with green plants. In comparison, the red amplitude and red edge area, yellow amplitude and yellow edge area, blue amplitude and blue edge area could be used as the important spectral characteristic parameters to distinguish the purple leaf plants, the red leaf plants and the yellow leaf plants from green plants. This study provides a theoretical basis for applying the hyperspectral technique in the future observation of urban color leaf plant system construction.
The Nanhong agate is one of the most common red agates in the Chinese jewelry market. The market of the Nanhong agate is thriving, and Nanhong agate imitations are flourishing, while few studies have been conducted on the differences of materials and spectral characteristics between the natural Nanhong agate and its imitations. In this paper, the conventional gemological instruments, Microscope, UV-Vis spectrometer, Raman spectrometer and Fourier infrared absorption spectroscopy(FTIR) were employed to study two kinds of the Nanhong agate imitations and the natural Nanhong agate. The results show that the two kinds of the Nanhong agate imitations are both composed of quartz, similar to the natural Nanhong agate, and have a similar refractive index, density, hardness, color, luster, and other physical properties relative to the natural Nanhong agate, with inertia under both short-wave and long-wave ultraviolet light. The first imitation (FZP-1) imitates a cherry red bracelet, exhibiting a light orangey-red as indicated from the spectrum of the UV-Vis showing a broadened absorption band between 240 and 570 nm. The FZP-1 displays granular texture and a pulp luff-like shape, with red dyestuff filling along the edge of the quartz granular, a typical structural characteristic of a dyed quartzite. The second imitation (FZP-2) imitates a persimmon red bracelet with a yellow orange red color as demonstrated by an absorption band from 300, 240 nm to 550, 540 nm under UV-Vis. The natural Nanhong agate(TR) showed an absorption band from 440 to 560 nm under UV-Vis. The FZP-2 shows a cryptocrystalline structure, whose banded and nail-like structures can be observed on the surface, and whose different colors are shown in different layers, indicative of dyeing and heating treatments of the FZP-2. The nature Nanhong agate exhibits cryptocrystalline texture and contains spot-like hematite, which is remarkably different from the internal structures of two imitates. The FTIR spectrum reveals quartz’s typical spectrum characteristics for both of the two kinds of Nanhong agate imitations and the natural Nanhong agate. The absorption peaks existed in the range of 1 100~1 250 and 600~800 cm-1 are attributed to the So—O—Si’s asymmetric and symmetric stretching vibration, respectively. The peaks at 300~600 cm-1 are assigned to the bending vibration of Si—O—Si. The peaks around 800 cm-1 in FTIR patterns are splitting in both samples, indicating a good crystalline degree of quartz. Peaks between 2 800~3 200 cm-1 are detected at the particle clearance in the FZP-1 under micro-infrared spectroscopy, which is related to organic dyeing agent, especially at 2 916 and 2 848 cm-1 to the stretching vibration of C—H. In addition to the peak position of quartz, the Raman spectrum of the FZP-1 show peaks at 915 and 1 337 cm-1, due to the bending vibration of the saturated C—H, which are related to organic dyeing agent, in good agreement with the result of micro-infrared spectroscopy. The peak at 502 cm-1 in the Raman spectrum indicates the existence of moganite in the ZFP-2. The ratios of relative content of moganite and quartz are calculated spanning 0.15~0.16, based on the ratios of characteristic peaks of moganite and quartz in the Raman spectrum, which is higher than the natural Nanhong agate. Rather than, the peaks relate to hematite is inexistent in both of the two kinds of imitations. The first and second imitations should be named as dyed quartzite and agate, respectively, according to the national standard of Gems-Nomenclature.
The ionospheric characteristics such as total electron content and plasma bubble parameters can be retrieved by observing the ionospheric airglow with spaceborne imager. Atoms and molecules absorb solar radiation and excite to higher energy states in the daytime. At night, they radiate the energy in the form of airglow. The radiation intensity is related to the density of ionospheric components. Therefore, airglow is an excellent tracer for observing the ionosphere. In order to promote and optimize the design of space-borne imager and enrich the ionospheric detection methods, it is necessary to conduct imaging simulation analysis of global airglow. The main works of this paper are as follows: (1) the photochemical reaction process of 630 nm radiation at night is analyzed, and a simulation analysis method of airglow imaging is designed. The intensity distributions of airglow in four different seasons with high and low solar activity are obtained, which provide a theoretical basis for setting detection index; (2) the simulation research of space-borne imaging is carried out, including imaging chain and signal-to-noise ratio analysis. A typical imager parameter with a time-delay integral imaging method is used to carry out the simulation combined with the satellite orbit. The main conclusions are as follows: (1) the intensity of 630 nm at night is closely related to the solar radiation intensity in the daytime. The average night radiation intensity with high solar activity is 115 Rayleigh, and that with low solar activity is 50 Rayleigh, the radiation intensity and distribution are consistent with the actual observation results of GLO-1 and ISS-IMAP; (2) the observation width and horizontal resolution of typical parameter imager reach 245 km and 1 km. The signal-to-noise ratio is more significant than 10 for the intensity greater than 50 Rayleigh, it means the typical parameter imager can observe the global structure of ionospheric airglow with high solar activity. The research results in this paper provide a theoretical basis for space-borne ionospheric airglow detection and provide a reference for observing other wavelengths.
The study of electron transfer in life has attracted much attention, and the research on the electron transfer of proteins and enzymes has become a hot spot. However, electron transfer may be an effective way to explain this mechanism. The detailed mechanism of photoinduced heme protein reduction is still unclear. In this paper, UV-visible absorption spectroscopy, steady-state fluorescence spectroscopy and circular dichroism spectroscopy were used to study the effects of different UV wavelengths systematically, pH, amino acids,Glutathione and Imidazoleon the photoreduction of Cyt b5 in vitro near-physiological environment to clarify the photoreduction mechanisms of Cyt b5 which wasn’t proposed by the traditional methods. The results show that ferric cytochrome b5 can be photoreduced to the ferrous state by direct photoexcitation in the near-ultraviolet region. In this study, we studied the mechanism and facilitating conditions for photoreduction. Based on the sort band blue-shifted of 412 nm and absorbance intensity increase of Q band 556 nm, Cyt b5-FeⅢ in phosphate-buffered was photoreduced to Cyb5-FeⅡ similar to the action of a chemical reducing agent occurs. Considering that the fixed wavelength, pH values, amino acids and ligands of photoreduction were irradiated by 280 nm light, Cyt b5 had the strongest reduction degree. Under 280 nm alkaline conditions, Cyt b5 had the strongest reduction degree; glutathione and imidazole promoted the photoreduction reaction by providing electron and hydrogen donors; free Met in solution promoted the photoreduction reaction at the maximum rate happened. The photoreduction mechanism of Cyt c was intramolecular electron transfer, including the formation of porphyrin cation radical as an active intermediate excited by 280 nm light. In addition, results of fluorescence and CD spectra indicated that the protein-peptide chain structure, while the secondary structure of the protein changes, α-helix content decreased, β-sheet content increased.However, the secondary structure of Cyt b5 is still dominated by α-helix in the photoreduction process. Moreover, it provides a theoretical basis for the redox reaction and electron transfer mechanism in life.
Generally, fossil resins emit distinct fluorescence under ultraviolet illumination. However, their phosphorescence remains to be characterized. In this paper, six Indonesian fossil resins similar to the Dominican blue amber, are further divided into three parts: white inclusions (Part Ⅰ), dark inclusions (Part Ⅱ), and basal body (Part Ⅲ). By the infrared spectrometer, three vibration peaks at 1 384, 1 377, and 1 367 cm-1 indicate that these Indonesian fossil resins were derived from the Dipterocarpaceae plant. Firstly, we investigated three-dimensional fluorescence contours from three parts in Indonesian fossil resins. The results show the emission wavelengths covering the 330~380 nm ultraviolet area (excited by 235 nm), the 388 nm (excited by 330 nm), and the 446, 474 and 508 nm in the blue-green area (all excited by 440, 415 and 395 nm). It suggested at least two fluorophores contributing to the visible-range fluorescence. The relative concentration of these two fluorophores varies from Part Ⅰ to Part Ⅲ. Additionally, Indonesian fossil resin (copal) radiated a bright greenish-yellow phosphorescence when irradiated with a 365 nm ultraviolet light. Part Ⅱ & Ⅲ have a strong phosphorescence covering 460~650 nm with an emission center at 537 nm, while Part Ⅰ is close to 430 nm. The lifetime of 537 nm emission lasts more than 100 ms, while that of 430 nm emission is about 50 ms. These luminescence differences indicate that Part Ⅱ & Ⅲ underwent more aromatization than Part Ⅰ in the fossilization process.
Malachite green is an artificially synthesized triphenylmethane compound. The disadvantages of conventional detection methods for malachite green, such as complicated pre-treatment, long time-consuming and requiring the use of large instruments, result in the inability to detect promptly. So it is of great importance to invent a method that can detect malachite green residue effectively, rapidly and conveniently. Molecularly Imprinted Polymers (MIPs) are multiporous materials with specific recognition sites that allow the recognition and adsorption of specific target molecules. The rare-earth complexes emit fluorescence at 618 nm, and the maximum absorption wavelength of malachite green is also 618 nm, and the combination of the two produces fluorescence quenching effect. Thereby a rare-earth complex based molecularly imprinted fluorescent probe was developed to detect malachite green in aquatic products. The specific content of malachite green in aquatic products was calculated by detecting the degree of its fluorescence quenching at 618 nm. A malachite green molecularly imprinted polymer was prepared by precipitation polymerization method using cryptic malachite green as a template, methacrylic acid as a functional monomer, ethylene dimethacrylate as a crosslinking agent, modified silica as a core, and the rare-earth fluorescent complex Eu(MAA)3phen as a fluorochrome, in the following conditions∶template∶monomer∶crosslinker=1∶4∶10, Rare earth complexes=15 mg, acetonitrile 60 mL, Molecular imprinting of rare-earth complexes, which have been successfully synthesized, was verified by carrying out TEM and FT-IR scanning analysis, and the fluorescence lifetime when examined was found to be 1 094.11 μs. However, the fluorescence lifetime after the addition of malachite green was 587.49 μs. The decrease of fluorescence lifetime illustrated that the quenching of MIPs by malachite green belonged to the fluorescence resonance energy transfer fret. After verifying the selectivity and adsorption properties of MIPs, malachite green was examined. The linear range of the optimized polymer for malachite green was 0~20 μmol·L-1, the fluorescence quenching coefficient F0/F shows a good linear relationship with the malachite green concentration, and the linear equation is F0/F=1.008c+0.344(0.1~1 μmol·L-1, R2=0.991), F0/F=0.587c+0.570(1~20 μmol·L-1, R2=0.999) with a detection limit of 0.037μmol·L-1 (3σ/S, N=9), which was successfully applied as a fluorescent probe for the detection of malachite green in fish meat, with spiking recoveries in the range of 95.61%~102.51%. These results indicate that the developed MIP based probes can detect malachite green residues easily, rapidly and accurately.
Triplet-triplet annihilation (TTA) upconversion is a spectral conversion technique with large anti-stoke shift under the incoherent low-power photoexcitation. And the excitation and emission wavelengths are adjustable. Therefore, TTA upconversion has an important application value in improving solar energy utilisation. Tremendous advances have been made on the sensitizers, but the research on the emitters is relatively backward. In this paper, 2-substituted anthracene derivatives (DTACl and DTACN) were used as the emitter doped with Ru(Ⅱ) polypyridine complex [Ru(bpy)2Phen]2+ (as the sensitizer) to set up the TTA upconversion models. The effects of anthracene 2-substituents on the luminescence efficiency, triplet-triplet energy transfer (TTET), TTA have systematically studied through the emission and upconversion spectra of the sensitizer the emitter. It is found that DTACl has higher fluorescence quantum yield, larger triplet quenching constant and higher TTA efficiency than DTACN. These results make the upconversion efficiency of [Ru(bpy)2phen]2+/DTACl higher than that of [Ru(bpy)2phen]2+/DTACN. Additionally, from the aspect of orbital energy level, the relationship between the triplet energy difference of the sensitizer and the emitter and the TTET efficiency, as well as the relationship between the singlet/triplet energy difference of the emitter and the TTA efficiency, were studied based on the emission spectra and the density functional theory calculation. The research results show that reducing the ability of the 2-substituted group to withdraw electrons can effectively improve the triplet energy level, which is conducive to the TTET efficiency due to the decrease of the triplet energy difference between the emitter and the sensitizer. At the same time, it is good for the TTA efficiency due to the increase of the emitter’s singlet/triplet energy difference. The triplet energy level has an important influence on the TTA upconversion efficiency. This work provides a simple and feasible method for designing new and efficient triplet emitters.
Elemental analysis is an essential requirement in the metallurgical industry, nuclear industry, pollution detection and environmental monitoring. As a new type of atomic spectrum analysis technology, LIBS has been widely concerned because of its real-time, fast, almost non-destructive and multi-element simultaneous analysis. However, its poor analytical sensitivity has restricted the development of this technology. LIBS-LIF can improve the sensitivity of analysis and efficiently detect the element types of samples through laser resonance excitation. The spectrometer can collect spectral information and a model can be established to predict the concentration of unknown samples. However, when the characteristic spectral lines of the matrix atom and the target atom are very close, the matrix spectral lines will be affected, and the unary calibration accuracy will decrease. In this paper, linear models of Ni and Cr elements in steel were established using linear fitting with one variable and linear fitting with multiple variables. Firstly, the peak spectral line in the sample spectral map is selected to find whether it is the characteristic spectral line corresponding to the element to be measured or the collective element. After selecting suitable characteristic spectral lines, the spectral intensities of multiple spectral lines and the concentrations of the elements to be measured in the sample were used as a multivariate linear fitting model, and the fitting coefficients corresponding to each spectral line were ranked from highest to lowest, and the contribution of the spectral intensities corresponding to each characteristic spectral line in the multivariate linear fitting model to the concentration prediction was taken as the criterion from highest to lowest, and the fitting dimension was increased continuously. The mean relative errors of the regression models for Ni and Cr elemental content were reduced from 38% to about 10% and 55% to within 25%, respectively, and the root mean square error values of the cross-validation of the linear regression models for Ni and Cr elemental content were reduced from 3.4% to 2% and 2.5%, respectively, with the increase of dimensionality. and 2.5% to 1.5% for Ni and Cr, respectively. In this paper, the method of selecting multiple spectral lines to establish a multiple linear regression model is relatively effective in reducing the influence of excitation interference, and it puts forward a feasible scheme for promoting the practical application of laser-induced fluorescence assisted laser-induced laser spectroscopy technology in element analysis.
Site-specific variable spraying is an effective approach to reducing pesticide use and improving the use efficiency for crop protection against disease, pests and weeds through chemical spraying, and target detection is a key procedure for site-specific variable spraying. Active illumination was adopted to detect green plant targets (crops and weeds), and the fluorescence spectral information of targets was analyzed. White, blue and red LEDs were utilized for illumination, and the spectra of green plants and others were collected in four circumstances, i.e., day-indoor, day-under sunshine, day-shadow, and night-dark environment. Classification models were built based on multi-wavebands spectral features using soft independent modeling of class analogy (SIMCA) and linear discriminant analysis (LDA) methods. Results showed that with the illumination of the three types of LEDs, the recognition rates for the prediction dataset using SIMCA models were all above 92%, and corresponding rejection rates were all 100%. The LDA models could predict all samples with 100% accuracy, performing better than SIMCA models. And the difference in the effect of the three types of LEDs was indistinguishable. -The objective function for classifying green plants and others was proposed, and the particle swarm optimization (PSO) method was used to select the optimal single waveband. The optimal waveband for the three types of LEDs (white, blue and red) was 731.1, 730.76 and 731.1 nm, respectively, and corresponding thresholding classification models were established. Results showed that the classification F1-scores for the three classification models were 76.71%, 80.52% and 78.48%, respectively. Under complex circumstances, the blue LED provided the best illumination for greed plant detection. The selected blue LED light source and optimal waveband are valuable for developing low-cost green plant sensors.
To determine the relationship between the thermal evolution degrees and Raman spectra of reservoir bitumens, bitumen from the reservoir in the Baiceng area of Southwest Guizhou Province was quantitatively analyzed using non-destructive Raman spectroscopy and fluid inclusion. Firstly, the homogenization temperature of fluid inclusions associated with the reservoir bitumen was obtained. The Raman spectrum of the bitumen was then obtained and compared with the maturity distribution standard for bitumen to determine the homogenization temperature, thermal evolution degree, and characteristics of the bitumen in the study. The results indicate that hydrocarbon reservoir charging events occurred in the Baiceng area of Southwest Guizhou in the Late Triassic (230 Ma) and Oligocene (30 Ma) and that the hydrocarbon-forming fluid had the characteristics of multi-stage hydrocarbon accumulation, these two oil and gas charging events are the ultimate source of reservoir bitumen in this area. Bitumen is the natural cracking product formed by the thermal metamorphism of oil. With the increase of burial depth, bitumen is continuously polymerized or carbonized. The formation of reservoir bitumen is accompanied by two stages of aqueous thermal fluid events, and the homogenization temperatures of aqueous inclusions are 93.5~96.7 and 101.2~103.7 ℃. The results show that the Raman shift range of D peak is 1 334~1 346 cm-1, the Raman shift range of G peak is 1 607~1 610 cm-1, the difference G-D is 264~275 cm-1, and the Dh/Gh value is 0.552~0.573. According to the bitumen maturity distribution chart, the bitumen in the reservoir has reached the over-mature stage. The energy intensity ratio of D peak to G peak (R1) is 0.573,the full width at a half ratio of D peak to G peak(R2) is 1.688~1.945, and the ratio of D peak to the (D+G) integral peak area (R3) is 0.68~0.72. The Raman spectrum analysis indicates that the fluid temperature of the regional paleo reservoir is 122.78~164.31 ℃. The reservoir bitumen in the Baiceng area of Southwest Guizhou is derived from allochthonous migration-type organic matter. The similarities in laser Raman spectrum characteristics indicate that the reservoir bitumen samples have the same origin. They are products of the transformation of oil and gas materials that escaped from the preexisting paleo reservoir along the ore-controlling structure in the study area. Finally, the relationship between the Raman spectrum and thermal evolution of bitumen is determined, providing a theoretical basis for studying the evolution of ancient reservoir oil into reservoir bitumen.
This paper investigates coherent conditions for smaller anti-Stokes Raman scattering imaging sample size than the system point spread function size and the reasons for depth around coherent anti-Stokes Raman scattering images using experimental design and analysis models. The axial transmission dynamic displacement light method, which subtracts axial light from the coherent volume element, is introduced to model and analyse lateral and axial dimensions for spherical or cylindrical samples with a smaller diameter than the system point spread function. The Gouy phase shift effect was approximately zero for small sample size and large refractive index. The main reason was the interaction between sample refractive index and the surrounding environment, and the system coherent tomographic volume element effective length. The obtained results apply only to CARS image analysis, where the sample size is smaller than the system point spread function, but it is also the first paper that clarifies the underlying reason for depth around CARS images using design experiments and quantitative model analysis. Successful nano-imaging analysis using axial transmission dynamic displacement light verified that the nano-action mechanism is similar to coherent action length, effective action length and its travel path.
Spectral extinction method is widely used in the field of Particle Size Distribution (PSD) measurement. During the inversion process of particle size by spectral extinction method, the speed and accuracy of the whole inversion process are greatly affected due to the problems of complex theory, complicated calculation, slow convergence speed and unstable solution of particle extinction coefficient. Moreover, in the extinction data of many wavelengths, there is more repeated redundant information, which also greatly increases the time of the inversion algorithm. Aiming at the problems of complicated calculation and low inversion efficiency of spectral extinction PSD inversion algorithm, a spectral PSD analysis method based on Principal Component Analysis (PCA) and Back Propagation (BP) neural network was proposed. Based on Mie scattering theory, the spectral extinction values under different particle sizes and wavelengths were simulated and calculated. Through the PCA of the spectral extinction data set and the calculation of the comprehensive load coefficient of each wavelength, the optimal characteristic wavelength was selected. The PCA-BP neural network model was trained by using the reduced spectral extinction data, and the PSD was calculated by using the network model. Through simulation calculation, the prediction accuracy of PCA-BP neural network model was compared with the traditional BP neural network model, and the influence of wavelengths number on the prediction results of the two neural network models was analyzed. Based on the trained PCA-BP neural network model, the verification experiment of spectral extinction inversion algorithm of PSD was carried out, and an experimental system for PSD measurement by spectral extinction method is established. Six types of standard polystyrene particles with different particle size parameters ranging from 0.5 to 9.7 μm were measured. Simulation and experimental results show that the correlation between each wavelength vector can be determined based on the PCA method, and the extinction value corresponding to the optimal characteristic wavelength can be selected by using the comprehensive load coefficient, which has good representativeness of the overall spectral data and can realize the dimensionality reduction of spectral data. Compared with the traditional BP neural network model, the analysis method of PSD based on the PCA-BP neural network model has higher prediction accuracy and has more obvious advantages for predicting distribution parameters of more dispersed particle systems. Moreover, when the number of selected wavelengths is small, the PCA-BP neural network model still has high prediction accuracy. The trained PCA-BP neural network model is used to verify the particle size parameters experimentally. The PSD prediction results can be output instantaneously, and the error is within 5%, which verifies the algorithm’s feasibility.
Accurate detection of CH4 is essential to prevent gas explosion and ensure safe production. However, the gas detection technology based on tunable diode laser absorption spectroscopy (TDLAS) has a large error due to temperature change. This paper explored the CH4 detection based on TDLAS technology and the temperature compensation method, analyzed the impact of temperature on CH4 absorption line, and finally eliminated the impact of environmental temperature on the CH4 detection through algorithm compensation model. This study used TDLAS technology’s principle and theory to design the transmitter unit, absorption cell, signal receiver unit and data processing unit. A CH4 detection system based on TDLAS technology was established, the concentration of CH4 at different ambient temperatures (10~50 ℃) was measured, and the effect of temperature change on the intensity and half width at half-maximum of CH4 absorption line at 1.653 μm was analyzed. In order to eliminate the influence of temperature on CH4 detection and improve the compensation effect, the particle swarm optimization (PSO) was employed to optimize the optimal weight and the threshold of back propagation neural network (BPNN). The PSO-BP temperature compensation model of CH4 was established, which overcame the characteristics of slow convergence rate and easy to fall into local optimum of the BPNN The result indicated that: (1) Based on TDLAS technology, the CH4 detection concentration dropped with the increasement of ambient temperature, the relative error range within the whole experimental temperature was 4.25%~12.13%. The relationship between CH4 detection concentration and temperature under different ambient temperatures can be expressed as a cubic polynomial; (2) The absorption intensity and half width at half-maximum of CH4 gas decrease with the increase of temperature relationship between it and temperature was a monotonous decreasing function. The relative change rate of temperature on the absorption line intensity of CH4 gas was greater than the half width. The absorption line intensity of CH4 gas was more susceptible to the temperature change; (3) The absolute mean error (MAE) of the BPNN and PSO-BP model test samples were 12.88% and 1.81%, the mean absolute percentage error (MAPE) were 2.3% and 0.3%, the root mean square (RMSE) were 15.96% and 2.69%, and the correlation coefficient R2 were 0.980 6 and 0.999 6, respectively. By establishing the PSO-BP temperature compensation model, the compensation effect was mostly distributed within the error range of ±1.0%, and MAE, MAPE, RMSE, R2 and another evaluation indexes were greatly improved. It has a certain reference significance to improve the accurate detection of CH4 in the mine with TDLAS technology.
As an essential tool in science and technology, wavelength detection plays a vital role in analytical chemistry, bio-sensing and optical communication. The traditional spectrometers based on dispersing components or resonant cavities greatly suffer from bulky size, high power consumption and fabrication imperfection. With the rapid development of micro processing, novel types of high-performance and portable spectrometers emerged, and the pursuit of pushing the performance to limit remains unsettled. Based on the signal transmission theory in multimode fiber, the intensity interference patterns are resulting from the mode interference effect were established in adiabatic and collimated model. In the experimental measurement, the tapered region with a slowly varying slope (about 0.01) was introduced near the end of the fiber to ensure that the side radiation signal could be collected. To estimate the number of modes supported in different structures, both the theoretical and numerical simulations are consistent with the experimental tendency. Using the confocal microscope system we made, the interference patterns are stored by continuous scanning a narrow-band laser. The calibration matrix corresponding to the device’s unique characteristics is obtained by region selection, vector splicing and singular value decomposition. The following wavelength detection process can be divided into two steps: the rough calibration matrix within the working bandwidth is obtained after the rough scanning of the wavelength in 1nm scale, and the wavelength units with the non-zero value are selected as the target after inner product correlation operation with the degraded one-dimensional signal intensity vector. This initial procedure provides the criterion of optimizing the structural parameters. On this basis, fine scanning is performed to obtain the refine calibration matrix. The three largest principal components are selected and defined as the final detected wavelength based on the minimum Euclidean distance. The inner product correlation operation combined with the principal component analysis can improve the wavelength detection resolution to 20 pm with the accuracy rate of 96.7%. The detection efficiency is fifty times higher than other nonlinear spectral reconstruction algorithms reported. The experimental results show that the working bandwidth is at least from 400 to 700 nm, and the device size is only π×(20 μm)2×0.5 mm. The practical feasibility and photon detection are also investigated, considering its further application. Compared with its counterparts, this device has a significant improvement in high performance, portability and low cost, it also integrates with an efficient algorithm in wavelength detection procedures. Both device and theory could be widely used in real-time wavelength detection of optical fiber transmission systems.
Inorganic elements are essential substances in the growth process of plants in nature and are also the basic components of Chinese medicinal materials. Their composition and content determine the efficacy and properties of Chinese medicine and are an indispensable parameter in the quality control and evaluation of Chinese medicine. The rhizosphere is the node of material and energy exchange between plants and soil. The nutrient elements of the rhizosphere soil are closely related to the intrinsic quality of Chinese medicinal materials. The changes in the composition of medicinal materials and the law of action due to differences in soil, production areas and other ecological factors are issues worthy of study. As an important element determination method, atomic absorption spectrophotometry plays an important role in analysing Chinese herbal medicines and finished medicines. The study used samples of Salvia miltiorrhiza and rhizosphere soil from 9 main producing areas in 5 provinces were used. The atomic absorption spectrophotometry was used to detect the contents of eight inorganic elements of Na, Mg, K, Ca, Mn, Fe, Cu and Zn in the samples. Use cluster analysis, principal component analysis, orthogonal partial least square discriminant analysis and other chemical pattern recognition methods to discuss and summarize. The results show that the established atomic absorption spectrophotometric method has a good linear relationship and has high accuracy and precision. The content of Mn in the Salvia miltiorrhiza from the Shan-dong area is higher than that in other producing areas. Salvia miltiorrhiza from the Si-chuan area have higher Fe and K elements, while the content of Ca in the rhizosphere soil of Salvia miltiorrhiza from Shan-xi province is slightly higher. Cluster analysis showed that there were significant differences between different origins of Salvia miltiorrhiza. The K, Na, Mn and Zn elements in the in root soil showed correlations with several elements in the herbs. The results of the principal component analysis showed that the elements in the soil influenced the variation of the constituent elements of the herbs. If these eight elements were used as evaluation indexes, the quality of Salvia miltiorrhiza in the Shan-dong area would be better. The results of partial least squares discriminant analysis results revealed that four elements, Na, K, Fe and Mg, might be the main influencing factors for the difference in quality of Salvia miltiorrhiza from different production areas. In this study, methods and evaluation systems for the accurate and efficient analysis of inorganic element content in Salvia miltiorrhiza from different producing areas and rhizosphere soil and the evaluation system were to explore the relationship between the quality of authentic medicinal materials and the growth environment. It provides a scientific basis for the quality control and standard establishment of Salvia miltiorrhiza and a reference for other studies.
Photon-counting detector based X-ray spectral computed tomography (CT), realizes the transformation of CT image from gray to color by increasing energy resolution, which increases material identification capability. However, with increasing the number of energy channels, the channel’s noise increases significantly, which decreases the accuracy of material identification. In order to make full use of the sparsity of spectral CT images and the correlation between spectral CT images, a multi constraint narrow-spectral CT iterative reconstruction algorithm is proposed, which can effectively preserve the edges and details of the image while reducing the noise. Furthermore, principal component analysis (PCA) is used to estimate the spectrum information in narrow spectrum CT images, and the mapping relationship between principal component image and color components R, G, B are established. Finally, the color CT image is obtained. This method can effectively identify materials through the color representation of material components and reduce the background noise in the images. The results of simulation and practical experiments show the proposed reconstruction algorithm is effective, and it is feasible to use PCA for the color characterization of material components.
L-Arginine (L-Arg) is an important component of protein and one of the important diagnostic criteria for certain diseases in humans. The concentration change of L-Arg may cause many health problems. Therefore, it is very important to detect L-Arg efficiently and sensitively. At present, most research work based on L-Arg is used as the precursor of NO (Nitric Oxide) to prevent or alleviate some diseases. It are rarely reported for qualitative tests of L-Arg, and the detection of L-Arg by proton transfer to form complex/adduct is even less. In this paper, a colorimetric probe ISO-CN-OH based on isophorone, malononitrile and 2,4-dihydroxybenzaldehyde was designed and synthesized. The method based on proton transfer forming complex/adduct for detection of L-Arg rapidly were found. The UV-Vis spectra showed that absorption peak of the probe at 669 nm increased sharply when L-Arg was added into the ISO-CN-OH and the color of the solution changed from orange yellow to dark green. However, no color and absorption peak change was observed while other amino acids were added. Besides, ISO-CN-OH could detect L-Arg specifically without any interference by competition experiments. What’s more, the titration experiment of L-Arg, showed There is A good linear relationship (R2=0.997) between the relative absorption intensity (A-A0) and the concentration of L-Arg within the concentration range of 1.0~10.0×10⁻⁶ mol·L-1. And the linear regression model wasy=0.020x+0.073. According toDL=3σ/K, the detection limit of ISO-CN-OH was 8.5×10⁻⁸ mol·L-1, which indicated that the probe had very high detection sensitivity. Fixing the total concentration of ISO-CN-OH and L-Arg was 100 μmol·L-1, and the ratio of L-Arg to the total concentration is changed to get the job’s plot titration curve. According to the job’s plot titration curve analysis, it is found that the UV absorption intensity of ISO-CN-OH reached the maximum at 669 nm when the ratio of L-Arg to the total concentration was 0.67, which indicated that ISO-CN-OH coordinated with L-Arg in the ratio of 1∶2. In order to further understand the coordination mechanism of ISO-CN-OH and L-Arg, 1H-NMR titration experiment was carried out. 0, 0.5, 1.0 and 2.0 equivalent of L-Arg (d2O) were added into the DMSO-d6 solution of ISO-CN-OH respectively. It was found that the hydroxyl peak of ISO-CN-OH disappeared and the hydrogen around the hydroxyl group shifted after adding L-Arg. The results showed that ISO-CN-OH causes the formation of negative charges near the —OH group by transferring acidic phenolic hydroxyl protons to l-ArG alkaline guanidine NH group. The forming negative charge complexed with the guanidine part of arginine to form a complex/admixture, which result in a new peak at 669 nm, and the color solution change. The study based on proton transfer forming complex/adduct for detection of L-Arg will provise certain guidelines for the design of L-Arg probe molecules in the future.
The polyethylene terephthalate (PET) was used for dielectric to produce the atmospheric pressure helium-argon mixture discharge plasma. The electrical and luminescence properties of PET dielectric barrier discharge were studied using a voltage probe, a current probe, a digital oscilloscope and a digital camera. It found that one or more current pulses appear in every half voltage cycle, and the discharge transits from uniform to pattern discharge with the increase of argon content. Argon atomic spectra intensities (696.54, 763.13, 772.09, 811.17 and 911.81 nm) were measured using a spectral system composed of the diffraction grating and a CCD detector. The influences of argon content and peak voltage (Vp) on the spectra intensity were researched. The results show that: at lower Vp, the above five argon spectra intensities enhance slowly, then weaken sharply, and enhance rapidly again with the increase of argon content; at higher Vp, the intensities of spectral line 696.54, 763.13 and 772.09 nm enhance and the intensities of argon spectral line 811.17 and 911.81 nm weaken. The discharge mode plays an important role in the spectra intensity variation at lower Vp, but the ionization mechanism makes a dominant contribution to the spectra intensity at higher Vp. At argon content ≤30% or ≥80%, the above argon spectra intensities almost remain unchanged, then increase to the stable value with the increasing Vp; at 30%≤argon content≤80%, the above five argon spectra intensities enhance slowly, then weaken sharply, and enhance rapidly again. The electron excitation temperature (Texc) was calculated using the Boltzmann graph method, and the variation of Texc with the ratio of helium to argon was obtained under different Vp. The results show that: the Texc at high Vp is higher than that at low Vp, and the Texc decreases with the increasing argon content. The reason is to maintain the balance between the ionization process and ion escape loss because the electron-helium collision section is much smaller than the electron-argon collision section, but helium has a larger diffusion coefficient than argon.
GF-4 can provide stable data for disaster prevention and mitigation, and its mid-infrared sensor can be well applied in rapid-fire monitoring. Because of lacking far-infrared, the spectral information that GF-4 provided is supplementary data as usual. Affected by a single band, the commission error and omission error of the adaptive threshold method is high. Therefore, to probe the potential of GF-4 data and improve the accuracy of fire point recognition, this study analyzed the characteristics of GF-4 data and proposed a fire point detection method with brightness temperature difference correction based on dual temporal image. The method mainly includes three parts: brightness temperature compensation acquisition based on Kriging interpolation on temporal scale, adaptive threshold segmentation on a spatial scale based on contextual information, and fire point detection, with two images-before and during the fire event. Firstly, the difference between the two images is processed. Moreover, we use this difference of non-polluted pixels in the dynamic neighborhood around the potential fire point as the sampling data for spatial interpolation and then substitute the result of the previous step into the first image. Finally, using discrimination conditions for fire point discrimination and false alarm elimination get the final results. The study also compares three spatial interpolation acquisitions: Inverse Distance Weigh, Simple Kriging and Ordinary Kriging. From the fitting results, the Ordinary Kriging can reflect the volatility of the pixel area and has a certain smoothing effect to avoid peaks of background brightness temperature, which is the better method. The study area contains two fires in Qinyuan, Shanxi Province and New Barhu Right Bannerin, Inner Mongolia. Results show that compared with the traditional single time phase algorithm, introducing brightness temperature difference correction data can better fit the background brightness temperature, reducing the commission error to 3% and obtaining comprehensive evaluation index Fβ above 0.9. This developed method could be used to support automatic fire point detection and extraction in future studies.
Photonic crystal fibers have been widely used in the supercontinuum generation of femtosecond pulse laser sources. When the repetition rate of a laser source is low, the evolution of supercontinuum over time is slow, which is usually not noticed. In applications such as calibrations of astronomical spectrometers, high repetition rate laser sources of the order of gigahertz to tens of gigahertz are required. In this case, the supercontinuum degradation is significant within a limited time period. Using 1040nm femtosecond laser as the pump source, by testing the evolutions of supercontinua of three photonic crystal fibers with different air-filling fractions, it is found that the degradation process accelerates with the increase of the air-filling fraction. Accompanying the degradation of supercontinuum, multiple bright spots of different colors appear in the section where the supercontinuum is generated on the fiber. It implies a directional light leakage phenomenon. Observing the spectral absorption of the spectrally degraded fiber confirmed that the main reason for the degradation is not the generation of massive non-bridged oxygen color centers in the fused silica material. Based on the directional characteristic of the light leakage, a theory that a long-period grating formation in the fiber core by multiphoton absorption is proposed. In order to search for the factors that affect the supercontinuum generations of the photonic crystal fibers, so that the goal of suppressing the degradation can be achieved, firstly, parameters of the fiber tapering are changed. It is expected that the photon tolerance of the fused silica material of the fibers can be enhanced. The experimental results show that the effectiveness is scant. Then, experiments are carried out with maintaining the average power of the laser source, reducing the peak power of the laser pulse and maintaining the peak power of the laser pulse, reducing the average power of the laser source. It is shown that the total amount of high peak power pulses coupled into the optical fiber in a certain time period is the most important factor affecting the supercontinuum degradation. In the application of astronomical spectrometer calibration, the demand for optical power of supercontinuum is not high. Using a chopper to reduce the average power of the incident light of the photonic crystal fiber is an effective, simple and feasible method to slow down the supercontinuum degradation.
Aiming at the problem that the quantitative analysis of soil is greatly affected by the matrix effect and the accuracy of the quantitative analysis of LIBS is not good. The particle swarm algorithm is used to optimize the LSSVM to improve the accuracy of the model. Pb Ⅰ 405.78 nm and Cr Ⅰ 425.44 nm was selected as the analysis lines for analysis. Collect the characteristic spectra of twelve samples with different concentrations. The LSSVM calibration model has a low degree of fitting and cannot meet the experimental requirements. The performance of the model needs to be improved. Use particle swarm optimization to optimize the model parameter penalty coefficient γ and kernel function parameter g of LSSVM to obtain the best combination of γ and g. The Pb element is (8 096.8, 138.865 7), and the Cr element is (4 908.6, 393.563 5). Compared with LSSVM, the accuracy of the PSO-LSSVM calibration model is higher. The R2 of Pb and Cr elements is increased to 0.982 8 and 0.985 0, and the fitting effect is significantly improved. The root means square error of the training set of Pb and Cr elements decreased from 0.026 0 Wt% and 0.027 2 Wt% to 0.022 4 Wt% and 0.019 1 Wt%, and the root means square error of the prediction set was reduced from 0.101 8 Wt% and 0.078 8 Wt% to 0.045 8 Wt% and 0.042 0 Wt%, the stability of the model is further improved. It shows that the PSO-LSSVM algorithm can better reduce the influence of the soil matrix effect and self-absorption effect, and improve the accuracy and stability of the analysis results.
Spectral enhancement is one of the key methods to improve Laser-Induced Breakdown Spectroscopy (LIBS) analysis performance. Spatial confinement of plasma is often used due to its simple device and better confinement effect. The characteristics of plasma will directly affect the spatial confinement. The properties of the plasma are closely related to the focusing of the laser in the experimental system. In order to study the effect of the laser focusing on the spectral enhancement of the plasma confined by a hemispherical cavity, the condition of the laser focusing was changed by adjusting the distance between the lens and the sample (Lens to Sample Distance, LTSD). Under the experimental configurations without and with confinement, the alloy steel sample was ablated to produce plasma, and the time evolution spectra at 15 different LTSD positions were collected. The two-dimensional spatial distributions of the spectral line intensity and enhancement factor with LTSD and acquisition delay were obtained. The results had shown that the spectral line intensity of the plasma without confinement peaks when the LTSD was 94 and 102 mm, respectively. When the acquisition delay was less than 8 μs, the maximum value of the spectral line intensity was at the LTSD of 94 mm. The maximum intensity appeared at the LTSD of 102 mm when the delay time was greater than 8 μs. Moreover, the line intensity has two sequential enhancements when the hemispherical cavity confined the plasma. The delay time ranges corresponding to these two enhancements were 4~10 and 12~15 μs. The main reason for the second enhancement is that the shockwave reflected by the inner wall of the hemispherical cavity will continue to propagate after interacting with the plasma and it will encounter the other side of the cavity wall and be reflected again secondary compress the plasma. The two-dimensional distribution of the enhancement factor with LTSD and delay time was analyzed. It is found that the maximum enhancement factor of the first enhancement has no obvious trend with the change of LTSD and the enhancement factor fluctuates from 2 to 6. The maximum enhancement factor of the second enhancement first increases and decreases as the LTSD changes and decreases after a small increase. The enhancement factor is relatively high. It reaches the maximum when the LTSD is 96 mm, and the maximum enhancement factor is about 6. The delay time corresponding to the maximum enhancement factor was defined as the optimal delay time. It is found that the optimal delay time for the first enhancement varies from 6 to 9 μs. When the LTSD is in the range of 85~93 mm, the optimal delay time remains unchanged. When the LTSD varies from 94 to 104 mm, the optimal delay time of the first enhancement first decreases and then increases. However, the optimal delay time of the second enhancement maintains at a range from 14 to 15 μs, and there is no obvious change with the change of LTSD.
In recent years, laser-induced breakdown spectroscopy (LIBS) is gradually emerging to classify and identify biological organizations by combining them with algorithms. Due to each part of the pork similar spectral characteristics, it is difficult to achieve accurate identifications only through the analysis of the effect of spectral information, so in this paper studied pork from four different parts of the same individual and sliced and planished them, then applied LIBS technology on four parts, i.e., the organization, fillet, plum flower, and front legs. 100 specimens of each sample were collected and the spectrum analysis was conducted. A preliminary analysis of the spectrum was performed on Ca, Na, K and 6 lines. It was found that other tissues were difficult to distinguish except for the C—N tissue of plum flower with more fat content and higher C content than other tissues, so the Principal Component Analysis (PCA) on these 6 principal components was carried out. The cumulative contribution rate of PC1, PC2 and PC3 reached 95%. The Support Vector Machines (SVM) classification model was established by employing feature scores as the input source of SVM model, and the confusion matrix diagram of these samples got obtained. Through observation of the confusion matrix, the classification accuracy of each type of samples could be clearly distinguished. The results showed that the accuracy of the four samples was 96%, 98%, 97% and 100%, respectively, with an average accuracy surpassing 97%. The study proved that LIBS combined with PCA-SVM can be used as a fast identification method for different parts of pork tissues.
Hyperspectral data can capture the spectral changes caused by different concentrations of chemical oxygen demand (COD) in inland water bodies, and it is important to study the relationship between spectrum and COD concentrations for COD estimation. Support Vector Regression (SVR) model has the advantages of being suitable for small samples and good generalization ability, but it is difficult to select a parameter and prone to fall into the local extremum. In order to solve this problem, this study introduced Simulated Annealing-Particle Swarm Optimization (SA-PSO) into the parameter optimization process of SVR and proposed an improved SVR (SA-PSO-SVR) method to estimate the inland waters COD. This paper takes the Weihe River Basin as the research area, obtained the COD concentrations and spectral curves through field measurement. The sensitive band was determined by analyzing the response of spectral reflectance to COD at first in this paper, and the Simulated Annealing-Particle Swarm Optimization (SA-PSO) was introduced into the parameter optimization process of Support Vector Regression (SVR) to established an inversion model between the cod concentration and the sensitivity factor. The Orbita Hyper Spectral (OHS) hyperspectral data was used to verify the accuracy, and the distribution of COD concentration was obtained at last. Through spectral analysis, it can be seen that the measured above-surface spectra in this area demonstrated typical spectral signatures of second-class water, and the shape of the spectrum curve shows obvious double-peak characteristics. When the concentration increases, the reflection peak tends to move to the short wavelength direction and the reflection valley to the long wavelength direction. The Pearson’s correlation coefficient was used to analyze COD concentration and the spectral, the result showed that the best inversion factors are four band combinations of 518 nm/940.4 nm, 623.6 nm/636.8 nm, 729.2 nm/890.9 nm and 752.3 nm/857.9 nm. The model established by the SA-PSO-SVR method is accurate compared with models established by SVR, Back Propagation neural network, and linear regression method. The Mean-Relative-Error (MRE) and Root-Mean-Square-Error (RMSE) of the COD estimation model established by the SA-PSO-SVR method are 1.62% and 2.99 mg·L-1 (R2=0.86), respectively. The optimal model established by the measured water surface spectra was applied to the hyperspectral satellite image. The RMSE and MRE are 4.47 mg·L-1 and 11.87% respectively. The obtained COD inversion results of the Weihe-Xiashan reservoir area show: the overall concentration of COD is between 17 and 42 mg·L-1, and COD concentration in the Hanxinba, the northeast region of XiaShan Reservoir, the confluence of the Qu River into the Wei River are higher than other waters. The experimental results show that SA-PSO-SVR is a feasible approach for the COD inversion of hyperspectral data, providing a reference for water resources management in the Weihe River Basin.
Soluble solid content (SSC) is a key factor to evaluate the flavor and quality of fruits. The feature extraction of hyperspectral images provides the data basis and method path for the non-destructive estimation of the solid soluble content. Previous studies have shown that fruit internal quality evaluation based on multi-spectrum, fluorescence spectrum, near-infrared spectrum, and electronic nose has achieved good results. However, the lack of multi-feature fusion limits the accurate estimation of fruit quality. Therefore, this study proposed a model based on stacked autoencoder-particle swarm optimization-support vector regression (SAE-PSO-SVR) to predict the solid soluble content of fresh peaches. Firstly, hyperspectral images extracted spectral information, image pixel information corresponding to different bands, and fusion information. Secondly, a universal stacked autoencoder (SAE) was set up to extract the deep features of spectral information, spatial information, and space-spectrum fusion information. Finally, the deep features were used as the input data of the particle swarm optimization-support vector regression (PSO-SVR) model to predict the solid soluble content of fresh peaches.Among them, three hidden layer network structures were designed for the SAE model with spectral information as input data, including 453-300-200-100-40, 453-350-250-150-50 and 453-350-250-100-60. Three network structures of hidden layer nodes were designed forthe SAE model with image information as input data, including 894-700-500-300-50, 894-650-350-200-80 and 894-800-700-500-100. Three hidden layer network structures were designed forthe SAE model with fusion information as input data, including 1347-800-400-200-40, 1347-750-550-400-100 and 1347-700-500-360-150.The experimental results show that the models with SAE structures of 453-300-200-100-40, 894-800-700-500-100 and 1347-750-550-400-100 have the better estimation effect for spectral information, image information and fusion information as input data of the SAE model, and the prediction accuracy of the model based on the deep features of the fusion information was significantly better than that of the model based on spectral features or image features. The SAE model with the structure of 1347-750-550-400-100 was used to extract the deep features of the fusion information to estimate and visualize the solid soluble content of different varieties of fresh peaches. The results show that the prediction performance based on the SAE-PSO-SVR model was the best (R2=0.873 3, RMSE=0.645 1). Therefore, the SAE-PSO-SVR model proposed can improve the estimation accuracy of solid soluble content of fresh peaches, which provide technical support for detecting other components of fresh peaches.
The classification and detection of impurities in machine-harvested seed cotton provides a reference for adjusting cotton cleaning mechanical processing parameters and has important significance for improving lint quality. However, the uneven distribution of seed cotton makes image detection more difficult, and traditional detection methods cannot effectively detect various impurities. The hyperspectral imaging method was used to discriminate the five impurities (cotton leaf, cotton stem, plastic film, hull inner, and hull outer) in the machine-harvested seed cotton. The hyperspectral images of 120 machine-harvested seed cotton samples were collected, and the region of interest was selected to obtain the average spectral curve. Due to the difference in the composition of materials, various impurities showed different spectral absorption and reflection characteristics, and the spectral difference of the characteristics of different materials was greater than that of similar materials. Principal component analysis (PCA) of the extracted average spectral curve showed that cotton, plastic film and hull outer were better separable than the other three types. However, the spectral distributions of cotton leaf, hull inner, and cotton stem overlapped seriously. Based on the extracted average spectral curve as the training sample, three discrimination algorithms of linear discriminant analysis (LDA), support vector machine (SVM) and neural network (ANN) were used to optimize the algorithm parameters and finally established the impurity detection model. Among them, the sample space after dimensionality reduction of the LDA model shows better separability than PCA. Regularization was used to prevent overfitting in LDA, and the accuracy rate of the training set was 86.4%, and the accuracy of the test set was 86.2%. The parameter optimization result of the SVM model was C=105, g=0.1. The accuracy of the training set was 83.42%, and the accuracy of the test set was 83.40%. The parameter optimization result of the ANN model was that the number of hidden layers and neurons were 1 and 10, respectively. The accuracy rate of the training set was 82.9%, and the accuracy rate of the test set was 81.8%. Comparing the classification accuracy and detection time of the three models, the results of the LDA model were all the best. Through the pixel level discrimination of hyperspectral images, the results show that both cotton and botanical impurities were effectively detected. However, there were misidentifications between plastic film and cotton, which was consistent with the results of the impurity spectrum classification discrimination model. Therefore, hyperspectral imaging technology can detect and identify seed cotton impurities quickly and non-destructively and provide feedback parameters for cotton processing equipment, which is of great significance to the mechanization and intelligence of cotton processing.
Environmental stress of light and temperature is a major restricting factor that affects the quality and yield of crops. Traditional crop stress monitoring is insufficiently sensitive, time-consuming and laborious, and mostly destructive testing. In recent years, with the rapid development of information technology, hyperspectral technology can quickly and non-destructively obtain crop physiological information, and dynamically monitor the response to adversity, providing digital support for the precision production and intelligent decision-making of modern agriculture, and is of great significance for realizing the transformation of traditional agriculture to precision and modern digital agriculture. This paper takes the corn seedling stage as the research object, obtains the hyperspectral data and physiological parameters of leaves under different light and temperature environments, explores the response law of corn leaves to different light and temperature environments, conducts hyperspectral difference analysis, and construct physiological parameters Hyperspectral inversion model. The correlation analysis method is used to screen the spectral sensitive band. The preprocessing method combining Multivariate Scattering Correction (MSC), Standard Normal Variable transformation (SNV), and Savitzky-Golay (SG) smoothing is used, respectively. Partial Least Square regression (PLS), Principal Component Regression (PCR), Stepwise Multiple Linear Regression (SMLR) three modeling methods combination, the model correlation coefficient and root mean square error are used as model effect evaluation indicators to explore the optimal method of hyperspectral inversion of leaf physiological parameter models. The results show that the hyperspectral characteristics of corn under different light and temperature environments have the same changing trend as a whole, but there are still differences. The reflectance of the spectrum in the 500~700 nm band gradually increases with the increase of light intensity, the reflectivity of the spectrum in the 760~900 nm band gradually increases with the increase of temperature, and the changes of the light and temperature stress environment can be reflected in the hyperspectral characteristics. The spectral reflectance in the 760~900 nm band is relatively high in a high temperature stress environment, the spectral reflectance is low in a low light stress environment, and the reflectance is significantly reduced in a low temperature stress environment. The optimal combination of SPAD and Fv/Fm inversion model is PLS-MSC-SG, the correlation coefficients of the model validation set are 0.958 and 0.976, and the correlation coefficients of the training set are 0.979 and 0.995, respectively. The model’s predictive accuracy is high, which indicates that the use of hyperspectral technology can realize quantitative monitoring of maize plants under light and temperature environmental stresses, improve the level of refined management in the field, and provide a reference for the intelligent management of high-quality and high-yield maize.
Pitaya is a new kind of fruit with high nutritional value and good economic benefit which was introduced into China for a short time. Its stems are the most important photosynthetic organs, which is quite different from the common green leaf fruit trees. In order to explore the spectral characteristics and the estimation method of biochemical components of vegetation using stems for photosynthesis, the field experiments were carried out at four nitrogen application levels in Luodian Guizhou, the chlorophyll content of Hylocereus polyrhizus stems were taken as the research object. Firstly, hyperspectral reflection data and chlorophyll content data of Hylocereus polyrhizus stems under different nitrogen nutrient were measured simultaneously; Secondly, the hyperspectral data were analyzed by mathematical transform, continuous wavelet transform(CWT)and correlation analysis algorithm to extract and screen the characteristic bands; Finally, the chlorophyll content estimation model of stem was established by partial least squares regression(PLSA). The results showed that: (1)The overall trend of the original spectral curve of Hylocereus polyrhizus stems is similar to common green leafed plants, the bands sensitive to chlorophyll content of branches are mostly located in the red edge and near-infrared region. In the near-infrared region, the variation of stems spectrum with nitrogen application is different from that of green leaves. The absorption peak (valley) of Hylocereus polyrhizus branches spectrum increased (deepened) with the increase of nitrogen application. (2)First derivative(FD)and CWT in the scale of L1—L5 can effectively improve the sensitivity of the spectrum to chlorophyll content. The sensitive region of the original spectrum and chlorophyll content of Hylocereus polyrhizus stems is located in 730~1 400 nm. Both the mathematical transform and CWTcan significantly improve the sensitivity of the spectrum to chlorophyll content, but the distribution of sensitive bands is relatively scattered, and there are more sensitive bands in the red edge (730 nm) and near infrared region(1 100~1 600 nm), which is different from the distribution of chlorophyll content sensitive bands in leaves. (3)Both the mathematical transformation and CWT can significantly improve the spectral estimation ability of chlorophyll contentin Hylocereus polyrhizus stems. The estimation model based on FD the optimal models of mathematical transformation, the verification accuracy is $R_{verification}^{2}$=0.625, RMSE=0.048, RPD=1.238(FD). The model based on L1 and L4 has relatively high modeling accuracy and estimation accuracy, which is the best model with $R_{verification}^{2}$=0.678, RMSE=0.037, RPD=1.652(CWT). Hyperspectral technology can be used as a non-destructive monitoring method for chlorophyll content and nutrition diagnosis of Pitaya. This study provides a supplement for improving the retrieval of chlorophyll content of different vegetation types based on hyperspectral index.
In order to reduce the influence of dust retention on the extraction of effective spectral information of tea leaf and to establish a more robust water content estimation model of tea leaf by spectrum. We took “Shu Chazao” as the research object and collected samples of tea leaves by random sampling. Then the hyperspectral information, leaf water content and dust retention rate of leaves were measured. The correlation coefficient method was used to extract feature information. Newly-built vegetation indexes were constructed by the normalization calculation method and ratio calculation method, The relative variability analysis was used to screen the candidate indexes that reduce the impact of dust retention on the accuracy of the leaf water content estimation model. By comparing the response relationship between newly-built vegetation indexes and existing water indexes under the different conditions of dust retention, the optimal vegetation index estimation model of tea leaf water content which less affected by dust retention, was selected. Finally, the high-precision estimation models of the tea leaf water content with the optimal vegetation index were established and verified. The results show that, dust leaves’ spectral reflectance is higher than clean leaves in 711~1 378 nm bands. The correlation between the water content of the tea leaves and vegetation index is affected by dust retention, but its correlation direction is not. Dust retention also makes the accuracy value of tea leaf water content estimation model decreased. The newly-built ratio index (RVI(1 298, 1 325)) with 1 298 and 1 325 nm as the center band is least affected by leaf dust retention under complex environmental conditions. Therefore, it is the optimal vegetation index, and the hyperspectral estimation model of tea leaf water content constructed by RVI(1 298, 1 325) has higher estimation accuracy, better sensitivity and stability (y=0.245x-0.241, R2=0.854, RMSE=0.001). In conclusion, this study provides a basis for the refined water management of tea trees and provides new ideas that high-precision models of water content estimation is constructed by hyperspectral information under complex environmental conditions.
Rapid and non-destructive detection of invisible handwriting, such as erasure, steganography and covering, is a research difficulty in the field of forensic scientific document inspection. In the current research, the method of switching multi-band light source and filter is mostly used to visualise the invisible handwriting, but the spectroscopy mechanism of invisible handwriting is less analyzed. Therefore, the efficiency of invisible handwriting and the success rate of testing are both not high. In order to improve the efficiency and accuracy of erasure, steganography and covering in document examination, the mechanism and rapid visualization method of the three kinds of invisible handwriting were studied by measuring the excitation and fluorescence spectra, reflection and transmission spectra, and micro-topography. Based on the hyperspectral imaging technology of liquid crystal tunable filter (LCTF) and support vector machine (SVM) classification algorithm, a rapid test method for simultaneous display and classification of invisible handwriting is proposed. Chenguang and Pilot erasable pen, fluorescent writing pen and lemon juice emit strong fluorescence under the excitation of 365 nm long-wave ultraviolet light. The fluorescence wavelength of erasable pen and lemon juice is about 716 nm, and the fluorescence wavelength of fluorescent writing pen is 447 nm. Besides the lemon juice invisible writing can also be effectively visualized by using 254 or 365 nm ultraviolet reflection imaging. In the study of covering handwriting, it is found that the transmittance of a ballpoint pen, marker pen and erasable pen is more than 60% in the infrared band of 700~2 500 nm, and the transmittance of a gel pen is less than 20%. Therefore, the near-infrared band of 850 nm imaging is used to effectively visualize the Chenguang gel pen covered by a Pilot ballpoint pen. The LCTF hyperspectral camera was used to image the three kinds of invisible handwriting in the range of 400~720 nm with a step of 5 nm, and the different handwriting in the image were visualized classified simultaneously by SVM classification algorithm, the total classification accuracy was 99.284 4%, and the Kappa coefficient was 0.959 1. Photoluminescence imaging using a 365 nm light source as an excitation light can effectively visualize erasure and steganography handwriting. Because the reflectivity of different inks in the near-infrared band is quite different, near-infrared imaging can effectively visualize the covering handwriting. SVM classification technology based on LCTF hyperspectral imaging can realize the simultaneous display and classification of different types of invisible handwriting and has high visualization efficiency and classification accuracy.
Fulvic acid (FA) is an important component of soil humus. As an intermediate substance in soil humification, the structural characteristics of FA play an important role in indicating the improvement of soil organic matter. The combined organic and inorganic fertilizers are an effective measure for soil fertility improvement, straw resource utilization and inorganic fertilizer reduction. In order to explore the effect of straw organic fertilizer instead of inorganic fertilizer (nitrogenous fertilizer) on soil FA in the black soil region of Heilongjiang Province, six treatments were set up, including no fertilization (CK), a single application of inorganic fertilizer (NPK), 25% of organic nitrogen fertilizer (NPKM1), 50% (NPKM2), 75% (NPKM3), and 100% (NPKM4). The contents of soil organic carbon (SOC) and FA were determined. The source of soil FA was characterized by fluorescence index (FI) and biological index (BIX), and the degree of soil humification was analyzed by humification index (HIX). Three-dimensional fluorescence spectrum parallel factor analysis method was used to analyze the fluorescence components and maximum fluorescence intensity (Fmax) of soil FA, and redundancy analysis (RDA) was used to explore the response relationships among fluorescence intensity, soil organic carbon and different treatments. The results showed that compared with NPK treatment, the contents of SOC and soil FA increased significantly in the treatments of combined application of organic and inorganic fertilizers, the greatest impact on NPKM2 treatment, SOC and soil FA content increased by 8.06% and 13.84%. Soil FA was affected by both autochthonous and terrestrial sources (FI>1.4, 0.8Fmax values of fulvic-acid-like and humic-acid-like first increased and then decreased, and the Fmax value of protein-like gradually decreased. The Fmax values of fulvic-acid-like and humic-acid-like were the highest, and the relative percentage of humic-acid-like was the highest. The results of RDA showed that NPKM2 treatment had the greatest effect on the content of SOC and soil FA. Therefore, based on the analysis of soil FA fluorescence spectrum characteristics, in order to improve the content of soil organic matter, increase straw utilization rate and reduce the application of inorganic fertilizer, the treatment of straw organic fertilizer replacing inorganic nitrogen fertilizer by 50% was the best organic-inorganic fertilizer ratio.
Hangjin2# clay is a layered iron-bearing natural mineral found in Ordos, Inner Mongolia. In succession, X-ray diffraction, pyridine adsorption Fourier transform infrared spectroscopy and X-ray photoelectron spectroscopy were used to characterize Hangjin2# clay. X-ray photoelectron spectroscopy results indicated that Fe in Hangjin2# clay skeleton structure mainly exists as Fe(Ⅲ) and Fe(Ⅱ). Moreover, the binding energy of Si and Al in Hangjin2# clay has increased significantly compared with the standard binding energy of Si and Al in silicon-oxygen tetrahedron and octahedron aluminum oxygen, which indicated the presence of Lewis and Brönsted acid sites. In heterogeneous Fenton reaction, structural iron in Hangjin2# clay could react with H2O2 to produce?OH to degrade methyl orange, but the rate is slow and difficult to cycle. After acid activation, Si and Al’s increased binding energy in activated Hangjin2# clay has been confirmed, and iron in activated Hangjin2# clay has transformed into non-structural iron which coexists in the form of Fe2+ and Fe3+. Whatsmore, the increase Lewis acid and Brönsted acid sites on activated Hangjin2# clay surface have been confirmed by the characterization of X-ray photoelectron spectroscopy, pyridine infrared, and ammonia temperature-programmed desorption. After activation, Fe3+ and Fe2+ could circularly react with H2O2 to continuously generate ·OH to degrade methyl orange. Furthermore, Brönsted acid sites on the activated Hangjin2# clay surface could provide protons to surround H2O2, and the formation reaction of $HO_{2}^{-}$ will be inhibited. Lewis acid sites on activated Hangjin2# clay surface could increase adsorption oxygen content. Moreover, Fe2+ can be oxidized by adsorption oxygen to form Fe3+, promoting the circulation between Fe2+/Fe3+. Furthermore, in the oxidation process, the electron could transfer to adsorption oxygen to form $O_{2}^{·-}$ which can be reacted with protons provided by Brönsted acid sites to form ·OH. These ·OH and $O_{2}^{·-}$ are oxidizing radicals, which could improve the reaction activity of Hangjin2# clay in heterogeneous Fenton reactions. In addition, X-ray diffraction analysis indicated that acid activation could convert $CO_{3}^{2-}$ to $SO_{4}^{2-}$, while $SO_{4}^{2-}$ has a less negative effect on Fenton reaction compared with $CO_{3}^{2-}$.
The component detection of petroleum mixed oil is an important research content in the field of three-dimensional fluorescence spectroscopy. The actual obtained three-dimensional fluorescence spectrum data of mixed oil has problems such as the serious overlap of different component spectra and poor trilinearity of the data. When analyzing the three-dimensional fluorescence spectrum by the parallel factor algorithm (parafac), the difference between the analytical spectrum and the standard spectrum is too large, or the type of oil cannot be judged correctly. The paper verifies that the parallel factor algorithm can be applied to three-dimensional fluorescence partial derivative spectroscopy. This paper combines the three-dimensional fluorescence partial derivative spectroscopy with the parafac, improving the degree of fitting between the analytical spectrum and the standard spectrum. Therefore, this paper realizes the accurate detection of the components of petroleum mixed oil. First, the paper use sodium dodecyl sulfate solution (SDS) as the solvent to prepare 15 parts of pure oil solutions of different concentrations of jet fuel and lubricating oil. 9 parts of mixed oil solution are prepared by jet fuel and lubricating oil according to different concentration ratios. The FS920 fluorescence spectrometer obtains the three-dimensional fluorescence spectrum data of 39 samples. They were using the following methods to preprocess the three-dimensional fluorescence spectrum data. Raman scattering is removed by the subtraction standard method. The Rayleigh scattering area is subtracted, and then the subtracted area is interpolated by the segmented cubic Hermite interpolation method to perfect the data. The wavelet transform threshold denoising method is used to remove the high-frequency noise in the spectrum data. Finally, the Savitzky-Golay fitting derivative method is used to obtain the first-order partial derivative spectrum of the three-dimensional fluorescence spectrum. The parafac is used to analyze the three-dimensional fluorescence spectrum and the three-dimensional fluorescence partial derivative spectrum. The experimental results show that when the parafac is used to analyze the three-dimensional fluorescence spectrum of the mixed oil, the lubricating oil analytical results are better, but the analytical results of jet fuel have big problems. When the parafac used to analyze the three-dimensional fluorescence partial derivative spectrum of the mixed oil, the analysis results of jet fuel are significantly improved while ensuring the analysis results of lubricating oil. The correlation coefficient between the analytical spectrum and the standard spectrum of jet fuel has increased by 12.0% (emission spectrum) and 6.7% (excitation spectrum), and the root means square error has reduced by 70.4% (emission spectrum) and 20.6% (excitation spectrum). In view of the poor trilinearity of three-dimensional fluorescence spectrum data, three-dimensional fluorescence partial derivative spectroscopy combined with parafac analysis method is better than three-dimensional fluorescence spectroscopy combined with the pafarac analysis method, which achieves accurate detection of mixed oil components.
Cast-forging GH4096 superalloy turbine disk is a key hot end component of aero-engine because of its excellent properties such as high temperature bearing capacity, high strength, low crack growth rate, high fatigue resistance and so on. However, due to its high alloying degree, large part size and complex preparation process, it is inevitable that the composition and microstructure distribution will be uneven, which will affect the service performance of the turbine disk to a certain extent. Micro-area X-ray fluorescence spectroscopy (μ-XRF) has the advantages of high micro-resolution, fast analysis speed, simultaneous analysis of multi-elements, non-destructive and so on, so it is widely used in archaeology, geology, biology and other fields. However, there is little research on the composition distribution of large-size superalloy components, and there is no report on the quantitative distribution of composition at the original location of the material. In this experiment, by selecting suitable measuring conditions and optimizing instrument quantitative method, a new quantitative analysis method of composition distribution of cast-forging GH4096 alloy turbine disk based on microbeam X-ray fluorescence spectroscopy was established, and the in-situ statistical analysis method was introduced to analyze the quantitative statistical distribution of Cr, Co, Mo, W, Ti, Al, Nb and Ni in turbine disk. It is found that Co, Mo and Ti have obvious arc negative segregation zone from hub to flange in the central region of turbine disk thickness, while Ni and Cr have arc positive segregation zone. In addition, there is also a certain composition gradient distribution in the radial direction of the turbine disk. The contents of Co, Cr and W gradually decrease from the hub to the flange, while the contents of Mo, Ti and Nb show a gradual upward trend. After the calculation and analysis of the maximum segregation degree, statistical segregation degree and statistical fitting degree of each element, it is known that the overall segregation degree of Cr, Co, Mo, W, Ti, Nb and Ni elements in the measurement area is small, the statistical coincidence degree is large, and they have better composition uniformity within the allowable range of material element design values. The linear distribution of elements in the same test area was analyzed by spark source metal in-situ analyzer (OPA-200). The analysis results agree with those obtained by microbeam fluorescence spectra, indicating that there is temperature field distribution in large-size turbine disks during heat treatment, which leads to differences in element diffusion behavior and microstructure distribution, so there is some segregation in different parts. Through the quantitative statistical analysis of the composition distribution of the large size turbine disk, it is of great significance to evaluate the uniformity of the composition distribution of the new cast-forging deformed GH4096 superalloy turbine disk and to analyze the correlation between the preparation process and the composition and structure distribution of the significant size components.
Confocal X-ray fluorescence is a directly non-destructive analysis technique with spatial resolution, widely used in materials, biology, mineral sample analysis, archaeology, evidence traceability and other fields. The confocal X-ray fluorescence spectrometer work is based on a polycapillary X-ray lens. A polycapillary focusing X-ray lens (PFXRL) attached to the X-ray tube is used to focus the divergent X-ray from the X-ray tube to the output focal spot with dozens of micron diameter and high power density gain. A polycapillary parallel X-ray lens (PPXRL) with an input focal spot placed on the front of the silicon drift detector is used to receive the fluorescence signal from the specific region. The overlap region of the output focal spot of the PFXRL and the input focal spot of the PPXRL in the confocal X-ray fluorescence spectrometer is called probe volume. Only the sample in the probe volume can be detected. The spatial information of the sample can be obtained by the relative movement of the probe volume and sample point by point. The size of the probe volume determines the spatial resolution of the confocal X-ray fluorescence spectrometer. Thus, it is significant to measure the size of the probe volume. The shape of the probe volume is similar to an ellipsoid. The size of the probe volume can be expressed as the horizontal resolution X, Y and the depth resolution Z, as showni n Fig.1. The detail size of the probe volume of the confocal X-ray instrument is commonly measured by the metal wire ormetal film using the knife scanning method. To precisely measure the probe volume size, the diameter of the metal wire prefer small than the probe volume size. It is difficult to place the metal wire close to the probe volume because the probe volume size and mental wire diameter are dozens of microns. According to obtain the changing curve of the probe volume size and the energy of the incident X-ray beam, various metal wires were used, which is a waste of time. The metal film is suitable for measuring the depth resolution of the probe volume (Z). However, it is difficult for the metal film to measure the horizontal resolution of the probe volume (X, Y). To solve the problem mentioned above, a special sample of series metal wires stick on paper was used to measure the size of the confocal volume of the confocal X-ray instrument. To adjusting the special sample close to the probe volume, the probe volume can be placed in the plane of the paper. With the assistance of the digital camera, the metal wire can be rapidly placed close to the probe volume. After putting the metal wire close to the probe volume, two-dimensional scanning is performed along with two directions of the probe volume with the help of the motorized translation stage. The changing curve of the probe volume and incident X-ray energy was obtained by processing the data obtained from the two-dimensional scanning. In this study, the probe volume size of the confocal X-ray instrument in our laboratory was measured by the method proposed above.
Fluorescence quenching technology is one of the advanced technologies for rapid measurement of oxygen content in sewage, surface water and aquaculture water. Oxygen sensitive membrane is the core of fluorescence quenching detection technology. Oxygen sensitive membrane with high fluorescence emission efficiency owns high sensitivity, strong specificity and high signal-to-noise ratio,which makes the detection results more accurate. High efficiency is not the basis of selecting oxygen sensitive film and the key to the optimization design of dissolved oxygen detection components, detection circuit and detection optical path. There is no standard method for evaluating the quality of oxygen-sensitive membranes in existing dissolved oxygen fluorescence detection devices. Based on the research on the optical path and circuit of existing sensor probes, this paper proposes a method to evaluate the quality of oxygen-sensitive membranes using the fluorescence emission efficiency of the whole wavelength range. In this method, the high-power xenon lamp was selected as the excitation light source, and the monochromatic spectroscopy was performed based on the continuous single-wavelength scanning method. Then of oxygen-sensitive membranes were determined by scanning the excitation light spectrum and fluorescence spectrum, and the fluorescence emission efficiency calculation method was put forward and established. The method could objectively evaluate the fluorescence emission ability and find the optimum excitation wavelength accurately. In order to verify the feasibility of this method, this article conducted experimental measurement on a number of oxygen-sensitive film samples from home and abroad. The test results showed that: the fluorescence emission efficiency of a single oxygen-sensitive film varied with wavelength and exhibits a multimodal distribution. The fluorescence efficiency curves of the samples of the same type were similar, but there were significant differences in the fluorescence emission efficiency. The fluorescence emission efficiency of the samples with the largest excitation wavelength was 14.5% higher than that of the ones with the smallest excitation wavelength. The wavelength of the highest peak of the given three films were located differently, respectively lying at 401, 543 and 435 nm, meanwhile, all emission peaks were at 650 nm. it is great different of magnitude from 10 to 100 times of the maximum fluorescence emission efficiency for every oxygen sensor membrane. In practice, the observed fluorescence efficiency is only half of the highest, because the exit light wavelength used is not the best one with highest fluorescence, which indicates that it is necessary to optimize the wavelength selection of exit light in order to obtain the highest efficiency. In conclusion, this paper established a dissolved oxygen-sensitive membrane fluorescence emission efficiency detection system, proposed a method to effectively evaluate the quality of oxygen-sensitive membranes based on fluorescence emission efficiency, and carried out the experimental determination of oxygen-sensitive membrane samples. The work in this paper is expected to be used in the research of new oxygen-sensitive membrane materials and processes and the optimal design and manufacture of sensors.
The frequency and area of red tide in China’s coastal areas continue to increase, resulting in serious economic losses. According to the toxic characteristics of red tide, it is usually classified into three categories: non-toxic red tide, ichthyotoxic red tide and toxic red tide. Among them, paralytic shellfish poison is the main toxin produced by toxic red tide. Because of its wide distribution and strong toxicity have become one of the most harmful biological toxins. According to the different intake of paralytic shellfish poisoning, people will feel tingling or burning in various parts of the body after eating shellfish poisoning, and then they will be paralyzed or even die in a short time. Many people have died after eating shellfish. The intake of paralytic shellfish poisoning mainly depends on the concentration of paralytic shellfish poisoning algae. Therefore, it is particularly important to monitor the concentration of paralytic shellfish poison producing algae. In this paper, a quantitative analysis model of paralytic shellfish poison producing algae was established by three-dimensional fluorescence spectroscopy combined with chemometrics. Firstly, The three-dimensional fluorescence spectrum contour map of algae samples were analyzed by f-4600 fluorophotometer, including Alexandrium minimum, Gymnodinium catenatum and Alexandrium. Then, the new features of the three-dimensional fluorescence spectrum of paralytic shellfish poisoning algae were established using the emission spectrum data under different excitation wavelengths. Finally, the new feature was the input of particle swarm optimization least squares support vector machine and partial least squares regression respectively, and the quantitative analysis model of paralytic shellfish poisoning algae was made. The results showed that the quantitative analysis model established by Particle Swarm Optimization- Least Squares Support Vector Machine algorithm was generally better than the partial least squares regression algorithm when using the emission wavelength of 650~750 nm under an excitation wavelength of 460 and 530 nm. The results show that RC=0.999 9, RMSEC=0.017 1, RP=0.949 2, RMSEP=0.291 0. It shows that the three-dimensional fluorescence spectrum combined with the quantitative analysis model of Particle Swarm Optimization- Least Squares Support Vector Machine can effectively monitor the concentration value of paralytic shellfish poison producing algae in vivo, which provides a new online detection method for the concentration detection of paralytic shellfish poison producing algae.
The emergence of oil pollution has destroyed the ecological environment. Therefore, the study of oil identification methods is of great significance to the protection of the environment. Petroleum spectrum data can be obtained by fluorescence spectroscopy. At the same time, the spectrum data is preprocessed, and feature information is extracted by dimensionality reduction. Then the pattern recognition algorithm is used for classification, it can realize the qualitative analysis of oil. However, it is vital to study a more efficient way of data dimensionality reduction and recognition algorithms. Based on the three-dimensional fluorescence spectroscopy technology, this paper uses sparse principal component analysis (SPCA) to extract the features of the fluorescence spectrum data measured by the FS920 spectrometer, and the support vector machine (SVM) algorithm applies for classification and recognition, thereby a more efficient oil identification method is obtained. First, seawater and sodium dodecyl sulfate (SDS) was prepared into a micelle solution with a concentration of 0.1 mol·L-1. It was used as a solvent to prepare solutions of 20 different concentrations of 4 kinds of oil: Diesel oil, Jet fuel, Gasoline and Lubricating oil. Then, the three-dimensional fluorescence spectrum was measured by the FS920 spectrometer, and the data schould be preprocessed. Finally, the pre-processed data is extracted using SPCA, and principal component analysis (PCA), and the feature vectors are classified by SVM and K-nearest neighbor (KNN) two pattern recognition algorithms, the classification results of four models PCA-KNN, SPCA-KNN, PCA-SVM and SPCA-SVM are obtained. The research results show that the classification accuracy rates obtained by the four models are 85%, 90%, 90% and 95% respectively. In the same classification algorithm, the classification accuracy obtained by using SPCA is 5% higher than that of PCA. Therefore, SPCA can better highlight the main components in its sparsity, and the sparsity of the load matrix can remove redundant information between variables, achieve the optimization of dimensionality reduction, and provide a better classification for subsequent classification. Effective data feature information; Under the same feature extraction algorithm, the classification accuracy rate obtained by using the SVM algorithm for classification is 5% higher than the accuracy rate obtained by the KNN algorithm, it shows that the SVM algorithm has more advantages in classification. Therefore, this paper uses three-dimensional fluorescence spectroscopy technology combined with SPCA and SVM algorithms to accurately identify petroleum, which provides a new idea for the efficient detection of petroleum pollutants in the future.
Non-tuberculosis mycobacteria (NTM) are the collection of mycobacteria other than Mycobacterium tuberculosis complex (MTC) and Mycobacterium leprosy. The clinical symptoms of NTM are very similar to MTC infection, yet their treatments are different, thus rapid and accurate identification methods of NTM are urgently needed. Single-cell Raman Spectroscopy (SCRS) is label-free, and independent of cultivation, thus it is deemed a rapid and efficient technology with low cost. Here we propose an SCRS based method to identify NTM based on confocal SCRS. We selected six common NTM species in the clinic, Mycobacterium abscessus, Mycobacterium gordonae, Mycobacterium fortuitum, Mycobacterium fortuitum, Mycobacterium avium and Mycobacterium kansasii. The unsupervised low-dimensional visualization t-distribution random neighborhood embedding method for the data structures proved the separability of data in the low-dimensional space. Performance of six commonly classifiers, including Support Vector Machine (SVM), K-Nearest Neighbor method (KNN), Partial Least Square-Discriminate Analysis (PLS-DA), Random Forests (RF), Linear Discriminant Analysis (LDA) and XG Boost was compared, with SVM and LDA achieving an accuracy of 99.4% and 98.8% respectively in NTMs classification. SVM offers 100% classification accuracy for every species, except Mycobacterium kansasii which is slightly lower (97.96%, 48/49), while LDA offers 100% accuracy for each species except Mycobacterium abscessus (95.65%; 22/23) and Mycobacterium gordonae(96.30%, 26/27). Therefore, SCRS combined with SVM can accurately classify NTMs and thus provide a new tool for the rapid diagnosis of NTM.
Chlorpyrifos, a broad-spectrum and highly effective organophosphorus pesticide, is widely used in agriculture and other fields. However, environmental toxicology studies have found that chlorpyrifos can be directly applied to the soil, firmly binds to soil particles, hardly migrate or volatilize, and has low water solubility, which is likely to cause drug residues, thus affects the safety of agricultural and sideline products. Many countries have strict regulations on the residual amount of chlorpyrifos in agricultural products. Therefore, detecting the ecological risk of chlorpyrifos residues is a top priority. Surface-enhanced Raman spectroscopy has the advantages of fast, high efficiency and high sensitivity, and has become a hot technology in the spectroscopy research field. Density functional theory is widely used in theoretical simulation calculations and spectral analysis of molecular structure and properties. This paper, based on the surface-enhanced Raman spectroscopy technology and density functional theory, the theoretical study of chlorpyrifos Raman and surface-enhanced Raman spectroscopy is carried out. First, GaussView5.0 was used to configure the insecticide chlorpyrifos molecule and the molecular structure added to the silver cluster base. Second, the 6-31G basis set was used for the chlorpyrifos molecule, and the structure was optimized based on density functional theory, and then the Raman and surface-enhanced Raman spectra were calculated by Gaussian09 simulation. The Raman spectrum peak attributions were determined. Finally, the enhancement effect of silver clusters Ag2 and Ag3 on the Raman spectrum of chlorpyrifos was analysed from the frequency shift perspective, and the frequency shift was compared. The study found that the peak intensity of Raman spectrum at 326, 463, 741, 781, 1 068, 1 294, 1 435, and 1 602 cm-1 wavenumber has a significant increase with the action of the silver clusters, and with the increase of the size of the silver cluster structure, the enhancement was more effective. Besides, the position of some characteristic peaks shifted and the frequency shift was related to the structure of silver cluster Correlatively. Raman spectrum of 463, 741 to 781 cm-1 wavenumber produced a large frequency shift and the frequency shifts at other characteristic peak wavenumbers were all smaller than 20 cm-1. The frequency shifts of the surface enhanced spectra of Ag2 invasion with the chlorpyrifos molecule were in agreement with the shifts of Ag3 invasion with the chlorpyrifos molecule. The results of this article provide a theoretical basis for applying surface-enhanced Raman spectroscopy for pesticide residue detection.
Spatially offset Raman spectroscopy (SORS) can accurately, fast, and non-destructively obtain the characteristic spectral information from multi-layer turbid media samples. In this work, we developed and introduced a modular inverse SORS device realizing two different spectral detection modes of inverses SORS and conventional backscattering Raman spectroscopy. The deep-layer Raman spectral information from the two/ three-layer tissue model was detected and analyzed with different spatial offset value (Δs). Meanwhile, by the geometrical optics theory and the principle of projection measurement, the quantitative relationship between Δs and the axicon lens position is addressed, which supports precise controlling of the spectral detection conditions. In order to verify the system performance, a two-layer model composed of sheep scapula/paracetamol and a three-layer model composed of pig skin/silicone rubber/paracetamol were used to obtain the mixed spectra containing the constitution information of samples surface and deep layers under different spatial offsets. By performing area-under-curve normalization on the mixed spectra, it was observed that the Raman contribution of the sample surface decreases with the increase Δs value, while the Raman contribution of the second or third layers gradually increases. Moreover, for better understanding the dependence of the relative Raman intensity on the spatial offset and thickness, the relative Raman intensity is calculated by selecting the characteristic peaks of each layer in the model. The relative Raman intensity ratio increases with the increase of Δs, which exhibits an enhanced pattern of the Raman intensity. However, with the same spatial offset condition, the relative Raman intensity induces as the thickness of the first layer increases. The above experimental results testified that our developed modular inverse SORS device could obtain spectral information from a biological model with a depth of 8 mm, and manifest the application potentialities of our inverse SORS system in transcutaneous non-destructive detection.
MgB2 superconducting film, as the alloy superconductor with the highest superconducting transition temperature so far, has a broad application prospect in the field of electronics because of its simple structure, long coherent length, no weak connection between grain boundaries, high upper critical field, short electron-phonon scattering time and so on. Raman spectroscopy is an effective method to study the electron-phonon interaction and superconducting band. Moreover, Raman spectroscopy has been used to study the electron-phonon characteristics and superconducting band structure of MgB2. Research shows that sample quality, grain size and test conditions greatly influence the peak position and shape of the Raman peak of MgB2. The change of Raman spectrum with temperature is also a research priority. However, the temperature range of MgB2 variable temperature Raman spectrum is relatively small, which is limited to 83 K to room temperature or the region near the transition temperature. In this work, the Raman spectra of MgB2 film in a large temperature range are studied. The polycrystalline MgB2 film was prepared on (0001) SiC substrate via hybrid physical-chemical vapor deposition with grain size ~300 nm and superconducting transition temperature 39.3 K. The Raman spectra of MgB2, from 20 to 1 200 cm-1, were measured and studied in the temperature region from 10 to 293 K. The Raman spectra show that Raman peaks related to MgB2 appear at ~620 cm-1 in high-frequency region and at ~80 and ~110 cm-1 in low-frequency region. The frequency of the two Raman peaks in the low-frequency region corresponds to the width of the superconducting energy gap, indicating the dual-gap characteristics of MgB2. Considering the Raman activity of the four phonon modes in MgB2, the Raman peak at ~620 cm-1 in high-frequency region is contributed by the E2g vibration mode. And as temperature decreases, no obvious peak position shift is observed. Nevertheless, the FWHM of the Raman peak decreases with temperature. Furthermore, the FWHM is 380.7 cm-1 at 293 K, and 155.7 cm-1 at 10 K. Analysis shows that the non-harmonic effect caused by the nonlinear coupling between E2g phonon and electronic system may be the main reason for the linear decrease of the FWHM.
The hygroscopicity of aerosol particles determines their size, concentration, chemical compositions and phase states, and thus affects the global climate, heterogeneous atmospheric chemistry and human health. In this study, an on-line and in-situ rapid scan attenuated total reflection Fourier transform infrared (ATR-FTIR) technique coupled with a linear relative humidity (RH) controlling system was utilized to obtain the IR spectra of aerosols under different RH. The mass growth factors (MGFs), deliquescence relative humidity (DRH) and efflorescence relative humidity (ERH) of (NH4)2SO4, NH4NO3, and mixed (NH4)2SO4/NH4NO3 aerosols were determined rapidly by measuring the peak areas of the bending vibration band of liquid water (~1 640 cm-1). Comparisons between the measurements and the predictions from the E-AIM model showed good consistency, which verifies the rapid scan ATR-FTIR as a powerful tool for investigating hygroscopic behaviors and phase transitions of atmospheric aerosols. Furthermore, pure (NH4)2SO4 and NH4NO3 particles were found to effloresce at 49% and 25% RH, respectively, while mixed (NH4)2SO4/NH4NO3 aerosols with a mole ratio of 1∶1 and 1∶2 exhibited one-stage efflorescence transition beginning at 44% and 38% RH, respectively, upon dehydration. These results indicate that the presence of NH4NO3 can inhibit the crystallization of (NH4)2SO4, and formed (NH4)2SO4 seeds will act as heterogeneous nuclei to promote the efflorescence of NH4NO3 at higher RH. In addition, the double salt (NH4)2SO4·2NH4NO3 was formed upon efflorescence of mixed particles. These findings are critical for understanding complex phase transitions of mixed inorganic aerosols and interpretation for RH dependency of heterogeneous reaction rates of atmospheric reactive species.
Aiming at the interference caused by the gas in the air gap between the gas cell and the spectrometer, as well as the baseline drift and distortion in the application of Fourier infrared spectroscopy on-line analysis of dissolved gas in transformer oil, a new method of gas absorption spectrum compensation based on time-sharing scanning with two gas cell, was proposed. Based on the traditional single-gas cell measurement, a background gas cell is added that is the same as the structure, size, and other parameters of the measurement gas cell. The background gas cell is filled with nitrogen, and the measurement gas cell is filled with the sample gas to be measured. Besides, the controller is used to realize the switching control of the background gas cell and the measurement gas cell. However, the spectrum processed by the conventional absorbance calculation formula has unknown absorption peaks in the wavenumber range of 1 100 to 1 200 cm-1. There is a severe baseline drift phenomenon, which indicates that the calculation method is no longer suitable for double gas cells. Therefore, in order to eliminate the adverse effect of the inconsistency of the parameters between the two gas cells, especially the difference in the filter characteristics of the window, a new method for calculating the gas absorption absorbance spectrum based on the double gas cell time-division scanning is further proposed, which was proved to eliminate unknown absorption peak and baseline drift, and the drift value decrease from 0.3 to 0.005. Finally, a transformer oil sample was obtained at a substation in Shaanxi, and the corresponding gas samples were obtained after degassing treatment. Conventional single-cell scanning method (group 1), two-gas cell compensation method (group 2), and gas chromatography (group 3) were used for experiments. The results show that methane concentration in group 1 is always more significant than that in group 2. At the same time, the carbon dioxide concentration in group 1 is always greater than the carbon dioxide concentration in group 2. The obvious difference in such analysis results is most likely due to the influence of the air gap between the spectrometer and the gas cell. On the whole, compared with group 1, the analysis results of group 2 are closer to those of gas chromatography. In summary, the new gas absorption spectrum compensation method based on double gas cell switching time-sharing scanning proposed in this paper can effectively solve the problem of spectral baseline drift and distortion. In gas analysis, this method can eliminate the influence of interfereing gas between the gas cell and the spectrometer, and obtain more accurate analysis results.
Rice aging during storage leads to a decline in eating quality, and protein changes are the underlying reasons. Glutelin is the main protein in rice. Raman and infrared spectroscopy were used to characterize the changes in glutelin during aging, and the differences in functional properties were compared, which was helpful to clarify the mechanism of rice aging. Raman spectroscopy showed that the normalized Raman intensities of aged rice glutelin at 1 665 and 1 218 cm-1 were 1.01 and 0.25, significantly lower than fresh rice glutelin, indicating a decreased α-helix in glutelin after rice aging. The disulfide bonds (the peak intensities at 516 and 527 cm-1 were 0.45 and 0.42 respectively), sulfoxides (the peak intensity at 1 035 cm-1 was 0.48) and sulfones (the peak intensities at 1 124, 1 152, 1 159, 1 316 and 1 334 cm-1 were 0.47, 0.22, 0.26, 0.50 and 0.63, respectively) of the aged rice glutelin were significantly higher than those of the fresh rice glutelin, indicating the obvious oxidation of sulfur-containing amino acid residues. The intensity ratio of Fermi resonance at 857/830 cm-1 of tyrosine in aged rice glutelin was 1.68, which was larger than fresh rice glutelin, indicating more exposed tyrosine residues in glutelin after aging. The Raman intensity of the tryptophan indole ring near 751 cm-1 of aged rice glutelin was 0.20, which was significantly higher than the intensity of 0.14 for the tryptophan indole ring of fresh rice glutelin, indicating more buried tryptophan residues after aging. The O—H stretching strength of the aged rice glutelin at 3 423 cm-1 was 0.05, which was significantly higher than that of the fresh rice glutelin of 0.02, indicating that the degree of intermolecular bonding was increased association between glutelin and starch strengthened. Except for the peak intensities of tyrosine Fermi resonance and sulfone at 1 333 and 1 152 cm-1 were not higher, the Raman intensities of fresh rice glutelin-aged at other peaks were higher than those of aged rice glutelin, which indicates that the oxidation degree of fresh rice glutelin-aged is high. Infrared spectroscopy showed that the absorption peaks of sulfur oxides at 1 153, 1 078 and 1 026 cm-1 in aged rice glutelin and fresh rice glutelin-aged increased, further supporting the oxidation of glutelin after aging. Compared with the functional properties of fresh rice glutelin, the solubility, water holding capacity, emulsifying properties and emulsifying stability of aged rice glutelin were significantly reduced, while oil holding capacity increased, which supported the obvious oxidation of aged rice glutelin. The solubility (except for pH 9), water holding capacity and emulsifying properties of fresh rice glutelin-aged were lower than those of aged rice glutelin, and its oil holding capacity was higher, which indicated that glutelin had a higher degree of oxidation when it was extracted from fresh rice and aged alone. The changes in the functional properties of glutelin after aging supported the oxidative changes shown by Raman and infrared spectroscopies, which provides new evidence for clarifying the roles of protein in aging deterioration of rice quality, and provides a basis for controlling the deterioration of rice aging and reducing post-harvest losses.
Soil composition is complex and varied. Predicting the contents of soil propertiesfast and efficiently is important for precision agriculture. Spectra are usually measured on dried soil samples. However, soil moisture is an important indicator for the guidance of agriculture activities. In order to predict the soil organic matter (SOM), soil moisture content (SMC), total iron (Fe) and pH value, we propose to measurement VIS-NIR spectra directly on wet samples and use Standard normal variable (SNV)-Continuous wavelet transform (CWT) method on spectra. CWT method uses Mexh as wavelet filter and 10 scales after SNV on each spectrum. Seven common methods, including Gauss filter (GS), First derivative (FD), Continuous removal (CR), and Mathematical transform (Log(1/R)) et al were used as comparisons. All of 74 samples were divided into 50 and 24, for calibrated and validation datasets. On the coefficients of each scale after SNV-CWT, wavebands that passed 0.05 significance level were selected as RF input variables. The optimal scale for each property was confirmed based on the statistical indicators of validation models. Then the Pearson correlation coefficients (PCC), Model based coefficients (MBC) and Grey relation degree (GRD) between each property and wavelet coefficients were calculated on the optimal scales. Models were estimated by the filter screening method based on the correlation coefficients calculated by the three methods. Results showed that, accuracies of all properties were improved after SNV-CWT comparing to the 7 commonly methods. The optimal transformation scales were 7, 8, 1 and 10, corresponding to SOM, SMC, Fe and pH respectively. When taking high dimension features as input variables, the Coefficient of Determination (R2) was reached to 0.90 and 0.93. The best analysis method was MBC. Because the models performed best when wavebands for the models were selected using MBC as a screening method, the R2 of SOM and SMC was 0.94 and the accuracies of Fe (R2=0.67, Mse=0.01%, RPD=1.76) and pH (R2=0.80, Mse=0.1, RPD=2.24) were greatly improved, methods can be used for extracting and monitoring multi soil properties.
The ink unearthed from the Warring States tomb M56 of Jiudian village, Jiangling County in Hubei province provides important material objects for researching the early ink materials and technologies in China. However, the types of ink, additives and binding media in ancient ink are still unknown. In this paper, Infrared Spectrometer (FTIR), Transmission Electron Microscopy (TEM), and Pyrolysis-Gas Chromatography/Mass Spectrometry (Py-GC/MS) were used to analyze the morphology and chemical composition of the Warring States ink. The results show: (1) the FTIR analysis reveals that there are the vibration absorption peaks of soot C=C skeleton near 1 595 cm-1, carboxylic acid carbonyl C=O (1 716 cm-1), alcohol C—O (1 031 and 1 092 cm-1) bonds, and O—H (3 421 cm-1) in OH and COOH, which indicates that there are carboxylic acids and alcohol in the Warring States ink; (2) the TEM results show that the characteristic of Warring States ink is similar to pine wood soot ink; (3) the results of Py-GC/MS show that there are a series of polycyclic aromatic hydrocarbons (PAHs), pyrolysis compounds of pine wood (retene and methyl dehydroabietate), camphor and cedar oil-related aromatic compounds (cedr-8-ene, beta-cedrene, cuparene and cedrol). Among these, the content of PAHs and the characteristic compounds of pine wood indicates that the Warring States ink is pine wood soot ink. Besides, camphor and cedar oil are used as additives in Warring States ink. This study shows that camphor and cedar oil existed in pine wood soot ink as additives during the Warring States period in China.
Near-infrared spectroscopy analysis technology has the advantages of low cost, high efficiency, and pollution-free. In recent years, it has been widely used in qualitative and quantitative analysis in various fields. Multivariate calibration technology is the most advanced technology in the field of spectroscopy. Changes in conditions, instruments, or substances may cause the multivariate calibration model to no longer be suitable for the prediction purposes of newly measured samples. Re-calibration and re-modeling will inevitably waste a lot of time and resources; another option is calibration transfer, which extends the existing calibration model in the source domain to the target domain to avoid the cost of repeated modeling. In the related chemometrics literature, most transfer methods need to measure a set of transfer standard samples under the same conditions of two instruments. However, in the near-infrared spectroscopy measurement technology, due to the characteristics of volatilization of the standard samples, It is not easy to obtain and save the standard samples for constructing the transfer method for instrument calibration. This paper proposes a joint feature subspace distribution alignment (JSDA) calibration transfer method in response to these problems. This method can establish a calibration transfer model without a standard sample from the instrument. JSDA first establishes the joint PCA subspace (Principal component analysis) of the data features of the source and target domains; then corrects the calibration model by aligning the source domain feature distribution and target domain feature distribution mapped in the joint feature subspace; Finally, the least squares model is used to build a calibration model on the corrected source domain, which can be directly used for the calibration of the target domain. The experimental results show that compared with the existing mature calibration transfer methods, JSDA has more advantages in predicting performance on public real data sets, which verifies the effectiveness and superiority of the model in practical applications.
Moldy core of apples is a fungal disease that affects many commercially popular cultivars of apples.It is difficult to distinguish moldy core of the fruit from its appearance until the fruit is cut open. The objective of this study was to detect moldy core of apples by visible near-infrared spectroscopy (NIRS). The discrimination effects of four kinds of apple on-line transportation postures were compared: the apple stem upward, the apple stem downward, the apple stem towards the transportation direction, and the apple stem perpendicular to the transportation direction. Principal component analysis (PCA) was used to extract the principal components from the transmission spectra of 600~900 nm, and then linear discriminant analysis (LDA), Mahalanobis distance (MD) and k-nearest neighbor (KNN) models were established for comparison. The partial least squares discriminant analysis (PLS-DA) model was established after the central pretreatment of 600~900 nm. Two machine learning algorithms, extreme learning machine (ELM) and support vector machine (SVM)were also used to predict moldy core of apples. The best modeling method is PLS-DA. The accuracy rate of stem upward and stem downward was 93.75%, and the accuracy of the other two postures were more than 85%. Then according to VIP (variable importance in projection) scores, the characteristic band 690~720 nm was extracted, and the model was rebuilt. The best result of the four postures was apple stem upward. The accuracy rate of the prediction set was 93.75%.The results showed that PLS-DA could be used as an effective method to distinguish moldy core of apples, and the stem upward can be used as an effective posture for on-line detection of moldy core of apples.
Clarifying the pedigree on Eucalyptus pellita populations is of great significance for studying rules of interspecific hybridization of eucalypt and the development of excellent new eucalypt genotypes. The purpose of the present study was to assess the accuracy and reliability of near infrared spectroscopy (NIRs) used in the analysis of the pedigree of E. pellita populations by comparing the relationship between genetic variations and NIRs differences that. The genetic materials involved natural provenances from the E. Pellita population, fresh leaves of 8~12 families were collected from each provenance. The DNA information of materials was obtained through whole-genome resequencing. Firstly, the genetic distances among provenances were evaluated with the DNA nucleotide sequence differences between samples. Meanwhile, four to six healthy leaves of each sample were placed in a drying ovenuntil completely dry. The dried leaves were milled and then put into a transparent self-sealing plastic bag. A portable NIR device, phazir RX (1 624), was used to take the NIRs information of samples. The NIRs spectral distance between validating provenance and calibrating provenance was estimated with the soft independent modeling of class analogy (SIMCA). Hierarchical clustering was performed for all provenances with NIRs Euclidean distance. PCA scores plots of provenances NIRs demonstrated the pedigree and the genetic variations of provenances. The results showed that the total mean of the genetic distance of provenances from New Guinea Island and Queensland were 0.186 and 0.157 respectively, the total mean of genetic distance between New Guinea Island and Queensland was 0.295, which was higher than that within each separate district significantly. There was a positive correlation between NIRs spectral distance and genetic distance between provenances in two separate districts, but a negative correlation was also found between some provenances of E. pellita. The correlation between genetic distance and NIRs spectral distance was also proved by the NIRs Hierarchical clustering of all provenances. However, the clustering did not completely correspond with their geographical distance of provenances, suggesting that gene flow of some forms greatly affects the genetic relationship among separate districts of E. pellita populations. The PCA score plots demonstrated that PCs plots of some provenances with large genetic distance or NIRs spectral distance would overlap seriously, and PCs plots of some provenances with close genetic distance or NIRs spectral distance would be clustered, which verified the sensitivity of NIRs in the distinguishing of heterogeneous samples, also showed the genetic variation among families inprovenance of E. pellita. All the current study results proposed that NIRs could genuinely reflect the genetic differences among provenances of E. pellita, and could be used to analyze the genetic relationship and genetic variation within eucalypt populations, and could be used to assist the improvement of eucalypts breeding populations in a generation.
The place of origin of Chinese medicine is an important factor affecting the quality of medicinal materials. The growth environment of different places of production directly impacts the growth of Chinese medicine and the accumulation of metabolites. Chinese medicinal materials are known for the difference between authentic and non-dao regions, and they have a long history in China. The change of its production area and the increase of modern main production areas have resulted in slight discrepancies between the main production areas of current medicinal materials and historical records. Fourier transform infrared spectroscopy technology has the advantages of being fast and non-destructive. Fourier Transform Infrared spectroscopy is characterized for its high speed and non-destruction. Infrared spectroscopy can completely express the information on different origins of Rehmannia glutinosa. Combined with chemometrics, FTIS can also express the digitization of information embodied in infrared spectroscopy. It can collect different Infrared spectroscopy of Rehmannia glutinosa by using Fourier transform infrared spectrometer. The original spectral data can be preprocessed like baseline correction of the original spectrum, 6 smoothing points, selection of 900~1 200 cm-1 band for highest peak normalization and so on. Moreover, FTIS can calculate the relative peak height of the main characteristic peaks of the infrared spectrum of each origin. FTIS is trying to put up quality differences with normal distribution, clustering (CA) and principal component analysis (PCA). In addition, the identification of the origin of Rehmannia glutinosa has scientific significance for the rational application of Chinese medicine. The results showed that the infrared spectra of 73 batches of Rehmannia glutinosa from different origins were collected by Fourier transform infrared spectroscopy. The peak shape, peak position and height of the fingerprints of 73 batches of Rehmannia glutinosa from different origins were basically similar, and the same chemical components were contained in different origins. The characteristic peaks and shapes are basically the same. Rehmannia glutinosa produced in Henan has prominent heights of individual characteristic peaks, and there are certain differences in fingerprint areas. The main contribution bands for the differences are: 1 639, 1 424, 1 354 and 1 260 cm-1. Four bands, a total of 13 common peaks are calibrated. Cluster analysis can divide 73 batches of Rehmannia glutinosa samples into two types, namely Huai Rehmannia glutinosa produced in Henan and other Rehmannia glutinosa, which indicates that there are internal quality differences in different origins of Rehmannia glutinosa. The normal distribution is consistent with the cluster analysis results. It showed that at the peak of 1 639 cm-1, the normal distribution curves of Huai Rehmannia glutinosa produced in Henan and other provinces are in order as follows: Shandong, Shanxi, Hebei. Therefore, this method can distinguish authentic medicinal materials from non-authentic medicinal materials well. It can reduce the dimension of the relative peak height of the resulting common peaks. And it can calculate the principal component composite scores of different origins of Rehmannia glutinosa. The results showed that the comprehensive scores of Rehmannia glutinosa produced in Henan were higher than those of other origins, indicating that the quality of Rehmannia glutinosa produced in Henan was the best. Fourier transform infrared spectroscopy combined with multivariate statistical analysis methods can non-destructively, effectively and quickly identify different origins of Rehmannia glutinosa.
The quality of jujube is susceptible to factors such as the environment, causing changes in its post-harvest redness index, leading to large differences in fruit color, which affects the analysis accuracy of its soluble solids content (SSC) detection model. Visible-near infrared spectroscopy (Vis-NIRs) combined with spectral preprocessing methods including Norris-Williams smoothing (NWS), continuous wavelet derivative (CWD), multiplicative scattering correction (MSC), standard normal variate (SNV) and NWS-MSC were used to build the partial least squares (PLS), quantitative analysis models of the SSC of jujube, with different colors (red and green-MJ, green-GJ and red-RJ). Five independent sample sets, including MJ, GJ, RJ, MJ-GJ and MJ-GJ-RJ, were used to establish the quantitative analysis models of SSC for jujube, and test set samples MJ-GJ-RJ were used for model evaluation. The correlation coefficient of calibration set (Rc) and the root mean square error of cross-validation (RMSECV) were used to evaluate model accuracy. The correlation coefficients of prediction (Rp) and the root mean square error for prediction (RMSEP) were used to evaluate model prediction accuracy. The research results showed that when the independent sample sets of MJ, GJ and RJ were used for modeling, the models only achieved a better prediction for the SSC of jujube samples with the same color, respectively. When adding GJ and GJ-RJ samples to the MJ samples to construct the quantitative model of the two mixed sample sets, including MJ-GJ and MJ-GJ-RJ. The MJ-GJ model had better prediction results of SSC for MJ and GJ jujube samples, the model’s RMSECV, Rc, RMSEP, and Rp were 1.108, 0.698, 0.980, 0.724 and 1.108, 0.698, 0.983, 0.822, respectively, but the effect of RJ samples was relatively larger, the model’s RMSECV, Rc, RMSEP, Rp were 1.108, 0.698, 1.928, 0.597. The MJ-GJ-RJ model obtained good prediction results of SSC for the three colors jujube: for the SSC model of MJ, the RMSECV, Rc, RMSEP, Rp of the MJ-GJ-RJ model were 1.158, 0.796, 1.077, 0.668; for the SSC model of GJ, the model’s RMSECV, Rc, RMSEP, Rp were 1.158, 0.796, 0.881, 0.861; for the SSC model of RJ, the model’s RMSECV, Rc, RMSEP, Rp were 1.158, 0.796, 1.140, 0.841. After using the Monte Carlo uninformative variable elimination (MCUVE) method to optimize the variables of the MJ-GJ-RJ model further, the Rc and Rp were increased from 0.796 and 0.864 to 0.884 and 0.922, respectively. The RMSECV and RMSEP were reduced from 1.158 and 0.946 to 0.886 and 0.721, respectively. The model has better analysis accuracy. When the SSC of different color jujube was analyzed using near-infrared spectroscopy, similar sample set properties for calibration and prediction or modeling variables are required to construct universality models.
In order to improve the stability and accuracy of near-infrared spectroscopy (NIR) detection of total volatile basic nitrogen (TVB-N) in fresh mutton during storage (at 4 ℃, 8 ℃, 20 ℃), the selection of characteristic spectra and prediction models is the key step of NIR spectroscopy research. The 121 mutton samples were taken as experimental objects, the NIR spectra between 680 and 2 600 nm of fresh mutton samples were collected. The scattering correction methods, including multi scattering correction (MSC), standard normal transformation (SNV), and smoothing methods including Savitzky Golay convolution smoothing (SGS), moving average smoothing (MAS), and scaling methods including normalization, centring and auto scaling, were adopted to pretreat NIR spectra, and then PLS prediction models were built, by comparison, it is found that the spectra treated with SGS got the best modeling effect. Monte Carlo sampling (MCS) method and Mahalanobis distance method (MD) were used to eliminate 5 abnormal data of mutton spectra. The sample-set partitioning based on joint x-y distance (SPXY) algorithm was used to split 75% (87 samples) of the total samples as calibration set samples and the remaining 29 were validation set samples. The competitive adaptive reweighted sampling (CARS) algorithm, uninformative variable elimination (UVE) algorithm, improved uninformative variable elimination (IUVE) algorithm, successive projections algorithm (SPA) were employed to select characteristic wavelengths, and wavelength numbers were 14, 703, 144 and 15, respectively. The full spectra and the characteristic wavelengths selected by the four methods were taken as input variables to build prediction models, the results show that the performance of the model built with the wavelengths selected by CARS is better than the model built with the wavelengths selected by UVE, IUVE and SPA, and it shows that CARS method can effectively simplify the input variables and improve the performance of the prediction model. Compared with the UVE algorithm, the IUVE algorithm can select fewer wavelengths and improve the model’s performance. The PLS models, support vector machine (SVM) models and least squares support vector machine (LS-SVM) models were established with the selected characteristic wavelengths. The optimal prediction results of the calibration set are obtained by SVM models, in which the calibration determination coefficient ($R_{C}^{2}$) and root mean square error of calibration (RMSEC) of the CARS-SVM prediction model were 0.939 1 and 1.426 7, respectively. LS-SVM prediction model achieves the optimal prediction results of validation set, and the validation determination coefficient ($R_{V}^{2}$) and the root mean square error of validation (RMSEV) of IUVE-LS-SVM prediction model were 0.856 8 and 1.886 2, respectively. The simplified and optimized TVB-N prediction models for fresh mutton during the storage period are established based on NIR characteristic spectra, which provides reference and technical support for rapid and non-destructive detection of TVB-N concentration in fresh mutton.
Infrared detection technology is widely used in the field of chemical engineering, bio-medicine, food safety, among the many chemical substance detection techniques due to its characteristics such as non-destructiveness, high sensitivity, fast detection speed, and good accuracy. Quantum dot (QD) spectrometer is a new type of micro spectrometer that uses QD instead of grating as a light splitting device and combines array detector with spectral reconstruction algorithm to realize spectrum detection. It has the advantages of small size and low cost. In order to improve the universality of existing QD spectrometers, QD devices for detecting chemical substances, and ultimately provide an effective technical approach for the development of micro-near infrared (NIR) spectroscopy devices. This article used hazardous chemicals Ethanol, simulants of chemical warfare agent sarin, mustard gas, including Dimethyl Methylphosphonate and Dichloromethane as the targets. A NIR colloidal quantum dot (CQD) array with an emission spectrum of 900~1 600 nm was prepared by mixing a variety of QD materials with UV curing glue and deposited on the RGB dot matrix. Extracted the high-frequency signal of the input spectrum and reduced the random noise interference with empirical mode decomposition method, established the corresponding spectrum reconstruction algorithm based on the least square method. The experimental results show that the preparation method of the NIR CQD array is simple, low-cost, and stable. The reconstructed spectral resolution achieved by the NIR CQD array with 144 spectral channels can reach 4.861nm. Compared with the standard absorption spectrum, the minimum deviation of its characteristic peak is only 0.043%. Therefore, detecting and identifying gas and liquid targets can be achieved by combing the NIR CQD arrays with spectral reconstruction algorithms. In the future, the spectral resolution of the reconstructed spectrum can be effectively improved by increasing the number of arrays; Spectral detection from UV to IR can also be achieved by increasing the QD materials selected; Target detection signal-to-noise ratio can be improved by optimizing the optical detection path and the reconstruction algorithm parameters.
In order to study the evolution of the chemical structural characteristics of coal samples with the increase of the degree of metamorphism, the distribution of functional groups of five coal samples with different degrees of metamorphism was studied by Fourier transform infrared spectroscopy and split-peak fitting technique, and the structural parameters were calculated based on the results. The results showed that the chemical structure of the coal samples with different degrees of metamorphism differed significantly, but the overall trend of the evolution of the samples was similar as the degree of metamorphism increased, i. e., the relatively more active functional groups gradually decreased, the more stable functional groups gradually increased, and the chemical structure of the coal samples as a whole developed towards stability and order. With the deepening of coal sample metamorphism, in terms of hydroxyl functional groups, the free hydroxyl group gradually decreased. At the same time, the hydroxyl-π hydrogen bond gradually increased, and the relative content of hydroxyl self-conjugated hydrogen bond fluctuated within 40% to 55%, which was the main type of hydroxyl hydrogen bond in coal. The overall trend of hydroxyl ether-oxygen bond and ring-conjugated hydrogen bond decreased. In terms of aliphatic hydrocarbon structure, the relative content of methylene in the experimental coal samples was higher than that of methyl and hypomethyl, indicating that the lipid ring structure and lipid chain structure were more developed in coal. At the same time, the structural parameter A(CH2)/A(CH3) increased and then decreased, indicating that the fatty chains composed of methyl, methylene and hypomethyl tended to develop in the coal samples with low degree of metamorphism, and started to break in the coal samples with medium and high degree of metamorphism. The overall length of fatty chains tended to increase and then shorten, but the number of branched chains as a whole tended to decrease and then increase. The relative content of C—O in phenols tended to increase and then decrease, and the relative content of aryl ethers and alkyl ethers gradually increased and became the main oxygen-containing groups in anthracite coals. Functional groups in anthracite. In the aromatic hydrocarbon structure, the benzene ring substitution is mainly trisubstituted, and the structural parameters $f^{C}_{ar}$ and DOC gradually become larger, which indicates that the aromatic system in coal increases and the degree of aromatic structure condensation gradually increases, and the degree of aromatic structure condensation in anthracite coal is much stronger than other coal samples.
Fritillary is widely used in clinical practice of Chinese medicinal materials, especially Fritillaria cirrhosa Don. There are adulteration and fake phenomenon, fake fritillary will have a negative impact on the health of the drug users. Terahertz Time-Domain spectroscopy has many advantages of transient, broadband, safety, penetration, etc. In recent years, Terahertz Time-Domain spectroscopy is very active in drug and food non-destructive detection. In this experiment, four common fritillaria species (Fritillaria cirrhosa Don, Fritillaria ussuriensis Maxim, Fritillaria pallidiflora Schrenk, and Fritillaria thunbergii) were taken as the research objects to explore the feasibility of using terahertz time-domain spectroscopy to identify fritillaria species. In this experiment, the TAS7500TS Terahertz spectrum system was used to collect the spectra of fritillate samples in the range of 0.6~3.0 THz, and the stoichiometric method was combined for pretreatment and classification model establishment. When the number of categories is 2, it is called Binary classification; when the number of categories exceeds 2, it is called Multiple classifications. Four kinds of fritillary were established by Partial Least Squares Discriminant Analysis (PLS-DA). Initial spectra are treated with Savitzky-Golay (S-G) smoothing, Multiplicative Scatter (MSC) Correction, Standard Normal Variable Transformations, moving averages, or Baseline. Principal Component Analysis is performed.PCA can reduce the dimensionality of the preprocessed data to reduce the amount of data computation and simplify the operation. Finally, a multi-classification model of Random Forest (RF), Support Vector Machine (SVM) and Back Propagation Neural Network (BPNN) can be established. The discriminant accuracy rate of the model was 93.333% for Fritillaria cirrhosa Don-Fritillaria pallidiflora Schrenk, 98.333% for Fritillaria cirrhosa Don-Fritillaria thunbergii, and 100% for all the other four biocalcification models. The accuracy of the other four dichotomies was 100%. By comparing and analyzing the established multi-classification models, it was found that the SVM combining SNV modeling effect is best, the Fritillaria cirrhosa Don accuracy is 95.349%, the Fritillaria pallidiflora Schrenk accuracy is 96.552%, the accuracy rate of Fritillaria ussuriensis Maxim and Fritillaria thunbergii was 100%. The overall accuracy rate was up to 97.490%. This research shows that it is feasible to use Terahertz Time-Domain spectroscopy to identify different fritillaria varieties, and a SNV-SVM multi-classification model with good classification effect is established, which provides a new means to control the quality of traditional Chinese medicine and is of great significance to maintain the normal operation of the traditional Chinese medicine market.
Jade is a rare mineral that people have favored. The identification of jade authenticity has always been a thorny problem in the jewelry identification industry. Traditional identification methods are difficult to identify the nephrite and their imitations.Terahertz standoff detection technology can realize quick non-destructive testing and has a variety of applications in the classification and identification of mixtures. In this paper, Terahertz Time-domain Spectroscopy (TDS) and pattern recognition are applied to identify nephrite and imitations. The terahertz spectrum of several nephrite jade samples from Afghanistan, China’s Qinghai, Pakistan and China’s Xinjiang and imitations, like glass, marble, and raw gemstone is measured with TDS in the frequency range 0.1~1.5 THz. Due to the complexity and diversity of the sample’s chemical composition, the nephrite jade and the imitation cannot be distinguished correctly withtheir characteristic spectrum. In order to distinguish Jade with their imitations, a classification model is established.Principal Component Analysis (PCA) performs dimension reduction and feature extraction on the refractive index. The scores of the first and second principal components of the sample were obtained. It can be found that nephrite and imitations can be clearly distinguished from each other. Based on the extracted data,third quarters of them are randomly selected as the training set, the rest as the test set, a Support Vector Machine (SVM) model is established, and the parameters of the Support Vector Machine is optimized by GridSearch, genetic algorithm (GA) and particle swarm algorithm (PSO). The optimal parameters of SVM based on grid search are c=2.828 4 and g=2 while that based on GA are c=1.740 1, g=4.544 6 and based on PSO c=11.287 2, g=1.833 1. The recognition rates of the three optimization algorithms are 97.7%, 98.3% and 98.6%, and the running time is 1.39, 3.6, 6.13 s respectively. Although the optimal parameters obtained by the three optimization algorithms are different from each other, all of them can achieve a correct classification. The results show that the Terahertz spectrum combined with the pattern recognition method is a promising technique for identifying nephrite with their imitations.
Poly-ether-ether-ketone (PEEK) can replace traditional materials such as metals and ceramics in many fields and is widely used due to its excellent properties such as heat resistance, corrosion resistance, radiation resistance, fatigue resistance, and electrical insulation. Especially with the development and application of 5G technology, PEEK has become a popular material for 5G. Temperature is an important and key factor to affect the application of PEEK materials. This work studied the Terahertz (THz) spectroscopic characteristics of PEEK and their dependences on the temperature. It is using terahertz transmission spectroscopy, combined with a temperature control device, THz time-domain spectral signals of the PEEK flake sample were measured every 5 ℃ in the temperature range from 25 to 300 ℃ with a constant temperature increasing speed. THz absorption coefficient, dielectric constant and other optical constants of the PEEK flake can be obtained with the optical constant extraction algorithm. The temperature dependence of these THz spectroscopic parameters on the temperature was analyzed. In the effective spectral range of 0.5~4 THz, the experimental results show that at room temperature (25 ℃), PEEK has a distinct characteristic absorption peak at 3.5 THz. At the temperature range of 25~300 ℃, at 1 THz frequency, the absorption coefficient and the dielectric constant of PEEK have a fluctuation of 4.38% and 5.0%, respectively, relatively to room temperature. At room temperature, the PEEK at 1 THz has a dielectric loss tangent value of 2.5×10⁻³. Compared to PMMA, PE and other polymers, the dielectric loss tangent value of PEEK is much lower; At the temperature range of 25~300 ℃, it remains relatively stable with a small fluctuation during heating, indicating excellent thermal stability and low dielectric loss of PEEK. The results in this work show that terahertz spectroscopy can be combined with a temperature-controlled device to study and characterize the thermal stability of polymer materials through the optical constants of the materials and obtain the dielectric properties of the materials at different temperatures. Terahertz spectroscopy is fast, efficient, label-free and non-destructive, and it can be used to study the internal defects, stability, and identification of materials. Simultaneously, the test data in this work can provide a reference for PEEK material applied in 5G, 6G, and other high-frequency communications at different temperatures.
Pesticides directly pollute the environment and contaminate foods, ultimately being absorbed by the human body. Its residues are highly toxic, which have serious effects on human health. Some methods such as chromatography and gas/liquid chromatography-mass spectrometry have been widely used to detect pesticide residues. However, these methods also have some disadvantages, such as complicated pre-processing steps, time-consuming and labor-intensive. Surface-enhanced Raman spectroscopy (SERS) technology is regarded as a new pesticide residue detection method due to its high sensitivity, good specificity, comprehensive fingerprint information and no damage to the sample. It can realize trace pesticides in liquid or solid samples through simple extraction. In this review, to provide new references in the detection of pesticide residues, we mainly summarized the research progress of SERS detection technology and methods for pesticide residues from the three aspects of the preparation of SERS active substrates, detection methods, and intelligent analysis of spectra. In preparing SERS active substrates, single noble metal sol nanoparticles have poor stability and sensitivity due to random and uncontrollable “hot spots”, which can no longer satisfy trace pesticide residue detection. In order to improve the adsorption capacity of the SERS substrate more target analytes are enriched on the surface of the SERS substrate and the signal does not change significantly. The single noble metal sol nanoparticles are assembled, or its surface is modified by adding chemicals, inert materials, etc., to prepare uniform SERS composite substrate, thereby effectively and specifically capturing the analyte, ensuring good reproducibility and sensitivity of SERS signal. On this basis, in order to achieve the specificity and high sensitivity detection, the detection method of SERS for pesticide residues has gradually evolved from the use of simple nanoparticles such as gold and silver nanoparticles as an enhanced substrate to the optimization of sample pretreatment techniques, the preparation of specific SERS probes by chemical modification, breakthroughs in the physical structure of enhanced substrates, and dynamic SERS(D-SERS) detection. After obtaining the Raman spectrum of the substance, the effective Raman characteristic region is usually within a short wavenumber range, and the spectral data is as high as thousands of dimensions. There is more redundancy, which leads to an increase in the complexity of subsequent analysis. SERS spectrum intelligence analysis often uses chemometrics methods to pre-process the original spectrum, extract features and modeling, realize data dimensionality reduction and main information extraction, and then achieve qualitative and quantitative for pesticide residues. In order to obtain global features and large-scale process data, deep learning methods have also been introduced into SERS spectral intelligent analysis in recent years, which has achieved good analysis results. In summary, SERS has an excellent development prospect for rapid detection of pesticide residues and can provide new ideas for future analysis and testing field.
How to extract useful information from massive or high-dimensional data is a huge challenge for current data analysis and a hot spot of current research. Variable selection technology can extract feature information variables from numerous and complex measurement data, and achieve the purpose of simplifying multivariate model and even improving the model’s prediction performance. In spectral analysis, the measurement data will inevitably contain interference and irrelevant information variables and the multicollin earity among variables, which will affect the robustness and prediction ability of the model. Therefore, the variable(wavelength) selection methods have progressed greatly in the research and application of spectral analysis. Based on the related pieces of literature and the author’s research experiences, this paper summarizes the proposals, characteristics, developments, categories, comparisons and applications in recent five yearsof methods for selecting variables not only in near-infrared spectra area but also in fields of mid-infrared spectra, Raman spectra and other spectra. The parameters as their criteria or thresholds for evaluating the importance of variables and the strategies or tracks of selecting variables are vital. Moreover, each method has its advantages and limitations. In practice, it is necessary to select the appropriate method according to the characteristics of boththe method and the object. Key contents: (1) Compared the wavelength selection, and wavelength interval selection methods; (2) Summarized the different variable selection methods based on PLS model parameters; (3) Classified and overviewed the variable selection methods according to the strategiesof searching and selection of variables. Finally, we discuss the problems of variable selection methods (such as overfitting and instability etc.) appearing in the actual system and the corresponding solutions. Meantime, there look forward to the research trend, development prospect and application direction of the variable selection methods. Among them, new criteria for evaluating the importance and new selection strategy of variables still require further research. It is expected that this paper will play a positive role in promoting the follow-up researches and applications of variable selection technology.
Optical frequency comb is widely used in high precision measurement and metrology because of its characteristics such as constant frequency interval, wavelength stability, narrow spectral line width and wide spectral band width. Among them, the fast dual-comb measurement, including spectroscopy, absolute ranging, 3D imaging and ultra fast asynchronous optical sampling, has become one of the research hotspots. The dual-comb spectroscopy system based on free-running single-cavity dual-comb laser has attracted much attention due to its advantages of simple structure, large measurement range and high accuracy. This article first introduces the features of the optical frequency comb in the time domain and frequency domain andits application, especially the advantages of the dual-comb measurement. Compared with the current mainstream dual-comb source schemes, such as frequency-stabilized and phase-locked mode-locked laser, electro-optic modulation and so on, the single-cavity dual-comb laser scheme is expected to avoid the use of complex electronic control system and simplify the structure and decrease the volume and the cost of the dual-comb source. Therefore, this paper mainly introduces single-cavity dual-comb fiber laser technology with wavelength-multiplexing, polarization-multiplexing, space-multiplexing and pulse-shape-multiplexing, and analyzes the basic principles, performance parameters and current research progress, as well as the existing problems in the current development of these technologies. Moreover, the researches and performances of polarization-maintaining fiber dual-comb lasers with higher stability are summarized. Then, this paper introduces the principle of dual-comb spectroscopy, reviews the current spectral extension technology, and introduces some application cases of dual-comb spectroscopy based on the free-running single-cavity dual-comb laser in detail, including the near infrared band of the erbium-doped fiber laser and the detection extended to mid-infrared and terahertz bands. Finally, we summarize the development trends of single-cavity dual-comb lasers, including further improving frequency stability of single-cavity dual-comb lasers, decreasing the common-mode noise of single-cavity lasers, exploring the application of single-cavity dual-comb system in mid-infrared and terahertz band, and making single-cavity dual-comb mode-locked fiber laser to be practical.