


Please enter the answer below before you can view the full text.

2020
Volume: 35 Issue 5
19 Article(s)

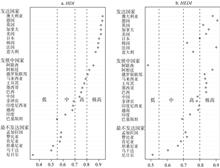
Ming-li BI, Gao-di XIE, and Cui-you YAO
It is an inevitable requirement to modify human development index (HDI) with greenness and fairness indicators. Using ecological footprint, this paper tried to construct the human-ecological sustainable development index (HEDI) based on panel data of 28 countries from 1990 to 2014, and analyzed the contribution of sub-indicators to HEDI with the Logarithmic Mean Divisia Index (LMDI) decomposition approach. Fairness was adjusted to construct a comprehensive human-ecological sustainable development index (cHEDI) that could fully reflect the degree of economy, society, ecology and equal development comprehensively. We analyzed the spatial and temporal changes of HEDI and cHEDI with the index in 28 countries around the world. The results show that developed countries with high biomass surplus are highly sustainable, ranking higher than other countries. One of the main factors affecting sustainable development is high carbon emissions in these countries. Besides the high carbon emissions, the shortage of biomass resources is another unsustainable reason in the developed countries with biomass deficit, which maintain development by transferring assets from other countries. Unfairness leads to a decline in comprehensive sustainability in the United States. From 1990 to 2014, income and education in developing countries increased rapidly, but ecological consumption and Gini coefficient continued to rise, and the inhibitory effect gradually expanded to increase the unsustainability of development. The sustainability index of the United States and developing countries is greatly affected by the Gini coefficient. The United Arab Emirates ranked last in the world, with the least sustainable development mode. Although its income ranked first in the world, biomass and energy consumption was very high, and the Gini coefficient far exceeded that of other countries. The development of the least developed countries mainly came from contribution of health, education and low ecological consumption. Barren natural assets limited their further development. Different countries have different shortcomings in human sustainable development. The sub-divisions were highly correlated, hence to achieve the high level of human sustainable development requires better balance between society, economy, greenness, and fairness.
May. 28, 2020Vol. 35 Issue 5 1017 (2020)
Yi LUO, Xuan-fu LI, Dong HUANG, and La-ping WU
Concerns about food insecurity have grown in China due to growing population and food consumption structure improvement. The research and development practitioner has begun to focus on food loss and waste, often referred to as post-harvest losses (PHL), in China. PHL reduction has been identified as a key component to complement efforts to address food security challenges and increase farmers' incomes, especially for the rural poor. This article reviews the current state of the literature on PHL mitigation. First, we identify explicitly the varied objectives underlying efforts to reduce PHL levels. There are four main objectives of reducing post-harvest loss: (1) Improve food security and protect social stability. Reducing food loss increases the quantity of food, which can reduce the need to supplement availability through transfer programs (at household level) or via commercial imports or food aid donations. (2) Reduce unnecessary resource use and protect the environment. These resources come in the form of on-farm inputs, including water, chemical fertilizer, agrochemicals, labor, and land. (3) Improve food safety. Sometimes spoilage or contamination is not perceptible to the human senses and goes undetected, leading to adverse health effects when food is consumed. These food safety concerns have major disease and global health implications. (4) Increase profits for food value chain actors. The private sector, including smallholder farmers, plays a crucial role in making food available to consumers. Second, we summarize the estimated magnitudes of losses, evaluate the methodologies used to generate those estimates. Losses and waste can be measured in quantity and quality terms, and the commonly used loss estimation methods are case study, experimental method and questionnaire survey. So it is difficult to compare values due to differences in methods, especially the methodologies employed are often unsatisfactory. Third, we synthesize and critique the impact evaluation literature around on-farm and off-farm interventions expected to deliver PHL reduction. They include: (1) Improved varietals. Because of the compounding effects of pests and deterioration accumulated before harvest, interventions that aim to reduce PHL while crops are still in the field is arguably more effective than deploying strategies that only start after harvest. (2) Education on best practices in harvest and post-harvest handling. Interventions also occur around education for best practices in harvest and post-harvest handling, generally in the form of extension messaging. (3) Chemical sprays in storage. Many farmers use some form of chemical or natural spray during home-based storage as a means of keeping pests and insects away from food, but it may lead to negative environment or health effects. (4) Improved storage of grains through advanced technologies. The most widespread intervention strategy is the use of improved storage devices such as metal silos. (5) Integrated pest management in storage. The integrated pest management paradigm is generally discussed with respect to the prevalence of pests pre-harvest, but IPM can also be useful during storage. (6) Other methods include improving infrastructures and developing rural finance. Finally, we conclude with a summary of main points.
May. 28, 2020Vol. 35 Issue 5 1030 (2020)
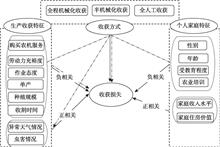
Xuan-fu LI, Dong HUANG, Xue QU, and Jun-feng ZHU
Based on the data of 3251 rural households in China, this paper compares the effects of different harvesting ways and social services (purchase of agricultural machinery services) on the loss of harvesting links of wheat, rice and maize. The results showed that compared with manual harvesting, the whole mechanized harvesting generally increased grain losses of the harvesting link, and in terms of varieties, increased rice losses, but it reduced wheat losses, and the semi-mechanized harvesting significantly reduced corn losses. In-depth study found that the purchase of agricultural machinery services can significantly reduce wheat losses in harvesting link. The results of robustness test are consistent. Based on this, this paper believes that, for wheat, we should promote the whole process of mechanization, while for rice and corn, we must develop small-scale and professional agricultural machinery suitable for farmers, so as to advance the mechanization of segments in the short term.
May. 28, 2020Vol. 35 Issue 5 1043 (2020)
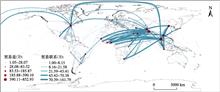
Mo-zhu ZHOU, and Jie-yong WANG
Based on the complex network theory and trade data from 2000 to 2016, a global rice trade network was constructed. This study quantitatively analysed pattern and evolution of the network and the role of China in global rice trade. The results show that the scale of network expanded and interdependence between nodes increased during the research period. The complexity and heterogeneity of the global rice trade network are obvious. Core nodes play leading roles in the stability of the network. The characteristics of importing countries are dispersed and volatile while those of exporting countries are centralized and stable. The global rice trade network in 2016 can be divided into six main communities. The largest one is led by India. Communities are often dominated by exporting countries and followed by importing countries inside. Geographical proximity is the most critical factor in the formation of community pattern. Trade choices of the demanding countries are becoming more important in the evolution of community structure. India, Thailand, China, Vietnam, Pakistan and USA are core nodes in the network. Southeast Asia, South Asia and East Asia are likely to maintain leading status of global rice production and trade. The importance of West Asia and Africa may further increase. As it is the largest rice importer in the world, the influence of China in the network is growing. But the import sources of China are over concentrated. It is suggested that we should continue to tap potential of global rice trade and take advantages of trade networks. In the premise of risks controllable, we can increase imports while optimizing exports and enhancing the complexity of our trade networks so as to improve the level of domestic food security.
May. 28, 2020Vol. 35 Issue 5 1055 (2020)
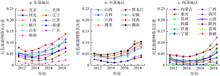
Nan GAO, Xin-cheng ZHANG, and Lin-yan WANG
Red tourism network attention degree is a typical method for measuring the performance level of red tourism development promotion, and it is also an important reflection of the influence of red tourism promotion level. This paper takes the "red tourism network attention degree" of 31 provincial-level regions as the research object, and uses the Moran index and panel vector autoregressive model to analyze the spatio-temporal characteristics and the influencing factors of the red tourism network in China from 2011 to 2018. The results show: (1) The network attention of the national red tourism shows a fluctuant growth trend in the study period, and its seasonal difference is significant. (2) The national red tourism network attention shows a decreasing trend from the eastern to central and western regions, but the trend of attention in the red tourism 5A-level tourist attractions is prominent in the western region. (3) The attention of red tourism networks in the 31 provincial-level regions has significant global spatial autocorrelation. The phenomenon of "high-high" and "low-low" agglomerations is concentrated in the eastern region, and central and western region. (4) The contribution of the factors affecting red tourism network attention was ranked as follows: internet penetration rate > per capita GDP > tourism information index > regional media attention > red tourism classic scenic network attention.
May. 28, 2020Vol. 35 Issue 5 1068 (2020)
Mao-tao DENG, Min SHANG, Zhi-juan YANG, Miao YANG, Zheng-xing YANG, and Si-miao HE
Multi-destination round-trip travel is a hot spot in the evaluation of tourism value with the travel cost method (TCM). But it is a key problem in the evaluation of recreation value to divide the public cost of multi-destination travel and determine the cost weight of each destination objectively and accurately. Therefore, this paper, with Zoige county as object of study, and most popular Huahu Lake and the First Bend of Yellow River in Zoige county as two sample points, introduces the concepts of public travel costs and the direct costs of destination, to improve the calculation model of public cost sharing in multi-destination travel; that is, the ratio of direct expenses in the destination to be evaluated to the total direct expenses of multi-destination is taken as the shared weight of the destination to be evaluated in the public travel expenses. The calculation model shares the public cost of the trip according to tourists' own consumption characteristics surveyed, and tries to avoid the influence of subjective assumptions, and to make the sharing of expenses more objective and reasonable. This can properly solve the widespread multi-destination round-trip travel problem. Based on the interval travel cost method, this paper applies the improved cost sharing calculation model to evaluate the recreation value of Zoige county. In 2017, the recreation value was 3.109 billion yuan and the per capita recreation value was 1538 yuan, in which, the travel cost was 2.506 billion yuan, the per capita travel cost was 1240 yuan, the consumer surplus was 0.603 billion yuan, and the per capita consumer surplus was 298 yuan. This paper can help to improve recreation value assessment methods by modifying the multi-destination travel cost sharing model. The research results can provide scientific guidance for the development and planning of eco-tourism industry in Zoige county.
May. 28, 2020Vol. 35 Issue 5 1090 (2020)
Chong-gang LIU, Wei SUN, Yu-hong CAO, and Chen CHEN
Rural areas play an important hinterland role in social development, and the evolution of rural spatial structure has an important impact on the function of rural ecological services. Taking Nanjing as an example, this paper conducts the research on the evolution of rural regional ecological service functions based on the scope of physical rural areas. The remote sensing quantitative measurement and CASA model are used to calculate and analyze the evolution of rural regional ecological service functions in Nanjing from 1985 to 2016. The results show that: (1) From 1985 to 2000, the value of various functions of rural ecosystem services declined in varying degrees; from 2000 to 2016, the values of all kinds of functions, except that of water conservation function, still showed a downward trend. (2) In the first stage, the decline of rural ecological service function was mainly found in the south, west to south and east to south. In the second stage, except for the increase of ecosystem services in the north and northwest directions, the decline of ecosystem services in all directions decreased in varying degrees. (3) In the stage of industrialization of villages and towns, the change of land use structure within villages had a major impact on the ecological service function. In the stage of urbanization, the impact of urban expansion on rural ecological service function was the main aspect.
May. 28, 2020Vol. 35 Issue 5 1098 (2020)
Ecosystem health assessment method of eco-redline based on land use and landscape pattern in Nanjing
Shou-guang YAN, Hui LI, Hai-dong LI, and Yin-long ZHANG
Ecological conservation redline (eco-redline), the region with special and important ecological functions in the ecological space, must be strictly protected. According to the theory of ecology, only in a well-structured and healthy ecosystem, can the ecological function be brought into full play and the ecological security be guaranteed. Therefore, the ecosystem health of eco-redline is the basis of maintaining regional ecological security. Based on the data of land use/cover and remote sensing images in years of 2000, 2005, 2010 and 2015, this paper evaluated the ecosystem health of the eco-redline in Nanjing from five aspects: vigor, organization, resilience, ecosystem service function and anthropogenic stress. The results show that: (1) The areas of forest land, farmland, water bodies, construction land, wetland and grassland in eco-redline in the study area were 511.74 km2, 456.96 km2, 432.58 km2, 118.0 km2, 32.79 km2 and 1.56 km2, respectively. The area of forest land continued to increase, while that of farmland decreased gradually. (2) From 2000 to 2015, the average ecosystem health index of eco-redline in Nanjing was 53.83, above the sub-health level, and showing a slow growth trend. (3) The ecosystem health index of terrestrial ecosystem was higher, especially in the areas with large forest vegetation coverage, compared with aquatic ecosystem.
May. 28, 2020Vol. 35 Issue 5 1109 (2020)
Cheng WANG, Rong-rong FAN, and Zhuo-qi LONG
It is of great significance to scientifically evaluate the risk level of rural production space system, reveal the characteristics of its spatial pattern, and design risk control measures differently, so as to guide and regulate the multi-subject behavior choice in rural production space system and implement healthy and sustainable rural revitalization strategy. Based on sorting out the risk mechanism of rural production space system, this paper constructs a comprehensive risk evaluation index system of rural production space system from three aspects: the pressure of risk source, the status of risk carrier, and the response of risk control mechanism. Taking 37 districts in Chongqing Municipality as the research unit, and the year 2016 as the time point for the research, this paper evaluates the risk level of the rural production space system and reveals its space differentiation characteristics. On the basis of risk control, we identify the differentiation of rural production space system. The results show that: (1) The generation of risk in rural production space system is the result of interrelation and joint action of risk source pressure, risk carrier status and risk control mechanism response. (2) The risk of rural production space system in Chongqing is generally at a medium level, showing a spatial pattern of "high in the east and low in the west". There are obvious spatial differentiation features of system pressure, status and response level. Finally, differentiated risk control measures are proposed on the dimensions of space control, land use pattern and disaster prevention, reduction and relief system.
May. 28, 2020Vol. 35 Issue 5 1119 (2020)
Yue-yue ZHANG, Cui-zhen LI, De ZHOU, and Hao XIA
Land use and management in rural areas is facing more challenges in the implementation of rural revitalization strategy. Therefore, this paper applied stakeholder analysis, game equilibrium analysis, and empirical case analysis to explore the relationship evolution of various land use stakeholders in the context of rural revitalization. The results are as follows: (1) Since the founding of the People's Republic of China in 1949, the number of rural land use stakeholders has increased, the game relationships present a feature of complexity, diversification and multidirectionality. (2) There are mainly six kinds of game relationships in the rural revitalization period. We discussed four kinds of game in the process of decision-making in the study area, namely poverty alleviation, development of rural tourism, entry of new business agents, and rural development promoted by urban residents. (3) In the context of rural revitalization, related policies should focus more on infrastructure construction, the coordination of land use efficiency and ecological environment, the sustainability of farmers' livelihoods, etc. The conclusion is that we should be devoted to achieving the optimal balance of land use stakeholders, reducing the risks of stakeholders, protecting the ecological environment and seeking balanced interests among stakeholders in the process of rural revitalization.
May. 28, 2020Vol. 35 Issue 5 1132 (2020)
Xiao LYU, Tao ZANG, and Quan-jing ZHANG
Based on the framework of social cognition theory and planned behavior theory, the principal component analysis method, Heckman two-stage model, and comparative analysis method were adopted using 379 farmer survey questionnaires from three counties (districts) of Wulian, Dongping, and Kenli in Shandong province. The purpose is to explore the main influencing factors, mechanism and difference of farmers' scale management willingness and behavior, and to provide decision-making reference for promoting the moderate farmland scale management. The results showed that: (1) The degree of cognition of land policy by farmers interviewed is generally low in the case study areas, and there are regional differences in the level and structure of cognition. (2) The individual characteristics, resource endowment and location factors all have significant effects on the scale management willingness, while the influences of policy cognition and social security are not significant. The individual characteristics, resource endowment, policy cognition, social security and location factors all have influence on scale management behavior. Among them, the factors that have greater effects and pass the significance test are whether to participate in agricultural insurance and the cognition degree of new business entities. (3) Some 27.70% of the farmers interviewed have inconsistency between scale management willingness and behaviors. There are some differences in the scale management influencing mechanism between mountain and plain farmers, and there are many differences in the factors affecting the farmers' willingness and behavior. (4) It is necessary to thoroughly understand the level and structure of farmers' policy cognition, strengthen publicity and education in a targeted way, build information platforms according to local conditions, reduce transaction costs for the transfer of agricultural land, and build an agricultural socialized service system for small farmers to realize the dual scale of "land + service".
May. 28, 2020Vol. 35 Issue 5 1147 (2020)
Wei-hua LIAO, Xin NIE, and Wei-guo JIANG
Land use change is a long-term process with certain complexity. The traditional transfer matrix method can only compare the two phases of land use data, but cannot summarize the long-term overall change law. The frequent itemsets method cannot derive the sequence trajectory. To overcome the shortcomings of these methods, this paper proposes a land use change model based on sequence model. According to the actual characteristics of land sequence data and the vertical format sequence pattern SPADE algorithm, taking Guangxi, China as an example, we calculated the sequence of 22 secondary land use types in 7 periods from 1970s to 2015. The results show that, in the 35 years, land use types changed in 6.58% of Guangxi, and the change areas were mainly concentrated in roads, towns and settlements; the top 3 types of land use change 1-sequence support degree in Guangxi are {wood land}, {other wood land} and {sparse forest land}, and the support degree values are 0.5109, 0.3810 and 0.2333, respectively. The top 3 types of the 2-sequence support degree are {wood land, other wood land}, {other wood land, wood land} and {sparse forest land, wood land}, and the support degree values are 0.2040, 0.0699 and 0.0640, respectively. The top 3 types of the 3-sequence support degree are {sparse forest land, other wood land, wood land}, {sparse forest land, wood land, other wood land} and {high coverage grassland, wood land, other wood land}, and the support degree values are 0.0065, 0.0044 and 0.0031, respectively. The land use change 3-sequence {with forest land, other woodland, and other construction sites} has a support degree of 0.0007. The land use change in the study area mainly occurs in forest land, and some forest land is converted into construction land types such as mines, quarries and traffic roads; urban land is mainly converted from dry land and paddy fields; there is no land unit converted into paddy fields during the study period. The land use change sequence analysis model proposed in this paper can calculate the sequence of multi-period land use change as a whole, and make up for the shortcomings of studying land use change from a long-term scale.
May. 28, 2020Vol. 35 Issue 5 1160 (2020)
Yu-shuo ZHANG, Dian-ting WU, and Xiao LYU
As an important link between human and natural systems, ecosystem services are closely related to human well-being and sustainable development. Land use/land cover change (LUCC) is one of the important drivers for ecosystem services change, and it has a significant impact on ecosystem services at the local, regional and global scales. Under the background of ecological civilization construction, it is very important to understand the spatial characteristics, differences and correlation at multi spatial scales. It is beneficial for studying the scale effect profoundly, coordinating the decision-making of multi-level management institutions and alleviating the constraints of scarce ecosystem services on socio-economic development. From the perspective of spatial scale, we summarized the concepts of spatial scale on this topic and introduced the analytical framework for considering spatial scale effect based on the recent theoretical and empirical developments. Then, we systematically analyzed the scale selection basis, features and correlation on the impact of LUCC on ecosystem services at different spatial scales, following the research thinking and process. Furthermore, we evaluated the research approach used to study the impact of LUCC on ecosystem services at both single scale and multi scales. This review put forward the key questions which should be considered in studies on the scale effect as follows: (1) building a research framework combining humanistic factors with natural factors; (2) explaining the scale effect of LUCC on ecosystem services; (3) exploring the effective analytical methods of the scale effect of LUCC on ecosystem services.
May. 28, 2020Vol. 35 Issue 5 1172 (2020)
Teng-fei DU, Wei QI, Xi-cun ZHU, Xin WANG, Yu ZHANG, and Lei ZHANG
Space control of natural resources is the basic tool for balancing the relationship between ecological protection and economic development. Observing the bottom line of ecological security pattern strictly is of great guiding significance to reconstruct the new pattern of natural resources spatial control with complete system and ecological surplus. Taking Qixia city, an mountainous intensive agricultural area in Jiaodong Peninsula, as a case study area, coupling pattern and process, integrating geographic information method and model, this paper identified the ecological sources from the aspects of ecosystem service function importance and ecological environment sensitivity. Then the basic ecological resistance surface based on land cover and anthropogenic disturbance was revised by the terrain niche index, and the ecological corridors were identified using the minimum cumulative resistance model, so as to construct the ecological security pattern and achieve natural resources zoning control for Qixia city. The results showed that the ecological sources of Qixia city were 627.80 km2, accounting for 31.14% of the total area, mainly distributed in the central eastern, the central southern and the northwestern regions. More than half of the ecological sources were forest land. The key and optimized ecological corridors were 237.19 km and 83.90 km, mostly composed of forest land, mainly distributed in the central eastern, the northwest and the southwest, forming a complete ecological network. Finally, prohibited, restricted, conditional and prioritized construction areas were delineated. This provided method guarantee for precise control of natural resources space.
May. 28, 2020Vol. 35 Issue 5 1190 (2020)
Gang WANG, He-ping LIAO, Hui-kun HONG, Yi-ming CHEN, and Tao LI
Industrial assistance is one of the most important parts of targeted poverty alleviation, the impact of poverty identification and targeted assistance on the efficiency of poverty alleviation industry is worth of further study. Based on the survey data of 534 farmers in Shizhu Tujia Autonomous county, Chongqing, this paper applied the classical statistical analysis framework to test the differences in planting industry efficiency between villages and farmers after poverty identification, and further explored the formation of differences. The results show that: (1) Poverty identification and targeted assistance significantly promote the efficiency of the planting industry, especially in the poverty-stricken villages and the poor households. (2) The policy is the key factor that causes significant differences in planting efficiency between poor and non-poor villages and households. Among them, infrastructure construction such as road construction, and characteristic planting industries have a particularly strong impact on poverty-stricken villages and poor households. (3) The effect of age on the efficiency of the planting industry in poverty-stricken areas shows a "U-shaped" pattern, in which 55 to 60 years old is an efficiency turning point. (4) Farmers with high school education and above can promote the efficiency of the planting industry. Therefore, in order to resolve the unbalanced contradictory problem, the local governments should continue to implement industrial assistance policies and establish a long-term mechanism to ensure the steady growth of poor people's income, and improve the agricultural labor force in poverty-stricken areas, as well as increase the level of human capital.
May. 28, 2020Vol. 35 Issue 5 1201 (2020)
Shuai LI, Bo ZHANG, Bin MA, Qi HOU, and Hang HE
In order to figure out the impact of climate warming on crop planting areas, this paper used grid data to analyze agricultural heat resources in China based on methods of Sliding Mean Temperature of Five Days, accumulated anomaly, Manner-Kendall test and multiple regression interpolation. The results showed that: (1) The effective accumulative temperatures (≥5 ℃ and ≥10 ℃) show an overall upward trend, and the accumulative temperature of ≥5 ℃ is more remarkable. The southern region has the highest inclination rate, followed by the northern region, and the Qinghai-Tibet Plateau has the smallest, while the cumulative temperatures of the Qinling-Daba mountains show a decreasing trend. (2) The effective accumulated temperatures (≥5 ℃ and ≥10 ℃) present a similar spatial distribution, namely, the accumulated temperature varied with latitude from south to north and varied with altitude from east to west. The eastern and central regions of China are obviously affected by latitude, while the western region is affected more by altitude than latitude. The area suitable for planting chimonophilous crop is larger than that suitable for thermophilic crop. (3) The effective accumulated temperatures of both ≥5 ℃ and ≥10 ℃ mutated in 1997, and both of their boundaries show a tendency toward northward and high altitude. The cumulative temperature increment in the south is larger than that in the north. The Qinghai-Tibet Plateau and mountain areas with high altitude have the smallest increase, while cumulative temperature increment is negative in the Qinling Mountains. (4) The initial days (closing day) of the effective accumulated temperature (≥5 ℃ and ≥10 ℃) presented an overall phenomenon of advance (delay), and the number of advance (delay) days is mostly within 0-10 days. Both of their durations increased overall after mutation. The number of initial days (closing day) in advance (delay) is the largest in the Qinghai-Tibet Plateau.
May. 28, 2020Vol. 35 Issue 5 1216 (2020)
Zheng CHEN, Wen-jie WANG, Wei-guo JIANG, Kai JIA, and Kun CHEN
This paper aims to analyze the variation pattern of irrigation water use in the Huang-Huai-Hai Plain and its relationship with drought. Based on the irrigation water consumption and withdrawal data, GRACE data and scPDSI data, the relationship between irrigation water use and drought in the Huang-Huai-Hai Plain was analyzed in this paper. The results showed that (1) irrigation water consumption accounts for about one-third of the water withdrawal. The irrigation water use in the southern part of Hebei province, Henan and Shandong province is higher than that of other regions. Irrigation water withdrawal in the Huang-Huai-Hai Plain increased from 2003 to 2014, with a rate of about 37 mm/month. (2) The meteorological condition tended to be arid, and there was a significant nonlinear correlation between scPDSI and the number of cells with positive irrigation water withdrawal anomaly (R2=0.60), especially from August to December. (3) The obvious decrease of precipitation led to occurrence of drought events. Therefore, irrigation water withdrawal was increased to ensure grain production. This indicates that drought is a major cause for increased irrigation water use in the Huang-Huai-Hai Plain and exacerbates the terrestrial water storage deficit.
May. 28, 2020Vol. 35 Issue 5 1228 (2020)
Rong-rong XIE, Ru-lin WU, Chen TANG, Yue-ting LAI, Kai-sheng GONG, and Jia-bing LI
In this paper, three sampling sites, namely a non-invaded Cyperus malaccensis wetland (A), a Spartina alterniflora-invaded patch edge (B) and a Spartina alterniflora-invaded wetland (C) were selected to examine the effects of Spartina alterniflora invasion on heavy metal accumulation in estuarine wetland sediments. Sediment Cobalt (Co), Nickel (Ni), Copper (Cu) and Arsenic (As) at 10 different depths were analyzed and then evaluated using geo-accumulation indexes and potential ecological risks evaluation methodology. The results suggested that: (1) Co, Ni, Cu and As in sediments increased with the invasive time of Spartina alterniflora (i.e. C>B>A), and the retention of Co, Ni, Cu and As increased by 26.31%, 19.66%, 50.79% and 16.93%, respectively. (2) According to the geo-accumulation indexes, Co, Ni and Cu in the research area were slightly polluted and As experienced a transitional period from strongly polluted to extremely polluted. (3) The potential ecological risks of Co, Ni and Cu were low, however As at sites A and B was in high potential ecological risk and that at site C was in very high risk. The results of both methods showed that Spartina alterniflora invasion increased heavy metal pollution and potential ecological risks. And more attention should be given to the As pollution in the research area. Finally, the heavy metals in sediments were significantly correlated with total carbon, total nitrogen, C/N, bulk density and aboveground biomass, which indicated that the accumulation of heavy metals might be related to the developed biomass aboveground and the dense root structure underground of Spartina alterniflora.
May. 28, 2020Vol. 35 Issue 5 1238 (2020)
Wei-wei MA, and Wen-ying SUN
In order to study the effects of soil organic carbon (SOC) and soil enzyme activities during the vegetation degradation process, the field experiments were conducted in marsh meadow of Gahai Wetland on the eastern edge of Qinghai-Tibet Plateau. The main results were as follows: vegetation degradation significantly affected SOC content and soil enzyme activity, reduced SOC content and enzymatic reaction efficiency, and this effect varied with soil depth. The weighted mean values of organic carbon content and soil enzymes activity in 0-100 cm layers varied in different stages of vegetation degradation of marsh meadow, following an order of non-degradation > light degradation > moderate degradation > heavy degradation. In different soil layers, the organic carbon content in 20-40 cm soil layer was moderate degradation > light degradation, and the activity of amylase and cellobiose in 0-10 cm soil layer was moderate degradation > light degradation. In 20-100 cm soil layer, the activity values of invertase were the highest in heavy degradation stage, and the activity values of fiber disaccharidase showed heavy degradation > moderate degradation. With increasing soil layers, SOC content, invertase and fiber disaccharidase activity decreased significantly (P 40 cm soil layer.
May. 28, 2020Vol. 35 Issue 5 1250 (2020)
© Copyright 2018-2021 | Chinese Laser Press.
All Rights Reserved 沪ICP备15018463号-20