


 View fulltext

2022
Volume: 51 Issue 6
41 Article(s)

Guan ZHOU, Libo LI, Di FU, Yafei ZHANG, Yutao FENG, and Changhai LIU
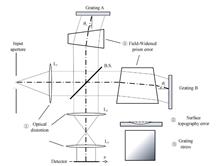
The wind information of the middle and upper atmosphere is very important to study the coupling of the upper and lower atmosphere and energy, to ensure the smooth development of spacecraft space activities, and to carry out medium and long-term meteorological predictions. The doppler asymmetric spatial heterodyne wind measurement technology is a technique based on the Fourier transform of the interferogram to realize the detection of the doppler frequency shift of the wind. Doppler asymmetric spatial heterodyne is a new passive wind detection technology. For the interferometer, the processing and assembly errors of optical components and structural components, and the aberration of the optical system will distort the interference image. Introducing inversion error in the process of wind speed measurement. The current research on DASH interferogram distortion has not analyzed the influence of interferogram distortion on the accuracy of Doppler phase inversion and lacks the quantitative theoretical basis for the design, processing, and adjustment of Doppler asymmetric spatial heterodyne. In this paper, we analyzed the sources of different distortion in Doppler asymmetric spatial heterodyne. Then by adding different types and sizes of interferogram distortions to the interferograms of the red and green oxygen emission line, the simulation compares the difference between the distorted interferogram’s and the ideal interferogram’s Doppler phase. By adding optical distortion, local bending, slanted fringes and frequency changed these four different forms of interferogram distortion, we got the influence of distortion on the accuracy of Doppler phase inversion. The results show that the Doppler phase error will increase with the increase of the target wind field and interferogram distortion. The Doppler phase error of optical distortion is also will increase with the increase of the target wind field but will fluctuate increase with the increase of interferogram distortion. Among these four different forms of interferogram distortion, the local bending of fringes has the greatest influence on Doppler phase inversion. The phase error increases by 0.113‰ for each additional pixel of the local bending. But the maximum phase error is only 0.03‰ under the condition of 2% distortion. To further explore the influence of local bending sizes and location, we simulate various interferograms with local bending of different sizes and locations. The result shows that the Doppler phase error fluctuation decreases and gradually converges when the size increases. And the phase error fluctuates with the change of position. The fluctuation amount in the first half is small, and the fluctuation in the second half increases gradually. The phase error generated by the same bending at the sampling center is larger than that at the sampling edge. Therefore, attention should be paid to the small distortion in the sampling center area, and if necessary, interferogram correction should be performed to reduce the phase error. The simulation of errors caused by local bending on systems with different fringe frequencies shows that the same amount of bending will have a greater impact on systems with high fringe frequencies. In addition, interferogram with a low signal-to-noise ratio usually uses multiple rows of pixels of the interferogram to reduce uncertainty of phase. Local modulation is reduced when multiple rows of pixels of the distorted interferogram are merged. In order to find out the actual impact of the distorted interferogram in multiple rows of pixels of interferogram, we simulate different interferograms with local bending of different local bending max offset, in different signal-to-noise ratio and modulation. The result shows that even local modulation is reduced when multiple rows of pixels of the distorted interferogram are merged, but the phase uncertainty of the interferogram will not increase. Therefore, even if the interferogram has defects, multiple rows of pixels can be merged to increase the signal-to-noise ratio and reduce the phase uncertainty. This article may provide a quantitative theoretical reference for the design, processing, and adjustment of the Doppler asymmetric spatial heterodyne.
Jun. 25, 2022Vol. 51 Issue 6 0601001 (2022)
Dechun ZHAO, Yansong SONG, Yang LIU, Yan DONG, and Baishuo ZHANG
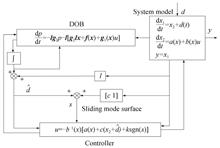
Tip-tilt mirror is a type of precision optical equipment that controls the direction of beam propagation in modern photoelectric systems. It has been utilized in space laser communications, adaptive optics, vehicle/airborne laser systems, image stabilization, astronomical telescopes, confocal microscopy, real-time laser scanning, capture target tracking, and other applications. The tip-tilt mirror is used in adaptive optics to correct the phase wavefront caused by atmospheric turbulence, which accounts for approximately 87% of the overall tilt. As a result, the tip-tilt mirror helps to rectify the first-order tilt of the system.The closed-loop performance of the adaptive optics system is severely harmed because the tip-tilt mirror is susceptible to wind vibration, equipment vibration, and platform vibration. As a result, the vibration must be minimized to approach the diffraction limit of optics. The standard closed-loop feedback control is ineffective in suppressing the vibration of the tip-tilt mirror, reducing closed-loop performance. In consequence, research into novel anti-vibration technology is critical to improving the closed-loop performance of the tip-tilt mirror. There are numerous methods for reducing vibration in use today. For example, literature offered a disturbance-based feedforward control method to suppress structural vibration of the tip-tilt mirror system, which involved measuring the disturbance with an accelerometer or a gyroscope and then feeding the disturbance with signal reconstruction. Returning to the system, the controller is not limited by low-rate sampling because it can produce a large suppression bandwidth. Additional measurement equipment, on the other hand, will raise the cost of the system as well as its complexity and analytical difficulty. Accelerometers or gyroscopes suffer from severe low-frequency drift and high-frequency noise. Existing control systems face extra control issues as a result of the accuracy of vibration estimation. Many enhanced control structures and optimized controllers, such as the Linear Quadratic Gaussian controller (LQG) and H∞/H2controller, have been developed based on the assumption of perturbation feedforward control. The results demonstrate that these strategies can improve the closed-loop performance of the system by 20% to 30%. However, the performance of the closed-loop system is dependent on the model accuracy and vibration of the controlled object. For example, in the tip-tilt mirror control system, if the model error is considerable, the performance of the system would be severely hampered. Because interference normally occurs in the low-frequency domain while sensor noise occurs in the high-frequency domain, a disturbance observer is employed to suppress interference in the low-frequency domain when the interference can be reliably estimated or measured. The Q-filter is commonly employed as an optimum filter in various servo control systemsto maximize closed-loop performance in terms of control bandwidth and robust stability. When low-frequency and intermediate-frequency interference are significant, the high bandwidth of the low-pass filter is necessary. Sliding Mode Control (SMC) is widely used in industry because of its simple algorithm, strong anti-interference ability, and ability to overcome system uncertainty. However, the uncertainty existing in many practical systems does not satisfy the matching conditions of the system. For example permanent magnet synchronous motor system due to uncertainty caused by parameter variation and load torque, flight control system without dynamic modeling, external wind vibration, and parameter variation causing concentrated disturbance torque, For these systems, the sliding-mode motion of conventional SMC suffers from mismatch perturbations, which greatly reduces their robustness.To solve the control problem of the tip-tilt mirror in Adaptive Optics with the external disturbance, a disturbance observer was designed based on the sliding mode control (DOB-SMC) to suppress structural vibration. A new disturbance observer (DOB) was added to the traditional SMC method in the tip-tilt mirror control system, and a new sliding mode control rate was designed to suppress chattering. The improved DOB was not limited by precise models. And the emulation proved that this method is achievable. The experimental results showed that the control error of the azimuth axis is reduced from 1.637 μrad to 1.083 μrad, and the accuracy is improved by about 51.2%. The control error of the pitch axis is reduced from 1.966 μrad to 1.614 μrad, and the accuracy is improved by about 21.8%. This method can greatly weaken the inherent chattering and external disturbance of the system, and improve the stability of the tip-tilt mirror system.
Jun. 25, 2022Vol. 51 Issue 6 0601002 (2022)
Hui ZHANG, Zaikun ZHANG, Depeng KONG, and Zhengquan HE
Light is an important vehicle for observing and obtaining image information about objects and is an important way of perceiving the environment. However, in the natural environment, there are often small particles or obstacles between the observer and the observed object that prevent direct imaging of the observed object. When there is a scattering medium in the imaging optical path, photons are scattered with the scattering medium and the incident wavefront of the light is destroyed, resulting in a change in the direction of light propagation, and the photoelectric imaging system does not work properly under these conditions. To solve the problem of not being able to image the observed object clearly in the presence of the scattering medium, in this paper, statistical averaging and lensless Fourier transform digital holography are used to achieve imaging through the scattering medium. The speckle is averaged through the rotating scattering medium, and the exposure time of the camera is increased so that the time average of the scattering field replaces the collective average, thus eliminating the effect of the random phase introduced by the scattering medium on the imaging process. This method of digital holography using statistical averaging and lensless Fourier transform has the advantages of simple and compact optical path structure, fast reconstruction speed, and low cost. Compared to wavefront shaping technology, transmission matrix technology, adaptive optics technology, and other methods of imaging through scattering media, this method does not require phase correction and complex image processing, target scanning, wavefront shaping, and other complicated operations.The experiments firstly investigate the effects of ground glass rotation speed and CCD exposure time on the peak signal-to-noise ratio of reconstructed images. The experiments show that different rotation speeds require different exposure times to achieve the highest peak signal-to-noise ratio, and the faster the rotation speed, the shorter the time required to reach the highest peak signal-to-noise ratio. The highest peak signal-to-noise ratio of 21.44 dB was obtained for the four sets of data at a rotation speed of 1.5 r/min and an exposure time of 800 ms. After obtaining the optimal experimental conditions, the imaging experiment through a single scattering medium was carried out. The laser light is divided into two beams by the beam splitter, one beam of light irradiates the object for transmission or reflection and then passes through the rotating ground glass as the object light, and the other beam is reflected by the mirror. After the incident on the convex lens, the convex lens converts the light beam from a plane wave to a spherical wave emitted by a point light source, to meet the conditions of lensless Fourier transform digital holographic recording. Then the reference light and the object light interfere after being combined by the beam combiner, and finally, the interference speckle image is recorded by the CCD. The experiments show that the method can reconstruct the object information for both transmissive resolution plates and reflective dolls and coins. On this basis, to solve the problem that actual imaging scenes rarely have a scattering medium with rotation or small displacement, we extend the application scenario of the method by introducing a stationary scattering medium. Experiments are carried out by loading a random speckle image on a spatial light modulator to simulate a stationary scattering medium. The experiments show that although the imaging quality is reduced compared to that through a single rotating scattering medium, the method is still able to image the target object clearly and achieve imaging through a double scattering medium. Finally, the reconstructed image is subjected to Butterworth high-pass filtering, and the contrast of the reconstructed image is effectively improved after the filtering.
Jun. 25, 2022Vol. 51 Issue 6 0609001 (2022)

Yuan GUO, Lanlan WU, and Shiwei JING
Symmetric encryption is a classic encryption method. The algorithm is relatively mature. The encryption and decryption keys are the same key. The decryption method of the algorithm is basically the inverse operation of the encryption algorithm. Although the calculation speed is fast and the complexity is low, the encryption system is linear. Features also bring great hidden dangers to the security of the system. Classical optical encryption systems are mostly symmetrical encryption methods. The asymmetric encryption method distinguishes the encryption key and decryption key of the system, encrypts the information with the public key, and only the corresponding private key information can complete the correct decryption. This encryption method that divides the key into key pairs is not only suitable for actual key information distribution and management, but also destroys the linear characteristics of the encryption system, and the encryption system is more secure. The asymmetric cryptosystem based on Phase-truncated Fourier Transforms (PTFT) uses phase truncation to obtain the decryption key in the encryption process, breaking the linear operation of the algorithm. The separation of the encryption key and the decryption key is realized, and the security of the system has been greatly improved. Although the PTFT system hides the phase information in the encryption system by intercepting the phase and constructs an asymmetric encryption system; but under the condition of satisfying the "Kerckhoffs assumption", the deciphering of the asymmetric encryption system with phase interception only takes two steps to iterate the Fourier transform algorithm to recover the private key information of the system. The security of the encryption system is insufficient. From the cracking algorithm of the system, we can see that the complex value information of the system is divided into phase and amplitude, so that the encrypted values are all amplitude information; the cracking of the system takes advantage of this feature. In this paper, an undisclosed amplitude template is added after the first phase modulation template, and the threshold amplitude truncation method is adopted. Part of the amplitude information is used as the new private key, and the phase angle is used as the ciphertext. The conditions are broken and the security of the encryption system is enhanced. Although the security of the improved system is guaranteed, in addition to a set of ciphertext information, two sets of intercepted phase information need to be transmitted during information transmission, and the amount of information transmission is tripled. This encryption method brings huge compression to the transmission and storage of information, especially for large-capacity information transmission, the efficiency of information transmission is reduced. In order to achieve the data compression of the transmitted information, this paper proposes to combine compressed sensing with PTFT optical asymmetric encryption. The plaintext is divided into low-frequency information and high-frequency information by discrete wavelet transform. The high-frequency information is compressed by 2/3 by using compressed sensing. It is transformed into phase information of low-frequency information, and jointly constructs a complex image to be encrypted whose size is 1/4 of the original plaintext image. System security performance experiments, attack experiments and comparative experiments show that the encryption system in this paper can effectively resist various attacks, has high robustness, small transmission volume, short encryption time, good quality of decrypted image reconstruction, and excellent overall performance.
Jun. 25, 2022Vol. 51 Issue 6 0610001 (2022)
Xia WANG, Xin ZHANG, Gangcheng JIAO, Ye YANG, Hongchang CHENG, and Bo YAN
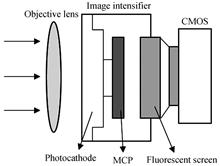
Low-light-level night vision technology is to explore the photoelectric technology that how to enhance, transmit, store, reproduce and apply the images captured under low light conditions. It is an important part of modern optoelectronic technology. ICCD/ICMOS (Intensified CCD/CMOS) is a solid low-light imaging device with a wide range of applications and the lowest working illuminance which is formed by coupling an image intensifier and CCD/CMOS. Although ICMOS can image under low-light night vision conditions, the image intensifier also amplifies the intensity of the noise while enhancing the signal, resulting in obvious random noise in the captured image, and the noise characteristics are more complex than that of traditional CMOS imaging. Due to the microchannel plates, ICMOS sensing image noise is not independent and identically distributed, but aggregated random noise with spatial correlation. Aggregated noise destroys the original structural features of the image, which also greatly increases the difficulty of denoising. In this paper, we propose a dual residual attention network for ICMOS sensing image denoising. There are three main ideas for our method. First, the network adopts the idea of residual learning, which means that the output of the network is the noise image, not the denoised image. Then the denoised image is achieved by subtracting the noise image from the original image. The residual learning network only needs to extract the noise component from the original image, which greatly reduces the difficulty of training the network. Secondly, we introduce four residual attention modules in our model, and the number of feature maps of each module is constantly decreasing. Each residual attention module consists of four residual blocks, one channel attention layer and one convolutional layer. The basic unit of the module is the residual block, which can effectively improve the network performance. At the same time, the introduction of the residual module can better solve the problems of gradient dispersion, gradient explosion and gradient degradation. Finally, the network introduces the channel attention layer, which can assign different weights to the output feature map of the middle layer, thereby analyzing the importance of each feature channel, and then enhancing the useful features and suppressing slight features according to this importance, and finally guide the network to continuously reduce the dimension of the feature map. Existing deep learning denoising methods mostly work for simulated Gauss-Poisson distributed noise and real noise data of some natural images. These methods can not be directly applied to ICMOS sensing images. Due to the particularity of ICMOS imaging noise, we made the ICMOS image dataset ourselves. We adopt the multi-frame averaging method to obtain the label image The image sequence is captured from a static scene under a certain fixed illumination in the dark room, and then one label clean image of the image sequence is synthesized by a multi-frame weighted average method. The scene illuminance is accurately measured with an illuminance meter. This dataset is mainly based on three different illuminances 2×10⁻¹、3×10⁻²、2×10⁻³ lx for image acquisition, and seven different static scenes are collected under each illuminance condition. Due to the inconsistency of noise intensity and brightness, we conduct model training for images under different illuminances. Two static scenes with 1 000 images are used as training sets under each illuminance. Our method applied the L1 loss as the loss function. From the subjective and objective results, it can be seen that our method has better denoising results and higher efficiency than other state-of-art methods.
Jun. 25, 2022Vol. 51 Issue 6 0610002 (2022)
Haixia WANG, Lubin SHAN, Qiaoling PANG, and Yilong ZHANG
Fingerprint is the most widely used category among many identity features. Conventional fingerprint capturing devices use contract-based 2D measurement. The uncontrollability of the pressing force during measurement and the residue left by the previous collection result in unsatisfactory fingerprint quality and certain security problems. The non-contact 3D fingerprint acquisition technology has attracted research attention due to its high security and abundant fingerprint information. The Fringe Projection Profiolmetry (FPP) is a widely used non-contact 3D measurement technique, based on which a 3D fingerprint acquisition system is built in this paper. Phase demodulation is a key step of FPP, where the phase shifting method is widely used. Phase shifting method achieves high accuracy for the 3D measurement of static objects. The higher number of phase shifting steps, the higher the quality of the 3D information obtained. However, in fingerprint measurement, human fingers will involuntarily shake due to heart beating and excessive fatigue, which introduces potential defects using phase shifting method. How to shorten the acquisition time while maintaining the high-precision phase extraction quality is a problem that has to be considered in this field. In recent years, with the continuous improvement of computation power and cloud resources, the application of artificial intelligence technology to realize intelligent data processing is a brand-new solution. Therefore, a convolutional neural network with wrapping-aware loss is proposed in this paper to extract the phase of a single fringe pattern. The network consists of an encoder, a residual module and a decoder to exact the wrapped phase map directly from the fringe pattern. Two factors are considered during the network establishment. Firstly, the fingerprint is relatively subtle. The variations of fingerprint details are comparably small compared with variations of finger shape in phase map. The normalization operation, which is usually used in neural network to speed up the network convergence, and the current mainstream Mean Square Error (MSE) loss function, which causes the fingerprint details to be blurred and smoothed, need to be avoided. Secondly, in the region of 2π discontinuity in the wrapped phase map, a small phase difference will cause a large error in the loss function, which will misguide the optimization process and decrease the quality of the overall fingerprint details. Therefore, during the network design, instead of normalization, this paper adds nine residual blocks between encoder and decoder to improve the network training speed. In the loss function design, this paper proposes a new wrapping-aware loss function. The loss function is a fusion of Mean Absolute Error (MAE) and sine function error. The MAE has better capability to reserve subtle details. The sine function error can effectively reduce the sharp error caused by the sudden change in the 2π discontinuity region. Furthermore, considering that most of the acquired fringe image is the background area, only the region of interest of the fingerprint is carried out to realize the loss function calculation. Experiments are carried out to test the performance of the proposed method. The four-step phase-shifting results are used as ground-truth. The proposed method is compared with the conventional Fourier Transform (FT), Windowed Fourier Transform (WFT), HU' phase extraction network and FENG' phase extraction network. Firstly, the MAEs of the phase differences are calculated. The MAEs are 0.394 7, 0.341 7, 0.165 1, 0.179 2 and 0.083 9 for the FT, WFT, HU's method, FENG's method and the proposed method, respectively. Meanwhile, the MAEs at the 2π discontinuity region are 0.396 5, 0.355 4, 0.239 6, 0.370 4 and 0.104 9 respectively. The proposed method has achieved the best performance. Secondly, since images may be distorted in the process of neural network processing, it is necessary to evaluate the similarity of the results obtained by the methods in this paper. The Structural Similarity (SSIM) and histogram similarity indicators are used for comparison. The two indicators are 0.980 7 and 0.866 1 of the proposed method respectively, which are closest to the four-step phase-shifting results than the other four comparison methods. Thirdly, in the evaluation of different loss functions, the MSE loss function, the MAE loss function and the fused loss function are compared. They achieve MAEs of 0.157 8, 0.084 7, and 0.839, respectively of the whole fingerprint and 0.206 1, 0.120 9 and 0.104 9 at the 2π discontinuity region. The results also show that the loss function proposed in this paper can effectively improve the quality of the network prediction, and is suitable for images with subtle features such as fingerprints. In the last, the fingerprints estimated with the proposed method, HU's method, FENG's method and the four-step phase shifting method are visualized and demonstrated. It can be seen from the figures that the fingerprint using the proposed method performs better compared with HU's method and FENG's method. Clear ridges and valleys are observed. In summary, the convolutional neural network constructed in this paper and the proposed wrapping-aware loss function achieve a high phase extraction accuracy and retain fingerprint details.
Jun. 25, 2022Vol. 51 Issue 6 0610003 (2022)

Kang NI, Yuqing ZHAO, and Zhi CHEN
Remote sensing image scene classification is one of the important research contents of remote sensing image interpretation. Nowadays, with the rapid development of satellite imaging techniques, remote sensing scene classification which uses High Spatial Resolution (HSR) remote sensing images has received, considerable attention recently, as can be used in natural hazards detection, traffic control, and object detection etc. Based on the feature representation used for remote sensing scene classification, the existing scene classification approaches can be categorized into three classes: handcrafted feature based methods, unsupervised feature learning-based methods, and deep feature learning-based methods. Convolutional Neural Networks (CNNs), one of the deep feature learning-based methods, have achieved great success in the computer vision community. Especially, the powerful feature representations learned through CNNs have been widely used in remote sensing scene classification, but due to the different scale information of ground targets and the complex spatial distribution and texture information of the scene images, the classification effect of the scene classification algorithm based on CNN is insufficient good. For addressing the above problems, the paper proposes a multi-scale convolutional neural network driven by a sparse second-order attention mechanism (MCNN-SSAM) while comprehensively considering the accuracy of scene classification and feature dimensions. The proposed MCNN-SSAM network includes the following parts: backbone network, pyramid convolution module, sparse second-order attention module and softmax classification layer. The network firstly inserts a multi-scale convolution layer after the backbone network to acquire the characteristic expressions of different scale information targets of the ground target, and embeds the group convolution into the multi-scale convolution layer to reduce the computational complexity; Secondly, after discuss the advantage of the attention mechanism of first and second-order statistics, a sparse second order attention mechanism is proposed to enhance the discriminability of channel information of different scale convolution features. The sparsity of the attention mechanism is able to effectively reduce the feature dimension of the second-order statistics while ensuring the performance of scene classification; Finally, the multi-scale convolutional layer and the sparse second-order attention mechanism are embedded into the proposed network for end-to-end training. We conduct extensive experiments on two challenging high-resolution remote sensing data sets, i.e., AID (Aerial Image Dataset) and NWPU45 (NWPU-RESISC45) datasets. The AID dataset contains 10 000 images in RGB space, which has 30 different scene classes and of size 600×600 in each class; There are 31 500 optical RS images for 45 scene classes, and each image measures 256×256 pixels on the NWPU45 dataset. In this paper, the VGG-16 network is selected as the backbone of MCNN-SSAM, and the Adam optimizer is used for end-to-end training. The training parameters of the proposed network are set as follows: initial learning rate 0.001, weight attenuation coefficient 0.001, batch size 32, momentum 0.9. All experiments are implemented in PyTorch, NVIDIA GeForce GTX 8G 1070 Ti GPU, and 32.00 GB RAM. we make the experimental result on AID dataset to analyze the influence of some important parameters on the MCNN-SSAM, then we can conclude that the number of the atoms in the dictionary and low-rank matrix parameters have a greater impact on the remote sensing scene classification performance of the proposed MCNN-SSAM. Afterwards, we compare MCNN-SSAM with some related networks, i.e., AlexNet, VGG-16, SAFF, MSCP, and CapsNet. The experimental results show that: compared with the benchmark network (VGG-16), the overall accuracy (OA) of MCNN-SSAM is improved by 5.27%~5.34% and 10.20%~10.82%; While compared with the SAFF, MSCP, and CapsNet networks, the remote sensing scene classification accuracy is improved by 0.23%~1.61% and 1.34%~2.75%. Additionally, based on the confusion matrix, we can observe that most of the remote sensing scene classes can be classified easily and correctly, some even achieving high classification accuracies, i.e., mountains and viaducts in the AID dataset, jungles and sea ice in the NWPU45 dataset. Meanwhile, the effectiveness of the Sparse Second-order Attention Mechanism (SSAM) is verified by comparing with other related attention mechanisms and heat map results. Finally, we make the ablation generalization experiments to verify the effectiveness of MCNN-SSAM, such as SENet (Squeeze-and-Excitation Networks), CovNet which is based on covariance statistics, and SSAM. We can conclude that, whether the CNN features or multi-scale MCNN features, compared with the attention mechanism based on first-order feature statistics (CNN+SENet and MCNN+SENet), The scene classification accuracy obtained by CNN+CovNet, CNN+SSAM, MCNN+CovNet, and MCNN+SSAM which are based on the attention mechanism of second-order feature statistics has been further improved. In addition, MCNN module, SSAM module, and the fusion of these two modules can improve the classification accuracy of remote sensing image scene images. In this paper, we propose a multi-scale convolutional neural network driven by sparse second-order attention mechanism for remote sensing scene classification. The experiment results illustrate that the proposed MCNN-SSAM improves the accuracy of remote sensing image scene classification while taking into the feature dimensions of the second order feature statistics.
Jun. 25, 2022Vol. 51 Issue 6 0610004 (2022)
Ming LI, Fan LIU, and Jingzhi LI
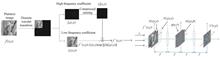
Panchromatic and multispectral images can be captured by Earth observation satellites. Usually, panchromatic images have high spatial resolution and low spectral resolution, while multispectral images have low spatial resolution and high spectral resolution. For combining the spatial and spectral information of panchromatic and multispectral images, remote sensing image fusion techniques are applied and born. Although significant progress has been made in fusion algorithms, there are still problems of spectral distortion and insufficient details. To solve the above problems, this paper proposes to design a new remote sensing image fusion algorithm with convolutional auto-encoders, attention mechanism and filter as the detail processing module and additive injection fusion rule as the fusion module. Convolutional auto-encoders learns the nonlinear mapping relationship between the low-resolution image and the high-resolution image, and the high-resolution image corresponding to the low-resolution image can be obtained after the training is completed. The introduction of attention Mechanism in the convolutional auto-encoders can improve the sensitivity of the network to information and increase the channel importance of image information. The filter plays two roles in this paper, one is to obtain the high or low frequency information of the image through the filter, and the other is to obtain the low-resolution image corresponding to the high-resolution image. The specific steps are described below. First, high-frequency images of low-resolution images and high-frequency images of high-resolution images for model training are acquired separately using Gaussian filters, while high-frequency images of low-resolution multispectral image for model prediction are acquired; then, the non-linear mapping relationship between the high-frequency image of low-resolution image and the high-frequency image of high-resolution image is learned by using convolutional auto-encoders; finally, the missing detail information of the multispectral image, i.e., the high-frequency image of high-resolution multispectral, is obtained using the convolutional auto-encoders completed by training, and fused with the original image to generate the high-resolution multispectral image. For the filter selection, experiments are conducted based on the mean filter, Laplace filter, Gaussian filter and morphological filter in this paper, and the results show that using the Gaussian filter has a better fusion effect. At the same time, experiments were conducted on the selection of the number of iterations of the network model. In this paper, the objective metrics of fused images with the different number of iterations are recorded. Since the objective indicators are floating in nature, a fitting function is used to fit the data to the objective indicators. The influence of the number of iterations on the fusion results is found by observing the trend of the fitting curve. The fitting curves show that the fusion algorithm proposed in this paper obtains the best fused image at about 1 600 iterations. This paper combines the respective advantages of Convolutional Auto-Encoders, attention mechanism and filter to perform experiments on two datasets, which are images taken by QuickBird and SPOT satellites, respectively. The resolution of the datasets is 512×512 for multispectral and 512×512 for panchromatic images. To expand the training dataset, the datasets are cropped to 8×8 size images by using a sliding window. In training the model training batch size is 256, the number of training iterations is 1 600, and the optimizer Adadelta is used for network model parameter optimization and learning rate adaptive optimization. To demonstrate the effectiveness of the algorithm proposed in this paper, it is compared with the classical fusion algorithm. Since this paper uses the additive injection of fusion rules, IHS and BDSD additive fusion algorithms are selected for comparison. PNN and GAN are typical deep learning fusion algorithms and are compared with classical deep learning fusion algorithms to demonstrate the effectiveness of the proposed fusion algorithm. The comparison with the CAE fusion algorithm can effectively prove the effectiveness of the attention mechanism and filter introduced in this paper, which can significantly improve the fused image effect. Di-PNN fusion algorithm and SR-D fusion algorithm are both detail injection fusion algorithms based on deep learning networks, and the comparison with Di-PNN and SR-D fusion can illustrate the effectiveness of the network structure in this paper. In this paper, the results of different fusion algorithms are compared in terms of subjective visual and objective metrics. The objective metrics are CC, UIQI, ERGAS, RASE, AG and SAM, where the UIQI and AG metrics describe the detail information of the image, and the ERGAS, RASE, SAM and CC metrics describe the spectral information of the image. the larger the CC, UIQI and AG metrics, the better the image quality; the smaller the ERGAS, RASE and SAM metrics, the better the image quality. By comparing with the classical fusion algorithm and using subjective visual and objective metrics, the experimental results show that the fused images in this paper retain more spectral information and detail information and show good performance both subjectively and objectively.
Jun. 25, 2022Vol. 51 Issue 6 0610005 (2022)
Shuai HAO, Shan GAO, Xu MA, Beiyi AN, Tian HE, Hu WEN, and Feng WANG
The detection system based on infrared thermal imaging has been extensively used in pedestrian detection because of its strong anti-interference ability, long detection distance and less affected by light and climate change. However, due to its unique thermal radiation imaging, infrared images usually have the defects of unclear texture features and low spatial resolution. At the same time, infrared pedestrian features are easy to be submerged by the bright background, which makes the detection algorithm difficult to locate the object region accurately. In addition, the multi-scale characteristics and mutual occlusion of pedestrian objects also pose a serious challenge to the performance of the detection algorithm. Therefore, aiming at the problem that traditional pedestrian detection algorithms are difficult to detect accurately owing to multi-scale, partial occlusion and environmental interference in infrared pedestrian images, an infrared pedestrian detection algorithm based on cross-scale feature aggregation and hierarchical attention mapping is proposed. Firstly, the CSPdarknet53 structure is utilized as the backbone feature extraction network. On this basis, to reduce the loss of small-scale object feature information during the down-sampling process in the backbone network, the focus module is introduced and added at the input to replace the first residual layer. Using slice segmentation sampling, the spatial dimension information in the original image is extracted to the channel dimension to realize lossless down-sampling. Secondly, to improve the multi-scale feature aggregation ability of the detection network and improve detection accuracy of the network, a cross-scale feature aggregation module is constructed to integrate the global features and multi-scale local features output by different residual layers of the backbone network. Then, aiming at the problem that infrared images are vulnerable to the effects of self-imaging mechanism and complex background and cannot effectively express pedestrian object features, a hierarchical attention mapping module is constructed by embedding visual attention mechanism into multi-layer feature transfer branches of feature pyramid. In the constructed detection network, the attention mechanisms based on the location, appearance and semantic features of pedestrian objects are established respectively. It establishes semantic and localization associations with spatial and channel dimensions and adaptively adjusts weight coefficients of regions of interest at different scales. The detector can quickly focus on pedestrian objects in the feature extraction process and effectively improve pedestrian detection performance in a complex environment. The ablation experiment proves that the proposed cross-scale feature aggregation module can effectively fuse the features of different scales and improve the pedestrian object detection performance in multi-scale and partially occlusion regions. The constructed hierarchical attention mapping module can enhance the salience of pedestrian objects in the complex background and solve the missed and false detection caused by the lack of feature expressive ability of pedestrian objects in the complex environment. Finally, in order to verify the effectiveness of the proposed algorithm, three infrared pedestrian detection datasets were selected from the OTCBVS common benchmark database for testing. The selected test set covers a variety of complex detection environments, including multi-scale pedestrian objects, highlighted pseudo-objects, fuzzy scenes, etc. The selected experimental scene covers the real pedestrian detection scene well, which can well demonstrate the detection effect of the algorithm in the real scene. In order to verify the advantages of the proposed algorithm, four mainstream object detection algorithms are selected and compared with the proposed algorithm from subjective evaluation and objective evaluation indexes respectively. Experimental results demonstrate that the proposed algorithm has obvious advantages over the contrast algorithm in both subjective and objective evaluation. A large number of experimental results also show that the algorithm can achieve accurate detection of infrared multi-scale pedestrians in a complex environment, with an average accuracy of 95.37% and recall rate of 92.99%.
Jun. 25, 2022Vol. 51 Issue 6 0610006 (2022)
Chang TAN, Shiyong WANG, Sili GAO, Li CHEN, Weilin CHEN, and Liya QIU
As an important auxiliary means to improve polarization detection technology, infrared polarization simulation technology can provide a theoretical basis and reference for the design of infrared polarization detectors. For imaging simulation, the most accurate method is to use the ray tracing method and the idea of global illumination to simulate all the energy interaction between all rays and the surface. However, for polarization imaging simulation, based on the original massive calculation, there is more polarization state transmission process, which is disastrous for most projects.To solve the problems of complicated calculation of traditional polarization bidirectional reflection distribution function and poor real-time rendering, based on the microplane theory, a faster polarization bidirectional reflection distribution function model is proposed, and the imaging simulation of the whole link is completed. In this research, a semi-empirical model is used to simulate the shadowing and shading effects of radiant energy on rough surfaces using mathematical modeling. It avoids building a 3D model at the micro-facet scale, greatly reducing the workload of creating the sea surface and subsequent rendering. The sea surface is generated according to the P-M wave spectrum, and the Cox-Munk model is used to calculate the slope variance σ2 of the sea surface, which is abstracted as the material properties of the sea surface, which reduces the complex calculation process and still conforms to the objective physical laws. A three-dimensional data storage structure suitable for polarization simulation is designed. For infrared polarization simulation, the illumination and color data of the model are not required, but for different material modules, material properties such as complex refractive index and roughness need to be added. Therefore, the vertices and surfels in the original ASE file are re-divided into modules according to the ship parts and materials where the surfels are located, and the vertices and surfels in each module are regrouped and numbered. The effective radiation received by the detector is discussed and the radiation control equation is established. For the specific scene of sea surface detection, the effective radiation that the detector is capable of receiving is analyzed, and a relatively complete radiation control equation is established. The created simulation model is more realistic. For infrared detection, the spontaneous radiation of the target and the sea surface is also a non-negligible part of the energy received by the detector. According to Kirchhoff's law, the spontaneous radiation polarization model of the sea surface and the ship target is established. It is assumed that the average orientation of micro-surface elements is represented by the intermediate vector between the macro-surface element normal and the detection direction, the traditional PG polarization bidirectional reflection distribution function model is improved, and a polarization bidirectional reflection distribution function model that is more suitable for computer real-time rendering is proposed, which balances the Authenticity and real-time requirements of simulation. The directional hemispherical polarization reflectivity and emissivity models of the sea surface and ships are established. Finally, the detector is modeled, and the radiance and polarization state of each surface element is calculated at the same time. The focal length, aperture, responsivity, and other parameters of the detector are used to establish a preliminary detector model, carry out reasonable grayscale mapping, generate S0, S1, and S2 images, and calculate the polarization degree map to complete the simulation work of the whole link. The images of ships on the real water surface under similar conditions were collected and compared with the simulated images, and the gray-scale distributions of the polarization images were similar. The time-consuming results of imaging simulation of sea surface targets respectively show that compared with the traditional model, the simulation model improves the speed of imaging simulation under the premise of ensuring the correctness of the model.The simulation results provide theoretical support and data basis for target recognition of ships on the sea surface, wind speed inversion of sea surface remote sensing images, and feasibility demonstration before actual detection.
Jun. 25, 2022Vol. 51 Issue 6 0611001 (2022)
Jupu YANG, Jialin DU, Fanxing LI, Qingrong CHEN, Simo WANG, and Wei YAN
Digital lithography based on digital micromirror array devices is one of the methods for the production of micro and nano structures, with the advantages of low cost and high flexibility, and has great advantages in micro and nano processing. As the demand for higher resolution of micro and nano structures increases, the wavelengths of lithography systems are getting shorter and the numerical apertures are getting larger, which leads to shorter and shorter exposure depths of focus. To ensure the quality of lithography patterns, the substrate must be within the depth of focus, so fast and high precision inspection of the focal plane becomes the key to the production of high resolution micro and nano structures. Most of the traditional methods require a separate design of the focus detection system, which will not only increase the complexity of the whole system structure but also increase the difficulty of mounting. With the growing development of image processing technology, focusing methods do not require complex optical path adjustment and can achieve focal plane detection based on out-of-focus images only, and the methods have been applied to many fields. Inspired by this, this paper proposes a deep learning based focus detection method, by adjusting the optical path of digital lithography so that the exposure focal plane and the camera imaging focal plane coincide, at this time the image captured by the CCD is the exposure pattern on the exposure focal plane, the blurred degree of the image directly reflects the out-of-focus degree of the exposure pattern, so the focal plane can be quickly and automatically detected using the algorithm only based on the currently formed image. The focus detection algorithm proposed in this study consists of two steps, firstly a coarse focus detection of the substrate at a large out-of-focus distance to reduce the out-of-focus range of the substrate, and then a further improvement of the focus detection accuracy at a small out-of-focus distance. According to the characteristics of these two focusing steps, a deep learning model is used for detection in the coarse focusing and a conventional sharpness evaluation function combined with a search algorithm is used for detection in the precise focusing. Different out-of-focus ranges are firstly classified according to the out-of-focus distance, and corresponding training and test datasets are produced. The trained network can achieve 88.7% accuracy on the test set, and it only takes 90 ms to determine the current out-of-focus range of the substrate, and then move the displacement table to move the substrate to the focal plane. Compared to conventional methods, this avoids the need for a round trip movement of the displacement stage, thus reducing the impact of return errors on focus detection accuracy. The evaluation performance and evaluation speed of different sharpness evaluation functions were also compared using out-of-focus image data. The Laplacian function is chosen as the image sharpness evaluation function for precision focus detection. Using this function, the sharpness value of an image can be calculated in only 5 ms and combined with the search algorithm to find the position with the highest sharpness value near the focal plane, the focal plane can be found accurately in 7 steps on the basis of coarse focus detection. Simulation and experimental validation results show that although the method has a certain chance of error in the coarse focusing stage, the misjudged out-of-focus range is small and can be corrected by the search algorithm in the precise focusing stage to find the true focal plane. In the end, the method can be used with a 5× focusing objective and the focusing accuracy can reach 2 μm in the out-of-focus range of (-40 μm, 40 μm) with a total time of less than 300 ms. In summary, the method has the advantages of low structural complexity, fast focusing speed, and high focusing accuracy, can be well applied in the field of digital lithography.
Jun. 25, 2022Vol. 51 Issue 6 0611002 (2022)
Shuai REN, Wei ZHUANG, Mingli DONG, Yongqian WANG, Guang YAN, and Yue WU
Tunable laser has been widely introduced in the field of optical fiber sensing as core component for spectrum analysis, wavelength division multiplexing and grating demodulation in recent years. There is a new type called Modulated Grating Y-branch (MG-Y) laser, and the characteristics of small size, wide tunable range and fast wavelength switching made it extremely popular in the field of optical fiber sensor demodulation. The primary key technology for MG-Y laser that needs to be solved in the application of fiber sensing is to control multiple input currents at the same time and build a stable, accurate and continuous wavelength Look Up Table (LUT). However, the wavelength tuning characteristics of MG-Y lasers are complex, the traditional methods are inefficient, the tuning wavelength can not meet the resolution requirements, and it is difficult to ensure the accuracy and stability of the output wavelength, which in turn affects the demodulation fiber sensing accuracy. Therefore, it is particularly necessary to find a new method for quasi-continuously tuned LUT construction.Aiming at the problem that it is difficult to achieve a stable quasi-continuous tuning of a specific wavelength for modulated grating Y-branch lasers, we proposed a method of constructing a wavelength look up table for MG-Y lasers. The method based on the KNN model, which is a simple classification algorithm. It can convert multi-class problems into multiple two-class problems for discussion, and calculate the accuracy rate, recall rate, and F1-score. The construction process of LUT is mainly divided into 4 parts: obtain the initial scan data, identify the ILR and IRR quasi-continuous tuning range, identify the linear tuning range of each segment of IPH, interpolation retrieval of target wavelength in a single path, generate LUT of MG-Y laser. This method has achieved rapid classification of the wavelength quasi-continuous tuning region. It used toolkit of sklearn machine learning. Its input is the wavelength parameter-control of L1, output wavelength, which are converted into training set and test set according to 7∶3. And the data set of L2 was used as verification set. Its output is the prediction category of each test sample. This method used euclidean distance to reflect the similarity of two example points, and the optimal K value is obtained by cross verification. At the same time, the relationship between F1 value and K value is selected for experimental verification. The results show that when K=5, the classification result is better. Calculation time of the entire algorithm on the CPU is only 10 s, which has greatly reduced hours with an accuracy rate of 77%. According to the model prediction result, its maximum wavelength interval obtained is 50 pm. This method can meet the needs of engineering applications and generated a smooth, which made the best of phase tuning characteristics of MG-Y laser and adopted Newton interpolation to fine-tune the wavelength.To verify the application value of the method proposed in this paper, the following experiments are carried out in turn. Firstly, to verify the accuracy and stability of MG-Y laser, we built a laser LUT experimental system, and continuously scanned the LUT which based on our method 20 times. According to LUT, the laser drive current is controlled to output a specific wavelength of light. The experimental system used Xilinx XC7Z020 as the main control unit, and used a multi-wavelength meter (AQ6151, with an accuracy of 0.3 pm, its sampling frequency is 1 Hz) to acquisition output wavelength. The experimental results show that its accuracy is about 2 pm, and the stability is 0.7 pm. Secondly, to verify the effectiveness of the constructed LUT, we built the F-P etalon wavelength demodulation experiment system. We placed a F-P etalon in the high and low temperature test chamber (GDW-100), the temperature was kept at 25 ℃. The sampling frequency of demodulation system is 250 Hz. The experimental results show that the F-P etalon demodulation wavelength stability is 1.73 pm. Finally, to verify the effectiveness of LUT in practical engineering applications, we built an FBG wavelength demodulation experimental system, which based on the detection requirements of the three-way load of a certain type of aircraft landing gear. Under impact conditions, the FBG sensor network was used to obtain the strain response of the landing gear structure, and the MG-Y laser-based demodulation system was used to collect and demodulate the FBG strain spectrum information. Its single sampling time is 5 s, and its sampling frequency is 250 Hz. By analyzing the data collected for 6 consecutive days, we come to the conclusion that the FBG demodulation wavelength stability is 1.75 pm, and the FBG demodulation wavelength correlation coefficient R is greater than 0.952 5. The experimental results proved that this method can control the MG-Y laser to achieve stable wavelength quasi-continuous tuning. In summary, the fiber grating demodulation system, which used this method, can realize stable F-P etalon and FBG spectrum acquisition and wavelength demodulation. This method has good practical application value.
Jun. 25, 2022Vol. 51 Issue 6 0614001 (2022)
Na LIU, Li FAN, Guangqiong XIA, and Zhengmao WU
Microwave Frequency Comb (MFC) has the unique advantage of simultaneously providing multiple continuous microwave signals and then plays an important role in some application fields such as satellite communication, remote sensing, distance measurement, and anti-interference detection. At present, sustained efforts have been paid to explore novel techniques to generate the MFCs signal with adjustable comb distance, pure comb line, power balance and broad bandwidth. In this work, a system scheme for generating broadband tunable MFC based on a modulated optical injection Semiconductor Laser (SL) is proposed and experimentally investigated. First, via a distributed feedback semiconductor laser (DFB-SL1) strongly modulated by a single-tone electrical signal, a seed Optical Frequency Comb (OFC) including a few comb lines can be obtained. Next, the seed OFC is sent into a phase modulator driven by the same single-tone electrical signal as that loaded on the DFB-SL1, thus a promoted OFC with more comb lines can be obtained. Finally, the promoted OFC is injected into another DFB-SL (DFB-SL2), except the regenerated injection OFC, another sub-OFC can be observed located nearby the red-shifted central wavelength of DFB-SL2. In this case, the whole OFC can be regarded as a combination of two sub-OFCs, and then a broadband MFC can be obtained through converting the output of DFB-SL2 into electrical signal by a photo-detector. The experimental results show that, by utilizing a single-tone electrical signal with a frequency of 2.9 GHz, under optimized injection power and frequency detuning between two DFB-SLs, an MFC with 55.1 GHz bandwidth within a ±5 dB amplitude variation can be obtained, where the phase noise of each comb line is maintained below -98.66 dBc/Hz at 10 kHz frequency offset. Through varying the frequency of the single-tone electrical signal and selecting matched operating parameters, the comb spacing of generated broadband MFC can be tuned. Also, the variations of optimized MFC bandwidth with the frequency detuning Δf and injection power Pinjare analyzed. For -9.0 GHz≤Δf ≤3.6 GHz, there is only one comb line within a ±5 dB amplitude variation calculated from DC, and the MFC bandwidth maintains at 2.9 GHz. For 4.8 GHz ≤ Δf ≤ 37.4 GHz, with the increase of Δf, the minimum comb line interval between two sub-OFCs is periodically varied within [0, fmod], and meanwhile the intensity of each comb is also varied. Therefore, the bandwidth of generated MFC behaves a complex varied trend. The maximum bandwidth is about 55.1 GHz obtained under Δf=37.4 GHz. For Δf >37.4 GHz, the bandwidth of the generated MFC is relatively small due to too far apart between two sub-OFCs. Considering the red-shift induced by the optical injection, the beat frequency is not located at the frequency detuning between the two DFB-SLs. Besides frequency detuning Δf, injection power Pinjis another key parameter. With the increase of the injection power, the red-shift is more severe, and higher frequency comb lines will be enhanced, which leads to the variation of the distribution of MFCs. For a fixed Δf=37.4 GHz, with the increase of Pinj, the MFC bandwidth first increases, after reaches its maximum value of 55.1 GHz, and then decreases.
Jun. 25, 2022Vol. 51 Issue 6 0614002 (2022)
Zhongzheng LIU, HaiJun CHEN, Jun CAI, and Jinjun FENG
Improving the stability of laser frequency by reducing frequency fluctuation can enhance the performance of the optically pumped Cs beam frequency standard. It has developed various methods to stabilize the laser frequency, such as the Saturated Absorption Spectroscopy (SAS), Polarization Spectroscopy (PS), Dichroic Atomic-Vapor Laser Lock (DAVLL), Frequency Modulation (FM) spectroscopy, Doppler-free bichromatic spectroscopy. These methods above are mostly based on the thermal vapor cell in a system which is kind of complicated and facing the problems of the temperature of vapor, the light power and the magnetic field, which caused the unstable frequency of laser. For compact optically pumped Cs beam frequency standard, reliability is an important thing that need to be considered, which is probably easier to realize through a simple structure. Therefore, the method of laser frequency stabilization by laser-induced (one-peak) fluorescence spectroscopy is developed. This method has enhanced the system reliability, but introduce a problem of linewidth broadening, which caused by divergent atomic beam.In this paper, we propose a method to stabilize the 852 nm laser frequency by fluorescence spectroscopy with two peaks, which have a simple and reliable structure, and can reduce the Doppler effect caused by divergent atomic beam. The fluorescence spectroscopy with two peaks is induced by two laser beams and atomic beam at oblique incidence. The two laser beams propagate contrarily and coincide exactly with each other. After fluorescence collection and photoelectric conversion, the two-peak fluorescence spectroscopy is formed. By changing the oblique angle θ,the half-width of the central peak of the two-peak fluorescence spectroscopy can be tuned, and we get 16.3 MHz, 18.7 MHz, 21.7 MHz, 24.4 MHz and 26.9 MHz at the different oblique incidence angles separately, which is narrower than the linewidth of one-peak fluorescence spectroscopy whose measured linewidth is about 42.5 MHz. By using the two-peak fluorescence spectroscopy to stabilize the laser, the locking point will be located at the center of the atomic transition when the power of two laser beams is the same and the two laser beams coincide with each other, which is easy to realize. But this method has a drawback of deterioration of the signal-to-noise ratio when the oblique angle θ decreases and tend to zero. When the laser frequency is stabilized by the central peak of a two-peak fluorescence signal with a half-width of about 24.4 MHz, the frequency fluctuation is suppressed to 70 kHz peak-peak and the estimated frequency stability is about 2.7×10⁻¹¹ at 1 s, 1.2×10⁻¹¹ at 10 s, 4.0×10⁻¹² at 100 s, 1.4×10⁻¹² at 1 000 s. In order to compare the performance between the two-peak and one-peak fluorescence spectroscopies, we keep the amplitude of dispersive signals roughly same and the other parameters invariable. And we obtain the error signal by one-peak fluorescence signal with the Allan deviation σy(τ) is about 3.9×10⁻¹¹ at 1 s, 1.4×10⁻¹¹ at 10 s, 4.7×10⁻¹² at 100 s, 3.4×10⁻¹² at 1 000 s . The results show that the method of laser frequency stabilization by two-peak fluorescence spectroscopy is better. This method would help improving the performance and reliability of the compact optically pumped Cs beam frequency standard.For the generation of two-peak fluorescence spectroscopy, further work can be done to simplify the arrangement of the experiment. The laser beam spreads straightly through the optical windows and returns along its original path after reflecting by a mirror. The two-peak fluorescence spectroscopy can also be obtained but exist left-right asymmetry, which will cause the locking point to be shifted from the center of transition. But this character is suitable for laser cooling, because of the frequency locking point can be easily tuned by changing the propagation direction of the Cs atomic beam.
Jun. 25, 2022Vol. 51 Issue 6 0614003 (2022)
Lanpeng GUO, Jianning LIU, Jun WENG, Chao WANG, Yushu ZHANG, Qin XIE, and Yunli PENG
The precision anomalies in variable-temperature experiments are accounted for more than two thirds of the faults in the total reflection prism laser gyro. Because of the prism machining error, the assembling error, the pyramidal error of the cavity and the improper adjustment, the actual optical path in ring laser may deviate from the ideal path in the meridian and sagittal planes, the high-order transverse modes and the fundamental mode are mixed and oscillated simultaneously, it will lead to the precision of the gyro falls or even the faults. In this paper, based on the laser mode theory and the operation characteristics of the ring laser, combined with the movement rules of the optical path in the prism ring resonator under the temperature variation conditions, the mechanism of the fault gyro interference spots distortion in the variable-temperature experiment is investigated. Theoretically, according to the optical characteristics of the prism ring resonator, considering the multiple high-order transverse modes mixture, the physical model of the two-beam interference is established. The numerical simulation shows that the energy distribution of the fundamental mode interference field is uniform, and the dark stripes are equally spaced, which is suitable for the signal source for the interferometry. The edge of the TEM11 mode interference field is clear, but the contrast in the middle of the interference field is weak, which is not conducive to signal detection. The energy of the interference field of the TEM22 mode is dispersive. The parts of the interference field are distorted, which caused the gyro to fall in the variable-temperature experiment.In the experiments, the cat’s eye laser is used to realize the independent oscillation of the high-order transverse modes. On this basis, the two-beam interference device is used to form a ring cavity. The interference spots of the high-order transverse modes are obtained at the 2o interference angle. The theoretical analysis is verified by the experiments. In the precision experiments of the laser gyro under the variable-temperature conditions, the laser gyro is placed in a heating block. The temperature is changing from 25℃ to 70℃ at the rate of 1℃/min. The interference spot is led out from the heating block by the fiber that is connected with the self-focusing lens. The variable experimental results show that the interference spot of the fault gyro is distorted discontinuously. The precision of the gyro is intermittent normal and repeated abnormal. On this basis, combined with the variational characteristics of the optical path in the prisms ring cavity under the variable-temperature: the optical path is diffused outward at the high temperature and shrinked inward at the low temperature, the causes of the gyro failure are analyzed. For stable limiting the high-order transverse modes oscillation, the external aperture is assembled around the clear aperture. For example, when the optical path has inclined slight displacement in the sagittal plane because of the temperature variation, it can be solved by replacing the single external aperture to the oblique 45° bilateral external aperture. The variable-temperature fault of laser gyro is effectively solved by the above repairing methods.In the conclusion, the precision anomalies of the total reflection prisms laser gyro in variable-temperature experiments are caused by the multiple high-order transverse modes oscillating simultaneously. The reason of the gyro failure is that the modes limited structure cannot keep the fundamental mode oscillating individually after the optical path is changed. The multiple transverse modes are oscillated simultaneously, the boundary of the interference spot is fuzzy, and the interference dark stripes are not suitable for being detected. This phenomenon seriously affects the operation of the laser gyro. The pertinence assembling using an external aperture can solve this kind of fault effectively.
Jun. 25, 2022Vol. 51 Issue 6 0614004 (2022)
Chenhui WANG, Junhu CAI, Xinpei HU, Enguo CHEN, Sheng XU, Yun YE, and Tailiang GUO
All-inorganic perovskite quantum dots have attracted much attention because of their outstanding photoelectric properties. However, the instability of PQDs to the environment has become a potential threat that restricts its practical application. At present, a large number of scientific studies have been devoted to improving the stability of PQDs. However, most of the current stability improvement schemes are to encapsulate PQDs in hydrophobic materials to provide a physical barrier against environmental changes, while the defects and unstable performance of materials themselves have not been effectively improved. It is therefore of great significance to study the corresponding performance and stability improvement schemes from the PQDs material itself.Ion exchange resin is a kind of polymer compound with a functional group, a network structure and insolubility. As for anion exchange resin, its active group can adsorb different types of anions to achieve ion exchange reaction, while PQDs is a kind of ionic compound containing halogen anions, and the two have a good binding ability. In this study, the performance and stability of CsPbBr3 PQDs were improved simultaneously by introducing defect passivation and selective removal of ion exchange resin. The product PQDs prepared by high temperature thermal injection method was named as the original sample, and the sample treated with Br type anion exchange resin was named as the modified sample. From direct observation of their appearance, the original sample is yellow-brown, while the modified sample after ion exchange resin treatment is transparent green. The resean is the large number of micropores in the ion exchange resin, which has strong an adsorption capacity comparable to activated carbon, and can selectively adsorb and remove organic impurities. TEM images show that the original sample has poor surface morphology. In contrast, the modified samples treated with ion-exchange resin show clear cubic phase with almost no surface damage or structural distortion. It is worth mentioning that continuous UV excitation and high temperature environment will lead to partial crystal phase separation of PQDs, and the surface ligand will fall off, resulting in grain agglomeration and decreased fluorescence intensity. The luminescence intensity of the original sample and the modified sample decreases to 80.6% and 85.7% respectively after 3 h of UV excitation, and to 75.2% and 99.6% respectively after 2 hours of 70℃ heating. Obviously, the fluorescence intensity attenuation of the modified sample is relatively less, showing more excellent stability. It is worth noting that after high temperature heating, the fluorescence intensity of the modified sample almost does not decay, showing excellent thermal stability. Compared with the original sample, the modified sample also had a longer average fluorescence lifetime. The third-order exponential decay model was used to fit the fluorescence lifetime curve, and the results show that the average fluorescence lifetime of the original sample and the modified sample was 10.4 ns and 22.2 ns, respectively. The defects in the crystal will act as the center of non-radiation recombination to inhibit the radiation recombination process, and the increase of the final average fluorescence life indicates that the radiation recombination is enhanced, which also reflects the reduction of defect states from the side. The improvement of average fluorescence lifetime indicates that the excess halogen anions released by anion exchange resin contribute largely to the passivation of surface defects and the improvement of optical properties of PQDs. The PLQY of the original sample and the modified sample were 53.23% and 90.00%, respectively. Such a large increase in PLQY is not only due to the direct band gap characteristics of the material itself, which can improve the light absorption coefficient and speed up the radiation recombination rate, but also due to the passivation of excessive halogen anions on the surface defects of quantum dots, thus reducing a large number of non-radiation recombination paths.In summary, the introduction of ion exchange resin can selectively remove PQDs single crystals with poor morphology and unstable structure without changing the inherent crystal phase of PQDs, which makes the surface morphology and uniformity of the prepared PQDs greatly improved. And the stability of PQDs has also been greatly improved under long-term ultraviolet light and high temperature experiments. Moreover, before and after modification, the photoluminescence quantum yield and fluorescence lifetime of CsPbBr3 PQDs were significantly increased from 53.23% to 90.00% and from 10.4 ns to 22.2 ns, respectively. This research provides a new idea for improving the performance and stability of PQDs. Due to the reproducible and low-cost characteristics of ion exchange resins, it has broad application prospects in the field of optoelectronics.
Jun. 25, 2022Vol. 51 Issue 6 0616001 (2022)
Yue HU, Ran ZENG, Siyuan XU, Weiqiang CHEN, Haozhen LI, Shuna YANG, Qiliang LI, and Yaping YANG
The van der Waals–Casimir and Casimir-Polder effects of microscopic particles have been the subject of intensive research in recent years. The zero-point energy quantum fluctuations of the electromagnetic field cause the van der Waals forces; the change of the boundary surface leads to the disturbance of the zero-point energy of the electromagnetic field, and the Casimir force acting on the object can be observed macroscopically. For anisotropic media, the Casimir force may change with the relative direction between the media, and this change leads to the relative rotation, which is called the Casimir torque. The current research on the Casimir effect has involved a variety of anisotropic materials, such as birefringent materials, metamaterials, and anisotropic topological insulators, and the experimental setup for measuring the torque has also been proposed. The Casimir-Polder effect of the two-level atomic system has aroused great interest within the study of quantum optics in recent years. In the presence of boundary of material, the atoms in the ground state or excited state can be affected by the Casimir-Polder potential, and then the Casimir-Polder interaction force emerge, which are also induced by the electromagnetic field of the vacuum fluctuation. Between the boundary of the anisotropic medium and the atom, the Casimir-Polder rotational torque is generated. The vacuum-induced torque effect plays an important role in the fields of physical chemistry, atomic optics and cavity quantum electrodynamics, and it can also result in many potential applications in nanotechnology, such as atomic force microscopes, and reflective elements in atomic optics. The ferrite is a non-metal composite oxide material with ferromagnetism that has been continuously developed in recent years, and its resistivity and dielectric properties show advantages in comparison with conventional magnetic metal. The ferrite has a large magnetic permeability in the high frequency range, so it also has a wide range of uses in the field of high frequency weak current. Ferrite materials have both magnetic absorption and electrical absorption capabilities, and they are superior to other absorbing materials in terms of thickness and bandwidth of the absorbing layer. Therefore, the ferrite absorbing materials are popular materials currently studied. At present, the Casimir repulsion effect and equilibrium recovery effect generated near saturated ferrite, and the Casimir torque of the multilayer ferrite structure system, have been studied and analyzed. Due to the unique electromagnetic properties of the ferrite, the Casimir-Polder torque of nearby atom will be quite different from that of atom in other material environment. In this paper, the Casimir-Polder torque between the two-level atom and the saturated ferrite material plate is calculated, and the specific expression of the Casimir-Polder torque is obtained by using the Green tensor. The theoretical results of the torque under the circularly polarized dipole are presented. The numerical calculation results of the torque under the influence of the atomic position and the transition frequency are given, and the influence of the external magnetic field on the torque is studied as well. The farther the atoms are located from the material plate, the smaller the Casimir-Polder potential becomes, and therefore the rotational torque effect appears weaker, which is also similar to the laws in other Casimir forces or Casimir-Polder interactions. It is found that the Casimir-Polder torque shows a monotonous decreasing behavior with the atomic position and frequency, and it can also be seen that the torque magnitude for the circularly polarized dipole in the plane of certain direction is relatively stronger. Moreover, a non-monotonic inflection point appears in the curve of the torque changing with the external magnetic field, which indicates that when the Casimir-Polder torque is used to control the inherent or existing atomic rotation state, if the torque corresponding to the inflection point in the external-field dependence curve can exactly cancel the original atomic rotation, then further increasing or reducing the intensity of the external field can make the atom rotate in the same direction. The stability of the rotating plane of the torque is also discussed from the perspective of the perturbation imposed on the atomic circular polarization dipole. The Casimir-Polder rotation torque of the atom can be manipulated due to the saturated ferrite, which provides a new way for the control of the rotation state of the two-level atomic system.
Jun. 25, 2022Vol. 51 Issue 6 0627001 (2022)
Jilong TANG, Xiongwei XU, Tianxiang CHEN, Na GAO, Jiewei CAO, and Lin LI
The self-supporting metal film is very important in the observation of X-ray and extreme ultraviolet bands. When the X-ray and extreme ultraviolet telescopes are used to observe the corresponding bands, the detector is usually disturbed by visible and infrared light and other stray light, they affect its detection accuracy and performance. Therefore, it is necessary to add filters in front of the detector, the filters are usually hundreds of nanometers of metal film. The preparation of self-supporting thin films is usually deposited on some special substrates, and then the substrate is removed to obtain the required self-supporting thin films. At present, there are two main methods for obtaining self-supporting films, one is substrate etching; the other is the release agent. The substrate etching process is complex, and the method of release agent is simple and easy to implement. Therefore, this study uses the method of release agent to prepare the self-supporting Al filter. The release agent used in the past is very easy to dissolve, such as NaCl, CsI, etc., and they are easy to bring defects to the film deposited on the release agent. In this paper, AZ50XT photoresist and polyvinyl alcohol are used as release agents. They have good film-forming properties, stable performance, and are good release agent materials. To make the self-supporting Al film have a regular shape and easy to test, it is necessary to prepare a nickel supporting frame. We copied the nickel frame pattern on clean Si wafer by two mask lithography, and then prepared the nickel frame by the micro-electroforming process. After preparation, the nickel frame was removed for use. The thickness of the nickel frame is about 60~70 μm, the inner diameter is 16 mm, the outer diameter is 28 mm. The interface between the nickel frame and the sample is smooth and easy to bond. In the experiment, AZ50XT photoresist and polyvinyl alcohol release layers were prepared on clean Si substrate by spin coater, and then dried on the heating table. After the sample was cooled to room temperature, placed it in the magnetron sputtering coating machine with background vacuum of 5.0×10⁻⁴ Pa to deposit Al film, the deposition thickness was 80 nm. The thickness of Al film was monitored by crystal oscillation film thickness meter, and the step measuring instrument was used to verify whether the thickness of Al film deposited was 80 nm. The test results show the average thickness of Al film is 80.75 nm, it was within the allowable error range. After the deposition of Al film was completed, the nickel frame has adhered to the surface of Al film by epoxy resin adhesive. After the epoxy resin adhesive was completely cured, the sample was put into acetone or deionized water for release, the self-supporting Al filter was obtained. The defects and pinholes on the surface of the filter were analyzed by scanning electron microscopy and a CMOS camera. The analysis results showed that the prepared Al filter surface was uniform and dense, with only a few pinholes. The optical properties of the prepared filter were characterized by Ultraviolet-visible spectrophotometer, soft X-ray transmittance test system and synchrotron radiation device. The transmittance of Al filters prepared by two kinds of release agents is higher than 0.02% in the ultraviolet band, and lower than 0.02% in the visible and infrared bands, they basically meet the requirements of use. The transmittance of Al filter prepared by AZ50XT photoresist is lower than that prepared by polyvinyl alcohol, because the preparation process of photoresist is advanced and the uniformity is better, the surface of the release layer prepared with it is flat and smooth, and there is almost no pinhole on the surface of Al film. The polyvinyl alcohol solution can produce gel during the preparation process, and there is a little gel residue even after repeated filtration, therefore, the prepared release layers have defects, resulting in a few pinholes on the surface of Al film. Compared with the polyimide-aluminum filters commonly used in space X-ray detection, the self-supporting single-layer Al filter has better ability to suppress visible and infrared light. In the 200~400 nm band, the Al filter without polyimide support has higher transmittance to ultraviolet light, so it is more conducive to extreme ultraviolet detection. The soft X-ray transmittance test system is built by our laboratory, the system consists of an X-ray light tube (target is Ag, window is Be), a vacuum chamber, a translation stage and an SDD detector. Under the given tube voltage and tube current, the transmittance of the film in the soft X-ray band is characterized by measuring the ratio of the transmitted light intensity to the incident light intensity. Due to the existence of Be window in the X-ray tube, low-energy photons are shielded, and no low-energy photons are emitted from the X-ray tube. Therefore, the energy section below 1.6 keV can be ignored. The transmittance of the filter is higher than 90% in the energy range of 1.6 ~10 keV. In order to verify the reliability of the test results, we compare the test results with the theoretical calculation results. The transmittance curve is consistent with the theoretical results, which meets the application requirements. Finally, the transmittance of the filter in the energy range of 50~250 eV was measured by synchrotron radiation device. The test results show the highest transmittance of the prepared two filters in this energy range can reach 53% and 35%, respectively. Due to the oxidation of the Al filter surface and the residue of the release agent, the actually measured transmittance is much lower than the theoretical value.
Jun. 25, 2022Vol. 51 Issue 6 0631001 (2022)
Yamei LIU, Haihang MA, Yan GU, Zhou HUANG, and Shun ZHANG
To solve the problems of the low filling rate of the photoresist leads to poor pattern transfer quality, and excessive imprinting force damages the surface morphology of the template in the nanoimprinting process. A low-frequency and low-amplitude vibration-assisted nanoimprinting method based on piezoelectric driving is proposed. This method is used to prepare grating structures. Applying lateral one-dimensional vibration reduces the imprinting force required for nanoimprinting and improves the filling rate of the photoresist to the template cavity in nanoimprinting process.To study the influence of the periodic change of the double-sided grating film on the transmittance, the Finite Difference Time Domain (FDTD) method is used to simulate and analyze the double-sided grating structure with different period parameters in the wavelength range of 500~1 500 nm. The influence law of period parameter on transmittance is obtained. When all the dimension parameters of the grating structure are constant, the smaller the upper surface grating period, the larger the lower surface grating period, and the higher the average transmittance. The double-sided grating structure is selected to prepare the upper surface grating period of 800 nm, and the lower surface grating period of 1 800 nm. Study the mechanism of vibration effect on photoresist filling by establishing a mathematical model of vibration-assisted nanoimprint. The variation law of the filling rate with the vibration parameters after the vibration is introduced by the simulation simulation. Simulation results show that the vibration frequency has almost no effect on the filling rate when the vibration amplitude is constant. As the vibration amplitude increases, the filling rate first increases and then decreases. Through simulation analysis, the frequency of 100 Hz and the amplitude of 300 nm are selected as the vibration parameters of the upper surface grating. The frequency of 100 Hz and the amplitude of 600 nm are selected as the vibration parameters of the lower surface grating. The vibration-assisted nanoimprinting experiment is carried out on the developed vibration device. Characterize the surface topography of the double-sided grating structure, and perform the transmittance test. Experimental results show that compared with vibration-free nanoimprinting lithography technology, the filling rate of photoresist is significantly improved. It also improves the quality of pattern transfer and reduces large-area surface defects. The height of the grating prepared by applying vibration is basically the same as the height of the template cavity. It is confirmed that the filling rate of the photoresist is significantly improved after vibration applying, and the surface topography of the grating is improved. By the transmittance detection, compared with SiO2 without film, the average transmittance of SiO2 with double-sided grating film prepared by vibration-assisted nanoimprinting is increased by 6% in the wavelength range of 500~1 500 nm.
Jun. 25, 2022Vol. 51 Issue 6 0631002 (2022)
Wenbing HU, Chong PENG, Hongbo RUAN, Zhuang YE, Xiangyang HU, Jixiang DAI, and Minghong YANG
Hydrogen is explosive and hydrogen sensors are used in hydrogen monitoring work. The hydrogen sensor films used in previous hydrogen monitoring work were WO3-based and Mg-based hydrogen sensor films, which only available in an aerobic environment. Hydrogen sensing films for monitoring hydrogen concentration in an oxygen-free environment remain to be further investigated. Tantalum is stable in nature and has a high solubility for hydrogen in oxygen-free environment. In this paper, 40 nm Ta0.88Pd0.12~10 nm Pd~6 nm Pt~40 nm PTFE multilayer films were deposited on the end face of single mode optical fiber for hydrogen concentration monitoring for the absence of oxygen. The reflectivity of the deposited film under different hydrogen concentration was probed by the sensing demodulator. The sensing performance were investigated by a series of hydrogen sensing experiments. Firstly, the sensing film are designed for hydrogen sensing in oxygen-free environment. The Ta0.88Pd0.12 thin film is used as basal layer for sensing. Palladium film can improve the selectivity of hydrogen sensing film. Tantalum and palladium absorb hydrogen and become TaHx and PdHx. This phenomenon will result in a decrease in the reflectivity of the film, so that hydrogen concentration can be monitored by the change of reflected light intensity. Platinum film has good catalytic effect and excellent oxidation resistance, so it is employed as a protective layer. PTFE is hydrophobic and can hinder the adsorption of water molecules on the surface of the hydrogen sensing film. Moreover, it has good stability under various ambient environment, which can reduce the negative influence of temperature and humidity. The hydrogen sensing probe was fabricated by magnetron sputtering aforementioned multilayer films. The microscopic morphology of hydrogen sensing film was characterized by scanning electron microscope. Elements of hydrogen sensing thin film were analyzed by energy dispersive spectrometer. The phases of hydrogen sensing film were analyzed by X-ray diffractometer. Secondly, a fiber optic hydrogen sensing system based on Ta-based hydrogen sensing film was constructed, including amplified spontaneous emission light source, attenuator, coupler, spectral acquisition module, reference fiber grating and the fabricated sensing probe. The spectral response of the reference fiber grating with high-reflection was acquired by a compact spectral acquisition module with the range of 1 520~1 570 nm. The Reflection peak intensity (I1) and background intensity (I2) were obtained simultaneously. Reflection peak intensity (I1) of the high-reflection fiber grating is hardly affected by the reflectivity of hydrogen sensing film and is used as the reference signal. The ratio of I1 over I2 is traced as main measuring parameter to enhance the signal noise ratio of sensing system and to suppress the other noise induced by light source fluctuations, insertion loss, and fiber bending. Finally, we investigated the hydrogen sensing performance of the fabricated sensing probe. The probes are characterized in different hydrogen concentration provided by a gas mixer including two gas flow meters with N2 as carrier gas. A series of experiments are carried out to verify the sensitivity and repeatability of the fiber optic hydrogen sensing system with the proposed Ta-based probe. Three on/off cycles under a hydrogen concentration of 3 000 ppm are conducted. When the sensor is put in nitrogen, the value of I1/I2 is on a lower level. When the hydrogen with a concentration of 3000 ppm is turned on, the value of I1/I2 rises to a higher value each time. The results have shown the sensor has a good repeatability and recovery during hydrogen on/off cycles. Multiple experiments under gradient hydrogen concentration with a lower range of 100 ppm~1 000 ppm and a higher range of 1 000 ppm~20 000 ppm show that the different hydrogen sensitivity for different hydrogen concentration ranges. When the hydrogen concentration is in the range of 100 ppm~1 000 ppm, the sensitivity of sensor probe is the largest. The theoretical resolution is 20 ppm in the range of 100 ppm~1 000 ppm hydrogen concentration. This is because the hydrogen sensing film can easily reach saturation in the absorption of hydrogen at high concentrations of hydrogen. As the hydrogen concentration increases over 1 000 ppm, the reaction rate of the sensing film with hydrogen becomes slower. The result implies the sensor probe presents better sensitivity towards lower hydrogen concentration. In conclusion, the sensor probe proposed in this paper has the potential to monitor hydrogen concentrations in an oxygen-free environment and is suitable for monitoring the change of low concentration hydrogen gas.
Jun. 25, 2022Vol. 51 Issue 6 0606001 (2022)
Yan ZHANG, Song GAO, Yaohui XUE, Zhuo ZHANG, Xiaozhang WANG, Shanshan CAO, Haitao XU, Shengfei SHE, Jin XIE, Yizhao LI, Lutao LIU, Haitao GUO, and Chaoqi HOU
With the continuous development of international communication and industrial testing field,optical fiber cables are often in harsh working environments with high temperature, high humidity and high pressure, and will be used in deep-sea signal transmission, urban communication network construction, petrochemical smelting, national defense and military industries. Its application environment puts forward higher and higher requirements for optical fiber strength. The strength of conventional silica fiber can not meet the requirements of harsh environments, which restricts the further expansion of its market application range. Theoretically, using the bond length and surface energy between fused silica atoms, it can be calculated that the theoretical maximum breaking force of standard single-mode fiber is 203 N, while the average breaking force of commercial single-mode fiber is 47.6 N, which is far less than the theoretical maximum breaking force. The main reason is that during the optical fiber manufacturing process, it can inevitably experience the thermal and cold changes of high-temperature fused silica to accumulate internal stress inside the optical fiber. All will cause micro-cracks on the surface of the fiber, reducing the strength of the fiber. Therefore, suppressing the micro-cracks on the surface of the optical fiber and effectively improving the strength of the silica fiber have become the key exploratory areas by researchers. This article uses the passive single-mode quartz preform provided by Zhongtian Technology Co., Ltd(diameter 35 mm, core NA 0.14). The experiment is designed by an online active temperature-controlled annealing furnace to reduce the temperature difference between the surface temperature and room temperature when the fiber is released from the furnace, eliminate the internal stress of the fiber and inhibit the generation of micro-cracks on the surface and inside of the fiber. The newly installed online active temperature control annealing furnace has a length of 600 mm, and the furnace body has built-in three-stage heating wire, which can realize the temperature adjustment of 0~600 ℃ inside the furnace body. Acrylate was used as the coating material, and the fiber was drawled online by UV curing. The fiber cladding diameter was 125±1 μm, the coating diameter was 245±5 μm, and the coating/cladding concentricity error was less than 10.0 μm. The breaking force of the optical fiber is the reference standard to measure the strength of the optical fiber. According to international standard, the average breaking force of optical fiber is tested by universal tensile testing machine. The running speed of the tensile testing machine was 50 mm/min, and 15 samples were selected for each set of tests, and the length of each sample was 1 m. Different preform pretreatment processes,drawing speeds and active temperature control annealing processes are measured in experiment. The surface morphology of preforms and fibers with different treating conditions were characterized by reflective optical microscope (OLYMPUS, BX53M) and Scanning Electron Microscopy(SEM,ZEISS-EVO-18). The influencing factors of optical fiber breaking force were analyzed and studied. The result shows that average breaking force of the fiber behaves a downward trend with the increasing of drawing speed. Through the analysis of the fracture curve of the optical fiber Weibull function under different process conditions, with the optimization of the process conditions, the tensile force of the optical fiber increases but the sample consistency deteriorates. The micro-cracks on the surface of optical fibers and preforms can be effectively suppressed and average fiber breaking force was increased from 36.69 N without any treatment to 68.28 N, and the breaking force increased by 86%, through flame polishing and gradient cooling treatment on preforms, optimizing the active temperature control annealing process and decreasing the drawing speed. Relevant experimental surfaces carried out flame polishing pretreatment on the preform and optimization of the annealing process during the drawing process, while reducing the fiber drawing speed, which can effectively improve the average breaking force of the fiber. The research has opened up a wider application space for high-strength optical fibers in harsh environments such as oil exploration, submarine optical cable laying, and climate monitoring.
Jun. 25, 2022Vol. 51 Issue 6 0606002 (2022)
Kang SUN, Mengyang HE, and Yu HAN
With the continuous development of basic theories and high performance devices, distributed optical fiber acoustic sensing technology has gradually transitioned from the qualitative detection stage to the quantitative detection stage and has been widely used in various applications. Demodulation of disturbance signal is indispensable for quantitative detection, so many demodulation methods intended for optical fiber sensing systems have been derived. The PGC (Phase Generation Carrier) technology has been widely used in optical fiber acoustic sensing systems due to its outstanding advantages of simple structure, high sensitivity, wide dynamic range, good linearity, and strong timeliness. According to the demodulation method type, the PGC technology can be mainly divided into the PGC-DCM (Differential and Cross Multiplying) algorithm and the PGC-Arctan algorithm. In terms of demodulation performance, the PGC-DCM algorithm has relatively high requirements on a circuit and is susceptible to interference from hardware facilities, especially system light intensity disturbances. In contrast, the PGC-Arctan algorithm is less sensitive to light intensity disturbances and has relatively low circuit requirements, but it has high requirements for the modulation depth of the system and faces the problem of phase unwinding. To address this limitation of modulation depth, this study proposes a method that introduces the differential self-division operation in the traditional PGC-Arctan algorithm framework to eliminate the influence of the modulation depth. Theoretical analysis shows that by introducing the differential self-division operation, the first-order and second-order Bessel function values of C can be eliminated, thereby eliminating the influence of the modulation depth drift on demodulation. Then, the original vibration signal is obtained through the square root operation and the arctangent operation. Using the simulation platform to analyze and compare the proposed algorithm and other common algorithms from two aspects: different modulation depths and different SNR. Calculate the amplitude error and the total harmonic distortion of the four algorithms with different modulation depths and signal-to-noise ratios respectively. The amplitude error measures the linear distortion of the demodulated signal, and the total harmonic distortion measures the nonlinear distortion of the demodulated signal. The simulation results show that the amplitude error of the proposed algorithm is less than 0.150% and the total harmonic distortion is less than 0.100%. And with the continuous reduction of the SNR, the linear distortion and nonlinear distortion of the demodulated signal do not fluctuate greatly, indicating that the proposed algorithm has a certain anti-noise performance. An experimental platform is built to verify the simulation results and further study the performance of the proposed algorithm. Firstly, the four algorithms are analyzed and compared under different modulation depths. Comparing the minimum value of the amplitude error and the total harmonic distortion, the minimum amplitude error of the PGC-DSVV (differential self-division) algorithm is 0.105%, which is 0.525%, 0.858%, and 2.900% lower than the other three algorithms, respectively. The minimum total harmonic distortion of the PGC-DSVV algorithm is 0.068%, which is 0.101%, 0.662%, and 0.595% lower than the other three algorithms, respectively. After that, the dynamic range of the proposed algorithm is analyzed. The experimental results show that demodulated signal bandwidth and dynamic range of the PGC-DSVV algorithm are larger than other algorithms. The dynamic range of PGC-DSVV is 62.5 dB when the frequency is 200 Hz, which is 6.1 dB, 11.7 dB, and 14.5 dB higher than the other three algorithms, respectively. And the dynamic range is 31.5 dB when the frequency increases to 5 kHz. The comprehensive analysis results verify that the proposed algorithm can effectively eliminate the modulation depth influence, indicating its good stability and noise resistance. Therefore, the proposed algorithm has a good application prospect in high-performance optical fiber acoustic sensing systems.
Jun. 25, 2022Vol. 51 Issue 6 0606003 (2022)
Jingyi CAI, Jieya WU, Chunliu ZHAO, Juan KANG, and Huaping GONG
Strain measurement is an important problem in bridge health assessment. Fiber Bragg grating is a kind of optical fiber passive components with wavelength modulation effect, and has small volume, high corrosion resistance, good electrical insulation measurement precision, good stability, short response time, and the advantages of distributed measurement. Along with the development of technology, optical fiber Bragg grating sensor for structural health monitoring, space exploration, power system measurement, medical equipment improvement, and other fields has been widely concerned. However, in the process of monitoring bridge strain, the sensitivity of FBG strain sensor will decrease due to long-time use. The resistance strain gauge has the advantages of high precision, good consistency and good repeatability, and is commonly used as the strain sensor. Therefore, in practical process, the resistance strain gauge can usually be used as the reference sensor and the FIBER Bragg grating strain sensor as the sensor to be calibrated. Therefore, an in-situ calibration method is proposed for the accuracy of fiber Bragg grating strain sensor in measuring bridge structural strain. The resistance strain gauge was used as the reference sensor, and the FIBER Bragg grating strain sensor was used as the sensor to be calibrated. The temperature was kept unchanged to avoid the wavelength drift of the fiber Bragg grating strain sensor caused by temperature change. The cantilever beam with equal strength is used to simulate the bridge structure, and the weight is used as the excitation source to simulate the loading and unloading process of the bridge load. By referring to the strain measurement of the response of the sensor and the sensor to be calibrated, the two sensors are installed in a close position to measure and compare. In the actual bridge measurement process, due to uncontrollable environmental factors affecting the measurement results, abnormal jump points appear in the strain output waveform, which can affect the calibration coefficient generated by the actual data matching results, so it is necessary to remove abnormal jump points. In addition, due to the difference in characteristics of different sensors, there is usually data dislocation between the measured value sequence of the calibrated sensor and the reference value sequence, which makes it impossible to judge the consistency of the strain response of the sensor. Therefore, based on the data sequence matching method of dynamic time warping algorithm, the strain data of resistance strain gauge and fiber grating strain sensor are matched and analyzed, and the data matching rate is above 96%. The results show that the method can effectively solve the problem of whether the strain response of the sensor is consistent, and can realize the in-situ calibration of the FIBER Bragg grating strain sensor, and the in-situ calibration results are basically the same as the static calibration results.
Jun. 25, 2022Vol. 51 Issue 6 0606004 (2022)
Jiashun LI, Pinggang JIA, Jun WANG, Jia LIU, Guowen AN, and Jijun XIONG
Dynamic pressure measurements under high-temperature and other harsh environments, such as the pressure monitoring in aerospace engines, on-line health monitoring and control of molten salt reactors and gas-cooled reactors in nuclear applications, in-cylinder pressure monitoring in the automotive internal combustion engines, have a wide range of application requirements. The sensors used for dynamic pressure measurement include electronic pressure sensors and fiber-optics sensors. Among them, electronic sensors are highly dependent on temperature or close proximity electronics, limiting their high-temperature capabilities. In order to effectively protect electronic pressure sensors used in harsh environments, the engineering solutions, such as impulse lines, have been used to isolate sensors sensitive to heat and corrosion. But the impulse lines can also dampen the pressure signals, which will make it difficult to achieve in situ dynamic pressure monitoring, and increase the likelihood of blockages or bubbles impacting pressure measurements. Compared with electronic pressure sensors, fiber-optic pressure sensors have attracted widespread attention due to their high-temperature resistance, high sensitivity, anti-electromagnetic interference, corrosion resistance, simple structure, and small size. At present, most of reported fiber-optic pressure sensors are used for static pressure measurement and various types of fiber-optic FP pressure sensors have been fabricated using the MEMS, chemical corrosion, arc-discharge, laser processing techniques. Among them, the pressure sensors fabricated by chemical corrosion, arc discharge and laser processing technology are usually produced in a single piece, which results in poor consistency between sensors. By contrast, the MEMS technique can be applied in mass production and the materials used to fabricate fiber-optic pressure sensors by MEMS technology mainly include silicon, Pyrex glass, sapphire. Due to the limitation of temperature resistance of the material itself, the pressure sensors made by silicon-glass bonding will have a lower operating temperature. Pressure sensors made of sapphire can withstand high temperatures, but adhesives are usually used to connect the sensitive head and the signal transmission fiber. And if different materials are used to fabricate the fiber-optic sensor or use adhesive to realize the connection between the sensor head and optical fiber, the mismatch of the Coefficients of Thermal Expansion (CTE) between different materials will easily reduce the sensor stability and result in large temperature cross-sensitivity in the high temperature environment. In this paper, we propose a MEMS-based all-silica fiber-optic Fabry-Perot dynamic pressure sensor used the silica wafer with ultralow CTE and softening point as high as about 1 750 ℃. The sensor heads are batch-fabricated with silica wafers using MEMS technique and three-layer silica direct bonding technology, which ensures consistency in the sensor heads and cost effectiveness and have the desired pressure measurement range and sensitivity by flexibly designing the related parameters. The all-silica adhesive-free integration between the sensor head, hollow silica tube and the optical fiber is achieved using CO2 laser fusion. The sensor exhibits an ultralow thermal drift (about 0.069 nm/℃) and good thermal stability owing to the low CTE of silica and the all-silica adhesive-free design, which can effectively avoid the sensor damage induced by the CTE mismatch of different materials at high temperatures and increase the lifetime of the sensor in high temperature environments. To investigate the high-temperature static pressure performance of the all-silica pressure sensor, a static test system was set up and the system includes a high temperature and pressure testing platform, a demodulator, and a personal computer. High-temperature static pressure experimental results show that the proposed all-silica fiber-optic pressure sensor can function under the temperature range from 23 to 800 ℃ with the nonlinearity of approximately 1.13% at 800 ℃ and exhibited a good linear response to pressure at high temperatures, and the pressure sensitivity at room temperature and 800 ℃ was 810.84 nm/MPa and 755.52 nm/MPa, respectively. At the same time, a dynamic test system was set up and the system includes the standard piezoelectric sensor, the sinusoidal pressure generator, and a personal computer. Room-temperature dynamic pressure experimental results show that the proposed all-silica fiber-optic pressure sensor can function under the 2 kHz dynamic pressure environment and exhibited good dynamic pressure response characteristics. Furthermore, the frequency response of the all-silica fiber-optic pressure sensor is in good agreement with the standard piezoelectric sensor. We believe that the proposed all-silica fiber-optic FP dynamic pressure sensor will find broader and more promising applications in dynamic pressure measurement fields at a high temperature and extreme environments due to its low cost, small size, batch-production, and ultralow temperature coefficient.
Jun. 25, 2022Vol. 51 Issue 6 0606005 (2022)
Ruoyan WANG, Dan ZHU, Qun YUAN, Weijian LIU, and Zhishan GAO
Sub-aperture stitching interferometry plays an important role in large-aperture surface testing. Instead of employing large aperture interferometers, a displacement mechanism is often utilized for testing each sub-aperture from the tested surface. In sub-aperture stitching interferometry, positioning error and alignment error between two adjacent sub-apertures are the major error source for surface map testing. The positioning error, mainly introduced by the mechanical scanning of each sub-aperture, will cause a mismatch of the overlapping regions of two adjacent sub-apertures, and will severely decrease the accuracy of stitching testing. The alignment error is mainly caused by piston, tip, tilt, and defocus between two adjacent sub-apertures. Some iterative algorithms utilized alternate optimization to make the positioning error and alignment error converge in sequence. However, due to the coupling between positioning error and adjustment error, the alternative optimization method may not accurately solve the relationship between these two errors. Different from alternate optimization, global searching algorithms can realize synchronous optimization of these two kinds of errors.Particle Swarm Optimization (PSO) is a random searching algorithm derived by simulating the foraging behavior of birds. PSO is a global optimization method, and the model parameters setting is simple, making it widely used in many areas. In this paper, PSO was selected as the optimization method for sub-apertures stitching. However, if PSO is conducted in the original surface maps directly, it will take a long time to get an accurate estimation of positioning and alignment errors. In order to accelerate global searching in PSO, an accurate stitching method based on down-sampled PSO was proposed to realize the synchronous elimination of positioning error and alignment error. To improve the efficiency of PSO, down-sampling was applied to reduce the searching range of PSO algorithm. Then the pixel-level positioning error was obtained by the gradient method. Finally, the coefficients of all error terms were solved, and the positioning error and alignment error were eliminated.To validate the proposed algorithm, two adjacent sub-apertures were selected from the surface data of a spherical mirror tested by a 4-in Zygo interferometer for simulation analysis. To simulate the actual testing process, random noise and positioning error, and alignment error were introduced into the two sub-apertures artificially. The coefficients of these errors were selected randomly. The sub-aperture stitching results of the conventional PSO, and the proposed algorithm based on down-sampled PSO were obtained. The positioning accuracy of the two methods can reach the pixel-level accuracy, but the operation speed of the algorithm is increased by about 12 times by employing 4th order down-sampling. In order to verify the feasibility of the proposed algorithm, a 4-in plane mirror and a 3-in off-axis parabolic mirror were selected as test samples. The surface maps obtained by the proposed stitching method were consistent with the full-aperture direct test, in which the Peaks and Valleys (PV) and Root Mean Square (RMS) values of the proposed algorithm were closer to full-aperture test results. Compared with traditional Least Square (LS) method, the PV value and RMS of residual surface errors of the proposed algorithm are both smaller than those of LS method, indicating that by the proposed method, the positioning error and alignment error are eliminated precisely, and the obtained surface map is more coincident with the full-aperture direct testing result.
Jun. 25, 2022Vol. 51 Issue 6 0612001 (2022)
Lianbo FU, Jianjun LIU, Xin REN, Wei YAN, Deqing KONG, Wangli CHEN, Hai HUANG, and Xingye GAO
With the rapid development of China's planetary exploration project, the communication requirements between spacecraft and ground are getting higher and higher, the antenna aperture is getting bigger and the antenna panel structure is more complex. Large antenna use process, by the temperature, wind, frost, rain, snow and other natural factors, as well as the role of their own gravity, with the passage of time, the antenna structure will inevitably deformation. On the other hand, with the change of antenna pitch angle, the antenna panel will be deformed by gravity. In order to meet the requirements of fast adjustment of antenna face shape and antenna performance analysis for engineering tasks, it is very important to obtain antenna shape variables with high efficiency and high accuracy.This paper adopts the scheme of high precision 3D laser scanner to measure the antenna panel deformation, and constructs a large antenna panel deformation dynamic detection system. And it was applied to the largest fully movable 70 m antenna in Asia at Tianjin Wuqing Station, which was constructed by China's Tianqin-1 Mars Exploration Project. By measuring, analyzing and processing the antenna panel point cloud data, the 70 m antenna panel deformation information was obtained.According to the characteristics of the point cloud data of antenna panel, we adopt the fitting paraboloid specific algorithm for point cloud data alignment to realize the alignment between the point cloud data of theoretical model and actual measured point cloud data, and achieve high efficiency and high accuracy alignment after many falls.The statistical algorithm removes the discrete point cloud data, and the surface fitting algorithm removes the point cloud number data of antenna structure. Finally, the filtering of antenna panel point cloud data and antenna panel deformation analysis are realized, which realizes the high-efficiency, high-precision and automated large antenna panel deformation detection. The data of the theoretical model of the antenna panel is constructed as a grid, and the distance from the measured data to the theoretical model is calculated to obtain the deformation information of the antenna panel.The 3D laser scanner deformation measurement method is applied to the data of the antenna panel at 20, 48 and 70 degrees to obtain the deformation results of different pitch angles and compare and analyze the effect of gravity on the antenna panel. According to the measurement results, it is shown that this paper achieves the antenna panel deformation measurement by 3D laser scanner and the accuracy reaches sub-millimeter.The large antenna panel deformation dynamic monitoring system can be completed within one hour from data acquisition to data processing to derive antenna deformation variables. The photogrammetry method, total station method and radio holography method in the process of large antenna panel deformation measurement, data acquisition all need one or two hours, as well as the subsequent data processing also need a long time, 3D laser scanner measurement of antenna panel deformation only need one hour to complete data acquisition and analysis, to achieve high efficiency of antenna panel deformation monitoring. The 3D laser scanner has reliable single point measurement accuracy and surface measurement accuracy, and the reliability of single point accuracy is verified by total station, and the 3D laser scanner measures antenna panel deformation to sub-millimeter accuracy, which realizes high precision antenna panel deformation measurement. The processing algorithm of the antenna panel point cloud data has been integrated, from data acquisition to data processing, with simple operation and automated deformation monitoring. The LAP3D constructed in this paper can obtain the sub-millimeter scale deformation of large antenna panel with 70 m aperture. Compared with the traditional measurement methods to obtain the antenna panel deformation, the measurement efficiency is greatly improved while the measurement accuracy is not reduced, and the measurement and analysis functions of the antenna panel data under different pitch angles can be completed quickly.
Jun. 25, 2022Vol. 51 Issue 6 0612002 (2022)
Ran ZHAO, Xuan LI, Bo LIU, Peng JIAO, Yonggang HUANG, and Jinsheng JIA
Due to physical and chemical effects in industrial production, various deformations can occurs on the surface of optical products such as glass fiber and quartz fiber. Although it is micro-nano-scale deformation, the properties of materials and related products can be seriously affected. Therefore, enterprise spends a lot of time and money every year to monitor these deformations. Since the microscope is the most common and practical detection device, microscopic detection technology is always the focus of research. At present, the three-dimensional deformation measurement methods used in microscopic system mainly include white light micro-interferometry, micro-fringe projection, digital holographic microscopy, three-dimensional digital image correlation. Although the optical arrangements of white light micro-interferometry is simple, this method needs multiple images to complete the test, which takes a long time and can not realize rapid industrial detection. The measuring devices of micro-fringe projection method and digital holographic microscopy method are usually complex, and the methods above need phase unwrapping operation, which can undoubtedly increase the calculation difficulty and measurement error. Conventional digital image correlation method is a high-precision and stable in-plane displacement measurement technique. With the development of research, scientists have proposed a variety of three-dimensional digital image correlation methods in recent years and have been widely used in real-time dynamic measurement field. However, three-dimensional digital image correlation methods usually require two industrial cameras or a 3CCD camera to complete the test. The inevitable oscillation and disturbance in industrial production can increase the detection error of such binocular or beam splitting techniques. Considering the detection practicability and cost, enterprises and the researchers in production line look forward to the three-dimensional deformation measurement method based on the microscopy with single camera. In 2019, the research group has successfully explained the image rotation phenomenon of micro channel plate by using image spherizing algorithm. Since the algorithm can simulate the reflection image of deformed object, it provides a new idea for three-dimensional micro-deformation measurement. Differential theory shows the fact that all curves can be considered as the integral of infinite small line segments. Therefore, it is easy to figure out that the spherical or hemispherical deformation can be treated as the integral of infinite small slopes and all the deformation observed under microscope is slope-shaped. On this basis, a general slope model, which relates the in-plane displacement and out-of-plane displacement is proposed, then the three-dimensional deformation measurement can be realized. Firstly, two images of the object before and after deformation are taken by the monocular microscopic imaging system. Secondly, the in-plane displacement field between the images is calculated. Finally, the out of plane displacement is extracted from the in-plane displacement field according to the image spherical model, thereby the measurement of three-dimensional deformation is realized. Because the out-of-plane displacement is estimated by the in-plane displacement, the measurement accuracy of in-plane displacement has a significant influence on the measurement results of out-of-plane displacement. In this paper, digital image correlation method and optical flow method are chosen as in-plane displacement estimation techniques to ensure the measurement accuracy. The test object in the application experiment is an optical fiber inverter with a diameter of 20 mm. In order to minimize the error caused by environmental oscillation during measurement, all experimental devices are placed on the air suspension damping platform, and the amplitude of the damping platform is less than 1 μm. The experimental pictures before and after deformation are captured by an industrial camera(Andor, ZYLA 4.2 Plus) which fixed on the microscope with a magnification of 50X. All the pictures are filtered by homomorphic and wiener filter to prove the image quality. The absolute errors and relative errors of all the out-of-plane displacement measurement results are less than 0.2 μm and 5% respectively, which verifies the effectiveness of the presented method. Note that the accuracy of out-of-plane displacement measurement can also prove the accuracy of in-plane displacement measurement. This method only needs two images captured by a microscope with single industrial camera to complete the measurement, and the measuring time is less than 30 s. The measurement theory shows that the new method makes full use of the out-of-plane displacement information carried by the in-plane displacement field, and it does not need frequency conversion or phase unwrapping operation, which provides a new way for the dynamic measurement of micro-nano-scale deformation.
Jun. 25, 2022Vol. 51 Issue 6 0612003 (2022)
Kunyan WANG, Yichun DAI, and Zhenyu JIN
Ground-based solar telescopes take high-resolution observations as their main goal, and have stricter image quality requirements. Due to the direct observation of the sun, solar telescopes are more susceptible to heat and other factors during operation. Gravity and temperature will cause changes in the positional relationship between the primary and secondary mirrors, resulting in time-varying aberrations. If not improved, it will affect the effect of high-resolution observation. In order to better realize high-resolution imaging observation, it is necessary to strictly control the image quality of the telescope during operation. How obtain the misalignment of the secondary mirror relative to the primary mirror is a key link in the attitude alignment of the secondary mirror. In the attitude alignment problem of the secondary mirror based on aberration detection, due to the coupling relationship between the translation and the tilt of the optical axis of the telescope, they will both lead to the coma aberration of the system. Therefore, the aberration measurement cannot completely distinguish decenter and tilt, which will have a certain impact on the attitude adjustment accuracy of the secondary mirror. For telescopes with a large field of view, aberration detection can be performed in different fields of view, and decenter and tilt can be decoupled through aberrations in different fields of view. Small field telescopes cannot achieve decoupling through multi-field wavefront aberration detection. Taking the attitude alignment system of the secondary mirror of the 2 m Ring Solar Telescope as an example, the attitude alignment method of the secondary mirror based on the measurement of the wavefront aberration of the small field of view is studied. To reduce the influence of coupling on the accuracy of misalignment solution, there are usually two schemes. The first scheme is to directly constrain the low-sensitivity misalignment, that is, not to adjust the low-sensitivity misalignment; the second scheme is to use a regular factor to constrain the low-sensitivity misalignment. In the correction scheme of using the regular factor to constrain low-sensitivity misalignment, two implementations are proposed on this basis: "alignment based on stable 0-point position" and "alignment based on relative position". Due to the real-time nature of the attitude alignment of the secondary mirror, multiple corrections are required during the observation time. Based on the misalignment calculation accuracy and image quality compensation effect, the concept of "accumulated error" in the control system is proposed. According to the sensitivity matrix model of the misalignment correction, the measurement accuracy of the wavefront detection system and the execution error of Hexapod, different correction methods are simulated from three aspects: image quality compensation effect, misalignment solution accuracy and cumulative error. The simulation results show that although the scheme of directly constraining the low-sensitivity misalignment has a certain compensation ability, the root mean square error of the corrected wavefront is greater than λ/14, which cannot meet the target accuracy requirement of 2mRST. The solution accuracy of the misalignment is not as good as that of using a regular factor to constrain the low-sensitivity misalignment, and since the decenter does not participate in the control, the accumulated error on the decenter will also exacerbate the deviation of the misalignment from the adjustment range of Hexapod. In the scheme in which the low-sensitivity misalignment is constrained by the regular factor, the misalignment adjustment scheme of the relative position is adopted. With the increase of the adjustment times, there is a problem of accumulation of errors, and the coupling between the decenter and the tilt leads to a low solution accuracy of the decenter and the tilt, the cumulative error range is larger. And as the accuracy of the detection and execution links decreases and the correction frequency increases, the speed of error accumulation will increase, and the execution of the misalignment will exceed the travel range of the Hexapod, which may cause damage to the mechanism. A correction scheme that uses a certain regular factor to make an overall constraint on the misalignment based on the stable 0-point position, can achieve better results in solving the misalignment and improving the image quality of the system. This method can improve the wavefront root mean square error from 0.495 9λ to 0.006 2λ, and will not introduce a large cumulative error in the continuous adjustment process. This scheme is more suitable for the attitude alignment system of the secondary mirror based on the measurement of small field of view aberrations.
Jun. 25, 2022Vol. 51 Issue 6 0612004 (2022)
Zhengxue SHI, Jialiang YANG, Tianxiong LI, and Maosheng HOU
The laser scanning projection system can accurately project a virtual laser template onto complex models and parts to guide operators through the process of part fabrication, and the template is the outlines of parts to be placed, aligned or nested. In order to project the virtual template onto a workpiece accurately, it is necessary to obtain the coordinates of six retroreflective targets at least, and the coordinates are in the projected coordinate system and the workpiece coordinate system, respectively. Then calculate the coordinate transformation matrix between the projector coordinate system and the workpiece coordinate system. The numbers and positions of the edge scanning points vary with different scanning methods, and thus different scanning methods will affect the accuracy of center extraction for retroreflective targets. In this paper, we studied different retroreflective target scanning methods, and proposed the sunflower-shaped scanning method and the epicycloid-shaped scanning method. The raster rectangular scanning method can extract a large number of scanning points corresponding to the high reflection area of retroreflective targets, and the center extraction results are reliable. But there are too many scanning points, which result in long scanning time and low acquisition probability. The scanning points of the epicycloid-shaped scanning method are sparsely distributed in the central area and densely distributed in the edge area. This method can effectively save the scanning time and improve the acquisition probability by reducing the number of scanning points in the central area. According to the experimental results, the acquisition probability of the epicycloid-shaped scanning method is 0.89%, which is 6.719 times that of the raster rectangular scanning method. It can achieve the desired effect that more edge scanning points but less total number of scanning points. However, there are obvious position deviations of the edge scanning points when scanning with the epicycloid-shaped scanning method, and that leads to a large error of center extraction. The average center extraction error of the epicycloid-shaped scanning method is 0.227 935 mm. The sunflower-shaped scanning method can also reduce the number of scanning points in the center area of retroreflective target and improve the acquisition probability effectively. According to the experimental results, the acquisition probability of the sunflower-shaped scanning method is improved to 0.96%, which is 6.231 times that of the raster rectangular scanning method, and the probability of obtaining edge scanning points is greater. Moreover, the scanning time of the sunflower-shaped scanning method is 0.055 710 mm, and the center extraction error is small. Therefore, the scanning time of the raster rectangular scanning method is 2.5 s, while the scanning time of sunflower-shaped scanning method is 0.36 s, and the scanning time of epicycloid-shaped scanning method is 0.612 s. Moreover, the acquisition probability of edge scanning points of the raster rectangular scanning method is 0.39%, while the acquisition probability of edge scanning points of the sunflower-shaped scanning method is 0.89%, and the acquisition probability of edge scanning points of the epicycloid-shaped scanning method is 0.96%. Both the sunflower-shaped scanning method and the epicycloid-shaped scanning method can save the scanning time and improve the acquisition probability of edge scanning points. The average center extraction error of the raster rectangular scanning method is 0.091 883 mm, and the average center extraction error of the sunflower-shaped scanning method is 0.055 710 mm. The accuracy of the retroreflective target's center coordinates is higher by using the sunflower-shaped scanning method. In conclusion, the sunflower-shaped scanning method can meet the demands for short scanning time, high acquisition probability and high center extraction accuracy. It could achieve more efficient and accurate scanning for retroreflective targets and improve the working efficiency and positioning accuracy of auxiliary assembly when applied to a laser scanning projection system.
Jun. 25, 2022Vol. 51 Issue 6 0612005 (2022)
Yuchang WANG, Guoyu ZHANG, Gaofei SUN, Shi LIU, Jian ZHANG, and Shanchi MING
Sunshine duration is an important observation for ground-based meteorological observations. The World Meteorological Organization defines it as "the sum of the periods of direct solar irradiance at or above 120 W/m2". The instrument for measuring sunshine duration is the sunshine recorder, and nowadays, the mainstream sunshine recorder in the world is the photoelectric sunshine recorder. The primary calibration method is the outdoor calibration method. This method has significant shortcomings, such as being affected by different cloud conditions and sky scattered radiation value is not constant, which results in low calibration test accuracy and significant errors. The experimental results show that the threshold error range of outdoor calibration of the sunshine recorders is 9.3~10.3 W/m2, and the measurement results are difficult to achieve repeatedly[1]. Hence, the study of indoor calibration systems that are not subject to environmental conditions is imminent. According to the measurement principle of the photoelectric sunshine recorder, the test system consists of 3 modules: direct radiation simulation system, radiation environment simulation system, and radiation suppression system. This paper focuses on the working principle of the radiation suppression system. The integrating sphere model was chosen as the initial model for the radiation suppression system. Because the distribution of radiation out of the integrating sphere is relatively uniform, even if a considerable amount of radiation returns to the radiation environment simulation system, the impact on the calibration test can be offset from each other. In this section, the calculation method of the radiation flux out of the integrating sphere is studied. Then the configuration of the radiation suppression system is analyzed according to the formula. According to the law of conservation of radiance and Taylors Series, the estimation formula for the flux at the exit port of the integrating sphere can be obtained. Before deriving the output radiation flux calculation, the effect of the thickness of the integrating sphere port in the radiation transmission is analyzed. From the direction of transmission, the radiation emitted from the integrating sphere consists of three parts: the radiation directly emitted to the outside of the integrating sphere, the radiation reflected by the port to the outside, and the radiation back to the inside of the integrating sphere. On the basis of the analyzed the direction of transmission in the integrating sphere, the radiation flux calculation model is established. Then the radiative heat transfer coefficient is introduced to transform the problem of solving the incident radiation flux into an analysis of how the radiation is transmitted between the two surfaces. By substituting the radiative heat transfer coefficients between each surface into the calculation model, the equation for estimating the radiation flux in a plane at a certain distance from the exit of the integrating sphere is obtained. Based on the formula, under the condition that the radius of the exit port, the thickness of the port, and distance from the exit is known, the larger the radius of the integrating sphere, the smaller flux back into the radiation environment simulation system, which means the smaller the error brought to the calibration. Using Light Tools software to build models, the radius of the integrating sphere was taken 1 m, 2 m, 3 m. The results show that the integrating sphere can suppress the radiation, and the sphere's radius is proportional to the suppression effect. The experimental results show that the accuracy of direct radiation simulation of the improved system has improved by more than 80%, and the absolute error is less than 2 W/m2; the accuracy of scattered radiation simulation has improved by more than 95%, and the absolute error is less than 1 W/m2. The error of the system consists of two parts: 1) Stray light of solar simulator. But this error is essentially a systematic error generated during the alignment process of the solar simulator and coupled with the fact that the specific parameters of the integrating sphere vary. It can not be calculated precisely at present and can only be determined through actual measurements. It is recommended that the measured value of stray light be used as the threshold correction value for the current system. 2) The radiation suppression device. It appears from the measured data that the scattered radiation measurements are uniform. The principle of the photoelectric sunshine recorder is the total radiation minus the scattered radiation. Therefore, in the case of a uniform distribution of simulated scattered radiation, even if some radiation returns, the effect on the calibration results is negligible.
Jun. 25, 2022Vol. 51 Issue 6 0612006 (2022)
Kaiqiu LAN, Xibin YANG, Baoteng XU, Jialin LIU, Wei ZHOU, and Daxi XIONG
In recent years, neuroscientists have become more and more interested in brain imaging of conscious and free-behaving animals, hoping to obtain nerve impulse signals in the brains of free-behaving experimental animals, especially certain types of cellular activity may be inhibited by anesthesia. Combined with the Genetically Encoded Calcium Indicator (GECI), the miniature microscope has the ability to image the brain of free-behaving animals and obtain the signal of nerve impulse. The miniature microscope is then widely used in the study of brain science. Currently, most optical systems of miniature microscopes are limited by chromatic aberration due to the use of Gradient Index Lenses (GRIN), which does not meet the experimental requirement of the two-color fluorescent imaging effect. Dual-color fluorescence imaging miniature microscopes have a number of advantages, such as the ability to compare the activities of two different cell populations in the same brain region of a free-behaving animal combined with GECIs which have distinguishable color spectrums, or it can be used for the motion correction. Therefore, a Dual-color Fluorescent Imaging Miniature Microscope (DCFIMM) is developed. Firstly, in order to enhance the dual-color fluorescent imaging capability of the miniature microscope, a micro achromatic lens is designed to replace the gradient index lens. The miniature achromatic lens is composed of double cemented lenses, which forms an infinity correction optical system with the imaging lens. And according to the application direction of cerebral cortex imaging and deep brain imaging, DCFIMM-SBI (superficial brain imaging) and DCFIMM-DBI (deep brain imaging) are designed, both have a larger imaging field of view than the monochromatic fluorescence imaging miniature microscope with grin lens, which are 1.10 mm×1.10 mm and 0.77 mm×0.77 mm respectively. Meanwhile, the dual-band filter for green and near-infrared is used to reduce fluorescent crosstalk. Secondly, a data acquisition circuit is designed to alternately trigger two LEDs with different wavelengths with the frame rate of the CMOS camera. Therefore, the green fluorescent information and near-infrared fluorescent information can be obtained in odd-numbered frames and even-numbered frames, respectively. Our system can realize the imaging speed of 10 fps with the ability of dual-color fluorescence imaging. Thirdly, the video data is stored in a micro SD card. DCFIMM is not limited by the wire transmission. Finally, the structure design of our DCFIMM is optimized. The whole weight of our DCFIMM is 4.8 g (6.2 g with a battery). The experimental results of the USAF 1951 high-resolution target show that the achievable resolution of our DCFIMM is 3.47 μm, which is comparable with monochromatic fluorescent imaging using a miniature microscope with GRIN lens. In the dual-color fluorescent imaging experiment for the hybrid microsphere, DCFIMM can distinguish the fluorescent microspheres of different colors. Compared with the experimental results of monochromatic fluorescence imaging miniature microscope with grin lens, it is found that the chromatic aberration of the DCFIMM optical system has also been well corrected, which demonstrates that our DCFIMM has the ability to distinguish fluorescence of different wavelengths. The proposed DCFIMM in this paper shows promising and wide applications for brain science research.
Jun. 25, 2022Vol. 51 Issue 6 0618001 (2022)
Biyu YANG, and Yue XU
Fluorescence lifetime imaging technology utilizes the decay difference of the emitted fluorescences to distinguish different fluorescent molecules, which is widely used in biomedicine, chemical analysis, and life science. The quality of fluorescence lifetime imaging depends on fluorescence lifetime measurement techniques and retrieval algorithms. The measurement method based on time-correlated single-photon counting technology has become the main stream fluorescence lifetime measurement method in the field of biological research because of its high accuracy and easy low-light detection. Traditional fluorescence lifetime retrieval algorithms based on time-correlated single-photon counting technology are not suitable for the extraction of fast, high-precision, and long fluorescence lifetime. Most of the long fluorescence lifetime substances are quantum dots. In recent years, emerging deep learning techniques have also been gradually used for fluorescence lifetime retrieval, mainly realizing fluorescence lifetime imaging with fluorescence lifetimes in the range of 10 ns. Therefore, it is urgent to develop a new fluorescence lifetime retrieval algorithm to solve the constraints of retrieval accuracy and speed in a wide fluorescence lifetime range.To solve the problem of low accuracy of fluorescence lifetime retrieval in a large dynamic range, a fluorescence lifetime retrieval algorithm based on long short-term memory neural network is proposed in this paper. The algorithm uses a multi-layer long-short-term memory neural network with a time-series memory function to realize the feature extraction of the fluorescence lifetime decay histogram data which is based on time-correlated single photon counting. The unique gate structure of long-short-term memory neural network can realize the protection and control of time series information. What's more, deep learning technology is used to learn a large number of various fluorescence lifetime decay information, establish a corresponding relationship between histogram and fluorescence lifetime, and then the weight value and bias coefficients of the network are updated to make the training model more suitable for fluorescence lifetime retrieval. To train the model, the grid search method is used to select the hyperparameters of the neural network model, including a number of neurons and network layers. To make the simulated data closer to the real experimental data, the data set for model training is a time series generated by a computer simulation of the time-correlated single-photon counting process in the presence of Poisson noise. The generated time series is the series corresponding to 20 000 fluorescence lifetime decay histograms uniformly distributed in the range of 100 ns. The data were normalized to eliminate the order-of-magnitude differences, and to avoid large order-of-magnitude differences which would reduce the accuracy of the predictions. The prediction accuracy of the randomly generated 1~100 ns fluorescence lifetime outside the training data set is supposed as the evaluation standard, and the optimal model including 3 layers of LSTM network is selected for the subsequent fluorescence lifetime retrieval. Monte Carlo simulation results indicate that the proposed retrieval algorithm achieves a retrieval accuracy of 95% in the fluorescence lifetime range of 1~90 ns even when the number of photons is 5 000 which is conducive to the fluorescence lifetime imaging. In the case of the same number of photons, the retrieval range is increased by 4.5 times in comparison with the center-of-mass method. Moreover, the proposed method achieves higher retrieval accuracy of the long lifetimes than the traditional least squares method. For the imaging of 32×32 arrays, after several experimental calculations, it is shown that the center-of-mass method can complete the computing in 0.07 s, the least-squares method takes about 77 s, and the proposed algorithm takes about 9.7 s under the conditions of Windows11 (64-bit) operating system, 16 GB memory, and Intel(R) Core(TM) i5-1157G7 processor. The results reveal that neural network not only provides comparable or even better performances but also offers much faster high-throughput data analysis. A shorter time will be used to complete the array imaging when the hardware conditions are improved which provides the possibility for real-time imaging. The proposed algorithm can significantly broaden the fluorescence lifetime reduction range with high retrieval accuracy, thus, it is suitable for accurate fluorescence lifetime retrieval imaging with a single exponential large dynamic range.
Jun. 25, 2022Vol. 51 Issue 6 0618002 (2022)
Chen TIAN, Peng CHEN, Xiaojie ZHANG, Huabao LONG, Mingyang HOU, and Zhengxiang SHEN
Division of focal plane polarimeters can obtain transient polarization imaging information, which is a research hotspot in the field of infrared polarization imaging technology. However, there are also some shortcomings. In the measurement process, the instantaneous field of view error will be produced and the image resolution will be reduced. The method of combining micro-scanning technology and infrared polarization imaging technology can make up for the above shortcomings. The focusing lens in the infrared imaging system is used as the micro-scanning lens and fixed on the two-dimensional micro-scanning platform which adopts 2×2 mode to implement periodic scanning. Finally, four sequential images of the same scene with one pixel shift can be obtained, to obtain the target's polarized light intensity data in 4 different directions, and then calculate the Stokes parameters. The polarization imaging optical system based on lens micro-scanning requires that the displacement of the micro-scanning lens does not reduce the imaging quality, that is, the tolerances such as the coaxiality, true position, and scanning displacement of the micro-scanning lens are not sensitive, so higher requirements are proposed for the design and assembly of the optical system.The article first discusses the relevant theoretical basis of polarization based on Stokes vector method, introduces the representation of Stokes vector and the calculation formulas of polarization degree and polarization angle, and then introduces the division of focal plane polarimeters based on micro-scanning technology in detail, including the distance of each displacement, the movement path of the micro-scanning lens.What's more, the infrared imaging system is designed. The catadioptric system is selected as the initial structure, the aspherical secondary mirror is simplified to a plane mirror only for reflecting the light path, and then the aspherical rear lens group is used to correct the aberration. The infrared system has four lenses, and using the last lens as a micro-scanning lens to realize the orthogonal displacement of 2×2 mode. The wavelength of the system is 3~5 μm, the F-number is 2, the optical field angle is ±2°, the focal length is 176 mm and the aperture is not less than φ40 mm. After completing the optical design, the optical transfer function and spot diagram are performed. The optical transfer function of each field is higher than 0.47@17 lp/mm and the RMS radius of each field is less than 11 μm. The results show that the optical system meets the requirements for use. Then the tolerance analysis is completed. From the result of the Ment-Karol simulation, the probability of MTF value greater than 0.2@17 lp/mm is over 90%. The influence of the coaxiality, true position, and scanning displacement of the micro-scanning lens on the imaging quality is also analyzed. The system MTF value changes with the decenter and tilt of the micro-scanning lens in the X and Y directions are provided. The results show that the optical system can still ensure good imaging quality in the range of decenter ±200 μm and tilt ±0.4°, and it is not sensitive to tolerances. In addition, structural design is completed. The entire imaging system includes the optical system and the mechanical structure supporting the optical system. Among them, the support frame is made of titanium alloy material to improve rigidity and the rest of the structure is made of aluminum alloy material. The main reflector is the core of the catadioptric optical system, and its surface shape accuracy determines the imaging quality of the system. Therefore, a stress isolation groove is used to realize a flexible connection with the support frame. All mirrors and lenses are machined using a single point diamond turning method.Finally, a polarization imaging experiment is carried out with the developed system, and the results show that infrared polarization imaging images have higher contrast, clearer target contours, and better identification of different materials compared with infrared intensity imaging.
Jun. 25, 2022Vol. 51 Issue 6 0622001 (2022)
Pan GUO, Yanbao DENG, Lifu WANG, Siying CHEN, Wangshu TAN, Yinchao ZHANG, Yuting SUN, Jiayi ZHANG, Wenhui YANG, and He CHEN
Czerny-Turner spectrometer has been found for widespread application in the detection of Raman, fluorescence, and atmospheric remote sensing because of its simple structure and high resolution. The conventional Czerny-Turner configuration also known as unfolded C-T spectrometer, consists of two concave mirrors where the light path has no folded part. It can detect a wide range of light, so it is very suitable for dual-band detection. Dual-band spectral detection is mostly used for dual-channel spectral detection systems in the visible infrared band, dual-wavelength-excitation particle fluorescence spectrometer. However, for dual-band or multi-band detection, the spectrometer based on the Czerny-Turner structure often needs to be deformed, and the detector is always selected as area array detectors and detectors even need more than one. It makes the structure of the system more complex and increases the cost. Considering that linear array detectors are more beneficial than planar array detectors for the detection of one-dimensional spectral information, and linear array photomultiplier tube has higher detection efficiency for weak signals and has been verified for effectiveness in the dual-laser-induced fluorescence detection system. We proposed a modified optical design of a combined unfolded Czerny-Turner Spectrometer sharing one common linear-array detector. In the proposed design, the astigmatism of the system is controlled by using divergent illumination on the grating without introducing any additional optical elements, which is used for the correction of astigmatism in the Czerny-Turner spectrometer. By considering the condition of sharing one detector and the astigmatism correction method of the illuminating grating, the proposed design method of the system is provided, and the proposed design method of the system is provided. Zemax is used for simulation and optimization of the proposed optical system model. The spectrometer can detect two bands of light i.e., 280~460 nm and 380~560 nm. We have also analyzed the reciprocal linear dispersion, which demonstrates that the reciprocal linear dispersion at the central wavelength of two wavebands are 6.03 nm/mm,6.10 nm/mm, respectively. That means the proposed system satisfies the spectral resolution of 6 nm, and the spectral resolution difference of the two spectrometers in a whole working band is less than 0.6 nm. Finally, the RMS spot size of the system is also analyzed theoretically. In the first band (i.e., 280~460 nm) the maximum RMS spot is 67.1 μm at 280 nm, while in the second band (i.e., 380~560 nm) the maximum RMS spot is 53.2 μm at 560 nm. The 80% range of RMS spot radius is less than 50 μm in these two bands. In view of the design and simulation results, the prototype model is developed and the experimental verification finished. Mercury lamp was used for the optical inlet of spectrometer as a light source, and the experimental results were obtained by 32 linear array photomultiplier tube, the results demonstrate that the positions of several spectrum peaks detected are consistent with the simulation. This proposed method extends the application of the system structure with two light paths and one common linear detector in the elaborate and expensive designs, which may be beneficial for the non-imaging design of dual-waveband spectral systems.
Jun. 25, 2022Vol. 51 Issue 6 0622002 (2022)
Pengfei XIE, Xiaoxin FAN, Zhishan GAO, Jinzhou FEN, and Qun YUAN
To solve the problem of the high cost of infrared detection devices in wave aberration detection, a single-detector infrared Fizeau interferometer optical path design method is proposed, which realizes that the interferometric imaging optical path and alignment imaging optical path share the same near-infrared detector and all components of the system are of existing. Based on the principle of Fizeau interference, the near-infrared fiber laser with a working wavelength of 1310 nm and the selection of a near-infrared detector with a 12.8 mm×10.24 mm target surface, combined with the measurement aperture requirement of 20 mm, the vertical of the interferometric imaging optical path is established. The axis magnification is 1/2, and the field angle of the alignment imaging optical path is ±1.2°. Combined with the laser numerical aperture of 0.14, the F number of the collimated optical path must be greater than 3.54. In this paper, the basic parameters of the imaging element are determined by calculating the conjugate relationship of the collimated optical path, the interferometric imaging optical path, and the alignment imaging optical path.First, the conjugate relationship between the collimated optical path, the interferometric imaging optical path, and the alignment imaging optical path is calculated to determine the basic parameters of the imaging element. Thorlab's cemented lens in the near-infrared band is selected as the optical element. Considering the ability of a single lens group to correct aberrations in the worst case, the collimating mirror and the imaging mirror are constructed using a double lens group.The interferometric imaging optical path is mainly composed of a light source, a collimating lens, a pinhole, an imaging lens, and a detector. To eliminate the influence of parallax and ensure that the imaging optical path has a constant magnification, the interferometric imaging optical path adopts a double telecentric design. Among them, the imaging lens consists of a single lens group and a double lens group. Compared with the single lens group, the image quality of the double lens group is significantly improved. The scheme of the double lens group can control the RMS of the full field of view within the diffraction limit. The RMS value of the wave aberration in the full field of view of the two-group scheme was less than 0.03λ; the maximum astigmatism of the system was reduced from 4 mm to 0.17 mm; the maximum field curvature was reduced from 2 mm to 0.08 mm; maximum distortion was reduced from 1.6% to 0.7%. For the field curvature distortion of the two-group scheme, with the spatial frequency of 25 mm/lp as the comparison index, the MTF values of the full-space sagittal and meridional directions are both less than 0.3; the MTF value of the two-group scheme is about 0.5 when the almost identical to the meridian MTF value. The system finally uses a double lens group composed of double 200 mm achromatic cemented lenses as the collimating lens for the collimating optical path. The light sources are located at the focal plane of the collimator lens, 94.5 mm apart, the aperture diaphragm is 40.2 mm from the imaging mirror, and the imaging mirror is 55.6 mm from the detector.The alignment imaging optical path is composed of the diffuser, the relay lens, the imaging lens, and the detector. After the design of the interferometric imaging optical path is completed, the distance from the image plane in the alignment imaging optical to the rear surface of the imaging lens group is a fixed value. To clearly distinguish the interferometric pattern from the spot, this paper introduces a relay lens into the alignment imaging optical path, cooperating with the imaging lens to make the optical path meet a certain lateral magnification and control the size of the spot, and finally realizes the distinction between the two. Then insert beam splitters and reflectors at the corresponding position to realize beam splitting and beam combination of the optical path.The final design of the interferometer has an effective aperture of 20 mm and a measurement error of fewer than 1/20λ, which ensures the accuracy of wave aberration detection and the requirements of aperture, while effectively controlling the cost of development.
Jun. 25, 2022Vol. 51 Issue 6 0622003 (2022)
Guang YANG, Minghui DUAN, Yue HUI, Kai LIU, Guide LIANG, and Zhipeng HUANG
There are higher requirements for various properties of optical films with the increasing maturity of the manufacturing process of polymer surface microstructures. The road traffic reflective film uses the pyramid array structure to achieve the effect of light retroreflection. Therefore, the simulation to design the pyramid structure is the important significance for shortening the product development cycle and saving costs using the computer. A standard pyramid prism (with an angle of 90°between surfaces) is an optical structure element that can return light rays along the incident direction. In practical application, microprism reflection film requires a certain observation angle (divergence angle) and requires that the brightness decrease from the center of the optical axis to the edge. However, the standard pyramid prism reflective film can not meet the requirement of large viewing angle brightness. The research on the divergence of pyramid prisms can be divided into two aspects. One is to enhance the divergence of the reflective film by changing the size of the pyramid prism. However, only when the size of the pyramid is less than 10 μm, it will have a certain brightness at the larger observation angle, and the manufacturing cost of the pyramid with a small size will increase as the processing difficulty increases. Another method is to achieve the purpose of light deflection by changing the pyramid structure. Among them, the pyramid array formed by changing a single dihedral angle deviation (non-standard pyramid) can enhance the light intensity at a specific deflection angle, but significantly reduce the light intensity at other deflection angles. In addition, the ideal light distribution and illumination can be obtained theoretically by combining the pyramidal laminates with different dihedral angle deviations to optimize the light distribution at different deflection angles. However, the angle cutting with different dihedral angle deviation faces the use of forming tools with different cutting angles, and the tool change brings difficulties to precise positioning. The design of setting different dihedral angle gradients on the same cone to achieve the effect of light divergence also has the problem of difficult positioning accuracy brought by tool change. The light beam can be distributed uniformly or non-uniform by using the pyramid with dihedral angle deviation, and the premise is to combine the pyramid with different dihedral angle deviations. The lens can realize the divergence of light because the radius of curvature of the lens controls the diffusion range of the whole beam. With the increase of the radius of curvature, the diffusion range becomes smaller, the average illuminance becomes higher, and the peak illuminance becomes smaller. The concave lens can achieve uniform divergence of light rays, but can not achieve non-uniform divergence. The non-uniform divergence can be easily realized by superimposing microlens and dihedral angle deviation pyramid structures. In this paper, the influence of dihedral angle deviation and lens curvature radius on divergence angle is analyzed theoretically based on the geometrical optics principle. The divergence of light rays is analyzed by using optical simulation software according to the combination of the microlenses and pyramidal structure with different geometric parameters. The results show that the deflection angle increases linearly with the increase of dihedral angle deviation. The divergence angle increases with the decrease of the curvature radius of the microlenses. Non-uniform divergence of light rays can be realized by using microlenses superimposed with dihedral angle deviation. The combination of the concave lens and negative dihedral angular deviation prism, or convex lens and positive dihedral angular deviation prism, can realize the continuous non-uniform divergence of light rays from the center to the outside. The optimal design interval of the curvature radius is determined to be 5~6 mm, and the optimal design interval of dihedral angle deviation is determined to be 2.80~3.32 mrad through the simulation calculation. The above research results can be used for the structural design and optimization of micro prism reflective film.
Jun. 25, 2022Vol. 51 Issue 6 0622004 (2022)
Yu ZHANG, Meini GAO, Haitao DAI, Ying LIU, and Qieni LÜ
Inspired by the two-layer twisted graphene in electronics, Moire photonic lattices are also of great interest to researchers. Various Moire photonic configurations have been shown to possess peculiar photonic properties. In this paper, the photonic characteristics of Lieb Moire lattices composed of two overlapping Lieb sublattices with different rotation angles are studied. It is found that two Lieb sublattices can form a lattice with square characteristics when the rotation angle is 36.87°. Both the Lieb lattice and Lieb Moire lattice are composed of GaAs dielectric cylinders embedded in air. The radii of the cylinders of the two sublattices are r2 and r1 respectively. In order to compare their lattice properties, their lattice constants are set to be equal. With the same filling factor, the plane wave method is used to simulate the band structures of TM modes. According to numerical simulation, the Lieb Moire lattice has a wider photonic bandgap and a blueshift of the bandgap center than the conventional Lieb lattice, which is more suitable for optical communication applications. The main reason for the phenomenon is the change of dielectric contrast. To find the widest bandgaps, the filling factors of Lieb lattice and Lieb Moire lattice are further scanned, and the bandgap maps are obtained. The numerical simulation results show that the bandgap firstly increases and then decreases with the increasing filling factor, and the bandgap of Lieb Moire lattice is wider. At the same time, the photonic flat band properties are also observed. Three bands with very small gradients are observed in the band structure of Moire lattice, which are the 15th, 22nd and 27th bands. In order to indicate the characteristics of flat bands, the flatness is defined as F. Through calculation, the 22th band has the minimum F, meaning it has the highest flatness. By changing the size of the dielectric cylinders, the flatness of the flat band can be higher. The flat band can lead to localization of field near lattice. By calculating the intensity of electric field distribution at the Γ and K points in the 22th band with the highest flatness, it can be seen that the electric energies are obviously located tightly to the central rings of cylinders , which verifies the effective flatness of photon band. The flat band with higher flatness can lead to stronger localization of electric field, which has a wide application prospect in nonlinear optics, photoelectric energy conversion devices and so on. Changing the structural parameters and dielectric parameters of Lieb Moire lattice can further increase the width of bandgap. In order to obtain the optimized bandgap width, the materials are changed. The band characteristics of composite Moire Lieb lattice formed by the superposition of sublattices of different dielectric materials are also studied based on plane wave method. The dielectric material of the unrotated sublattice labelled as “A” was selected as GaAs, and the dielectric material of rotated sublattice labled as “B” was selected as SiO2, and the superposition points of two sublattices were selected as GaAs. The dielectric cylinders are all embedded in air. It is proved that the composite Lieb Moire photonic lattice has a wider bandgap, which is mainly due to the reduced symmetry caused by the two kinds of materials. Then the radius relationship of the two sublattices is simply set as r2=0.5r1, and r2 changes synchronously with r1. The main bandgap width of the composite Lieb Moire photonic lattice is further increased, which can be attributed to the decrease in the overall lattice symmetry caused by the change of the radius. The Moire configuration based on Lieb lattice proposed in this paper provides a new method to improve the bandgap of photonic lattice, it provides a meaningful platform for studying the physical phenomena of flat band.
Jun. 25, 2022Vol. 51 Issue 6 0623001 (2022)
Quanze LI, Zunkai HUANG, Li TIAN, Yongxin ZHU, Hui WANG, and Songlin FENG
In the past twenty years, research heat and market demand for image sensor technologies have grown rapidly, and image technologies are undergoing the transition from Charge-Coupled Device (CCD) to Complementary Metal Oxide Semiconductor(CMOS). Since there are a large number of differences between the two technical difficulties, a lot of research directions have changed, but improving the transmission efficiency of charge in pixels has always been one of the most important research directions. The key point of CMOS Image Sensor (CIS) pixel design is the transfer of photo-generated charge in photo-diode. Especially in applications requiring large pixels, such as medical imaging and astronomical imaging, limited signals need to be detected at high speed, which requires high transmission efficiency of charges in photodiode.Charge transfer is a complex process affected by many factors. It is usually divided into drift, diffusion and self induced drift.In order to improve the charge transfer speed in CIS pixel, a large number of solutions have been proposed. Generally, it can be divided into two directions: increasing the bias electric field externally or generating the potential gradient internally. The method of adding an external bias electric field, has great scenic limitations. The methods of forming internal potential gradient in a photo-diode can be roughly divided into two directions: designing the special shape and manufacturing gradient doping. Designing specific diode shapes, are relatively complex, and the formation of a built-in electric field is actually the cost of reducing the filling factor, which reduces the space utilization and virtually increases the cost of actual production. Manufacturing gradient dopingare lack complete theoretical analysis, which will take a lot of time to adjust parameters in practical operation, and there is no rigorous reference value. Therefore, there is a great need for a complete and relatively refined analysis method to provide theoretical support for the design and research of gradient doping.Based on Fick's law and electron drift theory, this paper deeply analyzed the whole process of ion implantation and diffusion and proposed an efficient implementation method of arbitrary gradient doping distribution. Taking the manufacturing of linear-gradient doping distribution as an example, the correctness of this method is verified by simulation calculation and process simulation. By this method, the process parameters such as ion implantation energy, implantation dose and the time required for thermal diffusion can be accurately calculated. Then, according to the target doping distribution, a lithography mask with a specific structure can be designed. The doping region with an arbitrary distribution function can be fabricated by only one ion implantation.A 5 μm CMOS image sensor pixel with gradient doped photo-diode is designed by this method. A set of control experiments were set up with a pixel designed by traditional technology. Compared with pixels designed by traditional technology, the experimental results show that the transmission efficiency of photo-generated charge in the pixel with gradient doped photo-diode is significantly improved. The method proposed in this paper can greatly improve the efficiency of researching gradient doping. In addition, this method can also be used in other fields, such as studying the diffusion coefficient of specific impurities in substrate materials, determining some physical properties of new materials, etc.
Jun. 25, 2022Vol. 51 Issue 6 0623002 (2022)
Jiashun ZHANG, Junming AN, Bingli SUN, Jun CHEN, Yanzhang HU, and Chongxin SHAN
At present, the world has entered the era of big data, with the rise of cloud computing, big data and mobile Internet, it is urgent to introduce the next generation port technology to meet the application requirements. With the formal freezing of the 3rd Generation Partnership Project (3GPP) the 5th generation mobile communication technology (5G) Non Standalone (NSA) and Standalone (SA) networking standards, Chinese operators have started planning and designing 5G pilot and pre commercial schemes simultaneously. The pace of 5G moving towards commercial use has been gradually accelerated. Up till now, the most representative Dense Wavelength Division Multiplexing (DWDM) technology suitable for 5G fronthaul is the multichannel bidirectional metro access DWDM System with port agnostic, which based on the G.698.4 standard adopted and released by International Telecommunication Union Telecommunication standardization sector (ITU-T) in 2018. The scheme adopts wavelength tunable optical module, which has port independent and wavelength adaptive characteristics. The tail end equipment has the ability to automatically adjust the working wavelength of the optical module to the port connected, including optical demultiplexer, multiplexer and optical add drop multiplexer. The 20 channel WDM system carried by 5G contains 20 uplink wavelengths and 20 downlink wavelengths, and each output contains one uplink wavelength and one downlink wavelength. It is similar to a cyclic structure and requires a special cyclic Arrayed Waveguide Grating (AWG). It is usually composed of many discrete devices, which has complex structure, high cost and large volume, and difficult to produce on a large scale. According to ITU-T G.698.4 standard, a 20 channel cyclic AWG suitable for 5G fronthaul transmission is designed and fabricated with a channel spacing of 100 GHz. Compared with the traditional periodic AWG structure, the 2×20 cyclic AWG structure can achieve strict alignment of channel wavelength and higher insertion loss uniformity. In addition, the exponential tapered waveguide is used to replace the rectangular Multimode Interferometer (MMI), which can reduce the loss caused by the sudden change of waveguide structure, and do not bring the deterioration of spectral performance. And a flattened AWG passband is realized. After mechanical compensation athermal packaging, the insertion loss of the prepared 20 channel cyclic AWG module is about 5.5 dB, 0.5 dB bandwidth is about 0.31 nm, and the center wavelength offset is in the range of -40 pm to 80 pm when the temperature changes at -40 ℃/25 ℃/80 ℃. The center wavelength offset is a litter large, mainly due to the following two reasons: 1)the average difference of central wavelength offset between uplink band and downlink band is 25 pm,the two are not equal; 2)the central wavelength offset at low-temperature is 68 pm on average compared with normal temperature, and the offset at high-temperature is -5 pm. The wavelength offset at high and low temperature is unbalanced. For the above two problems, the input waveguide position of the downlink band can be fine-tuned downward to make the center wavelength offset of the uplink / downlink band equal. The length of the expansion screw can be adjusted to balance the wavelength offset at high and low temperatures, so as to further reduce the center wavelength offset. The athermal AWG module has the advantages of miniaturization, low cost and large-scale production, and can be widely used in 5G fronthaul transmission network.
Jun. 25, 2022Vol. 51 Issue 6 0623003 (2022)
Bowen JIANG, Tao YUE, and Xuemei HU
Radar is a sensor that uses electromagnetic waves for detection and ranging. The Light Radar (LIDAR) has been widely applied in many fields, such as robotics, ocean detection, atmospheric detection, intelligent driving, etc. Recently, LIDAR, based on the aperiodic random signal, has aroused great attention. The chaotic signal is one of the various aperiodic random signals, and the LIDAR systems taking the chaotic signal as the detection signal are named chaotic laser ranging systems. Considerable simulation and experimental results have illustrated that this kind of LIDAR system can perform attractive qualities, such as anti-jamming properties, high precision (mm-level), and multi-target real-time ranging ability. Nevertheless, up to now, existing work has not proposed a simulation model based on a realistic physical processes for chaotic laser ranging systems yet; also, there is no work that quantitatively analyzes the main degradation factors affecting the accuracy of chaotic laser ranging systems and the quality of reconstructed depth maps. In order to solve the problems above, a computational model based on the physical process for chaotic laser ranging systems is proposed in this paper. The computational model comprehensively considers various factors which will possibly cause chaotic signal degradation and ranging error during the realistic ranging process, including atmospheric attenuation, atmospheric turbulence, geometric attenuation, surface information of the object and its Bidirectional Reflection Distribution Function (BRDF), multipath noise, ambient noise, thermal noise and the degradation model of photodiodes. The program of the computational model is implemented with MATLAB. Among various degradation factors, there are three factors that require special awareness which namely BRDF, ambient noise, and multipath noise. In order to explore the influence of these three degradation factors on the accuracy of depth map reconstruction, this paper further uses the discrete chaotic sequence generated from the simulated Chua's chaotic circuit as the detection signal to scan the synthesized depth images and reconstructs depth maps by means of the cross-correlation mathematical method. To comprehensively assess the quality of the depth maps reconstructed under different degradation factors and degradation levels, we not only calculate the Peak Signal-to-Noise Ratio (PSNR) and Structural Similarity (SSIM) between the reconstruction result and ground truth but also visualize both the reconstructed and ground-truth depth images. The experimental results show that the quality of depth maps reconstructed by the chaotic laser simulation ranging system is slightly affected by the roughness coefficient in BRDF model, but as the roughness coefficient increases, the influence of multipath noise will become non-negligible. Additionally, the chaotic laser simulation ranging system studied in this paper performs satisfying robustness against ambient noise when it is not extremely intense. However, the chaotic ranging system is relatively sensitive to multipath noise, i.e., even when the multipath noise is not intense, the depth map reconstruction quality will decrease rapidly. Therefore, when designing a realistic chaotic laser ranging system in practice, it is necessary to take the reflection and geometric property of the object and the influence of multipath noise into careful consideration. In conclusion, the computational model of a chaotic laser ranging system proposed and analyzed in this paper can serve as an important reference for analyzing the degradation factors affecting the ranging quality before designing and implementing a practical chaotic laser ranging system. Moreover, with the help of this computational model, it is possible for researchers to quickly and efficiently generate synthetic chaotic laser ranging datasets similar to the data measured in a realistic environment.
Jun. 25, 2022Vol. 51 Issue 6 0628001 (2022)
Geyang HAO, Qing LUO, Yahan YANG, Zhaochao YAN, Guojun WU, and Jie HUANG
The Photon Doppler Velocimeter (PDV) is a non-contact velocity measurement equipment with high accuracy and high-time resolution, which can obtain the continuous interior ballistic velocity of ultra-high-speed launchers. Continuous velocity data is very important for ultra-high-speed experiments. It can be used to understand the performance of ultra-high-speed launchers and the physical processes of ultra-high-speed, as well as to develop the theory of interior ballistics. Limited by the small size of the muzzle, the serious attenuation of laser energy and (the limitation of) the bandwidth of detector, it is difficult for ordinary PDV to obtain continuous ultra-high-speed interior ballistic velocity. In this paper, we have developed a large depth field PDV with an effective working distance greater than 7 m, which is constructed based on fiber Mach-Zehnder interferometer. The emission aperture of optical antenna is 25 mm, the beam waist of emission position is located at 3.3~3.4 m, and the diameter of beam waist is 1 245 mm. In order to verify the performance of the system, we first simulated the high-speed motion process by using a rotating turntable and a motor, and tested the measurement error of the PDV system. In the velocity range of 1~40 m/s, the measurement uncertainty of the PDV can be controlled at 2.48%. Then we carried out experiments on the ultra-high-speed ballistic target (FD-18A) of China Aerodynamics Research and Development Center (CARDC), and repeatedly obtained the continuous ultra-high-speed inner ballistic velocity of the ultra-high-speed two-stage light gas guns. In the experiments, we placed a reflector directly behind the muzzle to change the direction of the laser signal and put the optical antenna on one side of the reflector. Finally, the PDV recorded the velocity changes of the launch model from static acceleration to about 2 km/s and 7 km/s, with the maximum velocity of 6.89 km/s. By comparing with the numerical simulation results, it is found that the measured velocity of experiment is lower than the simulation velocity in the test with a velocity of 2 km/s. While the measured velocity of experiment is higher than the simulation speed in the test with a velocity of 7 km/s, and the deviations are -20.11%, -23.7% and +9.15%, respectively. Through the analysis of velocity-acceleration data, it is found that the difference in friction between simulation and experiment may be the main reason for the difference of velocity. The actual friction force of the ultra-high-speed projectile in the ballistic target is greater than the theoretical friction force given in the simulation, so it may cause that the maximum speeds and accelerations are lower than the theoretical results in the test with an estimated launch velocity of 2 km/s. In the test with a velocity of 7 km/s, the mass of the projectile decreases rapidly due to severe friction, so the maximum velocity and acceleration in the second half of the movement are gradually larger than the simulation results.
Jun. 25, 2022Vol. 51 Issue 6 0628002 (2022)
© Copyright 2018-2021 | Chinese Laser Press.
All Rights Reserved 沪ICP备15018463号-20