


Please enter the answer below before you can view the full text.
9-6=

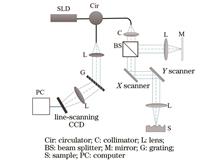
ObjectiveIn conventional spectral domain optical coherence tomography (SD-OCT), depth information is calculated by fast Fourier transform (FFT) to bring an axial resolution typically within the range of 10 μm. Sub-micrometer resolution is achieved by employing broadband light sources. Phase-sensitive SD-OCT (PSSD-OCT) provides nanometer-level precision and can be employed for film thickness measurement, displacement sensing, optical fiber Fabry-Perot sensors, quantitative phase microscopy, and surface profile imaging. Phase wrapping is an inherent issue in optical interference techniques, and various phase unwrapping algorithms have been proposed to enhance the dynamic range. The current approaches are typically to first calculate a low-precision solution by frequency estimation methods, followed by determining the phase cycle number. However, the frequency estimation methods are highly susceptible to noise, which makes them suitable only for interference spectra with high signal-to-noise ratio (SNR). Synthetic wavelength methods are widely adopted for expanding the phase dynamic range. Since the synthetic wavelength is much larger than the wavelength of the light source, it can increase the dynamic range to the synthetic wavelength size. However, when the measurement range exceeds the synthetic wavelength, phase wrapping still occurs. To improve the dynamic range of existing synthetic wavelength methods, we propose a high dynamic range synthetic wavelength (HDR-SW) phase unwrapping method. This method eliminates the phase wrapping limitation and achieves a dynamic range of millimeters. Finally, a method is provided for displacement measurements with a large dynamic range, high sensitivity, and high speed.MethodsThe experimental system mainly consists of a fiber Michelson interferometer, a SLD light source, and a spectrometer. Light from the SLD is directed into a fiber circulator. Then, it is split into reference and sample beams by a beam splitter. The beams reflected from the sample and reference arms enter a spectrometer. The spectrometer has a spectral width of 30 nm and a spectral resolution of 0.0146 nm. Both the reference and sample arms are in free space, and achromatic lenses are utilized to eliminate the dispersion mismatch between the two arms.Firstly, the synthetic phase is calculated by splitting the interference spectrum into two sub-spectra. Then, the correct integer number of phase cycles is computed from the full-length spectrum and the half-length spectrum located in the middle of the spectrometer. The method combines the demodulation results of the interference spectra with full-length and half-length to eliminate the ±1 phase cycle jump that is easily affected by noise.Results and DiscussionsThe experimental results demonstrate that the HDR-SW method enables high-sensitivity phase demodulation for a large dynamic range. Compared with the linear regression method, the HDR-SW method has higher anti-noise ability and higher precision [Fig. 2(f)-(i)]. The linear regression method conducts phase unwrapping by comparing the phase differences between adjacent points. For the case of low SNR, phase unwrapping may result in a 2π error and consequently a larger linear fitting error. In contrast, the proposed method directly calculates the unknown phase cycles. By combining the results of the spectra with full-length and half-length, the phase cycle jump can be corrected. However, when the error in the low-precision solution exceeds λc/2 with λc of the central wavelength, Eq. (7) introduces an error of λc in the high-precision solution.Conventional SD-OCT is frequently employed for conducting imaging on multi-layer samples using FFT for optical path demodulation. Due to the inherent frequency resolution limitations of FFT, the results of the FFT method show lower precision [Fig. 4(b) and (c)]. When the proposed method is applied to multi-layer samples, it also suffers from frequency resolution limitations. The interlayer spacing must be greater than π/Δk, and the interference spectra must be separated by filtering. The theoretical sensitivity of PSSD-OCT primarily depends on the phase sensitivity. In the case of a common-path configuration, the sensitivity of this experimental system reaches the nanometer level. In the non-common-path configuration, due to the influence of environmental vibrations, the sensitivity reduces to tens of nanometers.ConclusionsPhase wrapping is an inherent issue in optical interference techniques to cause a limited dynamic range in PSSD-OCT. A large dynamic range synthetic wavelength-based phase unwrapping method is proposed to improve the dynamic range in the traditional synthetic wavelength methods. By selecting the full-length interference spectrum and the half-length interference spectrum located in the middle of the spectrometer, the correct integer number of phase cycles is computed. The method combines the demodulation results of the interference spectra with full-length and half-length to eliminate the phase cycle jump that is easily affected by noise. Imaging experiments using a step calibration block, a coin, and a circuit board demonstrate that this method enables high-sensitivity displacement demodulation with a large dynamic range (millimeter-scale).
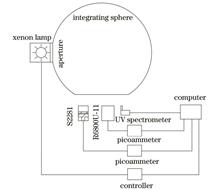
ObjectiveUltraviolet detection technology is widely used in military and civilian fields, playing an important role in missile warning, ultraviolet/infrared composite guidance, detection of solar ultraviolet radiation intensity, ozone detection, biomedicine, and other fields. In recent years, with the development of ultraviolet optical remote sensing detection technology, quantitative research on ultraviolet radiation information has become particularly important. As a type of ultraviolet detector, the solar blind phototube can reduce the impact of out-of-band leakage in ultraviolet radiation measurement, thereby improving the detection accuracy of the ultraviolet band. Based on its characteristics, it is often used in various large military equipment missile approaching warning systems and also commonly used in corona detection to effectively and quickly detect fault locations. In Europe and America, it has been used as a standard power detection method and widely applied in equipment. At present, research on solar blind phototube preparation has gradually begun in China, and the study of its radiation quantification is one of the key links for application. Therefore, in the face of the urgent need for high-precision radiation calibration in the ultraviolet band and the exploration of the application of solar blind photocell, it is necessary to study its response nonlinearity.MethodsThe research on the response nonlinearity of detectors can be divided into two methods:direct method and indirect method. Based on the indirect method, the responsivity standard is transferred to the detector to be calibrated by the standard detector method. The response nonlinearity of the solar blind phototube detection system is studied, and a standard transfer chain based on the detector is established. In terms of the measurement method, we use an external xenon lamp integrating sphere as the radiation source and control the luminous flux of the external xenon lamp entering the integrating sphere through an adjustable aperture. The adjustment of the radiance of the sphere exit portal is achieved and the spectral consistency during the adjustment process is ensured. In this way, the synchronous measurement of the reference detector and the detector to be tested is easy to achieve under the same radiation conditions. In traditional measurement methods, the optical power level of the radiation source is selected with a set of neutral density filters used either one at a time or in combinations of several filters. It needs to construct a dual optical path to achieve synchronous measurement between the reference detector and the detector to be tested. Otherwise, it needs to establish a standard transfer chain by a motor to continuously exchange the positions of the two detectors. Therefore, we provide a new approach for the study of detector response nonlinearity. Compared to traditional measurement methods, the proposed approach simplifies the complexity of the optical path, reduces the strict requirements for the stability of the light source, and eliminates errors and drifts introduced by non-synchronization during the measurement process. In addition, it reduces sensitivity to environmental and interference factors, improves measurement repeatability and accuracy, and obtains more reliable and accurate measurement results.Results and DiscussionsWe first analyze the stability of the xenon lamp light source spectrum, indicating that there is no drift phenomenon in its relative spectral radiance within 2 h. The peak value (wavelength: 308.558 nm) has a relative standard deviation of 0.254% during the measurement period, with little fluctuation. Then, we propose a method for selecting a reference point, and based on the relative error calculated in Table 3, 0.147 is selected as the reference responsivity. Subsequently, we focus on the influencing factors of indirect synchronous measurement and discuss the interference of light source fluctuations and dark background noise on linear measurement devices from the perspective of the correlation between the measured data of the detector to be tested and the reference detector. Results show that the response nonlinearity of the detector to be tested can be studied within a range of 2.97×10⁻¹⁰-6.61×10⁻⁸ A. Finally, based on the principle that the transmittance of the neutral density filter is independent of the radiation output of the light source, we study the nonlinearity of the reference detector responsivity, indicating that its linear error is within the range of 0.69% when the response photocurrent is greater than 1.239×10⁻⁹ A, which can be used as a standard detector with excellent linearity in the ultraviolet band.ConclusionsWe introduce an indirect method to establish a transfer chain based on a standard detector and study the application of the standard detector method in laboratory calibration. Compared to the typical light flux superposition method, this method reduces the tedious measurement procedures and the requirements for light source stability. The experiment adopts an external xenon lamp light source integrating sphere as the radiation source, which has good illumination uniformity and reduces the complexity of the optical path compared to the typical dual optical path measurement method. The research results indicate that the response photocurrent of the solar blind phototube detection system is within 2.97×10⁻¹⁰-6.61×10⁻⁸ A, and its linear error is within 5.2%. The value range of the nonlinear correction factor is 0.948-1.006. The main factor affecting the nonlinear correction factor is the dark background noise of the detector to be tested, and the uncertainty of the measurement system is 3.59% (k=2).
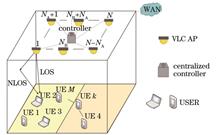
ObjectiveIndoor visible light communication has been widely studied for its simultaneous illumination and secure communication functions. In practical indoor multiple-input and multiple-output (MIMO) visible light communication (VLC) environments, users usually concentrate their work in specific areas, resulting in a non-uniform user distribution. As the number of users increases, the way users tend to access to the nearest access point (AP) may overload some APs, a problem that has rarely been considered in most studies. In this paper, we introduce a backtracking AP assignment scheme using a channel gain weighting model, which aims to balance the distribution of connections between APs and users, thereby reducing the load on APs and increasing the system sum rate. However, the power allocation method using power allocation coefficients designed based on user channel gains cannot meet the communication needs of all users. At the same time, users are subject to interference from other users' signals during the communication process, which may affect the rate that users can achieve, depending on the amount of power allocated to other users' signals. Therefore, the scheme of power allocation by the dimension-by-dimension dynamic cosine algorithm (DDSCA) improved by the optimal parameters r1 combined with the optimal solution direction adaptive exploration strategy is adopted. It redistributes the user's power to solve the problem that each user's achievable rate is lower than the threshold value, which can improve the overall communication performance.MethodsThe non-uniform distribution of indoor users in MIMO scenarios leads to poor user communication quality due to accessing too many users at APs. To this end, we propose a joint AP assignment and power allocation scheme to improve the sum rate of data transmission in the system. A candidate list ℒ is constructed by generating the channel gain weight parameters of users and APs, and all APs are divided into subsets. The performance of the scheme is dynamically explored based on ℒ for users joining each AP subset. Power allocation coefficients are designed during the dynamic exploration of the AP allocation scheme, and the APs allocate the power to the users based on the power allocation coefficients. Then the AP allocation algorithm based on the channel gain weight model backtracking is adopted to balance the connection distribution between APs and users, and the centralized controller controls the APs to provide communication services for different users. In addition, after obtaining the optimal AP allocation scheme, the DDSCA is improved by designing the transformation parameters and the strategy of adaptive exploration in the direction of the optimal solution to satisfy the communication needs of all users.Results and DiscussionsIn the case of non-uniform distribution of indoor users (Fig. 5), the proposed scheme is compared with other schemes under different assumptions. The results show that the proposed scheme outperforms the other schemes in increasing the system sum rate with a larger number of users (Fig. 6). By introducing an improved DDSCA (IDDSCA) for power allocation, it can effectively improve user satisfaction index. In addition, IDDSCA enables all users to reach the achievable rate threshold (Fig. 9), which leads to an increase in the average user satisfaction index. The system sum rate (Fig. 7) and average user satisfaction indices (Fig. 10) are examined for users equipped with receivers having different field-of-view (FOV) angles. It is observed that a larger FOV angle can have a significant impact on the channel gain, resulting in a decrease in the system sum rate. However, the proposed solution effectively mitigates the impact of FOV on the system sum rate and user satisfaction index through dynamic APs and power allocation. In addition, we analyze the effect of the maximum transmit power of the AP on the system performance (Fig. 8), and as the AP transmit power increases from 6 W to 20 W, the proposed scheme increases the sum rate of the system by 15.62%, which shows that the higher transmit power can allow users to ensure stable communication while bringing a higher achievable rate.ConclusionsIn this paper, we study the problem of maximizing the system sum rate and improving the user quality of service in MIMO VLC systems with non-uniformly distributed indoor users. We propose an AP allocation algorithm based on the backtracking of the channel gain weight model so that the user can select the AP that can improve the system sum rate. To improve the system sum rate while meeting the user's communication requirements, it is necessary to allocate the power to the user after the user accesses to the AP. We propose an IDDSCA, which allocates the power to the user to reach the achievable rate threshold. The analysis examines the system sum rate and user satisfaction of the proposed scheme under various environmental assumptions. Simulation results indicate that the improvement in the proposed AP allocation scheme becomes more pronounced as additional users are added, and the improved power allocation scheme can effectively increase user satisfaction.
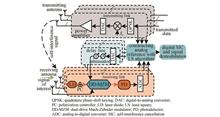
ObjectiveIn-band full-duplex (IBFD) communication technology transmits and receives signals simultaneously in the same frequency bands, theoretically doubling the spectrum efficiency. However, the leakage from the transmitter to the receiver leads to severe self-interference (SI) that must be eliminated. Conventionally, the SI signals are canceled in the electrical domain using electronic circuits, but due to the electronic bottleneck, it is difficult to realize the SI cancellation (SIC) of large bandwidth signals, with poor tunability. Photonics-assisted SIC methods have been proposed to break the electronic bottleneck. Nevertheless, considering multipath SI signals introduced by wireless channels or even complex multiple-input multiple-output (MIMO) scenarios, the existing photonics-assisted analog SIC schemes employ multiple parallel photonic links and a large number of delay and amplitude tuning devices to construct the reference signals for multipath SI signals. This is complex and difficult to track the rapid change of multipath channel response in actual wireless systems. The digital domain method is combined with the photonics-assisted SIC scheme as an auxiliary means to reduce the complexity of constructing the complex multipath SI signals and meet the multipath SIC requirements. However, in the IBFD MIMO system, besides the multipath SI signal, the nonlinear distortion caused by the power amplifier and crosstalk among different transmitting links will bring channel model changes. Till now, the photonics-assisted SIC scheme simultaneously considering the inter-channel crosstalk, nonlinear distortion, and multipath effect has not been studied, which should be urgently studied.MethodsIn IBFD MIMO communication systems, the inter-channel crosstalk, nonlinear distortion, and multipath effect collectively lead to exceptionally complex SI signals. To eliminate the complex SI signals in large bandwidth application scenarios, we propose a least square (LS) algorithm-assisted scheme for the cancellation of MIMO nonlinear SI in the optical domain and combine subsequent digital domain SIC. A continuous-wave light wave is modulated in a dual-drive Mach-Zehnder modulator (DD-MZM) by the received signal and the digitally constructed reference signal. The complex SI in the received signal can be suppressed after the optical signal from the DD-MZM is beaten in a photodetector (PD). To construct the analog reference signal, this method models the MIMO multipath SI signals in the presence of inter-channel crosstalk and nonlinear distortion. The model parameters are estimated by the LS algorithm, and then the analog reference signal for the analog optical domain SIC is constructed via the obtained model. Additionally, we reduce the order of the LS algorithm and improve the reference construction speed by setting a threshold and ignoring the components with low power in the SI signal while ensuring the analog SIC depth. Based on a two-step SIC of digital-assisted analog optical domain SIC and digital domain SIC, the complex SI signals in the IBFD MIMO communication systems can be well eliminated.Results and DiscussionsAn IBFD MIMO scenario with two transmitting antennas is assumed in the experiment. The SI signal has a center frequency of 1 GHz, a baud rate of 0.5 Gbaud, and a signal duration of 3.8 μs. The dominant third-order nonlinear distortion is only considered and the SI signal from each antenna has seven multipath components. The crosstalk coefficient is first set to 0.1. After estimation by the LS algorithm, the tap coefficients of the filter are obtained and then normalized. Based on the normalized tap coefficients, the running time of the LS algorithm is tested. When the threshold of the normalized tap coefficients increases from 0 to 0.2, the running time of the algorithm in MATLAB is significantly reduced from around 0.25 s to 0.07 s. With the increasing threshold, the construction of complex SI signals using the LS algorithm will not be accurate enough, and the cancellation depth of the analog optical domain SIC will decrease from around 27 dB to around 15 dB. However, after further digital domain SIC, the overall SIC depth is around 35 dB, which is similar to that when the threshold is low and the digital domain SIC is also employed. When the crosstalk coefficient is set to 0.3, increasing the threshold of the normalized tap coefficients can also greatly reduce the running time of the algorithm in MATLAB. Due to the large inter-channel crosstalk in this case, which indicates relatively large multipath SI signal power, the effect of analog optical domain SIC does not decrease significantly during increasing the threshold from 0 to 0.2, and the SIC depth of optical domain analog SIC can be maintained at about 28 dB. The experimental results show that a reasonable setting of the order of LS algorithm adopted for analog optical domain SIC can reduce the order of parameter estimation and computational complexity, and improve the construction speed of analog reference signals.ConclusionsWe propose and experimentally demonstrate a low-complexity digital-assisted nonlinear analog optical domain SIC method for the IBFD MIMO communication systems. By utilizing this method, the complex SI signal in the IBFD MIMO communication systems can be well constructed, which can be leveraged for the analog optical domain SIC. Additionally, when the LS algorithm is adopted to construct the analog reference signal, the low-power components in the SI signal are ignored by setting a reasonable threshold to reduce the order of parameter estimation and computational complexity of the LS algorithm and improve reference construction speed. The experimental results show that the proposed method can eliminate the MIMO multipath SI signals with inter-channel crosstalk and nonlinear distortion, and achieve an SIC depth of about 35 dB after analog and digital SIC when the SI signal carrier frequency and baud rate are 1 GHz and 0.5 Gbaud respectively. The proposed method provides a promising solution for the optical domain elimination of complex multipath SI signals in IBFD MIMO communication systems.
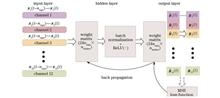
ObjectiveWith the rapid growth of internet traffic, the demand for large transmission capacities from all walks of life has grown dramatically. In the context of limited device bandwidth and high hardware update costs, typical expansion methods include wavelength division multiplexing (WDM) and mode division multiplexing (MDM). At the same time, optical signal impairments caused by devices and fiber optic channels make advanced digital signal processing technology crucial to achieving high-speed fiber optic communications. With the emergence and development of deep learning, equalization based on machine learning has become a hot topic in the field of optical communications. At present, the MDM field mainly uses the intensity modulation direct detection (IMDD) method for experiments and most use a single-channel single-model traditional linear equalizer for channel compensation. However, in scenarios with many mode multiplexing channels and polarization multiplexing, the requirements for nonlinear equalization capabilities are gradually increasing. We adopt WDM, MDM, polarization multiplexing, and advanced digital signal processing technology to construct a homodyne coherent transmission system based on multiple input-multiple output neural network equalizer (MIMO-NNE). We successfully achieve the equalization of 16 channels of 48 Gbaud 16QAM signals after transmitting 100 km of few-mode fiber (FMF) on six modes: LP01, LP02, LP11a, LP11b, LP21a, and LP21b. The bit error rate (BER) of the MDM-WDM system can meet the 15% soft decision forward error correction (SD-FEC) threshold of 1×10⁻².MethodsA 16-channel signal with 50 GHz spacing is generated at the transmitter. The channels are divided into two groups according to odd and even, and each group uses 8 external cavity lasers (ECLs) to couple into optical carriers. After the high-speed signal undergoes the transmitting side digital signal processing(tx-DSP), it is loaded onto the in-phase/quadrature modulator (I/Q MOD) through the arbitrary waveform generator (AWG). A delay line is adopted to divide the optical signal modulated by a single modulator into multiple channels for multiplexing. The odd and even signals are divided into two by a 1×2 optical coupler (OC) respectively and are sent to the polarization multiplexer (PM) after being decorrelated by a delay line, and coupled by a 1×2 optical coupler. After the signal is amplified by an erbium-doped fiber amplifier (EDFA), it is divided into 6 beams by a 1×6 optical coupler, and a delay line is again used to decorrelate LP01, LP02, LP11a, LP11b, LP21a, and LP21b. After being multiplexed by a mode multiplexer, the wavelength division multiplexed signal is transmitted on a 100 km FMF. We use 6-mode EDFA to simultaneously amplify and compensate for each channel mode signal. At the experimental receiving end, after decoupling by the mode demultiplexer, the 6-channel signals pass through a dense wavelength division demultiplexer (DWDM), and an optical switch is applied to gate the 6 wavelengths respectively. Finally, the coherent receiver (CR) performs polarization demultiplexing and homodyne coherent reception. We adopt a real-time digital storage oscilloscope (DSO) to capture the baseband electrical signal and perform offline DSP. In the receiving side digital signal processing (rx-DSP), the precise down conversion (DC) is conducted on signals to compensate for the frequency offset of the system. Then the signals undergo Bessel filtering, resampling, and Gram-Schmidt orthogonalization (GSOP) to solve the problem of IQ imbalance. Additionally, we perform clock recovery (Retiming) to eliminate timing errors and perform chromatic dispersion compensation (CDC). Finally, we adopt the MIMO-NNE to perform channel nonlinear equalization to compensate for nonlinear damage and calculate BER.Results and DiscussionsFigure 5 shows the BER of the traditional MIMO-LMS algorithm and the proposed MIMO-NNE algorithm under different 6-mode EDFA current. MIMO-NNE algorithm has an average bit error gain of about 0.02 compared to MIMO-LMS algorithm. At the same time, MIMO-NNE algorithm can make the BER of 16QAM transmitted over 100 km lower than the 1.0×10⁻² SD-FEC threshold. Fig. 6 shows the convergence process of the mean square error (MSE) of MIMO-NNE algorithm and MIMO-LMS algorithm under an approximate iteration data amount. MIMO-NNE algorithm has better convergence performance than MIMO-LMS algorithm. As shown in Figs. 7 and 8, the difference in BER of each mode and different wavelength sub-channels is not significant. At the same time, the BER of each channel in 100 km transmission is lower than the 1.0×10⁻² SD-FEC threshold.ConclusionsIn this study, we experimentally build a 6-mode 16-wavelength dual-polarization homodyne coherent transmission system. At the receiving end, the MIMO-NNE based on multi-label technology is used for channel equalization. When transmitting 100 km, the total system rate reaches 36.864 Tbit/s. With the help of MIMO-NNE, the MDM-WDM system BER can meet the 15% SD-FEC threshold of 1×10⁻². The experimental results confirm the nonlinear equalization potential of MIMO-NNE in future high-capacity long-distance transmission systems.
ObjectiveThe growing emphasis on renewable energy sources in sustainable societies is evident, indicating a shift towards cleaner energy solutions. Solar photovoltaic modules harness solar radiation to generate electricity and meet the power requirements for the normal operation of instruments and devices. Typically, there are two primary approaches to increasing electricity generation, including using high-efficiency solar panels and expanding the deployment areas of solar arrays. However, the former approach has limitations in improving efficiency, while the latter significantly increases the satellite launch cost. Non-imaging solar compound parabolic concentrators have caught considerable attention due to their efficient and stable operation, easy construction, and compatibility with satellite systems for reducing energy costs and improving the effective payload capacity of satellites. The utilization of solar concentrators in satellite systems enhances sunlight capture by solar wings, thus increasing energy output, reducing weight and volume, improving the stability and durability of solar panels, and expanding the application range of concentrators. Taking these advantages into account, we design a truncated compound planar concentrator for the operational characteristics of solar wings. Coupled with real-time sun-earth distance, earth-satellite space relationships, and solar radiation theory, a model for receiving solar radiation by solar wings is developed. The findings provide valuable insights for the structural design and optimization of solar wings.MethodsFirst, via carefully analyzing the shortcomings of traditional S-CPC systems, a TMS-CPC surface structure is designed based on the edge-ray tracing principle, and its three-dimensional geometry is modeled by software. Meanwhile, a scaled-down model is built using 3D printing technology to verify the focusing performance of the constructed TMS-CPC. In the ground laboratory, parallel lasers are employed to simulate sunlight and enable visual ray tracing of the coupled TMS-CPC system. This allows for observing and recording the concentration process and characteristics of TMS-CPC on "solar rays". Simultaneously, optical simulation software is adopted for ray tracing simulations, and the obtained experimental values are compared and analyzed against the simulated values to validate the model reliability. Secondly, by considering the spatial relationships among the sun, the earth, and the satellite, a real-time distance model is built. The solar radiation amount received by the solar wing can be calculated via spatial radiation theory. Simulations and analyses are conducted using the Satellite Tool Kit (STK) to study the characteristics of solar wing reception of solar radiation based on a congruent concentrating surface.Results and DiscussionsDuring the laser validation experiment of the solar wing TMS-CPC, factors such as the laser divergence angle, high reflectivity of the flexible reflective membrane, and manufacturing errors associated with 3D printing all affect the experimental results. However, in this scenario, the simulated values of the concentrating performance of the solar wing TMS-CPC tend to align with the experimental values, with a maximum average absolute error of 1.49 mm and a minimum of 0.75 mm (Fig. 3). When the incident angle of the light exceeds 6°, optical efficiency decreases within the TMS-CPC system (Fig. 4). A comparison between the theoretical and simulation values of solar radiation on the solar wing, along with the satellite exposure characteristics, reveals an average absolute error of only 0.04 W/m2 in the radiation model calculation values and 18.2 s in satellite exposure characteristics (Fig. 7 and Table 1). During variation analysis in energy flux density on the solar surface with different incident angles of sunlight, it is observed that in the constructed solar wing TMS-CPC system, when sunlight is incident vertically (at an angle of 0°), the energy flux density on the surface of the solar panels is symmetrically distributed on both sides of the central axis. However, when sunlight is incident at angles within the acceptance half-angle (0°, 1°, and 2°), the peak energy flux density increases with the rising incident angle, while the average energy flux density remains constant (Fig. 8). The closer distance of the incident angle to the acceptance half-angle leads to more uniform distribution of energy flux density on the solar panel surface (Fig. 9). Theoretical peak power generation with the solar wing TMS-CPC is approximately 87% higher than that of traditional solar wings. However, there is a reverse trend in power generation with variations in sun-satellite distance (Fig. 10).ConclusionsOur study is based on the edge-ray tracing principle to construct a truncated structure compound planar concentrator TMS-CPC, and incorporates real-time sun-earth distance calculations, earth-satellite spatial relationships, and solar radiation theory to build a model for solar radiation reception by solar wings. Laser experiment results show that the experimental data are in good agreement with the simulation results, thereby confirming the reliability of the built model. The solar wing TMS-CPC expands the acceptable angle range beyond that of the conventional S-CPC, providing sufficient error margin in satellite tracking systems. Significantly, within the acceptance half-angle range, the average uniformity index on the solar panel surface reaches 0.615, greatly enhancing its capability to capture solar radiation. During one orbital cycle, the satellite predominantly stays in the sunlit region, ensuring favorable conditions for photovoltaic components of the solar panels and guaranteeing the satellite's long-term stable operation. This reduces energy costs and enhances overall economic benefits for satellites. Numerical simulations of power generation from a single solar wing coupled with TMS-CPC, along with a comparative analysis against traditional solar wings, illustrate that the built model effectively enhances theoretical power generation.
ObjectiveDisplay technology is essential for human beings to obtain information. In display technology, holographic display is considered the most influential display technology, as it can reconstruct all the information of real or virtual scenes without visual fatigue. Color holographic display is a significant technology that can record and reconstruct the color and three-dimensional (3D) information of the original object. Compared with monochrome holograms, color holograms can reflect the real information of objects, having a more wide application. In this paper, we propose an iterative method for generating multiplane color phase-only holograms based on time-division multiplexing. This method is based on the Gerchberg-Saxon (GS) algorithm. When holograms are recorded, amplitude constraints are imposed on each channel plane, which is repeated. The red (R), green (G), and blue (B) channel information of color images is recorded in three phase-only holograms respectively. During reconstruction, RGB channels overlap at the same distances, and the target color images are reconstructed. The reconstruction results of one, three, and five color images are displayed. Compared with the deep-division multiplexing (DDM) method, the quality of reconstructed color images by the proposed method is improved, and the crosstalk between different channel planes is effectively avoided. Numerical simulation and optical reconstruction results prove the effectiveness of the proposed method.MethodsThe red, green, and blue channels of color images are set to the same distances when encoding in this study. When recording, we set the amplitude of the initial holograms of three-color channels as a constant of 1 and the phase as a random. When the wavefront propagates to the object plane through angular spectrum diffraction, its amplitude information is replaced by the amplitude of the object plane. The amplitude constraint is relaxed by applying a small nonzero value to the zero-intensity region of the object plane, and the phase is preserved. The wavefront continues to propagate backward, and the amplitude in the hologram plane is replaced by a constant of 1. The phase is preserved, and the process is repeated. Eventually, their three-color channel information is recorded in three holograms respectively. When reconstructing, the three-color channels of the color images are reconstructed at the same distances, and then the color images are reconstructed. When the wavefront propagates to the object plane through angular spectrum diffraction in holographic recording, a small nonzero value is applied to it to relax the amplitude constraint of the object plane. In holographic reconstruction, the original color images are reconstructed at a set distance. It can effectively reduce the speckle noise of the target color images by padding with zeros to the original images. As laser speckle often reduces the quality of the reconstructed images in optical experiments, we adopt the time averaging method. Through the time integration effect, the intensity information of reconstructed images of multiple holograms is superimposed to suppress speckle noise. For the optical reconstruction system, the chromatic aberration caused by the objective lens may lead to different image sizes in red, green, and blue channels. In this study, we construct an optical system with achromatic optical elements to avoid the problem of inconsistent size and distance of reconstructed images.Results and DiscussionsOur proposed method shows excellent performance in both numerical simulation and optical experiment (Fig. 6). The proposed method and DDM method can reconstruct the single-color image well. However, the original color image reconstructed by the DDM method has color deviation, which may be caused by the hologram recording images of different color channels during recording. The original color image can be reconstructed well by our method. We introduce the correlation coefficient as an index to measure the quality of color image reconstruction. The correlation coefficient values of our proposed method in reconstructing single and multiple color images are higher than those of the DDM method (Fig. 7). The DDM method reconstructing multiplane color images is very limited. When recording holograms, we need to keep multiple color channels at different distances, whereas this work will be very hard within a limited calculation distance. Eventually, crosstalk will inevitably occur between different channels, leading to color deviation. Because reconstructing n color images will eventually reconstruct n×3 channels, the possibility of crosstalk between different channels greatly increases. However, when we reconstruct n color images, only n channels will be reconstructed. Our method can reconstruct more color images, but we need to pay attention to the distance setting between different images to avoid crosstalk.ConclusionsIn this paper, we propose a phase-only hologram generation method for reconstructing multiplane color images. In holographic recording, the red, green, and blue color channels of color images are recorded in three holograms respectively, and finally, the original color images are reconstructed at the set distances. The traditional DDM method needs to record multiple information of different color channels when encoding. Therefore, the quality of the reconstructed images is poor and crosstalk occurs. Our method effectively avoids crosstalk between different planes by setting the distance between different planes reasonably during recording. When reconstructing multiplane color images, it can still maintain high quality. The correlation coefficients of our proposed method are significantly higher than that of the DDM method when reconstructing single and three images. Both numerical simulation and optical experiment results show the novelty and effectiveness of our proposed method.
ObjectiveGray level residual (GLR) field refers to the intensity differences between corresponding voxel points in the digital volume images acquired before and after deformation. Typically, internal damage in materials induces substantial variations in grayscale values between corresponding voxel points. Therefore, the GLR field helps to reveal the damage location. In the finite element-based global digital volume correlation (DVC) method, the GLR field, as the matching quality evaluation criteria, can be readily calculated and has been employed to characterize the evolution of internal cracks. However, the widely used subvolume-based local DVC, which can output displacement, strain, and correlation coefficient at discrete calculation points, cannot obtain the GLR directly. Compared with correlation coefficient and deformation information, the GLR field achieves voxelwise matching quality evaluation, thus demonstrating superior performance in visualizing internal damage. Therefore, accurate GLR calculation in local DVC is undoubtedly valuable in compensating for its shortcomings in fine-matching quality evaluation and expanding its applications in internal damage observation and localization.MethodsThe GLR field is obtained by subtracting the reference volume image from the deformed volume image after full-field correction. The key of its calculation is to utilize the continuous voxelwise data, including contrast and brightness correction coefficients and displacement, to correct the deformed volume image. In this work, a dense interpolation algorithm based on finite element mesh is adopted to estimate the voxelwise data within the volume of interest (VOI). 3D Delaunay triangulation algorithm is first utilized to generate tetrahedron element mesh from the discrete calculation points, and then the data of voxel points inside each tetrahedron element can be determined with the shape function of finite element. After acquiring the voxel-wise data of VOI within the reference volume image, the corrected deformed volume image can be reconstructed. Given that the corresponding voxel points in the deformed volume image normally fall into the subvoxel positions, a subvoxel intensity interpolation scheme is required during the calculation of correlation residual in local DVC. In this work, the advanced cubic B-spline interpolation method is adopted to estimate the grayscale of the corrected deformed volume image. In addition, a simulated mode I crack test and a tensile test of nodular cast iron are carried out to verify the feasibility of the GLR field based on local DVC and the reliability and robustness in damage observation and detection.Results and DiscussionsIn simulated mode I crack test, the results show that the uncorrected GLR field still keeps a higher grayscale even in the region away from the crack compared with the corrected GLR field (Fig. 7), which degrades the damage observation and location. Therefore, contrast and brightness correction are necessary during the calculation of the GLR field. The crack plane can be detected clearly from the GLR field after threshold processing, and the position of the crack plane is very close to the preset value (Fig. 7). The proposed GLR based on local DVC effectively eliminates the influence of contrast and brightness changes and achieves precise crack location. Additionally, more information about the damage can be acquired from the GLR field. The crack morphology and orientation can be determined from the slice image at y=40 voxel in the real test. Besides, the debonding between the nodular graphite and matrix can also be detected roughly from the GLR field (Fig. 10). It should be noted that the GLR field after post-processing can only reflect the approximate morphology of damages and fails to reflect the opening of crack and debonding accurately since the interpolation used in displacement correlation may enlarge the region with damage. Despite all this, the location and morphology of damages extracted from the GLR field are helpful in understanding the fracture mechanics properties of nodular graphite cast iron.ConclusionsA simple and practical method for GLR field calculation based on post-processing of local DVC measurements is proposed. The method addresses the limitations of existing local DVC in fine-matching quality evaluation. Compared with correlation coefficient and deformation information, the GLR field not only accurately reflects the location of internal damage but also facilitates visual observation of internal crack morphology and interface debonding behavior. It holds the potential for broader applications in visualizing and precisely locating internal damage within materials and structures.
ObjectiveAs the number of spectral channels significantly affects the system complexity, data load, time resolution, and spatial resolution of images, a multispectral color imaging system that aims to accurately reproduce the visible spectrum reflectance of object surfaces is preferred using a limited number of spectral channels. However, seldom literature has been explained statistically for the determination of numbers of spectral channels. The heuristic or even arbitrary number of spectral channel configurations challenges the purpose of multispectral color imaging for accurate spectral reconstruction and color reproduction. It is even more crucial with the emergence of various modalities of color imaging sensors, such as those of with liquid crystal tunable filters (LCTFs) and multispectral filter arrays (MSFAs) and recently developed nanostructure color filters. Previous evidence shows that the spectral transmittance of the optimal filter set for multispectral color cameras is Gaussian curves. We build upon the previously proposed multi-objective optimization method for filter selection with specific channels and systematically explore the way to determine the optimal number of spectral channels for typical multispectral color imaging systems with filters modeled by Gaussian functions.MethodsThe workflow for optimizing the number of spectral channels in the multispectral color imaging system studied in this research is illustrated in Fig. 1. Firstly, we provide a systematic theoretical presentation of the spectral sensitivity optimization by filter selection for the broadband multispectral imaging and the method for the channel numbers optimization, which could scarcely be found in the literature published so far to the best of our knowledge. The highlight of the proposed method is built upon the previously proposed multi-objective optimization method for filter selection, and we systematically explore the way to determine the optimal number of spectral channels for typical multispectral color imaging systems. Then, we investigate the optimal number of channels experimentally. Using the Munsell spectral reflectance dataset to construct the spectral imaging targets, imaging simulations and reflectance reconstruction under 10 noise levels are conducted by the spectral sensitivity of an actual CCD image sensor, the spectral distribution of the D65 illuminate, and the transmittance curves of the filters generated by Gaussian filter model. it involves 29 virtual multispectral cameras, or in other words, the channel numbers are 3-31, respectively.Results1) Determination of the optimal number of channels. The optimal filters' serial numbers and the corresponding accumulative scores under different channel numbers are presented in Table 1. Figure 3 illustrates the concentration index of multi-objective functions (CMFs) under different channel numbers. Moreover, Fig. 4 depicts the performance of the best filter sets in terms of CIEDE2000 and MSE, respectively, under different channel numbers. Additionally, Fig. 5 displays the accumulative scores of the best filter sets' performance within the 29 numbers of channels.2) Characterization of the filter set with the optimal channel number. The optimal number of channels for a multispectral color imaging system is 5 (Fig. 6) when the maximum number of channels is not greater than 8. Figure 7 presents the transmittance curves of the optimal Gaussian filter sets with five and nine channels, respectively. Table 3 presents the characteristics of the optimal Gaussian filter sets with five channels under two different illuminates. Table 4 compares the performance indices of the optimal Gaussian filter sets with five channels under different illuminates.ConclusionsFrom the results, the following six items could be concluded: 1) For broadband multispectral color imaging, increasing the number of channels does not always lead to an improvement in spectral reconstruction accuracy. It is observed that a smaller number of spectral channels has the potential to simultaneously satisfy the requirements of color difference reproduction and spectral reconstruction error accuracy; 2) By employing the multi-objective optimization method within the optimal filter range for each channel, that is to say, extending the concept of CMF, a unique optimal number of channels can be obtained; 3) In general, a higher noise level (i. e., a lower signal-to-noise ratio) often indicates worse performance indicators, but the specific performance indicators may exhibit varying nonlinear characteristics with the noise; 4) CIEDE2000 is more sensitive to noise when compared to the relevant indicators, MSE and PSNR, as indicated in Fig. 7, and the latter two are more discrete; 5) Based on the principles of multi-objective optimization in this study, the optimal number of spectral channels for Gaussian filters with less than eight channels is 5 under the illuminant D65. Moreover, compared with illuminant A, D65 enhances the performance of the Gaussian filters with five channels in terms of spectral reconstruction and color reproduction; 6) Optimal filters with the same number of channels may differ under different spectral distribution light sources. Differences can be observed in terms of the geometric characteristics of transmittance curves, primarily the varying bandwidths. Furthermore, significant differences can be observed in performance, including color reproduction and spectral reconstruction.Briefly, the spectral transmittance of the optimal color filter set can be described by a series of Gaussian curves, and the number of spectral channels significantly impacts its performance and complexity. We systematically explore the way to determine the optimal number of spectral channels for typical multispectral color imaging systems. It would be of great theoretical and practical significance to model the spectral channel of color imaging systems with different physical modalities as Gaussian spectral channels and then explore the necessary color filter channels to optimize multi-spectral color imaging systems.
ObjectiveLiquid crystal lens is an emerging liquid crystal device that can be electrically controlled to modulate the focus, zoom, and depth measurement without mechanical movement, and thus it is widely employed in many fields such as photographic camera, microscopic imaging, and virtual reality. Due to the anisotropy of the liquid crystal material, the liquid crystal lens can only modulate the extraordinary ray, and the ordinary ray is not modulated, which causes reduced image contrast. Optical imaging systems of liquid crystal lens can be retrofitted with polarizing devices to remove the ordinary ray component of the incident light. However, the utilization of polarizers drastically reduces the optical flux and degrades the imaging quality. Additionally, there are three main polarizer-free imaging techniques. The first one is to adopt blue-phase liquid crystals instead of nematic-phase liquid crystals to prepare liquid crystal lenses. However, the blue-phase liquid crystal features small birefringence effect, narrow temperature range, and high voltage, and has not yet reached the practical level. The second is to leverage multilayer liquid crystals instead of single-layer liquid crystals to modulate the two components of incident light. However, the multilayer liquid crystal structure increases the thickness and fabrication cost of the device. The third one is to apply a polarizer-free imaging algorithm and an innovative combination of unsharp masking models to acquire high-quality images.MethodsThe non-ideal low-frequency component introduced by the unmodulated extraordinary ray is decreased by utilizing an optical imaging system of liquid crystal lens with a polarizer-free device to acquire one focused image and one unfocused image respectively and perform image processing on the two images. Meanwhile, the unsharp masking model for polarizer-free imaging is proposed to analyze pixel value changes of the images to estimate the percentage of the ordinary ray component, and then the unfocused and focused images are adopted to obtain a high-contrast image.Results and DiscussionsThe optical properties of the liquid crystal lens in the experiment are examined. The experimental results show that the optical focal length is linearly related to the optical aberration of an ideal glass lens. Additionally, the liquid crystal lens is close to the ideal optical aberration of a glass lens with high imaging quality, and can be adopted as a focusing unit in the imaging system (Fig. 7). A polarizer is placed in front of the liquid crystal lens to remove the ordinary ray component in the incident light, and different voltages are applied to the ends of the liquid crystal lens to capture the ISO 12233 chart. The fMTF50 is to characterize the resolution capability of the system and evaluate the image quality to determine the optimal operating voltage value (Fig. 10). Meanwhile, we adopt fMTF50 to characterize the system's resolving power, evaluate the image quality, and then determine the optimal operating voltage value (Fig. 10). Focus and non-focus images are captured, the values are set to process the two images, and the unsharp masking model is adopted for edge detection, with observations conducted on whether there is any abnormal "depression" and "bulge". The polarization direction of the incident polarized light is detected and recorded (Table 1). The relationship between the polarization angle and the ideal and actual values is plotted, and the values obtained by experimental measurements are near the ideal value curve, which indicates that the experimental method can obtain the actual values more accurately and process the images (Fig. 14). Meanwhile, we photograph the actual scene and process the image, and the image obtained by the imaging method of polarizer-free liquid crystal lens is clear and natural with high contrast. The value calculated by the unsharp masking model can be applied to the actual measurement (Fig. 16).ConclusionsWe propose a polarizer-free imaging technique of liquid crystal lens based on the unsharp masking model and experimentally verify the feasibility of the technique. The technique combines the unsharp masking model in image processing to estimate the proportion of the ordinary ray component in ambient light by analyzing the changes of the image pixel. Then, this value is employed to process the focused and unfocused images to reduce the non-ideal low-frequency component introduced by non-modulated unusual light and obtain a natural high-quality image. Additionally, values of the ratio of the o-light component are obtained by simulating the ambient light incidence conditions with different polarization directions, and the experimental results are consistent with the theoretical analysis.
ObjectiveSpectral computed tomography (CT) is a technology that utilizes the differences in attenuation coefficients of substances across different channels, which can demonstrate significant capabilities in material identification and analysis. Particularly, photon-counting spectral CT, which significantly curtails electronic noise and enhances resolution, signifies the latest technological advancements in CT imaging. However, effects such as photon starvation, charge sharing, and pulse pile-up engender severe noise in photon-counting spectral CT, directly undermining the image reconstruction quality and hampering the applications of photon-counting spectral CT technology. Our paramount research focus lies in accurately characterizing the statistical properties of projection data noise in photon-counting detectors, designing precise spectral CT reconstruction algorithms, and suppressing noise.MethodsInitially, a theoretical analysis is conducted on the statistical noise characteristics in the projection data of photon-counting detectors. Specifically, by comprehensively considering the statistical distribution of photon flux and electronic noise in the projection data, where photon flux can be characterized by a compound Poisson distribution and approximated by a Gamma distribution, and electronic noise follows a Gaussian distribution. A theoretical noise distribution model of projection data is derived by the Bayesian formula. Subsequently, a statistical inference is carried out on the proposed theoretical noise distribution model of projection data. On the one hand, the probability distribution of the noise is fitted via actual data experimentation. On the other hand, a goodness-of-fit test is conducted on the theoretical noise distribution model. Ultimately, by adopting time series analysis for prediction, the predicted values are employed to restore outliers in the projection data.Results and DiscussionsWe derive a rigorous theoretical noise distribution model in photon-counting spectral CT projection data (Eq. 9), bearing a similar expression to the univariate p-norm distribution. The rationality of characterizing the noise distribution of projection data using univariate p-norm distribution is then analyzed from three perspectives. By fitting the probability distribution of the actual data, the proposed univariate p-norm noise distribution model aligns more closely with the actual data than Gaussian, Poisson, and Gamma distributions, especially under extremely low photon flux, and the fitting degree of the proposed noise distribution model is optimal (Fig. 2). A goodness-of-fit test is conducted on the proposed noise distribution. The results are shown in Table 1. The proposed noise distribution is consistent with various collected datasets and consistency is the best in datasets with low photon flux. Lastly, the restoration of outliers using predicted values shows clear improvement from both visual images (Fig. 4) and quantitative assessments (Table 2). The proposed univariate p-norm distribution aptly characterizes the statistical properties of photon-counting spectral CT. However, the probability density function of the univariate p-norm distribution is challenging to calculate, and it should be transformed into a linear combination of Gaussian distribution and Laplace distribution for approximation, according to the p-value selection.ConclusionsWe investigate the statistical noise characteristics in the projection data of photon-counting spectral CT, and propose to employ univariate p-norm distribution to model the projection data noise. The distribution is verified by fitting actual data probability density functions and statistical inference tests. The univariate p-norm distribution can fully characterize the statistical law of observational errors. Especially under the insufficient number of photons, the univariate p-norm distribution can reach optimal when fitting the actual data distribution. The statistical probability model of projection data from the devised photon-counting detection system allows for an in-depth analysis of the system performance and accurate noise simulation during simulation experiments, and provides an accurate objective function for optimizing the likelihood functions in statistical iteration reconstruction. We explore the statistical noise characteristics of projection data in photon-counting detectors, enrich the theoretical results of X-ray spectral CT imaging systems, and provide theoretical support for the design and optimization of multi-spectral image reconstruction.
ObjectiveIn the precision polishing stage of optical element processing, optical interference detection methods are often employed to detect the surface shape and transmitted wavefront. Among them, the shearing interference method is a measurement technology that adopts its light wave and copied light wave, and there is a dislocation between the light wave and copied light wave in space, which makes it unnecessary to introduce the reference light wave. At present, the synchronous phase-shifting technology is the interference measurement method with the best anti-vibration effect. It can obtain multiple phase-shifting interferograms spontaneously, and then adopt the phase-shifting algorithm to restore the wavefront information to be measured. The combination of shearing interferometry and synchronous phase-shifting technology can realize the absolute common optical path phase-shifting measurement of the phase to be measured and remove the influence of environmental vibration and air disturbance on the interferometry. The study of synchronous phase-shifting shearing interferometry is significant for detecting transmission wavefront pairs and the surface shape of optical elements. In the wavefront measurement, due to the influence of the surface error of the reference mirror, insufficient utilization of light energy, environmental vibration, and air disturbance on the interference measurement results, we propose a synchronous phase-shifting shearing interferometry method based on polarization grating splitting. This can achieve high-precision detection of transmission wavefront and reflection wavefront.MethodsThe proposed method is based on polarization grating beam splitting to achieve the wavefront test method of synchronous phase-shifting shearing interference, which can be utilized to test the transmission wavefront. The shearing module is a reflective transverse shearing structure composed of a polarization grating, a plane mirror, and a quarter wave plate. The polarization grating is a diffractive optical element that realizes selective beam splitting based on the polarization state of the incident light. The beams carrying the wavefront to be measured are divided into two orthogonal circularly polarized beams by the polarization grating, and then transverse shearing occurs again after being reflected by the plane mirror via the polarization grating. The orthogonal polarized light with certain transverse shear is formed after passing through a quarter wave plate. The phase-shifting module adopts a synchronous phase-shifting structure composed of a two-dimensional phase grating, a small aperture diaphragm, and a phase delay array. The orthogonal linearly polarized light is diffracted by the two-dimensional phase grating, and the diffracted light of (±1, ±1) order is selected by the small aperture diaphragm. Then the phase shifting is generated by the phase delay array, and the interference occurs after passing through the linear polarizer. The vertical phase-shifting shearing interferogram can be obtained by rotating the polarization grating. Meanwhile, via adopting the transformation of the test scheme, the surface wavefront generation module of the optical element is added in front of the shear module, which can detect the surface shape of the optical element. For the shearing interference fringes in x and y directions collected by CCD, the image registration algorithm based on phase correlation, the four-step phase-shifting algorithm, and the phase unwrapping algorithm based on DCT are leveraged to obtain the phase distribution to be measured. Subsequently, the wavefront to be measured is reconstructed by the least square wavefront reconstruction algorithm based on differential Zernike polynomials.Results and DiscussionsWe build a phase-shifting shearing interferometer based on polarization grating on the optical platform of the laboratory, and measure a lens with a diameter of 25.4 mm and a focal length of 50 mm. The PV value of the wavefront to be measured is 0.5366λ and the RMS value is 0.1519λ (Fig. 7). The results are compared with the measured results of the SID4 wavefront sensor (Fig. 8), which proves the accuracy of this method. The repeatability experiment proves the stability of the measurement results of this method. Then, we construct a measuring device of optical element surface shape based on polarization grating synchronous phase-shifting shearing interferometry on the optical platform of the laboratory. A concave mirror with a diameter of 25.4 mm and a focal length of 50 mm is measured. The PV value of the wavefront to be measured is 0.6044λ and the RMS value is 0.1669λ (Fig. 13). The comparison experiment with the measurement results of the SID4 wavefront sensor (Fig. 14) and the repeatability experiment are also carried out. This can verify the accuracy and stability of the measurement results of the synchronous phase-shifting shearing interferometry based on polarization grating.ConclusionsA phase-shifting shearing interferometry based on polarization grating splitting is studied to detect the transmission wavefront and the surface shape of optical elements. The method employs a reflective shearing structure based on polarization grating splitting, with a compact and flexible optical configuration. Compared with traditional grating, the polarization grating has ultra-high diffraction efficiency, the energy of the two beams is uniform, and the light energy utilization is high. By combining shearing interference with synchronous phase-shifting technology, the quasi common path phase-shifting measurement of the wavefront to be measured is realized, which removes the influence of environmental vibration and air disturbance on the interferometry. The shearing interferograms in X and Y directions are processed by the image registration algorithm based on phase correlation, and the four-step phase-shifting algorithm and phase unwrapping algorithm based on DCT are adopted to obtain the shearing phase distribution. Then the wavefront to be measured is reconstructed by the least square wavefront reconstruction algorithm based on differential Zernike polynomials. The results show that the measurement results of this method are accurate and stable, and can achieve high-precision wavefront dynamic measurement, which is of significance for detecting the surface shape and transmission wavefront of optical elements.
ObjectiveAs an important part of optical materials, optical transmission materials are widely employed in optical display and optical communication, and their optical properties play a key role in the whole optical system. The optical properties of optical transmission materials mainly include optical uniformity, optical thickness, surface shape, fringes, and bubbles. The optical parallel plate is strictly controlled by its design parameters. If the optical uniformity, optical thickness, surface shape, and other optical parameters of the plate are inconsistent, the optical wave front will be changed when the light wave passes through, thus degrading the optical system performance. Therefore, the optical uniformity, thickness, and surface shape of optical materials are significant performance indicators for high-precision optical systems. To solve the problem of slow speed, low efficiency, and small measurement range of optical parameters of parallel plates with different thicknesses, we propose a wavelength phase-shifting interferometry method based on characteristic polynomial.MethodsThis method combines the two-step absolute measurement method to carry out theoretical research on multi-surface interference technology. Then we design a weighted multi-step wavelength shift algorithm based on the feature map and feature polynomial theory, which is employed to extract and calculate the surface shape, optical thickness changes, and optical uniformity information of the plate. The specific process is as follows. The evaluation function and Fourier expression of the phase-shifting algorithm show the immunity of the algorithm to the errors. Finally, the algorithm is compared with the OPL algorithm. Firstly, the two-step absolute measurement method is combined with the theoretical research on multi-surface interference technology. Then a weighted multi-step wavelength phase-shifting algorithm is designed based on the feature map and feature polynomial theory, which is adopted to extract and calculate the surface shape, thickness changes, and optical uniformity information of the plate surface. The evaluation function of the phase-shifting algorithm and its Fourier expression are utilized to show the immunity of the algorithm to errors. Among them, the weighted multi-step wavelength shift algorithm based on the characteristic polynomial theory is designed as follows. First, the measured plate is placed in an interference cavity, and 77 interferograms are obtained by wavelength-tuned phase-shifting interference. The superimposed interference region of each interferogram is composed of six groups of first-order interference fringes. According to these interferograms, the feature graphs are designed and the corresponding feature polynomials are written. The characteristic polynomial is polynomial expanded, and the sampling amplitude is obtained by simultaneous solution combined with the relative frequency amplitude of the target information. The phase information is obtained by taking the two into the phase calculation formula, and the corresponding wave front information is obtained after the phase information is unpacked and de-tilted. Then, the measured plate is removed for cavity measurement, and the cavity phase information obtained by cavity measurement is unpacked and de-tilted to obtain cavity wavefront information. Finally, the optical uniformity of the parallel plate can be obtained by bringing the information of the two wave fronts into the calculation formula.Results and DiscussionsThe proposed method features high speed and high precision in measuring the optical uniformity of parallel plates with different thin thicknesses. The PV and RMS errors of the 77-step phase-shifting algorithm and OPL algorithm are in the order of 10-8, and the PV errors of the surface shape and optical thickness changes are within λ/100. The PV and RMS errors calculated for the optical uniformity of parallel plate are in the order of 10-7, and the PV errors of surface shape and optical thickness are within λ/100. The data show that the calculation results of the two methods are basically consistent, and the measurement accuracy of 40 mm parallel plate is slightly higher than that of 5 mm parallel plate (Table 4). However, the 77-step algorithm is much better than the OPL algorithm in computational efficiency and speed because the required number of interference samples is much smaller than that of OPL algorithm (Table 5).ConclusionsWe study a multi-step wavelength phase-shifting algorithm based on the characteristic polynomial theory. Based on the conventional phase-shifting algorithm and the characteristic polynomial theory, three groups of 77-step algorithms are designed according to the target requirements for measuring and calculating the surface shape, optical thickness changes, and optical uniformity of parallel flat surfaces. Additionally, the evaluation function diagram of the algorithm is drawn to show the sensitivity and immunity of the algorithm to errors. The measurement results show that the 77-step phase-shifting algorithm can suppress harmonic errors, phase-shifting errors, and other coupling errors. Meanwhile, the algorithm requires fewer interferograms with high detection efficiency, takes into account the computational efficiency with high precision, and is suitable for optical parameter measurement of parallel plates with different thicknesses. The problems are solved such as the large number of interferograms required by existing algorithms, large computational amount, partial error compensation, and sensitivity to harmonic frequency mismatch or deviation.
ObjectiveKnown as the digital speckle correlation method, the digital image correlation method is a non-contact optical measurement method. The deformation information of the region of interest is obtained by correlation calculation of two digital images before and after the specimen deformation. DIC method is mainly composed of integral pixel displacement search and sub-pixel displacement iterative calculation, among which the commonly adopted sub-pixel displacement calculation methods include surface fitting, gray gradient, Gauss-Newton (G-N) method, Newton-Raphson (N-R) method, and inverse compositional Gauss-Newton (IC-GN) method. In sub-pixel displacement search algorithms, N-R and G-N methods as second-order nonlinear optimization methods have faster convergence speed and global optimal solutions. However, in the G-N method, when the Hessian matrix is approximately non-positive definite, the error of solving the inverse matrix will increase to result in incorrect final solution results. Additionally, when the texture features of speckle images are weak and the deformation amount is large, the error of solving the inverse matrix will rise. The whole pixel displacement search algorithm can not provide accurate initial value estimation, and eventually, the calculation fails. Since the inverse compositional algorithm has higher computational efficiency than these algorithms, it is employed to calculate the displacement field of speckle deformation images by sub-pixel displacement, with several algorithms explored.MethodsThe inverse compositional diagonal approximation algorithm and the inverse compositional Dog-Leg algorithm adopting to image matching are applied to the displacement field calculation of speckle images, and the parameter update strategy of the inverse compositional Levenberg-Marquardt algorithm is simplified. By the compression deformation experiment of the memory simulation speckle image and the real speckle image, the performance of these three algorithms is explored from three aspects including convergence speed, convergence evaluation rate, and computation speed. In terms of convergence rate, the speckle image is evaluated in different displacement and Gaussian noise conditions. The convergence speed and calculation speed are evaluated by different small windows and with or without Gaussian noise. Finally, three algorithms are utilized to measure the deformation of the rubber block and compared with the open-source software Dice.Results and DiscussionsAccording to the speckle simulation deformation experiment, the convergence speed and final calculation accuracy of several first-order algorithms are almost the same, and in simple rigid body translation deformation, the convergence speed and final calculation accuracy of the first-order algorithm are higher than those of the second-order algorithm. Generally, the convergence speed and the final calculation accuracy of the second-order algorithms IC-LM2, IC-DogLeg2, IC-Diag2, and IC-GN2 decrease from high to low values. In terms of convergence speed, the convergence frequency of the first-order algorithm is higher than that of the second-order algorithm. When the displacement is less than five pixels, several algorithms can successfully calculate the displacement of all POI, and the convergence frequency gradually decreases with the increasing deformation. In the second-order algorithm, the convergence frequency of IC-Diag2, IC-DogLeg2, IC-LM2, and IC-GN2 algorithms decreases from high to low values. With the rising subarea window size, the convergence radius of several algorithms gradually increases, and the convergence frequency of IC-GN2, IC-DogLeg2, and IC-LM2 algorithms tends to be the same, while IC-Diag2 algorithm gradually ranks first in other algorithms. Among first-order algorithms, the convergence frequency of IC-DogLeg and IC-LM algorithms is slightly higher than that of IC-GN and IC-Diag algorithms. The calculation speed of IC-GN, IC-LM, IC-DogLeg, and IC-Diag algorithms decreases from high to low values, and with the increasing displacement, the calculation speed of several algorithms is also decreasing. Meanwhile, since with the rising size of the subarea window, the pixel number in the subarea that needs to participate in the calculation is also increasing, and its calculation speed is also slowing down. In the deformation experiment of rubber blocks, both the proposed algorithm and Dice software can successfully calculate the displacement field and strain field of the experimental deformation. In the large deformation experiment, the maximum shape variable exceeds 100 pixel, and it is difficult for the Dice software to accurately calculate the displacement field and strain field of the deformation for some regions. The three algorithms can still successfully calculate the displacement field and strain field of deformation and are more applicable under large deformation measurement scenarios.ConclusionsIn measuring image displacement, different sub-pixel displacement iteration algorithms deal with the different performances of displacement measurement. We adopt the inverse compositional diagonal approximation algorithm and inverse compositional Dog-Leg algorithm in the digital image correlation method for displacement measurement. Additionally, the parameter update strategy of the inverse compositional Levenberg-Marquardt algorithm is simplified, and the performance of the three algorithms is compared and evaluated by the compression deformation experiment of the simulated and real speckle images. The experimental results show that in the simulation speckle experiment, each algorithm has a different convergence speed, convergence frequency, and calculation speed. In real experiments, the accuracy of a small deformation experiment is similar to that of the inverse combined G-N method, and the convergence radius of a large deformation experiment is larger.
ObjectivePeople's demand for light sources contains not only efficiency, energy conservation, and environmental protection, but is shifting towards healthy and comfortable lighting quality, which puts higher requirements on the measurement technology for luminescence characteristics of the light sources. At present, there are two main methods for measuring the luminescence characteristics of light sources, including far-field and near-field distributed photometric measurements. The far-field distributed photometric measurement based on a point light source model employs a single point photometric detector for spherical scanning to obtain the light intensity, which makes it difficult to accurately demonstrate the luminous information in the near-field distance. The near-field photometric measurement utilizes luminance images from different directions to build a near-field source model. By the conversion of photometric parameters and the processing method of luminance data, the luminescence characteristics of light sources can be characterized, and characteristic information such as the origin and propagation direction of light sources can be obtained. Although the near-field photometric measurement model is more complicated, it can more finely and completely characterize the luminescence characteristics of light sources. However, facing the application requirements for accurate luminescence characteristic measurement of light sources, the development of domestic near-field distributed photometric measurement systems is still in preliminary stages. Meanwhile, some systems have limitations in measurement size or measurement accuracy, which makes it difficult to characterize the luminescence characteristics of light sources. Therefore, by studying the near-field photometric measurement method and its measurement mechanism, we measure the luminous intensity distribution of a plane light source based on the self-developed near-field photometric measurement device.MethodsThe spatial distribution of luminous intensity information of a plane light source is obtained by a luminescence model of the plane light source. To build the model, firstly, the imaging luminance meter driven by the mechanical structure performs three-dimensional spherical scanning motion around the luminous body, while capturing luminance images of various directions on the scanning sphere. Therefore, the luminance spatial distribution information of the light source is obtained. Secondly, a luminescence model of the plane light source is built, which is composed of the point light source array. According to the transformation of the coordinate system and the conversion of photometric parameters, the light distribution in each direction of the luminous plane is obtained. Thirdly, the acquisition of the near-field luminous intensity distribution requires the luminous distribution calculation of the light source from multiple directions. Finally, the results of near-field-distributed photometric measurement are analyzed. The luminance measured value in our paper extracted from the center position of luminance images is compared with the luminance standard value traced to the National Institute of Metrology, China. Additionally, the calculated results of the near-field distributed photometric measurement are compared with far-field distributed photometric measurement by GO-R5000 photometer in far-field conditions.Results and DiscussionsThe luminance images of the plane light source in different directions are collected by the imaging luminance meter driven by a mechanical turntable to complete 2π space swing scanning. Under the fixed rotation axis angle, the luminous area detected by the imaging luminance meter first increases and then decreases with the rotation of the pitch axis. The luminance distribution curves of measured and standard values are consistent. The absolute error of the measured luminance value is less than 1015.52 cd/m2, and the relative error is better than 6.51%. The coincidence degrees of luminous intensity distributions obtained from near-field and far-field photometric measurements are relatively high. The absolute error of the near-field measurement is less than 14.74 cd, and the relative error is less than 8.38%. Meanwhile, the matching index between the luminous intensity distribution of near-field and far-field photometric measurements is calculated for overall evaluation. The matching index of the 0° photometric curve is as high as 98.33%. The results verify the effectiveness of the proposed method for near-field photometric measurement.ConclusionsWe collect the luminance data of the light source based on the self-developed near-field photometric measurement device and the light distribution of the luminous plane in all spatial directions is analyzed by the principle of photometry and geometric optics based on the luminescence model of a plane light source. Additionally, the luminous intensity distribution of the plane light source in near-field conditions is calculated. The results show that the luminous intensity distribution curves in the near- and far-field photometric measurements maintain good consistency. When the relative luminance error of the adopted imaging luminance meter is better than 6.51%, the relative error of luminous intensity from near- and far-field photometric measurements is less than 8.38%. The matching index of the 0° photometric curve is as high as 98.33%. The results show that the proposed method has yielded near-field distributed photometric measurement, and our study has high engineering application significance in lighting, displays, and other fields.
ObjectiveIsotropic laser cooling is regarded as one of the crucial laser cooling techniques because of its distinctive benefits including simplicity, compactness, and robustness. It has been extensively applied in areas including atomic microwave clocks, quantum simulation, and quantum sensing. As a distinct distribution type of cold atoms in isotropic laser cooling, cold atoms with quasi-two-dimensional distributions have significant applications and usefulness in fields of study, including atomic cooling and quantum precision measurement. Isotropic laser cooling does not restrict atoms, different from techniques like magneto-optical traps. The distributions of the optical field and the cold atoms inside the cavity are significantly influenced by the laser injection methodology and cavity design. To obtain cold atoms with a quasi-two-dimensional distribution, one must effectively establish a uniformly distributed quasi-two-dimensional optical field in a flat cavity. In order to get a uniform optical field, we explore the impact of various incident optical field parameters on the optical field distribution using optical simulations to study how to produce a quasi-two-dimensional optical field distribution.MethodsThe main method for creating a nearly two-dimensional optical field in a flat cavity is the subject of this study. We propose a flat diffusion cavity-based cavity structure for the first time. It models the effects of two alternative injection techniques, namely free-space injection and optical fiber injection, on the optical field distribution using optical simulation software. Using the optical fiber injection technique as a foundation, we explore how changing the angle of injection affects the way the light field is distributed inside the cavity. We also investigate the distribution of the optical field inside the cavity as a function of important optical fiber characteristics, particularly the numerical aperture and core diameter. Finally, we investigate the relationship between differences in the optical field distribution inside the cavity and variations in cavity diameters, and this demonstrates that by adjusting these factors, we may significantly improve the optical field's homogeneity.Results and DiscussionsThe simulation results show that the optical fiber injection method is superior to the free-space optical injection strategy in producing a homogeneous optical field within the flat diffuse-reflectance cavity (Fig. 4). Furthermore, by modifying particular parameters, the optical field may be optimized. The homogeneity of the optical field is improved to some extent when the angle of incidence of the optical fiber rotates within reasonable bounds. To keep a uniform optical field distribution, it is crucial to prevent large angle variations (Fig. 5). While changes in core diameter have relatively little influence on the optical field distribution, variations in numerical aperture have a large impact on the uniformity of the optical field (Fig. 6). As a result, choosing an optical fiber with the right specifications is essential for improving the homogeneity of the optical field. Due to structural modifications, increasing the cavity height while keeping the proper height enhances the optical field dispersion. Sometimes, it even improves the optical power density at particular locations. The optical power density distribution within the cavity, however, shows a declining tendency with an overall rise in height (Fig. 7). With a rising side length scaling factor, the optical power density inside the cavity displays a negative power-law relationship decrease pattern. The power consumption for the incident cooling light therefore grows dramatically as the cavity volume expands, even with the same optical power density requirements (Fig. 8).ConclusionsEstablishing a uniform optical power density distribution is a difficult point in studies designed to achieve a quasi-two-dimensional distribution of cold atoms within a flat diffuse-reflectance cavity. We simulate several cooling light injection strategies. When optical fiber injection is utilized instead of free-space optical injection, the optical field distribution is more uniform. The flatness of the optical field can be optimized within particular locations by adjusting the angle of incidence of the optical cable. The optical field's homogeneity is also strongly impacted by the optical fiber's numerical aperture. The initial beam diameter and divergence angle of the incident light are both determined by the numerical aperture and core diameter of the optical fiber. The flatness of the optical field can be improved within certain geographic areas by using optical fibers with the right characteristics. The optical power density inside the cavity shows a negative exponential drop trend as the cavity volume grows. These simulation findings offer helpful pointers for attaining a very homogeneous and quasi-two-dimensional optical field distribution. They also clarify the connection between variations in cavity size and the optical field distribution in the context of isotropic laser cooling.
ObjectiveThe thermal properties during pulse laser processing of carbon fiber reinforced polymer (CFRP) are significant for optimizing process parameters and strategies. An important factor in laser ablation of CFRP materials is the temperature rise caused by carbon fiber absorption of light. However, most of them employ computer-aided design software to simulate the internal temperature field of materials presently, with few underlying algorithms for heat transfer simulation. We study the ablation of the CFRP plate by optical fiber pulse infrared laser, build a new heat transfer model, and carry out the numerical analysis and the laser ablation experiment of the CFRP plate. The experimental results show that the theoretical model is correct and feasible, thus providing references for laser processing research of CFRP materials.MethodsDuring laser CFRP plate processing, the laser beams have a certain moving speed. According to this characteristic, a linear Gauss heat source is proposed to simulate the moving temperature field of laser ablation. Based on the Fourier heat transfer model, the heat transfer physical model of the nanosecond pulse laser processing CFRP plate is built, and the finite difference time domain method is adopted to analyze the model. The laser ablation of the isosceles triangle pattern in a 0.5 mm thick CFRP plate is conducted by nanosecond pulse lasers. Then, the surface roughness data after ablation is obtained by a surface roughness tester. According to the above experimental results, we verify the correctness and feasibility of the model and obtain sound process parameters of laser processing CFRP.Results and DiscussionsThe MATLAB numerical analysis temperature simulation results and comparative analysis on corresponding parameters of the ultra-depth-of-field photos are presented. Fig. 10(a) shows the surface morphology of the CFRP plate when the laser power is 1 W. At this time, the maximum temperature of the material surface [470 K, Fig. 1(a)] is close to the resin decomposition temperature. The resin presents a molten state on the tow area of parallel arranged carbon fiber and then solidifies along the carbon fiber arrangement structure. Part of the molten resin penetrates the gap of the carbon fiber, while the carbon fiber has little change. Fig. 10(b) shows the surface morphology of the CFRP plate under the laser power of 5 W. At this time, the maximum temperature of the CFRP plate surface is 1158 K [Fig. 1(b)], which surpasses the decomposition temperature and gasification temperature of the resin material. The thicker part of the resin surface layer does not evaporate and is also affected by the thermal expansion pressure to form curved resin layer fragments, which is inserted into the air. When the laser power increases to 9 W, as shown in Fig. 10(c), the highest surface temperature of the CFRP plate is as high as 1500 K [Fig. 1(c)], which greatly surpasses the resin gasification temperature and exceeds the carbon fiber decomposition temperature (1153 K). The thicker resin layer is largely evaporated, but there is still a small amount of residue. Meanwhile, we decompose a small amount of carbon fibers, break the carbon filament, and expose it to the air. The evolution rule of surface roughness and the sample variance of performance data stability with laser power and laser scanning speed are shown in Fig. 14. Under the scanning speed of 200 mm/s, the performance data stability is sound and the sample variance is 1.889. At the scanning speed of 200 mm/s and laser power P=9 W, the CFRP surface temperature increases, and the epoxy resin is evaporated, with the surface roughness decreasing to 7.20 μm. According to the evolution law of CFRP material ablation quality, when the laser power and laser scanning speed are 9 W and 200 mm/s respectively, the ablation quality of CFRP materials processed by nanosecond pulse lasers is ideal.ConclusionsBased on the linear velocity of laser beams, we build a heat transfer model of filament Gauss heat source for nanosecond pulse laser ablation of CFRP materials. The model only requires parameters such as laser and material properties, and its numerical simulation results are compared with the surface topography photos obtained by the super depth of field three-dimensional microscope. The experimental results are consistent with the numerical analysis results, which verifies the correctness and feasibility of the numerical simulation. This model is universal and widely applicable to provide theoretical guidance for heat transfer research on the surface of laser ablated materials. The combination experiment of laser ablation parameters for CFRP plates is carried out. The surface roughness of the ablated plate is measured with a roughness detector. The results show that good processing performance can be obtained under the laser power of 9 W and laser scanning speed of 200 mm/s. At this time, the surface roughness and sample variance are 7.20 μm and 1.889 respectively.
ObjectiveBiological particle materials have significant wide-band extinction performance, and the monomer shapes of bioparticles are complex with some irregular non-spherical shapes. However, the differences in extinction characteristics of bioparticle aggregates with different monomer shapes are still uncertain and have been ignored in previous research. Thus, we build bioparticle aggregation models with different monomer shapes to calculate the extinction coefficients in the 3-5 μm and 8-14 μm wavebands and analyze the differences in extinction characteristics caused by monomer shapes.MethodsFive typical monomer shapes are constructed by employing multi-sphere models in terms of the scanning electron microscopy (SEM) images, and the complex refractive indices (CRIs) of three biomaterials are calculated according to Kramers-Kronig relations based on specular reflectance in the 2.5-25.0 μm waveband. A novel simulation code or non-spherical particle aggregation (NSPA) model is applied to build realistic spatial structure models of bioparticle aggregates with different monomer shapes. To eliminate the influence of spatial structure density, we select the bioparticle aggregates with the same porosity of 0.840 to obtain the extinction characteristics. The discrete dipole approximation (DDA) method is adopted to calculate average mass extinction coefficient αext, average mass absorption coefficient αabs, and average mass scattering coefficient αsca in the 3-5 μm and 8-14 μm wavebands respectively. Then the differences in extinction characteristics of the bioparticle aggregates with different monomer shapes can be analyzed.Results and DiscussionsAccording to the calculation results, the influence of the monomer size, monomer number, CRI, and aspect ratio (AR) on the absorption and scattering effects of bioparticle aggregates with different monomer shapes is investigated. The results show that the closer size of bioparticle aggregates to the wavelength of incident light leads to stronger scattering of incident light by bioparticle aggregates. For bioparticle materials with monomer particle sizes ranging from 0.5 to 3.0 μm, the extinction ability in the 3-5 μm waveband is significantly stronger than that in the 8-14 μm waveband (Figs. 6 and 7). When the monomer diameter is 2.0 μm, the αext of bioparticle aggregates with different monomer shapes are about 0.820-0.850 m2/g in the 3-5 μm waveband (Fig. 8) and about 0.430-0.470 m2/g in the 8-14 μm waveband (Fig. 9). Within a certain range, an increase in monomer size enhances scattering effects (Fig. 6), but the trend of absorption and scattering effects is usually opposite. In the 3-5 μm waveband, the relative deviation of αext, αabs and αsca can reach about -6%, -1.3%, and -14% respectively (Figs. 6 and 8). In the 8-14 μm waveband, the relative deviation of αext, αabs and αsca can reach about -3.3%, -1.2%, and -14% respectively (Figs. 7 and 9). There are indeed differences in the optical properties of bioparticle aggregates with different monomer shapes. For the bioparticle aggregates with the monomer shape of pancake, when the monomer number is 15, the relative deviation of αext and αsca can reach -2.8% and -6.1%, but under the monomer number of 60, the relative deviation has reduced by more than 50% (Fig. 8). As the monomer number increases, the specific surface area differences of the overall spatial structure among bioparticle aggregates with different monomer shapes become smaller, and the scattering differences of bioparticle aggregates with different monomer shapes are relatively weakened. The extinction abilities of biological particle aggregates are more sensitive to CRI (Figs. 10 and 11). Therefore, the actual relative deviation in the extinction characteristics of bioparticle aggregates is not directly determined by the degree to which the monomer shape deviates from the spherical shape, but by the specific result of the combined effect of absorption and scattering. As the AR of ellipsoid rises, the absorption changes slightly while the scattering ability declines significantly (Figs. 12 and 13). Additionally, the results in the case of similar monomer shapes also demonstrate that the scattering differences caused by monomer shapes are indeed related to the degree to which the monomer shape deviates from the spherical shape.ConclusionsWe construct bioparticle aggregates with five typical monomer shapes and calculate and compare the extinction characteristic parameters of them under the influence of multiple factors. The results indicate that there are great differences in the extinction characteristics of bioparticle aggregates with different monomer shapes, which is mainly caused by the differences in light scattering. Meanwhile, generally the more deviation of the monomer shape from the sphere causes greater differences in extinction characteristic of bioparticle aggregates, but the specific magnitude of the relative deviation of the extinction characteristic parameters is the coupling result of various factors such as monomer size, monomer number, and CRI. Our study is of significance for accurately evaluating and optimizing the extinction performance of biological particle materials.
ObjectiveEdge-enhanced upconversion detection is a technique to enhance the geometric edges of a target and convert infrared (or terahertz, etc.) targets into the visible spectrum by nonlinear optics. Utilizing this technique for identifying and retrieving edge information within images can substantially mitigate computational burdens in image processing. This is of paramount significance in areas like machine vision, bio-imaging, and related disciplines. However, previous studies have predominantly focused on the "spiral phase contrast" resulting from nonlinear phase transfer and neglected the influence of nonlinear amplitude modulation on targets. The latter is determined by the pump amplitude distribution and the spatial overlap between the pumps and signals, both of which control the spatial spectrum distribution of upconversion images. We theoretically and experimentally investigate the effect of spatial-complex amplitude modulation of pumps on upconversion target based on edge-enhanced upconversion detection caused by amplitude bandpass filtering and spiral phase contrast, followed by analyzing quantum efficiency differences. Finally, based on research findings, we provide practical recommendations for multiple typical scenarios.MethodsThe principle of edge-enhanced upconversion detection (Fig. 1) allows for spatial filtering operations on the signal spatial spectrum by utilizing the spatial amplitude distribution and spiral phase of the pump via parametric nonlinear interactions. This process influences the outcomes of edge-enhanced upconversion detection, thus bringing an improved and more refined detection method. The nonlinear optics platform described by us is based on non-degenerate sum-frequency generation with type-0 phase matching (Fig. 2). Initially, the Laguerre-Gaussian (LG01) beam is employed as the pump beam, which has circular amplitude distribution and spiral phase similar to previous research. Subsequently, a hollow beam with the same spatial amplitude distribution is adopted as the pump beam, and only amplitude spatial filtering is applied to the signal. By comparing the differences between the imaging results and a reference, we can investigate the effect of the spiral phase on edge enhancement. Additionally, Gaussian and super-Gaussian vortex beams carrying spiral phase are employed as pump beam sources to examine how different spatial amplitude distributions of vortex beams affect both imaging results and quantum efficiency in an upconversion detection system.Results and DiscussionsTheoretical and experimental imaging results are compared and analyzed for the pump with four different spatial-complex amplitude distributions under two beam waist radii (Fig. 3). Specifically, when the LG01 beam is utilized as the pump beam, bandpass filtering, and spiral phase modulation are simultaneously applied to the target spatial spectrum, which leads to rounded edge distribution of the upconversion image. Additionally, an increase in the pump beam waist radius reduces the conversion of low-frequency components and sharper edges in the upconversion image. On the other hand, the hollow beam only applies amplitude bandpass filtering on the spatial spectrum of the target, enhancing regions with intensity gradients. In contrast, Gaussian vortex beams exhibit higher conversion efficiency for low-frequency components compared to high-frequency ones, thereby bringing smoother edge profiles for upconversion images. When the waist of the Gaussian vortex beam expands, due to the conversion of a greater proportion of high-frequency components, the low-pass filtering effect on the original image is diminished. Consequently, the contour width of the upconversion image becomes more pronounced. Lastly, super-Gaussian vortex beam has uniform spatial amplitude distribution that converts all spectral components equally, leading to nonlinear spiral phase contrast results close to linear ones.The quantum efficiency corresponding to these four pump beams at identical peak amplitudes and two beam waist radii is obtained (Fig. 4). Since the spectral energy of the image is predominantly concentrated in the low-frequency range, the super-Gaussian vortex beam overlaps most extensively with the spatial spectrum of the signal image, which brings the highest nonlinear conversion efficiency. Importantly, under intense pumping, a pump light characterized by super-Gaussian amplitude can attain the theoretical quantum efficiency upper limit of 100%. The quantum efficiency of the Gaussian vortex beam is surpassed only by the super-Gaussian vortex beam. In contrast, the nonlinear conversion efficiency of the LG01 pump light is comparatively inferior.ConclusionsThe results indicate that the utilization of a circular beam with a spiral phase as the pump light can obtain an upconversion image with enhanced edge sharpness. This technique is particularly suitable for scenarios where precise extraction of the target edge is desired. Conversely, a hollow beam outperforms a circular beam with a spiral phase in preserving more image features. Super-Gaussian vortex beams exhibit the highest quantum efficiency and approach theoretical limits under intense pumping. As a result, when efficient conversion of weak signals is necessary, the utilization of super-Gaussian vortex beam is recommended. On the other hand, the Gaussian vortex beams can be employed to smooth the target edge. It is important to note that Gaussian and super-Gaussian vortex beams are not spatial eigenmodes, whose transverse structures are propagation variants. Thus, imaging should be conducted on the pump light carrying the spiral phase to the signal image spectrum plane and then achieve superior enhancement of the upconversion target edge.
ObjectiveGeneration schemes of optical frequency combs mainly include mode-locked laser, electro-optic modulation comb, nonlinear supercontinuum-based comb, and nonlinear Kerr microresonator comb. Compared with other generation methods of optical frequency combs, the Kerr microresonator comb is considered a new type of coherent light source that features unique and promising advantages of lower power consumption and whole system integratability.The Kerr microresonator pumped in the anomalous group velocity dispersion (GVD) regime leads to the dissipative Kerr soliton comb. The dissipative soliton states are sometimes inaccessible due to the intracavity thermal dynamics and therefore require special tricks to align the pump laser and the resonances in soliton formation. These approaches need benchtop laser sources and complex control protocols, which are not suitable for integrated photonic systems. Furthermore, due to the small temporal overlap between the driving continuum wave laser and the ultrashort pulse, the pump-to-comb conversion efficiency is rather low. Meanwhile, Kerr comb pumped in the normal GVD regime has the benefits including relatively easy access to high pump-to-comb conversion efficiency, large pump frequency detuning range for comb generation, and lower power falloffs within the spectral region of interest which are more ideal for optical communications. Since there is no modulation instability (MI) in the normal GVD regime, the most prevalent method to generate a normal GVD comb is to modify the microresonator dispersion via mode splitting. Common mode splitting mechanisms contain mode coupling to different polarization modes, spatial modes, injection locking, and auxiliary resonator modes. However, the above-mentioned methods are quite complicated. Another method to generate a normal GVD comb can be achieved by pump direct modulation or electro-optic pulse generator based on electro-optic intensity and phase modulators at the resonator free spectral range (FSR), but the electro-optic pulse generator is quite bulky. The phase-locked dual-frequency laser can be regarded as a pulse pump laser source with a wide pulse duration, which can be realized by an integrated DFB laser.Silicon nitride is widely applied to nonlinear optics. It has an ultra-broad transparency window, low intrinsic loss, and a refractive index that allows for moderate optical field confinement in waveguides. However, fabricating thick films with high yield is challenging owing to the large tensile stress in as-deposited stoichiometric silicon nitride films, which can result in the formation of cracks crossing the photonic devices. An alternative way to overcome the high tensile stress is varying the composition of the material itself. In particular, silicon-riched silicon nitride can dramatically reduce the film stress. Silicon-riched silicon nitride waveguides also have a higher nonlinear Kerr coefficient and refractive index than stoichiometric silicon nitride, but the normal GVD comb based on the silicon-riched silicon nitride has not been reported. Thus, we propose a generation scheme of optical frequency combs by adopting a phase-locked dual-frequency laser-pumped normal dispersion silicon-riched silicon nitride microresonator. The proposed optical frequency comb has potential applications in astronomy, optical communication, and microwave photonics.MethodsFirstly, the flat normal dispersion in the 1550 nm band is realized via dispersion engineering of the silicon-riched silicon nitride microresonator by the finite element method mode solver. The effective mode field area of the TE0 fundamental mode at 1550 nm in the optimized silicon-riched silicon nitride waveguide is about 1.005 μm2, and the nonlinear coefficient is about 4.587 W-1·m-1. Meanwhile, the dispersion parameters of the microresonator with 100 GHz free spectral range (FSR) are also optimized. Then, the optical frequency comb generation pumped by a phase-locked dual-frequency laser based on the normal dispersion silicon-riched silicon nitride microresonator is simulated by employing the Lugiato Lefever equation (LLE). The evolution process of the optical frequency comb in time and frequency domains related to the laser pump detuning is studied. Additionally, the effects of several parameters on the performance of the optical frequency comb are also investigated.Results and DiscussionsThe silicon-riched silicon nitride waveguide structure with optimized normal dispersion and nonlinear coefficient is obtained by dispersion engineering (Fig. 1). The dispersion parameters such as resonant mode frequency spacing D1/(2π), second-order dispersion D2/(2π), third-order dispersion D3/(2π), dispersion parameter Dint/(2π) of a microresonator with bending radius of 206.5 μm are also obtained (Fig. 2). The schematic diagram of the optical frequency comb generated via phase-locked dual-frequency laser pumped normal dispersion silicon-riched silicon nitride microresonator is shown (Fig. 3). The optical frequency comb generation is simulated by the LLE. The time-frequency evolution process of the optical frequency comb in time and frequency domains related to the pump detuning is studied (Fig. 4). The optical frequency comb in the normal GVD regime can be generated within a relatively large pump detuning range. The laser pump detuning is intrinsically linked to the intensity filling rate of a pulse state. When the pump detuning increases, the pulse becomes narrow with a broad corresponding spectrum. The effects of several parameters such as the pump power, the power proportion of the dual-frequency laser, microresonator waveguide loss, microresonator dispersion, and the frequency interval of dual-frequency laser on the performance of the optical frequency comb are also investigated. The following conclusions can be obtained by the simulation. Firstly, under the higher laser pump power, the pump detuning range for the optical frequency comb generation becomes larger and the pulse peak power under the same pulse intensity filling rate increases, with a wider corresponding spectrum (Fig. 5). Secondly, the power proportion of dual-frequency laser has little influence on optical frequency comb generation (Fig. 6). Thirdly, when the microresonator waveguide loss is larger, the pump detuning range for optical frequency comb generation becomes smaller, and the pulse peak power under the same pulse intensity filling rate decreases (Fig. 7). Fourthly, with the increasing absolute dispersion value, the spectrum bandwidth of the optical frequency comb under the same pulse intensity filling rate reduces obviously (Fig. 8). Finally, the frequency spacing of the optical frequency comb can be tuned via changing the frequency spacing of the phase-locked dual-frequency laser with integral multiple of FSR (Fig. 9).ConclusionsWe propose a generation scheme of optical frequency combs by adopting a phase-locked dual-frequency laser-pumped normal dispersion silicon-riched silicon nitride microresonator. By optimizing the structure of silicon-riched silicon nitride microresonator and dispersion engineering, an optical frequency comb with bandwidth from 1520 nm to 1580 nm is realized via the simulation. The time-frequency evolution process of optical frequency comb generation is analyzed. The simulation results show that a dual-frequency pumped optical frequency comb in the normal GVD regime can be generated within a relatively large pump detuning range, which will benefit long-term comb stabilization and real applications. Additionally, the effects on the performance of optical frequency combs such as the pump power, the power proportion of the dual-frequency laser, microresonator waveguide loss, microresonator dispersion, and the frequency interval of dual-frequency lasers are also studied. Our study shows that silicon-riched silicon nitride waveguides have potential benefits for the 1550 nm broadband optical frequency comb based on normal dispersion nonlinear optical microresonator.
ObjectiveLinear Fresnel reflectors (LFRs) have gained increasing attention due to their advantages of simplified construction, reduced wind loads, cost-effectiveness, and optimal land area utilization. Mirrors are the focusing components of LFRs, including flat, parabolic, and cylindrical shapes. Flat mirrors have limited focusing ability, with a reflected light spot width not smaller than its width. The use of slightly curved cylindrical or parabolic mirrors can improve the focusing ability. Existing research on the optimization of cylindrical mirrors in LFRs is mostly limited to unaltered curvature radii. Although the production is simple and cost-effective, the individual optimization of the curvature of each mirror (half mirror field) can improve the optical performance of the system more effectively. We aim to investigate the optimization design problem of cylindrical mirrors in LFRs and propose an optimized calculation method for the curvature radius of cylindrical mirrors. A general calculation model is established, which only requires considering its distance from the center of the field and the transversal incidence angle of the sun during effective sunrise to obtain the optimal value.MethodsFirstly, based on the characteristic that the reflected rays passing through the two endpoints of the cylindrical mirror of LFRs always deviate towards the direction closer to the center when the mirror deviates from the reference position, an optimized calculation method for the curvature radius of cylindrical mirrors is proposed, and the calculation formula is derived. Secondly, using the method of polynomial surface fitting, the curvature radii calculated for cylindrical mirrors at different widths, distances from the center of the field, and the transversal incidence angles of the sun during effective sunrise are processed to obtain a general calculation model. The accuracy of the model is validated using numerically precise calculation results. Finally, the optical performance of the optimized cylindrical mirrors is analyzed using a ray tracing-based optical model. The focusing characteristics of the system are analyzed using an optical model based on SolTrace, with an LFR optimized in existing literature as an example.Results and DiscussionsIt is assumed that a transversal incidence angle of the sun during effective sunrise is 30°, and the curvature radii for cylindrical mirrors with different widths are nearly identical at the same distance from the center of the field (Fig. 4). By taking the transversal incidence angle of the sun during effective sunrise from 20° to 40° with an interval of 1°, the curvature radii for cylindrical mirrors with a relative width of 0.09 are calculated at different distances from the center of the field. A good fit is achieved with a polynomial surface fitting order of 3 for the distances from the center and an order of 1 for the transversal incidence angle of the sun during effective sunrise (Fig. 5). After ignoring the influence of mirror slope error and tracking error, it can be observed that as the distance from the center increases, the lateral offset of reflected rays from the cylindrical mirror exhibits a linear increasing trend. Under the same distance from the center, the maximum lateral drift of reflected rays from the cylindrical mirror increases with wider mirror widths (Fig. 7). At the center of the field, the lateral offset of reflected rays from the cylindrical mirror in response to the transversal incidence angle demonstrates a symmetrical relationship around 90°. Overall, a decreasing trend is followed by an increasing trend. When the cylindrical mirror deviates from the center of the field, the lateral offset of reflected rays from the cylindrical mirror first decreases and then increases across the entire range of transversal incidence angles, with the minimum value determined by the distance from the center (Fig. 8). With an increase in the transversal incidence angle of the sun during effective sunrise, the optical efficiency of the system and the concentrated solar flux on the absorber surface continue to rise, while the uniformity shows a decreasing trend followed by slight fluctuations within a narrower range. The concentrated solar flux primarily concentrates on the lower half of the absorber tube (Figs. 9 and 10).ConclusionsThe optimal curvature radius of the cylindrical mirrors has little correlation with its width but rather depends on the distance from the mirrors to the center of the field and the transversal incidence angle of the sun during effective sunrise. The results obtained from the general calculation model closely match the numerically precise calculations, with a maximum deviation of 1.26% and an average deviation of 0.38%. By considering the slope error, tracking error, and curvature radius error of the cylindrical mirrors, the real-time optical efficiency remains above 59.46% when the transversal incidence angle exceeds 45°. Within a small range on the aperture (relative distance -0.05-0.05), the concentrated solar flux density is high and exhibits good uniformity, making it suitable for concentrating photovoltaic systems.
ObjectiveThe development trend of onboard electro-optical systems towards multifunctionality, high performance, and light weight poses higher demands on the development of optical systems. Reflective optical systems are widely employed in various types of onboard electro-optical devices due to their broad bandwidth and compact working characteristics, and they face challenges such as obscuration of secondary mirrors, limited field of view, and low optimization degrees in traditional coaxial reflective systems. Off-axis three-mirror reflective optical systems with freeform surfaces can address these issues. However, the development and maturity of freeform surface design and manufacturing techniques pose challenges to freeform surface shape measurement and system alignment. In previous studies, computer-generated holograms (CGHs) are adopted for single mirror shape measurement, but there is limited publicly available information on multi-mirror shape measurement with CGHs and their joint baseline design.MethodsWe propose a method for CGH joint baseline design of multi-mirror shape measurement to enable independent high-precision positioning of each mirror during alignment. The core idea is to combine detection and design to ensure high-precision shape measurement and achieve high-precision positioning and stabilization of multiple mirrors. The specific process of the joint baseline design for multi-mirror CGHs is as follows (Fig. 1). 1) The input parameters for the mirror shape are set, including posture parameters and surface parameters. 2) The initial point for CGH posture optimization is calculated based on the parameters. Additionally, CGH posture parameters (tilt and distance from the measured surface) are optimized to ensure the integrity and moderate size of the holographic areas for primary mirror and third mirror. 3) Additional holographic areas are designed based on posture parameters, including rough alignment areas, angular alignment areas, and interference order marking areas. The angular alignment area utilizes a reflective grating design with the shining angle set as the incident angle of the interferometer's light rays. 4) The manufacturability of the designed fringe patterns is examined. If the patterns meet the processing requirements, the joint baseline design is considered complete to proceed to system alignment. Otherwise, the first step should be returned and the design parameters should be readjusted until the fringe patterns meet the processing requirements. The alignment process using multi-mirror joint baseline design CGH is as follows (Fig. 3). 1) The two-mirror posture optimization CGH design is finished based on the system parameters. 2) The CGH alignment baseline is set, the interferometer is aligned with the main mirror alignment area, and the alignment of the interferometer and the main mirror is fixed. 3) The primary mirror is aligned. The interferometer posture is adjusted based on the alignment area of the main mirror interferometer. The misalignment is reflected by the sensitivity matrix of the detection optical path. According to the sensitivity matrix theory, under small misalignment, Zernike polynomial coefficients are linearly related to the misalignment. The main mirror should be fine-tuned based on interferometric fringe Zernike coefficients. 4) The third mirror is aligned. The interferometer posture is adjusted based on the alignment area of the three-mirror interferometer and the third mirror are fine-tuned based on the interferometric fringe Zernike coefficients. Meanwhile, the posture and stabilization of primary mirror and third mirror are completed. 5) The system alignment baseline is established by the interferometer, and a theodolite is employed to align the system baseline and the reticle at the exit pupil. 6) The secondary mirror is aligned. A collimated laser is adopted to position the tilt and pitch of the secondary mirror. 7) The secondary mirror is fine-tuned to achieve the desired image quality at the zero field of view. 8) The angles of the interferometer and the collimated mirror are adjusted to the off-axis field of view, and the imaging quality at the off-axis field of view is measured. If it meets the design requirements, system alignment is ended. Otherwise, the zero field of view should be returned and the wavefront error adjustment should be continued until the off-axis field of view also meets the design requirements.Results and DiscussionsThe CGH design is limited by the following factors, including minimum stripe width greater than 1.5 μm, single holographic area diameter smaller than 80mm, and complete CGH diameter smaller than 160mm. The designed CGH (Fig. 5) with minimum stripe width 1.78 μm meets the manufacturing process and design requirements. The fabrication error analysis can simplify the model to a linear grating model (Fig. 7). The main fabrication errors (Table 2) contain substrate shape error, stripe width error, etching depth error, and stripe duty cycle error. Among them, the substrate shape error has the most significant influence on CGH imaging. However, the substrate's manufacturing accuracy is smaller than λ/100 and does not affect subsequent preparation of etched stripes. The other errors cause wavefront error changes within the tolerance range and have a minimal effect on CGH positioning accuracy. In production, it is essential to first suppress substrate shape errors and then pay attention to stripe width errors, further improving the precision of CGH shape measurement. Transmission wavefront measurement (Fig. 8) is performed on the fabricated CGH product. The comprehensive wavefront error in the measured CGH is less than λ/80, which meets the requirements for shape measurement accuracy. In the experiment (Table 3), the main mirror is aligned first, and the RMS of the single mirror shape is 0.022λ. Then, the three mirrors are aligned and the RMS of the single mirror shape is 0.032λ, which satisfies the design requirement that the RMS of the single mirror alignment shape should be less than 0.050λ. Finally, the secondary mirror is aligned. In the full-field imaging quality test (Table 6), the field angle adjustment is realized via theodolite positioning and optical system rotation. The RMS wavefront aberration in the near-infrared wavelength range is less than 0.093λ, and in the long-wave infrared wavelength range, it is less than 0.126λ. The RMS wavefront aberration at the central field of view is 0.079λ, which meets the design requirements for imaging quality.ConclusionsThis method has excellent application prospects. Meanwhile, it is applied to separate structure alignment in this study and has application significance in the off-axis three-mirror integrated structures. High-precision positioning using CGH can calibrate the common baseline machining errors. This method can be widely adopted in the alignment of freeform off-axis systems and the design of optical systems with freeform surfaces.
ObjectiveOff-axis reflective optical systems for freeform surfaces have the advantages of no chromatic aberration, no central obscuration, and a large field of view in one direction, so they are widely used in many optical observation fields. The optical system design and machining, as well as precise system assembly, are three key core technologies to obtain high quality optical imaging systems. Current design methods for freeform optical systems rely on the experience of optical designers to obtain initial structural parameters before calculating the coordinates of the discrete points on a mirror surface. To solve this problem, it is necessary to design a fast and accurate method for obtaining the initial structural parameters of an off-axis reflective optical system during the design. Furthermore, the optical alignment to assembly the manufactured system is also a high-cost and complex operation. Current integrated processing and manufacturing methods avoid the repeated assembly process of off-axis reflective systems using incorporating manufacturing constraints during the design. However, the manufacturing constraints are not considered by most design methods for freeform off-axis reflective systems, resulting in the designed system being unable to meet the requirements of integrated machining and manufacturing. Therefore, design methods are needed to guide the design of initial structural parameters and freeform off-axis reflective optical system under manufacturing constraints.MethodsWe propose an automatic generation method to design the starting points for off-axis freeform systems based on manufacturing constraints. First, the unified description of the surface shape and pose of mirrors in a global coordinate system is provided and the method for ray tracing is given. Second, the manufacturing constraint module is designed. When designing the initial structure of the off-axis system based on manufacturing constraints, it is necessary to take into account both the removal of the obstruction and the fit degree of the mirrors to the cylindrical reference surface. Therefore, a manufacturing constraint module composed of a degree of co-circularity function and obstruction evaluation function is proposed to assess the rationality of the initial structure. Then, we conduct a comprehensive objective function for the initial structure of the optical system by tracing the optical path structure of the off-axis reflective system. The most suitable initial structure parameters for the design requirements are achieved by searching the minimum value of the comprehensive objective function. Finally, taking the initial structural parameters as the input, combined with the improved Wassermann-Wolf (W-W) method, we propose a design method for a freeform off-axis reflective system under manufacturing constraints.Results and DiscussionsTwo freeform off-axis three-mirror reflective systems are designed by the proposed method. The field of view of the first system is 4°×4° and the F-number is 3.3. The entrance pupil diameter is 90 mm and the radius of the cylindrical reference surface is 150 mm. The initial structural parameters are searched based on these design requirements, and the starting point of the freeform off-axis three-mirror system is obtained through the combination of the improved W-W method (Fig. 5). To further quantify and verify the performance of the designed optical system, we change the tilt angle and mirror spacing of the mirrors. In addition, 10 different mirror pose combinations are randomly generated to simulate the possible combinations of mirror positions, which are used by the improved W-W method directly without searching for the initial structural parameters. The imaging quality of these 10 systems has significant uncertainty, and the average manufacturing error value is higher than the design starting point generated by the proposed method. The field of view of the second system is 2°×2°, the F-number is 3.5, and the entrance pupil diameter is 85 mm. In the generated design starting point, the three mirrors are close to the cylindrical reference plane, and the rays of each field of view converge at the image plane. After obtaining 10 random mirror position combinations, the obstruction is manually removed to simulate the possible mirror position combinations used to generate the design starting points directly by the improved W-W method when the initial structural parameters were obtained by manual off-axis. Among the 10 design starting points generated directly by the improved W-W method, the average root mean square (RMS) wavefront error is 0.95λ (λ is wavelenth) and the average RMS spot radius is 36.10 μm (Fig. 10), both are higher than the design starting point generated by the proposed method, and the imaging qualities are unstable. This indicates that even in the absence of obstruction in the initial structure, the RMS wavefront error and RMS spot radius of the system generated directly by the improved W-W method are strongly affected by the changes in the distance between mirrors, and the manufacturing error is still greater than the design starting point generated using the proposed method.ConclusionsWe propose a design method for off-axis reflective optical systems with freeform surfaces under manufacturing constraints. Under the consideration of manufacturing constraints, the initial structural parameters that meet the design requirements are automatically obtained through simple searching, and then the design starting point of the freeform off-axis reflective system is obtained. The experimental results show that by searching the minimum values of the comprehensive objective function proposed in this study and passing these values into the improved W-W method, the co-circularity characteristics can be significantly improved with no optical path blocking, and the problem of unstable imaging quality is avoided. The proposed method can effectively guide the freeform off-axis reflective systems manufactured by the integrated ultra-precision grating milling technology, and also can be applied to design more general reflective systems. The designers can choose or change the range of application of the subfunctions in the objective function.
ObjectiveCarbon dioxide, methane, ozone, and other gases in the atmosphere can absorb long waves reflected by the ground, and again release infrared radiation to increase the earth temperature. These gases are called greenhouse gases caused by the greenhouse effect and are an important factor causing global warming since industrialization. The world environment changes not only exert a great influence on human life but also lead to the extinction of many species. Therefore, in the face of climate change, greenhouse gas monitoring has become the research focus of various countries, and it is urgent to respond to global warming caused by the increase in greenhouse gas concentration. Greenhouse gas monitoring is the basis for studying the change trend of greenhouse gas concentration, and the composition, nature and intensity of greenhouse gas sources and sinks, and is also the basis for the greenhouse effect and yardstick for formulating emission reduction measures. Achieving the two-carbon goal relies on high-precision and high-resolution traceability of gases such as carbon dioxide and methane. The development of a new instrument for trace gas detection with high precision, low cost, and high timeliness has scientific research significance for carbon emission tracing and detection with high spatial resolution, and the obtained scientific data is vital for formulating carbon neutral strategies. With the continuous progress of the platform technology, higher requirements are put forward for the size of the imaging spectrum system, and light weight and miniaturization have become important development directions of the imaging spectrometers. To solve the above problems, we design a short-wave infrared hyperspectral imaging system with auto-collimation.MethodsIn the design method, the image-space telecentric of the telescopic system and the object-space telecentric of the spectroscopic system are ensured to meet the matching conditions of the pupil. The system aberrations are corrected by material matching and lens number increase. Due to the relatively large field of view of the system, the diaphragm is placed in the middle of the mirror group of the telescopic system, which is conducive to correcting the system aberrations. The initial structure obtained from the calculation is set and constrained. After optimization, we invert the collimator group, add the optical splitting element, and adjust the position of the image plane to obtain the optical splitting imaging system. Meanwhile, the system is further optimized to make the imaging quality meet the index requirements. The lens group is reemployed to obtain a spectroscopic system. The picking operation can be carried out, and the optical splitting system can be further optimized under the premise of ensuring the parallel light emission of the single collimator group, which can make the imaging quality meet the index requirements. Symmetric systems with the same structure also have a certain correction degree for aberrations, and the system adopts spherical lens. The optimized telescopic system is connected to the spectroscopic system. The image quality of the system will change after docking. The method of independent design and comprehensive optimization is adopted. The aberrations of the telescopic system compensate for those of the spectral system based on ensuring the sound imaging quality of the individual system. Then the aberrations of the whole system are reduced, and the imaging quality of the whole system is further improved.Results and DiscussionsAn auto-collimation imaging spectrometer is designed, and its structure is shown in Fig. 10. The light beam enters the slit through the telescopic system, and the light emitted from the slit is reflected by the plane mirror to avoid the difficult system layout. The collimator group collimates the light beam, the plane reflection grating is diffracted by the straight light, and the diffracted light passes through the mirror group again for focusing imaging and finally reaches the detector. The groove density of grating is 900 lp/mm and the diffraction order is 1. The working band is 1610-1640 nm, the spectral resolution is 0.1 nm, and the spectral sampling is 0.05 nm. The system design indicators are shown in Table 1. The design results show that the imaging quality meets the requirements. Under the Nyquist frequency of 20 lp/mm, the modulation transfer function (MTF) is better than 0.8, the full field mean square root radius (RMS) is less than 7 μms, and the spectral resolution is better than 0.1 nm, with optical system size better than 460 mm×150 mm×150 mm. Finally, the tolerance analysis of the system is carried out to ensure its feasibility in practical applications. The tolerance MTF is shown in Fig. 13, and the tolerance analysis results are shown in Table 2. The MTF of more than 80% probability value of the whole system is greater than 0.7, and that of more than 99% probability value is greater than 0.58, which meets the practical application requirements of the system.ConclusionsLight and small atmospheric monitoring loads are more suitable for small carrying platforms and reduce the overall system development cost. We adopt the self-collimating structure to realize the miniaturization design of the system. Based on the grating equation in vector form, the initial structure parameters satisfying the conditions of high spectral resolution and reasonable layout of the system are obtained by deducing its initial structure. Independent design and comprehensive optimization methods are adopted to optimize the whole system and ensure the high imaging quality of the independent system to further improve the imaging quality of the whole system. Finally, the F-number of the light and small short-wave infrared auto-collimation hyperspectral imaging system is less than 3 when the working band is 1610-1640 nm. When the cut-off frequency is 20 lp/mm, MTF is better than 0.8, RMS of each band in each field of view is less than 7 μm, and spectral resolution is better than 0.1 nm, with spectral sampling of 0.05 nm/pixel and the overall size better than 460 mm×150 mm×150 mm, all of which meet the design requirements. We provide a design scheme for light and small imaging spectrometers, and also further basic guarantee and technical support for the future development of miniaturized carrying platforms.
ObjectiveMetasurface effective and flexible manipulation of electromagnetic waves in sub-wavelength size has attracted widespread attention. Many metasurface-based devices have been reported in recent years, such as anomalous reflectors/refractometers, vortex beam generators, and polarization converters. However, most reported metasurfaces can only manipulate transmitted or reflected electromagnetic waves. Due to the limitations of half-space manipulation of terahertz waves, it is necessary to design a full-space metasurface, which can realize the manipulation of terahertz waves with reflected and transmitted modes. However, the reported full-space metasurfaces can only manipulate one of the polarized waves for circularly polarized and linearly polarized waves. Therefore, it is very urgent to design a metasurface that can simultaneously reflect and transmit terahertz waves of both circularly polarized and linearly polarized waves.MethodsIn this paper, we propose an omnidirectional bifunctional terahertz metasurface to generate the modulation of radiometric polarization and reflect circularly polarized waves. The unit cell has nine layers, which are elliptical metal pattern, polyimide, metal grating, polyimide, rectangular metal strip structure, polyimide, metal grating, polyimide, and elliptical metal pattern. When a circularly polarized terahertz wave is incident in the metasurface, it can produce reflected vortex beam splitting, deflection vortices, and superimposed vortices. When the y(x) linearly polarized wave is incident along the ±z direction, the designed metasurface produces the x(y) linearly polarized wave transmission and transformation. This terahertz metasurface device offers great flexibility in terahertz wave regulation.Results and DiscussionsWhen the circularly polarized terahertz wave is incident, the metasurface structure generates vortex beams with topological charges of l=±1 and ±2 at frequencies of 1.4 THz and 1.5 THz, four offset vortex beams with l=-1 and +2 at 1.3 THz, andsuperposition vortex beams with l=-1 and +2 at 1.5 THz. When the linearly polarized terahertz wave is incident along the ±z direction, the designed metasurface realizes the polarization conversion function of the transmitted wave at the frequency of 0.72 THz, and the polarization conversion rate is greater than 95%. This metasurface provides an innovative idea for the design of bidirectional multifunctional terahertz wave control devices.ConclusionsIn this paper, an omnidirectional bifunctional terahertz metasurface device is proposed, and the metasurface element structure is composed of the top elliptical metal pattern, polyimide, metal grating, polyimide, rectangular metal strip, polyimide, metal grating, polyimide, and elliptical metal pattern from top to bottom. When circularly polarized terahertz waves are incident to the metasurface, vortex beams with topological charges of l=±1 and ±2 are generated at frequencies 1.4 THz and 1.5 THz. Four vortex beams with l=-1 and one deflected vortex beam with l=+2 are generated at 1.3 THz, and superposition vortex beams with l=-1 and +2 are generated at 1.5 THz. When the y(x) polarized wave is incident to the metasurface from the -z(+z) direction, a transmission mode x(y) polarization wave is generated at 0.72 THz. The omnidirectional bifunctional terahertz metasurface proposed in this paper provides a new idea for manipulating terahertz waves with multi-polarized and bidirectional terahertz waves.
ObjectiveTerahertz waves are electromagnetic waves between microwave and infrared wave with the frequency of 0.1-10 THz and feature strong penetration, large information capacity, high security, and strong maneuverability. Additionally, they have extensive applications in remote communication, security imaging, radar detection, and other fields. With the increasing number of application scenarios, there is an urgent need for functional devices that can regulate terahertz waves in multiple frequency bands. As an important device to regulate terahertz waves, the coding metasurface is characterized by the phase response properties of the coding metasurface units by binary digital code and arranges the coding metasurface units according to the coding sequence to achieve flexible wave regulation. Meanwhile, it can generate various beam forms such as vortex waves, deflection waves, and focused waves. However, once a traditional coding metasurface is designed, it can only generate a beam form at a single frequency point, limiting the working frequency range of the coding metasurface. As a kind of phase change material, vanadium dioxide (VO2) can change its temperature by electricity, heat, and light to achieve phase change function, and is widely applied to metasurface design. Some studies implement the function of generating different beam forms by different coding sequences, but the working frequency band is single and cannot be switched. Another study adopts the PB phase principle combined with VO2 to design a frequency switchable coding metasurface, which achieves vortex wave generation at different frequency points. However, it only yields good results at three frequency points, limiting the working frequency range. Therefore, it is significant to broaden the working frequency range of the coding metasurface and achieve frequency band switching.MethodsFirst, a new type of coding metasurface unit is designed by combining the PB phase principle with the VO2 phase transition characteristics. By rotating the unit at a certain angle and changing the phase transition state of VO2, the reflection amplitude and phase in different working frequency ranges are studied. The conditions are as follows. When VO2 is in an insulated state and a metallic state, it works in different frequency bands respectively and meets the conditions of 3-bit coding metasurface unit in the corresponding frequency band. Then, by taking the terahertz metasurface which can generate high-capacity vortex waves and high RCS reduced scattering waves as an example, a coding sequence is designed. Finally, the wave forms generated by the coding metasurface are simulated at different frequencies to study whether the beam form corresponding to the coding sequence can be generated. By changing the phase transition state of VO2, switching of the operating frequency band can be achieved.Results and DiscussionsBy rotating the designed metasurface units (Fig. 1) counterclockwise in a step of 22.5° from 0° to 157.5°, eight metasurface units can be obtained (Table 1). The unit analysis based on the two phase transition states of VO2 shows that when VO2 is in an insulated state, the unit maintains a large reflection amplitude between 1.17 THz and 1.37 THz, and the phase difference of the eight units strictly meets a 45° phase difference. When VO2 is in a metallic state, it maintains a large amplitude and a phase difference of 45° in sequence at 0.87-0.92 THz and 1.4-1.6 THz. Therefore, at all three frequency bands, the metasurface unit meets the design conditions for a 3-bit coding metasurface unit. The coding metasurface units are arranged according to a certain coding sequence, the coding metasurface formed by them can flexibly regulate terahertz waves, and its mechanism of regulating terahertz waves is similar to traditional phased array antenna theory (Formula 1). Therefore, the designed coding metasurface units are arranged according to the coding sequence that generates vortex waves with topological charge number 1 (Fig. 4) and scattered waves that can reduce RCS (Fig. 6). The results show that VO2 can generate the same beams with the same coding sequence at different operating frequency bands under different phase transition states, and the operating frequency band can change with the phase transition state of VO2.ConclusionsBased on the PB phase principle and phase change material VO2, we design the 3-bit coding metasurface units. A variety of coding metasurfaces are formed by different coding sequence arrangements, which can regulate terahertz waves to generate beam forms corresponding to the coding sequences. Under an insulated state, VO2 works in a single frequency band of 1.17-1.37 THz, and it works in dual bands of 0.87-0.92 THz and 1.4-1.6 THz in a metallic state. The designed VO2 based on coding metasurface can switch the frequency bands without changing the wave forms, and provide important ideas for frequency modulation of terahertz waves.
ObjectiveCooling of mechanical oscillators is an important direction of cavity optomechanics research. Cooling the mechanical oscillators to their quantum ground state is a prerequisite for a wide range of applications based on cavity optomechanics. Therefore, ground-state cooling of mechanical oscillators is the focus of cavity optomechanics at present, which attracts a large number of scholars to study it. However, due to noise interference from external environments, the mechanical oscillators cannot enter the quantum regime. The hybrid system-coupled optical parametric amplifier provides a unique platform to solve the above problem.MethodsThe hybrid optomechanical system consists of two fixed mirrors FM including a rotational mirror RM mounted on the support S which can rotate around the Z axis, and an OPA medium. Cavity 1 which couples the OPA medium is made up of partially transparent FM1 and perfectly reflecting RM while cavity 2 is composed of FM1 and another perfectly reflecting FM2. The cavity 1 is driven by the transmitted beam with charge 0 and a Laguerre-Gauss beam G of charge 0 is incident on FM1. The charge 0 beam reflected from the RM is charged to +2l and then returns to FM1, where a mode with charge 0 is generated and enters cavity 2. After the reflection of FM2, it is also charged to +2l. We study the problem of the intracavity-squeezed cooling in the optical parametric amplifier coupled by a double Laguerre-Gaussian-cavity optomechanical system by calculating the optical force noise spectrum and the steady-state final phonon number. In the weak coupling regime, the optical force noise spectrum of the system is obtained by the perturbation approximation method, and the analytical expression of the final phonon number is calculated by the Fermi Golden Rule theory.Results and DiscussionsWhen the OPA medium is considered in the hybrid optomechanical system, the heating rate of the optical noise spectrum SFFω at ω=-ω? is reduced to 0, with an unaffected cooling rate. In other words, A+ drops while A- remains the same, the net cooling rate Γ=A--A+ naturally becomes larger, and the cooling effect is improved (Fig. 2). Next, we proceed to study how the optical noise spectrum SFFω is affected by the coupling strength J between two cavities. The value of SFFω at ω/ω?=1 is greater in the presence of the auxiliary cavity (Fig. 3). We depict the variations of the optical noise spectrum SFFω with ω/ω? for a given coupling strength J when Δc1=-ω?, Δc1=-2ω?, Δc1=-2.5ω?, and Δc1=-3ω?. The right-hand peak of the optical noise spectrum SFFω is observed to move rightward with the decreasing effective detuning Δc1. As a result, a suitable set of effective detuning Δc1 and coupling strength J can be chosen to make sure that the location of the right peak of the optical noise spectrum is at ω=ω?, which can greatly enhance the cooling process as much as possible (Fig. 4). Fig. 5(a) illustrates the optical noise spectrum SFFω as a function of ω/ω? for three different decay rates κ2. As shown in Fig. 5(a), the value of the optical noise spectrum SFFω at ω=ω? notably rises with the reducing κ2, which means that the decay rate decrease of the auxiliary optical cavity helps promote the cooling process. Meanwhile, SFFω goes down to zero at ω=-ω?, which indicates that the heating is completely suppressed whether the decay rate κ2 is changed or not. As exhibited in Fig. 6, the influence of the different optical coupling strengths J on the net cooling rate Γ is plotted. With the increasing coupling strength J, the net cooling rate Γ first rises to a maximum value and then decreases. Additionally, the net cooling rate Γ is significantly reinforced when the OPA medium is added. Subsequently, we investigate the final phonon number nf versus the coupling strength J with or without the OPA medium. With the increasing coupling strength J, the final phonon number nf will first decrease and then increase. Notably, as the coupling strength J rises, the final phonon number nf of RM drops to markedly less than 1 in the presence of an OPA medium (Fig. 7). Meanwhile, the final phonon number can be less than 1 by regulating the detuning of the auxiliary cavity (Fig. 8) and the decay rate of the cavity field (Fig. 9) respectively.ConclusionsWe propose an intracavity-squeezed cooling scheme to achieve a quantum ground state of RM in a double-Laguerre-Gaussian cavity optomechanical system comprising of an OPA medium. We demonstrate that the quantum backaction heating can be completely suppressed by adding OPA and the cooling efficiency is improved by coupling the auxiliary cavity. Further, the perfect cooling effect can be remarkably accomplished by selecting appropriate coupling strength, effective detuning, and decay rate, respectively. The restriction on the auxiliary cavity in the hybrid system is considerably loosened with the help of OPA. These results may have potential applications for achieving the quantum ground-state of mechanical resonators and greatly promote the study of various quantum phenomena in mechanical systems.
ObjectiveQuantum communication is based on the three principles of uncertainty, measurement collapse, and no-cloning in quantum mechanics. Compared with traditional classical communication methods, quantum communication features security and high efficiency and has great application significance and prospect in information security. In recent years, domestic and international scientists have conducted a lot of research on theories and experiments and made outstanding achievements in long-distance transmission and practical network of quantum communication. Quantum teleportation and quantum cloning have caught extensive attention as important protocols in quantum communication. With the help of quantum entanglement and classical communication, the transmission of any unknown quantum state from one location to another can be realized. As important resources of quantum information, quantum entanglement and EPR steering are widely adopted in various quantum communication tasks. The natural asymmetry of EPR steering makes quantum steering a helpful resource in various quantum information processes. In the tasks of single-side device-independent quantum-key distribution, secure quantum teleportation, and subchannel discrimination, quantum steering can improve key acquisition rate, and enhance the protocol efficiency and security. In 2000, Cerf N J et al. proposed quantum cloning of Gaussian states with continuous variables and gave the fidelity boundary of quantum cloning as 2/3. In 2001, the Grangier P group presented the quantum and classical fidelity boundary of coherent state continuous variable quantum cloning under Heisenberg representation. For coherent state input, quantum teleportation is achieved when the fidelity exceeds the classical limit of 1/2, which is the best value that can be obtained without entanglement. However, it is necessary to have certain requirements for entangled beams to realize quantum teleportation with a fidelity greater than 2/3. In 2004, the Furusawa group applied three single-mode OPOs to obtain a continuous variable quantum teleportation network with an optimal fidelity of 0.64, and then they utilized four OPOs to achieve quantum teleportation with a fidelity of 0.7. In 2012, Pan J W group experimentally realized long-distance quantum teleportation. In 2018, Wei J H et al. put forward a quantum teleportation scheme using non-maximum entangled states for measurement. In 2018, Wang K et al. studied teleportation by partially entangled GHZ states. The analysis based on quantum cloning shows that for coherent state inputs, secure teleportation is guaranteed if the teleportation fidelity is greater than 2/3. To sum up, the research on remote transmission security is still a long-term important topic.MethodsBased on the basic idea of quantum teleportation, we employ the method of combining quantum channel and classical channel to design a 1→2 quantum cloning scheme with continuous variables by partially disembodied transport. The relationship between the fidelity of a partially disembodied transport cloning scheme and EPR entanglement source is studied theoretically. Firstly, the fidelity of two output modes in 1→2 cloning scheme, the entanglement and steering of EPR shared entanglement source are analyzed. Secondly, the relationship between the fidelity of the output mode Clone 1 and the steering characteristics under the optimal gain is studied. Thirdly, the fidelity of the output mode Clone 2 varies with the reflectance and squeezing parameters under the optimal gain of the output mode Clone 1.Results and DiscussionsFirst, we analyze the variation of the steering between entanglement sources b^1 and b^2 and optimal gain with η1 and η2. Only if η1>0.5 there is a steering of b^2 by b^1, and if η2>0.5 there is a steering of b^1 by b^2. The results are as follows: when η1>0.5 and η2>0.5, there is a two-way steering between b^1 and b^2, and the entanglement amount between the sources increases with the improving transmission efficiency η1 and η2. The range of optimal gain gopt=maxgb2|b1,gb1|b2 is 2≤gopt<5, and the optimal gain corresponds to the optimal gain of output mode Clone 1, which is not optimal for output mode Clone 2. Second, the fidelity of output modes Clone 1 and Clone 2 varies with η1 and η2 under different reflectance when the optimal gain gopt is taken. The fidelity F1>23 should be in the two-way steering region, but the fidelity of the two-way steering region may not always meet F1>23. Meanwhile, the fidelity of output mode Clone 1 decreases with the increasing reflectivity, and that of output mode Clone 2 reduces with the rising reflectance. Third, the fidelity of output modes Clone 1 and Clone 2 varies with η1 and η2 under different squeezing parameters when the optimal gain gopt is taken. The fidelity of output mode Clone 1 in the two-way steering region is greater than 2/3, and the fidelity beyond the no-cloning threshold can also be achieved by two-way steering under smaller squeezing parameters. The fidelity of the output mode Clone 2 decreases with the increase in squeezing parameters.ConclusionsIn summary, we theoretically investigate the relationship between the fidelity of cloning and EPR steering based on the partially disembodied transport continuous variable 1→2 quantum cloning scheme. Meanwhile, we explore the fidelity variation with the reflectance of the beam-splitter and squeezing parameters at a given gain. The results show that for the output mode Clone 1, when the optimal gain is obtained, the two-way steering of the entanglement source should be shared when the fidelity exceeds the no-cloning threshold, but not all two-way steering resources can make the cloning fidelity greater than 2/3. The fidelity of output mode Clone 1 decreases with the rising reflectance and decreasing squeezing parameters, and the two-way steering can also achieve fidelity beyond the no-cloning threshold under smaller squeezing parameters. Additionally, the fidelity of the output mode Clone 2 reduces with the increasing reflectance and squeezing parameters. Therefore, high cloning fidelity does not require significant squeezing and high reflectivity. Therefore, we can employ the combination of quantum channel and classical channel to improve the cloning fidelity. The two-way quantum steering state is the necessary resource for secure quantum cloning of the coherent states. The research results provide certain references for the security of quantum communication networks.
ObjectiveRaman spectroscopy is an efficient and non-destructive analytical method for obtaining chemical information. The characteristic peaks in a Raman spectrum contain chemical information about the substance. The symmetric zero-area conversion is a commonly employed peak-seeking method. However, before peak seeking, various parameters related to the spectral line should be input, such as window width, Lorentz function half-width, and Gaussian function half-width. For different Raman spectra, these parameters to be input may be different, and if the input parameters do not match the current Raman spectrum, the obtained peak positions may be inaccurate. Currently, some open Raman databases only contain raw Raman spectral data without corresponding peak information. Preprocessing the raw spectral data and obtaining the corresponding peak positions and intensities by peak-seeking algorithms lead to better and more convenient utilization. Although the symmetric zero-area conversion method has advantages in automatic peak seeking and can obtain the intensity information corresponding to the spectral peaks, this peak-seeking algorithm requires various parameters related to the spectral data, such as window width, Lorentz function half-width, and Gaussian function half-width. Therefore, the universality of the symmetric zero-area conversion method is relatively limited during processing different Raman spectra in the database. We propose an improved symmetric zero-area method to reduce the input of parameters related to spectral data and adapt it to data with different spectral resolutions. We hope that this algorithm can automatically search peaks in batches for many raw Raman spectral data in the Raman database to generate a more concise and convenient database.MethodsThis algorithm improves the peak-seeking algorithm of symmetric zero-area conversion by combining noise reduction and baseline removal algorithms. First, the Whittaker Smoother algorithm is employed to remove noise from the raw Raman spectrum, which can quickly and easily remove noise without producing peak position shifts. Then, the asymmetrically weighted penalized least squares (arPLS) algorithm is utilized to remove the spectrum baseline. Next, we improve the symmetric zero-area method by normalizing the half-width of the Raman spectrum peaks, thus reducing the number of required input parameters and suppressing peak-seeking offsets. After peak seeking, the found peak positions are further corrected to reduce offsets and accurately locate peaks. Finally, the WALPSZ peak-seeking algorithm is formed by combining the Whittaker Smoother and arPLS. Additionally, the algorithm is leveraged to automatically search for peaks in ROD's raw Raman spectral data and adopted for experimental Raman spectral analysis of Anhydrite, Pyrite, and Moissanite. The obtained peak positions are compared with the literature's data to verify their reliability and universality for different Raman spectral data.Results and DiscussionsFirst, the traditional symmetric zero-area conversion method and the WALPSZ algorithm are applied to analyze the peak seeking of ROD's Calcite, Analcime, Bindheimite, and Brookite original spectral data. When utilizing the traditional symmetric zero-area peak-seeking algorithm with fixed parameters, it has the best peak-seeking effect on Calcite [Fig. 3(a)] and a better peak-seeking effect on Analcime, but there is a situation where a peak is searched twice at 1000-1500 cm-1 [Fig. 3(b)]. The peak seeking of Bindheimite shows an obvious peak-seeking offset and a situation where one peak is searched twice [Fig. 3(c)]. The peak seeking of Brookite exhibits a clear missing peak case [Fig. 3(d)]. By employing the WALPSZ peak-seeking algorithm, it maintains a sound peak-seeking effect on Calcite and solves the above inaccurate peak-seeking problems when facing other Raman spectra, which indicates that the WALPSZ peak-seeking algorithm has better universality. To further verify the universality and accuracy of the WALPSZ peak-seeking algorithm and explore whether the algorithm can still be applied in actual measured Raman spectra, Anhydrite, Pyrite, and Moissanite are prepared for Raman spectral measurement, and the WALPSZ peak-seeking algorithm is adopted for peak-seeking analysis (Fig. 12). The found peaks are compared with those found by the WALPSZ peak-seeking algorithm in the original spectral data of these three samples in ROD and RRUFF and literature data, and we find that these peaks can correspond to each other (Table 2).ConclusionsThe symmetric zero-area conversion method is improved by reducing the input parameters and then is combined with the Whittaker Smoother and arPLS baseline removal algorithm to form the WAPLSZ peak-seeking algorithm, which enhances its universality. The WAPLSZ peak-seeking algorithm is compared with the traditional symmetric zero-area conversion method and the peak-seeking results of other original Raman spectra of ROD by the WAPLSZ peak-seeking algorithm. The results show that reducing the input parameters makes this algorithm capable of automatically batch searching for spectral data in open Raman databases. Meanwhile, we employ the WALPSZ peak-seeking algorithm to obtain the peak positions of Anhydrite, Pyrite, and Moissanite in ROD and RRUFF's Raman spectra, obtain the peak positions of the measured Raman spectra of these samples by this algorithm, and compare them with the peak positions in literature. The results reveal that the WALPSZ peak-seeking algorithm is effective for automatically searching for peaks in measured Raman spectral data and original data in ROD and that the obtained peak positions can correspond to each other and are consistent with the data recorded in the literature. Then, the reliability and accuracy of the WALPSZ peak-seeking algorithm are verified for automatically searching for peaks in Raman original data. Finally, this algorithm can help establish a database of automatically searched peak positions in ROD and correspond to data recorded in literature to analyze chemical information from measured Raman spectra.
ObjectiveIn recent years, inertial confinement fusion (ICF) technology has developed rapidly and exhibited its great potential for applications. In ICF experiments, the pellet will radiate a large amount of X-rays, and the nuclear fusion process can be analyzed by studying the spatio-temporal properties of X-rays. However, the nuclear fusion duration is short (nanosecond-picosecond order), with requirements of high spatial resolution and large dynamic range. However, the commonly applied ultra-rapid diagnostic instruments are more or less defective, among which the optomechanical high-speed camera cannot monitor ultrafast phenomena below the nanosecond order, with sufficient temporal resolution. Electro-optical or magneto-optical shutter high-speed camera makes it difficult to monitor weak signals due to a shutter resulting in incident light loss. Therefore, the study of streak cameras (streak tubes) with ultra-high spatio-temporal and light intensity resolution capabilities is of significance for detecting X-rays in ICF experiments. The anisotropic focusing streak tubes can achieve anisotropic focusing of electron beams by making the temporal-directed focusing system and the spatial-directed focusing system independent of each other. This tube type can not only improve the spatial resolution by increasing the magnification of the streak tube, but also suppress the space charge effect, reduce the aberration in the spatial direction, and improve the dynamic range and temporal resolution of the streak tubes.MethodsAt present, it is difficult for the existing simulation software to completely simulate the whole physical process of streak tubes. Although CST (CST Studio Suite) and other electromagnetic simulation software can suitably reflect the electron transport and the interaction between electrons and electromagnetic fields, less credible results are given for the photoelectron generation process. Therefore, when designing a streak tube, researchers generally need to specially program to calculate the photoelectron distribution of the photocathode based on the Monte Carlo method. However, generally, a programme can only be adopted for one or a few cases, which makes it less portable. Additionally, it is more difficult to verify the results of purely theoretical calculations. Therefore, we employ a high-energy particle simulation software Geant4 (GEometry ANd Tracking) developed by the European Organization for Nuclear Research based on the Monte Carlo method to simulate the photoelectron generation process. Then, based on the simulation results of Geant4, we leverage CST to simulate the subsequent electro-optical system. Finally, the design of an anisotropic focusing streak tube is realized by the software co-simulation.Results and DiscussionsThe high-energy particle simulation software Geant4 is introduced to ultrafast diagnostics, the co-simulation from Geant4 to CST is realized, and an anisotropic focusing streak tube design that encompasses the entire process of photoelectron generation, transmission, focusing, imaging, and interaction between electrons and electromagnetic fields is yielded. Compared with the traditional simulation method, the photoelectron generation process is visualized in this scheme, and the photoelectron distribution is more consistent with the actual experimental situation. Meanwhile, since Geant4 can provide models for the electromagnetic, strong, and weak interaction between substances and particles of different energy to simulate the complete physical process, this scheme can be adapted to a wider range of photoelectron generation situations and is highly portable.ConclusionsBy adopting the co-simulation from Geant4 to CST, an anisotropic focusing streak tube with a CsI photocathode is designed, and the magnification ratio is 2 in both the sagittal and meridional directions, which can meet the practical engineering needs. The secondary electron emission from CsI photocathodes with a thickness of 50-300 nm irradiated by X-rays in the energy range of 1-10 keV is investigated by simulation in Geant4. In this process, the peak of secondary electron energy is around 1 eV, the proportion of secondary electrons is around 85%, and the half-height width of the secondary electron emission time is about 3.0 fs, with the angle of the secondary electron emission sinusoidally distributed from 0° to 90°, and the outline of emission electron being nearly a circular diffuse spot. The Geant4 results are subsequently imported into CST to explore the imaging of anisotropic focusing streak tubes in this case. Additionally, the effects of the temporal focusing system and spatial focusing system on the imaging results of the streak tube are obtained. By optimizing each structure parameter in the electro-optical system, the imaging aberration is wiped out to realize a uniform image-surface electron distribution. The electro-optical system with electron distribution generated by the CST self-generator and the Geant4 is simulated respectively, and the distributions of the electron beams on the object-surface and image-surface obtained for each of the two cases are analyzed. Finally, we find that the imaging results obtained by Geant4 are more uniform and reasonable, and this simulation scheme is more consistent with the actual situation.
ObjectiveNeutron displaced CT (computed tomography) scanning is an effective tomography detection method for large-sized samples, but the truncated projection data leads to significant calibration errors of the center of rotation (COR) of the turntable in the CT system, seriously affecting imaging quality. We consider the COR calibration error during the design of the neutron displaced CT scanning imaging method. A COR calibration algorithm of the turntable under the displaced CT scanning is designed. Then, the symmetric complementary data (SCD) reconstruction algorithm and the projection data preprocessing (PDP) reconstruction algorithm are established. The sensitivities of the reconstruction accuracy of the two reconstruction algorithms to the COR calibration error are discussed. We hope that the proposedCOR calibration algorithm and the reconstruction algorithm under the neutron displaced CT scanning mode can lay a theoretical foundation for solving the neutron CT imaging problem of large-sized samples.MethodsA preciseCOR calibration method under the neutron displaced CT scanning mode is established. The calibration algorithm based on the symmetry principle of projection data is designed. Each possible COR position is enumerated, and the variances between the sum of the projection data on the left and the right sides of the COR are calculated. Finally, the COR result is determined by finding the location where the variance has the minimum value. Under the displaced CT scanning mode, the truncation and redundant characteristics of projection data will result in bright circular artifacts in the reconstructed images. We design two reconstruction algorithms to eliminate the bright circular artifacts, namely SCD reconstruction algorithm and PDP reconstruction algorithm. SCD reconstruction algorithm supply the missing projection data under displaced scanning mode by using the principle of symmetric complementary data and then use the filtered back projection (FBP) algorithm to obtain the accurate reconstruction result. PDP reconstruction algorithm utilize the WANG weighting function to process sinogram data. In order to eliminate the bright circular artifacts in the reconstructed image, the redundant projection values are weighted to ensure that the projection data from all directions contribute the same data amount to the reconstruction results. A simulation method of neutron projection noise including Gaussian noise and γ white spot noise is proposed, and a 3D simulation phantom is designed to verify the performance advantages of the proposed COR calibration algorithm and PDP reconstruction algorithm under different COR displaced sizes and projection noise intensities. A neutron displaced CT scanning imaging experiment is conducted based on the reactor neutron source to verify the practicality and stability of the proposed COR calibration algorithm and the reconstruction algorithm.Results and DiscussionsBy using the designed 3D simulation phantom, it can be verified that the proposed COR calibration algorithm has a calibration error of 0.1. After adding Gaussian noise and γ white spot noise to the projection data of the 3D simulation phantom, the noise in the projection image is similar to the actual neutron data. As the noise intensity increases, the COR calculation error of the OAC (opposite angle calibration) algorithm significantly increases, but the COR calibration error of the proposed method does not increase (Table 2). Therefore, it can be proven that the proposed COR calibration algorithm has higher accuracy and stability. When the COR displaced size changes, the calibration error of the COR does not significantly increase. When the COR calibration error reaches two pixels, the reconstruction results of SCD reconstruction algorithm show certain image artifacts, resulting in distortion of the detailed structure in the reconstructed image. Additionally, due to the influence of stitching and misalignment, the reconstructed image also shows certain stripe artifacts (Fig. 8). The reconstruction results obtained by PDP reconstruction algorithm have stronger image detail resolution and higher reconstructed image quality (Fig. 9). When the projection has Gaussian noise and γ white spot noise, the reconstruction results obtained by PDP reconstruction algorithm are also better than those obtained by SCD reconstruction algorithm (Fig. 10). Moreover, PDP reconstruction algorithm can also achieve good reconstruction results when the COR displaced size changes (Fig. 11). Based on the reactor neutron source of China Academy of Engineering Physics, a neutron displaced CT scanning experiment is carried out, and clear internal and external structural details of the sample are obtained. The imaging field of the neutron CT system is expanded by 31.4%.ConclusionsWe design a neutron displaced CT scanning imaging method for large-sized samples and a COR calibration algorithm under the neutron displaced CT scanning based on the symmetry principle of projection data. The proposed COR calibration algorithm has the advantages of high measurement accuracy and strong anti-noise ability. Two neutron displaced CT scanning reconstruction algorithms are developed. SCD reconstruction algorithm is more sensitive to COR calibration errors. A smaller error can lead to stitching and misalignment issues in the supplemented projection data, thereby affecting the quality of image reconstruction. PDP reconstruction algorithm has a strong tolerance for the COR calibration error and can obtain higher reconstructed image quality. The 3D simulation phantom verifies the performance advantages of the proposed calibration algorithm and PDP reconstruction algorithm under different COR displaced sizes and projection noise intensities. In addition, the neutron displaced CT scanning experiment prove that the proposed COR calibration algorithm and PDP reconstruction algorithm have significant engineering practical values, laying a theoretical foundation for solving the problem of neutron CT imaging of large-sized samples.
ObjectiveX-ray polarization detection is an important means to study the astrophysical properties of intense X-ray sources such as black holes, pulsars, and related gamma-ray bursts. The development of X-ray polarization detectors with excellent performance is the technical basis for related research. Early X-ray polarization detectors were mainly Thomson scattering polarimeters and Bragg polarimeters. However, due to the low modulation factor and narrow detection energy range, the ideal polarization measurement results were not obtained. In 2001, Costa et al. proposed a new way of X-ray polarization detection using the photoelectric effect, in which the X-ray polarization information was obtained by imaging the photoelectron track produced by X-ray photons through a gas detector. The polarimetric photoelectric process is the key physical process for the detector to realize polarization detection. It is of great significance to clarify the photon-gas interaction process and the distribution law of emitted photoelectrons for further understanding the working mechanism of the detector. The polarimetric photoelectric process is an important research content in the development of this type of X-ray polarization detector. Different types of gases have various properties, which will affect the particle transport in the polarimetric photoelectric process and further leads to different detection efficiencies. Therefore, it is necessary to simulate the polarimetric photoelectric process under different conditions. This can provide a theoretical basis and data support for the structure design of X-ray polarization detectors.MethodsWe simulate the polarimetric photoelectric process of 2-10 keV linearly polarized X-ray photons in several commonly used working gases by the Monte Carlo code Geant4. The selected working gas combinations include He+C3H8, Ne+CF4, Ne+DME, Ar+CH4, Ar+CO2, Xe+CO2, CF4+C4H10, and DME+CO2. The response relationship of the emission position and azimuthal angle distribution of photoelectron with the polarization direction and energy of the incident photon is discussed. Moreover, the effects of gas thickness, gas component, gas ratio, and photon energy on the detection efficiency are analyzed.Results and DiscussionsFirst, the response relationship of the emission position and azimuthal angle distribution of the photoelectron with the polarization direction and energy of the incident photon is clarified. The emission direction distribution probability of the photoelectron is the largest in the polarization direction of the incident photon, and the azimuthal angle distribution can be approximated as a cosine squared function. With the increase in photon energy, the counts of photoelectrons at each angle decrease in different degrees, but all of them show a statistical law that the maximum values occur when the azimuthal angle is 0 or π (-π) (Fig. 6). Moreover, the effects of gas thickness, gas component, gas ratio, and photon energy on the detection efficiency are revealed and quantified. For 2 keV photons entering into 90%Ne+10%DME gas mixture, when the gas thickness is small, the detection efficiency increases rapidly with the increase in gas thickness, from less than 0.1 at 0.1 cm to 0.64 at 1 cm (Fig. 7). When the gas thickness increases to 3 cm, the detection efficiency is greater than 0.9. Then, with the increase in gas thickness, the detection efficiency gradually approaches 1. For the CF4+C4H10, Ne+CF4, Ne+DME, DME+CO2, and He+C3H8, the detection efficiency decreases with the increase in photon energy, and the large average atomic number of gas can lead to a high detection efficiency (Fig. 8). While for the Xe+CO2, Ar+CO2, and Ar+CH4, when the photon energy is greater than the binding energy of certain shell electrons of Xe or Ar atoms, the detection efficiency will be improved to a certain extent because the corresponding shell electrons begin to be ejected. In addition to the Ar+CO2 which is affected by the electron emission in K-shell, the detection efficiency in each energy range can be effectively improved by increasing the proportion of gas with high atomic number (Fig. 9).ConclusionsWe simulate the polarimetric photoelectric process of 2-10 keV linearly polarized X-ray photons in several commonly used working gases by the Monte Carlo code Geant4. The response relationship of the emission position and azimuthal angle distribution of the photoelectron with the polarization direction and energy of the incident photon is clarified. The emission direction distribution probability of the photoelectron is the largest on the polarization direction of the incident photon, and the azimuthal angle distribution can be approximated as a cosine squared function. With the increase in photon energy, the counts of photoelectrons at each angle decrease in different degrees, but all of them show a statistical law that the maximum values occur when the azimuthal angle is 0 or π (-π). Moreover, the effects of gas thickness, gas component, gas ratio, and photon energy on the detection efficiency are revealed and quantified. The larger gas thickness and larger average atomic number can lead to higher detection efficiency. In addition, the increase in photon energy can result in a decrease in detection efficiency. However, for the working gases composed of Xe or Ar, when the photon energy is greater than the binding energy of a certain shell electron, the detection efficiency will be improved to a certain extent because the corresponding shell electrons begin to be ejected. The results in this paper can provide some theoretical basis and data support for the structure design of X-ray polarization detectors. In the actual selection of working gases, the drift properties of electrons in gases, the effect of photoelectron drift and diffusion on track thickness and length, and the reconstruction efficiency of the track reconstruction algorithm should also be considered.