


Please enter the answer below before you can view the full text.
7-5=

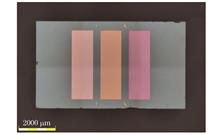
ObjectivePrecisely fabricated optical film elements of high performance are the basis for quantitative remote sensing instruments. For the Chinese ocean color and temperature scanner onboard HY-1C/D satellites [COCTS (HY-1C/D)], excellent characteristics such as precisely positioned spectral response, low stray light coefficient, and low polarization sensitivity are needed to reduce the effects of atmospheric absorption and scattering. The realization of these targets ultimately requires the development of specific optical films, such as multichannel integrated filters and optical films with low polarization sensitivity.MethodsBased on the optical thin-film characteristic matrix theory, we employ commercial software to calculate the spectral and polarization properties of band-pass filters at different incidence angles of light. Additionally, we also study the spectral and polarization effects caused by the spatial angular frequency distribution of light and simulate the spectral and polarization properties of converging beams in COCTS (HY-1C/D) through an integration method. Dual ion beam sputtering is adopted to prepare multichannel integrated band-pass filters on a single substrate at 90 ℃ to ensure reliability and spectral performance. The Jones matrix method is utilized to analyze the effect of different optical elements on the polarization sensitivity of the system, and film designs with special polarization tuning are finished for the key optical elements. The polarization sensitivity of the system is regulated and reduced by the mutual compensation of polarization characteristics among different optical elements.Results and DiscussionsThe integrated filters are well prepared as shown in Fig. 1, the simulated spectral distribution of the filter in the converging beam matches very well with the measured results as shown in Fig. 3, and after a variety of environmental simulations and reliability tests, the spectra remain consistent as shown in Fig. 4. The polarization characteristic analysis of the filters ensures that the polarization sensitivity of all the filters is less than 0.31% as shown in Table 2. The sound polarization design and mutual compensation of optical films ensure that the system polarization sensitivity is effectively controlled. Equipped with well-coated optical elements, COCTS (HY-1C/D) exhibits excellent relative spectral response and low polarization sensitivity when compared with the approved space-borne radiance sensors for ocean color detection, such as MODIS and VIIRS. For COCTS (HY-1D) launched in June 2020, the B7 band for atmospheric correction still has a bandwidth of 20 nm, without overlapping with atmospheric water vapor or oxygen absorption bands as shown in Fig. 2. The measured average polarization sensitivity is less than 1% at the scanning angle of 0° (Fig. 8 and Table 3). The chlorophyll-a mass concentrations of global ocean from COCTS (HY-1C/D) exhibit relatively high consistency with MODIS and VIIRS products, which indicates the satisfactory capability of COCTS (HY-1C/D) for quantitative remote sensing as shown in Fig. 9.ConclusionsQuantitative space remote sensing requires remote sensing instruments with accurate detection bands and low polarization sensitivity to reduce the effects of atmospheric absorption and scattering, and optical thin films play a key role. The technology of multichannel integrated band-pass filters on the single substrate can effectively reduce stray light and inter-channel crosstalk light, thus becoming the development direction of band-pass filters for quantitative remote sensing. To obtain the precise spectral response of the instrument, the influence of beam angle distribution on the spectral properties of band-pass filters should be fully considered in the design and fabrication processes. To reduce the polarization sensitivity of the instrument based on optical coating, we need to pay attention to the polarization regulation of each optical thin film and the complementary polarization characteristics of different components. The application of advanced optical thin film technology in COCTS (HY-1C/D) guarantees high-quality quantitative ocean color remote sensing and imaging, and the products of COCTS (HY-1C/D) show satisfactory performance.
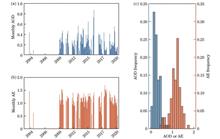
ObjectiveMarine aerosol is the most important natural aerosol source, and can significantly affect radiative budget, climate change, and air quality prediction. A precise numerical model representing the optical characters of local aerosol could help much in relevant research. Photoelectric observation equipment working in the sea area is susceptible to marine aerosol, and the evaluation of its detection ability relies on an accurate aerosol optical model. There are some aerosol models applicable for this purpose, such as the navy aerosol model (NAM) and Mediterranean extinction code (MEDEX), which are based on the data acquired primarily near the sea surface at some specific field sites. It is necessary to build a counterpart model using aerosol observation data from China's sea areas. Ground-based remote sensing mainly provides the column averaged aerosol parameters, which can expand the spatial observation coverage by acting as a collaborative network like an aerosol robotic network (AERONET). We propose a tentative aerosol model based on AERONET to explore the database source in building an aerosol optical model.MethodsAERONET is a commonly employed data source in aerosol-related research, such as air pollution prediction, climate changing analysis, and aerosol physics. Observation sites of AERONET are distributed around the world, making the network suitable to characterize the aerosol parameters in different geographical locations. Level 2.0 products from an island site of AERONET, Dongsha_Island, are utilized because of its relatively long temporal covering range, and the island is far enough to minimize the influence of terrestrial aerosol. An aerosol optical model is proposed based on column averaged parameters, aerosol optical depth (AOD), and retrieved size distributions from spectral and angular AOD. AODs obtained originally at 440 nm and 675 nm by CE-318 sun photometer are spectrally converted to 550 nm using Angstrom exponent derived from the AOD spectrum. Size distributions are averaged to the corresponding month to form a monthly aerosol model. Combined with the sea salt refractive index from the HITRAN 2020 database, spectral AOD could be calculated by Mie theory. Comparisons are conducted between calculated AOD spectra and the observed ones to evaluate the accuracy of the proposed model. During calculating the AOD spectra, the relative distributions of AODs at different wavelengths are normalized according to the observed 550 nm AOD.Results and DiscussionsOur efforts prove that building an aerosol optical model using column aerosol parameters acquired by ground-based remote sensing apparatus is viable. Monthly size distributions of local aerosols in Dongsha_Island are fitted by the lognormal distribution functions of three modes. Fitting coefficients show that the mode radii of fine mode, intermediate mode, and coarse mode are approximately 0.1, 0.28, and 2.2 μm respectively (Table 1). Although the fine mode radius of the built size distribution model is different from that of NOVAM, the intermediate and coarse mode radii conform to the values of their counterparts. Regional AOD is also analyzed and exhibits two peaks in the spring and autumn while concentrating on lower than 0.5. Local Angstrom exponent has the same seasonal tendency as AOD. Error analysis is carried out and the key index indicating the accuracy of the proposed model is root mean square error (RMSE). RMSE of spectral AOD is listed in Table 2 while that of the transmittance expressed in percent is tabulated in Table 3. RMSE of AOD is around 0.01-0.02 in the visible band, and takes a bit large value in the infrared band at around 0.01-0.03, while RMSE of transmittance is 1%-2% and 2%-3% in the corresponding band. Employing the proposed model to estimate the transmittance of the band of 3-5 μm (medium wave) and 8-12 μm (long wave) would result in the error of 0.0090 and 0.0039 respectively. The monthly variations of infrared transmittance demonstrate two peaks in the spring and autumn and have the same seasonal trend as AOD in both medium and long wave bands.ConclusionsBased on the long-term aerosol observation data of AERONET station Dongsha_Island, a local aerosol optical model that can be adopted for calculating atmospheric radiative transport characteristics is built. The monthly aerosol properties are analyzed, and the built model is verified using spectral AOD acquired at the same place. The error analysis results show that this model performs better in infrared and visible bands. The proposed model consists of aerosol size distribution, 550 nm AOD, and Angstrom exponent. The results indicate that the regional aerosol optical model could be developed in a relatively simple way based on ground remote sensing data, and the accuracy could meet the optical calculation requirements. This approach adopts observation data from solar photometers instead of in-situ surface experiments to expand the data source in modeling. This model can be utilized in estimating aerosol optical properties at wavelengths other than the ones leveraged by field observation apparatus. However, the proposed model is a column mean aerosol one and does not consider the vertical aerosol distribution. Errors may appear when the aerosol optical properties are calculated at a specific altitude. In the future, a layered model would be built based on the vertical lidar profile to improve the model description accuracy on aerosol microphysical status.
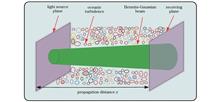
ObjectiveIn practical applications, communication between underwater platforms typically employs super low frequency/very low frequency (SLF/VLF) with narrow transmission bandwidths and insufficient security. Underwater laser communication has become a research hotspot due to its potential to provide higher transmission bandwidths and smaller transmission delay. However, adopting a Gaussian beam as a carrier of laser communication signals for underwater communication is limited by oceanic turbulence, which weakens the beam intensity and causes beam wander, beam expansion, and light intensity fluctuation to restrict the distance of underwater laser communication. To this end, we propose to utilize a Hermite-Gaussian beam for laser communication in oceanic turbulence. While this technique has been demonstrated in atmospheric turbulence, the mean square beam width, Rayleigh range, and turbulence distance in oceanic turbulence have not been reported. Therefore, our paper aims to build a beam transmission model in oceanic turbulence and analyze the mean square beam width, Rayleigh range, and turbulent distance. Finally, a more effective solution is provided for underwater laser communication technology, which can improve communication quality and extend the communication distance, thereby enabling more effective underwater exploration and resource development.MethodsThe research methodology involves the study on propagation properties of partially coherent Hermite-Gaussian beams in oceanic turbulence. Our study begins by developing an intensity analysis model of Hermite-Gaussian beams in oceanic turbulence based on the extended Huygens-Fresnel principle. Then, the mean square beam width, Rayleigh range, and turbulent distance of Hermite-Gaussian beams in oceanic turbulence are derived. The expressions are obtained by the analytical approach based on the proposed intensity analysis model. Finally, the simulation analysis of the mean square beam width, Rayleigh range, and turbulent distance of Hermite-Gaussian beams in oceanic turbulence is conducted. The proposed theoretical model is adopted for analyzing the propagation of Hermite-Gaussian beams in seawater. The relationship between the parameters such as the Rayleigh range and the oceanic turbulence parameters is studied, and a reasonable physical interpretation is given. We provide a theoretical framework for analyzing the propagation properties of partially coherent Hermite-Gaussian beams in oceanic turbulence. The results can be leveraged to improve the performance of underwater laser communication systems.Results and DiscussionsWe investigate the effect of oceanic turbulence parameters on the mean square beam width, Rayleigh range, and turbulent distance of Hermite-Gaussian beams in oceanic turbulence. The results indicate that the mean square beam width increases with the rising mean square temperature dissipation rate. Additionally, the mean square beam width decreases with the dissipation rate of turbulent kinetic energy and decreases to a greater extent when the parameter w takes smaller values. Meanwhile, the larger parameter w determines the larger mean square beam width when salinity dominates. We also find that the mean square beam width increases with the transmission distance. The coherence length has less influence on the beam width and a larger coherence length results in a smaller beam width. The order of the Hermite-Gaussian beam also influences the beam width, and a higher order corresponds to a larger beam width. The Rayleigh range of the beam decreases with the mean square temperature dissipation rate and the relevant parameter w of temperature and salinity and increases with the turbulent kinetic energy dissipation rate. Finally, the turbulent distance decreases with the increase in the mean square temperature dissipation rate and the parameter w, and rises with the turbulent kinetic energy dissipation rate. Our findings have important implications for the design and optimization of underwater optical communication systems.ConclusionsOur paper presents a study on the propagation properties of partially coherent Hermite-Gaussian beams in oceanic turbulence. We derive the expression for the cross spectral density function of the Hermite-Gaussian beam by the extended Huygens-Fresnel principle. We then investigate the effects of oceanic turbulence parameters and optical parameters on the Hermite-Gaussian beam transmission characteristics. The results show that the mean square beam width of the Hermite-Gaussian beam increases with the mean square temperature dissipation rate and the relative parameters of temperature and salinity, while it decreases with the dissipation rate of turbulent kinetic energy. In addition, the higher order Hermite-Gaussian beam means a larger mean square beam width, and both the Rayleigh range and the turbulent distance increase with the rising beam order. These findings suggest that higher-order Hermite-Gaussian beams are more resistant to turbulent perturbations and can lead to longer effective communication distances. Our study is significant for underwater laser communication research and provides insight into the optimal design parameters for communication systems operating in oceanic turbulence.
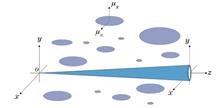
ObjectiveDue to the high data transmission rate, low energy consumption, and strong anti-interference ability, underwater wireless optical communication has been widely applied to underwater image transmission, underwater video transmission, underwater vehicles, underwater search and rescue, and other fields. As the vortex beams carry orbital angular momentum (OAM) and are orthogonal among different OAM modes, underwater optical communication can be conducted using the vortex beams. On one hand, in the atmospheric turbulent environment, the utilization of perfect vortex (PV) beams is proven to improve the channel capacity of optical communication system compared with Laguerre-Gauss (LG) and Bessel-Gauss (BG) beams. Meanwhile, it is unknown whether the channel capacity is still stronger than LG and BG beams when PV beams are adopted for optical communication in the ocean turbulent environment. On the other hand, most previous studies on the channel capacity of vortex beams in ocean turbulent environments have employed the power spectrum models of Nikishov or Elamassie, but both models are proposed under the assumption of infinite scale outside turbulence, which has certain limitations. Therefore, we explore the channel capacity of PV, LG, and BG beams transmitted in anisotropic ocean turbulence using the recently reported ocean turbulence power spectrum with finite outer scale. Our research is of great significance for implementing optical communication links and selecting light source parameters in the marine environment.MethodsAccording to the Rytov approximation theory, the spatially coherent length of spherical wave propagation under anisotropic ocean turbulence is derived. OAM mode detection probability and channel capacity for PV, LG, and BG beam propagation in anisotropic ocean turbulence are calculated. Additionally, we simulate the channel capacity changes of PV, LG, and BG beams with beam radius, receiving aperture, transmission distance, number of transmitted OAM modes, turbulence inner and outer scales, turbulent energy dissipation rate, temperature variance dissipation rate, anisotropy factor, and temperature salinity contribution ratio.Results and DiscussionsThe numerical simulation results of Fig. 2(a)-(c) show that the beam waist radius is an important factor limiting the channel capacity of PV, LG, and BG beams. When the transmission distance is less than 70 m and other parameters remain unchanged, PV or LG beams with a narrower waist radius (less than 4 mm) can obtain a larger channel capacity than that of BG beam. However, when the beam radius is larger (greater than 12 mm), the channel capacity of PV and LG beams is lower than that of BG beams. In addition, when the PV beam is less than 2 mm, the channel capacity is greater than those of LG and BG beams, and it is better for long-distance transmission. The numerical simulation results of Fig. 2(d) indicate that the channel capacity decreases and stabilizes with the rising receiving aperture. The numerical simulation results of Fig. 3(a) reveal that the channel capacity decreases with the increasing transmission distance. The numerical simulation results of Fig. 3(b) show that the channel capacity rises with the increase in the number of transmitted OAM modes. The numerical simulation results of Fig. 4(a) demonstrate that the channel capacity increases with the growing inner scale of turbulence. The numerical simulation results of Fig. 4(b) show that the channel capacity decreases only by a very low value with the increasing outer scale, and when the outer scale continues to grow, the channel capacity does not decrease and remains at a relatively stable value. The numerical simulation results of Fig. 4(c)-4(d) reveal that the channel capacity increases with the rising turbulent kinetic energy dispersion, and decreases with the increasing temperature variance dissipation rate. The numerical simulation results of Fig. 4(e) show that the channel capacity increases with the rising anisotropy factor, and those of Fig. 4(f) indicate that the channel capacity decreases with the increasing temperature salinity contribution ratio.ConclusionsThe beam radius has a great influence on the channel capacity of the three beams, and there is an optimal girdle size to make the channel capacity of the three beams peak, and the peak channel capacity of PV beam is greater than those of BG and LG beams. When the transmission distance is from 30 to 70 m, PV and LG beams with a smaller waist radius (less than 4 mm) can obtain a larger channel capacity than that of BG beam. However, the channel capacity of PV and LG beams with a larger waist radius (greater than 12 mm) is significantly lower than that of BG beam. Additionally, when the beam waist radius is less than 2 mm, the channel capacity of PV beam is greater than those of LG and BG beams, which indicates that PV beam with a narrow waist radius (less than 2 mm) can bring greater channel capacity to the communication system. In addition, the channel capacity of the three beams decreases with the increasing temperature variance dissipation rate, temperature salinity contribution ratio, and transmission distance. Meanwhile, it increases with the rising number of transmitted OAM modes, turbulent inner scale, turbulent kinetic energy dissipation rate, and anisotropic factor. Then, it decreases and eventually stabilizes as the aperture diameter of the receiver increases, but is very little affected by the turbulent outer scale.
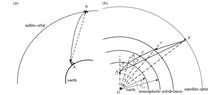
Result and discussion The medium earth orbit (MEO) satellite is selected as the navigation satellite. On this basis, we investigate the influence of atmospheric dispersion on the single-satellite-to-earth unidirectional time transfer deviation first. Simulation results of the unidirectional time transfer deviation are obtained with the laser wavelength of 815 nm (Fig. 3) and 1550 nm (Fig. 4) respectively. The range of unidirectional time transfer deviation is from 7.52 ns to 17.69 ns at 815 nm and slightly decreases from 7.38 ns to 17.36 ns at 1550 nm. The results show that the unidirectional time transfer deviation caused by atmospheric dispersion decreases with the increasing atmospheric temperature and potential height, and it also reduces with the decrease in atmospheric pressure and receiving zenith, with a more significant influence of potential height. The unidirectional time transfer deviation of Jiuquan station with higher altitude is significantly lower than that of other stations. Then, the effect of atmospheric dispersion on the unidirectional time transfer deviation of four satellites to the earth is studied, and the fluctuations of unidirectional time transfer deviation are obtained when the laser wavelength is 815 nm (Fig. 5) and 1550 nm (Fig. 6) respectively. The unidirectional time transfer deviation ranges from 15.02 ns to 35.36 ns at 815 nm and from 14.74 ns to 34.70 ns at 1550 nm. The trend of the time transfer deviation influenced by temperature, potential height, and receiving zenith angle is similar to that with the wavelength of 815 nm. Finally, a comprehensive analysis of the unidirectional time transfer deviation of the four ground stations in different months with a laser wavelength of 1550 nm (Fig. 7, Table 1). This shows that the mean square error of the unidirectional time transfer deviation at each ground station is in the order of 100 ps throughout the year when the relative position between the four satellites and ground stations is fixed.ObjectiveFree-space laser time transfer techniques have a wide range of application prospects as they have higher accuracy than the traditional global navigation satellite system (GNSS) and better flexibility than fiber-optic time transfer techniques. However, the current research on free-space laser time transfer techniques requires two-way signal transmission and antenna alignment to meet the symmetric reciprocity of channel time delay, resulting in the high complexity and cost of terminal equipment. Consequently, these techniques are mainly utilized for high-precision time transfer of satellite-to-satellite, satellite-to-earth crucial time-frequency nodes and users. Characterized by small user terminal size, low power consumption, good concealment, and plug-and-play convenience without the need for precise two-way alignment, satellite-to-earth laser unidirectional time transfer can combine the high precision of free-space laser time transfer techniques and the flexibility of unidirectional time transfer techniques to overcome the limitation. A significant factor limiting the performance of satellite-to-earth laser unidirectional time transfer is the time transfer deviation introduced by atmospheric dispersion. We can lay a solid foundation for further correcting the deviation and improving the time transfer accuracy by studying the range and fluctuation of atmospheric dispersion on the deviation of satellite-to-earth laser unidirectional time transfer.MethodsWe employ the meteorological data from China Meteorological Data Network to build a standard atmospheric refractive index layering model using Murray's classical spherically symmetric atmospheric refractive index layering theory, and then build a time transfer deviation model based on the unidirectional time transfer mechanism. On this basis, firstly, the variation of single-satellite-to-earth unidirectional time transfer deviation is simulated and studied. Secondly, the variation of four-satellite-to-earth unidirectional laser time transfer deviation is analyzed. Finally, the fluctuations of the single-satellite-to-earth and four-satellite-to-earth unidirectional time transfer biases are compared and analyzed under the laser wavelength of 815 nm (Fig. 3) and 1550 nm, respectively.ConclusionWe investigate the mechanism of the influence of atmospheric dispersion on the deviation of satellite-to-earth laser unidirectional time transfer link, build a time transfer deviation calculation model, and simulate and study the deviation caused by atmospheric dispersion in the satellite-to-earth laser unidirectional time transfer link. The results show that the unidirectional time transfer deviation introduced by atmospheric dispersion is related to the user receiving zenith angle, laser wavelength, ground temperature, and potential height. The receiving zenith angle exerts the most significant influence, resulting in time deviation fluctuation of up to 10 ns. When the relative position between the four satellites and ground stations is not fixed, the unidirectional time transfer deviation fluctuates within the range of 15 ns to 35 ns. However, when the relative position between the four satellites and ground stations is fixed, the annual unidirectional time transfer deviation fluctuation is less than 1 ns. Therefore, in non-extreme weather conditions, the peak deviation of satellite-to-earth laser unidirectional time transfer is expected to be reduced to the order of 100 ps by compensating the deviation with empirical values.
ObjectiveAtmospheric aerosols are an important component of the earth-atmosphere system, exerting significant influence on various aspects, such as climate change, air quality, and human health. Traditional aerosol retrieval methods, such as dark target (DT) and deep blue (DB) algorithms, assume surface reflectance parameters during atmospheric radiative transfer processes and construct Look-up tables to retrieve aerosol optical depth (AOD). However, these methods simplify retrieval factors based on prior knowledge, resulting in error accumulation and propagation. Additionally, Look-up tables are usually constructed based on blue or red bands to greatly limit the image information utilization. With the emergence of various machine learning algorithms, deep learning algorithms have become the preferred AOD retrieval method. The quality and quantity of the deep learning training dataset determine the accuracy and applicability of the final model. Meanwhile, current dataset construction faces the problem of biased and insufficient training datasets due to the sparsity of ground station (AERONET) data, the limitation of image cloud cover, and satellite replay cycle, which greatly affects the accuracy of the retrieval model. Therefore, we propose an atmospheric radiative transfer model to construct a simulated dataset that conforms to real scenes, supporting deep learning methods to achieve quantitative aerosol retrieval. We hope that this method can solve the difficult data acquisition, ensure the dataset comprehensiveness, and reduce the aerosol retrieval error to assist with AOD retrieval of high-resolution image aerosols.MethodsWe propose an atmospheric radiative transfer model to construct a simulated dataset and support the implementation of aerosol retrieval using deep learning methods. Firstly, the apparent reflectance of satellite bands in different conditions (observation geometry, surface reflectivity, atmospheric conditions, different AODs, etc.) is simulated by the atmospheric radiative transfer model. Then, based on the statistical relationship among parameters in the study area and the probability distribution, we combine different bands and parameters to construct a simulated dataset that conforms to real scenes. Next, we employ this dataset to perform aerosol retrieval with deep learning methods, and apply the trained retrieval model to Landsat-8 OLI sensor data and retrieve high-resolution (30 m) aerosol images above the urban surface of Beijing. To evaluate the model performance, we validate the results with AERONET ground stations and adopt four metrics including mean absolute error (MAE), root mean square error (RMSE), the Pearson correlation coefficient (R), and expected error (EE) to perform analysis and evaluation.Results and DiscussionsWe combine the radiative transfer model with machine learning methods, and take Beijing as an example to achieve the urban aerosol AOD retrieval. This method has higher accuracy than ground-based measurements to avoid the disadvantage of insufficient training datasets from ground-based measurements in the past. The AOD values inverted from the four stations shown in Fig. 5 (a)-(d) have a strong correlation with AERONET measurements (R = 0.8397-0.9283), and more than 72% of the points are within the expected error with relatively stable retrieval results. The overall results of the study area [Fig. 5 (e)] show that the error of the retrieval values is relatively small. The MAE and RMSE are 0.0685 and 0.1029 respectively, and have a high correlation with AERONET measurements, with an R value of 0.8989. 74.05% of the points are within the expected error, while some results still show the underestimation phenomenon, which is mainly manifested in regions with AOD values above 0.5. In the spatial aerosol distribution under different levels of atmospheric pollution [Fig. 7 (a)-(h)], the overall trend of the retrieval results is reasonable with a continuous distribution, providing full-space coverage of the aerosol retrieval results. Additionally, the aerosol image at 30 m spatial resolution can provide local details and provide more detailed information on the spatial AOD distribution in urban areas, which is of significance in pollution source monitoring and other aspects.ConclusionsWe propose an atmospheric radiative transfer model to construct a dataset to support the retrieval of high-resolution aerosol data from Landsat-8 using deep learning algorithms. The 6S atmospheric radiative transfer model is adopted to simulate the apparent reflectance of different Landsat-8 OLI bands in different conditions. By traversing the parameters in the study area and considering the joint probability of different parameters, different real scenes are constructed to ensure the unbiased dataset. To address the ill-posed problem during the retrieval, we leverage geometric angle information and statistical information between adjacent band apparent reflectance to screen the sample data and limit the parameter combination. An aerosol retrieval model is trained using the simulated dataset, and aerosol retrieval experiments are conducted in Beijing to verify the accuracy against AERONET ground-based aerosol measurement data. The results show that the method of employing simulated data to support deep learning algorithms has high accuracy, small errors, and high correlation with the measured data (R=0.8989). The RMSE and MAE are 0.1029 and 0.0685 respectively, and about 74.05% of the data falls within the expected error line. The proposed method addresses the bias and data volume problems of deep learning training samples using simulated data to better employ large amounts of training data and then learn more complex and accurate relationships between AOD and observation parameters, thereby achieving more accurate retrieval results.
ObjectiveCurrents, sea waves, and climate changes are generated by air-sea interaction. Oceans cover more than 70 percent of the earth and play a significant role in the ecological environment. Therefore, various countries are researching oceans. A wide range of substances are present in oceans, of which phytoplankton are important primary producers in the marine ecosystem and are linked to a variety of oceanic processes. Chlorophyll a is an indicator to characterize the phytoplankton amount and plays an indispensable part in ocean research. Meanwhile, bio-optical parameters can be employed in various fields of oceanographic research and contribute to the rapid development of marine research. Chlorophyll concentration is an important prerequisite for the inversion of bio-optical parameters, and it directly affects the results of the bio-optical parameters. Active remote sensors with outstanding advantages have become one of the most rapidly growing and most effective remote sensors in recent years. Since active remote sensing technology does not depend on solar rays, it can obtain profile information with few detection limitations. As active remote sensing, oceanographic lidar can be mounted on a variety of platforms and obtain the profile concentration of chlorophyll. However, the traditional methods of inverting chlorophyll from lidar signals have poor accuracy, because they are susceptible to multiple scattering. Therefore, high-precision chlorophyll inversion algorithms are essential for marine research. Since the echo signal and chlorophyll concentration have a complex nonlinear relationship, deep learning can be adopted to filter multiple scattering noises, extract the backward scattering signal features, and build a high-precision chlorophyll inversion model.MethodsFour steps are conducted as follows. Firstly, a dataset is built with two parts of label and feature. The label consisting of chlorophyll concentration profiles comes from BGC-Argo and the chlorophyll optical parameters are calculated by empirical relations. The lidar echo signals are simulated by a semi-analytic Monte Carlo algorithm and random sample consensus (RANSAC) algorithm is utilized to distinguish noises. Secondly, a network structure is constructed by Python. We build a lidar inversion model for chlorophyll based on backward propagation neural network (LIMC-BPNN) to solve the problem of multiple scattering effects degrading the accuracy. During the training, ReLU (linear rectification function) is adopted as the activation function, Adam (adaptive moment estimation) as the optimizer, and the epoch is 32. Python is an implementation language. Thirdly, chlorophyll concentration by PR-Chla is calculated to conduct a comparison between the two models. The perturbation retrieval (PR) proposed by Churnside can compute the lidar backscatter coefficient. Finally, relative error (RE), root mean square error (RMSE), correlation coefficient (R), and mean error (ME) are leveraged to quantify the results. The models are evaluated separately through three perspectives, including the average validation set, the validation set divided by water depth, and the set divided by chlorophyll concentration.Results and DiscussionsFirst, a network structure of LIMC-BPNN is built to extract lidar echo features (Fig. 2), and its parameters are determined by experiments. Next, a feature of the dataset covers the five oceans, which is around twenty thousand. The label is created from the dataset by empirical formulations of chlorophyll optics and a semi-analytic Monte Carlo (Table 3). The data in Table 3 exhibit lidar echoes containing chlorophyll information (Fig. 4), and then a comparison before and after noise rejection is shown using RANSAC (Fig. 5). After training, the average errors of the validation set are shown (Table 5). Additionally, two cases are presented (Fig. 6), the results in various chlorophyll concentrations and depths are demonstrated (Fig. 7), and the error variation at different depths (Fig. 8) is discussed.ConclusionsThe results of semi-analytic Monte Carlo can bring chlorophyll features, and RANSAC can filter outliers to enhance the dataset quality. In the ME of the validation dataset, LIMC-BPNN declines 34.22%, 0.363, and 0.213 in relative error, root mean square error, and mean error. The correlation coefficient is increased by 0.18, which indicates better credibility and stability of LIMC-BPNN to provide smaller data variances. Meanwhile, the error of LIMC-BPNN is lower than that of PR-Chla at different depths, which verifies the above findings. Additionally, in low concentration ranges, three errors of LIMC-BPNN are small. In 0-20 m, the traditional PR method performs well, but in 20-50 m RMSE and ME gradually grow larger. In medium and high concentration ranges, RE, RMSE, and ME are greater than those in low concentration ranges, with unchanged stability. Nevertheless, the PR-Chla is stable in 0-10 m and its error increased rapidly below 10 m. In conclusion, LIMC-BPNN is better than the PR-Chla for chlorophyll concentration. However, as the depth increases, errors of the two models are accumulated to demonstrate that the attenuation characteristics of the laser in water affect the accuracy.
ObjectiveAs the basic physical quantity of classical mechanics and quantum mechanics, orbital angular momentum (OAM) is a natural characteristic of the spiral phase beams and has been widely studied in modern times. Meanwhile, the OAM states of different topological charges are orthogonal to each other, which can be employed as a new degree of freedom of information. Thus, OAM state has been applied to a variety of multiplexing communication systems, and the OAM state correction is the key to realize these multiplexing communication systems.We propose a high-precision OAM state correction method based on a diffractive deep neural network (D2NN) because D2NN has almost zero energy deep learning function, and is faster and more accurate than that of the traditional deep learning network, CNN. As D2NN can realize various complex functions in traditional computer neural networks and perform parallel operations at the speed of light, the proposed method will provide a high-speed and efficient OAM state correction for realizing large-capacity and high-quality for the next-generation wireless communication.MethodsWe study a D2NN-based OAM correction method. First, the D2NN component is obtained mainly through the training dataset composed of multiple sets of OAM states and the target OAM states under different turbulence interference. Second, the designed D2NN network components are trained, and the parameters in the components are updated and optimized until the square error loss function of the OAM state and the target OAM state output from the D2NN component reaches a predetermined threshold. Then, the D2NN component is obtained, and can achieve the wavefront correction with high-speed and high-precision. The influence of the training parameters and the network iteration times on the proposed correction method is discussed, and the number of D2NN network layers and the training parameters with the best performance are presented. Finally, after the physically D2NN diffractive component is fabricated, using techniques such as 3D printing or lithography, one can perform the specific task by adopting only optical diffraction components.Results and DiscussionsWe propose a fast and efficient OAM state correction method based on D2NN to significantly reduce the training time and the loss function compared with the correction method based on the traditional CNNs. Furthermore, the environment configuration required by D2NN is not high and can be widely utilized. Meanwhile, we adjust the number of diffraction layers, the training parameters, and the network iterations in the designed D2NN to find the best correction performance. Additionally, the training parameters, with only amplitude as parameters, only phase as parameters, and both the phase and amplitude as parameters are discussed. The results show that the D2NN-based correction method performs optimally under medium turbulence (atmospheric turbulence intensity of 10-14 m-2/3), with 8 diffraction layers (Table 4), and both the amplitude and phase used as the training parameters. As the number of network iterations increases, the loss function value in the proposed correction method will gradually decrease and converge to a constant (Figs. 8 and 9). In addition, the influence of the topological charge of the OAM state in the dataset on the correction effect is also studied. The comparison of the peak signal-to-noise ratio (PSNR) of the corrected OAM state shows that a smaller topological charge leads to a smaller distortion degree and a higher accuracy, with the PSNR greater than 30. This indicates that the OAM state has been corrected to be close to the original OAM state (Fig. 7).ConclusionsThe selection of iteration times, layers, and training parameters in the designed D2NN component will affect the correction speed and accuracy, and the high-precision OAM state correction can be realized through the designed D2NN component. When the atmospheric turbulence intensity is 10-14 m-2/3, the designed D2NN component has the best performance when the layer number is 8, and the phase and amplitude are adopted as the parameters. Meanwhile, the loss function is reduced by more than 45.45% compared with those of the D2NN compoent when the layer number is 5. For the strong atmospheric turbulence, the correction accuracy can be improved by increasing the iteration number during the network training, since the reduction rate of the loss function in 20 iterations reaches 98.03%. For weak turbulence, only phase parameters can be employed for training. For strong turbulence, the method combining the phase and the amplitude parameters is better in training. In addition, a smaller topological charge leads to a smaller corrected distortion. The proposed method has a fast and efficient learning function to provide a new implementation method for OAM state correction.
ObjectiveAerosols are one of the major uncertain sources in radiative forcing assessments of the land-atmosphere system, and aerosol profile data detected by lidar can help quantitatively assess the climate effects of aerosols. In addition to published aerosol observation products, a large amount of aerosol lidar observation data are distributed in the references. However, there is still a lack of integrated analysis of historical aerosol reference data. Thus, we focus on the lidar ratio parameters that are relatively lacking in the existing observation products and propose a fuzzy comprehensive evaluation and analysis method of historical lidar ratio data with aerosol type differences fully considered. The historical data can complement the products of aerosol observation data, and the proposed evaluation and analysis method can help improving the understanding of optical aerosol properties.MethodsBased on the idea of fuzzy comprehensive evaluation, we propose a fuzzy comprehensive evaluation and analysis method for the historical reference data of aerosol lidar ratio, and design the evaluation index of confidence level. The confidence level analysis is shown in Fig. 1. First, the evaluation factors of the historical data are selected, and the analytic hierarchy process (AHP) is employed to determine the contribution proportion of each evaluation factor to the confidence level. Then, according to the characteristics of these factors, the membership function of each factor is determined, and the contribution weights are multiplied by the membership function to get the confidence value. Finally, the confidence values of all historical data are calculated, and the historical data of the same type and wavelength are accumulated to obtain the distribution of the total confidence values of the lidar ratio. To enable comparative evaluation, we normalize the total confidence values to obtain the distribution of confidence level for different types of aerosols lidar ratio over historical data.Results and DiscussionsAll observations of aerosol lidar ratios in the Web of Science database are analyzed with confidence level by the proposed evaluation method. We find that all aerosol types show different aggregation trends similar to Gaussian distribution on the lidar ratio distribution, and the larger amount of historical data lead to a better Gaussian fitting effect. Additionally, the analysis is carried out for sand and dust aerosols from different sources, and the results shown in Fig. 5 indicate that the optical properties of the same aerosol will be different for different sources. Finally, the confidence ranges of the lidar ratios for various aerosol types are summarized in Table 3 for reference, and the results are compared with the simulation data in Fig. 6 with good consistency.ConclusionsWe propose a fuzzy comprehensive evaluation and analysis method for the historical reference data of aerosol lidar ratios, which makes up for the analysis method gap of historical aerosol data and provides references for analyzing the aerosol research basis. Analysis of all the relevant observations in the Web of Science database show that the historical data of lidar ratios of all aerosol types have Gaussian distributions. The traditional aerosol type recognition method is the decision tree, which adopts a fixed threshold to truncate the aerosol data and is prone to cause aerosol type misidentification and discontinuous classification limitation. The lidar ratios of different aerosol types overlap, and they alone are unable to differentiate various aerosol types. Therefore, at least one more classification index should be introduced when aerosol type identification is needed. We present a more comprehensive historical data analysis of the aerosol lidar ratio to improve the understanding of optical aerosol properties and refine the aerosol classification results, providing an accurate reference basis for data analysis of on-board lidars.
ObjectiveAir-sea coupling and energy circulation inside the ocean are the frontiers of ocean science and important directions of earth system science. Researchers have carried out extensive research on multi-scale dynamic characteristics and ecological environment parameters based on the development of advanced remote sensing technology. However, the lack of in-situ detection technologies for measuring marine micro-scale dynamic characteristics, and biological, physical, and chemical features restricts the study of micro-scale phenomena and biological optics inside the ocean. The development of these technologies for micro-scale turbulence and particle size distribution in the ocean mixing layer can improve the understanding of the energy and matter transport inside the ocean. We focus on the great demand for high-resolution in-situdetection technology during the study of micro-scale turbulent flow structure and analyze the feasibility of the laser Doppler current probe in micro-scale turbulence measurement. Finally, theoretical support is provided for achieving a non-contact measurement system with high spatio-temporal resolution.MethodsImportant specification parameters in the scheme design of the laser Doppler current meter system are analyzed theoretically. The technical parameters obtained by theoretical analysis and literature research directly contribute to device selection and data correction during system construction. Meanwhile, we analyze the factors affecting the signal-to-noise ratio of the laser Doppler current probe, including the laser wavelength, scattered light direction received by the optical system, size and concentration of scattered particles, power of the transmitting laser, velocity of the particles, and bandwidth of the signal acquisition system.Results and DiscussionsSuggestions on wavelength selection of laser source are provided by analyzing the absorption coefficient of lasers in different water media. The scattering signals of suspended particles are the main signal source of the laser Doppler current probe. The performance of the laser Doppler current probe system is affected by the physical characteristics of suspended particles (such as shape, particle size, and density), fluid characteristics, and motion state. Additionally, we conclude that the laser Doppler current meter system has enough signal source in most sea areas, and the parameter scheme of the laser Doppler current meter system can cover most particle sizes by investigating the particle size composition, particle size distribution, and concentration of suspended particles in the ocean. The dependence of suspended particles is simulated based on the Basset Boussinesq OSEEN (BBO) equation to correct the velocity errors at different angular frequencies and provides theoretical support for data correction.ConclusionsThe laser Doppler current probe has been proven to be effective in measuring ocean micro-scale turbulence based on a comprehensive analysis of relevant characteristics of ocean water and suspended particles. Suggestions and parameter calculation methods of the laser Doppler current probe system are discussed in the manuscript for micro-scale turbulence measurement.
ObjectiveDuring the visual inspection of underwater structures, the camera lens used for observation is often obscured by suspended impurities such as dead leaves and algae in the water. This obstruction leads to a loss of clear image information, affecting the effectiveness of the inspection. Currently, there is limited research focused on removing these suspended impurities underwater. To address this issue, we propose a method for eliminating visual occlusion from impurities using the intra-frame spatial information and inter-frame motion information from underwater video sequences. Our approach thoroughly analyzes the imaging characteristics of these impurities in water. Then we provide prior information according to analysis and leverage the dynamic perception and information complementarity between adjacent frames to detect and repair occluded regions affected by underwater suspended impurities. We aim to enhance the quality of underwater images and enable underwater robots to more effectively detect the condition of underwater structures.MethodsIn this study, we propose an underwater suspended impurity occlusion elimination method by combining the characteristics of suspended impurity imaging, the motion information and complementary information between adjacent consecutive frames. Firstly, we take the current frame and its two adjacent frames as a set of input data and estimate the optical flows of the three input frames. Based on the distribution of optical flow between adjacent frames, a displacement compensation strategy is proposed to eliminate the background shift caused by camera movement. Secondly, considering the imaging characteristics of suspended impurities, we build a dynamic visual perception model by extracting the motion and color information, which aims to accurately detect impurities with different shapes in aligned neighboring frames. Finally, a hybrid guided restoration model is constructed to determine the optimal complementary information between frames and restore the areas obstructed by suspended impurities. In detail, there are three steps. According to the built hybrid guided repair model, we match the complementary information between the aligned adjacent frames to initially repair the occluded regions, maximizing the retention of the real scene information. Then we adopt the STTN algorithm to carry out the secondary repair of the occluded regions that cannot be complemented by adjacent frames. Next, the two repair results are merged to obtain the final image repair frame. After the current input data processing is completed, the next set of adjacent frames are updated and the above processes are conducted until all the video frames are repaired.Results and DiscussionsTest results on both real and synthetic datasets demonstrate that the proposed method can accurately detect and eliminate obstructive impurities, resulting in significantly improved image quality across multiple metrics. Specifically, the adjacent frame alignment by background displacement compensation effectively eliminates the interference of background movement on the detection of suspended impurity regions. The detection of suspended impurities by dynamic visual perception is not affected by their color, size and morphology and can accurately detect and segment various types of suspended impurity regions in the map (Fig. 6). The estimated hybrid guided repair model map can accurately judge the best matching region in adjacent frames (Fig. 7), effectively guiding the effective repair of the occluded region. The proposed method enables good smoothness and natural transition between the repaired region and the surrounding pixels, and the original detail information of the crack and other regions is better preserved (Fig. 8), which improves the clarity and quality of the image (Fig. 9). This method takes approximately 8–9 s to process each frame segment, and the processing speed needs to be further improved. The selection method of parameters also needs further optimization.ConclusionsIn this paper, we propose a suspended impurity occlusion elimination method in underwater structure apparent state detection video for information loss caused by suspended impurities occluding the lens in the actual water body environment. Experiments on the real and synthetic underwater suspended impurity video datasets verify the validity of the proposed method. This method can accurately detect underwater suspended impurity regions of different sizes, colors and densities and can effectively restore the original information of the occluded regions. In conclusion, this study is of great significance for improving the quality of underwater images and helping underwater robots to better detect the state of underwater structures. However, this method still has some limitations that need to be further overcome. Since the proposed method mainly relies on motion and color information to detect underwater suspended impurities, the detection and removal of suspended impurities with unclear motion characteristics due to slow movement or convergence with the camera's motion direction and speed are not effective. Therefore, in future research work, depth information perception will be combined to further improve the detection and removal effect of underwater suspended impurities. In addition, a dataset containing more scenes of underwater suspended impurities will be further established, and an end-to-end underwater suspended impurity detection and repair model will be established. Optimization terms for various parameters will be designed to decrease specific parameters, reduce the complexity of the model, and improve video processing speed to meet practical application needs.
ObjectiveCarbon dioxide (CO2) and methane (CH4) are major atmospheric greenhouse gases. In recent years, due to the continuous development of human activities and industrial production, the global greenhouse effect caused by the rising levels of CO2 and CH4 in the atmospheric environment has seriously affected human life and health. Therefore, accurate concentration detection is of significance for both environmental monitoring and human health. The off-axis integrating cavity output spectrum technology (OA-ICOS), has been widely concerned for its simple experimental operation, strong anti-interference ability, high sensitivity, and in-situ real-time measurement. It is often adopted in atmospheric and environmental science, medical diagnosis, industrial production engineering, and other research fields. Even when the incident light is fully off-axis, OA-ICOS still has some residual cavity modes that cannot be eliminated and become the main noise of the system. Injecting a radio frequency (RF) noise source into a laser current is a new method to suppress cavity modes. We optimize the CO2 and CH4 dual gas sensing system of OA-ICOS using an RF signal source.MethodsWe study the influence of different power RF noise sources on CH4 absorption signals and select the best RF noise source power. In realizing simultaneous measurement of CO2 and CH4, the output lights of the two DFB lasers are combined into a beam through a fiber coupler and coupled into the cavity. However, the time-division multiplexed scanning signal is designed by software to realize multiplex signal transmission and avoid interference between the signals during measurement. The RF noise source is injected into the near-infrared (NIR) distributed feedback laser, and the time-division multiplexing method is employed to collect dual gas signals at the same time for maximizing the signal-to-noise ratio (SNR) of the signals and the detection limit of the system. Meanwhile, we establish an OA-ICOS sensing system combined with TDM-DAS.Results and DiscussionsAs shown in Table 1, the influence of different RF noise power values on the CH4 absorption spectrum is studied by analyzing SNR and absorption line width of the CH4 absorption spectrum. Considering the influence of SNR and broadening on absorption lines, -20 dBm is chosen as the white noise power of the system. The OA-ICOS systems without a noise source and with a -20 dBm RF noise source are utilized to measure CO2 and CH4 continuously for a long time. The stability and measurement accuracy of the two OA-ICOS systems are evaluated according to the experimental results of the two groups. As shown in the left side of Fig. 5(a) and Fig. 6(a), the average volume fraction of CO2 concentration is 5.8157×10⁻⁴ and 5.9895×10⁻⁴ in the system without a noise source and with an RF noise source. The average volume fraction of CH4 is 2.24×10⁻⁶ and 2.25×10⁻⁶. As shown in the right side of Fig. 5(a) and Fig. 6(a), the measurement accuracy of CO2 is 40.5200×10⁻⁶ and 14.7500×10⁻⁶ in the system without a noise source and with an RF noise source, respectively. The measurement accuracy of CH4 is 0.2716×10⁻⁶ and 0.0997×10⁻⁶ in the system without a noise source and with an RF noise source, respectively. Compared with the system without an RF noise source, the system measurement accuracy of the system with an RF noise source is increased by 2.74 times. Figs. 5 (b) and 6(b) show the analysis of Allan variance results. In the systems without a noise source and with an RF noise source, the CO2 detection limits at 1000 s are 1.85×10⁻⁶ and 5.50×10⁻⁷, with the detection limits of CH4 at 1000 s being 1.61×10⁻⁸ and 5.78×10⁻⁹. The Allan variance values of CH4 and CO2 are always lower for OA-ICOS with an RF noise source than OA-ICOS without a noise source, and the system detection limit is at least three times higher. Adding an RF noise source can improve the stability and detection limit of the OA-ICOS system. Under the average time of 5 s, the NEAS of CH4 and CO2 in the system without adding a noise source is 4.98×10⁻⁹ cm-1·Hz-1/2 and 2.14×10⁻⁹ cm-1·Hz-1/2 respectively. By adding an RF noise source, the NEAS in the system for CH4 and CO2 is 1.70×10⁻⁹ cm-1·Hz-1/2 and 1.07×10⁻⁹ cm-1·Hz-1/2 respectively.ConclusionsWe present a near-infrared OA-ICOS dual gas detection sensing system for continuous and real-time CO2 and CH4 detection. By adding an RF noise source to the laser drive current, the cavity mode noise is suppressed, and the SNR, accuracy, and measurement sensitivity of the OA-ICOS system are enhanced. The results show that the measurement accuracy of the OA-ICOS system with an RF noise source is improved by a factor of 2.74 relative to that of the system without a noise source. According to the analysis of Allan variance results, in OA-ICOS systems with an RF noise source, the Allan variance values of CO2 and CH4 are always better than those without noise sources, and the detection limits of CO2and CH4 at 1000 s are 5.50×10⁻⁷ and 5.78×10⁻⁹. The system detection limit is at least three times higher than that without noise sources. Under the average time of 5 s, the noise equivalent sensitivities of CH4 and CO2 in the system with an RF noise source are 1.70×10⁻⁹ cm-1·Hz-1/2 and 1.07×10⁻⁹ cm-1·Hz-1/2 respectively. Additionally, the CH4 and CO2 concentrations in the atmosphere are continuously monitored for four days to verify the stability and reliability of this system.
ObjectiveWith the large-scale deployment of underwater vehicles and ocean sensing networks, underwater high-speed wireless optical communication systems have become an important data acquisition means. The analysis of beam scintillation and transmission characteristics caused by oceanic turbulence and the exploration of effective oceanic turbulence suppression techniques have become a key technology for building underwater wireless laser communication systems with high stability, high speed rate, and long-range transmission. However, the inconsistency of salt transfer and thermal diffusion mechanisms in the real oceanic environment leads to unstable water stratification, and meanwhile, the refractive index power spectrum based on the infinite outer scale results in possible singularity problems at the poles. As a result, the scintillation effects of Gaussian beams in the oceanic turbulence channel and the theoretical model of spatial coherence radius deviate significantly from the real oceanic environment. Therefore, a Gaussian beam-based Reed-Solomon (RS) coded joint single-input multiple-output (SIMO) communication system using the equalized equal gain combining (EEGC) algorithm is developed to further mitigate the light intensity flicker caused by oceanic turbulence and improve the transmission performance of the system under a weak oceanic channel with a finite outer scale and oceanic water stratification instability.MethodsWe derive closed analytical formulas for the scintillation index and spatial coherence radius for a Gaussian beam based on Yue spectrum, and quantify the turbulence intensity and the detector spacing threshold in a Gaussian beam-based oceanic diversity receiver system under a weak oceanic turbulence channel with a finite outer scale and oceanic water stratification instability. A Gaussian beam-based composite communication system is proposed. This system combines the RS codes technique with the SIMO technique through the EEGC algorithm in light of the aforementioned study. In addition, a closed analytic formula for the upper bound average bit error rate (ABER) of our proposed system using the hyperbolic tangent distribution method is derived.Results and DiscussionsTo verify the designed scheme, we employ the derived closed analytical formulas of scintillation index and spatial coherence radius to determine the turbulence intensity and the detector spacing thresholds for four different channels in our proposed composite communication system (Table 1). Based on this, the performance of the Gaussian beam-based RS coded joint SIMO communication system is investigated in detail by numerical simulations under different detector distribution methods and the instability of oceanic water stratification (Fig. 4). When avalanche photodiodes (APDs) in the receiving plane are placed in symmetrical distribution and asymmetric distribution, the emitting optical power at an upper bound ABER of 10-8 is summarized in Table 4 and Table 5, respectively. Results show that the performance of our proposed RS coded joint SIMO communication system can be significantly underestimated or overestimated by treating oceanic water stratification as a stable state in optical oceanic turbulence caused by salinity fluctuations or temperature fluctuations (Fig. 4). By further comparing the EEGC SIMO communication system (Fig. 3) with the RS coded joint EEGC SIMO communication system (Fig. 4), the proposed RS coded joint EEGC SIMO communication system can significantly improve the transmission performance of the system under different turbulent channels. Additionally, the improvement in system performance is noticed to be more significant as the oceanic turbulence intensity increases in the weak oceanic composite channel. Therefore, comparing emitting optical power at an upper bound ABER of 10-8 in an RS-SIMO system with symmetrically and asymmetrically distributed APDs, it can be seen that the performance of the RS coded joint SIMO system with symmetric distributed APDs is about 1.5 dB better than that of the asymmetrically distributed APDs RS coded joint SIMO system when the EGC algorithm is adopted. When the APD position at the receiver is symmetrically distributed, the performance of the EEGC algorithm improves by about 1 dB over the EGC algorithm (Table 4). When the APD at the receiver is asymmetrically distributed, the performance of the RS coded joint SIMO system with the EEGC algorithm improves by about 2.4 dB (Table 5). The RS coded joint SIMO communication system using the proposed EEGC algorithm can effectively compensate the system performance loss caused by the non-linearity of the Gaussian beams and reduce the influence of the detector distribution method on the system performance.ConclusionsAn EEGC algorithm for light intensity equalization is proposed for the Gaussian distribution characteristics of the light intensity in the receiving plane in the SIMO communication system, and an RS coded joint EEGC SIMO composite communication system based on Gaussian beams is established. The closed analytic formula for the upper bound ABER of the proposed system using the hyperbolic tangent distribution method is further derived. The simulation results show that the instability of the oceanic water stratification exerts a significant influence on the system performance. The designed communication system significantly mitigates the effect of oceanic turbulence on the system's performance, especially the suppression effect, which becomes more significant as the oceanic turbulence intensity increases. Additionally, the proposed system eliminates the influence of the detector distribution on the Gaussian beam-based SIMO system performance. We not only provide guidance for the characteristics of high-order complex beams in real marine channels but also a useful theoretical basis for the underwater applications of composite communication systems using multiple turbulence suppression techniques for complex beam transmission.
ObjectiveWith the expanding marine exploitation, high-speed long-reach underwater wireless communication has caught extensive attention. Compared with underwater acoustic communication and radio frequency communication, underwater wireless optical communication (UWOC) features a high data rate, great confidentiality, and large data capacity. Nevertheless, the challenging underwater environment exerts a significant effect on underwater light transmission. Absorption, scattering, and communication distance change may lead to a great variety of detection optical intensity, and the link misalignment between the transmitter and receiver caused by turbulence can also realize this. Nonlinear distortion or loss of receiver signal will be resulted in. Optical receivers generally employ variable gain amplification circuits to process dynamic signals to mitigate these effects. However, existing UWOC systems have some shortcomings. Limiting amplifier is generally applicable to optical communication systems of on-off keying modulation digital transmission. Automatic gain control (AGC) circuit generally adopts a detector to detect the changes in output signal amplitude to form a gain control feedback loop. In this feedback loop, the time to reach a stable operating state is affected by its characteristics, and the AGC adjustment time is fixed, with hysteresis in gain control. We propose an adaptive light intensity detection circuit, which utilizes automatic gain control technology to adjust the amplification of the received signal and output stable electrical signals. This adaptive light intensity detection circuit has the advantages of fast response time and better real-time performance. We hope that our proposed method can improve the practicality of UWOC systems, aiming for optical communication systems in complex environments.MethodsOur proposed circuit is based on the characteristics of the direct-current-biased optical optial orthogonal frequency division multiplexing (DCO-OFDM) signal. The circuit takes advantage of the proportional relationship between the amplitude of the DC signal and the AC signal in the DCO-OFDM signal, and logarithmically amplifies the DC signal to form a control voltage to adjust the amplification of the AC amplifier circuit. The circuit leverages the AGC technique to adjust the amplification of the received signal and output a stable electrical signal. First, relevant parameters of the adaptive light intensity detection circuit are analyzed theoretically and verified by simulations, and then the circuit is designed and tested experimentally for air and underwater channels. The output signal of the adaptive light intensity detection circuit and the relationship between the control voltage formed by the logarithmic amplifier circuit and the gain of the circuit are investigated and compared with theoretical values. Then, this circuit is applied to an optical communication system for ethernet communication experiments at different distances.Results and DiscussionsOur proposed circuit can realize automatic gain adjustment to output stable electrical signals, thereby expanding the optical communication system receiver's dynamic range of signal processing. Preliminary experiments are carried out to obtain the relationship between the AC signal and DC signal (Fig. 7). According to this relationship, we adjust the parameters of the designed circuit and further investigate the performance of the UOWC system through this circuit. The results of the air channel experiment show that when the light intensity changes, and the DC voltage varies from 18 mV to 1300 mV, and the output signal's peak-to-peak value in the variable gain amplifier circuit can be stabilized around the set value with a fluctuation range of -3.3%-3.3% (Table 3). As depicted in Figs. 8(a) and 8(b), when the DC signal changes, the AC signal is stable. Then the logarithmic amplifier circuit's parameters are tested. Table 4 lists the theoretical and measured values of the control voltage. The results show that the designed logarithmic amplifier circuit realizes the desired function. The DC signal in the DCO-OFDM signal generates a gain control voltage to the AC signal (Fig. 9). Experiments for the underwater channel indicate that when the communication link is misaligned and the signal strength changes, the DC signal varies in the range of 356-890 mV and the peak-to-peak value of output signal is stable with a fluctuation range of -3.3%-3.3% (Table 6). Finally, we experimentally demonstrate a 45 Mbit/s optical communication link over a 6 m air channel through the adaptive light intensity circuit in an optical communication system receiver (Fig. 14).ConclusionsWe design an adaptive light intensity detection circuit based on the characteristics of the signal from an underwater optical communication system using DCO-OFDM modulation. The performance of the optical communication system in terms of received signals is experimentally analyzed for air and water as channel media. The feasibility of the circuit is demonstrated and verified in the experiment. The optical communication system which adopts an adaptive light intensity circuit shows good communication performance and robustness in various channels. When channel conditions such as link misalignment change, the peak-to-peak value of the circuit output signal is stable, and the maximum difference between the actual working gain and the ideal gain of the circuit is 0.29 dB. It is inferred from the experimental results that the circuit has better processing capability for dynamic signals. The adaptive optical intensity detection circuit employs DC signals to achieve gain control of AC signals with the advantages of simple structure, fast response, low circuit cost, and low output signal fluctuation. Additionally, it is expected to be widely applied in optical communication receivers to improve system performance.
ObjectiveAtmospheric turbulence limits the accuracy of data return and position adjustment over long distances, resulting in significant uncertainty in the long-axis beam tracking phase. With two-dimensional (2D) reflectors for beam tracking, the receiver does not need to transmit data back to the transmitter, but instead carries out short-axis tracking from the 2D reflector to the receiving antenna, which is convenient and less affected by the environment. At long distances, the laser beam passes from the transmitter to the 2D reflector with a significant beam expansion effect. In a 2D mirror-assisted acquisition pointing and tracking (APT) system, the difference from the conventional long-axis follow-through at the transceiver end is the need for short-axis follow-through from the 2D mirror to the receiver end. In the alignment control stage, the spot control needs to be maintained within the effective range of the detector. The detector target surface at the receiving end detects the offset information of the reflected light spot, and controls the servo mechanism through the tracking controller to adjust the optical axis of the reflected beam from the 2D mirror, so that the reflected beam pointing is adjusted. The diffused spot can completely cover the entire 2D mirror, but the laser beam reflected by a single 2D mirror is limited by the size of the mirror, and can only be reflected for the part of the beam that is diffused over a long distance. To improve alignment efficiency and optical energy utilization, we conduct a study on the employment of dual mirrors to control beam alignment for wireless optical communications.MethodsIn the alignment control of the 2D reflectors to the receiving antenna, a single-detector multi-actuator tracking control strategy is proposed.We use multiple 2D mirrors for beam tracking control. Multiple 2D mirrors are equivalent to one large mirror that can increase the reflection area. To distinguish the double-reflected light spot on the detection surface, a filter disc is inserted in the optical path between the reflector and the receiving end, and the filter, rotation is achieved by rotating the corresponding discs through motor control. When the attenuation filters on the two optical paths rotate at different speeds, the two beams of light at consecutive times will appear as two beams of light and dark alternating with different frequencies on the detecting surface, thus distinguishing the two light spots. We design and study a double-reflected spot identification and tracking control method for double-spot detection in the case of overlapping reflected spots. For the overlapping double-spot images with offset, a multi-spot/overlapping spot center extraction method is designed, and the binarised image after edge extraction is adopted to judge the overlapping spots by the shape factor. Then the spot image is segmented by quadratic overlapping spot segmentation based on least squares ellipse fitting, and segmentation is conducted for three cases of no overlapping, less overlapping, and more overlapping.Results and DiscussionsA system architecture employing multiple reflectors for beam alignment is proposed for wireless optical communication APT system, and a reflective spot alignment control method based on two 2D reflectors is investigated (Fig.1). The structure is simple and low-cost compared to the multi-transmitter-multi-receiver wireless optical communication system. By introducing a filter carousel module and applying different frequency perturbations to the reflected beams separately, a method for the discrimination and tracking control of double-reflected spots is designed and investigated for the double-spot detection in the case of overlapping reflected spots (Fig.2). The images of the two reflected beams received on the detection surface will differ depending on the rotation period of the filter disc (Fig.4). The higher the rotational speed of the discs, the smaller the rotational period, the more times the reflected beams are captured per unit of time, and the greater the total light intensity value on the detection surface at the corresponding moment. When the two discs are controlled to rotate at different speeds, there will be a difference in the number of bright spots captured on the detection surface per unit of time. Therefore, by observing the number of bright spots captured on the detection surface per unit of time, it is possible to achieve the purpose of distinguishing between two spots within the field of view of the camera at the receiving end.ConclusionsAfter many statistical calculations, the standard deviation of the positioning of the spot center position does not exceed 0.2 pixel when there is no overlap of the spots, and the standard deviation of the positioning of the spot center position stays below 0.5 pixel when there is overlap of the spots. The smaller the degree of overlapping Roverlap of the two spot images, the better the stability, and the stability of the non-overlapping spot is better than that of the overlapping spots as a whole, so the proposed algorithm has good effect on the separation of overlapping spots.
ObjectiveWhen a laser is transmitted in the atmosphere, atmospheric turbulence causes random fluctuations in the received light intensity, which seriously affects the performance of the free space optical (FSO) system. At the same time, the phase noise introduced by the electrolytic modulator module in the M-th quadrature amplitude modulation (MQAM) FSO system can cause the signal phase to shift, leading to degradation of demodulation performance and an increase in system error rate. Therefore, it is crucial to design a high-performance adaptive transmission scheme that can alleviate the severe degradation of optical signal transmission caused by atmospheric channels. The atmospheric turbulence effect in atmospheric channels is a slow fading process compared with high-speed coded modulation systems. By mapping the constellation points in the outer circle of the constellation map to a position close to the constellation origin with a certain probability and rules and sending and transmitting the mapped constellation points, probability shaping (PS) is achieved. Therefore, it is feasible to optimize the source distribution of the MQAM encoding FSO system and achieve adaptive adjustment of the transmitter signal constellation distribution based on channel conditions. In summary, we propose an adaptive PS system model in atmospheric channels that considers the combined effects of Gamma-Gamma turbulence and phase noise. This scheme can effectively improve the capacity of FSO communication links with QAM and suppress the impact of atmospheric turbulence on FSO systems.MethodsWe consider the comprehensive impact of atmospheric turbulence and phase noise of the electrolytic modulation module on the performance of optical communication systems. A model describing the combined effects of phase noise and atmospheric turbulence is constructed using Tikhonov distribution and Gamma-Gamma turbulence model. By iteratively searching through the particle swarm optimization algorithm in the heuristic algorithm, we obtain the optimal probability distribution under the condition of maximizing the decoding rate of the bit metric and realize rate adaptation with the bit metric decoding rate as the objective function through adaptive 16QAM PS technology. We also evaluate the error transmission performance of the system through pre-FEC BER and NGMI threshold before FEC decoding and investigate the effects of different turbulence intensities, phase noise, and fixed turbulence intensities with varying phase noise levels on the decoding rate, pre-FEC BER, and NGMI performance of contrast metrics.Results and DiscussionsA practical 16QAM encoding modulation FSO scheme with adaptive PS is proposed to address the issue of traditional channel coding techniques in FSO being susceptible to turbulence fading effects and the low achievable information rate of the system in conventional encoding uniform distribution mode. Compared with uniform distribution: the PS scheme can effectively improve the BMD rate under the combined influence of turbulence and phase noise; PS technology can improve bit error rate performance, and this improvement can be more pronounced in modulation schemes with lower entropy. The shaping gain between the PS scheme corresponding to the three information entropies and the uniform distribution under weak turbulence increases with the increase of BER.ConclusionsWe design a practical adaptive FSO coding modulation scheme based on PS. Due to the constraint of transmission rate, the optimization problem becomes non convex, increasing the complexity of the optimization process. Therefore, a heuristic algorithm is used to solve the optimization problem. The optimal probability distribution of the source is obtained by maximizing the bit metric decoding rate, and an adaptive PS signal-to-noise ratio threshold lookup table is established based on the optimal bit metric decoding rate switching point, greatly improving the capacity of the QAM FSO system. In addition, we also evaluate the NGMI and pre-FEC BER performance of the proposed scheme. The simulation results show that by considering the combined effects of phase noise and atmospheric turbulence, the adaptive PS scheme with non-uniform distribution can achieve a maximum shaping gain of 4.8 dB compared with uniform distribution. Moreover, when the turbulence intensity is constant, the increase in phase noise has a greater impact on the selected PS distribution under low signal-to-noise ratio. Therefore, PS technology brings a better compromise between effectiveness and reliability for the performance of the 16QAM modulation format system in FSO communication.
ObjectiveThe vision-based navigation and localization system of China's "Yutu" lunar rover is controlled by a ground teleoperation center. A large-spacing traveling mode with approximately 6-10 m per site is adopted for the rover to maximize the driving distance of the lunar rover and improve the efficiency of remote control exploration. This results in a significant distance between adjacent navigation sites, and considerable rotation, translation, and scale changes in the captured images. Furthermore, the low overlap between images and the vast differences in regional shapes, combined with weak texture and illumination variations on the lunar surface, pose challenges to image feature matching among different sites. Currently, the "Yutu" lunar rover employs inertial measurements and visual matches among different sites for navigation and positioning. The ground teleoperation center adopts inertial measurements as initial poses and optimizes the poses with visual matches by bundle adjustment to obtain the final rover poses. However, due to the wide baseline and significant surface changes of images at different sites, manual assistance is often required to filter or select the correct matches, significantly affecting the efficiency of the ground teleoperation center. Therefore, improving the robustness of image feature matching between different sites to achieve automatic visual positioning is an urgent problem to be addressed.MethodsTo address the poor performance and low success rate of current image matching algorithms in wide-baseline lunar images with weak textures and illumination variations, we propose a global attention-based lunar image matching algorithm by the view synthesis. First, we utilize sparse feature matching methods to generate sparse pseudo-ground-truth disparities for the rectified stereo lunar images at the same site. Next, we finetune a stereo matching network with these disparities and perform 3D reconstruction for the lunar images at the same site. Then, we leverage inertial measurements among different sites to convert the original image into a new synthetic view for matching based on the scene depth, addressing the low overlap and large viewpoint changes among images of different sites. Additionally, we adopt a Transformer-based image matching network to improve matching performance in weak-texture scenes, and an outlier rejection method that considers plane degeneration in the post-processing stage. Finally, the matches are returned from the synthetic image to the original image, yielding the matches for wide-baseline lunar images at different sites.Results and DiscussionsWe conduct experiments on the real lunar dataset from the "Yutu 2" lunar rover (referred to as the Moon dataset), which includes two parts. The first part is stereo images from five continuous stations (employed for stereo reconstruction), and the second is 12 sets of wide-baseline lunar images from adjacent sites (for wide-baseline image matching testing). In terms of lunar 3D reconstruction, we calculate the reconstruction error within different distance ranges, where the reconstruction network GwcNet (Moon) yields the best reconstruction accuracy and reconstruction details, as shown in Table 1 and Fig. 4. Meanwhile, Fig. 5 illustrates the synthetic images obtained from the view synthesis scheme based on the inertial measurements between sites and the scene depth, which solves the large rotation, translation, and scale changes between adjacent sites. For wide-baseline image matching, existing algorithms such as LoFTR and ASIFT have matching success rates of 33.33% and 16.67% respectively as shown in Table 2. Our DepthWarp-LoFTR algorithm achieves a matching success rate of 83.33%, significantly improving the matching success rate and accuracy of wide-baseline lunar images (Table 3). Additionally, this algorithm increases the matching success rate from 16.67% to 41.67% compared to the ASIFT algorithm. We present the matching results of different algorithms in Fig. 7, where DepthWarp-LoFTR obtains more consistent and denser matching results compared to other methods.ConclusionsWe propose a robust feature matching method DepthWarp-LoFTR for wide-baseline lunar images. For stereo images captured at the same site, the sparse disparities are generated through a sparse feature matching algorithm. These disparities serve as pseudo-ground truth to train the GwcNet network for 3D reconstruction of lunar images at the same site. To handle the wide baseline and low overlap of images from different sites, we propose a view synthesis algorithm based on scene depth and inertial prior poses. Image matching is performed on the synthesized current-site image and the next-site image to reduce the feature matching difficulty. For the feature matching stage, we adopt a Transformer-based LoFTR network, which significantly improves the success rate and accuracy of automatic matching. Our experimental results on real lunar datasets demonstrate that the proposed algorithm greatly improves the success rate of feature matching in complex lunar wide-baseline scenes. This lays a solid foundation for automatic visual positioning of the "Yutu 2" lunar rover and subsequent routine patrols of lunar rovers in China's fourth lunar exploration phase.
ObjectiveThe components such as water vapor and aerosol in the atmosphere can lead to the blurring of high-resolution satellite remote sensing images, and the image quality will be seriously undermined. By means of multispectral imaging technology, an atmospheric correction instrument and the satellite main camera can obtain the atmospheric parameters in the same region at the same time, and the atmospheric correction for remote sensing images is carried out to improve the image quality. In the field of spectral imaging, CCD detectors are applied by most traditional cameras. However, with the rapid development of technology, CMOS detectors have been able to compete with CCD in terms of quantum efficiency, noise level, dynamic range and other key performance parameters, and have the tendency to gradually replace CCD detectors. To fill the gap of domestic scientific CMOS detectors in the field of space spectral imaging, we design a set of CMOS imaging electronics systems with high reliability and signal-to-noise ratio based on the scientific CMOS detector HR400 of Gpixel for the multispectral imaging requirements of a correction instrument project. Besides, a dynamic time-delay imaging method is proposed according to the characteristics of its filter wheel imaging, which solves the problem of polarization azimuth deviation caused by the variation of exposure time and provides a reference for the design of similar instruments.MethodsThe system architecture is based on field programmable gate array (FPGA) and static random access memory (SRAM) buffer. The driver design and image acquisition technology of CMOS detectors is discussed in detail. To address the problem that the variation of the exposure time of the filter wheel multispectral cameras will lead to the difference in the polarization azimuth, the influence of the imaging position on the polarization azimuth is analyzed first. Then, combined with the working principles of the rolling shutter CMOS detectors, a time-delay imaging method is proposed, which can be dynamically adjusted according to the exposure time. The driving schedules are designed to complete the simulation verification, and the position error of the imaging center in the dynamic time-delay imaging method is analyzed. In the stage of image storage, a 2×2 binning method is devised to improve the image signal-to-noise ratio. Finally, a test platform is built to test the imaging quality of the camera, and the signal-to-noise ratio and dark noise of the imaging system are also tested. An experiment is conducted to compare the polarization azimuth before and after using the dynamic time-delay imaging method.Results and DiscussionsFor the filter wheel of multispectral polarization cameras, if the incoming light spot is taken as the starting point of imaging, the imaging center positions of the same channel are not consistent under different exposure time. The angle positions of the motor change with the variation of exposure time in the actual imaging. The increase in the difference in exposure time is accompanied by the enlargement of the difference in the polarization azimuth angle of the actual imaging (Fig. 2). The time sequence simulation of the dynamic time-delay imaging method shows that the different delay time before imaging can ensure the positions of the imaging exposure center are consistent under different integral time (Fig. 7). The angle position errors of the motor with dynamic delay compensation are about ±0.087°, which is mainly affected by the motor positioning error, with weak influences from other error sources (Table 1). The image quality test results show that the temporal dark noise is 71.6 (equivalent electron number) and the SNR is 588.1 when the system light intensity is 80% of saturation light intensity, meeting the requirements of the camera (Table 2). In addition, with the addition of delay compensation, the maximum deviation of polarization azimuth angle measured under different exposure time is less than 0.22°, which is greatly improved compared with the method without delay compensation. The time-delay imaging method can significantly reduce the polarization azimuth difference caused by exposure time (Table 3).ConclusionsIn this paper, an imaging electronics system based on the scientific CMOS detector HR400 of Gpixel is established according to the functional requirements of multispectral cameras and the characteristics of aerospace applications. The system structure is introduced in detail, and the driver design and image acquisition technology of CMOS detectors are discussed in particular. To address the problem of polarization azimuth difference caused by the variation of exposure time of the filter wheel of multispectral cameras, we analyze the influence of imaging position on polarization azimuth. The greater difference in exposure time is coupled with the greater difference in the polarization azimuth angle of actual imaging. Then, a time-delay imaging method is proposed, which can be dynamically adjusted according to the exposure time. The angle position errors of the motor with dynamic delay compensation are about ±0.087°, mainly affected by the motor positioning error, and the influences from other error sources are less strong. Experimental results show that the time-domain dark noise of the imaging system is 71.6 (equivalent electron number), and the signal-to-noise ratio is 588.1 when the system light intensity is 80%, which meets the requirements of camera imaging. The maximum deviation of polarization azimuth angle measured at different exposure time is less than 0.22°. Therefore, the system is expected to provide some valuable references for the in-orbit application of domestic CMOS imaging sensors and the design of similar satellite-borne remote sensing instruments.
ObjectiveOn-orbit radiation calibration is part of spectral imager calibration of polar-orbiting meteorological satellites, and also an important technical means to achieve highly quantitative remote sensing data. Onboard calibrators take the sun as a long-term stable reference light source and the diffuse transmission plate of the calibrators as the reference transmission medium, the calibration accuracy of which directly determines the onboard calibration accuracy. According to the orbital characteristics of the Fengyun-3E satellite and the working mode of the spectral imager, the onboard calibrator adopts the special form of diffuse transmission plate. Meanwhile, we study the high-precision performance testing technology of the calibrator and propose an outfield calibration method for diffuse transmission plate based on a standard spectrometer. We solve the calibration problems such as large-aperture and high-brightness uniform test light source and high-precision automatic control overlay of test angle matrix in the bidirectional transmittance distribution function (BTDF) of diffuse transmission plates.Fengyun-3E satellite is in the morning and dusk polar orbit, and its spectral imager employs scanning mirror to observe cold space, earth, diffuse transmission plate, and black body in turn. As an onboard radiation reference in the solar reflection spectral band, the diffuse transmission plate can receive direct light from the sun to form a near-Lambertian light source. The imager scanning mirror observes the diffuse plate in the normal direction to obtain radiation input and complete the radiation calibration of the solar reflection band. The imager calibration in orbit is shown in Fig. 1.MethodsThe whole calibration test project includes two aspects of diffuse plate BTDF, spectral dimension distribution and angular dimension distribution. 1) Spectral dimension distribution test: under the perpendicular incidence of the sun (normal direction, zenith angle is 0), different radial brightness is obtained by the changing atmospheric quality at different times of the day for BTDF spectral distribution data of 0 incident zenith angle of the diffuse plate. When the sun shines on the diffuse plate, the standard spectrometer obtains a mathematical model of the diffuse plate outgoing radiation brightness, as shown in Equation 5. 2) Angular dimension distribution test: during the period of slow changes in the sun zenith angle at noon, the incidence angle θ of the solar rays changes by adjusting the pitch angle and horizontal angle of the scaler to obtain the relative distribution of the diffuse plate BTDF under different solar incidence angle θ, as shown in Equation 6.Results and DiscussionsThe test data of Figs. 6-8 show that the atmospheric transmittance on the test day is high and stable, with high linearity of the fitting curve. The spectral transmittance of the diffuse transmission plate in the range of 400-1000 nm is flat (except for atmospheric absorption peaks such as 760 nm and 940 nm), and the transmittance value can meet the design expectations and on-star calibration design. Figs. 9-11 demonstrate that in the pitch direction and horizontal direction, the BTDF does not change significantly with the angle and is close to 1, indicating that the diffuse transmission plate has better Lambertian properties. According to the results of the current on-orbit test, the overall deviation between the calibration coefficient obtained by the onboard scaler and the cross-calibration coefficient of the imager from the international load is better than 2%, revealing that the on-orbit application of the scaler has reached the design expectations.ConclusionsWe propose an outfield radiation calibration method of diffuse transmission plate based on standard spectrometer. The test site is selected in the stable atmospheric transmittance area at high altitude and high latitude. The spectral distribution and angle distribution of the diffuse plate BTDF are obtained through the reasonable design of the test process and time period selection. The method adopts the outfield sun as the reference light source, the standard spectrometer for traceability transmission, and the 2D high-precision automatic tracking turntable for angle transformation to obtain the BTDF of the diffuse transmission plate. The results show that this method can obtain an accurate BTDF of the diffuse transmission plate, and the calibration accuracy is better than 2.5%, which can meet the on-orbit calibration accuracy requirements of the on-orbit calibrator. The consistency of the onboard calibration coefficient of the instrument in the orbit test stage with the cross-calibration of similar loads is better than 2%.
ObjectiveSea surface skin temperature (SSTSkin) is the seawater temperature at a depth of about 10 μm. Satellite infrared radiometers can be employed to obtain long-time series of SSTSkin data over a large area. However, as their accuracy can be easily affected by the environment, it is necessary to adopt field data to verify their data accuracy. When obtaining field data, the spatio-temporal mismatch of the sea-sky field of view will introduce uncertainties to the measurement. Thus, we propose an SSTSkin correction method, which utilizes a circulating water-film device designed, a non-cooled infrared thermal imager, and corresponding algorithms to calculate sky radiation. Compared with applying an infrared radiometer to measure sky radiation, this method can indirectly obtain the sky radiation distribution over a larger range. Additionally, the infrared thermal imager simultaneously observes the circulating water-film device and sea surface to realize the synchronous measurement of sky radiation and sea surface radiation. Therefore, this method can reduce the error introduced by the spatio-temporal mismatch of the sea-sky field of view and lower the measurement equipment cost, thus obtaining high-precision SSTSkin.MethodsThe infrared thermal imager operates in the 8–14 μm spectral bands. Therefore, when the imager measures the SSTSkin, the total radiation received in the corresponding band is composed of two parts, including radiation emitted by the sea surface and downward radiation from the sky reflected by the sea surface. Thus, after knowing the received radiation, if the sea surface emissivity and the sky radiation can be obtained, the accurate SSTSkin can be inverted. According to the empirical formula, the sea surface emissivity is 0.97994 when the observation angle is 45°. To obtain the sky radiation distribution and reduce the instrument cost, we design the circulating water-film device whose surface can form a smooth water film with uniform temperature. The cold skin effect is the phenomenon where the seawater temperature at the sea-air interface is lower than that of the deeper seawater. In the circulating water-film device, the surface layer of the water film and the water body below the surface layer are fully mixed through the water circulation. Finally, the differences between the skin temperature (depth of about 10 μm) and the water body temperature are eliminated to accurately measure the water-film skin temperature. Based on knowing the true skin temperature of the water film and the measured value of water-film skin temperature by the thermal imager, the sky radiation can be obtained by combining it with the radiation characteristics of the water film. After calculating the sky radiation, the influence of the sky radiation on SSTSkin measurement can be removed by the sea surface emissivity to obtain accurate SSTSkin data. Based on this theory, combined with the circulating water-film device and the thermal imager, we design two SSTSkin correction schemes. Meanwhile, a comparison scheme that employs the sky radiation measured by the infrared radiometer to correct the measured SSTSkin value is formulated to verify the correction effect of the designed two schemes.Results and DiscussionsIn indoor simulation experiments, a background radiation simulation panel is leveraged to simulate the sky with uniform brightness temperature distribution. After correction, the thermal imager's measurement error of water-film surface temperature decreases from 0.203 K to 0.005 K (Fig. 6). In outdoor experiments, when the sky radiation varies in time and space, the designed two schemes are better than the comparison scheme in correcting measurement of water surface temperature, indicating that the two schemes can reduce the error introduced by the spatio-temporal mismatch of the sea-sky field of view (Fig. 10 and Table 1). Before algorithm correction, the average value of water surface temperature measurement error is -0.503 K. After the correction with Scheme 1, the error is -0.081 K. After the correction with Scheme 2, the error is -0.041 K.ConclusionsWe propose an SSTSkin correction method by the circulating water-film device and the infrared thermal imager, which can reduce the error introduced by the spatio-temporal mismatch of the sea-sky field of view. In the circulating water-film device, the water-film skin temperature can be accurately measured by the thermometer through the water circulation. This method employs the thermal imager to measure the skin temperature of the water film and seawater simultaneously and corrects the measured SSTSkin value through the differences between the real and measured values of water-film skin temperature. As a result, the influence of sky radiation on the SSTSkin measurement can be removed and accurate SSTSkin data is obtained. In indoor simulation experiments, after correction, the thermal imager's measurement error of water-film surface temperature decreases from 0.203 K to 0.005 K. In outdoor experiments, after correction, the thermal imager's measurement error of water surface temperature decreases from -0.503 K to -0.041 K. The experimental results show that the proposed method can improve the measurement accuracy of water surface temperature when sky radiation is variable in time and space, and reduce the measuring equipment cost. In the future, this system will conduct on-site SSTSkin measurement comparison experiments with an infrared sea surface temperature autonomous radiometer (ISAR). We hope to study the influence of sky radiation on the temperature measurement accuracy of the rough sea surface to further improve the proposed method, providing a new technical approach for obtaining field SSTSkin data to verify satellite remote sensing data.
ObjectiveThe Lyot filter is a key device for narrow-band imaging observations of the solar atmosphere, and is widely employed for solar photospheric magnetic field measurements and solar chromospheric imaging observations. The mechanically rotating waveplate speed is around 3-5 s, and the long wavelength switching speed limits the solar atmospheric observation efficiency. If rapid wavelength tuning can be achieved, the effect of turbulent atmosphere on the signal can be somewhat eliminated by smoothing multiple sets of data. The liquid crystal variable retarder is an electronically controlled polarization element, and its utilization for phase instead of rotating waveplates can significantly increase the speed of filter spectral line scanning. There are successful examples of adopting liquid crystals to adjust the transmission band wavelength of Lyot filters. However, the spectral line widths of magnetically sensitive spectral lines leveraged for solar photospheric magnetic field measurements are narrow, typically between 0.1 ? and 0.3 ?. Therefore, a very narrow transmitting band is required for the filter, usually with a FWHM below 0.1 ?. The extremely narrow transmission band puts forward higher demands for the installation, calibration, and control of the filter. Thus, we propose to develop an extremely narrow FWHM liquid crystal filter for solar magnetic field measurements.MethodsWe present the development, calibration, and observation verification of a multi-stage liquid crystal Lyot filter with an FWHM of 0.1 ?. First, the optical and electrical control design of the filter is shown. The filter consists of multiple polarizing elements and liquid crystals. Second, the characteristics of the liquid crystal variable retarder are tested by a Mueller matrix spectrometer. The Mueller matrix of the test sample is first obtained, and then the phase retardation and fast axis azimuth parameters are estimated. The time stability, spatial uniformity, and electrical resolution of the liquid crystal variable retarder in the filter are obtained. Then, the filter wavelength is calibrated by a high-resolution solar spectrometer. The FWHM of the filter is measured and the central wavelength of the filter is aligned to the target position. Finally, the liquid crystal filter is placed on the NVST experimental platform for observation and verification. The optical image quality of the filter is measured by a test target, and a clear monochromatic image of the solar photosphere is obtained by fast multi-wavelength observation. The Doppler velocity is calculated by the multi-wavelength monochromatic image.Results and DiscussionsThe filter FWHM is measured to be 0.1 ? with a central wavelength of 5324.19 ? (Fig. 9), and the filter wavelength switching speed is less than 100 ms (Fig. 6). The filter optical image quality meets the imaging requirements of NVST diffraction limit in the NVST solar photospheric narrow-band observation system. The resolution of the liquid crystal filter-based solar narrow-band observation system can reach 0.1284" (Fig. 11). Different atmospheric structures can be found in monochromatic images of different wavelengths of the solar photosphere (Fig. 12). Doppler velocities are calculated using multi-wavelength images, which agree with the HMI results in the quiet region (Fig. 13). The filter employs a pre-filter with a 1 ? blue shift in the central wavelength compared to the target wavelength, and there is leakage risk in the secondary transmission band under the too large offset band. The peak transmittance of the filter can be improved by replacing the polarizer in the Lyot unit at each level with a polarizer with higher transmittance.ConclusionsWe develop a six-stage liquid crystal Lyot filter for solar photospheric magnetic field measurements. This filter has a higher wavelength tuning speed than the conventional filters. The filter has an FWHM of 0.1 ? and can be adopted for scanning observations of the magnetically sensitive spectral lines of the sun's photosphere. The instrumental performance of the liquid crystal filter is verified by observations in the NVST solar photospheric narrow-band observation system. Multi-wavelength high-resolution monochrome images are obtained efficiently. The high-quality image data can be leveraged for quantitative calculation of Doppler velocity and other physical parameters. The measured results show that the spectral line scan speed of the filter is greatly improved compared with that of the conventional filters, and the transmittance half-width and other parameters meet the design requirements. The filter performance has significant features and performance advantages over the conventional filters and meets the high-resolution observation requirements of the solar photospheric magnetic and velocity fields of NVST.
ObjectiveProper orthogonal decomposition (POD) method has been widely applied to time-dependent field analysis, but its direct method and snapshot method both have their inherent problems. The former makes it difficult to solve eigenvalues and eigenvectors of correlation matrices, and the limited sampling number of the latter will affect statistical random field analysis. The direct method needs to solve eigenvalues and eigenvectors of spatial correlation matrices, and the correlation matrix dimensions are the spatial discrete points of the field. When there are more discrete points in the space, the matrix dimensions are high, which results in a large amount of computation, consumed time, occupied memory, and even difficult solutions. The snapshot method is to solve temporal correlation matrices. Generally, by sampling about 200 frames, the correlation matrix dimensions and computation amount are significantly reduced, which makes the POD method practical and operable. However, the few sampling frames will affect the statistical analysis of random field modes, and the calculated modes will vary with the frame number and interval time between frames. Thus, the Zernike and proper orthogonal decomposition (Z-POD) method based on the Zernike polynomial weighted coefficient is established for statistical wavefront mode analysis of aero-optical effects.MethodsThe Z-POD method which introduces the wavefront reconstruction method based on Zernike polynomials is changed from the decomposition of the wavefront itself to that of the weighted coefficients of Zernike polynomials. For the circle domain, given the Zernike polynomial order, weighted coefficients correspond to wavefront distribution one by one, and polynomials of several hundred orders are usually enough to recover various complex wavefront shapes. Since the polynomial order is far less than the discrete point number in the wavefront space, the correlation matrix dimensions are reduced, with reduced computation amount and significantly improved computation calculation efficiency. The Z-POD method does not lose spatial resolution and does not need to limit the maximum samples. Therefore, the temporal statistical characteristics are not affected and predicted wavefront modes have high spatio-temporal resolution.Results and DiscussionsTo verify the effectiveness of the Z-POD method, we employ the large eddy simulation (LES) method to simulate flow around a cylinder and calculate the time series aero-optical effect wavefront generated by the Karman vortex street structure in the cylinder wake for wavefront modal analysis. The spatial resolution of the wavefront is 100×100, the sampled frame number is 20000, and the order of Zernike polynomials is 217. First-order mode and steady-state wavefront distribution are similar (Fig. 7), second-order and third-order modes, and fourth-order and fifth-order modes are approximately paired with each other (Fig. 8). The first ten modes can restore the wavefront shape, the first 49 modes contain more than 97% energy, and the wavefront reconstructed with the complete modes has no essential differences from the original wavefront (Figs. 9 and 10). The modal weighted coefficients and their power spectrum decrease with increasing order. The peak frequencies of the power spectrum of weighted coefficients of the first five modes are consistent with those of fluctuation velocity at the center point of the optical window, corresponding to the main frequency of Karman vortex street, with the Strauhal number of about 0.22 (Figs. 3 and 11).ConclusionsAs it is difficult for us to employ the POD method for statistical analysis of random fields with high spatial resolution and high sampling frames, the Z-POD method is proposed for wavefront modal analysis of time-dependent series aero-optical effects. Based on the original POD method, the Z-POD method introduces wavefront reconstruction based on Zernike polynomials and carries out POD of the weighted coefficients of Zernike polynomials instead of the wavefront itself. Since wavefront reconstruction based on Zernike polynomials has the function of dimensionality reduction for wavefront, the complex wavefront shape can be usually restored with polynomials of several hundred orders, and there is no strict restriction on the number of discrete points and sampling frames of wavefront. Therefore, the correlation matrix dimensions for the Z-POD method are significantly reduced, the computational efficiency is significantly improved, and the wavefront modal analysis can be guaranteed to have a sufficiently high spatio-temporal resolution. In the time series data analysis of wavefront by Karman vortex generated in the wake flow around a cylinder, the Z-POD method also has the advantage of restoring the original wavefront shape with a few modes, and the energy ratios of the first order, 10th order, and 49th order modes are above 44%, 88%, and 97% respectively. Additionally, the wavefront reconstructed with the whole 217 modes is not substantially different from the original wavefront. The Z-POD method has been authorized by a China National invention patent. Since the wavefront reconstruction method based on Zernike polynomials is also applicable to the ring domain and square domain, it is also suitable for statistical analysis of wavefront modes on such domains, and can also be extended to analysis and processing of images, flow fields, and signals on two-dimensional fields.
ObjectiveLow-orbit quantum satellites are part of building a global secure communication network. However, as single quantum satellites move fast relative to ground terminals with limited service time and the satellite-ground quantum link is susceptible to atmospheric conditions (e.g. rain, snow, haze, etc.), ground end-users need to switch to other satellites available for service in time to meet the sustainable communication demands. In the common coverage area, if the user only chooses the currently proposed single-attribute decision strategy, such as the minimum communication elevation angle, the optimal entanglement degree or the minimum link attenuation, the optimal single attribute can be achieved with losing the advantage of other attributes. This will easily result in load imbalance and uneven resource allocation of quantum satellites, and even communications may be interrupted in serious cases. To this end, we consider the attenuation interference of snowfall on the satellite-ground link and the process of end-user-associated switching of quantum satellites, and build a multi-attribute evolutionary game switching model to achieve Nash equilibrium in the allocation of quantum satellite resources. Meanwhile, satellite resource allocation can be maximized to enhance the switching success rate of users in the low earth orbit (LEO) quantum satellite communication network.MethodsEvolutionary game theory combines biological evolutionary properties with game theory to make the system stable through constant comparison and imitation in multiple choices. In actual quantum satellite switching, the users switching satellites at the same time do not know each other's state information in a completely rational way, which satisfies the non-rational conditions of evolutionary games. We analyze the quantum channel attenuation characteristics under snowfall and atmospheric turbulence according to the Gamma spectral distribution function of snow and obtain the variation of channel attenuation with transmission distance. The bandwidth that can be allocated to users by the quantum satellite corresponds to the current satellite load state, which means that more users result in fewer quantum satellite bandwidth resources available to each user. The longer remaining service time of the quantum satellite indicates that the selection of this strategy prolongs the service cycle of the user and reduces the user switching number. The communication elevation angle reflects the channel condition of the satellite-ground link, and the larger communication elevation angle leads to shorter communication distance, lower link attenuation, and better channel conditions. As the elevation angle is difficult to measure in real time with the terrain environment obstruction, the measured elevation angle cannot reflect the channel conditions, and thus the communication elevation angle is converted into the link attenuation characteristics which can directly represent the channel conditions. Therefore, we define a utility function based on the user's bandwidth, remaining satellite service time, and link attenuation, and define an overhead function based on the inter-satellite transmission delay and channel entanglement to obtain the user's payoff function. Finally, we derive the dynamic replication equation of the satellite to build an evolutionary game switching model.Results and DiscussionsFirstly, the effect of snowfall on the satellite-ground link attenuation is analyzed. Under certain snowfall intensity, the total attenuation suffered by the link increases as the light quantum propagation distance rises. In the case of a certain propagation distance of the light quantum signal, as the snowfall intensity increases, the total communication link attenuation grows due to the scattering and absorption effect between the light quantum signal and snow particles in the atmosphere. It results in the subsequent increase in the total communication link attenuation, and the atmospheric snowfall environment will exert a significant influence on quantum satellite communications (Fig. 1). The number of users to be switched simultaneously is 1000 and the number of available strategies is 2. In the six switching experiments, the number of users selected for Quantum LEO1 varies with the iteration number (Fig. 3), and the number of users plateaus with the increasing iteration number, which demonstrates that the proposed quantum satellite multi-user switching strategy has sound convergence stability. As the game proceeds, the gains gradually converge to the average gain of all users and reach equilibrium by the sixth iteration. Then the users revenue do not increase and stabilize to ensure the multi-user fairness during the quantum satellite switching (Fig. 4). The single-attribute judgment switching method converges faster than the multi-attribute switching decision, and the number of users connected to Quantum LEO1 increases when equilibrium is finally reached, but this is at the expense of the other attributes (Fig. 5). Experimental results show that the switching strategy based on the evolutionary game improves the switching success rate by 1.2% over the switching strategy based on the lowest link attenuation (Fig. 6) under the switching user number of 660. When the minimum entanglement threshold is set to 0.8, the switching success rate of the evolutionary game-based switching strategy improves by 1.5% over the switching strategy based on the optimal entanglement (Fig. 7) under the switching user number of 700.ConclusionsAn evolutionary game-based quantum satellite switching strategy is proposed for the multi-user switching scenario of quantum satellites under a snowfall environment. Various attributes affecting the quantum satellite switching decision are analyzed and combined with the attenuation characteristics between quantum star-ground links to obtain the effect function, the overhead function, and then the average gain function of users. An evolutionary game model is built by considering the transmission among users and between users and quantum satellites, and the performance of the switching strategy using this model is simulated. The results show that the proposed strategy not only has sound stability with the influence among multiple attributes considered but also can make the quantum satellite load relatively balanced. Finally, compared with the single-attribute quantum satellite switching strategy based on minimum link attenuation and optimal entanglement, the proposed strategy can also improve the success rate of user switching more effectively, providing references for future multi-user dynamic switching design of low-orbit quantum satellite networks under snowfall interference environment.
ObjectiveThe high spatial and temporal resolution observations of the middle and upper atmosphere can promote the study of atmospheric circulation coupling mechanisms and improve the accuracy of medium- and long-term weather forecasting. The Rayleigh Doppler lidar (RDLD) is able to detect atmospheric temperatures and wind speeds above 30 km altitude. However, the signal-to-noise ratio of the high-altitude Rayleigh backscatter signal received by RDLD is extremely low. To ensure measurement accuracy, it is normally required to increase the measurement spatial and temporal resolution, as well as to optimize the signal transceiver efficiency of the lidar system. Doppler shift wind speed measurement requires high frequency stability of the emitted laser, and the output frequency of the traditional seed injection laser cannot be kept strictly the same as the seed laser. In this paper, a new RDLD is designed using a new seeder multi-stage series direct amplification multiplier laser and a polarization-splitting-based time-division multiplexing transmitter system. The problems of long integration time and unstable laser frequency consistent with existing RDLD are solved. Higher spatial and temporal resolution atmospheric temperature and wind speed measurements are obtained.MethodsThe system is equipped with a new laser system to output high repetition frequency and high energy pulsed laser. The laser is emitted into the atmosphere in vertical, westward, and northward directions in sequence by a polarization-splitting-based time-division multiplexing transmitter system. The atmospheric Rayleigh backscatter signal is coupled into a multimode fiber by the receiving telescope, combined into one way by a 3-in-1 optical fiber and sent into a iodine cell frequency discriminating receiver for atmospheric wind speed and temperature measurements. The simulation method is used to calculate the expected detection performance of the new RDLD design, and verify the feasibility of the new design. Finally, we built a set of RDLD according to the new design. The real atmospheric echo signal, atmospheric temperature and wind speed measurement results are obtained through the observation experiments. The real performance of the new RDLD system will be analyzed by comparing with the simulation results, and the accuracy of the measurement results will be confirmed by comparing with the atmospheric model and satellite measurement results.Results and DiscussionsThe simulation results of the new RDLD in Fig. 8 show that it can achieve simultaneous measurements of atmospheric temperature and zonal and meridional horizontal wind speed with a temporal resolution of 30 min and vertical distance resolution of 1 km. The detailed conditions of an integration time is 5 min for the vertical channel and 12.5 min for other two inclined channels. The theoretical measurement uncertainty of atmospheric temperature at 60 km altitude is 1.99 K, and the theoretical measurement uncertainty of zonal and meridional horizontal wind speed is 4.78 m/s. In the observation experiment (Fig. 9), the actual average measurement uncertainty of the atmospheric temperature of the new RDLD is 2.539 K, and the actual average measurement uncertainty of the zonal and meridional horizontal wind speed is 2.972 m/s and 2.575 m/s, respectively. The zonal and meridional horizontal wind speed average measurement result differs from the average model result by -2.327 m/s and -3.946 m/s in the altitude range from 30 km to 50 km, and the temperature average result differs from the average model result by 1.137 K (Fig. 10). In the altitude range from 50 km to 70 km, the zonal and meridional horizontal wind speed deviation increases to -5.904 m/s and -12.703 m/s, and the temperature deviation increases to 1.447 K. The difference between RDLD measurement and satellite measurement is 2.889 K and 4.038 K in the altitude ranges of 30-50 km and 50-70 km, respectively.ConclusionsThe proposed Rayleigh Doppler lidar applies a seeder multi-stage series direct amplification multiplier laser system for ground-based mid-atmosphere detection. The laser system provides high-frequency stability, high laser repetition frequency and high single pulse energy laser output through direct power amplification of the seeder by a multi-stage fiber amplifier and solid-state amplifier. The laser atmospheric echo signals received in three directions are combined by a 3-in-1 optical fiber and sent to the same set of iodine cells for Doppler discriminations, the wind speed measurement uncertainties introduced by calibration differences of multiple channels can be avoided. The simulations and experiments have shown that it can solve the problem of too-long signal integration. The polarization-splitting-based time-division multiplexing transmitter reduces the overall system's complexity. Experimental results demonstrate that the actual signal transceiving capability and measurement performance of the system have been close to that expected in theoretical simulation. After that, simultaneous measurements of atmospheric temperature and horizontal wind speed at vertical distance resolution of 1 km and time resolution of 30 min are obtained. The accuracy of the new RDLD measurement results is validated by the good agreement with the European Centre for Medium-Range Weather Forecasts (ECMWF) atmospheric model and Thermosphere Ionosphere Mesosphere Energetics and Dynamics (TIMED) satellite measurements.
ObjectiveAs commonly used spectroscopic elements, the dichroic mirror and the polarization beam splitter have been widely used in polarization lidar in recent years. Due to the non-ideal performance of the two optical components and the polarization error angle during installation, the depolarization ratio of the backscattered light in atmospheric detection will be affected to a certain extent. In the mainstream polarization lidar calibration methods, the influence of the polarization beam splitter on the polarization signal of the system is mainly considered, but in multi-wavelength polarization lidar systems, there will be two optical devices, namely the dichroic mirror and the polarization beam splitter. In addition, few studies discuss the effect of the depolarization ratio of the dichroic mirror on the atmospheric backscatter signal. The article focuses on the problem that only the influence of the polarization beam splitter is usually considered in the calibration of polarization lidar. Through the simulation method, the influence of the dichroic mirror, the polarization beam splitter, and the cascade of the two on the depolarization ratio of aerosols in the atmosphere is analyzed, with the error analysis given. We hope that relevant research in this article can be used to improve the detection accuracy of polarization lidar and the design of calibration methods.MethodsIn this article, we use the Stokes-Miller matrix method to analyze the influence of optical devices on the signal depolarization ratio. The simulated light of the backward scattered light of dust and cirrus clouds at the wavelengths of 532 nm and 1064 nm is used as the input, and the data on the depolarization ratio of dust and cirrus clouds are obtained by consulting the literature. We chose the dual-wavelength polarized lidar (532 nm and 1064 nm) receiving system as an example. The model of the selected dichroic mirror is DMPL900 produced by THORLABS, and the parameters of the polarization beam splitter are given by the relevant literature.Results and DiscussionsThe results show that the commonly used long wave-pass dichroic mirror will produce a change of 7.111% in the depolarization ratio under the transmission channel of 1064 nm, and the reflection channel of 532 nm has a change of 3.012% in the depolarization ratio (Table 2). When the position of the main polarization of the signal and the plane of incidence is changed, the depolarization ratio error does not change significantly. As the polarization error angle increases, the depolarization ratio error will be further increased (Fig. 4). When the error angle reaches 10°, the depolarization ratio error will increase by more than 15% on the original basis (Fig. 5). For polarization beam splitter, the depolarization ratio of dust detected at 532 nm and 1064 nm will produce relative error changes of 21.333% and 27.3%, respectively; the depolarization ratio of cirrus clouds detected at 532 nm will produce a relative error change of 14.2% (Table 4). By making the main polarization state of the signal perpendicular to the plane of incidence, the error of the depolarization ratio will be greatly reduced. With the increase in polarization error angle, the change in depolarization ratio is similar to the dichroic mirror (Fig. 9). Under the cascade of the two optical elements, the depolarization ratio of the simulated light also indicates an increase in accumulative errors (Fig.10).ConclusionsThe dichroic mirror and polarization beam splitter are important optical elements in the polarization lidar system. Studying the influence of the two optical elements on the depolarization ratio of atmospheric backscatter signals can be used for reference when the system calibration methods are designed. In this paper, the depolarization ratio of dust and cirrus clouds at two wavelengths is calculated by the Stokes-Miller matrix method after the depolarization ratio signal passes through the dichroic mirror and polarization beam splitter. The results show that the dichroic mirror has some influence on the depolarization ratio of the signal, and the transmission channel has more influence than the reflection channel. The polarization beam splitter will produce greater depolarization error for aerosols with a smaller depolarization ratio. The simulation results under the cascade of two optical elements show that the influence on the depolarization ratio is approximately the accumulation of the independent action of optical elements. In the analysis of the cascade case, the influence of the polarization beam splitter on the depolarization ratio is the largest. However, due to the addition of the dichroic mirror, the depolarization ratio error will increase by about 5% compared with the effect of the polarization beam splitter alone, and the error will be further increased when there is a polarization error angle during the installation of optical elements. The analytical method used in this paper can be used to calculate the detection accuracy of the depolarization ratio of the polarization lidar system and improve the design of the system calibration method. The above analysis method can also be used to evaluate the performance of the polarization lidar system with optical elements cascaded at more wavelengths.
ObjectiveVehicle odometer plays an important role in unmanned driving systems, and its main task is to determine the position and pose of the vehicle. The calculation method falls into two categories of visual odometry (VO) and LiDAR odometry (LO). VO is limited by illumination conditions, while LO is unaffected by illumination changes through active laser beam emission, making LO more suitable for vehicle odometry measurement than VO. However, the traditional LO algorithms face the problems of low accuracy and weak robustness when they are employed to register the continuous LiDAR frame point clouds without initial value and long sequence. We introduce an end-to-end point cloud registration network HRegNet and propose an LO computation algorithm using deep neural networks HRegNet-LO. Such a LO computation strategy exhibits strong robustness, good accuracy, and high efficiency, and we hope that the proposed algorithm can be helpful to the LO measurement.MethodsThe HRegNet-LO algorithm includes two core modules of front-end calculation and back-end optimization. The calculation is shown in Fig. 1.In frond-end calculation, scan-to-scan registration is conducted to obtain the transformation of adjacent two LiDAR frame point clouds. Firstly, HRegNet is employed to calculate a rough transformation matrix between two adjacent LiDAR frames without initial value by adopting the original point clouds. Secondly, according to point curvature, some feature points belonging to different categories are extracted from the original point clouds. Thirdly, the rough transformation matrix is refined by an iterative closest point (ICP) algorithm using feature points. Fourthly, LO initial pose is obtained by the sequence registration of the transformation matrix between two adjacent LiDAR frames.In back-end optimization, scan-to-map registration is conducted to adjust the LO initial pose. Firstly, a feature map is constructed using the initial LO pose and feature points. Secondly, by finding the corresponding feature points from the current LiDAR frame and feature map, a pose correctional value is obtained via the ICP algorithm. Thirdly, the LO pose of the current LiDAR frame is adjusted to reduce the estimated trajectory drift.Results and DiscussionsComprehensive experiments are carried out on the Kitti odometry dataset to evaluate and demonstrate the performance of the proposed HRegNet-LO algorithm. The LOAM, F-LOAM, and some other methods are compared with our method.Figures 5 and 6 show the qualitative results of HRegNet-LO on three experimental datasets. Figure 5 indicates that the measurement results of the HRegNet-LO algorithm along the x and z axes are in good agreement with the real pose information of the ground truth, while the measurement accuracy along the y axis is poor. This is because the point clouds obtained by the vehicle-mounted LiDAR system have more constraints in the horizontal direction (along the x and z axes), but fewer constraints in the vertical direction (along the y axis). Therefore, the positioning accuracy of the horizontal direction is better than that of the vertical direction. In practical applications, the horizontal component of LO measurement results is more important than the vertical component. To observe the horizontal measurement results of the proposed algorithm more clearly, Fig. 6 shows the aerial view of our algorithm's measurement results on the three testing datasets, where we can find that the horizontal component of the measured results is very close to the real path of the ground-truth. To conclude, the proposed algorithm can accurately realize the LO measurement only by LiDAR point clouds.Quantitative and comparison experiments are also conducted, whose results are shown in Fig. 7 and Table 2. In terms of relative rotation error (RRE) and relative translation error (RTE), our method almost obtains the best LO measurement results, and the RRE and RTE per 100 m can be controlled at about 0.3° and 1 m respectively, which can meet the positioning accuracy requirements in unmanned driving.Ablation experimental results are shown in Fig. 8 and Table 3, which show that the back-end optimization can improve the accuracy by about 70%.ConclusionsWe design a novel LO measurement method HRegNet-LO algorithm. The front-end calculation is realized by HRegNet deep neural network, and back-end optimization is realized by point clouds feature map. Experimental results show that the RRE and RTE of HRegNet-LO are about 0.003°/m and 1% respectively, and the consumed time of calculating each frame pose is about 100 ms. The proposed method can satisfy the accuracy and real-time requirements in LO measurement. However, we only consider using 3D coordinates of LiDAR point clouds to achieve LO measurement. Multi-system fusion methods such as integrated inertial navigation, vision, and LiDAR odometer measurement technology can be considered in subsequent studies to improve the reliability and accuracy of LO measurement results. Meanwhile, the generalization of deep neural networks also should be improved.
ObjectiveSatellite remote sensing characterizes fine surface information and is widely employed in military surveys, agriculture, human activity research, and other fields. Clouds cover about 60% of the sky on Earth and can block the imaging channels of optical satellites and reduce the number and quality of available pixels in images. As a special surface landform, ice-snow covers more than 40% of the northern hemisphere in winter. Both cloud and ice-snow will greatly affect the processing and analysis of remote sensing images. The spectral characteristics of clouds and ice-snow are similar in the visible light bands, which will result in unsatisfactory cloud detection over ice-snow, and misjudgment of clouds and ice-snow. In recent years, polarization detection technology has become a rapidly developing research field globally. Two polarization-loaded atmospheric aerosols directional polarized camera (DPC) and particulate observing scanning polarimeter (POSP) are carried on the hyperspectral observation satellite [Gaofen-5(02) satellite]. The "polarization crossfire" scheme of the two polarization loads has multi-angle and multi-spectrum observation capabilities with high-precision polarization and wide-swath imaging. Polar regions are covered by ice-snow all year round, and the reflectivity of clouds and ice-snow is high in the visible light bands, which makes it difficult to detect clouds in these regions. Therefore, it is of significance to conduct cloud detection research in typical regions such as polar regions based on the Gaofen-5(02) satellite data.MethodsWe employ both DPC and POSP data to perform cloud detection. First, DPC multi-angle polarimetric observations are adopted for the apparent pressure detection in the oxygen A-band. Next, multi-angle polarimetric signal clouds are added to examine water clouds over ice-snow, improving the accuracy of water cloud detection. Then, the cirrus cloud detection over ice-snow is improved by the detection of cirrus cloud bands. Finally, by analyzing the reflection properties of water clouds, ice clouds, and ice-snow in different wavebands, the waveband for the commonly utilized NDSI normalized snow index is increased to improve the detection accuracy of ice clouds over ice-snow. The optimal threshold values for each detection criterion are determined through a large number of statistical analyses of multiple regions sampled in different months.Result and DiscussionsTo verify the effectiveness of the algorithm, we apply it to cloud detection over ice-snow. A total of two sample regions including the Greenland region and the Antarctic region are selected, and they are covered with ice-snow all year round. The DPC/POSP cloud detection results are in good agreement with the spatial distribution of cloud pixels from the MOD35 product [Figs. 9(b) and 9(c)]. The number of pixels is 17589. The pixel-by-pixel comparison shows that the consistency of the two products is approximately 83.3%. Among the DPC/POSP discrimination results, 26.6% are cloudy and 73.3% are clear sky, while 29.7% are MODIS cloudy and 70.2% are clear sky. This indicates that the employed DPC/POSP data are consistent with the MODIS cloud identification results when applied to cloud detection over ice-snow. In the Antarctic region [Figs. 10(b) and 10(c)] which is covered by both datasets, the DPC/POSP cloud detection results are more consistent with the spatial distribution of cloud pixels from the MOD35 product. The number of pixels is 395991. The pixel-by-pixel comparison shows that the consistency of the two products is about 94.4%. The DPC/POSP cloud detection results include 9% cloudy and 90.9% clear sky, while the MODIS cloud results contain 13% clear sky and 86.9% clear sky. 86% of the MOD35 cloud mask results are above clear sky to verify the algorithm reliability.ConclusionsWe propose the algorithm of cloud detection over ice-snow based on the data characteristics of polarization loads DPC and POSP in the Gaofen-5(02) satellite. The algorithm mainly includes cloud-based cloud detection, DPC multi-angle polarization signal test, cirrus cloud band detection, and improved NDSI detection. Based on the strong detection of oxygen A-band, the multi-angle polarization signal cloud is increased to test the water cloud over ice-snow, with improved accuracy of water cloud detection. Cirrus cloud bands are employed to improve the cirrus cloud detection over ice-snow. Finally, by analyzing the reflection characteristics of water cloud, ice cloud, and ice-snow in different bands, the bands leveraged by the commonly leveraged NDSI normalized snow index are improved to increase the detection accuracy of ice clouds over ice-snow. A large number of statistical analysis of multiple samples in different months helps determine the best threshold for each test judgment of each test. Greenland and Antarctic regions covered with all year round of ice-snow are selected for the algorithm verification. The consistency between cloud detection results of the proposed design algorithm and MOD35 cloud products is 83.3% and 94.4%. This indicates that this algorithm can better detect the cloud pixel over ice-snow, verifying its effectiveness.
ObjectiveAerosols play an important role in assessing radiation, climate, cloud formation, and environmental pollution. Additionally, their optical and physical properties exert a significant influence on the formation and transportation of air pollutants. Therefore, spatio-temporal distribution characteristics of tropospheric aerosols are vital for studying the uncertainties of aerosol environments and climate changes. It is of great significance to study the optical properties and vertical distribution changes of aerosols by effective observation methods. As a widely employed aerosol active detection instrument, lidar plays an irreplaceable role in detecting vertical aerosol distribution. Relevant scholars classify the aerosol types by classifying the distribution characteristics of optical parameters such as aerosol depolarization ratio, color ratio, and lidar ratio, which promotes the development of lidar detection research methods. High spectral resolution lidar (HSRL) can accurately detect optical parameters such as aerosol extinction coefficient and backscatter coefficient, and improve the inversion accuracy of aerosol optical parameters. This airborne high spectral lidar flight test is the first aerosol observation test with Air-ACDL, and the analysis results fully reflect the advantages of HSRL in detecting aerosol types and lay a foundation for spaceborne high spectral lidars to invert aerosol types.MethodsAerosol classification is based on the difference in optical parameters of different aerosol types to reflect their various characteristics. For example, aerosol depolarization ratio δa reflects the shape characteristics of particles, aerosol lidar ratio Sa characterizes the absorption characteristics of particles, and dual-wavelength color ratio Cr (532 nm/1064 nm) corresponds to particle size. These characteristics are the theoretical basis for aerosol classification. Generally, Sa varies with the size, shape, and composition of aerosol particles, and the value is higher for particles with strong absorption. δa is an important parameter for identifying dust aerosols, which is related to the shape regularity degree of particles. Meanwhile, the δa value of spherical particles is the smallest, and the more irregular shape leads to the greater value. The color ratio corresponds to the particle size, and generally the larger color ratio brings smaller particles. Based on these characteristics, the aerosol particle classification can be well achieved. According to the summary of the existing studies, the threshold ranges of Sa, δa, and Cr for different aerosol types are sorted out, and an aerosol classification lookup table is established based on the classification threshold standard of aerosols. Additionally, aerosols in the Shanhaiguan area are classified by combining the aerosol optical parameters detected by airborne high spectral lidar.Results and DiscussionAccording to the comparison results of aerosol optical depth (AOD), the correlation between the airborne observation data, the ground-based sunphotometer, and the passive detector data carried by the satellite is greater than 0.90 (Fig. 2), Aerosol types on March 11, 2019 are classified by the established aerosol classification lookup table and detection data from airborne high spectral lidar [Fig. 6(a)]. The classification results are compared with those of CALIPSO [Fig. 6(c)], and then confirmed by combining meteorological data and backward trajectories (Figs. 4 and 7). The results show that the polluted air flow mainly comes from Mongolia, and it is prone to bring sand and dust aerosols over Shanhaiguan. In addition, since the experimental site is close to the Bohai Sea, there is marine aerosol over Shanhaiguan, and the flight path of CALIPSO passes over the Bohai Sea without marine aerosols. Thus, the classification results of the aerosol classification lookup table based on HSRL are more accurate. Then, by analyzing the aerosol classification results on March 14 and March 19, 2019, the feasibility of the proposed aerosol classification method is verified again.ConclusionsWe analyze the distribution characteristics of lidar ratio, depolarization ratio, and color ratio of different aerosol types, and establish the optical parameter lookup table of different aerosol types on the basis of summarizing the previous classification methods. Meanwhile, the aerosol types are divided into eight types, including ice particles, sand, mixed sand, ocean, polluted ocean, city, smoke, and fresh smoke. Based on the lookup table, the airborne observation data on March 11, 2019 are employed to achieve aerosol classification and identification in Qinhuangdao. The results show that there are aerosol types such as mixed sand and dust aerosols, marine aerosols and smoke over Tianshan Customs, and the feasibility of the aerosol classification method is verified by adopting HYSPLIT trajectory mode and meteorological data. The method applicability is verified by the correct identification of aerosol types on March 14 and March 19, 2019 during the observation period. March 14 and March 19, 2019 are polluted days, and there are dust aerosols from Mongolia over Shanhaiguan. Additionally, as Shanhaiguan is close to the Bohai Sea and the experiment is in the winter heating period, there are marine aerosols and smoke aerosol types over Shanhaiguan, and there will be ice particles in the air under large air humidity. This airborne hyperspectral lidar flight test is the first aerosol observation test with Air-ACDL. The analysis results fully reflect the advantages of HSRL in detecting aerosol types and lay a foundation for spaceborne high spectral lidars to invert aerosol types. In the future, as the ACDL spaceborne lidar data accumulate, they can be utilized to establish a more accurate and rich aerosol classification database and realize global aerosol classification.
ObjectiveGravity wave activities play a key role in atmospheric circulation, and the energy and momentum coupling between the lower atmosphere and the upper atmosphere can be realized via wave propagation from the troposphere to the mesosphere. Based on the Rayleigh scattering of atmospheric molecules, temperature structures in the middle atmosphere can be effectively measured with lidar, and the temperature perturbation induced by wave propagation can be employed to study gravity wave activities. In the past few decades, lidar observations of gravity wave activities in the middle atmosphere have been carried out at many locations globally, and different regional characteristics of gravity wave activities are found at different latitudes. According to the longtime observation data accumulated by the Rayleigh lidar at Haikou (19.9°N, 110.3°E), a data analysis process is designed in this study for the retrieval of temperature structures in the middle atmosphere and the identification of atmospheric gravity wave events. It is successfully applied to the regional characteristic investigation of gravity wave activities in the middle atmosphere. Hainan Province locates in the South China Sea, and atmospheric activities in this low-latitude region are significant to the terrestrial climate changes in the global atmospheric circulation system. The developed data analysis process may be helpful to the broader application of the dataset for the Chinese Meridian project, and research on the regional characteristics of gravity wave activities in Hainan Province could be meaningful to building global climate parameterization models.MethodsBased on the Rayleigh lidar observations, the temperature structure in the middle atmosphere (30-65 km) is retrieved according to the method introduced by Chanin and Hauchecorne. However, the accuracy of calculation results of atmospheric temperature is related to the signal-to-noise ratio (SNR) of lidar observation data, and a proper reference altitude is also very important to precisely retrieve the temperature structure in the middle atmosphere. Therefore, the relative measurement error in temperature is calculated according to the SNR distribution in the observation data, and it is preset to less than 5% at different altitudes. Additionally, simultaneous measurement results from SABER/TIMED and COSMIC are utilized for comparison in this designed data analysis process to find the proper reference for the accurate retrieval of temperature profiles. The power spectral density of atmospheric temperature perturbations is calculated with the Fourier transform of the autocorrelation function, and atmospheric gravity wave events are identified from the sequences of lidar observation data. After the high-frequency components are removed with the wavelet analysis method, the vertical wavelength and the observed wave period of dominant gravity waves are extracted according to the calculation results of the vertical wavenumber spectrum and the temporal frequency spectrum.Results and DiscussionsA data analysis process (Fig. 5) is developed for accurately retrieving the temperature structure and identifying gravity wave events in the middle atmosphere, and it is successfully applied to the analysis of the Hainan lidar observation dataset. Atmospheric density and temperature structures (Fig. 2) are retrieved for the middle atmosphere over Haikou (19.9°N, 110.3°E), and 202 gravity wave events in the middle atmosphere are successfully identified from Hainan lidar observations from January 2011 to July 2013. Vertical wavelengths and the observed wave periods are extracted for every gravity wave event, and statistical analysis (Fig. 7) shows that those lidar-observed gravity waves in the middle atmosphere over Haikou are typically 5-9 km in vertical wavelength and 5-13 h in observed wave periods. Comparison with the Rayleigh lidar observation results at Arecibo (18°N, 66°W), Gadanki (13.5°N, 79.2°E), and the middle and higher latitudes demonstrates that these lidar-observed characteristics of gravity wave activities over Haikou are different from those reported at other locations in the world. This indicates that atmospheric gravity wave activities may have obvious regional characteristics, and lidar observation results in the middle atmosphere are typically influenced by the properties of wave sources and the background atmosphere.ConclusionsBased on the Rayleigh lidar observation dataset of the Chinese Meridional project, a data analysis method on the retrieval of temperature structures in the middle atmosphere and the identification of atmospheric gravity wave events have been investigated in our study. The temperature structure in the middle atmosphere (30-65 km) is retrieved accurately by the Chanin-Hauchecorne method, and the calculation results are compared with satellite measurements from SABER/TIMED and COSMIC. Gravity wave events are identified by calculating the power spectral density of atmospheric temperature perturbations after the dominant wave components are extracted through the wavelet analysis method. A specific data analysis process is well designed, and 202 gravity wave events in the middle atmosphere are successfully identified from Hainan lidar observations from January 2011 to July 2013. Vertical wavelengths and the observed wave period are extracted for every gravity wave event, and statistics show that lidar-observed gravity waves in the middle atmosphere over Haikou (19.9°N, 110.3°E) are typically 5-9 km in vertical wavelength and 5-13 h in wave period. This data analysis method designed by us can be applied to the research on temperature variations and gravity wave activities in the middle atmosphere over China and may be helpful to further data assimilation of the Chinese Meridional project.
ObjectiveAerosols are an important component of the earth's atmospheric system and exert significant effects on radiation forcing, meteorology, environment, quantitative remote sensing, and human health. The demand for high-precision aerosol products in scientific research and social production continues to grow. Multi-spectral, multi-angular, and polarization observations can better achieve global aerosol detection. The directional polarimetric camera (DPC) sensor is currently carried on satellites Gaofen-5A, Gaofen-5B, and the atmospheric environment monitoring satellite to conduct global atmospheric environment monitoring. DPC can obtain observation data from three polarization bands and five non-polarization bands, with a minimum of nine and a maximum of seventeen angles. Currently, there is an urgent need for DPC to provide aerosol products of reliable scientific and application significance. The posterior error analysis in inversion results is an important tool in testing DPC performance.MethodsThe entire process of our research includes data matching, aerosol inversion, and analysis of error dependence on wavelength and scattering angle. At the same time, the DPC and polarization and directionality of the earth's reflectance (POLDER) results are compared in the same conditions. First, the satellite transit time over the aerosol robotic network (AERONET) site and the pixel where the AERONET site is located are determined through spatio-temporal matching, and the matching results are trimmed and stored. Second, the generalized retrieval of aerosol and surface properties (GRASP) algorithm is adopted to retrieve the matched DPC and POLDER data. To test the performance of DPC and ensure the comparison in the same conditions, we employ the common band of DPC and POLDER to retrieve both data. Third, the successful order of scattering (SOS) radiation transfer program is leveraged to conduct forward simulation with the inversion results of DPC and POLDER as inputs. Compared with the observed values, the inversion residuals for each band and angle are obtained (RI and RP representing intensity and polarization residuals, respectively), and the distribution of RI and RP in each band is analyzed. Then, the multi-band aerosol optical depth (AOD) observed by AERONET is employed as the real value, and the error distribution differences between DPC and POLDER retrieved AOD relative to AERONET products are compared in the same conditions. Finally, the influence of scattering angles is analyzed. Satellite observation scattering angles are mostly distributed between 100° and 175°. The distribution of RI and RP at 5° intervals is studied, and a comparative analysis of the scattering angle dependence of RI and RP is conducted.Results and DiscussionsFirst, the variation of the inversion residual with the wavelength is analyzed. The results show that RI and RP of DPC and POLDER are both at lower levels, which are about 10×10-3 and 10×10-4, respectively. The overall distribution of RI and RP from DPC and POLDER is relatively centralized. But for RI@565, RI@865, and RP@865 of DPC, the error bar of them is relatively large (Fig. 1). The inversion results of DPC are generally in good agreement with AERONET, reflecting the DPC ability in aerosol observation. However, AOD@865 is seriously overvalued (Table 2). Second, the variation of inversion residual with scattering angle is also analyzed. We find that the mean values of RI and RP in mountain areas are higher than those in non-mountain areas, with relatively discrete RI and RP. In non-mountain areas, RI and RP are relatively concentrated, but the standard deviation is large when the scattering angle is greater than 160°. The angular characteristics of the DPC and POLDER residuals are relatively consistent, without significant differences (Figs. 2 and 3). Third, after discussing the inversion results of the mountain and non-mountain areas, the inversion ability of DPC in non-mountain areas is proven to be close to POLDER, while in mountain areas it lags behind POLDER (Fig. 4). Fourth, the influence of polarization on AOD inversion is discussed. It is found that polarization information can significantly improve the AOD inversion effect, with correlation increasing from 0.763 to 0.808, RMSE decreasing from 0.373 to 0.213, mean bias decreasing from 0.117 to 0.012, and the proportion of falling into the expected error section REE increasing from 44.4% to 55.7% (Fig. 5). Cross comparison between Figs. 4 and 5 shows that deducting large scattering angles in the inversion process can improve the inversion effect, but the effect is not obvious.ConclusionsFirst, although the error of AOD@865 from DPC is large, it is excellent at 670 nm band. Due to the common participation of all wavelengths in retrieval, there will be certain constraints between them. AOD@670 still exhibits good results even when there is a large error in the 865 nm band, which indicates that DPC has great potential in aerosol remote sensing. Second, in the case of large scattering angles, the simulation accuracy of the radiation transfer model will decrease, thereby affecting the inversion accuracy. However, due to the small number of large scattering angles and multi-angular constraints, the effect of large scattering angles is reduced. Therefore, in practical multi-angle inversion, large scattering angles do not significantly improve the inversion accuracy. Third, polarization information exerts a significant influence on improving aerosol retrieval accuracy. In multi-angular remote sensing, polarization information can supplement intensity information in estimating surface and aerosol models, thereby improving the retrieval accuracy. Fourth, the DPC inversion in non-mountain areas is similar to that of POLDER, but there is a significant difference in mountain areas. Since the spatial resolution of DPC is higher than that of POLDER, many factors including pixel aggregation, geometric reconstruction, and land surface-atmosphere coupling can affect aerosol retrieval results. This will also be a problem to be addressed in aerosol remote sensing of mountainous areas.
ObjectiveIndoor aerosols are known to have a significant influence on atmospheric environment and human health. Therefore, it is meaningful to study the physical processes and movement patterns of them, such as transport, diffusion, and deposition. Although numerical simulations can provide strong support for the analysis of indoor aerosol flow field, it remains challenging to quantify the random factors in real environments. Thus, further research is needed through experimental measurements. Conventional measurement methods, such as high-speed photography and pulsed lidar, are difficult to meet the range and resolution requirements for indoor aerosol research due to their inherent limitations. The Scheimpflug lidar, a type of lidar technology based on the Scheimpflug principle, has the potential to provide high-resolution detection at short range. However, the dead zone of a single field-of-view (FOV) Scheimpflug lidar still occupies a large proportion, hindering accurate studies of indoor aerosol distribution and diffusion patterns. Therefore, we propose a dual-FOV Scheimpflug lidar.MethodsThe proposed dual-FOV Scheimpflug lidar emits a continuous laser beam that interacts with the aerosol particles and produces elastic scattering. The backscattering signals from different ranges are collected respectively by two FOVs and then simultaneously captured by the corresponding image sensors (Fig. 1). In our study, a dual-FOV Scheimpflug lidar is developed with a 520 nm laser diode as the laser source. The lens for the primary FOV has a focal length of 100 mm and is designed to receive aerosol scattering signals from the far range, while the secondary FOV lens with a focal length of 45 mm is adopted to receive near-range signals. Two identical CMOS cameras serve as detectors for each FOV. In an indoor environment, we experiment to test the performance of the dual-FOV Scheimpflug lidar system (Fig. 3), with the artificially released aerosol source placed at 4.5 m. As the aerosol concentration along the path changes during the experiment, the signal intensity at the hard target at 7.1 m varies accordingly. By calibrating the system constants, interpolating the range resolution in the overlapping area, and splicing signals of the two FOVs, a full path signal profile with a very small dead zone can be obtained (Fig. 5). The signal intensity variation observed at the hard target is considered to be indicative of the changes in aerosol optical depth, which provides a constraint for the iterative determination of the boundary value. Subsequently, by utilizing the Klett method, the aerosol extinction coefficient profile is retrieved by employing the determined boundary value.Results and DiscussionsThe dual-FOV Scheimpflug lidar has a detection range of 0.36–7.1 m, which reduces the dead zone from 1.26 m to 0.36 m compared with a single FOV structure. The system's range resolution is 0.1 mm at the nearest distance and 15 mm at the farthest, enabling high-resolution detection at short distances. The accuracy of the pixel-distance relations for both FOVs is verified by comparing signals in the overlap area. The high correlation coefficient of 0.872 indicates a good correlation and consistency between the signals of the two FOVs. Through the signal calibration and fusion of the two FOVs, the obtained signal profiles exhibit sound spatiotemporal continuity over the entire coverage range (Fig. 6). The inversion results at typical moments demonstrate that the dual-FOV Scheimpflug lidar effectively and accurately describes the aerosol variation trends in different aerosol concentration conditions (Fig. 7). The time-space map of the extinction coefficient shows good spatiotemporal continuity throughout the detection process (Fig. 8), enabling high-precision quantitative inversion of the short-range aerosol distribution. The correlation between signal intensity and extinction coefficient at the near end of 0.36 m is analyzed (Fig. 9), with a correlation coefficient of 0.991. This confirms the feasibility of adopting the signal of a hard target as a boundary value constraint and verifies the reliability and accuracy of the dual-FOV Scheimpflug lidar data.ConclusionsWe propose a dual-FOV Scheimpflug lidar for indoor aerosol detection, which features a small dead zone and extremely high resolution. The system comprises two FOVs, one designed for receiving near-range aerosol backscattering signals and the other for far-range signals. The dual-FOV Scheimpflug lidar system is employed to detect artificially released aerosols, and the full path signal profile is obtained by combining the signals from two separate FOVs. The system achieves dynamic self-calibration with the boundary value provided by a hard target, enabling the retrieval of the aerosol extinction coefficient profile without boundary value assumptions. The experimental results demonstrate that the secondary FOV supplements the aerosol information in the near range, and the inversion results show good spatiotemporal continuity. These results suggest that the dual-FOV Scheimpflug lidar can realize fine detection of indoor aerosols and provide a new technical means for detecting small-scale aerosol flow fields.
ObjectiveHyperspectral remote sensing is a new remote sensing technology that emerged in the early 1980s. Hyperspectral data has the advantages of fine spectral resolution, numerous bands, and wide spectral range. It provides almost continuous spectral curves for each pixel. Its rich spectral information of ground objects can broaden the scope and enhance the depth of remote sensing applications and improve the accuracy and reliability of quantitative analysis. In recent years, hyperspectral technology has developed rapidly in China. The launch of hyperspectral satellites such as GF-5, ZY-1 02D, GF-5B, and ZY-1 02E has enriched abundant hyperspectral data sources and has greatly promoted the development of hyperspectral remote sensing in China. However, hyperspectral satellites, like multispectral satellites, will inevitably be affected by clouds and cloud shadows in the imaging process. Thick clouds in the atmosphere totally cover the reflected surface information, while thin clouds attenuate the reflection of the surface, such as cirrus clouds and haze. Cloud shadow will also degrade the image quality. Therefore, how to accurately identify clouds and cloud shadows has become the key to ensuring the level of further applications. An improved method is proposed to detect clouds and cloud shadows based on domestic hyperspectral satellites.MethodsAs a mature cloud detection algorithm, the Fmask algorithm has been widely used and has become the operational algorithm of Landsat and Sentinel product systems. In this algorithm, clouds and cloud shadows are recognized by multiple threshold criteria and flood filling, respectively. Finally, it uses similarity matching to reconfirm cloud shadows, and the detection accuracy of clouds and cloud shadows for Landsat can reach 96.41% and 70%, respectively. However, previous studies have revealed that the detection accuracy of Fmask is relatively low and limited for data without thermal infrared bands. For example, the cloud and cloud shadow detection accuracy of Sentinel-2 data is about 89% and 50%, respectively. It is much lower than the accuracy of Fmask applied to multispectral data. Therefore, an improved Fmask algorithm is proposed specifically for domestic hyperspectral satellites. We optimize the structure of cloud and cloud shadow detection procedures on the basis of the original Fmask algorithm. For urban areas prone to cloud-detected confusion, we add auxiliary judgments to detect bright ground objects. At the same time, the improved algorithm can distinguish the cloud shadow from terrain shadows and improve the accuracy accordingly. 20 hyperspectral images of GF-5 and ZY-1 02D are used to verify the improved algorithm, covering three typical classes, such as urban, mountainous, and flat areas.Results and DiscussionsThe experimental results indicate that the improved Fmask algorithm performs well in cloud and cloud shadow recognition, highly consistent with the visual recognition results under various underlying surfaces (Fig. 7). The improved Fmask algorithm is compared with the original Famsk algorithm and the other two algorithms, and the cloud and cloud shadow recognition accuracy of all algorithms are calculated, in terms of the overall accuracy, user accuracy, and producer accuracy. The user accuracy and producer accuracy of the improved Fmask algorithm for cloud detection can reach 91.26% and 99.97%, respectively, while the accuracy of cloud shadow detection can reach 78.66% and 79.41%, respectively. The accuracy of all algorithms is illustrated by thermal diagrams (Fig. 8). Evidently, the accuracy of the improved Fmask algorithm is significantly better than the original Fmask algorithm for the scenes containing cities and mountains. Compared with the other two threshold-based algorithms, the improved Fmask algorithm shows significant superiority in aspects of clouds and cloud shadows.ConclusionsThis work improves the Fmask algorithm in cloud and cloud shadow recognition to make it suitable for domestic hyperspectral data. The improved algorithm has been tested in 20 hyperspectral images containing typically different underlying surfaces, and the results are highly consistent with the visual recognition. It is also significantly higher than the validation algorithm in terms of user accuracy and producer accuracy in over 60% of images. The improved Fmask algorithm has advantages in terms of robustness, high accuracy, and versatility. The cloud and cloud shadow recognition procedures include an adjustable threshold, which makes the algorithm more flexible to meet different requirements for cloud and cloud shadow recognition. In addition, the improved algorithm does not need extra auxiliary data, running fast and implementing easily. It can be used for high-precision identification of clouds and cloud shadows in hyperspectral data and enable the operational processing of domestic hyperspectral satellite data.
ObjectiveRemote sensing images have a large detection range, long dynamic monitoring time, and a large amount of carrying information, making the obtained ground feature information more comprehensive and rich. By extracting ground object targets from remote sensing images, more detailed and accurate ground object information in the imaging area can be obtained, providing data support for high-altitude reconnaissance, precision guidance, and terrain matching. However, with the rapid increase in data volume, the current low level of intelligent and automated target extraction methods is difficult to embrace the demand. Traditional image extraction techniques contain edge detection, threshold segmentation, and region segmentation. These methods have good segmentation performance for remote sensing targets with significant contour boundaries but lack the ability of adaptive adjustment while facing complex and ever-changing remote sensing targets. Convolutional neural networks have stronger representation ability, scalability, and robustness than traditional methods by providing multi-level semantic information in images. Due to the uneven distribution, blurred edges, and variable scales of ground objects in remote sensing images, convolutional neural networks are prone to losing edge information and multi-scale feature information during feature extraction. In addition, cloud cover of remote sensing targets in complex scenes exacerbates the loss of target edge and multi-scale information, making it more difficult for convolutional neural networks to accurately segment remote sensing ground objects. In order to solve the above problems, we propose a segmentation method that uses deep residual networks as the backbone and combines attention guidance and multi-feature fusion to enhance the network's ability to segment remote sensing image ground object edges and multi-scale objects.MethodsWe propose a remote sensing image semantic segmentation network called AMSNet, which combines attention guidance and multi-feature fusion. In the Encoder Section, D_ Resnet50 is applied as the backbone network to extract the main feature information from remote sensing images, which can enhance the acquisition of detailed information such as edge and small-scale targets in remote sensing images. The category guidance channel attention module is inserted into the backbone to enhance the network's segmentation ability for difficult-to-distinguish and irregularly shaped areas in remote sensing images. A feature reuse module is added to the backbone network to solve the loss of edge detail information and the disappearance of scattered small-scale targets during feature extraction. In the Decoder Section, the cross-regional feature fusion module is applied to fuse the multi-feature information, improving the acquisition of multi-scale target information. Multi-scale loss fusion module is also joined to further enhance the segmentation performance of the network for multi-scale targets.Results and DiscussionsFrom the analysis of experimental results on the remote sensing image dataset of the plateau region and the remote sensing image dataset of the plateau region under cloud interference, compared with other semantic segmentation networks, the proposed network has better segmentation performance (Table 6 and Table 7) regardless of cloud interference. In addition, the segmentation performance is less affected by cloud interference. Even under cloud interference, the segmentation accuracy of ground targets is only 1.10 percentage points lower than that without cloud interference in mIoU, 0.58 percentage points lower than that in mPa, and 0.71 percentage points lower than that in mF1, which is lower than the influence of other semantic segmentation networks on segmentation effect under different cloud meteorological interference conditions. In addition, in order to verify the generalization performance of the AMSNet network segmentation effect, the International Society for Photogrammetry and Remote Sensing (ISPRS) dataset in the Vaihingen region of Germany is selected. In order to better fit the picture size, number of grouping convolutions of feature multiplexing modules in the AMSNet network is reduced to four groups. From the experimental results in Table 8, the network still performs better than other networks. This network is compared with PspNet and OCNet, with mIoU increased by 5.09 percentage points and 5.57 percentage points, Deeplabv3+ network with mIoU by 3.47 percentage points, mPa by 3.56 percentage points, and mF1 by 2.78 percentage points. From the segmenting effect diagram of Fig. 8, this network has a lower error rate, fewer omission, and a more accurate segmenting boundary for building edges and small-scale cars than other networks.ConclusionsWe propose a network model based on encoding-decoding structure—AMSNet. In the encoding part, the D_Resnet50 network is applied as the backbone to extract the main feature information of remote sensing images. We also use a category-guided channel attention module to reduce the interference of channel noise on segmented objects and improve the segmentation effect of targets in difficult-to-distinguish areas. We embed a feature reuse module to compensate for the problem of target edge loss and small-scale target loss during the feature extraction process. In the decoding part, the cross-regional feature fusion module is designed to integrate multi-layer features and combine the multi-scale loss fusion module to calculate the feature loss at different scales to improve the segmentation effect of the network on multi-scale targets. This network conducts experiments on the remote sensing image dataset of the plateau region, remote sensing image dataset of the plateau region under cloud interference, and a public dataset. Compared with semantic segmentation networks such as BiseNetv2, PspNet, and Deeplabv3+, the proposed network achieves better results in the evaluation indicators of mIoU, mPa, and mF1. The visualization results show that the proposed network can effectively segment the ground object targets and scattered multi-scale targets in the interlaced and hard-to-distinguish areas in the remote sensing images, and it has good segmentation performance and good robustness in cloud interference.
Progress The research history about the effect of atmospheric turbulence on optical imaging resolution was reviewed. Based on Fried's study, some investigators studied the role of turbulence outer scale in imaging resolution power. In 1973 Consortini et al. first investigated the problem and proposed that if the value of the wave structure function over the outer scale is less than 20, the turbulence does not put a limit to the resolution of an optical system. In 1990 Borgnino explored the problem mainly for long baseline interferometry and imaging in optical astronomy. In such cases, the baseline length or the telescope aperture diameter is comparable with the turbulence outer scale, and in imaging through the whole atmosphere, the turbulence strength and the outer scale vary with height. Therefore, Borgnino proposed an equivalent outer scale defined as an averaged outer scale weighted by the turbulence strength at different heights.In 1991 McKechine proposed a fresh point of view on how atmospheric turbulence affects images formed by large ground-based telescopes. This means the atmosphere can be represented by an equivalent phase screen for the two quantities that determine most of the important image properties, including the atmospheric modulation transfer function and the spectral correlation function. In 1992 McKechine investigated the imaging resolution by large telescopes and concluded that the outer scale of atmospheric turbulence is practically small and less than 1 m. Since the telescope aperture is much greater than the turbulence outer scale, the effects of turbulence on imaging can be eliminated, and thus in this case the adaptive optics is unnecessary for both astronomical imaging and laser propagation.Tatarskii and Zavorotny criticized McKechnie's viewpoint and believed that star images presented by McKechnie could well be explained with the classical propagation theory and the traditional turbulent model. However, the McKechnie model of scattering, a single-scale atmosphere with an outer scale of 35 cm, contradicts all our experience with turbulence. This comment was supported by Gurvich and Belen'kii. In 1997, Chesnokov and Skipetrov analyzed the imaging resolution ability in turbulent atmosphere. In 2012, Lukin also investigated quantitatively the effect of outer scale on the imaging resolution of large telescopes. These results could be applied to explain McKechnie's image problem. However, McKechnie insisted on his viewpoint and developed his theory in the book General Theory of Light Propagation and Imaging through the Atmosphere with the first and second editions published in 2016 and 2022 respectively.On the other hand, our understanding of the turbulence outer scale has deepened quickly. Increasingly more practical measurements at different locations reveal that the outer scale is not as large as early thought and its characteristics are very complicated. Some models for height distribution of the outer scale were proposed for theoretical use, but in-situ measurements are still needed for practical applications.Conclusions and Prospects It is well recognized that the turbulence outer scale exerts significant influence on the imaging resolution power of large telescopes, and quantitative relationships can be established based on the classical theory of light propagation through turbulence. However, some different turbulence spectrum models that can be adopted for theoretical research on different relationships between the imaging resolution and the turbulence outer scale may be obtained. Practical measurements for the outer scale and experimental studies are necessary for building a reliable relationship.As the turbulence outer scale can only be defined qualitatively, a quantitative definition should be built to investigate its properties with systematic measurements by employing related measurement techniques based on different principles. This kind of work is critical not only for imaging applications but also for other applications such as atmospheric turbulence profiling.SignificanceThe effects of atmospheric turbulence on astronomical observation (optical imaging) have long been recognized. Newton proposed that the observatory should be built on the top of a high mountain to reduce the turbulence effects. In modern time Fried investigated this problem based on the Kolmogorov turbulence model and obtained analytical formulae for resolution power. The Fried parameter r0 has been widely applied to optical engineering. If r0 is less than the lens diameter D, the resolution power will be determined by r0 rather than D. A typical r0 for a good observatory site is about 0.1 m and much less than the astronomical lens diameter, and the adaptive optics (AO) has to be employed to compensate turbulence-induced phase fluctuations. However, as the AO compensation efficiency degrades with turbulence and under strong turbulence AO can not work properly, large space telescopes such as Hubble and James Webb were launched into space to avoid Earth's turbulence. Meanwhile, some investigations reveal that the outer scale L0 affects the resolution power. If L0 is about or even less than the lens diameter D, the turbulence effect on imaging resolution power should be greatly reduced. As increasingly larger astronomical telescopes and optical engineering lenses are planned or being built, the effect of outer scale on imaging resolution power will play an essential role in the design and performance of the optical engineering system. Thus, it is necessary to clarify the outer scale properties of practical atmosphere turbulence and its effect on the imaging resolution power of large telescopes.
ObjectiveThe LED-based incoherent broadband cavity-enhanced spectroscopic absorption technology features simultaneous detection of multiple species, high resolution, high sensitivity, and strong real-time performance, becoming an important means of trace gas detection technology. However, this technology also has many problems, such as the large divergence angle and poor collimation of LED, which requires efficient light source coupling systems. Additionally, the light emitted by LED is greatly affected by temperature and current, and the instability of LED temperature control will directly interfere with measurement results. We discuss the LED coupling method and the temperature control problems and propose corresponding solutions.MethodsThe high-precision miniaturized broadband cavity-enhanced absorption spectrum (HPM-BBCEAS) system is developed from a previous version in the laboratory. An LED light source with a central wavelength of 460 nm is selected as the detection light. The direct focusing of the incident end using double-bonded lenses is adopted instead of traditional fiber optic sampling coupling, which improves the coupling efficiency of the light source. Combined with a high-sensitivity resonant cavity with an optical cavity length of 322.40 mm, high-precision and miniaturized NO2 measurement is achieved. The device adopts a self-designed LED automatic temperature control system to integrate the proportional integral derivative (PID) algorithm and the Kalman filtering algorithm and proposes an improved PID-Kalman filtering algorithm (Fig. 3). The main improvements are two-fold. First, the program can modify the PID parameters based on error changes to achieve fast and stable adjustment. Second, the Kalman filtering is added to the original PID to reduce the actual acquisition error and realize a more accurate calculated PID output value (Fig. 4). The system achieves rapid temperature control by adjusting the Peltier cooling time, reducing the light intensity fluctuations caused by temperature changes, improving the signal-to-noise ratio, and solving the problem of large system stability and detection accuracy errors caused by temperature drift.Results and DiscussionsThe experimental results show that by employing the improved PID algorithm and the conventional PID algorithm for long-term temperature monitoring of the LED light source on the same system, the adjustment time of the improved PID algorithm is approximately 13 times shorter than that of the conventional PID algorithm during analyzing the adjustment time from the process of turning off the LED to turning it on and adjusting the temperature to the stable stage, with the set temperature of 28 ℃. The data is evaluated by taking the stable data of the LED for about one hour, and the results show that the temperature fluctuation range of the improved PID algorithm is 27.985-28.015 ℃ with a fluctuation range of ±0.015 ℃, while that of the conventional PID algorithm is 27.8-28.2 ℃ with a fluctuation range of ±0.2 ℃. This indicates that the control precision of the improved PID algorithm is more than ten times higher than that of the conventional PID algorithm. From the perspective of light intensity fluctuation, the light intensity fluctuation range of the improved PID algorithm is approximately (30125±25) cd, while that of the conventional PID algorithm is approximately (30125±150) cd. This reveals that the control precision and light intensity fluctuation of the improved PID algorithm are better than those of the conventional PID algorithm. When the improved PID algorithm and the conventional PID algorithm are applied to the broadband cavity-enhanced absorption spectroscopy (BBCEAS) system, the influence of temperature control precision on the system detection limit is evaluated. The evaluation results show that compared with the conventional PID algorithm, the stability and detection limit of the instrument are both improved by about ten times when the improved PID algorithm is adopted (Fig. 7).ConclusionsWe introduce a high-precision NO2 analyzer based on BBCEAS technology. The analyzer adopts a cage-type coaxial integrated cavity structure consisting of a light source, a resonant cavity, and fiber optic output, greatly improving the system integration. Combined with an improved PID-Kalman filtering algorithm for the temperature control system, the stability of the entire system is greatly enhanced. The developed temperature control system can achieve precise control of the LED temperature in two minutes with a control accuracy of up to ±0.015 ℃, guaranteeing stable instrument measurement operation. Under the optical cavity length of 322.40 mm and a mirror reflectivity of 0.99985, NO2 detection limit of 21×10-12(60 s, 1σ) is achieved. Leveraging high-reflectivity mirrors with higher reflectivity can provide longer absorption paths and lower detection limits. The comparison of the instrument with the gas distribution system validates the accuracy of the system's NO2 measurements. Actual atmospheric applications demonstrate that this device can capture instantaneous NO2emissions, proving the reliability of the instrument's long-term stable operation.
ObjectiveOxygen (O2) is one of the most important components in the atmosphere and plays a key role in the survival of all living organisms on Earth. However, the atmospheric O2 concentration is decreasing due to the rapid expansion of human activities. The Tibet Plateau, known as the third pole, is a plateau with the highest altitude in the world. For a long time, as the O2 content of the local atmosphere is lower than that of other regions, the ecosystem is extremely fragile and sensitive. Long-term quantitative monitoring of atmospheric O2 concentration is crucial to understand the evolution pattern of decreasing O2 and its effects on the ecosystem of the Tibet Plateau. However, it requires a very challenging detection precision of 10-6 level. Various O2 measurement methods have been proposed. The commonly employed electrochemical techniques and magnetic dynamics methods are compact and easily commercial available but suffer from long-term stability and vibration. In contrast, laser absorption spectroscopic techniques based on the Beer-Lambert law can provide high reliability, completely non-contact measurement, and long-term performance. In particular, Faraday rotation spectroscopy further offers high selectivity for paramagnetic molecules and is a powerful tool for O2 measurement with high precision. Our paper develops a simply easy-to-deploy and maintenance-free O2 sensor based on FRS and provides a feasible sensor scheme for O2 detection in Tibetan Plateau.MethodsA 762.3 nm continuous wave distributed-feedback laser working at room temperature is employed as the probe laser. The laser current and temperature are controlled by a commercial laser controller. O2 measurement selects the PP(1)(J=1) line with a strong near-infrared magnetic effect and a strength of 3.063×10⁻²⁴ cm/molecule at 13118.04 cm-1. The static magnetic field is generated by a solenoid coil under constant current excitation. A Herriott optical multi-pass cell with two 8 cm diameter spherical mirrors separated at 35 cm is adopted to provide an effective absorption path length of 7 m. The cell is made of aluminum alloy which is oxidized and blackened to reduce stray light. A polarizer is utilized before the laser beam incidence in the cell to clean the polarization state, and a second polarizer, placed after the light beam exits the cell, acts as a polarization analyzer. Various parameters of the sensor are optimized to ensure that the sensor operates in optimal conditions, including magnetic field strength, offset angle, and modulation amplitude. Finally, the performance of the sensor performance is assessed by continuous O2 measurement with a fixed concentration. The system stability and detection precision are analyzed by Allan deviation and a histogram of frequency counts.Results and DiscussionsThe parameters of the sensor are optimized. The noise measurement shows that the optimal offset angle is 10° and the corresponding total noise of the system is 0.33 μV/Hz1/2 (Fig. 7). The optimal modulation amplitude for O2 detection at atmospheric pressure is 18 mV (Fig. 8). We find that the measured Faraday rotation spectral signals are proportional to magnetic field strength in the range of 0 to 540 Gs (Fig. 9). The 180 Gs field strength is chosen due to the safety and heat. The stability of the magnetic field strength is tested continuously for 12 hours by a Gaussmeter with a resolution of 0.1 Gs and an accuracy of ±0.3% of the reading (Fig. 5). The results indicate high stability. System calibration is performed with a strong linear relationship between Faraday rotation spectral signals and O2 concentrations. A fixed volume ratio of about 5.36% is continuously measured for 3600 s and the time resolution is 1 s (Fig. 12). A Gaussian profile is fitted to the frequency distribution histogram. The standard deviation value which corresponds to the actual instrument precision is 149×10-6. Allan deviation evaluation demonstrates that the optimal average integration time of the system is 60 s, at which the detection precision can be improved to 32×10-6.ConclusionsA high-precision atmospheric O2 sensor based on Faraday rotation spectroscopy is developed. The measurement selects the PP(1)(J=1) line with a strong near-infrared magnetic effect at 13118.04 cm-1. A Herriott optical multi-pass cell with coils wounded is designed specifically for Faraday rotation spectroscopy to offer an absorption path length of 7 m and a magnetic field strength of 180 Gs, which effectively enhances the detection signal and improves the system performance. The operating parameters of the sensor system are optimized, and the performance is evaluated. As a result, a detection precision of 32×10-6 with the acquisition time of 60 s is achieved, thereby confirming the precision and reliability of the sensor, and providing a feasible scheme for long-term O2 detection in Tibet Plateau. In future work, we will develop permanent rare-earth magnets instead of solenoid coils, try to provide higher-strength constant magnetic fields, and pursue lower power consumption and higher performance. We hope that our future research can achieve the networking O2 measurement in the Tibet Plateau.
ObjectiveCarbon dioxide (CO2), methane (CH4), water vapor (H2O), and other greenhouse gases have the ability to absorb longwave radiation emitted by the earth to cause the greenhouse effect. The escalating greenhouse effect has resulted in a series of climate and environmental degradation issues. Accurate measurement of CO2 gas concentration and estimation of CO2 emission intensity from emission sources are of significance for controlling greenhouse gas emissions. Remote sensing methods based on passive differential optical absorption spectroscopy (DOAS) technology can measure the concentration of multiple gas components in real-time with high precision and can capture a wide range of gas concentration variations. Currently, researchers both domestically and internationally have made corresponding progress in measuring greenhouse gas concentrations and emission fluxes from emission sources using DOAS technology, mainly focusing on satellite and airborne platforms. However, there is relatively less research on emission flux estimation from typical emission sources using DOAS remote sensing methods on ground-based platforms. Focusing on typical emission sources and urban areas as the research targets, we employ a ground-based near-infrared spectroscopy remote sensing system coupled with differential absorption spectroscopy technology to retrieve the two-dimensional distribution of CO2 column concentration. Based on these results, the emission fluxes from typical emission sources are estimated to provide a reliable technique and method for remote sensing of carbon emissions.MethodsThe near-infrared DOAS algorithm for retrieving CO2 concentration information is first studied, and the spectral range and interfering gases for CO2 inversion are selected by analyzing the distribution of gas absorption line intensity in the HITRAN database. Meanwhile, we calculate the effective absorption cross-sections of the gases in the measurement environment through line broadening and convolution. The absorption cross-sections of CH4 and H2O are included in the retrieval to account for their interference in the absorption spectra. The influence of reference spectrum selection on the retrieval results is analyzed, and ultimately the zenith direction spectrum is chosen as the reference spectrum. The CO2 column concentration information is obtained using least-squares fitting. By subtracting the gas concentration in the first column upwind from the obtained CO2 column concentration and considering the angular information of the remote sensing system, the two-dimensional concentration distribution of CO2 columns in the vicinity of the power plant and the boundary layer of Hefei is obtained. The bicubic interpolation algorithm is applied to achieve high spatial resolution for the two-dimensional distribution of CO2 column concentrations. Furthermore, the CO2 emission flux from the power plant is calculated, and the error sources are analyzed.Results and DiscussionsWe choose the background spectrum as the reference spectrum, and employ the DOAS algorithm to retrieve CO2 column density. The retrieval error can reach 0.79%. The remote sensing results of a chimney in a power plant in Hefei show that high concentrations of CO2 are concentrated above the chimney outlet, and the slant column density of CO2 at the emission hotspot is approximately 3.36×10²¹ molecule/cm2 higher than the background concentration (Fig. 9). The high concentrations of CO2 emitted from the power plant are mainly distributed within a height range of 35 m above the chimney outlet (Fig. 10). By utilizing the bicubic interpolation algorithm, the spatial resolution of the power plant's CO2 concentration distribution map is improved from 5 m×5 m to 1.25 m×1.25 m (Fig. 11). The emission flux from the power plant is about 1925 kg and the distance estimation error is the largest error source in the flux measurement. The remote sensing results in the boundary layer of Hefei indicate that both the power plant and the urban area have higher concentrations compared to the suburban area. After subtracting the complex background, the highest concentration in the urban area reaches up to 2.58×10²¹ molecule/cm2. The thickness of the high-concentration layer in the power plant is approximately 279.2 m, while it is 418.8 m in the urban area (Fig. 13).ConclusionsWe introduce a near-infrared spectroscopy remote sensing system and estimation method for measuring CO2 column density distribution and emission fluxes, and investigate the distribution characteristics of CO2 from typical point sources and urban emissions. A power plant is selected as a point source for emission research. Scanning measurements are conducted in the vertical direction of the power plant plume dispersion to obtain a two-dimensional concentration distribution map of CO2 emissions from the power plant. The CO2 emission flux is calculated as about 1925 kg, and observations and research on the CO2 distribution characteristics in the atmospheric boundary layer of Hefei are also conducted. Preliminary results show that the high concentration values in the boundary layer are primarily distributed near the ground level, and the concentrations in the power plant and urban areas are significantly higher than those in the suburbs. This suggests that the fuel combustion in the power plant and emissions from transportation and manufacturing activities in urban areas play a major role in atmospheric CO2 concentration and distribution. Finally, we provide effective techniques and methods for estimating carbon emissions. The next step will involve adopting three-dimensional modeling to investigate the three-dimensional spatial distribution characteristics of the plume and combining precise wind speed measurement instruments for more accurate emission flux estimation.
ObjectiveDue to the advantages such as good inactivation effect on pathogenic microorganisms and low usage cost, chlorinated disinfectants have been widely employed for disinfection in various aspects. However, the large amount of chlorinated disinfection by-products produced by chlorinated disinfectants have biological toxicity, and they will have toxic effects on aquatic organisms and pose potential threats to the aquatic ecosystem once entering aquatic environment. Therefore, the development of on-site and rapid detection methods for the toxicity of chlorinated disinfection by-products in water is of significance for ensuring the aquatic environment safety. As the main primary producers and energy converters in aquatic ecosystems, microalgae play an important role in maintaining the balance and stability of aquatic ecosystems and indicating the water environment quality. Additionally, the microalgae photosynthesis has a rapid response characteristic to the toxicity of pollutants in water. Based on this, fluorescence kinetics technique which could rapidly and non-destructively detect the photosynthetic status of living plants has good development prospects in rapid toxicity detection of chlorinated disinfection by-products in water. However, at present, it is still unclear which photosynthetic fluorescence parameter obtained based on fluorescence kinetics technique can serve as the optimal response indicator for rapidly and sensitively detecting the toxicity of chlorinated disinfection by-products. Therefore, we study the response characteristics of different photosynthetic fluorescence parameters to the toxicity of chlorinated disinfection by-products for determining the optimal response indicator with sensitive response characteristics to chlorinated disinfection by-products. This is of practical significance for the development of on-site and rapid detection methods for the toxicity of chlorinated disinfection by-products based on fluorescence kinetics technology.MethodsWe employ a common freshwater microalgae Chlorella pyrenoidosa as the test organism, and two typical toxic chlorinated disinfection by-products chloroacetic acid and trichloroacetonitrile as the research objects. Meanwhile, we first investigate the change rule of photosynthetic activity of Chlorella pyrenoidosa with incubation time and the influences of algal cell density and environmental temperature on the response sensitivity of Chlorella pyrenoidosa to the toxicity of two chlorinated disinfection by-products to determinate the optimal experimental conditions for the response of Chlorella pyrenoidosa to chlorinated disinfection by-products toxicity. The fluorescence kinetics method is adapted to study the response of four photosynthetic fluorescence parameters Fv/Fm, Fv/Fo, Fm/Fo, and PIABS to different mass concentrations of chloroacetic acid and trichloroacetonitrile, and then the dose-response relationships between each photosynthetic fluorescence parameter and each chlorinated disinfection by-product are constructed. On this basis, the response sensitivities of four photosynthetic fluorescence parameters to chlorinated disinfection by-products are compared in four aspects. The aspects include response performance to low mass concentration of chlorinated disinfection by-products, inhibition degree by equal mass concentration of chlorinated disinfection by-products, 10% effective mass concentration (EC10), and 50% effective mass concentration (EC50) values.Results and DiscussionsBy studying the change of photosynthetic activity of Chlorella pyrenoidosa with incubation time, the results show that when Chlorella pyrenoidosa is cultured to the third to fourth days, all the four photosynthetic fluorescence parameters Fv/Fm, Fm/Fo, Fv/Fo, and PIABS are at a high level (Fig. 1), which indicates that Chlorella pyrenoidosa has the best photosynthetic activity at this time. Therefore, the best growth period of Chlorella pyrenoidosa for studying the response characteristics of different photosynthetic fluorescence parameters to the toxicity of chlorinated disinfection by-products is the third day to the fourth day during culture. The results of influences of algal cell density and environmental temperature on PIABS inhibition ratio of Chlorella pyrenoidosa exposed to chloroacetic acid and trichloroacetonitrile demonstrate that when the algal cell density is in the range of 0.5×10⁵-100×105 cells·mL-1, PIABS inhibition ratio is at a high level and tends to stabilize [Fig. 2 (a)]. Under the environmental temperature of 25 ℃, the inhibition ratio of PIABS is the maximum [Fig. 2 (b)]. Therefore, 0.5×10⁵-100×105 cells·mL-1 and 25 ℃ are the optimal algal cell density and the optimal environmental temperature for the response of Chlorella pyrenoidosa to chlorinated disinfection by-products toxicity respectively. In the optimal toxicity response conditions, when the exposure time is 2 h, all the four photosynthetic fluorescence parameters Fv/Fo, Fm/Fo, Fv/Fm, and PIABS values gradually decrease with the mass concentration increase in chloroacetic acid and trichloroacetonitrile (Figs. 3 and 4). When the mass concentrations of chloroacetic acid and trichloroacetonitrile are in the ranges from 5.06 to 36.80 mg·L-1 and from 1.55 to 19.32 mg·L-1 respectively, all the inhibition ratios of Fv/Fo, Fm/Fo, Fv/Fm, and PIABS show good Logistic curve relationships with the mass concentrations of chloroacetic acid and trichloroacetonitrile, and the adjustive correlation coefficients Radj2 are all greater than 0.993 (Figs. 5 and 6). These results indicate that all four photosynthetic fluorescence parameters could be adopted as response indicators for quantitative toxicity detection of chlorinated disinfection by-products. For low mass concentrations of chloroacetic acid and trichloroacetonitrile, PIABS has the most sensitive response performance compared to Fv/Fo, Fm/Fo, and Fv/Fm (Figs. 3 and 4). Meanwhile, by comparing the inhibition ratios of Fv/Fo, Fm/Fo, Fv/Fm, and PIABS by equal mass concentration chloroacetic acid and trichloroacetonitrile at the exposure time of 2 h, the inhibition degree order of the four photosynthetic fluorescence parameters is PIABS>Fv/Fo>Fm/Fo>Fv/Fm. This indicates that compared with the other three photosynthetic fluorescence parameters, PIABS is the most sensitive to the toxicity of chlorinated disinfection by-products at the same mass concentration. Additionally, the EC10 and EC50 values of chloroacetic acid and trichloroacetonitrile calculated according to Fv/Fo, Fm/Fo, Fv/Fm, and PIABS are further compared. The results show that the photosynthetic fluorescence parameters corresponding to the EC10 and EC50 values of chloroacetic acid and trichloroacetonitrile in descending order are Fv/Fm>Fm/Fo>Fv/Fo>PIABS (Table 2). This indicates that the sensitivity of the four photosynthetic fluorescence parameters to the toxicity of chloroacetic acid and trichloroacetonitrile is PIABS>Fv/Fo>Fm/Fo>Fv/Fm.ConclusionsAll the photosynthetic fluorescence parameters Fv/Fm, Fv/Fo, Fm/Fo, and PIABS of Chlorella pyrenoidosa have mass concentration-dependent response characteristics to two chlorinated disinfection by-products chloroacetic acid and trichloroacetonitrile. The four photosynthetic fluorescence parameters have good logistic curve dose-response relationships with the mass concentration of chloroacetic acid and trichloroacetonitrile, which could be utilized for quantitative toxicity detection of chlorinated disinfection by-products in water. In addition, among the four photosynthetic fluorescence parameters, PIABS exhibits the most sensitive response characteristics to chloroacetic acid and trichloroacetonitrile. Therefore, it is a suitable response indicator for rapidly and sensitively detecting the toxicity of chlorinated disinfection by-products. We provide a more suitable toxicity response parameter for the development of on-site and rapid detection methods and technologies for disinfection by-products toxicity based on fluorescence kinetics technique.