


 View fulltext
Journal of Atmospheric and Environmental Optics
Co-Editors-in-Chief
Wenqing Liu

2023
Volume: 18 Issue 6
9 Article(s)

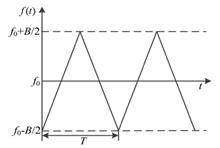
LI Cong, XU Hua, DAI Congcong, FENG Yang, DENG Quan, and ZHOU Zhiming
Due to the weak energy and low signal-to-noise ratio of radar echo signals, it is difficult to obtain the frequency domain characteristics of high quality medium frequency signals, which often leads to large measurement error. To address this issure, a signal time-frequency analysis method combining synchrosqueezing wavelet transform (SST) with median filtering is proposed to achieve strong random noise suppression. Firstly, a simulation model of 24 G frequency modulated continuous wave (FMCW) radar echo signal is constructed. By adding Rayleigh clutter and Gaussian random noise, the frequency analysis diagrams from short-time Fourier transform (STFT), continue wavelet transform (CWT), and SST are compared, and the instantaneous frequency identification accuracy is proposed as an evaluation index I.Secondly, STFT, CWT and SST algorithms are used to analyze the time spectrum of the echo signals with an actual distance of 6 meters. The research results indicate that SST can better highlight the instantaneous frequency characteristics and compress the random noise into low-energy short lines and strips. Based on the distribution characteristics, SST combined with median filtering can effectively suppress the noise, with I value decreasing by 0.21, 0.55 and 0.71 compared with SST, STFT and CWT, respectively. Compared with the traditional SST, STFT and CWT, the instantaneous frequency recognition accuracy of the proposed method is highest, while the peak and valley values of the reconstructed signals through inverse transform can be well maintained, at the same time, and the detection accuracy error at different distances is also the smallest.
Nov. 28, 2023Vol. 18 Issue 6 503 (2023)
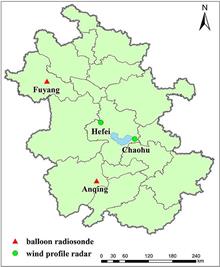
ZHU Song, DENG Xueliang, SHEN Weiwei, WU Yue, and JIN Xiaolong
As a new type of wind measurement radar, wind profile radar can continuously provide the distribution of meteorological elements such as horizontal wind field, vertical airflow, and atmospheric refractive index structure constant with altitude. Moreover, it has the characteristics of high spatiotemporal resolution, good continuity, and real-time performance, making it an important equipment for high-altitude meteorological detection. The quality of radar data is a fundamental prerequisite for the operational use of the data. This article compares the fifth generation reanalysis data (ERA5) of the European Centre for Medium-Range Weather Forecasts (ECWMF) with balloon sounding data to verify the applicability of ERA5 reanalysis data in the Anhui region, and then uses it to evaluate the wind profile radar data of Hefei and Chaohu, China, where no balloon sounding data is available. The results show that: (1) ERA5 reanalysis data is significantly correlated with balloon sounding data, and multiple indicators indicate that ERA5 reanalysis data can be used as an evaluation benchmark, and is feasible for evaluating wind profile radar data in areas without balloon sounding data. (2) The intensity of atmospheric turbulence has a significant impact on the maximum detection height of wind profile radar. According to seasons, the maximum detection heights are 2.7 km in spring, 4.5 km in summer, 3.6 km in autumn, and 2 km in winter. (3) The quality of the u component wind profile radar data in Hefei area is better than that of the v component in terms of data correlation, average deviation and root mean square error. Seasonally, the data quality is ranked as winter, summer, spring, and autumn in descending order. Among them, the data of spring, summer and winter are of good quality and can be assimilated into the numerical forecast model, while the autumn v component data needs to undergo deviation correction and quality control before application.
Nov. 28, 2023Vol. 18 Issue 6 516 (2023)
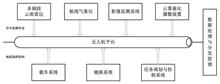
CAI Jun, XU Liren, SUN Haiyang, ZHAO Yiming, and DAI Xuebing
In order to meet the observation and operation requirements of artificial cloud and fog environment, based on the advanced active microwave laser detection and sensor loads, route meteorological instruments and cloud catalytic seeding devices equipped on a unmanned aerial vehicle (UAV) platform, three-dimensional monitoring of cloud, rain, aerosol and wind below the route, the continuous observation of conventional meteorological elements such as temperature, humidity, pressure and wind speed on the route, and the sowing of cold cloud/warm cloud catalyst are realized respectively. Furthermore, an integrated control software is designed to realize the intelligent command and control of UAV and the observation and operation loads through data information link. And an intelligent unmanned observation and operation system, which integrates the observation, operation and evaluation of artificial cloud and fog, is developed finally to achieve the goals of multi-element fine observation, cold and warm cloud efficient catalytic operation, intelligent command and control, and quantitative evaluation.
Nov. 28, 2023Vol. 18 Issue 6 532 (2023)
MAO Minjuan, LIU Houtong, DENG Fangping, and DONG Yilei
Inter-regional transport of pollutants is an important and difficult problem in atmospheric environment research. Based on lidar observation data of haze weather processes with high pollution levels in Zhejiang Province, China, from 2012 to 2015, aerosol vertical mass concentration in the region during the period were retrieved and the corresponding inter-regional transport of pollutants in high impact haze weather was studied quantitatively using Mie's theory and Fernald inversion method. The results show that: (1) high impact haze weather in Zhejiang during the period mostly occurs when high-pressure front turns to high-pressure control. High-pressure front is conducive to foreign pollutant input, while high-pressure control is conducive to local pollutant accumulation. (2) The transport height, mass concentration and composition of foreign pollutants vary in different high impact haze processes and even different moments in the same process. The variations of transport height and mass concentration of foreign pollutants are generally from 4.5 to 7.5 km and 450 to 1200 μg·m-3, respectively. Meanwhile, the input pollutants are mainly coarse particles, and the types of pollutants are dominated by sand dust and urban pollutants. (3) Case study shows that only 25 to 35 percent of the input pollutants settles to the near-surface layer. Gravity and temperature decline are the important factors affecting deposition. Comparativley, gravity has a greater effect on the deposition of coarse particles, while air temperature decline has a greater effect on that of fine particles.
Nov. 28, 2023Vol. 18 Issue 6 541 (2023)

WU Yarui, WANG Hu, and WANG Meijing
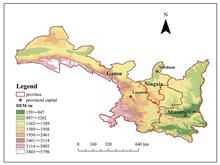
In order to obtain the spatial and temporal distribution characteristics of NO2 and explore its pollution status, based on the tropospheric NO2 column concentration data from the Ozone Observation Instrument (OMI), and the corresponding meteorology, energy, traffic emissions and other statistical data, the temporal trends, spatial distribution characteristics and influencing factors of NO2 column concentrations in Shaanxi-Gansu-Ningxia region, China, from 2005 to 2019 were analyzed through geospatial analysis, linear fitting, correlation analysis and so on. The results show that the NO2 column concentrations in the past 15 years show a general trend of first rising and then falling. Seasonally, the variation of NO2 column concentrations presents as winter ●gt; autumn ●gt; spring ●gt; summer, with stable changes in summer and intense fluctuations in winter. In terms of spatial distribution, the high NO2 column concentration areas are distributed in the provincial capital and nearby regions, with the Xi'an urban agglomeration being the most obvious. Further analysis of influencing factors shows that topography and wind direction have a certain comprehensive influence on the spatial distribution of NO2. There is a significant negative correlation between temperature, rainfall and NO2 column concentration, indicating that high temperature and rainfall have a reducing effect on NO2 concentration. While coal consumption, industrial output value and motor vehicle ownership all show a positive correlation with NO2 column concentration, indicating that fossil energy combustion and motor vehicle exhaust emissions are important sources of NO2 in the region. The continuous decrease in NO2 column concentration after 2012 is deduced to be mainly related to the strong implementation of relevant national and local policies.
Nov. 28, 2023Vol. 18 Issue 6 553 (2023)
SUN Le, TANG Chaoli, WEI Yuanyuan, and HUANG Yourui
Based on MODIS and AIRS remote sensing data from January 2001 to December 2021, the temporal and spatial modal characteristics and variation trend of cloud top pressure (CTP) over East Asia in recent 21 years were studied using empirical orthogonal function (EOF), MK trend analysis and least square method. The results show that the CTP in east Asia shows a gradually decreasing trend from northeast to southwest, and large differences in seasonal changes with a tick font shape, manifested as the highest pressure value in winter and the lowest in summer. Affected by geographical position and latitudes, the high value areas of CTP are distributed in northeast region throughout the four seasons in one year, while the low value area is always located in the Qinghai-Tibet plateau area. Guangxi and Guangdong in China, Myanmar, India and other places belong to the tropical monsoon region, they are affected by cold and dry air in winter and easy to form CTP high value area. The East Asian region is mainly dominated by medium cloud distribution. Specifically, the low cloud areas are mainly concentrated in Northeast China, Beijing-Tianjin-Hebei, the Korean Peninsula, and mid latitude marine areas. The meduim cloud areas are mainly distributed in the Central Plains region, southern regions (Guangxi, Guangdong, and various provinces in the middle and lower reaches of the Yangtze River), as well as some regions of Xinjiang in China. And high clouds mainly appear in the Qinghai-Tibet Plateau and Taklamakan Desert of China. The trend analysis shows that CTP in Xinjiang of China, Indian Peninsula, Myanmar, Mongolia and Lake Baikal significantly increases from 2001 to 2021, while that in Qinghai-Tibet Plateau, southern coastal areas and eastern sea of China shows a significant downward trend. Generally, CTP is significantly correlated with surface temperature, humidity, water vapor and cloud cover in some regions of East Asia. Therefore, the change of CTP can reflect regional weather changes to a certain extent.
Nov. 28, 2023Vol. 18 Issue 6 569 (2023)

LUO Yafei, ZHONG Xiaojin, FU Dongyang, YAN Liwen, ZHANG Yi, LIU Yilin, HUANG Haijun, ZHANG Zehua, Qi Yali, and WANG Qian
The optical properties of highly turbid coastal water bodies are complicated, so the application of reflectance products based on different satellites in such kinds of water bodies is desperately needed to be fully evaluated. Taking the water body of the Yellow River Estuary (YRE) as a typical research object, the applicability of the water-leaving reflectance products corrected by different atmospheric correction algorithms for Sentinel-2-MSI (S2-MSI) and Sentinel-3-OLCI (S3-OLCI) image is evaluated based on the reference of Landsat reflectance products corrected by ACOLITE DSF atmospheric correction algorithm suitable for YRE. The results show that S2-MSI and S3-OLCI data corrected by the image correction for atmospheric effects (iCOR) are in good agreement with Landsat reflectance products for highly-extremely turbid water bodies in YRE, followed by FLAASH (Fast line-of-sight atmospheric analysis of spectral hypercubes) and Sen2Cor (Sentinel-2 correction) corrected products, while C2RCC (Case-2 regional coast colour) performs poorly. iCOR, FLAASH and Sen2Cor corrected S2-MSI and S3-OLCI reflectance products show good results in the green and red bands with the mean absolute relative difference EMARD lower than 24%, except that in the near-infrared band the EMARD is higher than 34% in highly turbid waters. Among them, the FLAASH and Sen2Cor algorithms have similar results. Compared with that in highly turbid waters, the EMARD is even lower for iCOR, FLAASH and Sen2Cor algorithms in extremely turbid waters. On the contrary, C2RCC algorithm performs relatively poor in highly turbid waters and even worse in extremely turbid waters, with overall underestimation of water-leaving reflectance. This research is significant for it can provide useful reference for choosing atmospheric correction methods in highly turbid waters and lay the foundation for dynamic monitoring suspended sediment in YRE with high resolution.
Nov. 28, 2023Vol. 18 Issue 6 585 (2023)
SHENG Liangliang, HAO Shuang, CUI Yuhuan, LI Pengfei, XU Yazhou, and LIAO Congcong
With the acceleration of urbanization, the problem of urban surface heat island effect is gradually becoming prominent. In order to study the impact of urban spatial expansion and socio-economic development on the heat island effect, based on five periods of Landsat remote sensing images from 2000 to 2020, the surface temperature of Hefei City and Nanchang City, China, is inverted using the radiative transfer equation method. The heat island effect in the study area is divided into 4 grades using normalization method, the temporal and spatial evolution characteristics of the heat island effect in the two cities are analyzed and studied, and then the influence factors of the heat island effect intensity are comprehensively analyzed using geographic detectors. The results show that: (1) The urban expansion coefficient of Hefei decreases from 1.70 to 1.08 and finally tends to 1.25 from 2000 to 2015, and decreases to 0.56 from 2015 to 2020, while Nanchang fluctuates between 1.34 and 1.60 from 2000 to 2020. Hefei and Nanchang completed their industrial structure transformation in 2011 and 2018, respectively, evolving towards a trend driven by the tertiary industry. The expansion of the cities in space is inseparable from the development of social economy and the decision-making support of the government. (2) The continuous expansion of the main urban areas of Hefei and Nanchang both show a non-linear growth trend. Hefei surface heat island effect mainly expands in the northeast and southwest directions, while Nanchang mainly shows a southeast-northwest expansion pattern. Hefei and Nanchang surface heat island effect areas have increased from 45.17 km2 and 40.80 km2 to 351.61 km2 and 274.07 km2 respectively during the period, and the development intensity and scope of heat island are consistent with the scale and direction of rapid urban development. (3) The explanatory power of each influencing factor on the intensity of heat island effect in Hefei and Nanchang from large to small is: population density (0.891/0.844), built-up area (0.842/0.810), per capita GDP (0.788/0.773), proportion of secondary industry (0.679/0.711), proportion of tertiary industry (0.582/0.636), among which population density has the greatest impact, and the role of the secondary industry in the industrial structure is higher than that of the tertiary industry. In the other hand, the interaction of each factor has a greater impact on the intensity of the surface heat island effect than a single factor alone. The research results can provide a reference for the planning of Hefei, Nanchang and similar cities, and it seems that reasonable layout of green space in built-up areas and control of urban population can effectively alleviate the development speed of urban surface heat island effect.
Nov. 28, 2023Vol. 18 Issue 6 602 (2023)
FANG Lulu, HONG Jin, ZHANG Aiwen, JIN Jie, and LUO Donggen
As an important part of the spaceborne directional polarization camera, the power supply and distribution system not only needs to meet the functional requirements of converting the primary power provided by the satellite platform into the various secondary power supplies required for the loads, but also needs to meet the requirements of high reliability and long life when the loads are on orbit. The stress analysis procedure is an important method for analyzing the reliability of electronic systems. Based on the stress analysis procedure and according to GJB/Z 299C-2006 "Electronic Equipment Reliability Prediction Manual", the failure rate calculation of the electronic components in the power supply and distribution system of the directional polarization camera is carried out, and the reliability of the power supply and distribution system is analyzed by combining the structural block diagram of the system. The analysis results show that the redundancy design of cold standby can significantly improve the reliability of the system.
Nov. 28, 2023Vol. 18 Issue 6 617 (2023)
© Copyright 2018-2021 | Chinese Laser Press.
All Rights Reserved 沪ICP备15018463号-20