


 View fulltext
Journal of Atmospheric and Environmental Optics
Co-Editors-in-Chief
Wenqing Liu

2023
Volume: 18 Issue 3
8 Article(s)

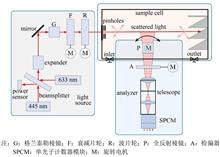
CHEN Minwang, QIU Zhenwei, and HONG Jin
Scattering matrix is an important parameter to describe the scattering characteristics of medium, which is sensitive to the physical and chemical properties of the medium. In order to investigate the feasibility of using this parameter to identify aerosols and obtain their physicochemical properties, an experimental measurement was designed to obtain the scattering matrices of the two aerosol samples of poly-alpha-olefin and sodium chloride, and the angular distribution of the two matrix elements was discussed. Furthermore, based on Mie scattering theory, the particle size distribution of poly-alpha-olefin aerosols was inversed using template matching method and the measurement results. The results show that based on the angular distribution of matrix elements, the two kinds of aerosols can be effectively identified and distinguished, and the physicochemical properties of aerosols can also be obtained by combining the correlation scattering model and inversion method. This research provides a method reference for aerosol identification and acquisition of physicochemical properties.
May. 28, 2023Vol. 18 Issue 3 191 (2023)
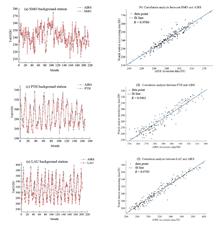
TANG Chaoli, HAO Dewei, WEI Yuanyuan, DAI Congming, and WEI Heli
The inversion data of Atmospheric infrared sounder (AIRS) from March 2003 to February 2021 were verified using the base data of Global Atmosphere Watch (GAW), and then based on AIRs data, the spatial and temporal distribution and variation characteristics of the total ozone column in Antarctica were analyzed. Moreover, combined with stratospheric temperature and sea ice data, linear regression, correlation analysis, wavelet analysis and other methods were performed to identify the key factors affecting the total ozone column in Antarctica. The results show that the correlation coefficient between AIRS inversion data and atmospheric watch station monitoring data is more than 0.945, indicating the high accuracy and stability of AIRS inversion data. The temporal variation of the total column of ozone in Antarctica has an obvious periodicity, with valley-valley alternating for about 12 months. The wavelet time-frequency analysis shows that the total amount of ozone column in Antarctic has obvious cycles with time scales of 2 years, 4 years, 6 years, 8-10 years and 13 years. Among them, the first main 13-year cycle with the most severe oscillation changes has a 10-year cycle, and the second main 6-year cycle has a 4-year cycle. From 2003 to 2021, the first main cycle experienced two high-low periods, and the second main cycle experienced four high-low periods. Furthermore, it is found that the total ozone column varies significantly with seasons, with spring being the season with the highest total ozone column in Antarctica, followed by winter, summer, and autumn. And there is a quite difference of the spatial distribution characteristics of ozone in Antarctica among seasons. Generally, the total ozone column decreases with the increase of the latitude, and reaches the bottom value near 85° S. The total column of ozone in most parts of Antarctica is significantly positively correlated with the stratospheric temperature, and the statistical results show that there will be an ozone hole when the stratospheric temperature is less than 189 k. The change of Antarctic sea ice extent is basically correlated with that of the total Antarctic ozone column, and both of them have a change cycle of 2 years, 6-8 years and 12-14 years, but the change of sea ice is one month earlier.
May. 28, 2023Vol. 18 Issue 3 201 (2023)
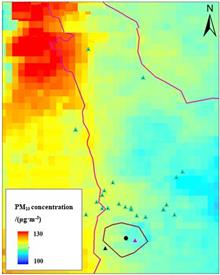
ZHANG Lijuan, YANG Yi, ZHANG Jianhui, ZHAO Aimei, ZUO Xinli, Xilinhasi , Edingaoqier , WENG Guoqing, MAO Huiqin, CHEN Hui, CHEN Linhan, ZHAO Shaohua, WANG Zhongting, LIU Cheng, ZHANG Tianshu, TAO Minghui, LAI Jibao, MA Pengfei, and GAO Jixi
Stereoscopic remote sensing monitoring system based on multilevel platform collaboration is a monitoring system including space-based satellite, space-based remote sensing, aerial drones, mobile patrol monitoring vehicles and ground observation. The core of the system is to use the collaborative linkage mechanism and technical method to build the core algorithm model of data fusion, in order to make up for the shortcomings of conventional single remote sensing means in terms of monitoring time, accuracy and periodicity. The core meaning and application of stereoscopic remote sensing monitoring system based on multilevel platform collaboration for atmospheric environment are elaborated here, and the application results of the system for atmospheric environment are shown by taking the Qipanjing Industrial Park (Erdos, China) as an example. It is shown that the system is helpful for finding out the characteristics of local pollution emissions and quantifying regional pollutant transmission contributions, achieving accurate source tracing and law enforcement, and finally forming a targeted comprehensive air pollution control proposal, which will effectively support the local air pollution prevention work.
May. 28, 2023Vol. 18 Issue 3 214 (2023)
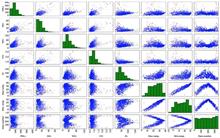
WANG Lijun, ZHOU Yu, WAN Lijuan, and CHENG Liangliang
A method for analyzing influencing factors of complex systems based on multi-dimensional Gaussian Bayesian classification algorithm is proposed, classification models for diverse range of PM2.5 are established, and then the analysis of the key influencing factors on complex systems is carried out in combination with Mahalanobis distance. Based on the weather and air quality data of Hefei City from 2013 to 2018, 8 main influencing factors for PM2.5, such as PM10, SO2, NO2, CO, O3 and so on, are screened out, and then the correlation between PM2.5 and the influencing factors is analyzed using scatter matrix. The PM2.5 analysis model based on Gaussian Bayesian classifier is established with these data. It is found that PM2.5 has a strong positive correlation with CO concentration, is selective to NO2, and has a negative correlation with O3. As for CO and SO2, a certain competitive mechanism between the two factors in the production of PM2.5 is observed.
May. 28, 2023Vol. 18 Issue 3 227 (2023)
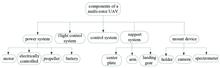
ZHANG Quan, LI Xin, WEI Wei, LIU Enchao, ZHANG Yanna, HUANG Xionghao, CHEN Shengli, KANG Zhuhai, and ZHENG Xiaobing
Considering the non-portability and low efficiency of the measurement of bidirectional reflectance distribution function at present, a measurement system of bidirectional reflectance distribution function based on multi-rotor UAV was developed. The system is mainly composed of multi-rotor UAV and visible - short wave infrared spectrometer, with the observation lens of the spectrometer controlled by a high-precision UAV cradle head. The spectrometer adopts two wave band detection units, and the overall spectral coverage is 400~1700 nm. The two detection units of the spectrometer detect signals with flat field concave grating and linear array detector, and their spectral resolution is better than 3nm and 12nm respectively. In order to verify the comprehensive performance of the measurement system of bidirectional reflectance distribution function based on multi-rotor UAV, the surface directional characteristics of Dunhuang radiation correction field were measured using the measurement system. The experimental results show that the portable measurement system can greatly improve the measurement efficiency of bidirectional reflectance distribution function and provide a useful reference for the future development of measurement of bidirectional reflectance distribution function.
May. 28, 2023Vol. 18 Issue 3 235 (2023)
CAO Yuan, GONG Mingyan, SHEN Fei, MA Jinji, YANG Guang, and LIN Xiwen
Based on the daily PM2.5 data of China in 2018, a high-precision PM2.5 concentration estimation model was constructed using random forest method, and the temporal and spatial applicability of the model was verified at seasonal and regional scales. Further, the importance of each influencing factor to the change of PM2.5 concentration was systematically explained using the feature importance method. Finally, the comprehensive influence of the interaction of different influencing factors on PM2.5 concentration change was explored using the partial dependence technique. The results show that: (1) Compared with the multiple linear regression model and the extreme gradient ascending tree model, the random forest model based on multi-source data has the highest accuracy, which not only can accurately simulate the PM2.5 concentration, but also has good applicability at the seasonal and regional scales. (2) According to the ranking results of model feature importance, the factors that had significant impact on the average daily PM2.5 concentration in 2018 were mainly global factors such as space-time and atmospheric boundary layer height, which indicated that the prevention and control of air pollution should follow the PM2.5 transmission mechanism, and regional joint prevention and control should be strengthened in air pollution prevention. (3) The partial dependent interaction effect study shows that the combination of temperature, relative humidity, annual cumulative day, latitude, temperature and atmospheric boundary layer height has a significant impact on PM2.5 concentration change, indicating that to improve air quality should start from the perspective of multi-factor collaborative governance.
May. 28, 2023Vol. 18 Issue 3 245 (2023)

FU Miao
NO2 is a main air pollutant that damages human health and ecological environment. Based on NASA's NO2 concentrations retrieved from Aura OMI, the prediction accuracy of NO2 concentration is improved in this work using the random forest algorithm, the Geographic Weighted Regression (GWR) and the Multi-scale GWR model respectively. Localized data of economy, population, road network and slope within 8 km of the sampling point, as well as the point values of meteorology, vegetation and elevation are used as correction variables in the models. It is found that the three models increase the cross validation R2 of NASA's concentrations, from original 0.48 to 0.74, 0.71 and 0.70, respectively. Among the three models, the random forest algorithm is the most accurate one, with a low root mean square error (RMSE) of 6.4 μg/m3 and a low mean absolute error (MAE) of 4.98 μg/m3, and its speed is much faster than multi-scale GWR. In addition, the accuracy of random forest algorithm is also higher than that of most existing studies of similar extents. In terms of the concentration correction of NO2, it is found that the contribution of localized factors of economy, population and road network is at least 11.24%. In addition, based on the random forest algorithm, the distribution map of NO2 estimated concentration for county-level cities in China is also presented.
May. 28, 2023Vol. 18 Issue 3 258 (2023)
CAO Yanan, YUAN Ye, ZHENG Xiaoyi, and GAO Jinlan
In order to reasonably evaluate water vapor resources, the distribution and variation characteristics of water vapour in Huaibei region of Anhui Provice, China, from 2006 to 2015 were studied using AIRS Level 2 Standard Physical Retrieval V006 data, a joint inversion product from atmospheric infrared detectors (AIRS) and advanced microwave detectors (AMSU). Interannual variations of monthly and seasonal average characteristics of total precipitable water vapour and integrated water vapour of different layers (viz. 1000-850, 850-500 and 500-100 hPa) were mainly analyzed, as well as the relationship between temperature and water vapour. The results show that monthly average of total precipitation water vapour over the Huaibei area shows a decreasing trend year by year from 2006 to 2015. The seasonal distributions of the layer integrated water vapour in 1000-850, 850-500 and 500-100 hPa are consistent with that of total precipitable water vapour, showing the trend of summer > autumn > spring > winter. The interannual variations of the layer integrated water vapour in 1000-850, 850-500 and 500-100 hPa are also consistent with that of the total precipitable water vapour. And the largest annual variation appears in summer with a linear decreasing trend, followed by autumn with a increasing linearly year by year from 2006 to 2011 except for 500-100 hPa layer. The interannual variation of spring and winter is relatively small, and there is no significant linear relationship.
May. 28, 2023Vol. 18 Issue 3 269 (2023)
© Copyright 2018-2021 | Chinese Laser Press.
All Rights Reserved 沪ICP备15018463号-20