


 View fulltext
Journal of Atmospheric and Environmental Optics
Co-Editors-in-Chief
Wenqing Liu

2023
Volume: 18 Issue 2
9 Article(s)

SU Yuan, WU Linlin, TAO Fa, HU Shuzhen, and CHENG Xin
In order to solve the problem that most of the equipments cannot obtain the whole sky cloud base height independently, based on the grey value and the cloud base height data measured by the visible /infrared sky imager and the millimeter wave cloud radar measured at the China Meteorological Administration Atmosphere Detection Base in June, 2019, the relationship between the downward infrared radiation of ground in 8-14 μm band iand the zenith angle is calculated using Santa Barbara DISORT Atmospheric Radiative Transfer mode, and then according to the linear relationship between the gray value of the zenith cloud base measured in the infrared band and the cosine gray value of the zenith angle at the non-zenith position, the cloud base height of the whole sky is retrieved. The results show that, (1) compared with that in cloudless day, the zenith gray value is higher when there is cloud all day at the same time during a day. (2) When the cloud base height is more than 2000 meters and the cloud base is thick, the correlation between the cloud base height and the gray value measured by the infrared module is significantly better than that of the low clouds with thin cloud layer. (3) The case verification on August 12, 2019 shows that the correlation coefficient is 0.956 between the inversion cloud height and the actual cloud height measured by cloud radar, while the correlation coefficient between the inversion of cloud height and the cloud height obtained by taking the zenith angle of about 30° near the zenith is 0.9508.
Mar. 28, 2023Vol. 18 Issue 2 89 (2023)
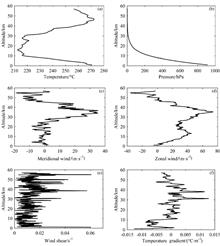
GENG Dan, ZHAO Zengliang, FAN Zhiqiang, WU Zuowei, LI Dongyang, and ZHANG Xiangxing
Atmospheric optical turbulence seriously affects the normol operation of optical systems. The acquisition of the profile of atmospheric refractive index structure constant Cn2 is the basis for calculating the effect of atmospheric turbulence, however, the research of the refractive index structure constant Cn2 profile is usually under 30 km presently. In order to study the Cn2 profile on higher altitude, the Cn2 profile in Gobi area is estimated in two parts taking 30 km as the boundary based on the conventional meteorology parameters obtained from meteorological rocket sounding, and regarding to the the Cn2 profile above 30 km, Tatarskii optical turbulence parameterization scheme and outer scale model HMNSP99 are used tentatively. The results show that under 30 km, the magnitude order and changing trend of estimated Cn2 are consistent with those of historical data, and at the altitude above 30 km, assuming that the homogenous and isotropic turbulence is satisfied, the estimated Cn2 decreases steadliy with the increase of altitude, with the average magnitude order decreasing from 10-20 to 10-23. Because of the lack of basic theory about turbulence, the estimation of Cn2 above 30 km in this work is tentative, however, it provides another idea and reference for further understanding the characteristics of the Cn2 profile above the stratosphere.
Mar. 28, 2023Vol. 18 Issue 2 99 (2023)
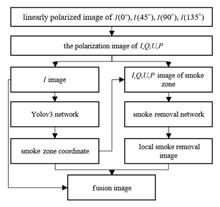
YAN Qing, YE Mengmeng, ZHANG Jingjing, LIU Xiao, NIAN Fudong, and LI Teng
The presence of smoke can cause the damage or loss of image target information. In view of the local nature of smoke in the scene, a smoke removal precheck mechanism based on the target detection Yolov3 algorithm is proposed in this work, that is, a precheck mechanism is added in the smoke removal process to realize the directional removal of smoke on the smoke image, improve the efficiency of smoke removal and avoid the impact of smoke on the non-smoking area. Different from the existing deep learning-based defogging methods for visible images, this method takes four polarization images as network input, and uses multi-scale attention adversarial network to extract the polarization information of the target in the smoke area, so as to alleviate distortion and enrich the structure and detail information of the target after smoke removal. Qualitative and quantitative experimental results on real data sets show that the proposed algorithm can effectively improve the smoke removal effectiveness and efficiency of polarized images.
Mar. 28, 2023Vol. 18 Issue 2 108 (2023)
LU Zhenli, YANG Chengfang, ZHENG Zongjie, CUI Guangshu, and AN Yuan
The video image monitoring technology of highway horizontal visibility is developing rapidly, and has become one of the important means of local dense fog weather monitoring and early warning. In order to prevent road fog traffic accidents effectively, referring to the definition of local dense fog and the regulation of early warning level, this paper statistically analyzes the luminance parameters of luminous objects at fixed road distance in different visibility environments of dense fog and non-dense fog based on the video and visibility data of road fog-prone sections, and explores the correlation between the luminance value of luminous objects and the horizontal visibility value at different distances in dense fog section. Then, based on the correlation analysis between the luminance parameter changes and the horizontal visibility of the video feature image, a method to estimate the horizontal visibility using the numerical analysis results is presented, which provides a new idea and realization way for the establishment of local dense fog weather early warning. The results show that: (1) It is scientific, innovative and feasible to monitor the visibility through monitoring the luminance change in different areas of the video image, which can realize 24 h continuous monitoring and early warning. (2) By introducing the contrast analysis of the luminance of the luminous object and that of the environment, the problem that the luminance of the image varies greatly at different time of the day can be overcome. (3) The monitoring of local dense fog can be realized by monitoring the luminous objects at a fixed distance, which can solve the problem that the horizontal scale of local dense fog is difficult to be directly monitored by instruments. (4) The monitoring results of the luminous target video monitoring method can be combined with the internet, geographic information system and navigation information system, so as to realize the purpose of issuing early warning quickly and accurately, and reducing traffic accidents.
Mar. 28, 2023Vol. 18 Issue 2 119 (2023)

CHEN Jinji, YIN Gaofang, ZHAO Nanjing, ZHANG Xiaoling, GAN Tingting, CHEN Min, QI Peilong, DING Zhichao, GU Mengyuan, WANG Xiang, DONG Ming, HUA Hui, and WANG Lu
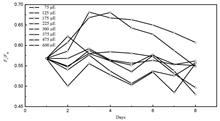
Planktonic algae are single-celled organisms, and their photosynthetic activity responds sensitively to external stress, so they are good test organisms for the comprehensive toxicity test of water quality. Obtaining the response law of the photosynthetic activity state of the tested algae species to the main environmental factors such as temperature and light, and mastering the culture conditions that effectively control the photosynthetic activity state and concentration of the tested algae species are essential for the comprehensive toxicity detection of water quality. Taking the model test organism Chlorella pyrenoidosa as the research object, the changes of photosynthetic activity of Chlorella pyrenoidosa under different temperature gradients and light intensities were studied in this work. The results show that the changes of photosynthetic activity and concentration of the algae species under different gradient illuminations are very obvious. Under low light (75 μE, 125 μE), the average photosynthetic activity of algae species is about 0.60 while the concentration of algae species basically does not increase. Under medium light (175, 225, 300, 375 μE), the average photosynthetic activity of algae species is around 0.57 and the concentration of algae species has increased significantly at this time. Among them, the best lighting for the experiment is 375 μE. Under high light (475 μE and 600 μE), the average photosynthetic activity of the algae species is lower than 0.56 (initial activity), which can stress the growth state of the algae species. It is also shown that the photosynthetic activity and concentration of algae species also changes significantly under different gradient temperatures. At medium and low temperatures (5, 15, 25 °C), the average photosynthetic activity of algae species is about 0.59, the concentration of algae species increases with the increase of temperature, and the best temperature is 25 °C. Under high temperature (30, 35, 40 °C), the photosynthetic activity of the algae species declines rapidly until inactivation. It is indicated that the photosynthetic activity and growth rate of planktonic algae can be controlled by controlling light and temperature, which can provide a standard method for cultivating the tested algae samples for a online water quality comprehensive toxicity meter, thereby laying a foundation for the development of the portable water quality comprehensive toxicity meter.
Mar. 28, 2023Vol. 18 Issue 2 133 (2023)
PAN Yan, LI Xin, LI Zhaozhou, ZHANG Quan, and ZHANG Yanna
Based on the self-developed automated reflectance monitoring spectrometer (ARMS) and hyperspectral irradiance meter (HIM) in visible-shortwave infrared band, the automatic measurement of the reflectance of three gray-scale targets in Songshan Remote Sensing Calibration Field, China, was realized, and the data obtained by the self-developed instruments was compared with the data acquired manually by the ASD portable spectrometer. The comparison results of the two methods show that the relative deviation of the reflectance data is better than ±2% in the range of 400-1600 nm for non-atmospheric absorption band. Then the target reflectance data in the site acquired by the automated equipments from October 2019 to November 2020 was analyzed in details. The analysis results show that the target reflectance of Songshan field is changeable with the environment, and the change trend of reflectance is related to the wavelength range and the measurement area, while the standard deviation of reflectance is within ±2.5% in the whole band. The work provides a strong technical support for the automatic and high-frequency on-orbit radiation calibration based on the Songshan Remote Sensing Calibration Field.
Mar. 28, 2023Vol. 18 Issue 2 141 (2023)

ZHAO Qiang, TAN Lu, FANG Qiansheng, LIU Changyu, MA Ke, and ZHU Shuguang
In order to study the evolution of urban pattern and the change of heat island effect in Hefei in recent 20 years, land classification and land surface temperature inversion were carried out based on the Landsat satellite images of October 2005, October 2009, October 2015 and October 2020. The normalized difference between bare land and building index (NDBBI), fraction vegetation coverage (FVC), modified normalized difference water index (MNDWI) and population density were extracted for multiple regression analysis, and then a mathematical model was established to analyze the heat island effect and its influencing factors in the main urban area of Hefei. The results show that: (1) From 2005 to 2020, the strong heat island area has increased by 15.03 km2. The distribution direction of standard deviation ellipse of heat island is from northeast to southwest, and the scope of the ellipse is expanding year by year. The mass center of heat island is concentrated in Shushan Economic Development Zone, and 81.90% of the strong heat island areas are high-density industrial areas, indicating a good corresponding relationship between the strong heat island areas and high-density industrial areas. (2) The analysis results of geographical detector show that the explanatory power of each influencing factor on land surface temperature from large to small is, NDBBI (0.542), MNDWI (0.409), FVC (0.379) and population density (0.018). (3) The results of multivariate linear model (R2 = 0.654) indicate that the main factors affecting land surface temperature is NDBBI, while the population density has little effect. (4) The analysis of geographical weighted regression (GWR) model shows that the R2 of each point is in the range of 0.489-0.667, and the R2 of urban construction area with dense buildings and roads is highest. The high value of NDBBI coefficient is concentrated in the economic development zone and other places, with the highest value reaching more than 0.9, the coefficient of population density is still very small, the high value areas of FVC coefficient are concentrated in areas with high vegetation coverage, while MNDWI high value areas are distributed in water areas.
Mar. 28, 2023Vol. 18 Issue 2 153 (2023)
HU Yang, GAO Wei, and YANG Jie
In view of the decline of urban ecological environment quality caused by urban expansion, based on the Landsat8 OLI~~TIRS satellite digital product image data of three time phases in 2014, 2016 and 2018, the changes of ecological environment quality in the central city of Tianjin, China, were evaluated and analyzed using remote sensing ecological index (RSEI). The results show that the RSEI has good applicability to the central urban area of Tianjin, which is characterized by high urbanisation, concentrated and compact urban housing, and can monitor environmental quality and also play an important role in the study of spatial changes. It is shown that the average values of the RSEI in the central urban area of Tianjin in 2014, 2016 and 2018 were 0.547, 0.463 and 0.478 respectively, and the RSEI geographically shows an inverted U-shaped trend of low-high-low from north to south and west to east. The correlation analysis of each index from the central urban area of Tianjin city shows that the normalized difference built-up and soil index (NDBSI) is the index that affects the quality of the ecological environment in the study area the most, with a high negative correlation with the eco-environmental quality, and is an important reference for the future improvement of the ecological environment in the central urban area of Tianjin. The successful demonstration in the central urban area of Tianjin shows that the application of RSEI remote sensing ecological index in the assessment of ecological environment quality can provide a positive reference for learning the urban ecological environment quality, monitoring and controlling the regional environment, and planning and constructing the city.
Mar. 28, 2023Vol. 18 Issue 2 168 (2023)
FAN Xuanshuo, WU Haibin, CHEN Xinbing, and SONG Wei
Nitrogen dioxide (NO2) has many adverse impacts on human health and climate change. With the acceleration of urbanization and industrialization in China, NO2 pollution has become a growing concern. However, releveant research shows that the traditional monitoring results of a single site can only represent the concentration of pollutants within a few square kilometers, and cannot provide large-scale pollutant distribution information. Compared with site monitoring, satellite remote sensing can provide large-scale and spatiotemporal continuous data. Based on NO2 column densities of Sentinel-5 Precursor and other auxiliary data such as weather and population density, a deep learning model (DNN) to predict ground-level NO2 concentration is built in this work, and then the model is verified by two cross-validation strategies. In the sample-based cross validation, the determination coefficient R2, root mean square error (RMSE) and mean absolute error (MAE) of the model are 0.80、7.72 μg/m3 and 5.31 μg/m3, respectively, while in the site-based cross validation, they are 0.74、8.95 μg/m3 and 6.01 μg/m3, respectively. Both of the two cross-validation results indicate that the DNN model has excellent overall predictive performance and spatial generalization ability. In addition, the comparisons with the other classic geostatistics and machine learning algorithms also show that the predictive performance of the deep learning algorithm is better than that of the other methods. Finally, the trained model is applied to generate NO2 distribution with 0.1° spatial resolution across Beijing-Tianjin-Hebei region.
Mar. 28, 2023Vol. 18 Issue 2 181 (2023)
© Copyright 2018-2021 | Chinese Laser Press.
All Rights Reserved 沪ICP备15018463号-20