


Abstract
Lanthanides-doped luminescent materials have gathered considerable attention due to their application potential in stress sensing, lighting and display, anti-counterfeiting technology and so forth. However, existing materials mainly cover the 380–1540 nm range, with slight extension to the UV region, impeding their applications in solar-blind imaging, background-free tracking, concealed communication, etc. To address this challenge, here we propose guidelines for far-UVC (200–230 nm) optical design. Accordingly, we achieve multi-stimulated far-UVC luminescence at ~222 nm in Pr3+-doped SrF2, stemming from the inter-configurational 4f5d → 4f 2 transition of Pr3+. Besides Pr3+, the SrF2 host shows high tolerance to Ce3+, Nd3+, Sm3+, Eu2+,3+, Gd3+, Tb3+, Dy3+, Ho3+, Er3+, Tm3+ and Yb3+, vastly extending the emission wavelength across the entire spectral range from 200 to 1700 nm. Particularly, these materials exhibit self-recoverable mechanoluminescence by direct mechanical excitation, along with thermally and mechanically stimulated emission after X-ray irradiation. We demonstrate that these lanthanides-doped SrF2 crystals offer unique opportunities for high-contrast marking and structural health monitoring in complex environments.
Introduction
Luminescent materials play a crucial role in modern technology and everyday life1,2,3,4. Scientists are actively developing high-performance luminescent materials capable of emitting multi-mode luminescence, including electroluminescence, photoluminescence (PL), cathodoluminescence, thermoluminescence (TL), mechanoluminescence (ML) and so forth5,6,7,8,9,10,11. ML materials are of particular interest due to their ability to convert mechanical energy from actions like compression, stretching and friction into light. Based on direct mechanical excitation and mechanically stimulated processes, these ML materials have enabled a wide range of applications, showcasing substantial potential for technological advancement and sustainable energy utilization. Such “trash to treasure” feature makes ML materials attract ever-increasing attention, especially considering that the global energy crisis is intensifying nowadays12,13,14.
ML has been observed in both organic and inorganic systems15,16,17,18,19. Compared to their organic counterparts, inorganic ML materials stand out due to excellent physicochemical stability and repeatability and have been used for self-powered sensors, security marking, imaging and structural monitoring20,21,22,23,24,25,26,27. Although ML has a long history of over four hundred years, it has only collected considerable attention since 1999, when Xu’s group first reported elastic ML in SrAl2O4:Eu2+ and ZnS:Mn2+ 28,29. One of the most important parameters for ML is wavelength, as it directly determines specific applications. To expand available ML wavelengths, several strategies are proposed, including searching for new hosts and luminescent centers, introducing energy transfer, engineering host lattice and constructing organic/inorganic hybrid30,31,32,33,34,35,36. Among these efforts, scientists mainly focus on the visible and near-infrared regions, with little attention to the UV range37,38. By doping Pr3+, Nd3+, Sm3+, Eu3+, Tb3+, Dy3+, Er3+, Ho3+, Tm3+ and Yb3+ ions into CaZnOS, for example, Wang’s group achieved ML wavelength coverage in the 380–1030 nm range39. Subsequently, Peng’s group extended the ML wavelength to 1540 nm by leveraging the 4I13/2 → 4I15/2 transition of Er3+ in CaZnOS40. Therefore, by carefully doping different lanthanides or lanthanide pairs in single CaZnOS, the ML can be tuned over the 380–1540 nm range (Supplementary Fig. 1 and Table 1). This raises the question of how broad the wavelength range of ML can reach in a single host.
In the longwave band boundary, the intra-configurational 4f level dominantly determines the emission wavelength, making the answer rather clear41,42. In the shortwave limit, however, it is filled with unknowns. Reports on ultraviolet-C (UVC, 200–280 nm) and ultraviolet-B (UVB, 280–320 nm) ML are quite limited. In 2023, Wang’s team observed UVB ML from Y3Al2Ga3O12:Gd3+ with a central wavelength at 313 nm, which was attributed to the 6P7/2 → 8S7/2 transition of Gd3+ 43. In the same year, our group collected the 1I6 → 3H6 transition of Tm3+ in MgF2 in the ML mode, peaking at 292 nm44. Using a trial-and-error method, we also observed ML at 250 nm in NaYF4:Pr3+ (Pr3+:1S0 → 3F4) and 230 nm in Sr2P2O7:Pr3+ (Pr3+:5 d → 4 f)45,46. These observations inspire us to break the shortwave limit in far-UVC (200–230 nm) using Pr3+ dopants by refining the host lattice. The ultra-shortwave emissions are expected to expand the applications of ML, such as in micropollutant degradation, inactivation of bacteria, concealed communication, and particularly in solar-blind imaging47,48. Solar-blind imaging represents a pivotal advancement in remote sensing and optical detection methodologies, emphasizing the importance of detecting UVC radiation in the absence of solar interference. By operating in a solar-blind region, imaging systems can effectively filter out the overwhelming background noise generated by sunlight and artificial light sources, allowing for enhanced visibility of faint signals from targets or phenomena of interest. Consequently, solar-blind imaging is particularly valuable for applications such as military surveillance, atmospheric research and pollution monitoring, where conventional imaging systems may struggle.
To establish general guidelines for far-UVC ML design, we herein analyze the complicated situation of Pr3+ energy levels under the influence of host matrices. Accordingly, we develop a class of Pr3+-doped SrF2 crystals and realize far-UVC ML with central wavelength at approximately 222 nm through the 4f5d → 3H4 transition of Pr3+. Moreover, we confirm that the SrF2 hosts show high tolerance to various lanthanides as luminescent centers, including Ce3+, Nd3+, Sm3+, Eu2+,3+, Gd3+, Tb3+, Dy3+, Ho3+, Er3+, Tm3+ and Yb3+. The ML of these samples covers nearly the whole spectral range from 200 to 1700 nm, superior to the previous reports (Supplementary Fig. 1 and Table 1). Taking into account the fact that the UVC part of the solar spectrum has been totally absorbed by the ozone sphere and UVC light is invisible to the naked eyes, we demonstrate the potential application of SrF2:Pr3+ for high-contrast and background-free marking. In addition, we also show how to use the multi-bands of ML for encryption, anti-counterfeiting, non-destructive testing and structural health monitoring.
Results
Design principles for far-UVC emission
In order to obtain far-UVC ML in Pr3+ ions, a set of conditions should be satisfied (Fig. 1). At the most basic level, the bandgap of the host where Pr3+ ions are embedded should be greater than 6.2 eV (≈200 nm), such that the far-UVC photons are not absorbed by the host (Fig. 1, step 1). This requirement excludes a large portion of semiconductors and oxysalts, such as sulfide (ZnS:3.5 ~ 3.8 eV, CaS:3.06 eV), oxides (Y2O3:5.5 eV, ZnO:3.37 eV and BaTiO3:3.3 eV), tungstates (CaWO4:4.5 eV) and molybdates (CaMoO4:3.7 eV), despite their popularity in hosting visible emitting ions.
Fig. 1: Design principles for far-UVC emission.
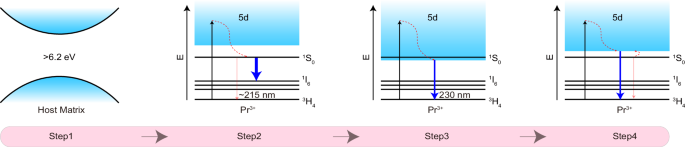
Step 1: Calculation of the band gap of the host crystal. Step 2: Assessment of the position and intensity of transitions from the 1S0 state of Pr3+. Step 3: Determine the lowest energy 4f5d state for the longwave boundary of far-UVC emission. Step 4: Analysis of the situation in which the transitions from the 4f5d state of Pr3+ dominate the emissions as well as the shortwave boundary of far-UVC emission.
Next, we pay attention to the 1S0 state of Pr3+, which may generate far-UVC emissions through the 1S0 → 3H4 (≈215 nm) and 1S0 → 3H5 (≈225 nm) transitions (Fig. 1, step 2). It should be noted, however, that the emission intensities of these intra-configurational transitions are very weak due to their parity-forbidden nature. Another downside is that the total transition branching ratios of 1S0 → 3H4,5 are usually less than 1%. More than 60% ~ 80% of the excited 1S0 state terminates in the lower-lying 1I6 state, peaking at ≈400 nm49,50. This explains why the 1S0 → 3H4 (≈215 nm) and 1S0 → 3H5 (≈225 nm) transitions are hardly observed in most reports. Even if they are observed under optimal conditions, the emission intensity is too weak51,52.
The above discussions suggest that the 1S0 state is unfavorable to far-UVC emissions. Therefore, it is more advisable to expect far-UVC emissions from the 4f5d state. The longwave boundary of far-UVC is at 230 nm, corresponding to ≈43478 cm−1. Accordingly, the lower limit of the 4f5d state should be above 43478 cm−1 (Fig. 1, step 3). Under this premise constraint, the energy position of the 4f5d state should be as close as possible to the center wavelength (≈46500 cm−1) of far-UVC, ensuring that most emissions fall within the far-UVC range.
Notably, an over-high energy of the 4f5d should also be avoided. Otherwise, the excited electrons at the 4f5d state will be non-radiatively relaxed to the lower 1S0 state, followed by the emissions from the 1S0 state (Fig. 1, step 4). In SrAl12O19:Pr3+, for example, the lowest 4f5d state and 1S0 state were ≈47600 cm−1 and ≈46500 cm−1, respectively, with an energy difference of 1100 cm−1 53. In this compound, only weak transitions from the 1S0 state were observed over the far-UVC region at 220 nm. In contrast, the lowest 4f5d state in LaB3O6:Pr3+ is higher than the 1S0 state by ≈900 cm−1, and the 5d → 4f transitions dominated the emission spectrum in the far-UVC range due to the Boltzmann distribution between the 1S0 state and the upper 4f5d state54. Combining the above two situations, we suggest that the position of the 4f5d state should not be higher than that of the 1S0 state by 1000 cm−1.
Summarizing all the information above, we can draw the following semi-empirical conclusion: the 4f5d state of Pr3+ should be in the range of 43478 to 47500 cm−1. Considering that the position of the 1S0 state may slightly change with the alteration of the host (<500 cm−1), the upper energy limit of the 4f5d state of Pr3+ can be appropriately relaxed to ≈48000 cm−1. Additionally, it is important to note that the host material where Pr3+ ions are embedded needs to have good far-UVC transmission. This clue points to fluorides that typically possess a wide band gap and good ultraviolet transmittance. Based on previous reports, the 4f → 5d transition of Pr3+ in SrF2 had an absorption peak at ≈46600 cm−1 55. Such energy value well satisfies the above guidelines, thus making it possible to achieve far-UVC ML. Therefore, SrF2:Pr3+ was chosen as a representative for examination in the subsequent sections.
Material synthesis and characterization
A series of SrF2:x%Pr3+ (x = 0.1, 0.2, 0.5, 0.7, and 1) phosphors were synthesized by a high-temperature solid-state technique. The X-ray diffraction (XRD) patterns of these samples, mainly comprising the diffraction peaks of (1 1 1), (2 0 0), (2 2 0), (3 1 1), (4 0 0), and (3 3 1) planes, matched well with cubic phase SrF2 crystals (PDF#88-2294) (Fig. 2a). It suggested that SrF2:Pr3+ crystalized in the single center-symmetric structure with the Fm-3m space group (Fig. 2b). In this structure, Sr ions occupied an octahedral coordination environment, where each Sr ion was surrounded by eight F ions. Meanwhile, Pr3+ ions entered the host lattice by substituting the Sr2+ sites (Supplementary Table 2), which was confirmed by the Rietveld refinement analysis (Fig. 2c and Supplementary Table 3).
Fig. 2: Characterization of SrF2:Pr3+.
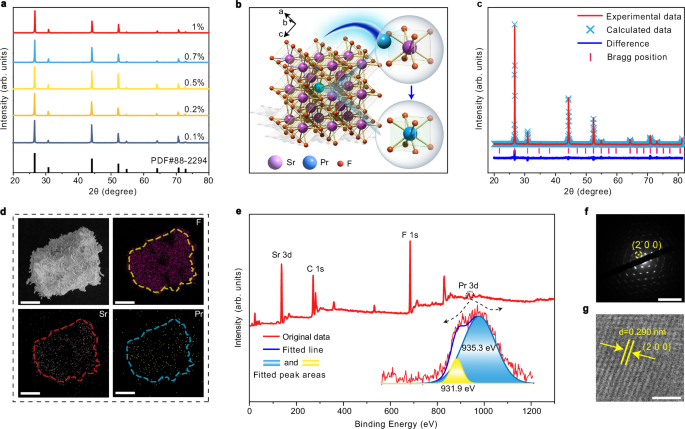
a X-ray diffraction patterns of SrF2:x%Pr3+ (x = 0.1, 0.2, 0.5, 0.7, and 1). b Crystal structure of SrF2:Pr3+. c Rietveld structure refinements of SrF2:0.5%Pr3+. d Scanning electron microscopy and elemental mapping images SrF2:0.5%Pr3+ (scale bar: 50 μm). e X-ray photoelectron spectroscopy profile of SrF2:0.5%Pr3+. f Selected area electron diffraction image of SrF2:0.5%Pr3+ (scale bar: 10 nm−1). g High-resolution transmission electron microscopy image of SrF2:0.5%Pr3+ (scale bar: 2 nm). Source data are provided as a Source Data file.
The scanning electron microscopy (SEM) image revealed an irregular morphology of the as-synthesized SrF2:Pr3+ in the micrometer length scale, with Sr, F and Pr elements distributed uniformly at the single particle level (Fig. 2d and Supplementary Fig. 2). The energy dispersive spectroscopy (EDS) results proved that the element ratios of Sr, F, and Pr were as expected (Supplementary Figs. 3–7). The X-ray photoelectron spectroscopy (XPS) results further validated the presence of constituent elements (Fig. 2e). The XPS peaks centered approximately at 966 and 946 eV were not observed, indicating the absence of tetravalent Pr. The peaks at the binding energy of 931.9 and 935.3 eV were ascribed to trivalent Pr. We also measured the Raman shift of SrF2:0.5%Pr3+ (Supplementary Fig. 8). A prominent band appeared at approximately 285 cm-1, attributed to the first-order F2g mode of SrF256. The selected area electron diffraction (SAED) exhibited sharp diffraction spots with a periodic arrangement, demonstrating good crystallinity (Fig. 2f). The high-resolution transmission electron microscopy (HR-TEM) images further disclosed the good crystallinity of our samples, which show well-defined (2 0 0) and (1 1 1) lattice fringes with observed d-spacings of 0.290 and 0.335 nm, respectively (Fig. 2g and Supplementary Fig. 9).
Multi-stimulated far-UVC luminescence
We designed a set of experimental procedures to systematically investigate the multi-stimulated luminescence, as schematically shown in Fig. 3a. Figure 3b depicts the emission spectra of SrF2:Pr3+ under different conditions. As can be seen, the sample can be directly excited by mechanical action through the self-recoverable ML mechanism (Stage I). After being exposed to X-ray irradiation, bright persistent luminescence (PersL) was detected (Stage II), indicating the occurrence of charge carrier trapping. Following PersL, we further detected trap-controlled ML by application of force (Stage III). The trap-controlled ML was about 90-fold stronger than the self-recoverable ML, and the intensity fell back to the original level by thermal cleaning of the trap states (Stage IV). Notably, all the spectra are dominated by the characteristic emission peaks of Pr3+ ions, suggesting that Pr3+ ions consistently acted as luminescent centers during the whole process (Fig. 3b). Specifically, the visible emission bands are attributed to the 3P0 → 3H4 (488 nm), 3P1 → 3H5 (524 nm), 3P0 → 3H6 (606 nm) /1D2 → 3H4 (606 nm) and 3P0 → 3F2 (640 nm) transitions of Pr3+. The UVC emission bands are assigned as the 4f5d → 3H4 (222 nm), 4f5d → 3H5 (233 nm) and 4f5d → 3H6 (259 nm) transitions of Pr3+. Note that the broad band peaking at 300 nm came from the self-trapped exciton of the host (Supplementary Fig. 10)57,58,59. The presence of the ML line at 222 nm proves the reliability of our guidelines for designing far-UVC luminescence.、
Fig. 3: Optical properties of SrF2:Pr3+.
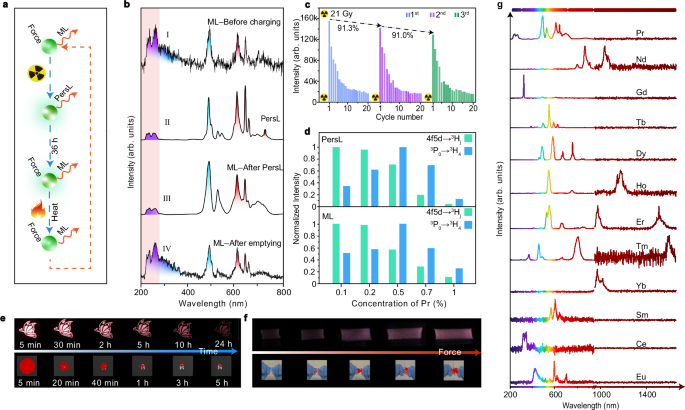
a Schematic of experimental procedures for mechanoluminescence (ML) and persistent luminescence (PersL) measurement. b Comparison of spectra of SrF2:0.5%Pr3+ under different conditions. Stage I: obtained before X-ray irradiation. Stage II: obtained immediately after stoppage of 5-min X-ray irradiation. Stage III: obtained upon force stimulation at 5 N after PersL. Stage IV: obtained after thermal bleach. c Repeatability results of trap-controlled ML. d PersL and ML intensity of SrF2:Pr3+ as a function of Pr3+ content. e Photographs of visible and UVC PersL of SrF2:0.5%Pr3+, showing progressive changes over time following a 5-min X-ray irradiation. f Photographs of visible and UVC ML of SrF2:0.5%Pr3+@polydimethylsiloxane films stretched under different magnitudes of force. g ML spectra of SrF2 singly doped with different lanthanides (0.5%mol). Source data are provided as a Source Data file.
We next examined the repeatability of ML. Both the self-recoverable and trap-controlled ML decreased after several cycles of continuous operation (Fig. 3c and Supplementary Fig. 11). This phenomenon was also previously observed by several groups13,15,22,25,43. By checking the XRD results of SrF2:0.5%Pr3+ after grinding, we found no noticeable change in the crystal structure (Supplementary Fig. 12). The comparison of SEM images of SrF2:Pr3+ before and after grinding suggested that the samples became progressively finer (Supplementary Fig. 13). As the surface area and morphology of samples had been modified, it was reasonable to assume that the ML property, including both self-recoverable and trap-controlled ML, were affected to some extent60.
We optimized the content of Pr3+ in SrF2 with emphasis on the 4f5d → 3H4,5,6 and 3P0 → 3H4 transitions. The transitions from the 4f5d and 3P0 states exhibit opposite trends with doping concentration (Fig. 3d and Supplementary Fig. 14). Such discrepancy is explained by the possible cross-relaxation-induced concentration quenching mechanism (Supplementary Fig. 15). With gradually increasing the content of Pr3+, the 4f5d → 3H4,5,6 transition showed a monotonic decrease trend, as the [4f5d → 3P0,1]/[1D2 ← 3H4] cross-relaxation process was harmful to the 4f5d state. By contrast, the 3P0 → 3H4 transition increased first over the range of 0.1 < x < 0.5 because the [4f5d → 3P0,1]/[1D2 ← 3H4] cross-relaxation would populate the 3P0 state, together with the increment of luminescent centers. When the content of Pr3+ exceeded 0.5%, the 3P0 → 3H4 transition experienced a continuous decline, attributed to the predominance of [3P0,1 → 1G4]/[1G4 ← 3H4] cross-relaxation59.
Under a doping concentration of 0.5%, the SrF2:Pr3+ exhibited pronounced and balanced visible and UVC PersL after the stoppage of X-ray irradiation (Fig. 3e and Supplementary Fig. 16). It was easy to distinguish the UVC PersL signal from the background noise after several hours. Even after one day, the visible PersL was observed clearly. Over the whole PersL process, the positions of emission spectra remained unchanged (Supplementary Fig. 17). After the release of room temperature PersL, SrF2:Pr3+ continued to emit in the visible and UVC regions by mechanical stimulation (Fig. 3f and Supplementary Movie 1). With increasing the force, both the UVC and visible ML were enhanced. Notably, the ML intensity of 3P0 → 3H4 (488 nm) and 4f5d → 3H4,5,6 transitions displayed different responses to the external force (Supplementary Figs. 18 and 19), pushing us to establish a ratiometric method for stress sensing61,62. The ML intensity ratio between the 3P0 → 3H4 and 4f5d → 3H4,5,6 transitions presented a monotonic decrease by raising the force, with the relative sensitivity varying from 3% N−1 to 7% N−1 over the 5–25 N range (Supplementary Fig. 20).
We also prepared a series of SrF2 samples doped with various lanthanides (Ce3+, Nd3+, Sm3+, Eu2+,3+, Gd3+, Tb3+, Dy3+, Ho3+, Er3+, Tm3+, and Yb3+) to expand the spectral range. The XRD and XPS results proved the successful preparation of target materials (Supplementary Figs. 21 and 22). All these samples emitted self-recoverable ML (Supplementary Figs. 23 and 24). After being pre-charged by X-ray, these samples emitted tunable PersL due to characteristic transitions in relevant lanthanide dopants (Supplementary Figs. 25–27). After the PersL faded out in one and a half days, all samples presented trap-controlled ML, nearly covering the whole spectral range from 200 to 1700 nm (Fig. 3g and Supplementary Figs. 28–31).
Mechanistic investigation of multi-stimulated emission
The self-recoverable ML was previously observed in some asymmetric materials like CaZnOS:Mn2+ and ZnS:Mn2+ due to piezoelectricity28,63. Accordingly, we conducted the piezoresponse force microscopy (PFM) tests to check the piezoelectric effect. Pure SrF2 did not show any piezoelectric properties due to the centrosymmetric nature (Supplementary Fig. 32). Nevertheless, piezoelectric hysteresis and butterfly loops appeared for SrF2:Pr3+ during the PFM measurements, indicating that the introduction of Pr3+ disrupted the local symmetry of SrF2 and thereby endowed SrF2:Pr3+ with local piezoelectric properties (Supplementary Fig. 33). The PFM results verify the arise of piezoelectric potential in the ML process.
It should be noted that, in addition to the piezoelectric effect, triboelectrification has recently been considered as another key mechanism for ML. A notable feature of triboelectrification-induced ML is that the ML intensity exhibits a strong dependence on the triboelectricity of the embedding substrates (Supplementary Table 4). Accordingly, we assessed the ML intensity of SrF2:Pr3+ particles embedded in a series of polymer substrates (Fig. 4a). The results show that SrF2:Pr3+@polydimethylsiloxane (PDMS) presented the strongest ML as PDMS has the best negative triboelectricity than ER (epoxy resin), PU (polyurethane) and SG (silicon gel), consistent with the previously reported results (Supplementary Table 4). The above observations indicate that the triboelectric effect is also responsible for the ML from SrF2:Pr3+. The conclusion was further corroborated by green-emitting SrF2:Tb3+ (Fig. 4a).
Fig. 4: Mechanistic study of SrF2:Pr3+.
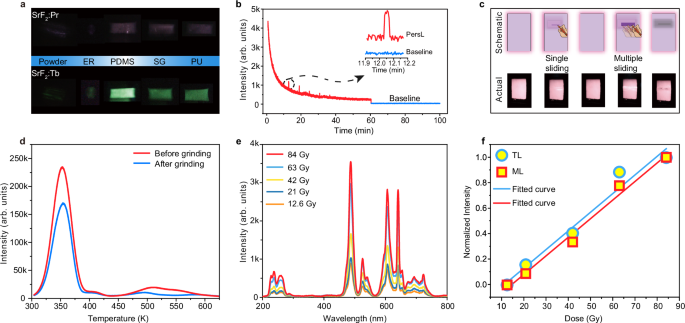
a Photographs of SrF2:0.5%Pr3+ powder and SrF2:0.5%Pr3+ embedded in different polymers, including epoxy resin (ER), polydimethylsiloxane (PDMS), silicon gel (SG) and polyurethane (PU), under mechanical action. b Persistent luminescence (PersL) decay curve of SrF2:0.5%Pr3+ after stoppage of 5-min X-ray irradiation. Inset: enlarged PersL signal upon stimulation of external force. c Photographs of SrF2:0.5%Pr3+ upon single- and multiple-sliding during the PersL process. d Thermoluminescence (TL) curves of SrF2:0.5%Pr3+ before and after grinding for 20 min. e Mechanoluminescence (ML) spectra of SrF2:0.5%Pr3+ after different X-ray exposure dose. f Normalized TL and ML intensities of SrF2:0.5%Pr3+ as a function of X-ray irradiation dose. Source data are provided as a Source Data file.
To gain insight into the trap-controlled ML mechanism after X-ray charging, we measured the PL (λex = 440 nm, λem = 488 nm) and ML decay curves of SrF2:0.5%Pr3+ (Supplementary Fig. 34). The results reveal that the duration time of ML is three orders of magnitude larger than that of PL. The observation supports the trap-controlled nature of the ML behavior, which involves the release and migration of charge carriers, thus taking a significantly longer time than PL (Supplementary Fig. 35). In line with the mechanically induced release of trap carriers, a transient enhancement of emission was detected at the PersL stage upon stimulation of external force (Fig. 4b). After repeated force stimulation, a notable dimming in PersL occurred at the location where the force was applied along with a significant decrease in the TL intensity (Figs. 4c, d). At the same time, the ML intensity constantly decreased. These results indicated that the PersL and ML originated from the same trapped charge carriers that can be released by both heat and force.
To shed more light on the multi-stimulated luminescence, the trapped charge carriers were adjusted by regulating the X-ray dose. With the increase of charging time, the ML intensified gradually (Fig. 4e). The observation is as anticipated due to the increased population in trap states, as confirmed by TL measurement (Supplementary Fig. 36). After performing the integral calculation, we clearly demonstrated the positive correlation of ML and TL intensities (Fig. 4f). As PersL is also closely related to TL, it is not difficult to understand that the stronger the PersL, the stronger the ML typically is (Supplementary Figs. 37 and 38). These observations provided additional evidence that the PersL and ML originated from the same trapped charge carriers. According to the TL spectra, we determined continuously distributed traps (Supplementary Figs. 39 and 40). The XRD pattern of SrF2:Pr3+ was essentially unchanged upon exposure to X-ray (Supplementary Fig. 41), suggesting that the traps of SrF2:Pr3+ were not due to the macro-structural change. We thus ascribe the trap states to intrinsic defects resulting from aliovalent doping. Our theoretical calculations (Supplementary Fig. 42 and Table 5 and Note 1) suggest that the substitution of two Pr3+ ions for two Sr2+ sites most likely occurred, resulting in one consequent Sr2+ vacancy. Moreover, fluorine vacancies and interstitials were expected to be generated in the fluorides under X-ray irradiation according to previous reports. Therefore, there were abundant defects in SrF2:Pr3+ to trap charge carriers64,65,66.
Far-UVC emission for solar-blind imaging
We designed a quick response (QR) code made of SrF2:0.5%Pr3+ and put it on the surface of high-valued goods. During X-ray inspections, the QR code was charged. After inspections, the QR code emitted both UVC and visible PersL that could be recorded separately by solar-blind and common cameras (Fig. 5a), providing a dual-layer anti-counterfeiting verification. Furthermore, even if the QR code’s PersL diminished over time, the QR code could still be captured by a typical smartphone under mechanical stimulation (Supplementary Fig. 43). By incorporating such a unique QR code on product packaging, counterfeiting and illegal transportation can be prevented to a great extent.
Fig. 5: Optical imaging through far-UVC emission of SrF2:Pr3+.
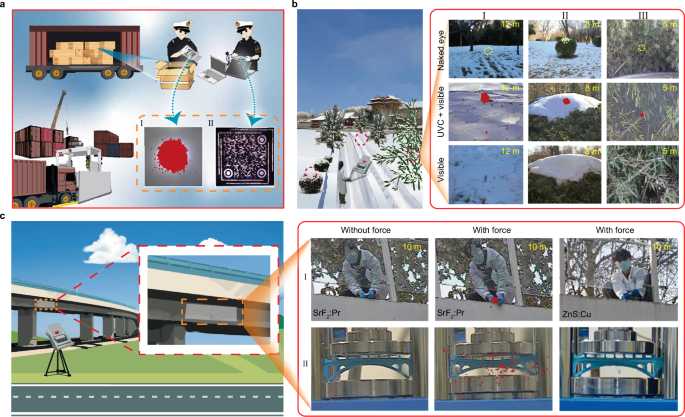
a Customs inspection. I and II show the photographs of SrF2:Pr3+ coated on the surface of goods after X-ray inspections, captured by collecting the UVC and visible emissions, respectively. b Solar-blind marking. The right panel presents the images of different complex scenarios that contain the SrF2:Pr3+ tablets, captured by using the visible or UVC+visible channel of a solar blind camera. c Structural health monitoring. The right panel shows the photographs of SrF2:Pr3+@polydimethylsiloxane and ZnS:Cu2+@polydimethylsiloxane films, as well as SrF2:Pr3+@photopolymer resin and ZnS:Cu2+@photopolymer resin under force stimulation by using the visible or UVC+visible channel of s solar blind camera.
Another important application for the UVC emission of SrF2:Pr3+ is high contrast marking. We prepared a series of SrF2:Pr3+ tablets with a diameter of 13 mm (Supplementary Fig. 44). As the samples are visually small and white, they are almost imperceptible to the naked eyes when placed in complex backgrounds such as in bamboo forests, holly bushes or snow. However, the positions of SrF2:Pr3+ tablets can be clearly identified by using a solar blind camera to capture the UVC PersL signal (Fig. 5b). We further constructed an array by mixing SrF2:Pr3+@PDMS with SrF2@PDMS (Supplementary Fig. 45). After X-ray irradiation, the pattern ‘Pr’ was captured using the combined UVC and visible channel of solar blind camera. This method enables advanced marking techniques.
Health monitoring of engineering structures such as bridges and buildings is important for preventing structural failures that can lead to major disasters and economic losses. SrF2:Pr3+ holds important value for remote and real-time structural monitoring. We simulated two scenarios to illustrate the superiority of UVC photons. One involved directly pulling the SrF2:Pr3+@PDMS film coated on the surface of a real bridge (Fig. 5c-I), while the other involved compressing the SrF2:Pr3+@PDMS film coated on the surface of a 3D-printed bridge model (Fig. 5c-II). When external force was applied to the SrF2:Pr3+@PDMS film, the UVC emission was clearly captured in high contrast even in a bright environment. In this way, structural damage to the building, such as cracks, could be promptly collected and warned to prevent accidents and ensure safety. As a control experiment, we also employed the well-established ZnS:Cu2+ with visible emission to replace SrF2:Pr3+ for the above demonstrations. Expectedly, no green ML could be observed due to the strong interference of background light, including intense outdoor sunlight and indoor lighting sources, although super bright ML was observed in dark environments (Supplementary Fig. 46). Considering the remarkable anti-interference capability of UVC photons, our samples are expected to unlock more applications such as emergency rescue (Supplementary Fig. 47). As the multi-stimulated luminescence can be substantially tuned across the full spectrum by doping different lanthanides, these materials also hold significant promise for information security and other advanced applications (Supplementary Figs. 48–51 and Note 2).
Discussion
In summary, we establish a set of design principles for far-UVC luminescence. Under the guidance of these principles, we develop a class of SrF2:Pr3+ crystals and realize unprecedented far-UVC ML at ≈222 nm through the inter-configurational 4f5d → 4f 2 transition of Pr3+. By careful selection of dopant luminescent centers, including Ce3+, Pr3+, Nd3+, Sm3+, Eu2+,3+, Gd3+, Tb3+, Dy3+, Ho3+, Er3+, Tm3+ and Yb3+, we further achieve tunable ML over the whole spectral range from 200 to 1700 nm, the widest emission wavelength span in a single host. Moreover, these materials can trap charge carriers following X-ray irradiation, giving rise to bright emissions by thermal and mechanical stimulations. The advances in these lanthanides-doped SrF2 have enabled promising applications encompassing high-contrast imaging and structural health monitoring in bright and complex environments.
Methods
Materials
The chemicals include SrF2 (99.99%, Aladdin), Pr6O11 (99.99%, Aladdin), CeO2 (99.9%, Aladdin), Gd2O3 (99.99%, Aladdin), Tb4O7 (99.9%, Aladdin), Dy2O3 (99.9%, Aladdin), Eu2O3 (99.99%, Aladdin), Sm2O3 (99.99%, Aladdin), Tm2O3 (99.9%, Aladdin), Nd2O3 (99.99%, Aladdin), Yb2O3 (99.99%, Aladdin), Ho2O3 (99.99%, Aladdin), Er2O3 (99.99%, Aladdin), NH4F (99.99%, Aladdin), polyethylene terephthalate (PET, Deli 3816 plastic packaging film), PDMS (Sylgard 184, Dow Corning), ER (Shenzhen midisha composite material Co., Ltd), PU (Shenzhen huiruide technology co., Ltd) and SG (Shenzhen huiruide technology co., Ltd). Note that the commercial ZnS:Cu2+ powder was directly purchased online (https://item.taobao.com/item.htm?id=683193241181).
Synthesis
Synthesis of SrF2:Pr3+ powder. The SrF2 and Pr6O11 were weighed according to the stoichiometric ratio. Next, the weighed powders were ground thoroughly for 30 min, followed by another 30-min grinding after adding sufficient NH4F. Subsequently, the mixtures were sintered at 900 °C in an air environment for 2 h to obtain the final products. For the rest of the powder samples, the preparation procedures are similar to SrF2:Pr3+, except that the raw material of Pr6O11 should be replaced by the corresponding rare earth oxides.
Synthesis of soft mechanoluminescent films. 0.3 g of SrF2:Pr3+ powder, 0.09 g of UV curing agent and 10 mL of ethyl alcohol were added to a centrifuge tube and ultrasonically treated for 30 min to form a homogeneous mixture. The mixture was then immediately poured into a 3*3 cm2 mold placed on a PET film. The mechanoluminescent film was successfully obtained by evaporating the alcohol in a drying oven.
Synthesis of SrF2:Pr3+@PDMS composite. The SrF2:Pr3+ (or SrF2:Tb3+) powders were mixed with the PDMS precursor and curing agent in a 20 ml centrifuge tube. The mass ratio of SrF2:Pr3+ (or SrF2:Tb3+) powders, PDMS precursor and curing agent was fixed to 5.5:10:1. Thereafter, the above mixture was stirred for 20 min. Finally, it was poured into an acrylic sheet mold with a length of 50 mm and a width of 10 mm, and cured at 70 °C for 2 h to collect the target composite.
Synthesis of SrF2:Pr3+@ER composite. Initially, the SrF2:Pr3+ (or SrF2:Tb3+) powders were mixed with the ER precursor and curing agent in a 20 ml centrifuge tube. The mass ratio of SrF2:Pr3+ (or SrF2:Tb3+) powders, SG precursor and curing agent was maintained at 2:3:1. Next, the above mixture was stirred for 20 min. Finally, it was poured into a silica gel grinder with a diameter of 8 mm and cured at 60 °C for 2 h to obtain the final composite.
Synthesis of SrF2:Pr3+@SG composites. The SrF2:Pr3+ (or SrF2:Tb3+) powders were mixed with the SG precursor and curing agent in a 20 ml centrifuge tube. The mass ratio of SrF2:Pr3+ (or SrF2:Tb3+) powders, SG precursor and curing agent was set to 5.5:10:1. After that, the above mixture was stirred for 20 min. In the end, it was poured into an acrylic mold with a length of 50 mm and a width of 10 mm, and cured at 70 °C for 6 h to obtain the sample.
Synthesis of SrF2:Pr3+@PU composites. Firstly, the SrF2:Pr3+ (or SrF2:Tb3+) powders were mixed with the PU precursor and curing agent in a 20 ml centrifuge tube. The mass ratio of SrF2:Pr3+ (or SrF2:Tb3+) powders, PU precursor A and PU precursor B was kept at 1:1:1. Subsequently, the above mixture was stirred for 20 min. Finally, it was poured into an acrylic mold with a length of 50 mm and a width of 10 mm, and cured at 70 °C for 2 h to obtain the product.
Material characterization
The crystal structure of samples was characterized by XRD (Bruker Optics, Cu-Kα). The valence states of samples were determined using XPS (Thermo Fisher Scientific, ESCALAB 250Xi; resolution: 0.45 eV). The morphological and elemental composition analyses of samples were performed using an SEM instrument (FEI Nova Nano SEM450) equipped with an EDS detector. The fine lattice structures of samples were observed using HR-TEM (JEOL-2100Plus). The Raman spectrum of samples was collected with a Raman spectrometer (Horiba Jobin Yvon, HR Evolution). The PFM measurements were conducted using a scanning probe microscope (Nanoscope V Multimode 8) from Bruker Corporation.
Optical measurement
An X-ray radiator (Dandong Tongda Science and Technology Co., Ltd., CT; 30 mA, 40 kV, W target) was used as the excitation source. The PersL and ML spectra of samples were obtained using a fiber optic spectrometer (QE65-pro and Maya2000-pro, Ocean Optics, 200–950 nm; NIR-Quest, Ocean Optics, 950–1700 nm). The ML performance of samples was quantitatively assessed using a custom apparatus consisting of a gravity-sensitive device, a fiber optic spectrometer, a programmable motion platform and a sample mounting plate. The mechanoluminescent powder was placed in the upper part of a mortar. The stress sensing device was placed on a programmable movable platform. A transparent quartz tube was fixed on the displacement platform, and the external force was applied to the sample through the displacement platform.
The ML reproducibility of samples was assessed quantitatively using a custom-built apparatus consisting of digital push-pull equipment, a fiber-optic spectrometer, a programmable mobile platform, and a sample-fixing plate. The mechanoluminescent PET film was pasted onto a quartz glass sheet. On one side, the digital push-pull instrument equipped with a metal attachment was fixed on a programmable mobile platform. The digital push-pull equipment controlled the applied force, and the ML signal was collected using the fiber-optic spectrometer. The ML Photographs of samples were taken using a digital camera (Canon 5D). The authors affirm that human research participants provided informed consent for publication of the images in Fig. 5 and Supplementary Fig. 47.
ML lifetime measurement
The SrF2:Pr3+@PDMS film was stretched by a universal testing machine (Stretching rate: 15 mm/sec for 5 mm). The ML signal was received by a photomultiplier tube (R928, Hamamatsu, Japan) at the moment the stretching was immediately halted. The ML signal was then read by a high resistance/low current electrostatic meter (6500/6430 series, Keithley) through a voltage amplifier.
PL lifetime measurement
A tunable laser (OPOTEK, Compact OPO Laser-Opolette Series, frequency: 20 Hz, pulse width: 6 ms) was used as the excitation source. The PL signal was collected by a photomultiplier tube (R928, Hamamatsu, Japan) coupled to an oscilloscope (MDO32, Tektronix).
First-principles calculation
First-principles density functional theory (DFT) calculations were performed using the Vienna Ab initio Simulation Package67,68,69. The projector augmented-wave (PAW) potential was adopted to describe the core electrons, and the valence electrons were described by plane-wave basis with an energy cut-off of 500 eV70,71. The exchange-correlation functional adopted the generalized gradient approximation in the Perdew-Burke-Ernzerhof form (GGA-PBE)72. The convergence criteria were 10-7 eV for the self-consistent energy calculation and 0.01 eV/Å for the Hellmann-Feynman force in the geometric optimization. The Brillouin zone was sampled using Monkhorst-Pack scheme with a k-point density of 2π × 0.03 Å−1. The atomic coordinates of the optimized computational models are provided in the Source Data file as data related to Supplementary Fig. 42.