


Abstract
The subcellular localization of RNA is closely linked to its function. Many RNA species are partitioned into organelles and other subcellular compartments for storage, processing, translation, or degradation. Thus, capturing the subcellular spatial distribution of RNA would directly contribute to the understanding of RNA functions and regulation. Here, we present PHOTON, a method which combines high resolution imaging with high throughput sequencing to achieve spatial transcriptome profiling at subcellular resolution. We demonstrate PHOTON as a versatile tool to accurately capture the transcriptome of target cell types in situ at the tissue level such as granulosa cells in the ovary, as well as RNA content within subcellular compartments such as the nucleoli, the mitochondria, and the stress granules. Using PHOTON, we also reveal the functional role of m6A modifications on mRNA partitioning into stress granules. These results collectively demonstrate that PHOTON is a flexible and generalizable platform for understanding subcellular molecular dynamics through the transcriptomic lens.
Introduction
RNA distribution within a cell is intimately linked to cell functions1,2. The enrichment of selective RNA species in subcellular compartments is a phenomenon observed across species. These RNA-containing compartments partition cellular content, create cellular asymmetries, enhance biological reactions, and promote molecular interactions required for cellular functions and cell fate decisions3,4,5. For instance, selective mRNAs have been shown to be recruited into the stress granules (SGs) for translation suppression during cellular stress6,7. In the nucleus, the nucleolus has been demonstrated to be the site for ribosomal RNA (rRNA) synthesis8 and inflammatory RNA decay during infection9. Given the significant roles of RNA distribution in cell functions, there is a need for tools that can specifically capture RNA species within subcellular compartments.
While many methods have been developed to study RNA distribution within cells, only a few have been applied on a transcriptome-wide scale. Furthermore, current transcriptomics methods suffer from various limitations. For example, a conventional approach to profile RNA content within subcellular compartments is to biochemically (e.g., protein-RNA crosslinking followed by immunoprecipitation) and/or mechanically (e.g., density gradient followed by centrifugation) purify these compartments and sequence their RNA content10,11,12. However, this approach requires millions of cells as input, which makes it challenging to apply to rare cell types. And more importantly, not all subcellular compartments can be purified, especially for those membrane-less, transient biomolecular condensates. Even for compartments that can be isolated, such as the SGs, current protocols fail to remove contaminants or prevent content loss during the isolation process.
Imaging-based spatial transcriptomics methods such as MERFISH13 and seqFISH14 can visualize the distribution of thousands of mRNAs within individual cells. The drawbacks of these approaches, however, are the need for designing and synthesizing a large pool of probe sets targeting RNAs of interest, the requirement for specialized technical expertise and instrumentation, and sophisticated image processing and data analysis.
Emerging proximity labeling-based RNA profiling methods, such as APEX-seq, are powerful tools to capture RNA transcripts at a high spatiotemporal resolution15,16. However, they often require time-consuming genome engineering in which a labeling enzyme (e.g., a biotin ligase) is genetically fused to a protein enriched in a type of compartment. This makes it difficult to scale to various types of subcellular compartments. And the specificity of these methods is dictated by the specificity of the protein the labeling enzyme is fused to.
Thus, there remains a need for tools that (1) can capture the spatial localization of thousands of endogenous RNA species within various types of subcellular compartments; (2) require significantly less input than existing methods; and 3) do not need genetic manipulations. Here, we present PHOTON (Photoselection of Transcriptome over Nanoscale), a method which combines high-resolution imaging with high-throughput sequencing to achieve spatial transcriptome profiling at subcellular resolution. We demonstrate PHOTON as a versatile tool to capture the transcriptome of target cell types in situ at the tissue level as well as RNA content within subcellular compartments. Using PHOTON, we also reveal the functional role of m6A modifications on mRNA partitioning into SGs. These examples illustrate the versatility of PHOTON and its ability to reveal biological insights.
Results
The PHOTON Workflow
To develop the methodology, we drew from our previous work in sequencing DNA of fixed samples at sub-micron (~300 nm) resolution using imaging-guided, laser-targeted photo-selection17. Based on the same imaging setup, PHOTON can be broken down into four major steps: (1) construction of a photocaged cDNA library in situ; (2) selective uncaging of the cDNA molecules using targeted illumination with near-ultraviolet (UV) laser light; (3) sample digestion and PCR handle ligation to uncaged cDNA molecules; and (4) library preparation followed by sequencing (Fig. 1A).
Fig. 1: PHOTON enables spatially resolved transcriptome profiling.
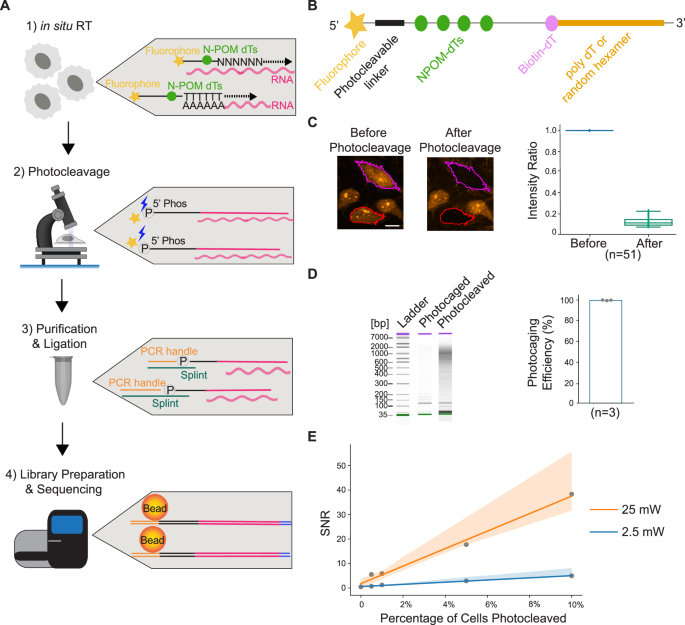
A Schematic diagram illustrating the PHOTON method. First, in situ RT is performed using photocleavable RT primers. Second, targeted illumination is performed within specific ROIs identified by fluorescence imaging. Exposure of the cDNA molecules to near-UV light modifies the N-POM-caged dTs and breaks the photocleavable linkers on the RT primers, releasing the fluorescent labels and revealing the phosphate groups. Third, nucleic acids are purified, and PCR handles are ligated to previously photocleaved cDNA molecules through splint oligos. Finally, successfully ligated cDNA molecules are pulled down using streptavidin beads, and a template switching step is performed with TSOs. Following PCR amplification, sequencing libraries are generated and read by next-generation sequencing. B Design of the RT primer. C Photocleavage of cDNA molecules in HeLa cells. The color-outlined cells were exposed to 25 mW 405 nm laser light, which cleaved the fluorophores from the RT primers and resulted in an 86.9% ± 4.3% (mean ± s.d.) intensity decrease (n = 51 cells, 1 experiment). Scale bar, 5 µm. The box represents the range between the first and third quartiles of the data. The line within the box indicates the median. The whiskers extend to the furthest data points. Source data are provided as a Source Data file. D Measuring the efficiency of the PHOTON photocaging mechanism. Left: tapestation gel image of a representative experiment; Right: bar graph showing the photocaging efficiency of PHOTON (n = 3 independent experiments). On average, 99.1 ± 0.26% (mean ± s.d.) of the photocaged cDNA molecules could not be amplified without near-UV light exposure. Source data are provided as a Source Data file. E SNR of PHOTON as a function of the fraction of cells selected under two different laser power conditions. The shaded areas represent the 95% confidence interval. Source data are provided as a Source Data file.
First, to construct a photocaged in situ cDNA library, we use custom reverse transcription (RT) primers. These primers contain, at the 3’ end, either a poly dT sequence or a random hexamer to hybridize to both mRNA and other non-poly adenylated RNA species. The 5’ end of the RT primer is linked to a fluorophore using a photocleavable linker. In addition, four 6-nitropiperonyloxymethyl (N-POM)-modified dTs as well as a biotin-conjugated dT are incorporated into the primers (Fig. 1B and Supplementary Table 1).
We next visualize the sample by microscopy and use fluorescent stains of a subcellular compartment to guide the identification of regions of interest (ROIs). Automated in-line image segmentation allows scalable assays of thousands of individual ROIs localized throughout the sample. Selective illumination of the ROIs using a 405 nm laser line cleaves the fluorophores from the RT primers via photocleavage of the linker, revealing a 5′ phosphate group. In the meantime, the 405 nm laser line also uncages the N-POM dTs within the primers, restoring the base paring functions of these dTs (Fig. 1A, Step 2). Thus, the photocleavable linker and the N-POM dTs serve as dual photocaging mechanisms to prevent unwanted uncaging of cDNA molecules.
Following photocleavage, cells are lysed, and nucleic acids are purified. A PCR handle containing a priming site for library amplification is then ligated to the 5’ end of the RT primer through a splint oligo (Supplementary Table 1). This ligation step only happens to the cDNA molecules where the 5′ phosphate groups were previously revealed and the N-POM dTs were previously uncaged through photocleavage (Fig. 1A, Step 3). Photocaged cDNA molecules do not have available 5′ phosphates, and the intact N-POM dTs prevent the base pairing of the splint oligos to the RT primers. Therefore, the photocaged cDNA molecules cannot pass the ligation stage.
Successfully ligated cDNA molecules can be pulled down by streptavidin beads due to the presence of biotin molecules on the RT primers. These purified cDNA molecules are subject to template switching using template switching oligos (TSOs) to add a second PCR handle. Following PCR amplification, the PCR products are subject to Illumina Nextera XT sequencing library preparation workflow, and the resulting libraries are depleted of rRNA sequences using DASH18. The final products are sequenced on an Illumina platform (Fig. 1A, Step 4).
The feasibility of PHOTON
To test the feasibility of PHOTON, we first characterized PHOTON libraries in cultured HeLa cells. To do this, we fixed and permeabilized HeLa cells, and performed in situ RT with the custom photocaged RT primers. cDNA products were visualized through the fluorophore on the RT primers (Fig. 1C, left image). When a subset of cells was exposed to a focused 405 nm laser light (Fig. 1C, images), we observed an accompanying 86.9% ± 4.3% (mean ± standard deviation (s.d.), N = 51 cells) decrease in fluorescence intensity within the exposed cells (Fig. 1C, plot) due to the photocleavage and subsequent diffusion of the fluorophore. In contrast, no decrease in fluorescence intensity was observed in non-targeted cells (Supplementary Fig. 1A).
To confirm that PHOTON libraries were generated from cellular RNA, we subjected two groups of cells (~5000 cells in each group) to the PHOTON workflow except that the reverse transcriptase was omitted in one group of cells (i.e., no RT). As expected, no PHOTON library was generated from the no RT group (Supplementary Fig. 1B).
To assess the baseline efficacy of the photocaging mechanism of the custom RT primers, we compared the size of PHOTON libraries generated with and without photocleaving the RT primers. Briefly, following in situ RT using the RT primers, cDNA products were isolated from the cells and split into halves. One half was exposed to the 405 nm laser light to photocleave the RT primers, while the other half was protected from light. The two halves were then subject to the rest of the PHOTON workflow. As expected, the photocleaved half resulted in a PHOTON library while the photocaged half did not (Fig. 1D, left). Quantification of the two halves using qPCR showed that the photocaging mechanism is 99.1 ± 0.26% (mean ± s.d.; n = 3 experiments) effective in preventing unwanted photocleavage of cDNA molecules (Fig. 1D, right).
Sequencing of the PHOTON libraries generated from total RNA (with ribosomal RNAs largely depleted) of ~ 5000 HeLa cells showed an alignment rate to the mitochondrial genome of 1.95 ± 0.35% (mean ± s.d.; n = 4 experiments) and alignment rate to the mRNAs of 43.80 ± 3.89% (mean ± s.d.; n = 4 experiments).
We next quantified the signal-to-noise ratio (SNR) of PHOTON. Given the design of PHOTON, we expect that the noise mainly stems from unwanted photocleavage of cDNA molecules due to, for instance, accidental exposure of the photocaged cDNA molecules to ambient light during sample processing or defective RT primer oligos during oligo synthesis. We also expect that the amount of signals scales with the level of laser power (stronger laser power means that more cDNA molecules can be photocleaved), as well as the number of cells photocleaved (which is proportional to the area of ROIs). Therefore, we calculated the relationship between the SNR and the laser power as well as the fraction of cells photocleaved in situ. To do this, we photocleaved various proportions of ~5000 HeLa cells using two different levels of laser power and measured the SNR under each condition. We found that under the 25 mW laser light, the SNR was approximately 357 times the fraction of cells photocleaved, and under 2.5 mW laser light, the SNR was 57 times the fraction of cells photocleaved. Notably, the signal of PHOTON was still above the noise (SNR > 1.2) even though only 0.5% of the cells (~ 25 HeLa cells) were photocleaved at a low laser power of 2.5 mW (Fig. 1E).
To further identify the optimal laser parameters for PHOTON, including both the laser power and the dwell time (the amount of time the laser stays at each pixel of an ROI), we performed the following experiments.
First, we performed a yield/sensitivity test by generating PHOTON libraries of ~ 5000 HeLa cells under a laser power of 2.5 mW, 25 mW, and ‘max power’, respectively. We defined ‘max power’ as the situation where all cDNA molecules in the cells were photocleaved. This was achieved by using RT primers that did not have any of the photo-caging mechanisms but contained 5’ phosphate groups for ligation (Supplementary Table 1). Thus, these ‘unblocked’ RT primers were used to set the upper bound of the yield and sensitivity achieved by a PHOTON experiment. Interestingly, we found that among all three laser power conditions, PHOTON captured a similar number of RNA species (Supplementary Fig. 1C, one-way ANOVA p = 0.0589). This suggests that PHOTON is highly sensitive even under low laser power. However, the expression levels of these RNAs slightly but steadily increased as the laser power rose (Supplementary Fig. 1D). This result corroborates with the notion that the yield of PHOTON increases as a function of the laser power.
Next, we performed a specificity test in which we tested the ability of the PHOTON laser setup to only focus on molecules within an ROI. To this end, we generated a lawn of photocaged RT oligos and directed the laser to ROIs of the same size under different levels of laser power or laser dwell time. We found that as either the laser power or the dwell time increased, the photocleaved area outside of the intended ROI also enlarged (Supplementary Fig. 1E). This result indicates that the specificity of PHOTON decreases as higher laser power or longer dwell time is used.
Together, these results suggest that PHOTON is highly sensitive in capturing RNA information in situ. Taking into account the sensitivity, the yield, and the specificity of PHOTON, we chose a laser power of 2.5 mW and a dwell time of 100 µs for all the subsequent subcellular PHOTON experiments (see Discussion).
PHOTON reproduces transcriptome data in the mouse ovary
After demonstrating the feasibility of PHOTON, we set out to validate its capability to capture the cellular transcriptome at the tissue level. We focused on granulosa cells (GCs; a cell type supporting oocyte development) in the ovarian follicles because GCs can be easily identified through their spatial locations and tissue morphology (Fig. 2A and Supplementary Fig. 2A). We generated two sets of PHOTON libraries by each photocleaving approximately 600 GCs from follicles at various developmental stages in a single mouse ovarian tissue section at a 10-micron thickness. The PHOTON data were highly reproducible, as demonstrated by the high correlation between the two replicates (Supplementary Fig. 2B). Transcriptome analysis showed that known GC markers such as Inha, Nr5a2, and Serpine2 were highly expressed in the PHOTON datasets while markers of other cell types in the ovary were not (Fig. 2B).
Fig. 2: PHOTON captures the spatial transcriptome of granulosa cells (GCs) in the mouse ovary.
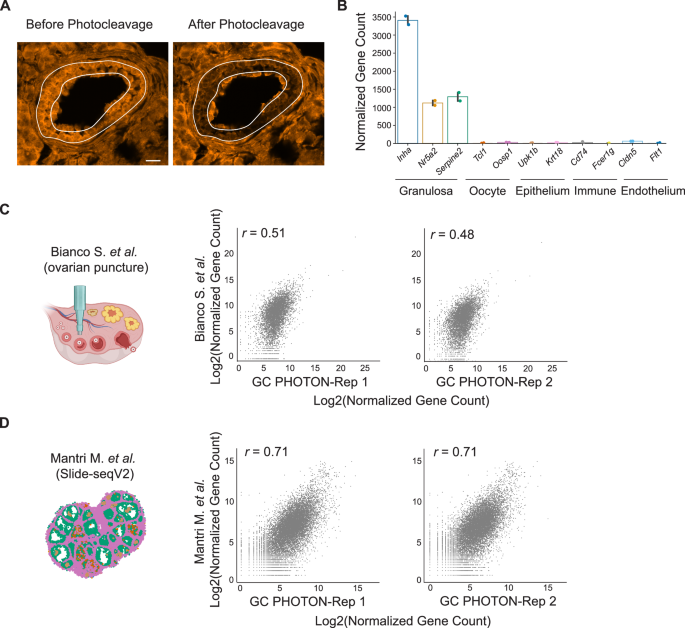
A Morphologically guided targeting of GCs in the adult mouse ovarian tissue slices. A secondary follicle was visualized by the fluorescence of the photocaged cDNA molecules. Scale bar, 15 µm. B Expression levels of ovarian cell-type marker genes revealed by PHOTON. n = 2 independent replicates. Error bars represent a 95% confidence interval. C Comparison between the mouse GC transcriptome generated by the follicle isolation method and that generated by PHOTON. The schematic was created using BioRender. D Comparison between the mouse GC transcriptome generated by Slide-seqV2 and that generated by PHOTON.
To further benchmark the GC transcriptome data generated using PHOTON, we compared them to a publicly available GC RNA-seq dataset. This public dataset was generated by mechanically dissecting out individual follicles from mouse ovarian tissues using punctures and then isolating GCs from follicles19. We found that PHOTON captured significantly more genes (>2-fold) than what was reported in the public RNA-seq dataset (Supplementary Fig. 2C), and that both PHOTON replicates only moderately correlated with the public RNA-seq dataset in terms of the expression levels for the shared genes (Fig. 2C). We reasoned that this was because the mechanical method of isolating GCs could not fully tease out other ovarian cell types and therefore the reference library may contain contaminants. To test this hypothesis, we extracted the GC transcriptome from another publicly available dataset in which mouse ovarian tissue sections were subject to unbiased spatial transcriptome profiling at a near single-cell resolution using Slide-seqV220. This approach does not require GC isolation. PHOTON captured a similar number of genes with Slide-seqV2 (Supplementary Fig. 2C). And indeed, a much higher correlation coefficient in gene expression levels was observed between the PHOTON replicates and the Slide-seqV2 data (Fig. 2D).
Together, these data suggest that PHOTON can accurately capture the transcriptome information of target cell types within a tissue in a spatially resolved manner.
PHOTON assays transcriptome in subcellular compartments
Following the validation of PHOTON at the tissue level, we next sought to validate its capability to capture RNA information at the subcellular level.
We first turned to the nucleolus – a well-characterized nuclear compartment with an essential role in ribosome biogenesis. We developed a computational pipeline to automatically identify and photocleave cDNA molecules in the nucleoli of fixed HeLa cells (Fig. 3A). The nucleolus PHOTON data was highly reproducible as demonstrated by the high correlation between the two replicates (Supplementary Fig. 3A). In parallel, we also used PHOTON to generate paired whole cell transcriptome data. This allowed us to identify RNA species that were specifically enriched in the nucleolus. The nucleolus is known to be rich in noncoding RNAs, mostly the rRNAs and small nucleolar RNAs (snoRNAs). Indeed, the majority of top-enriched RNAs identified by PHOTON were snoRNAs (because DASH, an rRNA depletion protocol, was included in the PHOTON workflow, rRNA was barely detected in the PHOTON datasets) (Fig. 3B). Of interest, PHOTON also identified long noncoding RNA RMRP to be associated with the nucleolus (Fig. 3B), consistent with a previous finding21.
Fig. 3: PHOTON captures transcriptome information within subcellular compartments.
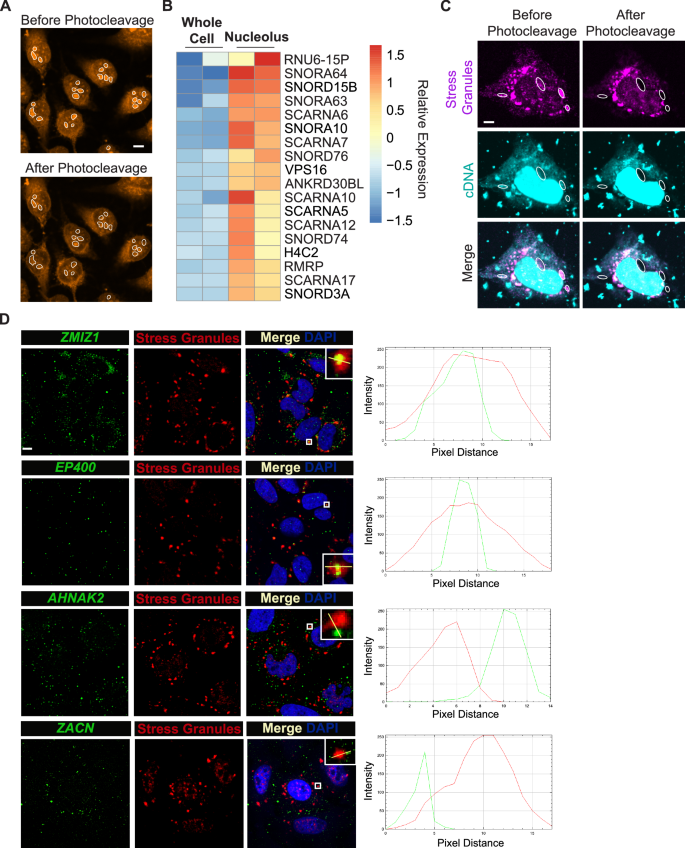
A Representative images of photocleaving cDNA molecules within nucleoli (white outlines). Scale bar, 2 µm. n = 2 independent experiments. B Heatmap showing the top-enriched RNA species in the nucleolus identified using the PHOTON data. C Representative images of photocleaving cDNA molecules (cyan) in sodium arsenite-induced SGs (magenta). SGs with white dashed outlines were targeted for photocleavage. Scale bar, 1 µm. n = 3 independent experiments. D HCR-FISH images showing the spatial distribution of ZMIZ1, EP400, AHNAK2, and ZACN mRNAs (green) in relation to sodium arsenite-induced SGs (red) in HeLa cells. Line graphs on the right show the intensity profiles of both the mRNA signal (green line) and the SG signal (red line) along the yellow line in the inserts. Scale bar, 2 µm. n = 1 experiment.
To further showcase the versatility of PHOTON in characterizing subcellular compartments, we next focused on mitochondria. Unlike the nucleoli, mitochondria typically form a dynamic, interconnected network that consists of tubular structures which can vary in shape, posing challenges to our on-the-fly image segmentation pipeline. Using MitoTracker to visualize mitochondria, we showed that the PHOTON pipeline could identify cDNA molecules within mitochondria (Supplementary Fig. 3B). By pairing the mitochondrial PHOTON data with the whole cell PHOTON data, we found that many mitochondrial genes were among the top transcripts that were differentially enriched in the mitochondria (Log2 fold change > 1; adjusted p-value < 0.05) (Supplementary Fig. 3C).
Finally, we applied PHOTON to characterize SGs, a membrane-less compartment. SGs are cytoplasmic mRNA-protein assemblies that are important in the cellular stress response and may contribute to degenerative diseases22. We applied PHOTON to capture the RNA content of SGs in HeLa cells induced by sodium arsenite treatment (Fig. 3C). The SG PHOTON data was highly reproducible as demonstrated by the high correlation between three replicates (Supplementary Fig. 3D). By pairing the SG PHOTON data with the whole cell PHOTON data, we identified transcripts that were differentially enriched and depleted in the SGs ( | Log2 fold change | > 1; adjusted p-value < 0.05). When comparing these data with a publicly available SG dataset generated by the conventional purification method10, we found a significant overlap between the SG-enriched (p < 0.05, hypergeometric test)/SG-depleted (p < 0.0001, hypergeometric test) transcripts from the PHOTON data and those from the public data (Supplementary Fig. 3E and Supplementary Data 1).
We next performed hybridization chain reaction-based fluorescence in situ hybridization (HCR-FISH) to verify the subcellular localization of some of the identified transcripts. For example, ZMIZ1 and EP400 mRNA were found to be enriched in SGs in both the PHOTON data and the public dataset. This observation was confirmed by HCR-FISH imaging of the ZMIZ1 and EP400 transcripts, which showed a significant overlap between the mRNA signals and SG signals (Fig. 3D). Of interest, there were also discrepancies between the PHOTON data and the public dataset. For instance, both AHNAK2 and ZACN mRNAs were reported to be enriched in SGs in the public dataset. However, our PHOTON data indicated no enrichment of these two mRNA in the SGs. Indeed, HCR-FISH showed that neither AHNAK2 nor ZACN mRNA signals significantly overlapped with the SG signals (Fig. 3D). This discrepancy between the PHOTON data and the public dataset may be due to the low specificity of the conventional SG purification method, as contaminations might have occurred during the SG isolation procedure.
Besides sodium arsenite-induced SGs, we also showed that PHOTON could assay RNA content of heat shock-induced SGs in HeLa cells (Supplementary Fig. 3F, G). We found that although a significant number of RNA species were enriched in both heat shock-induced and sodium arsenite-induced SGs (p < 0.001, hypergeometric test), these two types of SGs also contained distinct RNA species (Supplementary Fig. 3H). This observation suggests that the RNA composition of SGs differs according to the stressor, consistent with previous reports10,16.
Together, these results suggest that PHOTON can accurately assay the RNA content of subcellular compartments.
PHOTON provides insights into the mechanism of mRNA recruitment into SGs
Finally, we leveraged PHOTON to investigate the regulatory mechanisms governing RNA subcellular distributions using the SG as a model.
Given that selective mRNA species can be recruited into the SGs for translation suppression6,7, we first examined if the translation efficiency of a given mRNA is a determinant for its subcellular localization during stress. To this end, we cross-referenced both the sodium arsenite-induced SG PHOTON data and heat shock-induced SG PHOTON data with a public dataset looking at the translation efficiency of mRNAs23. We found that under both the sodium arsenite-induced and heat shock-induced cellular stress, transcripts that were depleted from SGs tend to have higher translation efficiency than those enriched in SGs (Mann-Whitney U test, p < 0.001) (Supplementary Fig. 4A). This finding demonstrates that the translation status of the mRNA may influence its localization to SGs, corroborating a previous notion10.
Previous studies have also demonstrated that during cellular stress, mRNAs with longer transcript length were preferentially enriched in SGs than shorter ones10,11. Analysis of our sodium arsenite-induced SG PHOTON data confirmed this observation (Fig. 4A), which further validated the ability of PHOTON to accurately capture RNA content in subcellular compartments. Despite this length bias, mRNAs of the same length can show different recruitment into SGs, suggesting the existence of sequence-specific factors that affect mRNA recruitment into SGs. One of such length-independent factors have been proposed to be the N6-methyladenosine (m6A) modifications on mRNAs as the binding of YTHDF proteins to m6A may facilitate the partitioning of the bond mRNAs into SGs24,25 (Fig. 4B). However, disentangling the relative contribution of m6A from that of the transcript length in mediating mRNA enrichment in SGs is challenging as m6A often occurs within long internal exons which are often present in long transcripts26. Furthermore, a recent study suggests that m6A modifications have negligible effects on mRNA partitioning into SGs27.
Fig. 4: PHOTON reveals the functional role of m6A in mRNA recruitment into SGs.
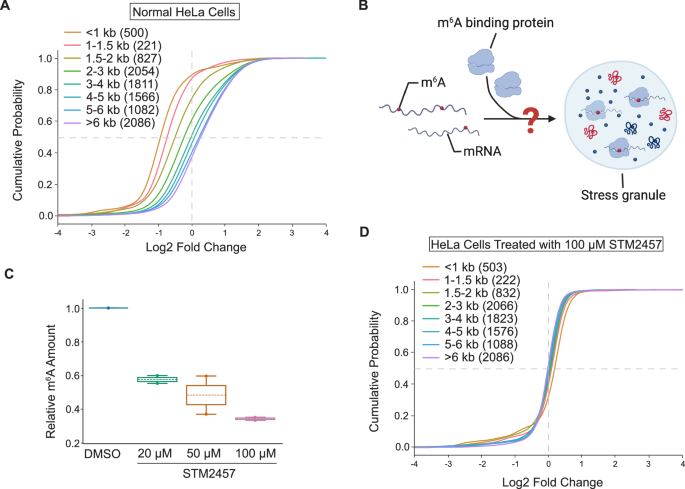
A Cumulative distribution plot of transcript abundance in the sodium arsenite-induced SGs of normal HeLa cells, binned based on the transcript length. Numbers in the parentheses indicate the number of transcripts in each bin. Source data are provided as a Source Data file. B m6A modifications may facilitate the partitioning of mRNAs into SGs through m6A-binding proteins. The schematic was created using BioRender. C Dose-dependent depletion of mRNA m6A modifications using METTL3 inhibitor STM2457. n = 3 independent replicates. The box represents the range between the first and third quartiles of the data. The line within the box indicates the mean. The whiskers extend to the furthest data points. Source data are provided as a Source Data file. D Cumulative distribution plot of transcript abundance in sodium arsenite-induced SGs of STM2457 (100 μM)-treated HeLa cells, binned based on the transcript length. Numbers in the parentheses indicate the number of transcripts in each bin. Source data are provided as a Source Data file.
We therefore set out to use PHOTON to clarify the role of m6A modifications in the spatial distribution of mRNAs in relation to SGs. To this end, we first used a drug-inducible Mettl3-knockout mouse embryonic fibroblast (MEF) cell line (Mettl3KO)28. 4-hydroxytamoxifen (4-OHT) treatment of this cell line for more than 5 days resulted in a loss of Mettl3 protein and subsequently a reduction of m6A on mRNAs (Supplementary Fig. 4B). We captured the RNA content of sodium arsenite-induced SGs in both wild type (WT) and Mettl3KO MEF cells using PHOTON while also capturing the corresponding total cellular RNA in parallel as input. We then focused on four genes with known quantities of m6A sites on their mRNAs. We quantified their fold changes in SG enrichment in Mettl3KO vs. WT cells using qPCR (n = 3 replicates per gene). We found that there was a negative effect of m6A reduction on the enrichment of mRNA transcripts in SGs. This negative effect was increasingly pronounced in transcripts with more m6A modifications (Supplementary Fig. 4C).
Next, we conducted a transcriptome-wide analysis to provide a comprehensive measurement of the role of m6A modifications in mRNA recruitment to SGs. To this end, we treated HeLa cells with a potent METTL3 inhibitor, STM2457, to reduce the m6A level on mRNAs (Fig. 4C) and induced SG formation using sodium arsenite. To distinguish the contribution of mRNA length and m6A in recruiting mRNA to SGs, mRNAs were grouped into bins based on the transcript length, and their fold enrichment in SGs was quantified using PHOTON. We found that, unlike the normal control HeLa cells shown in Fig. 4A, the length-dependent mRNA enrichment in SG was lost in HeLa cells treated with STM2457 at 100 μM for 6 h (Fig. 4D) even though PHOTON captured a comparable number of transcripts in each transcript length bin between the control and the treatment group (n = 3 experiments per group).
Together, these results suggest that the correlation between the transcript length and the SG enrichment is mediated, at least in part, by m6A modifications.
Discussion
PHOTON offers a solution to extract subcellular transcriptomic information by assimilating both imaging and sequencing technologies. We demonstrated that PHOTON can be flexibly applied across ROIs that spanned order-of-magnitude size scales, from specific regions of the mouse ovarian tissue to various subcellular compartments. In-line image segmentation enabled ROI generation based on an extensive range of spatial features and automated the targeted photocleavage process over large numbers of cells or features. At the tissue scale, PHOTON accurately captured the transcriptome of GCs within their native tissue microenvironment. At the subcellular scale, we used PHOTON to enable selective sequencing of the RNA content in the nucleoli, the mitochondria, and the SGs and demonstrate the role of m6A modifications in the recruitment of mRNA into SGs. Taken together, these results show that PHOTON has the potential to uncover connections between spatial and transcriptomic information at diverse length scales.
At the tissue level, we anticipate that PHOTON will be a useful alternative to existing spatial transcriptomics technology for fast, sensitive, and robust spatial annotation of cell types and states. Compared with PHOTON, existing spatial transcriptomics methods can be inaccessible due to the high cost. For example, array-based spatial barcoding methods powerfully profile large numbers of cells in tissue sections, but require the use of specialized microfluidics or custom arrays29,30. Furthermore, because library generation is not targeted to a cell population of interest, sequencing costs can be high (especially for human samples), and deep sequencing is required to adequately profile uncommon cell types. In contrast, PHOTON reduces sequencing costs by targeting library generation to the cellular population of interest, which decreases the number of sequencing reads needed to adequately profile the sample.
At the subcellular level, PHOTON adds to the arsenal of RNA localization methods while offering unique advantages. First, PHOTON can be used to analyze “unpurifiable” structures such as the membrane-less biomolecular condensates that are challenging to access via conventional purification-based approaches. Second, PHOTON provides sequence information for both coding and non-coding RNA transcripts. If combined with long-read sequencing platforms, PHOTON can be readily adapted to allow transcript isoforms with distinct localization to be distinguished. Third, no genetic manipulation or antibody-based pulled down is needed in the PHOTON workflow, making it easy to scale while maintain the high specificity. Finally, the high spatial resolution of the laser light employed in PHOTON allows the selective sequencing of ROIs with a spatial resolution down to the optical diffraction limit (200–300 nm). This high spatial resolution is on par with the recent nanoscale array-based spatial transcriptomics technologies such as Seq-Scope (∼ 0.5–0.8 μm)31 and Stereo-seq (220 nm spot size with a center-to-center distance of 500 or 715 nm)32.
Since many subcellular compartments directly contribute to the regulation of RNAs, PHOTON offers opportunities for mechanistic discoveries of this process. For instance, SGs have been described as a triage for mRNAs during cellular stress, where they either store translationally silent mRNA, transfer mRNA transcripts to processing bodies where they will be degraded, or transfer mRNA back into polysomes for translation33. Thus, understanding which mRNAs are preferentially recruited to SGs during cellular stress and the underlying recruitment mechanisms would inform us on how cells cope with stress under physiological and pathological conditions. Using PHOTON, we confirmed a previous observation that long mRNAs tend to localize to SGs. Furthermore, we showed that this length-dependent enrichment of mRNAs in SGs was mediated, at least partially, by m6A as long mRNAs failed to show enrichment in SGs in cells lacking m6A. This observation is consistent with a recent study28. And it is likely that YTHDF proteins bind to m6A to drive the partition of long mRNAs into SGs.
PHOTON leverages the laser setup used for the fluorescence recovery after photobleaching (FRAP) for photocleaving cDNA molecules within an ROI. This FRAP module can be readily found in a microscopy core facility at many institutes, which significantly lowers the barrier for accessibility. Depending on the samples of interest, different laser settings may be tested. Our study showed that a low laser power and a short dwell time could avoid the unspecific photocleaving of cDNA molecules outside of an ROI but at a cost of a reduced yield (Supplementary Fig. 1). However, given that a 10-fold increase in the laser power only enhanced the yield by approximately 5-8% and that the number of genes detected under varying laser powers were comparable (Supplementary Fig. 1E, F), we argue that our emphasis on specificity over yield is justified, especially for subcellular ROIs with small sizes (<1 µm in diameter). For tissue-level spatial transcriptomics, however, a higher laser power may be used as the margin for error in tissue-level ROIs is much greater than in subcellular ones. For the PHOTON experiment on ovarian tissue shown in Fig. 2, for example, we used a laser power of 15 mW. In general, we do not recommend increasing laser dwell time. This is because, in practice, a longer dwell time means a longer total experimental time. As photocleavage of thousands of subcellular compartments across numerous fields of view in multiple replicates is often needed for a single PHOTON experiment, keeping the total experimental time within a reasonable range (< a few hours) becomes important for the purpose of experimental efficiency and for preventing RNA molecules in the cells from degradation.
Our current PHOTON pipeline builds upon the image segmentation capability of the built-in microscope software where an interactive interface is provided to allow users to set a series of parameters (e.g., size, intensity threshold, and circularity) and to apply various functions (e.g., erosion, hole-filling, and local maxima identification) to identify ROIs. With software upgrades bringing in artificial intelligence-based image segmentation capabilities to the microscope system, we expect that the types of biological structures to which PHOTON is applicable will continue to expand.
While PHOTON offers several advantages over existing technologies to capture subcellular transcriptomic information, there are opportunities for further optimization. One limitation of the current PHOTON protocol is that only a single set of spatial regions can be selected within each specimen, and the data are inherently aggregated over these ROIs. Although this drawback can partially be mitigated by deconvolution algorithms, future versions of PHOTON may enable spatial barcoding of multiple classes of (and potentially individual) spatial regions. Potential approaches for multiplexed target selection include sequential rounds of photocleavage at different targets with in situ ligation of target-specific, barcoded PCR handles taking place between rounds. Another limitation of PHOTON is that during photocleavage, the laser passes through the entire thickness of the specimen and can potentially uncage cDNA molecules above and below the focal plane outside of the targeted subcellular compartments. Currently, we navigate this effect by sectioning tissues to approximately single-cell thickness and optimizing optical conditions. Both the axial and lateral resolution of PHOTON could be further improved by targeting the RNA molecules with two-photon absorption, enabling fully volumetric photocleavage.
In summary, PHOTON is broadly applicable to spatial transcriptomic analyses of many organisms and cell types. Future use of PHOTON in conjunction with other methods with a similar design principle, such as PSS17 may enable multi-modal profiling (e.g., a combination of the transcriptome, genome, and epigenome) of subcellular compartments to shed light on the mechanisms of gene regulation in a spatially resolved manner.
Methods
All research in this work complied with the regulations at UT Southwestern Medical Center.
Cell culture
HeLa cells were obtained from ATCC (CRM-CCL-2). Cells were maintained in DMEM, high glucose, pyruvate (Thermo Fisher Scientific 11995073), 10% heat inactivated fetal bovine serum (Thermo Fisher Scientific 16140-071), and 1% Pen-Strep (Gibco, 15140-122) at 37 °C/5% CO2. The day before the PHOTON experiment, cells were washed with 1X dPBS, dissociated with 0.05% Trypsin-EDTA (Thermo Fisher Scientific 25300054), and collected into a new tube. Cell density was measured with the DeNovix CellDrop cell counter. Cells were plated in a Cellvis 96-well glass bottom plate (Cellvis P96-1.5H-N) pre-treated with Matrigel Matrix (Corning 354234) diluted in DMEM at a 1:50 dilution.
To induce SG formation by sodium arsenite, cells were incubated in DMEM containing 0.2 mM sodium arsenite for 50 min at 37 °C/5% CO2. To induce SG formation by heat shock, cells were incubated at 42 °C for 90 min in a 5% CO2 incubator and then fixed with 0.4% PFA in pre-warmed PBS for 10 min at room temperature. Mettl3 conditional KO MEF Cells were a gift from Dr. Samie Jaffrey at Weill Medical College of Cornell University. To achieve Mettl3 KO, cells were treated with 500 nM 4-OHT for at least 5 days. Mettl3 KO was confirmed by Western Blot using an anti-Mettl3 antibody (Proteintech 15073-1-AP) at a dilution of 1:2000.
Tissue preparation
Animal-related experiments were performed with prior approval of the UT Southwestern Medical Center on Use and Care of Animals, in accordance with the guidelines established by the National Research Council Guide for the Care and Use of Laboratory Animals. Mice were housed in the UT Southwestern Medical Center animal facility, in an environment controlled for light (12 h on/off) and temperature (21–23 °C) with ad libitum access to water and food.
Two 8-week-old female C57BL/6 mice (The Jackson Laboratory) were intraperitoneally injected with 5 IU pregnant mare serum gonadotropin (PMSG, Lee Biosolutions Inc 493102.5) and after 48 hours were injected with 5 IU human chorionic gonadotropin (hCG, MilliporeSigma CG10). After euthanasia, ovaries from stimulated mice were dissected and washed with 1X PBS for 3 times. Ovaries were then immersed in 4% PFA for two hours at room temperature. After washing with 1X PBS for 3 times, ovaries were transferred into 10% sucrose solution and rotated overnight in the 4 °C cold room, followed by dehydration with 20% and 30% sucrose solution sequentially. Tissues were embedded in optimal cutting compound (OCT) media after kimwiping excess liquid, frozen on dry ice, and then stored at − 80 °C for later experiments. The ovarian tissue blocks were cut into sections of 10 μm thickness using Leica CM1950 Cryostat, and the sections were transferred into glass-bottom dishes (MatTek P35G-1.5-14-C) treated with 0.1% Poly-L-Lysine (Sigma-Aldrich P8920-100ML).
PHOTON workflow
All oligonucleotides for PHOTON were synthesized at IDT. Sequences were reported in Supplementary Table 1.
Samples were fixed in a glass-bottom dish or plate with 0.4% PFA for 10 min at room temperature, followed by 3 times of 1X PBS wash. Permeabilization was performed using 0.5% Triton X-100 (Sigma Aldrich, T9284-100ML) supplemented with 0.4 U/μL RNase inhibitor (NEB, M0314L) for 15 min at room temperature, followed by 3 times of 1X PBS wash. Samples can then undergo sample-specific immunofluorescent staining to label the ROIs (see Immunostaining below).
In situ RT was performed in the RT mix (0.5 μM NPOM-RT, 0.5 μM NPOM-RT-Random, 10 U/μL Maxima Reverse Transcriptase (Thermo Fisher Scientific, EP0741), 0.4 U/μL RNase inhibitor, 1X RT Buffer, and 1 mM dNTPs (Thermo Fisher Scientific, R0194)) on a shaker for 30 min at room temperature followed by incubation overnight at 37 °C. Samples were protected from light during the RT process.
ROIs were visualized on an inverted Nikon CSU-W1 Yokogawa spinning disk confocal microscope using either a 0.95 NA CFI Apochromat LWD Lambda S 20x water immersion objective lens (for tissue) or a 1.15 NA CFI Apo LWD Lambda S 40x water immersion objective lens (for cells). For GCs in the ovarian tissue, RO1s were selected manually. For nucleoli and SGs, the JOBS and GA3 modules in the NIS-Elements AR software were used to enable real-time segmentation of ROIs using custom scripts. Selected ROIs were scanned for targeted photocleavage using an XY galvo scanning module via the Nikon Ti2-LAPP system (Nikon) coupled with a 50 mW 405 nm laser line. For GCs in the ovarian follicles, photocleavage was performed with 37.5 mW laser power and a dwell time of 300 microseconds. For nucleoli and SGs, 2.5 mW laser power and a dwell time of 100 microseconds were used.
Following photocleavage, samples were digested by incubation in reverse-crosslinking buffer (50 mM Tris pH 8.0, 50 mM NaCl, and 0.2% SDS) with 1:50 proteinase K (NEB P8107S) for 30 min at 55 °C in the dark. Nucleic acids were then extracted using the NucleoSpin Gel and PCR Clean-up XS Kit (Takara Bio 740611.250).
Ligation adapters were generated by annealing 10 μM Splint Oligos with 10 μM P7 Handles in STE Buffer (10 mM Tris pH 8.0, 50 mM NaCl, and 1 mM EDTA) at a total reaction volume of 50 μL. The annealing was performed by heating the oligo mix at 95 °C for two minutes, followed by a cool-down to 20 °C at a rate of 1 °C per minute.
Ligation was performed by mixing 10 μL of the annealed ligation adapters with the purified nucleic acids. The ligation reaction also included 20 U of RNase inhibitor and 1X T4 DNA Ligase Reaction Buffer, bringing the total reaction volume to 47.5 μL. The ligation mix was then incubated for 30 min at room temperature on a shaker in the dark. After that, 2.5 μL of T4 DNA Ligase (NEB M0202L) was added to the mix, bringing the total reaction volume to 50 μL. The ligation mix was then incubated for 30 min at room temperature on a shaker in the dark.
To pull down cDNA molecules, 10 μL/sample MyOne Streptavidin C1 Dynabeads (Thermo Fisher Scientific 65001) were placed on a magnetic stand and washed once with 1X B&W-T Buffer (5 mM Tris pH 8.0, 1 M NaCl, 0.5 mM EDTA, and 0.05% Tween 20) and washed twice with 1X B&W-T Buffer supplemented with 0.4 U/μL RNase Inhibitor. After the washes, each 10 μL of the beads were resuspended in 100 μL of 2X B&T Buffer (10 mM Tris pH 8.0, 2 M NaCl, 1 mM EDTA, and 0.8 U/μL RNase inhibitor).
Following ligation, 50 μL of nuclease-free water was added to the ligation mix, bringing the total volume up to 100 μL. Then, 100 μL of the MyOne Streptavidin C1 Dynabeads resuspended in 2X B&T Buffer was added to each sample. The mixture was rotated on an end-to-end rotator for 60 min at room temperature in the dark. After incubation, samples were placed on a magnetic stand. The supernatant was removed, and the beads were washed three times with 1X B&W-T buffer supplemented with 0.4 U/μL RNase inhibitor and washed once with STE buffer supplemented with 0.4 U/μL RNase inhibitor.
After the washes, the MyOne Streptavidin C1 Dynabeads were resuspended in 50 μL of template switch mix for a second round of RT. The template switch mix consisted of 1X RT Buffer, 1 mM dNTPs, 10 U/μL Maxima Reverse Transcriptase, and 2.5 μM template switch oligomer (TSO). Resuspended beads were rotated on an end-to-end rotator for 30 min at room temperature in the dark, and then were shaken at 300 rpm for 90 min at 42 °C. The beads were resuspended by pipetting every 30 min during the incubation period. After incubation, beads were washed with STE Buffer for 3 times at room temperature.
After the STE buffer wash, beads were resuspended in 55 μL PCR Mix (1X Q5 Hot Start High-Fidelity 2X Master Mix (NEB M0494L), 0.45 μM PCR_TSO, and 0.45 μM PCR_P7). The PCR reaction was run on a BioRad T100 Thermal Cycler, which was programmed with an initial denaturation step of 98 °C for 30 s followed by five cycles of 98 °C at 10 s, 65 °C for 30 s, and 72 °C for 3 min. The final extension was 72 °C for 5 min.
To determine the number of additional cycles needed for the PCR reaction, after the initial 5 cycles of PCR amplification, samples were placed on a magnetic stand and 2.5 μL of supernatant from each sample was combined with 7.5 μL qPCR master mix (1X SYBR Green (Thermo Fisher Scientific S7563), 0.45 μM PCR_TSO, 0.45 μM PCR_P7, and 1X Q5 Hot Start High-Fidelity 2X Master Mix). qPCR was run on a LightCycler 480 II System (Roche Diagnostics 05015243001) in a 384-well plate with the following program: 98 °C for 30 s; 35 cycles of 98 °C at 10 s, 65 °C at 30 s, and 72 °C at 60 s. 72 °C for 5 min. The number of qPCR cycles needed to reach 1/3 of the saturated signal was used as the additional PCR cycles needed for each sample.
PCR products from the initial 5-cycle amplification were put back into the thermocycler for additional amplification using the number of cycles determined by the qPCR experiment. After the second round of PCR, samples were placed on a magnetic stand. Supernatant was collected and cleaned with 0.8X AMPure XP Beads (Beckman Colter A63880). The concentrations of purified PCR products were determined using the Qubit dsDNA HS Assay (Thermo Fisher Scientific Q32854).
Purified PCR products were subject to sequencing library preparation using the Nextera XT Library Prep Kit (Illumina FC-131-1024) following the manufacturer’s instructions. The resulting libraries were cleaned with 0.7X SPRI Select DNA Beads (Beckman Coulter B23317). The concentration and size distribution of the sequencing libraries were quantified using the Agilent D1000 High Sensitivity Screentape Kit (Agilent 5067-5584) on an Agilent TapeStation 2200 system.
DASH18 was used to eliminate the rRNA and mitochondrial DNA in the sequencing libraries of mouse ovarian granulosa cells, Hela cell nucleoli, and SGs from MEF and HeLa cell lines. Briefly, crRNA oligos were ordered from IDT and pooled to a stock concentration of 100 μM in IDTE Buffer (10 mM Tris and 0.1 mM EDTA). 100 μM DASH tracrRNA was then mixed in equimolar ratio with the pooled crRNA to a final duplex concentration of 10 μM. The duplex was then heated at 95 °C for 5 min and allowed to cool to room temperature. The crRNA:tracrRNA complex was then aliquoted and stored at − 80 °C. To create the ribonucleoprotein (RNP) complex, the 10 μM crRNA:tracrRNA duplexes was combined with EnGen Spy Cas9 NLS (NEB M0646M) in equimolar amounts in 1X PBS to a final concentration of 1 μM. The RNP complex solution was then incubated at room temperature for 5–10 min for optimal formation of the RNP complex. For mitochondria PHOTON sequencing libraries, to retain the mitochondrial RNA species, the SEQuoia RiboDepletion kit (17006487, Bio-Rad) was used to eliminate fragments derived from both ribosomal RNA (rRNAs) and mitochondrial ribosomal RNA (mt rRNA).
To perform in vitro digestion, each sequencing library was diluted to 10 nM in 20 μL nuclease-free water and mixed with 10 μL of 10X Cas9 Nuclease Reaction Buffer and 70 μL of the Cas9 RNP complex. Reactions were incubated at 37 °C for 60 min. After incubation, 1 μL of proteinase K was added to each reaction, and the mixture was further incubated at 56 °C for 10 min to release the DNA substrate from the Cas9 endonuclease.
The post-DASH libraries were cleaned up using 0.8X SPRI Select beads. The concentration and size distribution of the sequencing libraries were quantified using the Agilent D1000 High Sensitivity Screentape Kit (Agilent 5067-5584) on an Agilent TapeStation 2200 system. Libraries were sequenced on either an Illumina NextSeq 2000 or a NovaSeq X Plus.
Immunostaining
To visualize SGs during the PHOTON workflow, cells were incubated on a shaker for one hour at room temperature with the anti-eIF3eta antibody (Santa Cruz sc-137214) at a 1:200 dilution in 1X PBS supplemented with 0.4 U/μL RNase inhibitor. Cells were then washed three times for 5 min each with 1X PBS and incubated on a shaker in the dark for one hour at room temperature with of anti-mouse Alexa 647 secondary antibody (1:200 dilution, Thermo Fisher Scientific A-31571) supplemented with 0.4 U/μL RNase inhibitor. Cells were washed three times for five minutes each in 1X PBS, and post-fixed with 0.4% PFA in the dark for ten minutes at room temperature. After fixation, samples were washed three times for five minutes each with 1X PBS.
GCs in the ovarian follicles can be directly visualized through the fluorescent signals on the RT primers. Nuclei were visualized by staining the tissue with DRAQ5 dye (abcam ab108410) at a 1:300 dilution in 1X PBS for 30–60 min at room temperature. Nucleoli were visualized using 2.5 μM nucleolus bright green dye (Dojindo Laboratories c511).
Mitochondrion staining
The HeLa cell mitochondria were labeled by MitoTracker Deep Red FM dye (Invitrogen, M22426). Live cells were incubated with the MitoTracker probe at 100 nM in growth medium at 37 °C for 1 h. MitoTracker dyes was retained by 2% formaldehyde fixation for 15 min in pre-warmed growth medium. Cells were triple washed in PBS with gentle shaking for 5 min, then permeabilized with 0.5% Triton X-100 in PBS at room temperature for 15 min.
SNR quantification
Approximately 5000 HeLa cells per well were used in this experiment. A fixed percentage of cells were photocleaved for each well, and the samples were subject to the PHOTON workflow. The amount of the resulting library from each well was quantified and compared with that from the unblocked well (i.e., no photocleavage) using qPCR. For photocleavage, two different laser intensities were assessed. Low laser intensity was set at 2.5 mW with 100 microsecond dwell time. High laser intensity was set at 25 mW with 100 microsecond dwell time.
HCR-FISH
To validate the HeLa cell SG PHOTON dataset, we used HCR RNA-FISH targeting AHNAK, MN1, and ZACN. Briefly, sodium arsenite-treated HeLa cells were fixed with 4% PFA for ten minutes at room temperature. After fixation, cells were washed with 1X PBS twice for five minutes each at room temperature on a shaker. Cells were then permeabilized with ice-cold 70% Ethanol overnight at − 20 °C. After permeabilization, cells were washed twice for five minutes each with 1X PBS and incubated in antibody buffer (Molecular Instruments) for 60 min at room temperature on a shaker. Cells were then incubated overnight at 4 °C with the anti-eIF3eta antibody diluted at 1:100 in Antibody Buffer.
After primary antibody incubation, cells were washed three times for five minutes each with 1X PBS and incubated for 60 min at room temperature with the anti-mouse secondary antibody (Molecular Instruments) diluted at 1:100 in antibody buffer. After incubation, cells were post-fixed with 4% PFA for ten minutes at room temperature and washed twice for five minutes each with 1X PBS and then washed twice for five minutes each with 5X SSC buffer (Thermo Fisher Scientific AM9770). Cells were then pre-conditioned in pre-warmed hybridization buffer (Molecular Instruments) for 30 min at 37 °C.
Probes targeting each mRNA were ordered from Molecular Instruments and were diluted to 16 nM in the probe hybridization buffer. These probes were added to the cells for overnight incubation at 37 °C. After incubation, cells were washed four times for five minutes each with probe wash buffer (Molecular Instruments) at 37 °C and were then washed 5 × 5 min with SSCT buffer (5X SSC and 0.1% Tween 20) at room temperature. After washing, cells were pre-conditioned in amplification buffer (Molecular Instruments) for 30 min at room temperature.
To amplify the signal, fluorescent hairpins matching each probe set and the antibody were first heated at 95 °C for 90 s and cooled to room temperature in the dark for 30 min. The harpins were then added to the amplification buffer to achieve a final concentration of 60 nM. Cells were incubated with the hairpin solution overnight in the dark at room temperature. After incubation, excess hairpins were removed by washing 5 × 5 min with SSCT at room temperature. Cells were imaged on an inverted Nikon CSU-W1 Yokogawa spinning disk confocal microscope with a 1.15 NA CFI Apo LWD Lambda S 40x water immersion objective lens.
METTL3 inhibitor treatment and m6A quantification in HeLa Cells
The METTL3 inhibitor STM2457 (Selleck Chemicals S9870) was used to induce acute depletion of mRNA m6A methylation. Cells were treated with 20 µM, 50 µM, and 100 µM STM2457, respectively, while the control cells received the same amount of DMSO. After 6 h of treatment, cells were lysed in TRI Reagent. Total RNA was then isolated using the Direct-zol RNA MiniPrep kit (Zymo Research R2053). Subsequently, mRNA was isolated from the total RNA using Dynabeads Oligo(dT)25 (Thermo Fisher Scientific #61002). The m6A level on mRNAs was then colorimetrically quantified using the m6A RNA Methylation Quantification kit (abcam ab185912), with the absorbance signal measured at 450 nm by a CLARIOstar Plus plate reader (BMG Labtech).
Sequencing data analysis
Raw paired sequencing reads were trimmed to eliminate remaining adapter sequences and bases with quality scores < 25. Sequences with less than 35 bp were also removed. Trimmed data were aligned to the reference genome using HiSAT234. Features (genes, transcripts, and exons) were counted using featureCounts35. Pairwise differential expression analysis was performed using DESeq236.
Statistics and reproducibility
Statistical analyses of the data and the number of independent replicates for each experiment were detailed in the Results section. and included in the figure legends. No statistical method was used to predetermine sample size. No data were excluded from the analyses. The experiments were not randomized. And the Investigators were not blinded to allocation during experiments and outcome assessment.