


Please enter the answer below before you can view the full text.

2020
Volume: 35 Issue 2
20 Article(s)

Yu-rui LI, Chang-li BU, Zhi CAO, Xuan-he LIU, and Yan-sui LIU
Rural Vitalization Strategy (RVS) is an important measure to promote rural development in China in the new era. Village classification is an important work to promote the effective implementation of the plan for RVS at the village level. It is of great significance to achieve the phased objectives of the national RVS. The National Strategic Planning for Rural Vitalization (2018-2022) puts forward four types of villages: agglomeration and upgrading, suburban integration, characteristic protection, relocation and evacuation, but it does not specify the specific principles and methods for classification. Based on the four types of villages, this study further clarifies their sub-types, and puts forward the corresponding principles and methods for classification. A village classification model is also established, which refines the classification index system of villages from five dimensions: village characteristics, villagers' living conditions, village development and construction, urban-rural links and village functions. Based on the principles, methods and models mentioned above, 102 administrative villages in Yanchi county of Ningxia are classified. Empirical study shows that the principles and methods proposed in this study have practical guiding value for village classification. However, in view of the differences and complexity of village characteristics, some parameters and thresholds need to be set according to the actual situation.
Feb. 28, 2020Vol. 35 Issue 2 243 (2020)
Hai-bing JIANG, Wen-zhong ZHANG, and Jian-hui YU
External transport link is one of the main factors of the urban transformation and sustainable development toward the resource-exhausted cities. Taking 69 resource-exhausted cities as the object of study, this paper characterizes the urban external transport link level by daily accessibility indicator and employs the industrial substitution industry output value to reflect the economic transformation effects. In addition, the correlation analysis and geodetector and panel data model are utilized to address the relationship between accessibility and the effectiveness of urban economic transformation and to reveal the mechanism of accessibility on the economic transformation rules and characteristics of the resource-exhausted cities. The result shows that the overall accessibility level toward the 69 cities is medium and has a positive effect on the urban industrial substitution industry scale and efficiency development. The accessibility is one of the key factors affecting the alternative industries in these resource-exhausted cities. Furthermore accessibility can indirectly promote or hinder the development of resources city economy transformation by influencing the private economy, industrial park economy, fixed asset investment and high-tech industries and so on. Superior accessibility cities usually have stronger capacity for economic transformation and development. Moreover good accessibility will not only help the alternative industries to obtain necessary resources such as science and technology, intelligence, capital, labor force, market and information, but also create favorable conditions for regional industrial cooperation, industrial transfer and investment attraction to meet the internal needs of the alternative industries layout. On the contrary, the alternative industries with the lowest accessibility and far away from the economic center cities generally tend to have sluggish development, weak economic transformation and strong dependence on traditional resource-based industries. Meanwhile, the contribution of accessibility to the development pattern of economic transformation has been gradually strengthened. In view of this, the resource-exhausted cities in different regions are suitable to adopt different transformation models and differential support policies in combination with different levels of accessibility.
Feb. 28, 2020Vol. 35 Issue 2 257 (2020)
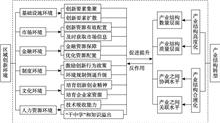
Hai-ning JIANG, Wen-zhong ZHANG, Jian-hui YU, and Jian-wei ZHANG
In order to analyze the spatial coupling of innovative milieu and industrial structure transformation of resource-based cities in Shanxi province in 2003 and 2016, the coupling coordination degree model was adopted in this paper. The results showed that the quality superiority of innovative milieu about resource-based cities in Shanxi province was changed in different degrees. Among them, the level of innovative milieu with high quality superiority plunged, while the level of innovative milieu with medium quality superiority was rising steadily. The low level innovative milieu, by contrast, did not realize a breakthrough rising at all as time goes on. The degree of industrial structure advancement was increasing, while the degree of industrial structure rationalization was high and relatively complex. The coupling degrees between the original innovative milieu and industrial structure transformation, including industrial structure advancement and industrial structure rationalization, were all high. Therefore, all of the resource-based cities in Shanxi province belonged to high degree coupling regions at this moment. What's more, the coupling degree between the original innovative milieu and industrial structure transformation in most of the cities was going down gradually as time goes on. However, the degrees of coordinated development between innovative milieu and industrial structure advancement, industrial structure rationalization were relatively low. The general pattern of the coordinated development degree in Shanxi province was "north-south moderate imbalance, the middle extreme imbalance" having not changed significantly; Relative development index in most of cities of Shanxi province showed a upward trend. The "north-south" area of Shanxi province belonged to the innovative milieu exorbitant type or simultaneous development between innovative milieu and industrial structure transformation, while the "middle" area mainly belonged to the lagging-type development of innovation milieu. Therefore, we should fully rely on the advantages of existing innovative milieu and industrial structure restructuring ability in every city, guiding the construction and development of resource-based cities according to local conditions, so as to achieve a coordinated and hand-in-hand development of innovative milieu and industrial restructuring.
Feb. 28, 2020Vol. 35 Issue 2 269 (2020)
Yuan-gang ZHANG, Xi CHEN, Run-zhe YU, Jing-jing CHENG, and Xiang-yang YU
From the perspective of traveling experience, the scenic byway is no longer the only tourist transit or tourism passage as experiencing scenic byways has become a new travel motive, which reflects the spatial mobility of tourism industry elements. Regarding "on the road" traveling experience as the major travel motivation of tourists, this paper believes that the scenic byway system performs the function of direct expression of tourists traveling experience rather than the traditional tourism highway system that transits tourist flow. Recognizing the scenic byway system as a special derived form of tourism destination, the paper analyzes the rationality of scenic byway system as a new linear experience space and expounds the theoretical analysis of this derived form of tourist destination. Their characteristics are summarized using relevant domestic and international case studies. Taking the Tongling- Huangshan section of the Beijing-Taiwan Expressway in southern Anhui as an example, this paper explores the necessity and importance of developing the scenic byway in the region, proposes the construction components of linear tourism experience space and summarizes the differences in development connotation. The introduction of the linear experience space profoundly expands the existing tourism research on the scenic byway system and provides a new direction for tourist destinations development.
Feb. 28, 2020Vol. 35 Issue 2 284 (2020)
Yue PAN, Gang-min WENG, Cong-hui LI, and Na SONG
The development of scenic spots is closely related to their location conditions, and scenic spots in advantageous locations are more likely to gain priority and rapid development. Taking the "Silk Road Tourism Belt" as an example, considering the four major location factors of resources, market, transportation and service, it is regarded as evidence, and the DS evidence theory is introduced to measure the location advantage of the scenic spot, characterizing the location from superiority to inferiority with I-V level. Finally, we compare the core area between the location and the tourism development of the scenic spot. The results show that: (1) The location advantage level is significantly different, and the overall spatial distribution law is gradually decreasing from southeast to northwest. From I to V, the center of gravity gradually shifts to the northwest. (2) There are differences in the distribution of location factors. The resource location of scenic spots in Southeast is better than that in Northwest; the difference between market locations is the most obvious, with the characteristics of "long tail" and the phenomenon of "one province alone" in Shaanxi; the inherent differences between traffic locations and the location advantage is similar; the service location is no longer the main factor restricting the location of the scenic spot, but in terms of individual provinces, the "core-edge" structure is more obvious. (3) Compared with the tourism development of scenic spots, the two have obvious spatial correlation, but there is still a certain degree of spatial dislocation.
Feb. 28, 2020Vol. 35 Issue 2 297 (2020)
Chuan-ming YANG
The national economy is a complex system composed of many different industries and interdependent industries. Scientifically identifying the correlation conduction structure of industrial carbon emissions is of great theoretical and practical significance for achieving the goal of carbon emission reduction in China. Therefore, the total carbon footprint was defined from the direct and indirect angles. Based on the energy consumption and the direct consumption coefficient of production service, the admissibility of the function improvement was created to update the input-output table and ram the data source base. Then the balanced input output industrial total carbon footprint life cycle model was designed to calculate the total carbon footprint of the industry. Using the WT index method, China's industry total carbon footprint complex networks in the new and old normal periods were constructed, and the characteristics of networks were analyzed from the point of view of the whole network, nodes status and community structure. By comparison, it was found that the structures of China's industrial total carbon footprint complex networks in the new and old normal periods were reasonable. Compared with the old normal period, the total industrial carbon footprint in the new normal period industry linked closer, the core key industries had stronger control influence, and the community structure was generally stable. At last, the paper put forward countermeasures and suggestions, which were a comprehensive consideration of the total carbon footprint of the industry, taking into account the individual and the overall characteristics, focusing on the key nodes and taking full consideration of the characteristics of the industrial community. And we hope this paper could improve the efficiency of China's industrial synergistic emission reduction in the new normal period.
Feb. 28, 2020Vol. 35 Issue 2 313 (2020)
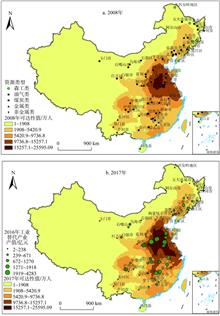
Yang SHEN, Cong-cong WANG, Chao GAO, and Lei DING
Urbanization becomes the primary source of carbon emissions and energy demand growth in China with industrialization entering the middle-later stages. With the current high-consumption and high-emission urban development model, the resulting resource consumption and carbon emissions become a major environmental issue and a sustainability problem. Based on the panel data of the bay area economic zone of Zhejiang province from 2003 to 2017, this paper analyzed the overall spatial and temporal distribution characteristics of carbon emissions of the economic zone. The main sources of carbon emissions will be studied in detail by incorporating the urbanization level, energy consumption structure, land use, economic development level, industrial structure, population agglomeration, openness, and technological progress into the STIRPAT (the Stochastic Impacts by Regression on Population, Affluence, and Technology) extended model. We further investigated the driving mechanism of carbon emissions and spatial and temporal heterogeneity of carbon emissions from the perspective of urbanization using the geographically and temporally weighted regression (GTWR). The results showed that: (1) The scale of carbon emissions has increased with time, but the growth rate has not been large with a decreasing growth rate. Carbon emissions in different regions are significantly different. The carbon emission is less intense through the years with a spatial distribution pattern of increasing from the southwest to the northeast. (2) The level of economic development and the degree of openness to the outside world are the dominant factors that affect the carbon emission level, followed by energy consumption structure, technological progress, and urbanization. (3) These influencing factors show substantial spatiotemporal heterogeneity that the direction and intensity of the fluctuations of various driving factors vary from time to time and region to region. This paper analyzed the impact of the driving factors of carbon emissions in the economic zone of Zhejiang Bay Area explicitly, providing scientific support for the implementation of regionally differentiated carbon emission reduction strategies. It is necessary to fully examine the actual development of each region to formulate a differentiated carbon emission reduction regulation strategy. In particular, these measures should be taken into consideration for reducing carbon emissions in the area: enhancing the efficiency of comprehensive utilization of resources by accelerating the construction of science and technology innovation corridors, and promoting the transformation and upgrading of traditional industries by fully introducing modern service industries and high-end manufacturing based on information technology.
Feb. 28, 2020Vol. 35 Issue 2 329 (2020)
Kang WANG, Zhi-xue LI, and Jia ZHOU
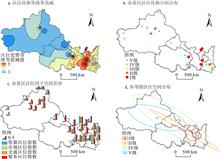
Based on the data of 36 municipal panels in the three provinces of Northeast China from 2005 to 2016, the spatial and temporal patterns of environmental regulation and carbon emission are analyzed qualitatively. And we use a mediation effects to analyze the influences of environmental regulation on carbon emissions quantitatively. The results show that: (1) The comparison of cities shows that there are obvious urban differences between different cities in the intensity of environmental regulation. The carbon emissions increased first and then reduced; (2) As for the spatial pattern, the intensity of environmental regulation shows a trend of increasing from north to south, and the differences between regions increased gradually. The high-level types of environmental regulation are centrally distributed, and most in cities. The low-level types of environmental regulation are found in the northern part of Heilongjiang Province, and the number of the low-level types is the smallest in cities. The high-level types of carbon emissions are concentrated in regions which are rich in oil and metal resources, such as Liaodong Peninsula and the cities of Daqing and Jilin. And the number of low-level cities has increased, mainly in the northeastern part of the region; (3) The strict environmental regulation in the three provinces of Northeast China not only directly restrains carbon emissions, but also indirectly restrains carbon emissions by optimizing industrial structure and reducing rough investment. Meanwhile, the competition between local governments would reduce carbon emissions of the environmental regulation.
Feb. 28, 2020Vol. 35 Issue 2 343 (2020)
Zi-hang FANG, Chun-yang HE, Zhi-feng LIU, Yuan-yuan ZHAO, and Yan-jie YANG
The Agro-Pastoral Transitional Zone in Northern China (APTZNC) is one of the major regions of the ecological protection in China due to its sensitivity to climate change. Our objective was to understand the trend of the climate change in the APTZNC. The historical climate change from 1971 to 2015 and the future climate change from 2006 to 2050 in the APTZNC were analyzed by using the historical data and the simulated data. The climate change in the APTZNC showed a warm-dry trend from 1971 to 2005, with the annual average temperature rise by 0.39 ℃/10 a and the annual average precipitation decrease by 4.60 mm/10 a. From 2006 to 2050, the regional climate change will show a warm-humid trend. The annual average temperature will increase by 0.20-0.50 ℃/10 a, and the annual precipitation will increase by 1.49-15.59 mm/10 a. We also found that the regional climate system will be unstable if the greenhouse gas emissions were not controlled. From 2006 to 2050, along with the increase of greenhouse gas emission concentration, the regional warming rate will increase from 0.25 ℃/10 a to 0.48 ℃/10 a, and the precipitation change rate will increase from 3.97 mm/10 a to 14.58 mm/10 a. Therefore, we suggested that effective measures for mitigation and adaptation to the climate change are needed to guarantee the sustainable development of the APTZNC.
Feb. 28, 2020Vol. 35 Issue 2 358 (2020)
Ya-hui WANG, Er-fu DAI, Liang MA, and Le YIN
In this study, we evaluated the water yield in the Hengduan Mountain region from 1990 to 2015 using the water yield module in the InVEST model; we further analyzed the corresponding spatial and temporal characteristics and influencing factors. The results show the following. First, water yield decreased with increasing altitude and tended to decrease from the southern to the northern areas. Second, water yield increased slightly from 1990 to 2000, decreased significantly from 2000 to 2010, and then increased slightly again from 2010-2015. Third, the average water yield varied greatly across different land use types: the water yield capacity of construction lands was the strongest, for about 550-920 mm; that of forests and grasslands were moderate, for about 438-650 mm and 412-580 mm, respectively; that of unused land and water areas were the weakest, for about 273-457 mm and 56-237 mm, respectively. Lastly, there exists a significant negative relationship between the water yield spatial pattern with elevation and grasslands proportion, while there is a positive relationship with precipitation and forests proportion. The temporal changes were attributed to the positive relationship with precipitation. Overall, this study promotes the development of mountain ES (ecosystem services) research, and the results provide scientific support for water resource management and sustainable development in the Hengduan Mountain region.
Feb. 28, 2020Vol. 35 Issue 2 371 (2020)
Zhuo-xin CHEN, Wen-long WANG, Ming-ming GUO, Tian-chao WANG, Wen-zhao GUO, Wen-xin WANG, Hong-liang KANG, Bo YANG, and Man ZHAO
Vegetation restoration has returned a large number of steep slope farmlands to forests and grasslands, and effectively controlled soil erosion in the Loess Plateau. In the loess-tableland and gully region of the Loess Plateau, loess-tableland, hill-slope and gully-slope are widely distributed. Geomorphological location and land use may lead to differences in soil properties and vegetation root systems, and thus affect soil erodibility. However, few studies have been conducted to explore the impact of vegetation restoration at different geomorphological locations on soil erodibility, and the relationships between soil erodibility and influencing factors. This study was carried out in the Nanxiaogou watershed in the loess-tableland and gully region of the Loess Plateau. The undisturbed topsoil (0-20 cm) of farmland, grassland, shrub land and woodland was sampled on loess-tableland, hill-slope and gully-slope (no farmland on gully-slope). The comprehensive soil erodibility index (CSEI) was obtained by weighted sum method. The results indicated that: (1) The significant difference in CSEI was found among different geomorphological locations. The CSEI of gully-slope was 8.1% and 77.7% higher than those of hill-slope and loess-tableland, respectively. (2) As for the loess-tableland, the CSEI of grassland, shrub land and woodland decreased by 21.1%, 29.2% and 28.8%, respectively compared with that of farmland. For the hill-slope and gully-slopes, the CSEI of woodland was lower than that of other land use types. (3) The CSEI had significantly negative correlations with clay content, sand content, soil capillary porosity, root weight density, root mean diameter, root length density and root surface area density, but significantly positive correlations with silt content and soil bulk density. Multivariate linear stepwise regression indicates that silt content, root mean diameter and soil bulk density are the most important factors influencing CSEI, among which silt content has the greatest direct influence on CSEI, while root mean diameter exerts negative influence on CSEI through direct or indirect effects. This study suggests that shrubs should be the preferred vegetation for vegetation restoration on the loess-tableland. Revegetation with arbor as dominant community may be more effective in controlling soil and water loss on hill-slope and gully-slope.
Feb. 28, 2020Vol. 35 Issue 2 387 (2020)
Sheng WANG, Tan-dong YAO, and Jian-chen PU
Based on in-situ observations in Qiyi Glacier during 2011-2016, and combined with the data from meteorological stations and remote sensing images (1975-2015), this paper analyzed the glacier terminal change, spatial and temporal variations of glacier mass balance and its sensitivity to climate change. The results showed that: the terminal of Qiyi Glacier continued to retreat 235 m from 1975 to 2015, with a rate of 5.9 m/a, and the glacier area reduced by 0.13 km2 (4.5%). During 2011-2016, the average annual mass balance of Qiyi Glacier was -476 mm w.e., the average ELA was 4941 m a.s.l., and the mass balance gradient was 2.9 mm/m. Affected by snowdrift and ice sublimation, the glacier mass balance tended to be more negative from November to March of the next year. Mass balance in April and September is dominated by precipitation, and the change with altitude showed the precipitation effect. Mass balance increased with altitude linearly from June to August, and the end of glacier melting season was delayed from early September to the end of September. The sensitivity analysis of glacier to climate change showed that, mass balance sensitivity to air temperature change was -178.7 mm w.e. ℃-1 a-1, while that to precipitation change was +2.93 mm w.e. mm-1 a-1. A 61 mm increase in precipitation was required to compensate for the net mass loss induced by an air temperature increase of 1 ℃.
Feb. 28, 2020Vol. 35 Issue 2 399 (2020)
Xiao-ji HU, Li TANG, Ya-hui LIU, and Xiao-dan DONG
As for industrial water, the effectiveness of price leverage to reduce water consumption and improve the reuse rate is significant for water saving and industrial transformation and development. Historically, for a long period, it is difficult for water prices to play a role in regulating the supply and demand of water resources. At this stage, industrial water prices still have room for growth. That is why so many existing studies deal with the estimation of water price elasticity. Estimating the price elasticity of industrial water by logarithmic production function is not considered to be the reverse effect of water consumption on price, which will lead to bias in results. This research, based on the data of 216 Chinese cities in 2016, builds simultaneous equations to solve endogenous problems and estimate the price elasticity of demand for industrial water. Results showed that average results of 3SLS in China are -3.423, which is above the estimated results of agriculture and livelihood in existing literature, scilicet 1% addition of price will lead to 3.42% decrease of water consumption. At the region level, improving industrial water price is effective to save water, especially in eastern and central China. The possible reason for the highest industrial water price elasticity is that there is a large amount of non-consumptive water used in industry expressed as reuse rate of water consumption. Moreover, the assessment of the effectiveness of the policy should be based on not only the reduction of industrial water demand when water prices rise, but also the impact of water prices on water efficiency and water reuse. If the rising water price can improve the efficiency of industrial water use and promote the reuse of industrial water, it will not have a great impact on industrial economic growth to some extent. Therefore, from the perspective of characteristics of industrial water, reuse rate will be used as an explained variable to set up an equation to estimate the effect of price on water conservation. Results showed that water price and reuse rate are positively correlated, indicating that there exists negative impact of increasing industrial water price, which will be an offset by improving reuse rate of water. What is more, it also means that raising the price of industrial water can encourage the recycling of water, and finally promote the industrial development.
Feb. 28, 2020Vol. 35 Issue 2 413 (2020)
De-sheng HU, Rui-heng SUN, and Sheng-qing XU
The rise and fall of civilizations depend on ecosystems, and the birth and existence of ecosystems are based on water. The Yangtze River Basin is the largest river basin in China, and has important economic, social and ecological functions. With the advancement of the construction of the "Four Belts" (a global influential inland river economic belt, a coordinated development belt with East-Middle-West interaction and cooperation, and an internal and external open belt with all-round promotion along coast-river-border, and a pioneer demonstration belt of ecological civilization construction) in the Yangtze River Economic Zone under the concept of ecological civilization, it is urgent to establish an effective river basin governance system for the Yangtze River Basin under the rule of law. Due to similarities of the objects, items and targets that are adjusted, the theories, principles, rules and practices of international water law are of important and beneficial referential value for the legislation on the Yangtze River Basin. The legislation on the Basin faces three key challenges, i.e., i) an arduous task to protect its eco-environment and resources, ii) multi-stakeholders, and, iii) a very unreasonable governance system and mechanism. The theories, rules, guidelines and practices of international water law on ecological integrity path, principle of equitable and reasonable utilization, and river basin governance system and mechanism, are helpful to deal with these challenges effectively and efficiently. The inspirations from these theories, rules, guidelines and practices tell us that, the legislation on the Basin should, (i) define the relevant content clearly, so as to reflect the ecologically integrated path; (ii) recognize the principle of equitable and reasonable utilization, and transplant it to a certain extent or absorb its essence, and enumerate in a non-exhaustive way that the relevant factors affect equitable and reasonable utilization; (iii) let the proposed "Yangtze River Basin Management Organization" play a basic, core and dominant role in the institutional and mechanism system of the river basin management. Their significant values include the following: promoting the realization of the harmonious, coordinated and sustainable development as well as the legalization of governance in the Basin, and further promoting the compatibility between China's river basin legislation and international water law; scientifically demonstrating and developing the above three basic aspects of international water law through China's practice so as to set a good example for other domestic river basins, as well as promoting implementation of the great strategy of China's endeavor to be an important participant, contributor and leader during the process of constructing global ecological civilization.
Feb. 28, 2020Vol. 35 Issue 2 425 (2020)
Da-wei WANG, Jun-hong BAI, Qing-qing ZHAO, Qiong-qiong LU, and Shu-yan ZHANG
The objective of the research was to investigate whether high-intensity anthropogenic disturbance changed the profile characteristics of soil salinity in coastal wetlands. Soil samples of different vegetation zones were collected in natural wetland (NW) and anthropogenic disturbance wetland (AW) in the Yellow River Delta, and tested in the laboratory. One-way ANOVA, nonparametric test and cluster analysis were applied for statistical analysis. The results showed that soil salinity ranged from mild salinization to saline soil along the land-sea gradient. Profile characteristics of soil salinity was significantly influenced by human disturbance, varying with plant communities. In general, compared to NW, soil salinization was much heavier in AW. Soil samples were clustered into three profile types: surface accumulation profile (SAP), oscillation profile (OP), even distribution profile (EDP). The profile types ranged from SAP and OP to EDP in spatial pattern from sea to land. The A-CL and bare tidal flat soil samples showed surface accumulative feature with coefficient of surface accumulation of 63%, belonging to SAP. And almost two-thirds of soil samples belonged to EDP. The dam and tarmac construction weakened the tidal connectivity and destroyed wetland habitats (e.g., soil water content, bulk density, etc.) by direct blocking or terrain changes, which could be the main attribution to soil salinization and salt surface accumulation. Thus hydrological connectivity restoration measures, such as sluice regulation and ecological water compensation projects, could be used to improve soil salinization and promote sustainable development of coastal wetlands in the Yellow River Delta.
Feb. 28, 2020Vol. 35 Issue 2 438 (2020)
Dong-dong QIU, Jia-guo YAN, Shu-yan ZHANG, Dian-long ZUO, Ze-zheng LIU, Fang-fang WANG, Qing WANG, and Bao-shan CUI
Birds are a key constituent of the coastal ecosystems. They have been identified as vital ecosystem engineers that modify both the abiotic and biotic factors through their behavior processes. Understanding the ecosystem engineering effect of birds is of importance to undergo restoration based on ecosystem process in coastal vegetation systems. Field surveys were conducted to investigate the effect mechanisms of the foraging-associated hollows of birds on the vegetation resilience in a degraded coastal saltmarsh vegetation ecosystem, in the Yellow River Delta, Northern China. Our results showed that the foraging-associated hollows of birds could play an important role in changing microtopography, improving edaphic environment and promoting vegetation establishment. Compared with the degraded flat microtopography areas without birds influence, the soil hardness and the soil salinity in the foraging-associated hollows of birds are significantly lower, while the soil moisture content, and the soil carbon and nitrogen nutrition content in the foraging-associated hollows of birds are significantly higher. Additionally, the foraging-associated hollows of birds could function as effective traps to improve the seed retention, seedling establishment and plant survival, which could effectively promote the recovery of Suaeda salsa. Our study highlights that foraging-associated engineering processes of birds modifying the microtopography should be considered as an important implication, for using artificial microtopography to increase the potentials of vegetation restoration in degraded coastal saltmarsh ecosystems.
Feb. 28, 2020Vol. 35 Issue 2 449 (2020)
Dong-xue LI, Yu-qin LI, Ke-hao ZHANG, Xu MA, Shu-yan ZHANG, Wei-hua LIU, Chun-guang CHE, and Bao-shan CUI
Carbon and nitrogen are two key elements in the natural wetland soil. Changes of organic carbon contents in wetland soil significantly affect the structure and function of wetland ecosystems. Soil carbon and nitrogen contents in coastal salt marshes are closely related to hydrological connectivity patterns of coastal wetlands. To explore the spatio-temporal characteristics of soil carbon and nitrogen contents in different tidal creek systems of salt marsh, this research selected a typical, complete tidal creek system with major and minor tributaries in the estuary of the Yellow River. By collecting surface soil (0-5 cm) in the first-, second-, and third-level tidal creek regions, we attempted to explore the relationship between soil organic carbon, total nitrogen contents and soil moisture contents, salinity, bulk density, pH and other physical-chemical factors. Results illustrated that the soil organic carbon and total nitrogen contents presented great heterogeneity on both temporal and spatial scales. On the time scale, the soil organic carbon contents increased firstly and then decreased, the second tidal creek changed the most striking while the third tidal creek showed the least significant. The soil total nitrogen contents presented variability in different grades of tidal creeks. The total nitrogen contents were listed as August > September > July in the first-degree tidal creek, while the contents reached the peak in September of the second and third tidal creeks. The soil carbon and nitrogen ratio reached the peak in August. On the spatial scale, the average contents of the soil organic carbon and total nitrogen (2.9 g·kg-1, 0.36 g·kg-1) in the first tidal creek were greater than those of the second tidal creek (1.4 g·kg-1, 0.18 g·kg-1) and the third tidal creek (1.6 g·kg-1, 0.21 g·kg-1). The longer the lateral distance of the first tidal creek is, the higher the contents of the soil organic carbon and total nitrogen are. The soil organic carbon and total nitrogen contents in the third-degree tidal creek showed a slow downward trend in distance which was opposite to those of the first-degree tidal creek. Correlation analysis showed that there was a significantly positive correlation between soil organic carbon, total nitrogen contents and salinity (P<0.01), and a prominently negative correlation with soil bulk density (P<0.01). In summary, the soil carbon and nitrogen contents of the salt marsh wetland are affected by the soil water and salt conditions, and the tree structure of the tidal water system is crucial to the water and salt conditions of the surrounding soil. The influence of the structural characteristics of the tidal water system on the water and salt conditions is one of the important factors of spatial and temporal differences in soil carbon and nitrogen content.
Feb. 28, 2020Vol. 35 Issue 2 460 (2020)
Ya-nan GUAN, Jun-hong BAI, Wei WANG, Da-wei WANG, and Shuo YIN
The remained litter mass, and the contents of As, Cr, Cu, Pb, and Zn in the litters of Phragmites australis and Suaeda salsa under different flooding conditions in the Yellow River Delta were determined to investigate the litter decomposition rates and heavy metal return characteristics. Results showed that the decomposition of S. salsa litters was significantly faster than that of P. australis litters (P<0.05), and the decomposition under tidal flooding conditions was faster than that under the short-term flooding conditions. In terms of P. australis litters, their contents of As, Cr and Cu were higher compared to the initials, and these heavy metals contents of P. australis litters under tidal flooding conditions were higher than those under short-term flooding conditions. For S. salsa litters, all heavy metals exhibited an increase in the study, and the contents of As, Cu and Pb under tidal flooding conditions were significantly higher than those under the short-term flooding conditions (P<0.05). Pb and Zn were released during the decomposition for both P. australis and S. salsa litters. The findings of this study contributed to further studies on the influences of the tidal waves on the litter decomposition and metal returns in the Yellow River Delta.
Feb. 28, 2020Vol. 35 Issue 2 472 (2020)
Fang-fang WANG, Jia-guo YAN, Xu MA, Dong-dong QIU, and Bao-shan CUI
Litter decomposition plays a vital role in governing ecological processes of wetland ecosystems. To investigate the variations of litter quality and nutrients during decomposition varying with tidal regime, we conducted manipulative experiments with different species of Suaeda salsa and Spartina alterniflora, at four sites along a tidal gradient, to test the decomposition rates, by putting the litter of each plant into the decomposition bags. Our results showed that losses of litter mass were related to litter species, soil salinity, soil water content and tidal disturbance, revealing that the tidal disturbance can be an important force to influence the retention and decomposition. We found that S. alterniflora litter decomposed faster than S. salsa litter at the sites with strong tidal disturbance, but for the sites with weak tidal disturbance, a converse trend was found that S. salsa decomposed faster than the S. alterniflora. The decomposition rates of them ranged from 0.00134 d-1 to 0.00234 d-1. We also found that the decomposition varies with time. After 270 days of ending experiments, the mass losses of S. alterniflora and S. salsa litter exceeded 30%, showing that the losses at the sites with stronger tidal disturbance were larger than those at sites with weak tidal disturbance. The variations of N and C/N of S. salsa and S. alterniflora litter differed significantly among sites (N: F71=3.280, P0.05). The average contents of C, N and C/N of S. salsa litter were 40.81±1.15%, 0.51±0.08% and 82.22±13.18, respectively, while the average contents of C, N and C/N of S. alterniflora litter were 31.72±2.37%, 0.39±0.05% and 82.59±14.91, respectively. Both litters showed a net release of carbon and nitrogen. The average releasing amounts of C and N were 36.9% and 55.8%, respectively in S. salsa litter and the average release amount of C and N were 53.1% and 47.1%, respectively in S. alterniflora litter. The net releasing amount of carbon at sites with strong tidal disturbance was larger than that of sites with weak tidal disturbance. Our result suggests that decomposition of coastal vegetation litter provided nutrient element (e.g. C and N) for coastal wetland ecosystems, in the Yellow River Delta. Therefore, our study highlights that tidal regime should be regarded as an important environmental factor in regulating biogeochemical cycles and carbon accumulation, consequently altering the ecosystem functioning.
Feb. 28, 2020Vol. 35 Issue 2 480 (2020)
Zeng-lin HONG, Hong-tao ZHANG, Guo-wei ZHANG, Shao-zhong KANG, Sheng-kui CHENG, Shu-zhong GU, Jing-yuan LI, Lei SHEN, Yan-fen WANG, Xi-sheng HUANG, and Shuang-lin YANG
Building ecological civilization is a millennium plan for the sustainable development of the Chinese nation. In order to maintain global ecological security, build a beautiful China, create a good production and living environment for the people, and achieve the goal of adhering to the harmonious coexistence of man and nature, we should get a better understanding of the laws of nature and respect the planet. To respect the earth and regulate human behavior, we must realize and adopt the concept that lucid waters and lush mountains are invaluable assets, adhere to the basic national policy of prioritizing resources conservation and environmental protection, and take the ecological environment as our lives. The principle of recovery is to let nature restore itself, develop spatial layouts, industrial structures, way of work and life that can help conserve resources and protect the environment. With this, we can make the earth a natural, harmonious and beautiful home for mankind.
Feb. 28, 2020Vol. 35 Issue 2 493 (2020)
© Copyright 2018-2021 | Chinese Laser Press.
All Rights Reserved 沪ICP备15018463号-20