


 View fulltext

2024
Volume: 53 Issue 10
25 Article(s)

Jingjing ZHANG, Jiansu LI, Changying DANG, Haowen CHEN, and Zhao YANG
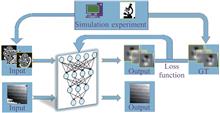
Objective: With the development of optical imaging technology, the advantages of digital holography have gradually emerged in the fields of surface contour inspection, industrial inspection, microscopic particle imaging and biomedical interferometry. Realizing high-precision phase unwrapping is the main key technology in the process of digital holography reconstruction. Phase unwrapping is to restore the phase information wrapped in the (-π,π] interval to the real phase information which changes continuously. Many phase unwrapping methods have been proposed in domestic and foreign related researches, including the research of algorithms and the application of deep learning techniques. But for the under-sampling problem due to the fast phase change, the classic phase unwrapping methods can solve the undersampling problem only within a certain range, and the difficulty lies in how to correctly recover the accurate phase distribution when the undersampling is more serious and the phase change is too fast. In order to solve the above problems, this paper proposes a spatial phase unwrapping method based on the DC-UMnet networks.MethodsA large number of simulated datasets are used to establish mapping relationships between wrapped and unwrapped phases by means of supervised learning. To address the problem of undersampling, this paper proposes a spatial phase unwrapping method based on the DC-UMnet network to unwrap the undersampling wrapped phase. The DC-UMnet network utilizes the U-net network as the framework. In order to reduce the complexity of the model, the number of parameters, and the cost of computation, it is integrated into the lightweight deep learning network of Mobilenetv1 in the encoding part. And it is integrated into the decoding part by the Dual-Channel block. The Dual-Channel convolution mode used in the Dual-Channel block better fuses the extracted features, so that the demodulated undersampling parcels phase information will have a higher accuracy. Finally, the optimal loss function and activation function suitable for this network are explored. The ReLU6 activation function is used to inhibit the maximum value in the process of feature extraction, which helps to maintain the accuracy in the quantization of the model. The SmoothL1 Loss loss function is used to calculate the loss value, which is robust to the outliers and outlying points in the training data, and is able to control the gradient magnitude to avoid affecting the final training effect of the network due to the special points. The undersampling simulated dataset is trained and the undersampling parcels phase diagram obtained from the experiments is verified. Comparing the proposed method with the U-net network and the DCT method, the results shows its superiority in the under-sampling problem.Results and DiscussionsThe simulation results in Fig.6-Fig.7 show the feasibility of the undersampling phase unwrapping of the method proposed, and the evaluated results according to the structural similarity index are more satisfactory. Comparing with the U-net network and the DCT method, the simulation results show that the structural similarity index values of the DC-UMnet network are improved by about 4.38 and 0.77 times. After adding noise, the test results show that the structural similarity index of DC-UMnet network increases about 4.68 times and 0.86 times. The experimental results with undersampling microscopic hole as the object shows that the proposed method has a smaller error. And the lateral error of the undersampling microscopic hole size obtained by the proposed method was 2.1 μm and the longitudinal error was 86.7 nm. The accuracy of this paper's method for extracting undersampling phase information is proved, which promotes its further development in the field of optical phase imaging and other fields.Conclusions A novel method is presented to solve the problem of unwrapping the phase of an undersampling parcel. The proposed method is based on the decoder-encoder framework of the U-net network. It incorporates the lightweight deep learning network of Mobilenetv1 and uses the dual-channel module to fuse the extracted features for the undersampling problem. The comparative analysis with existing phase unwrapping methods not only proves the feasibility of the method, but also demonstrates the excellence of its phase unwrapping ability under undersampling conditions. The experimental validation of the real object further affirms the superior performance of the proposed method, which is not only able to perform phase unwrapping with higher accuracy for objects without undersampling, but also able to accurately perform phase unwrapping under undersampling conditions with an accuracy of 91.2%. Simulation and experimental results show that the accuracy of the phase unwrapping results of the proposed method is greatly improved under the undersampling conditions. This is of great significance in optical phase imaging and provides new ideas and methods for solving the phase unwrapping problem under undersampling conditions.
Oct. 25, 2024Vol. 53 Issue 10 20240219 (2024)
Zijia CHENG, Jian LI, Bowen FAN, Weiyi ZHANG, Xiaohui XUE, and Mingjiang ZHANG
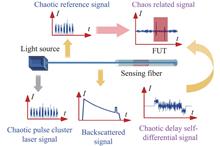
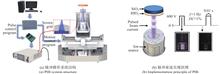
ObjectiveChaotic Raman distributed fiber optic sensing technology replaces the traditional pulsed laser as the detection signal with chaotic laser, breaking the technical bottleneck of the traditional Raman distributed fiber optic sensing system where the spatial resolution is limited by the pulse width, which can be applied in the field of safety monitoring such as transportation infrastructure, pipeline leakage, coal mine and so on. Since the incoming power of chaotic single pulse is limited by the nonlinear scattering threshold in the fiber can’t be infinitely improved, limiting the coupled optical flux of the system, resulting in the system signal-to-noise ratio decreases with the increase of the sensing distance, thus failing to achieve a longer distance of high spatial resolution temperature sensing. Therefore, this paper proposes a Raman distributed fiber optic sensing scheme with chaotic pulse cluster correlation compression, which suppresses the correlation between the noise and the sensing signal and the nonlinear effect in the optical fiber, improves the system signal-to-noise ratio, and realizes the high-performance Raman distributed fiber optic sensing technology.MethodsA simulation system of chaotic pulse-cluster Raman distributed fiber-optic sensing is established (Fig.1), the position and length information of the temperature mutation region is obtained by the time-delayed self-differential reconstruction and correlation compression scheme (Fig.3), and the theoretical spatial resolution of the chaotic pulse-cluster Raman sensing system is determined (Fig.5), and the temperature demodulation scheme is utilized to obtain the temperature information of the temperature mutation region and analyze the temperature sensitivity of the system (Fig.6).Results and DiscussionsThe effect of the number of pulses on the sensing performance of the Raman distributed fiber optic sensing system with chaotic pulse clusters is investigated by numerical simulation experiments. With the increase of the number of pulses in the chaotic pulse cluster, the optical flux that can be coupled to the system increases, and the dynamic range of the system gradually improves, and the dynamic range of the sensing system is 5.35 times higher than that of the chaotic single-pulse system when the number of pulses in the pulse cluster is 5 (Fig.2); the system can achieve a high spatial resolution of 10 cm at different sensing distances (Fig.3), and as the number of pulses in the chaotic pulse cluster increases, the positive correlation obtained by the correlation compression scheme increases the spatial resolution of the system. With the increase of the number of pulses in the chaotic pulse cluster, the peak value of the positive correlation peak obtained by the correlation compression scheme also shows a certain nonlinear increase (Fig.4); the theoretical spatial resolution of the Raman distributed fiber optic sensing system with chaotic pulse clusters is investigated, and the theoretical spatial resolution does not change with the change of chaotic pulse clusters (Fig.5); the analysis reveals that with the increase of the number of pulses in the chaotic pulse clusters, the system's sensitivity to the temperature increases, and the optimal value is reached at the time when the number of pulses is 5 (Fig.6).ConclusionsA Raman distributed fiber optic sensing scheme with chaotic pulse cluster correlation compression is designed to achieve high spatial resolution, long sensing distance, and strong temperature sensitivity, and it is proved that the chaotic pulse cluster correlation compression Raman distributed fiber optic sensing scheme can greatly improve the dynamic range, signal-to-noise ratio, and temperature sensitivity under the premise of guaranteeing the high spatial resolution of the system, which provides a new scheme for the high-performance Raman distributed fiber optic sensing system. It provides a new solution for high-performance Raman distributed fiber optic sensing system.
Oct. 25, 2024Vol. 53 Issue 10 20240235 (2024)
Shupei JIN, Yunong HU, Peng ZHOU, and Ming LIU
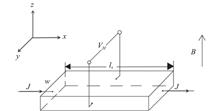
ObjectiveThe undoped GaSb has a donor defect and exhibits p-type conduction with good electrical conductivity. GaSb is usually used as the substrate for Type-Ⅱ superlattice materials prepared by molecular beam epitaxy, and the thickness of GaSb substrate is much larger than the thickness of the superlattice material. The thickness of GaSb substrate tends to have a great influence on the electrical properties of Sb based Type-Ⅱ superlattice during Hall test (Fig.1). In the preparation process of infrared detector, in order to increase the absorption of infrared radiation by the material, the substrate is usually thinned after the preparation of the device, and the infrared radiation is detected by back-side illumination. Therefore, exploring the electrical characteristics of Type-Ⅱ superlattice influenced by GaSb thickness could provide theoretical basis for the structural design of superlattice. MethodsThe effect of GaSb substrate thickness on the electrical properties of n-type and p-type superlattice films is discussed. Molecular beam epitaxy technology is used to grow Type-Ⅱ superlattice. After the pdoped GaSb buffer layer is grown on the n-type GaSb substrate, Si-doped n-type InAs/GaSb Type-Ⅱ superlattice (Fig.5) and Be-doped p-type InAs/GaSb Type-Ⅱ superlattice (Fig.6) are grown respectively. The substrates are thinned by mechanical polishing with different thicknesses and Hall tests are performed immediately.Results and DiscussionsThe results show that in the Hall test at 77 K temperature, the electrical properties of n doped superlattice and p-type superlattice vary with the thickness of the substrate. The carrier concentration and mobility of n-type InAs/GaSb Type-Ⅱ superlattice grown on GaSb substrate and buffer layer vary with the substrate thickness, but the variation is small within the same order of magnitude, which is mainly due to the fact that the Be-doped GaSb buffer layer attenuates the electrical influence of GaSb substrate on the superlattice material (Fig.7). The carrier concentration and mobility of p-type InAs/GaSb Type-Ⅱ superlattice grown on GaSb substrate and buffer layer change with substrate thickness in the same way as that of n-type superlattice films with substrate thickness: due to the presence of Be-doped GaSb buffer layer, the electrical influence of GaSb substrate on the superlattice material is attenuated, and the overall change changes are small, especially the mobility. The carrier concentration decreases with the thickness of GaSb substrate, and the mobility increases with the thickness of GaSb substrate (Fig.8). This result occurs for the following reasons: the decreasing of the superlattice material carrier concentration reduces the possibility of electron scattering result from the increased surface recombination effect and redistribution of impurity concentration, so the mobility increases with the thinning of the substrate thickness. The changes of carrier concentration and mobility of n-doped superlattice are of the same order of magnitude, and the electrical properties of thin film materials with opposite polarity to the buffer layer before thinning can be calibrated for the electrical properties of the materials after thinning. The change of carrier concentration in p-doped superlattice is relatively large.ConclusionsAlthough the buffer layer attenuates the effect of the substrate on the superlattice film, the effect of the substrate on the electrical properties of the superlattice film cannot be completely eliminated. When considering the carrier concentration of materials with the same polarity as the buffer layer material, high concentration doping is required during the growth process of materials that require precise doping to ensure the carrier concentration of the thin film material after thinning. This change needs to be taken into account, and the change in carrier mobility could be treated as a constant. This paper is of reference significance for the carrier concentration calibrations of Sb based Type-Ⅱ superlattice materials with different doping concentrations.
Oct. 25, 2024Vol. 53 Issue 10 20240243 (2024)
Siqi HE, Rundong FAN, Zhihao CHEN, Yan MO, and Donglin MA
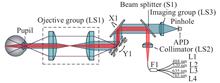
ObjectiveFunduscopic examination is a routine examination that can effectively screen for funduscopic lesions caused by systemic diseases such as diabetes mellitus and hypertension. However, current ultra-wide-angle high-resolution retinal imaging devices for funduscopic examination are usually difficult to combine the functions of long working distance and pupil-free dilation, which causes discomfort to patients and increases the difficulty of examination. In response to the need for wide-area retinal imaging in ophthalmological examinations, this study designed an ultra-wide-angle long exit distance pupil-free fundus imaging optical system based on confocal laser scanning fundus imaging technology. The system adopts a transmissive structure, taking into account the requirements of long pupil exit distance and no astigmatism, to achieve 110° ultra-wide angle imaging. The system has a 12 mm exit pupil distance, with a beam size of less than 2 mm at the pupil, and a built-in visual acuity compensation lens set, which can effectively compensate for the human eye with a refractive error of -15-+15 D. The design results show that the system's fundus resolution is 7.5 μm, with excellent imaging quality, and the imaging range and working distance meet the practical use requirements. This study provides a useful reference for the design of the ultra-wide angle confocal fundus imaging optical system, which is of significance for improving the quality of fundus imaging and the accuracy of clinical diagnosis.MethodsA scheme of a transmission confocal laser scanning fundus imaging system is proposed in this paper. Firstly, the technical specifications of the system are determined according to the actual demand (Tab.1), and then the wide-angle human eye model with adjustable diopter (Tab.2-Tab.3) is established. The objective is a common part of the imaging system and illumination system, and the initial structure consists of a wide-angle eyepiece and a long exit pupil eyepiece (Fig.2). The design problem of the objective is transformed into an optimization problem, and the image quality evaluation function for the multi-eye model with constraints is constructed, and the structure of the objective that meets the design requirements is obtained by optimization in ZEMAX.Results and DiscussionsThe optimized objective has nine lenses, including two aspherical lenses, and incorporates a dioptric compensation lens to correct for aberrations in the human eye at different diopters. The system is constructed by combining the objective, scanning galvanometer, and imaging lenses (Fig.5). Notably, the system achieves an angular magnification of 1. On one side of the object, the Numerical Aperture (NA) is 0.04. The full-field modulation transfer function (MTF) exceeds 0.2 at 67 lp/mm (Fig.7). Furthermore, the optical resolution is 7.5 µm, meeting the design requirements. Importantly, the system provides clear imaging of the human eye across a range of refractive errors from -15 D to +15 D. Even when compensating solely for refractive errors within the -10 D to +10 D range, the full-field RMS radius remains below 7.5 µm (Fig.8), indicating good imaging quality. Finally, tolerance analysis confirms that the system is feasible for manufacturing.ConclusionsA transmission confocal laser scanning fundus imaging system is proposed in this paper, which takes into account the ultra-wide angle and long working distance, with a field of view of 110° and a pupil exit distance of 12 mm. The system includes an objective lens, a scanning galvanometer, an imaging mirror, a collimating mirror, and a visual acuity compensating group in the objective lens, which can adapt to the refractive eyes of -15 D to +15 D. The optical resolution of this system is 7.5 μm, and the system exhibits relaxed tolerance, ensuring ease of manufacturability. This system serves as a valuable reference for the design and development of fundus imaging equipment.
Oct. 25, 2024Vol. 53 Issue 10 20240275 (2024)
Lingbo XIE, Feng SHI, Ye TIAN, Baoqi GONG, Dongyang QIAO, Guoyan SUN, Shuangpeng GUO, and Gang ZHOU
ObjectiveWith the ongoing advancement of optical systems, there has been a growing demand in recent years for precision optical components across various cutting-edge research fields, including EUV lithography lenses, synchrotron radiation X-ray mirrors, and strapdown inertial navigation laser gyro resonators. Ion Beam Polishing (IBP) technology is characterized by its ability to remove complex shapes with excellent stability, absence of edge effects, non-contact non-destructive processing, and high precision. It is commonly employed as the final finishing process for high-precision optical components. While there exist various optimization schemes for the current ion beam shaping machining paths and their velocity distributions, there are still instances where the machine tool's dynamic performance cannot meet the requirements of the optimized machining schemes when processing components with large gradient errors. We introduce a novel Pulsed Ion Beam (PIB) machining technique to overcome the limitations associated with current ion beams in the processing of high-precision optical components. This method not only offers ultra-high removal resolution but also significantly reduces the demands on machine tool dynamics, prevents the formation of extra removal layers, and adeptly achieves precise dwell times at each machining point on the component.MethodsThis article proposes a new PIB processing method, which adjusts the frequency of the pulse power supply to adjust the period of PIB, and controls the duty cycle to control the duration of the pulse beam current in a single period. It can achieve accurate and controllable material removal in the area that does not require processing by turning off the ion beam current in the non-processing area (Fig.1). Intelligent planning of machining paths using ant colony algorithm (Fig.9). Using ZYGO interferometer to measure the final processing results.Results and DiscussionsThe stability and linearity of PIB have been confirmed (Fig.2), with its removal resolution demonstrated to achieve material removal of 0.33 nm using just 5 pulses. The machining capabilities of traditional IBF and PIB in addressing gradient errors were compared through simulations. The results indicated that when the wavefront gradient of the surface shape error exceeds 0.5 λ/cm, the PIB offers a pronounced advantage in shaping (Fig.6). The implementation of the ant colony algorithm cut ineffective processing paths by 57% (Fig.9). Ultimately, the new processing strategy enabled the acquisition of surfaces with sub-nanometer precision. Following three stages of processing, the RMS error was reduced from 343.438 nm to 0.552 nm (Fig.15).ConclusionsThis study introduces a new generation of ion beam processing techniques. Compared to traditional IBF methods, the PIB offers superior material removal resolution. By comparing the amounts of material removed with the same sputtering time but varying duty cycles, the PIB system's outstanding stability and linearity in material removal were confirmed. Additionally, five pulses were applied at a frequency of 1 Hz and a 10% duty cycle to sputter hafnium oxide thin films. The comparison of film thicknesses before and after processing confirmed that PIB achieves a sub-nanometer removal resolution of 0.066 nanometers per pulse. Simultaneously, the ACO algorithm was employed to optimize and plan the PIB machining paths, reducing ineffective paths by 57.7%. Ultimately, this processing strategy was used to fabricate an actual monocrystalline silicon mirror, achieving a sub-nanometer precision optical surface of 0.552 nm. This verifies the superior performance of the PIB processing strategy and system in achieving high-precision optical surfaces. It represents a more flexible, accurate, and efficient ion beam processing technique.
Oct. 25, 2024Vol. 53 Issue 10 20240283 (2024)
Quanli ZHANG, Boxin XU, Jiahao LI, Jian LIU, Mingtao WU, and Yucan FU
ObjectiveCVD diamond is a hard and brittle material of wide applications, but the disordered arrangement of coarse grains in polycrystalline CVD diamond leads to uneven surface. The commonly used methods for CVD diamond processing are ultra-precision grinding and chemical-mechanical polishing, but generally of low efficiency and tool life. The efficiency of laser ablation depends on the optical and thermal properties of the laser, which provides a highly directional and localised energy source for diamond processing. Therefore, laser proessing is suitable for CVD diamonds with high hardness and wear resistance. It is necessary to study the influence of laser parameters on the surface morphology and surface damage to achieve the parameters optimization for nanosecond laser polishing of CVD diamond.MethodsIn this study, the surface generation process of laser ablated CVD diamond was firstly investigated by finite element simulation, and then the influence of laser processing parameter on the surface roughness and surface topographic characteristics of CVD diamond was investigated by single factor experiment. The surface roughness was measured using a 3D laser confocal microscope, and the surface topographic features of the workpieces were examined using a scanning electron microscope. The effects of laser incidence angle, laser power, laser scanning speed and scanning times on the surface roughness and surface topographic features of CVD diamond were achieved (Fig.6, Fig.11, Fig.14).Results and DiscussionsThe results of finite element simulation (Fig.4) show that the incidence angles of the laser affect the polished surface, and the greater laser incidence angle, the smaller removal depth of the material. The laser polishing of CVD diamond were carried out with different laser incidence angles and powers, and the experimental results (Fig.6) were consistent with FEM. When the laser power is higher, the surface roughness of the material decreases with increasing incident angle, while the effect of the laser incident angle on the surface roughness drops significantly when the laser power is lower. The laser polishing of CVD diamond under different laser scanning speeds (Fig.11) shows that the surface roughness of the material decreases firstly and then increases with the growth of laser scanning speed. When the scanning speed was lower, the a great number of larger-size graphite grains and grooves formed (Fig.13), and when the scanning speed was higher, the surface turned to be relatively flat but with a lot of small cracks among the graphite grains. Finally, different laser scanning times of CVD diamond (Fig.14) show that the surface roughness of the material firstly decreases and then increases with the increase of the number of laser scanning times. A growing number of laser scanning times leads to a number of cracks on the diamond surface, which worsens the surface roughness (Fig.16).ConclusionsIn this study, the surface generation process of laser ablation of CVD diamond is investigated by finite element simulation and experiments, and the influence law of nanosecond laser processing parameters on the surface morphology and surface damage of CVD diamond is explored to achieve the optimization of nanosecond laser polishing parameters. The experimental results show that the increase of the laser incident angle can weaken the trapped light effect on the material surface, which can effectively improve the surface roughness of the material, and the greater laser incident inclination angle, the lower processing depth of the material surface. After nanosecond laser processing, a graphite layer is formed on the surface of CVD diamond, and surface grooves grooves and other damages appears when the laser power is higher, which can be suppressed by increasing the laser incident angle. The cracks on the surface of the material are attributed to the tensile stress in the graphite layer after cooling, and the size and number of cracks can be reduced by increasing laser incidence angle and decreasing laser power. Finally, the surface roughness (Sa) of CVD diamond dropped to be 1.3 μm by controlling the parameters, including laser incidence angle, laser power and laser scanning speed.
Oct. 25, 2024Vol. 53 Issue 10 20240285 (2024)

Rui QU, Hongwei ZHANG, Huinan GUO, and Jian LI
ObjectiveHigh function density electro-optical (EO) system is becoming an important development direction at present and in the near future. With the gradual maturity of wide-band infrared detector technology, VIS-SWIR (from visible to short wave infrared) wide-band confocal zoom optical system, which can support various operational modes such as color imaging, fog penetration, and low-light conditions, effectively simplify the overall design of EO systems, turns into an important mean to realize the high functional density and SWaP&C (Size, Weight, Power, and Cost) of EO system, but optical materials show great differences in dispersion characteristics within this band, which makes design of continuous zoom system difficult and time-consuming. Studying of the corresponding optical system design method become necessary and urgent.MethodsIn order to solve this problem, a wide band zoom optical design model (Eq. (1)-Eq. (3)) is established with the combination of classical continuous zoom system design model and the achromatic conditions in the design of wide-band optical system. The parameters affecting the color aberration distribution of the whole system are explicitly demonstrated in the model. Based on the proposed model, the methods of optical power distribution and material selection are further discussed. Considering the dispersion characteristics of glass materials in different bands, some material using guidelines with examples in Tab.1 of wideband zoom lens design is provided. The extraordinary applications of the cemented elements, especially the synthetic abnormal dispersion characteristics and its synthetic method, are pointed out explicitly.Results and DiscussionsA wideband (VIS-SWIR) optical system under the requirements of F≤5.5, focal length 10-300 mm, horizontal field of view 38.8°-1.25°, waveband of 0.48-1.7 μm, 1 080 P InGaAs detector with pixel size of 3.45 μm is designed (Fig.3) to fulfill multi-band imaging by switching filters, and realize the common aperture integration of different functions such as color/fog-penetrating/laser/low-light imaging through a switching mechanism or a dichroic prism (Fig.4-Fig.5). It can be observed from Tab.3 that at a frequency of 100 lp/mm and 145 lp/mm, the MTF values at the edge of the field of view are approximately 0.3 and 0.1 across the wide wavelength range of 0.48 μm to 1.7 μm, the relative distortion at each focal length position is less than 2%; the chromatic focus shift at each focal length position is within the focal depth (162 μm) as 1.1 μm is taken as the central wavelength. The zoom lens system, which uses 7 kinds of optical glass, consists of 18 lenses, total length 190 mm, has good image quality and tolerance character through the full zoom range.ConclusionsStarting from the zoom system design model, a design method for a wide-band zoom system is discussed with consideration of the achromatic conditions within and between bands of a wide-band system. Material selection criteria for different components of the zoom system are provided, which reduces the time-consuming and tedious trial-and-error process of traditional methods. This approach can effectively guide the design and development of related optical systems. As an example, a continuous zoom optical system with a wide wavelength range of 0.48 μm to 1.7 μm is designed using only commonly used optical glass. This system achieves integration of a common aperture and common focal plane for the visible light, near-infrared, and short-wave infrared bands. It features a telephoto ratio better than 0.64 and a zoom ratio of 30×. Additionally, it demonstrates excellent imaging quality throughout the entire zoom range and is compatible with multi-band, multi-mode, and multi-purpose applications, making it promising for widespread use in related fields.
Oct. 25, 2024Vol. 53 Issue 10 20240296 (2024)
Li PEI, Baoqin DING, Bing BAI, Bowen BAI, Juan SUI, Jianshuai WANG, and Tigang NING
ObjectivePhotonic reservoirs have emerged as a promising complementary solution for computing hardware platforms, offering significant advantages in addressing time-dependent tasks and thus attracting substantial attention. Waveguide-based photonic reservoirs, in particular, have shown exceptional performance in time-series applications, such as communication and bit-level processing tasks. For more complex analog prediction tasks, studies have validated the efficacy of larger reservoirs, comprising up to 128 nodes, for the Santa Fe chaotic laser prediction challenge. However, this approach suffers from the limitation of requiring a large physical footprint. To overcome this constraint, the present study refines algorithmic techniques and input strategies, enabling accurate predictions using a more compact integrated photonic reservoir.MethodsFirst, to process the high-dimensional sampled data from the reservoir chip, the data processing algorithm was transitioned from linear regression to vector autoregression (VAR). VAR allows the incorporation of additional historical sample data as feature inputs in linear combinations, thereby alleviating computational limitations imposed by the restricted number of output nodes. Building on this improvement, a 32-node plum-shaped integrated photonic reservoir is proposed for predictive tasks. Finally, a multiple-dissimilar-input strategy is introduced to enhance data diversity at the input layer, further reducing computational errors in time-series prediction tasks.Results and DiscussionsThe results of research demonstrate that compact integrated reservoir computing, when combined with the VAR algorithm, achieves highly accurate prediction results. The prediction errors remain within the same order of magnitude as those in delay-based reservoirs, positioning the small integrated photonic reservoir as a strong competitor in this category. Building on this foundation, our investigation extended to the input strategy, demonstrating the effectiveness of a multiple-dissimilar-input approach. Compared to traditional methods, the root mean square error (RMSE) improves by an order of magnitude, while the normalized mean square error (NMSE) decreases by three orders of magnitude. Additionally, the mean absolute error (MAE) and dynamic systems (DS) evaluation metrics show substantial improvements. These findings suggest that the complexity of the reservoir's output signal is no longer solely determined by the chip's design and dynamic properties, significantly enhancing computational performance.ConclusionsThis study demonstrates the feasibility of compact waveguide-based reservoirs for complex time-series prediction tasks, offering superior predictive performance compared to existing delay-based reservoirs. By integrating the reservoir chip with the VAR algorithm, the compact reservoir gains enhanced capabilities for handling intricate tasks, achieving performance levels comparable to current state-of-the-art methods. Additionally, a significant improvement in prediction accuracy is attained through the implementation of an optimized input strategy. The precise prediction of stock indices underscores the vast potential of photonic waveguide-based reservoir chips in various time-series prediction applications. Moreover, the advancements in reservoir chip design, training algorithms, and input strategies extend beyond a single reservoir configuration. These improvements can be applied to cascaded configurations of small reservoirs, such as those employed in classical ensemble combination techniques, broadening the scope of their application.
Oct. 25, 2024Vol. 53 Issue 10 20240308 (2024)
Zonglin LIANG, Bo ZHANG, Yuanming ZHAO, Mingxu PIAO, Yiyang DONG, Yueling ZHANG, and Shoufeng TONG
ObjectiveThe diffractive optical element (DOE) possesses unique characteristics, such as negative dispersion and athermalization, which distinguish it from traditional refractive lenses. DOE is extensively utilized in various applications, including imaging, beam shaping, and 3D displays. It plays a significant role in the miniaturization of imaging optical systems and their engineering applications. Previous studies utilizing vector analysis and the extended scalar diffraction theory (ESDT) have demonstrated a more accurate calculation of the shading effect's impact on the reduction of diffraction efficiency at normal incidence. However, these studies did not address the influence of substrate materials at large-angle incidence on diffraction efficiency. This paper presents a technique for selecting substrate materials for the DOE based on ESDT. This method is essential for advancing the theoretical examination of the multilayer diffractive optical element (MLDOE) at high incident angles, particularly in the design of refractive-diffractive hybrid systems that incorporate diffraction elements with small period widths.MethodsBased on the ESDT, a theoretical model was proposed to describe the relationship between the microstructure height and the period width of the DOE, taking into account the substrate material and the angle of incidence (Eq.6). A method for selecting the substrate material for the DOE, based on the ESDT at oblique incidence, was proposed (Eq.8). An analysis was conducted using a MLDOE operating in the MWIR-LWIR dual band as an illustrative example.Results and DiscussionsAs illustrated in Fig.3, there is a significant contrast between the outcomes of SDT and ESDT. The results of SDT remain unaffected by the width of the microstructure period, whereas the outcomes of ESDT fluctuate based on this width. Figure 4 demonstrates the variation in polychromatic integral diffraction efficiency (PIDE) of ESDT with respect to angle under different period widths. It is evident from Fig.4 that, according to ESDT, there are discrepancies in the simulation results of diffraction efficiency for varying period widths. The outcomes of extended scalar diffraction theory are contingent upon the width of the microstructure period. The differences in diffraction efficiency for various substrate material combinations, as determined by ESDT, are presented in Fig.6 and Tab.1 for different period widths. As shown in Fig.6, the substrate material AMTIR1-ZNS exhibits the least variation in diffraction efficiency across all period widths, while the material combination GE-ZNS produces the greatest variation in diffraction efficiency across the same range. Consequently, AMTIR1-ZNS emerges as the most suitable substrate material combination for the MWIR-LWIR dual band.ConclusionsThis paper validates the accuracy and reliability of the rapid selection method for substrate materials based on ESDT. This design approach and its findings can serve as a valuable guide for designing MLDOE in dual-band infrared optical systems. Furthermore, this analytical method and its conclusions provide theoretical guidance for the optimal design of DOE operating at different incident angles.
Oct. 25, 2024Vol. 53 Issue 10 20240319 (2024)
Tong XIA, He ZHAO, Shuyuan ZHU, Penglei ZHANG, Siyuan CAO, and Pu WANG
Significance High-power Ytterbium-doped femtosecond fiber lasers have rapidly developed over the past few decades due to their all-fiber structural design, excellent beam quality, and reliable system stability. They are widely used in industrial processing, biomedicine, military defense, and frontier science. Fiber lasers utilizing chirped pulse amplification (CPA) technology are the predominant solution for these applications. Although fiber laser systems based on CPA are capable of generating femtosecond pulses with mJ level pulse energy, the pulse widths are typically above 200 fs. Nevertheless, a wide variety of applications require relatively low pulse energy and significantly shorter pulse durations. To date, the technique of nonlinear pulse amplification (NPA) has been employed to achieve femtosecond pulses with durations less than 50 fs. NPA technology includes self-similar pulse amplification, pre-chirp management amplification, and gain management nonlinear (GMN) amplification. In self-similar pulse amplification, however, the spectrum tends to exceed the gain bandwidth at higher energies, resulting in reduced pulse quality after compression. Pre-chirp managed amplification often requires precise control of the seed pulse dispersion, increasing system complexity and reducing stability. Compared to the first two technologies, GMN technology relies on nonlinear attractors and is insensitive to the temporal distribution of the seed pulse. Additionally, it surpasses the limitations of the gain narrowing effect, producing highly compressible pulses with spectral bandwidths exceeding hundreds of nanometers. Compared to CPA technology, the GMN technology does not require additional stretchers, ensuring an extremely compact structure.Progress Firstly, the mechanism of GMN amplification technology is detailed. GMN amplification primarily utilizes the dynamically evolving gain spectrum as a degree of freedom, generating spectra that far exceed the gain spectrum bandwidth while maintaining an approximately linear chirp and can be compressed to ~50 fs. In GMN amplifiers, when the nonlinear phase shift accumulates to a certain extent, spatiotemporal deterioration (STD) occurs, resulting in a rapid decline in pulse quality and a sharp increase in pulse duration after compression. Optimizing the pump and seed source configurations can further increase the STD threshold and enhance GMN amplifier performance.Secondly, the research progress of high peak power femtosecond fiber lasers based on GMN amplification technology, both domestically and internationally, is summarized from different design structures. Currently, two main design structures of GMN systems have been reported. One design involves pre-compressing the seeds output by the oscillator through a space compression device, injecting them into the fiber amplifier for GMN amplification, and then de-chirping through the space compression device. The other design involves pre-compressing the seeds by the optical fiber device, injecting them into the optical fiber amplifier for GMN amplification, and then de-chirping through the spatial compression device. This design maintains the advantages of the all-fiber structure and then de-chirps through the spatial compression device. Although some GMN systems use fiber optic devices as pre-compressors, the main compressor is still a free-space device. Additionally, our research group demonstrated the design structure of an all-fiber integrated GMN system. Hollow-core photonic-bandgap (HC-PBG) fiber is used to replace the grating pair compressor. This structure significantly simplifies the complexity of the GMN system.Finally, the expansion of GMN amplification system applications is analyzed. Currently, GMN amplification systems are widely used in various studies, such as optical parametric amplification and multi-modal nonlinear optical imaging. Additionally, our research group demonstrated the use of the GMN system for application research on supercontinuum light source generation.Conclusions and Prospects GMN amplification technology has garnered widespread attention since its proposal in 2019. This paper details the STD and influencing factors of the GMN amplifier, proposes a GMN system with an all-fiber integrated structure. The system is compact and can output a femtosecond laser with a pulse duration of 45 femtoseconds, a single pulse energy of 163 nanojoules, and a peak power of 3.6 megawatts. Due to its advantages of short pulses and high peak power, GMN amplification systems are employed in research on optical parametric systems, nonlinear optical imaging, and supercontinuum light sources. As laser technology advances, GMN systems will demonstrate significant value in fields such as high-precision processing, biomedical imaging, and frontier science.
Oct. 25, 2024Vol. 53 Issue 10 20240330 (2024)
Pengrui KANG, Yue TAO, Zhengfei MO, Man JIANG, Can LI, Jinyong LENG, Pu ZHOU, and Zongfu JIANG
ObjectiveThanks to the promising performances of narrow spectral linewidth, low noise and high coherence, single-frequency fiber lasers (SFFLs) have attracted considerable interests for a variety of applications including gravitational wave detection, LIDAR and nonlinear frequency conversion. In the 1.0 µm spectral band, single-frequency lasing from rare earth doped fibers mainly operates in the 1000-1120 nm wavelength region. However, for applications such as metrology and atomic spectroscopy that employ SFFLs in the visible band, extending the operation wavelength range to meet the application needs is urgently required. In particular, frequency doubling of 1178 nm SFFL to produce yellow light is crucially demanded in laser-guide-star detection. However, the large gain of ytterbium-doped fiber (YDF) between 1030 and 1100 nm would induce very strong amplified spontaneous emission (ASE) and lead to parasitic lasing, limiting the available lasing at 1178 nm.MethodsThis paper presents the realization of a high-performance 1178 nm SFFL based on the DFB (distributed feedback) structure. By inscribing a periodic structure on a 5 cm long YDF and introducing a π-phase shift point in the fiber Bragg grating, an extremely narrow spectral transmission window was formed, ultimately resulting in single-frequency laser output. The structural setup of the laser is depicted in Fig.1, where pumping light was coupled into the phase-shifted grating through a wavelength division multiplexer (WDM). The output laser was then tested through the backward output end of the WDM.Results and DiscussionsThe output power of the laser varies with the pumping power was recorded and shown in Fig.2, where it can be seen that the maximum output power of the laser is 13.0 mW and the slope efficiency is 6.92%. The spectrum at maximum output power is illustrated in Fig.3, showing an output wavelength of 1 178.01 nm with an overall signal-to-noise ratio up to 63 dB. To verify the single-frequency characteristics of the laser operation, its longitudinal mode was tested and shown in Fig.4. Only two main peaks were observed within one scanning voltage cycle, indicating the stable single longitudinal mode operation. Subsequently, the polarization extinction ratio (PER) was measured to be more than 19 dB across different power levels, demonstrating a consistent stability in polarization state of the laser. The relative intensity noise (RIN) was further examined and shown in Fig.5(a), in which the intensity noise levels remained around -120 dB/Hz within low frequencies ranging from 1 to 100 kHz. Furthermore, the phase/frequency noise of the laser was tested as depicted in Fig. 5(b). Within a 0.1 ms integration time, the linewidth of the 1178 nm single-frequency laser was calculated to be 27.61 kHz.ConclusionsIn this work, a 5.0 cm long Yb-doped fiber was employed to implement a DFB structure to realize 1178.014 nm single-frequency laser output. This fiber laser has a maximum output power of 13 mW with a signal-to-noise ratio of 63 dB and a polarization extinction ratio of 19.7 dB. As far as we know, this is the first demonstration of a 1178 nm Yb-doped single-frequency fiber laser.
Oct. 25, 2024Vol. 53 Issue 10 20240299 (2024)
Meng ZHANG, Shaozhi PU, Mingxin DU, Ying SUN, Xiaomeng WANG, and Ying LIANG
Objective Nematic liquid crystals have excellent electro-optical properties, significant optical nonlinearity, and the adjustable nonlocality and nonlinearities. So, it has become an ideal material for the study of non-local solitons. In 2017, JUNG P S et al. proposed a non-local model in which both molecular orientation and thermal effects coexist in the nematic liquid crystals. So far, there are few literature reports on the propagation of (1+2)-dimensional bright solitons and (1+2)-dimensional dipole solitons in this model. For this purpose, the propagation properties of (1+2)-dimensional solitons in nematic liquid crystals with competing nonlocal nonlinearities are investigated based on this model. The results can provide a theoretical basis for competing (1+2)-dimensional spatial optical soliton interactions in nonlocalized media, as well as potential applications in areas such as all-optical information processing and optical switching device preparation.Methods The critical power of (1+2)-dimensional ground-state bright solitons and dipole solitons in nematic liquid crystals with competing nonlocal nonlinearities are obtained by the variational method. Subsequently, the propagation properties of the (1+2)-dimensional bright soliton and dipole soliton with competing nonlocal nonlinearities are obtained using the beam propagation method. The conditions for stable transmission of (1+2)-dimensional bright and dipole solitons in nematic liquid crystals with competing nonlocal nonlinearities are given.Results and Discussions It is found that when the degree of reorientational nonlocality and the thermal nonlinearity coefficient is fixed, the critical power of optical solitons increases monotonically with the increase of the degree of thermal nonlocality. When the degree of thermal nonlocality increases to a certain value, the power of the upper branch increases monotonically with the increase of the degree of thermal nonlocality, and the power of the lower branch decreases monotonically with the increase of the degree of thermal nonlocality, and the power of the upper branch increases faster than the decrease of the power of the lower branch (Fig.1). When the degree of thermal nonlocality and the thermal nonlinearity coefficient are fixed, the increase of the degree of reorientational nonlocality, the critical power of optical solitons is first divided into two power branches, and the power of the upper branch decreases monotonically with the increase of the degree of reorientation nonlocality, while the power of the lower branch increases monotonically with the increase of the degree of reorientational nonlocality. When the value of the degree of reorientation nonlocality increases to a certain value, the critical power of optical solitons branches coincide into one, and the critical power of optical solitons decreases monotonically with the increase of the degree of reorientational nonlocality (Fig.2). When the degree of reorientational nonlocality and the degree of thermal non-locality are fixed, the increase of the thermal nonlinearity coefficient, the critical power of optical solitons is first divided into two branches, and the upper branch decreases monotonically with the increase of the thermal nonlinearity coefficient, while the lower branch increases monotonically with the increase of the thermal nonlinearity coefficient. When the thermal nonlinearity coefficient increases to a certain value, the critical power of optical solitons branches coincide into one, and the critical power of optical solitons decreases monotonically with the increase of the thermal nonlinearity coefficient (Fig.3). Finally, the beam propagation method shows that only the (1+2) dimensional solitons corresponding to the points on the unequal power branch can be stable propagation, and the solitons corresponding to the points with the equal power of the two branches cannot be stable propagation (Fig.4).Conclusions According to the model proposed by JUNG P S et al, the propagation characteristics of (1+2) dimensional optical solitons in nematic liquid crystals with competing nonlocal nonlinearities are studied. The analytical expression of the critical power of the soliton is given by the variational method, and it is found that the critical power of the soliton is related to the degree of reorientational nonlocality, the degree of thermal non-locality and the thermal nonlinearity coefficient of the material. The beam propagation method shows that only optical solitons and dipole solitons corresponding to the points on the unequal power branch can propagate stably in competing nematic liquid crystals, and optical solitons and dipole solitons corresponding to the points with the equal power of the two branches cannot be stable propagation.
Oct. 25, 2024Vol. 53 Issue 10 20240234 (2024)
Ronghua LI, Xinchen ZHOU, Chuanxin WENG, Haopeng XUE, Jinlong WU, and Chenyu LIN
ObjectiveDifferent targets have different material parameters on their surfaces. In the physical property inversion of targets, the contact measurement method is difficult to be carried out in complex environments, while the non-contact measurement method, due to certain errors in the measurement data compared with the contact measurement, causes the inversion accuracy to be affected. Therefore, it is necessary to propose a surface physical property inversion method for non-contact targets.MethodsIn this paper, a non-contact target surface physical property inversion method of infrared laser echo is proposed (Fig.1). The laser echo intensity measurement system is built (Fig.7). First, six materials (Fig.4) and seven measurement distances were selected. Through the 4.6 μm infrared laser transmitter, the laser is launched to the material at a certain distance away, and after the reflection of the material surface, the laser echo intensity information is collected by the receiver to establish a database of the laser echo intensity on the material surface; second, the SSA-GRNN neural network is used to obtain the prediction model of the laser echo intensity on the material surface; lastly, the echo intensity information of the unknown material is measured, and by assigning the material Finally, the echo intensity information of the unknown material is measured and input into the prediction model by assigning the material type, calculating the error between the predicted echo intensity value and the real value, and obtaining the material number with the smallest error to invert the material properties of the unknown target surface.Results and DiscussionsThe measured echo intensity data were used to train the SSA-GRNN echo intensity prediction model, and the model established by the SSA-GRNN generalized regression neural network not only has strong generalizability, but also has high accuracy. The echo intensity data on the surface of the unknown target at five distances are measured (Tab.3), and the predicted values of echo intensity as well as the results of physical property inversion are obtained by assigning the material type number to material 1 as an example (Tab.4). The experimental results (Fig.10) demonstrate that the root mean square error of the echo strength prediction results is reduced from 11.337 for the conventional network to 2.482 for the optimized one with the same inversion target. The relative inversion accuracy of the optimized neural network model can reach more than 88.89%, and the average inversion accuracy is improved by 45.83% compared with the traditional method, which is a better inversion effect.ConclusionsAiming at the current material physical property inversion using contact measurement and the existence of low inversion accuracy and other problems, a non-contact target surface physical property inversion method based on infrared laser echo is proposed. The inversion method proposed in this paper effectively solves the problem of local optimal solution in the traditional GRNN network inversion. At the same time, this paper adopts the non-contact target surface echo intensity measurement method, through the infrared laser irradiation of the target surface, the laser echo intensity signal is collected, and the target surface echo intensity data are calculated. Compared with the traditional contact echo intensity measurement, the distance is nearer and the environmental requirements are higher, the non-contact echo intensity measurement in room temperature environment is realized. The overall inversion method of the article has certain robustness and universality, which is of great significance for inverting the surface physical properties of non-cooperative targets. Since the 4.6 μm infrared laser transmitter is used in this paper, the next step is to choose infrared light sources in other wavelength bands to analyze the effect on the laser echo intensity on the target surface and verify the applicability of the laser echo intensity physical properties inversion method in different wavelength bands.
Oct. 25, 2024Vol. 53 Issue 10 20240217 (2024)
Chunjiang LIU, Yunhao ZHANG, Zheqiang ZHONG, and Bin ZHANG
ObjectiveThe space-based gravitational wave detection system utilizes laser transmission among three satellites for interferometric measurements to detect gravitational waves. This necessitates the space-borne telescope to have transmitting and receiving functions. However, when the space- borne telescope emits laser beams, inevitable backward scattering occurs due to the surface roughness of its ultra-smooth optical components (surface roughness less than 1 nm), which cannot be perfectly smooth. This backward scattering unavoidably decreases the detection accuracy of the signal light. Consequently, the level of backward stray light from the space- borne telescope needs to be below 10-10 to meet the requirements of gravitational wave detection. This presents significant challenges in measuring and suppressing the scattering characteristics of ultra-smooth optical components.In traditional non-contact surface roughness measurements of optical components, methods such as white light scattering and laser reflection interference are used to determine the surface profile of optical elements, followed by surface roughness calculations. However, these methods involve complex setups and high costs. For relatively smooth optical component surfaces, existing techniques such as Total Integrated Scattering (TIS) method and Angle-Resolved Scattering (ARS) Method based on optical scattering principles, exhibit low measurement accuracy. Therefore, existing methods for measuring surface characteristics parameters of optical components are inadequate to meet the measurement requirements of ultra-smooth optical components. There is a pressing need to develop prediction methods suitable for the surface characteristics parameters of ultra-smooth optical components to meet the high-precision requirements of gravitational wave detection systems.MethodIn response to the measurement requirements of ultra-smooth optical components, the method for measuring the surface scatter rate of highly reflective optical elements based on dual-channel optical cavity decay technology was proposed by LI B C. This method utilizes the optical cavity decay signals obtained from two channels to determine the surface scatter rate of the optical element being tested, offering distinct advantages such as absolute measurement, immunity to fluctuations in light source amplitude, and high measurement accuracy. Leveraging this method, we further combine the GBK scalar scattering model and the optical cavity decay method to propose a prediction method for surface characteristics parameters of ultra-smooth optical components. Specifically, this method involves using dual-channel optical cavity decay technology to ascertain the surface scatter rate of the optical element, followed by establishing a series of equations linking the surface scatter rate with surface roughness and autocorrelation length using the GBK scalar scattering model. By employing this approach, the surface roughness and autocorrelation length of ultra-smooth optical components can be obtained through numerical solution of the equations. This methodology aligns with the requirements for swift and precise measurement of surface roughness in ultra-smooth optical components.Results and DiscussionsTo validate the applicability of the prediction method, a series of optical components with different surface characteristic parameters were predicted (Fig.5), and relative error curves of predicted surface roughness and autocorrelation lengths of the components under different surface characteristic parameters were obtained (Fig.6). From the curves, it can be seen that within the range of 0.1064 nm to 1.064 nm for surface roughness, the relative error of the predicted values consistently remains within 1%. Similarly, for autocorrelation lengths falling within the range of 1064 nm to 3192 nm, the relative error of the predicted values consistently stays within 1%. This indicates that the proposed prediction method exhibits good adaptability and effectiveness within the specified range of surface characteristic parameters.ConclusionsA prediction method for surface characteristics parameters of ultra-smooth optical components based on the GBK scalar scattering model has been developed. The results indicate that this method predicts the surface roughness and autocorrelation length of ultra-smooth optical components with high accuracy. This work enhances and diversifies the swift and high-precision measurement of surface roughness in ultra-smooth optical components, offering valuable insights for measuring surface characteristic parameters in telescope systems designed for space gravitational wave detection.
Oct. 25, 2024Vol. 53 Issue 10 20240232 (2024)
Xizhen HAN, Zhengang JIANG, Yuanyuan LIU, Jian ZHAO, Qiang SUN, and Jianzhuo LIU
ObjectiveHyperspectral images can acquire continuous spectral bands integrated into a three-dimensional data set, which is rich in spectral information and capable of distinguishing different types of materials. They are widely used in various remote sensing surveying fields. However, with the rapid development of deep learning, hyperspectral image classification has made great progress, but still faces some difficulties. The annotation of hyperspectral images requires a significant amount of manpower, financial resources, and time. And the number of available labeled samples is limited, making it difficult to achieve accurate classification results through training. Therefore, the classification of hyperspectral images with only a small number of labeled samples is a challenge. Researching hyperspectral image classification in scenarios with few samples is of great practical significance for promoting the application of hyperspectral technology.MethodsIn recent years, Self-supervised Learning (SSL) has emerged as an effective approach to reduce the reliance on costly data annotation for hyperspectral image classification. SSL methods have achieved high classification accuracy in natural image classification by learning latent features that arise from different views of the same image. To explore the potential of SSL methods in hyperspectral image classification, a self-supervised hyperspectral image classification method under the Bootstrap Your Own Latent (BYOL) framework, referred to as BSSL, has been proposed. This method leverages the self-supervised image feature learning framework of BYOL, which can train the network and fine-tune parameters without the need for negative sample pairs, utilizing spatial-spectral similar pairs of the same category to extract more discriminative features. Specifically, the method mainly includes four parts: pre-training of BYOL, superpixel clustering, re-training of BYOL based on similar pairs, and final classification. In the BYOL model, the encoder employs a spectral-spatial transformer network to extract joint spatial and spectral features. The superpixel clustering utilizes a global measurement method for superpixel clustering based on binary edge maps, which can achieve more accurate clustering effects in edge areas. On the basis of clustering spatial features, the spectral similarity is calculated using the Spectral Angle Distance, ultimately obtaining a set of similar pairs for retraining the BYOL and fine-tuning the network parameters. Finally, classification is performed using a classical Support Vector Machine classifier.Results and DiscussionsTo verify the effectiveness of the proposed method, tests were conducted on three public datasets and compared with five advanced unsupervised and self-supervised classification methods: SuperPCA, S3PCA, ContrastNet, SSCL, and N2SSL. On the Indian Pines and Salinas datasets, the BSSL method achieved superior values in overall classification accuracy (OA), average classification accuracy (AA), Kappa coefficient, recall, and f1-score (Tab.1, Tab.3). Specifically, on the Indian Pines dataset, the OA was improved by 1.32%, 1.05%, 5.68%, 3.12%, and 1.27% compared to SuperPCA, S3PCA, ContrastNet, SSCL, and N2SSL, respectively. On the University of Pavia dataset, while the BSSL method did not perform as outstandingly, it still demonstrated the best overall classification performance (Tab.2). This is because, although the University of Pavia dataset has a considerable number of samples for each category, the distribution is quite scattered, and some ground object category areas are elongated, which is very unfriendly to superpixel segmentation.ConclusionsA BYOL-based self-supervised learning for hyperspectral image classification method (BSSL) was proposed. The method, by referencing the self-supervised feature learning framework BYOL, can train and fine-tune the network using spatial-spectral similar intra-class sample pairs, thereby extracting more discriminative features. The experimental results demonstrate that the BSSL method exhibits superior classification performance across all three datasets. It also indicates that the method is more suitable for scenarios where the area of the ground objects is relatively large and the distribution is more concentrated, as this is more favorable for superpixel clustering.
Oct. 25, 2024Vol. 53 Issue 10 20240215 (2024)
Kemin YAO, Junwei XU, Ximin TIAN, Kun XU, Linjie FU, Liang PAN, Yuhang JI, and Xiaoyu PAN
ObjectiveMetasurfaces, a planar optical element composed of subwavelength structural units, can flexibly tailor the phase, amplitude, polarization, and frequency of the optical field, providing a robust platform for the integration and miniaturization of optical components. Metalenses stand out as a crucial application of metasurfaces, with achromatism playing a key role in ensuring high imaging quality. Nonetheless, the existence of metacell resonances with varying dispersions and restricted resonance bandwidths causes metalenses to display considerable chromatic aberrations when functioning beyond the specified wavelength range, thereby hampering their utility in multi-wavelength or broadband applications. To tackle this challenge, this paper proposes a novel design strategy for visible broadband achromatic and polarization-insensitive metalenses, guided by the Rayleigh criterion principle for resolving the focal spot. By leveraging the theory of conjugate phase spin multiplexing design, a composite metacell element of metalenses is constructed using two differently-sized anisotropic TiO2 nanofins that operate efficiently at two distinct edge wavelengths, with their rotation angles limited to 0° or 90°. Through the complementary dispersion effects between the two nanofins, this design achieves wideband achromatism and polarization-insensitive focusing performance in the visible light spectrum (λ=470-650 nm), while maintaining high focusing efficiency. This advancement marks a significant step forward in the realm of broadband achromatic metalenses and paves the way for potential applications in compact, chip-level devices.MethodsInspired by the Rayleigh criterion for spot resolution, this work presents a novel design strategy for visible broadband achromatic and polarization-insensitive metalenses. By utilizing the Pancharatnam-Berry (PB) phase and leveraging the theory of conjugate phase spin multiplexing, we construct metalenses using two sets of anisotropic TiO2 nanofins that operate efficiently at two distinct edge wavelengths, with their rotation angles constrained to 0° or 90°. Through the complementary dispersion effects between the two nanofins, this design successfully achieves wideband achromatism and polarization-insensitive focusing performance in the visible light spectrum (λ=470-650 nm), while maintaining high focusing efficiency.Results and DiscussionsThe simulated normalized intensity distributions in the x-z planes for the designed broadband achromatic metalens under left circularly polarized (LCP) light incidence across the visible spectrum, ranging from 470 to 650 nm (Fig.2(a)). The results indicate that the center of the focal spot of the broadband achromatic metalens remains close to the predetermined focal length (indicated by the white dashed line) at approximately 40 μm throughout the visible spectrum, thereby confirming the feasibility of the proposed broadband achromatic design. The normalized intensity distributions along the x=0 cross-section of the designed broadband achromatic metalens, sub-metalens 1, and sub-metalens 2 under LCP light incidence at different wavelengths (Fig.3(a)-(c)). It is evident that the focal length of the designed broadband achromatic metalens remains close to the preset focal length of 40 μm. The designed metalens maintains a focusing efficiency of approximately 40% across the entire visible light spectrum, resulting in an average efficiency value of 38.2% (Fig.4). According to the quantitative analysis (Fig.5(b)), the maximum focal length shift of the designed metalens under different polarization states of incident light is only 4.5%, which is nearly negligible. Furthermore, an examination of the peak intensities, full widths at half maximum (FWHMs), and focusing efficiency of the focal spots generated by incident light with varying polarization states (Fig.5(c)-(d)) reveals that the metalens designed in this work exhibits strong robustness to the polarization state of the incident light.ConclusionsIn summary, inspired by the Rayleigh criterion for focal spot resolution, this paper proposes a novel design strategy for broadband achromatic and polarization-insensitive metasurfaces tailored for the visible light spectrum. By utilizing a pure phase-based approach and employing the theory of conjugate phase spin multiplexing, we construct a composite metasurface element composed of anisotropic TiO2 nanofins of two different sizes, with their rotation angles constrained to 0° or 90°, optimized for efficient operation at two distinct edge wavelengths. The simulation results demonstrate that, through the complementary dispersion effects between the two nanofins, this metasurface achieves broadband achromatism and polarization-insensitive focusing performance across the visible spectrum (λ=470 to 650 nm), while maintaining high focusing efficiency (with a maximum efficiency of 43.6% and an average efficiency of 38.2%) alongside diffraction-limited performance. Compared to existing broadband achromatic metalenses, the micro-nano structures involved in this study are simpler and more amenable to large-scale fabrication, offering a new approach for developing broadband achromatic and polarization-insensitive metasurfaces, with potential applications in ultra-compact chip-level devices.
Oct. 25, 2024Vol. 53 Issue 10 20240310 (2024)
Zefu XU, Jingjing WANG, Guanzhong ZENG, Di XIE, and Huajun FENG
ObjectiveCompared to the appearance-based method, Pupil Center Corneal Reflection (PCCR) method has higher accuracy, and has great significant application value in fields such as human-computer interaction and AR/VR. However, the existing researches mainly discuss the structural forms of eye tracking devices such as single camera single light, single camera multiple light, and multi camera multiple light, lacking quantitative hardware layout optimization methods. At the same time, in the PCCR method, the cornea is considered as a spherical surface, while human cornea is not ideal spherical, only the central part of it can be approximated as spherical. Especially when the distance between the light sources is too far, it can cause glints at the edge of the cornea, where the cornea is not spherical. The main solution is to make the glints as close as possible to the spherical area of the cornea, but if the distance between the light sources is too close, significant calculation errors will emerge. Therefore, optimizing the light layout of eye tracking devices has strong practical significance, when the distance between light sources is mutually constrained.MethodsThe method of computer simulation is used to theoretically calculate the average error of gaze estimation under different light layout, thereby deriving the optimal light source position. The main simulation process is divided into three parts, including eye imaging, gaze estimation based on simulation images, and construction of loss functions. The non spherical surface of the human cornea is considered in the content of eye modeling and imaging, which is closer to the actual human cornea. A typical pinhole model with superimposed distortion is adopted in the camera imaging model. For the optical axis reconstruction in gaze estimation, a typical optical axis reconstruction method suitable for single camera multi light devices has been adopted, which first estimates the corneal center position and then calculates the gaze optical axis. In the loss function, the error statistics of uniformly distributed test points are used as comprehensive evaluation indicators to calculate the iteration step of the light source position.Results and DiscussionsDifferent devices have different optimal light layouts, due to different camera focal lengths, installation positions, and user eye parameters. As an example, typical human eye parameters are used, and the optimal light layout for different forms of devices is discussed for both head mounted and desktop devices. In head mounted devices, the light source can be distributed in a circular pattern, and 7 discrete positions around the eye are taken as rough positions. After obtaining the optimal discrete position sets from 42 sets (Fig.14), as the initial value for optimization, the optimal light position can be iteratively optimized. Similarly, the light source of desktop devices is distributed in a linear pattern at the bottom of the screen. 8 discrete positions are taken and the optimal set of discrete positions is obtained from 64 sets (Fig.16). Then, the optimal light position can be iteratively obtained. The quantitative results indicate that there is an optimal position for the light source, and it can improve the accuracy of gaze estimation. Compared to existing studies, the results obtained by this method are more quantitative, and the ellipsoidal cornea is closer to the human cornea.ConclusionsThe PCCR method is an effective method for gaze estimation, but the cornea is considered as a sphere, which limits the accuracy. A quantitative optimization method of light layout has been proposed, and a framework for light layout optimization has been established, which can optimize different optimal light layouts according to actual application settings. At the end, typical system parameters are simulated, and the results show that the distance between the light sources is not necessarily better as it is larger or smaller. There is an optimal light source position that can suppress the error increase caused by ellipsoidal corneal. The simulation results can also serve as a theoretical reference for corresponding device design.
Oct. 25, 2024Vol. 53 Issue 10 20240209 (2024)
Yuan WANG, Chen YANG, Shijie LI, and Jin ZHANG
ObjectiveThe imaging quality of compound eye optical system is affected by many factors, such as material performance changes, processing and adjustment errors, optical and mechanical structure deformation and so on. As a key integrated component in the compound eye optical system, the dimensional accuracy of the spherical cover determines the positioning accuracy between the relay cylinders and the spherical lens. Generally, considering the weight reduction of the overall system, there is a preference for thinning its wall thickness. However, when the wall thickness is thinned to a certain extent, the thermal deformation of the spherical cover structure increases due to ambient temperature fluctuations, and its impact on the image quality of the compound eye system can not be ignored. In the process of optical system design, usually based on the designer's experience and processing level, using the method of tolerance analysis, by observing the sensitive items and pass rate to realize the performance stability prediction of optical system before actual processing is not perfect. In aerospace and missile guidance, the use of digital photography combined with sensors can also achieve high-precision monitoring of thermal deformation, but it requires actual sampling, which cannot achieve the purpose of pre manufacturing prediction. It is hoped that the basic strategies and findings of this study can help to predict the stability of the same type of compound eye optical system and provide an effective reference for the structural design of the spherical cover.MethodsA 3×3 array compound eye optical system is designed by using Zemax software, which is mainly composed of spherical concentric objective lens system and relay system(Fig.1). Because the light from the spherical concentric objective lens is a concentric beam, the influence of thermal deformation is small. In the rear relay camera array, if the optical axis of the sub camera is not concentric, the imaging quality will be seriously affected. Therefore, the spherical cover, a thin-walled structure with high accuracy requirements, is selected as the research object of thermal deformation. Based on the structural parameters, the spherical cover model is established in Solidworks and imported into Hypermesh for structural mesh generation (Fig.4). Imported into ANSYS Workbench, the position information and deformation data of the key nodes on the edge of the mounting hole on the spherical cover are extracted through the finite element steady state thermal structure coupling analysis, and the thermal deformation data is obtained through data processing, which is converted into the error of the corresponding optical system and inversely returned to the structure of the optical system, so as to realize the simulation of the impact of the thermal deformation of the structure on the imaging quality of the system.Results and DiscussionsA method is proposed to predict the influence of thermal deformation of spherical cover structure caused by ambient temperature change on the imaging quality of compound eye optical system. The MTF of the single channel of the designed compound eye optical system is higher than 0.4 at the spatial frequency of 100 lp/mm, the maximum distortion of the system is 0.309%, and the wavefront aberrations of different wavelengths and fields of view are less than 0.25 λ (RMS), meeting the requirements of general imaging system(Fig.2). The position information and deformation data of the key nodes at the edge of the mounting hole on the spherical cover are extracted by ANSYS Workbench (Fig.9), and the thermal deformation of the spherical cover in a stable temperature environment (30-100 ℃) is simulated. The thermal deformation is converted into the corresponding optical system error and introduced into the initial compound eye optical system structure to realize the secondary evaluation of the system performance (Fig.8), which provides an effective reference for the structural design of the spherical cover.ConclusionsThe thermal deformation of the spherical cover is converted into the error of the corresponding optical system and introduced into the compound eye optical system structure. The results show that the thermal deformation of the spherical cover will lead to the maximum deformation of 0.424 mm (Fig.5) and the tilt error of -0.367°-0.270° along the axis of the relay sub camera, and the tilt error is the key factor affecting the image quality of the compound eye optical system. The thermal expansion of the structure mainly presents a "bulge" shape, and the closer to the center (except for the central hole position), the greater the tilt error, resulting in a more significant decline in image quality. The application ambient temperature of the designed compound eye optical system should not be greater than 70 ℃.
Oct. 25, 2024Vol. 53 Issue 10 20240225 (2024)
Yuan PENG, Hongda WEI, Yang LIU, Jianwen ZHANG, Weijie DENG, and Qiang FU
ObjectiveInfrared optical systems used in the military field sometimes need to operate in a wide temperature range of nearly 200 ℃. In this temperature range, the optional types of infrared optical materials are further reduced, and the thermal defocusing phenomenon of the system will be more serious, which leads to the difficulty of the optical system to complete a good non-thermal design. To address this challenge, diffractive elements with unique thermal and achromatic properties are added to the design of optical systems, and a material selection method for secondary imaging systems is proposed. Based on the ideal optical system, the objective lens group and the relay lens group in the optical system are equivalent to the mirror group composed of two single lenses by the equivalent lens theory, and then the material selection of the two mirror groups is completed by the non-thermal map. After in-depth analysis and evaluation, it is determined that the optimal material combination of IRG24 and ZnS for objective lens group is IRG22 and IRG24 for relay mirror group. According to the combination of materials and the distribution of focal power of the ideal optical system, a set of medium-wave infrared optical system is designed. The working wavelength of the system is 3.7-4.8 μm, the field of view is 10°× 8°, the F number is 2, the focal length is 55 mm, the total length of the system is about 115 mm, and the cold stop efficiency reaches 100%. In the range of 20-220 ℃, the modulation transfer function (MTF) of the whole field of view is close to the diffraction limit, and good imaging performance is maintained.MethodsAn optical system capable of good imaging in the temperature range of 20 ℃ to 220 ℃ has been established (Fig.4). The optical system adopts the method of secondary imaging. In order to better correct the advanced color difference and achieve the miniaturization of the system, diffractive elements and higher-order aspheric surfaces are added to the optical system. Finally, MTF function is used to evaluate the imaging quality of the system (Fig.9).Results and DiscussionsAccording to the design index of infrared optical system and the design principle of light miniaturization and high energy transmission rate, it is decided to choose refractive secondary imaging system as the initial structure. According to a new material selection method, the material combination of IRG24-ZnS-IRG22 was selected as the glass material of the optical system. Aspheric surfaces were introduced in the system optimization process to ensure good imaging effect and correct advanced aberrations at high temperature. Finally, it can be seen that the MTF function values of the system are close to the diffraction limit in a wide temperature range, which meets the demand of good imaging. After setting a good tolerance value, the quality of the system can still meet the requirements of use.ConclusionsAiming at the problem that it is difficult to maintain good imaging performance of infrared optical systems operating in a very wide temperature range. Diffraction elements with good performance of heat dissipation and achromatic properties are used to strengthen the heat dissipation ability of the system. In terms of material selection, this paper presents a material selection method for secondary imaging system. Firstly, by constructing an ideal optical system, the parameters of optical elements and the height of paraxial rays are obtained. Then, combining these data with the equivalent lens theory, the objective lens set and the relay lens set are regarded as two single lens systems. On this basis, the material combinations of objective lens group and relay lens group were selected by using non-heat map. Based on this material combination, the optical system is designed. Based on this, the design of the optical system is completed. The optical system consists of only four lenses and one diffractive surface, and the total length of the system is only 115 mm, which meets the miniaturization requirements of the system. The modulation transfer function reaches the diffraction limit and achieves the goal of maintaining good imaging performance in a wide temperature range. Compared with the existing optical systems, this study expands the operating temperature range of the optical system while miniaturizing the system, showing its application potential in near-space hypersonic vehicles. In the next step, the system will be machined to verify its imaging performance in a real-world environment.
Oct. 25, 2024Vol. 53 Issue 10 20240240 (2024)
Haixin ZHANG, Qingyu MENG, Jiangnan WANG, Meichen LIU, and Lei LI
ObjectiveThe testability of mirror surface shape error is a fundamental requirement for high-precision optical systems from design to application, failure to test means that it can't be manufactured. Currently, many optical system design methods focus on improving system performance and imaging quality. The public reporting on methods for directly assessing surface shape error testability during the design process is limited. Traditionally, the design of optical systems and the testing of optical elements often occur sequentially, without direct feedback on the testability during optical design. For high-performance optical systems, this can lead to the situation where the system design is excellent, but the difficulty of element testing is too high, resulting in bottlenecks in the practical application. Integrating relevant theoretical methods for testing into the process of optical systems design is an important way to solve the testability of optical component surface shape error. This approach has significant implications for reducing testing difficulties, fully exploring the potential of optical design and improving the feasibility of optical systems.MethodsIn theoretical research, the research starts with the design of an off-axis three-mirror optical system as the theoretical entry point, using Computer Generated Holograms (CGH) as the test tool for optical element surface shapes error. Based on the surface shape characterization equation and CGH testing principles, mathematical relationships between the optical design parameters and CGH-related parameters are derived. This relationship act as a bridge for the testability of optical system surface shapes, thereby establishing a design method for off-axis three-mirror optical systems based on surface shape testability evaluation. In the design validation stage, an off-axis three-mirror optical system with a focal length of 800 mm, an F-number of 4, and a field of view of 14°×2° is taken as an example to validate the proposed design method based on surface shape testability evaluationResults and DiscussionsThe final result of the off-axis three-mirror optical system is shown in Figure 10. The system meets the requirements for image quality and design specifications, with the value of the Modulation Transfer Function (MTF) at 100 lp/mm exceeding 0.4 across all fields of view. Using this design method, the minimum line width of CGH used to test the system's tertiary mirrors has been increased from 4.84 μm to 14.34 μm, enhancing both the testability of optical system surface shapes and the manufacturability of CGH.ConclusionsBased on the principles of CGH testing and the surface characterization equations of optical elements, mathematical relationships between optical system design parameters of optical systems and the relevant parameters of CGH have been derived and a design method for off-axis three-mirror optical systems based on surface shape testability evaluation is proposed. Using this method, an off-axis three-mirror optical system with a focal length of 800 mm, an F-number of 4, and a field of view of 14°×2° was designed. The system shows good image quality, with MTF values exceeding 0.40 at 100 lp/mm across all fields of view. The design results demonstrate that compared to conventional off-axis three-mirror optical systems, this design method not only ensures imaging quality but also achieves calculation and control of the CGH-related parameters. It significantly enhances the testability of surface shapes and holds certain significance in reducing the difficulty of optical element testing and improving the feasibility of optical systems.
Oct. 25, 2024Vol. 53 Issue 10 20240323 (2024)
Qiang ZHANG, Baoyu YANG, Zhipeng GUO, Yuhan LI, Junfei LI, and Yinong WU
ObjectiveIn recent years, infrared technology has been widely used in space remote sensing and military reconnaissance. In order to meet the high performance requirements of infrared detectors, on-orbit real-time calibration is needed. The blackbody radiation source system is the key device for calibrating infrared instruments. The blackbody studied in this paper is used in the FY-3 satellite Medium Resolution Spectral Imager (MERSI), its operating temperature range is 260-320 K. The low temperature of 260 K is achieved by connecting the blackbody to the radiation heat dissipation plate through a heat pipe, and the high temperature of 320 K is achieved by heaters attached to area outside the installation area of the heat pipe at back of the blackbody. Due to the large thermal flow difference between the cold source and hot source at back of the blackbody, it is hard to maintain good temperature uniformity of the blackbody. To solve this problem, the idea of applying a whole layer thermal insulation material to the blackbody uniform temperature structure (UTS) was proposed. And the characteristics of good UTSs and the structure of the optimal UTS were obtained.MethodsA simulation environment was established based on the surrounding environment of the black body in the FY-3 MERSI (Fig.2). Based on the simulation environment, a simulation model was built on NX/TMG and verified by experiments (Fig.4). Then, different UTSs using copper plate (Cu), thermal pyrolytic graphite (TPG) and polyimide (PI) were designed and analyzed by the simulation model. Performance of different UTSs were compared by temperature differences and average temperatures of the blackbodies.Results and DiscussionsSimulation analysis and comparison of different UTSs were carried out. The results show that the optimal 4-layer UTS is “2TPG-Cu-PI”, compared with the UTSs without PI, the temperature difference can be reduced from 0.232 K to 0.156 K (Fig.5). The optimal 5-layer UTS is “3TPG-Cu-PI”, compared with the 5-layer UTSs without PI, the temperature difference can be reduced from 0.162 K to 0.112 K (Fig.6); while compared with the optimal 4-layer UTS, the temperature difference is decreased by 0.044 K (Fig.5-Fig.6). The optimal 6-layer UTS with 0 or 1 layer of PI is “4TPG-Cu-PI”, compared with the 6-layer UTSs without PI, the temperature difference can be reduced from 0.114 K to 0.086 K (Fig.7(a)); While compared with the optimal 5-layer UTS, the temperature difference is decreased by 0.026 K (Fig.6, Fig.7(a)). The optimal 6-layer UTS with 2 layers of PI is “2TPG-PI-TPG-Cu-PI”, compared with the 6-layer UTSs with 0 or 1 layer of PI, the temperature difference can be reduced from 0.086 K to 0.070 K (Fig.7).ConclusionsIn this study, the idea of applying a whole layer thermal insulation material to the blackbody UTS was proposed, and different UTSs were designed and analyzed. It was found that when using 1 layer PI, the temperature differences basically decrease as the PI moves downward; When the PI is at the bottom layer, the temperature difference is the smallest and the average temperatures are higher than the structures without PI. In addition, among the UTSs having the same PI position, the ones with PI right below Cu are the best. When using a 6-layer UTS with 2 layers of PI and the same PI positions, the optimal UTSs have two characteristics. The preferential one is that there are 2 layers of high thermal conductivity materials between the PIs; The other is that there are 2 layers of high thermal conductivity materials near the blackbody side. The optimal UTS is “2TPG-PI-TPG-Cu-PI”, with which the blackbody temperature difference can be reduced to 0.07 K. This result is much better than 0.25 K for similar blackbodies in published literatures. This study improves the temperature uniformity of spaceborne blackbodies significantly. It also expands the thermal control design idea for objects that require high temperature uniformity and provides new possibilities for further improving the temperature uniformity of temperature control targets.
Oct. 25, 2024Vol. 53 Issue 10 20240202 (2024)
Yunhong LI, Bin CAO, Xueping SU, Jinni CHEN, Limin LI, Gang ZHANG, and Yaolin ZHU
ObjectiveNon-contact infrared imaging thermometry, as an advanced temperature measurement method, holds significant application value in military security, medical health, industrial production, fire detection, and prevention. To address existing issues such as low accuracy and high costs in current infrared thermal imaging, a precise temperature measurement system utilizing MLX90640 infrared array imaging has been developed. This system incorporates an improved least squares curve fitting temperature compensation model and to enhance temperature measurement accuracy. This implementation ensures more efficient system processing and cost-effectiveness.MethodsCollecting object temperature information through the MLX90640 infrared array detector involves gathering data on the temperatures of objects using this technology. The improved bilinear interpolation algorithm is used to expand the temperature data to enhance the display of infrared image detail features. The system temperature calibration and calibration are performed using the BR125 blackbody calibration source for 30 ℃ to 100 ℃, and various temperature test data are collected at different set distances (Tab.1). It is found that the temperature error gradually increases with the increase of the measuring distance, showing a certain linear relationship (Fig.5). Exponential, linear, and second-order polynomial fitting models are established for temperature errors, and the temperature error fitting curve is optimized by comparing the determination coefficients of different temperature error fitting models (Tab.2) to establish a temperature correction optimization model (Tab.3) and estimate the true temperature of the object, achieving accurate prediction of the estimated infrared temperature values at different distances. The uncertainty of the experimental results is analyzed, and uncertainty analysis is carried out in the temperature range of 30 ℃ to 100 ℃. By analyzing the average temperature difference and average standard deviation, the reliability of the experimental results is verified. Results and DiscussionsThe experimental results show that within the measurement range of 0.2 to 1.2 m, the temperature error after temperature compensation does not exceed 1.0 ℃ (Fig.6). The average temperature error before correction was 5.70 ℃, reduced to 0.24 ℃ after correction, indicating a significant improvement in accuracy post-compensation compared to before. Uncertainty analysis of the temperature compensation model (Tab.4) reveals an experimental average temperature difference of 0.339 ℃ and an average standard deviation of 0.848 ℃ (Tab.5), consistent with expected experimental outcomes, validating the accuracy of the temperature measurement method and the reliability of the proposed model. Prior to system optimization, the edges of the infrared images were blurry; However, after optimization, the imaging system produced more realistic results, with smoother depiction of object edges. Comparison of the infrared image display before and after system improvement shows that the optimized infrared images appear more realistic. The algorithm improves edge smoothness and maintains clarity of object edge details significantly better than the original system. Image curves are more continuous, enhancing overall image quality. By employing enhanced image processing techniques, the algorithm achieves high-resolution images from low-resolution infrared inputs while reducing computational complexity, thereby improving processing speed and reducing resource consumption.ConclusionsCompared to traditional temperature measurement methods, the infrared imaging accurate temperature measurement system has significant advantages, enabling precise non-contact temperature measurement of objects. In contrast to single-point temperature measurement methods, infrared imaging temperature detection provides more comprehensive and rapid measurement of object temperatures, allowing real-time observation of temperature distribution within a specific area. The system design enhances the visual effects of infrared images, while the proposed temperature correction model greatly reduces system temperature measurement errors and conducts uncertainty analysis of experimental results. The thermal imaging temperature measurement system offers high real-time performance and accuracy, providing high-resolution infrared images for precise localization of heat sources. It holds significant application value in fire detection and prevention, security monitoring, and detection of electrical circuit faults causing overheating.
Oct. 25, 2024Vol. 53 Issue 10 20240269 (2024)
Jie MA, Xiaobing WANG, Qinglin NIU, and Shikui DONG
ObjectiveAfterburning of rocket exhaust plumes releases a large amount of heat, which significantly raise the temperature level and infrared radiation intensity of the plume and reduce the stealth capability of the vehicle. Therefore, it is very important to accurately predict the afterburning process of the rocket exhaust plume for finely describing the multi-component reaction flows and to improve the calculation accuracy of the infrared radiation of the exhaust plume. The high-fidelity chemical reaction kinetic model is often used to describe the chemical non-equilibrium afterburning reaction of high-speed flow field. Due to the uncertainty of the parameters of the afterburning chemical model, the reliability of the simulation results of the infrared radiation signature of the plume will be affected. This article will quantitatively study the uncertainty of the reburning reaction rate to evaluate its impact on the exhaust plume flow field parameters and infrared radiation characteristics. Based on this, the key reactions that affect the uncertainty of infrared radiation are extracted and reconstructed. This study can provide theoretical support for accurately predicting the infrared radiation characteristics of the exhaust plume.MethodsThe finite rate chemical reaction model expressed by Arrhenius equation was adopted, and it was a H2/CO/HCl system with the 12-species 17-reaction chemical reaction kinetic model. The Latin hypercube sampling (LHS) method was employed to design the sampling of uncertain input parameters. The physical property parameters of the exhaust plume radiation were calculated using the statistical narrow-band (SNB) model. The radiative transport equation was solved employing the light-of-sight (LOS) method. Additionally, uncertainty analysis of the reacting flows and infrared radiation of rocket exhaust plumes were conducted using the No-polynomial Chaos Expansions (NIPC) method and the Sobol index algorithm. Results and DiscussionsThe maximum uncertainty of the chemical reaction rates on the temperature of the flow field is about 7.63% (Fig.5(a)) and the temperature difference along the plume centerline between the reference value and the mean value calculated by NIPC is up to 6.45% (Fig.6(a)). The maximum standard deviation of the molar fraction of CO2 is 0.001 2 and the uncertainty is about 2.5% (Fig.5(b)). The maximum standard deviation of the molar fraction of H2O is 0.012 3 and the uncertainty is about 10.7% (Fig.5(c)). The uncertainty of infrared radiation intensity within the 2.7 μm band is about 20.4%, which is 7.8% higher than that in the 4.3 μm band (Fig.7-Fig.8). The sensitivity of chemical reaction rate to infrared radiation intensity shows that three chain reactions of H+O2↔OH+O, H2+O↔OH+H and H+OH+M↔H2O+M are the main contributors (Fig.9).ConclusionsThe uncertainty of the afterburning chemical reaction rate on the flow field structure, temperature and gas mole fraction is small and the uncertainty is negatively correlated with the standard deviation. The uncertainty of chemical reaction rate to infrared radiation is higher than that of flows, the uncertainty of 2.7 μm is the highest and the uncertainty of different bands is different. All the 17 reactions have different effects for the infrared radiation, and the sensitivity of the three chain reactions to infrared radiation is the largest. Based on the reaction rate experimental data, the chemical kinetic rates of the three chain reactions are reconstructed and the relevant parameters are given.
Oct. 25, 2024Vol. 53 Issue 10 20240301 (2024)
Guofang XIE, Jin DUAN, Jialin WANG, Qiang FU, Su ZHANG, Juntong ZHAN, and Yuze QIN
ObjectiveThe distribution of particles in the marine atmospheric medium environment is different. When the laser is transmitting through the sea fog, these unavoidable environmental factors have an un-negligible impact on the detection of marine targets and the polarization information transmission. In recent years, it has become a research hotspot to investigate the transmission characteristics of polarized light in complex environments. At present, the disadvantages of analyzing the transmission characteristics include simulations and experiments only for a single type of particle. To further explore the polarization transmission characteristics of polarized light in the multilayer sea fog environment, this paper improves the traditional Monte Carlo model based on the stratification of the marine atmosphere, and designs and builds the multilayer sea fog environment simulation device for experiments.MethodsThe marine atmosphere is divided into three regions and a multilayer Monte Carlo simulation model is established. Photons will be scattered and collide with the particle groups in different regions, namely, salt fog, water fog, and aerosol. Based on the particle formation process in the marine atmosphere environment, as shown in Fig.3, a multilayer sea fog environment simulation system device was designed and built (Fig.6). Changing the wavelength or polarization state of the laser, the relationship between the change of environmental humidity and the degree of polarization (DOP) was explored.Results and DiscussionsThe analysis of the simulation data in Fig.2 shows that for different incident light wavelengths of the same polarization state, the DOP of the 671 nm wavelength is generally higher than that of the 532 nm and 450 nm wavelengths. With the increase of humidity, the DOP of the three wavelengths is gradually decreasing, the longer the wavelength, the more obvious the advantage. For different polarization states in the same wavelength, the DOP of the circularly polarized light is generally higher than that of linearly polarized light. The trend of the test results and simulation results in Fig.7 is the same, which shows the high degree of conformity between the two, and the experimental device has a certain practical value.ConclusionsBy preparing varieties of particles in the marine atmosphere and designing and constructing a multilayer sea fog environment simulation system device according to the characteristics of various particles, laser transmission test experiments were carried out under controlled conditions. The simulation and test results show that the system can more realistically reflect the influence of the sea fog environment on the polarized light transmission. It provides data support and theoretical support for the subsequent research on polarization transmission.
Oct. 25, 2024Vol. 53 Issue 10 20240205 (2024)
Zhenglong LEI, Qiang MENG, Chen WANG, Xudong LI, Runfeng ZHANG, and Shuo YANG
Objective In laser cleaning, quality monitoring is the current focus of research, traditional quality inspection (visual inspection, chemical analysis, etc.) has the disadvantages of low inspection accuracy, high damage to the substrate, complicated process, high cost, and prone to human error., acoustic signal detection as a new detection method has non-destructive characteristics, without direct intervention in the substrate. In addition, in the cleaning process can be real-time detection, the cleaning process of the abnormal situation can be timely response, high sensitivity, easy to deploy and maintain. At present, the acoustic signal detection laser cleaning of the relevant research for the cleaning material is mainly rust (metal oxides), paint, oil and other inorganic substances, and the research focuses on the principle of detection and feasibility, has not yet established a relationship between acoustic signals and cleaning effect, less research on laser cleaning of marine microorganisms using signal detection, so this study is important for the management of metal-organic pollution of the ocean engineering.Methods This article builds an acoustic signal acquisition system (Fig.2). The system consists of a laser (model YLPN-10-30×240-200-R), a microphone, and a sound card (UR22C) to capture acoustic signals during laser cleaning of marine microbial on the surface of high-strength steel (30Cr3).First, the acoustic signal is pre-processed for noise reduction, then the Fourier transform is performed to plot the waveform in the time-frequency domain, and the four characteristic quantities of short-time average amplitude, Root-Mean-Square (RMS), Kurtosis factor, and Instantaneous frequency are extracted.Then a series of characterization of the metal surface before and after cleaning, such as the removal of thickness, roughness, and the degree of damage to determine the cleaning effect. The relationship between acoustic signals and cleaning quality is established through the correspondence between the characteristic quantities and the cleaning effect.Results and Discussions Through extracting the acoustic signal feature volume and corresponding to the cleaning effect characterization results, the results of the analysis show that the acoustic signal short-time average amplitude can reflect the thickness of microbial removal, the larger the short-time average amplitude, the larger the thickness of the microbial layer removed, the acoustic signal time-domain crag factor and the root-mean-square can reflect the degree of roughness of the cleaned surface, with the increase of the energy density, the crag factor firstly decreased and then increased, the root-mean-square value firstly increased and then With the increase of energy density, the Kurtosis factor decreases and then increases, the root mean square value increases and then decreases, and the inflection points of the two eigenvalues are close to each other, and the roughness reaches the minimum value at the inflection point, and the cleaning effect is good. Under the larger energy density, the instantaneous frequency of the acoustic signal can reflect the degree of laser damage to the substrate after cleaning, and the more low-frequency components in the transient frequency, the greater the damage to the substrate and the more the average hardness decreases.Conclusions There is a "main peak" signal in the frequency domain graph of the acoustic signal of short-pulse laser cleaning, The short-time average amplitude, Kurtosis factorr and root mean square, and instantaneous frequency of the acoustic signal can reflect the thickness of removal, roughness, degree of substrate damage, respectively. As shown in Fig.6, when the short-time average amplitude value is 0.013, the microbial layer on the surface is removed by 1 μm, which reaches the "start cleaning threshold". As shown in Fig.10, when the acoustic signal Kurtosis factor reaches 2.01, the cleaning effect is good and reaches the "optimal cleaning threshold".
Oct. 25, 2024Vol. 53 Issue 10 20240262 (2024)
© Copyright 2018-2021 | Chinese Laser Press.
All Rights Reserved 沪ICP备15018463号-20