


 View fulltext

2023
Volume: 52 Issue 5
43 Article(s)

Ting Yu, Chunhui Niu, and Yong Lv
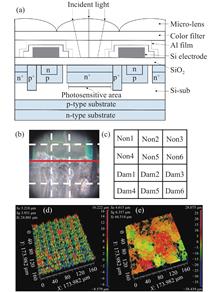
ObjectiveCharge Coupled Devices (CCD) is a common photoelectric sensor for acquiring image information in photoelectric warfare. In photoelectric warfare, active detection, optical performance analysis and damage status assessment of enemy CCD device are the prerequisites for effective implementation of photoelectric warfare. At present, there are few studies on CCD damage status and damage grade assessment based on the detection echo information, and the actual assessment is affected by the complex environment. The CCD damage status has a complex nonlinear relationship with the "cat's eye" echo intensity and polarization degree which can’t correctly judge whether the CCD is damaged or not based on the intensity and polarization value alone. Therefore, it is considered to use multi-source information fusion method to carry out research on CCD damage status assessment, that is, combining the characteristic information of multiple CCD to obtain the optimal estimation.MethodsCombined with multi-source information fusion technology and machine learning, three models of KNN, K-SVM and PNN suitable for nonlinear data classification and discrimination are used to study the assessment method of CCD damage status. Among the three assessment methods, the KNN method uses the category of the proximity point to predict the category, the K-SVM method uses the hyperplane to predict the category and the PNN method uses a posterior probability density to predict categories.Results and DiscussionsThe near- and long-distance "cat's eye" echo detection experiments were carried out respectively, and the echo intensity, polarization degree information and CCD actual damage information were used as input data to train the three models respectively (Tab.3), and the assessments of the three models were compared including the number of errors in the assessment points, the error rate and the assessment time (Fig.5-6), which show that the error rates of KNN and K-SVM fluctuate within 4%, and the error rate of PNN fluctuates within 2% during the five random test sets. The selection of test sets has a great impact on the KNN and K-SVM, but the error rate of PNN is relatively stable which does not affect the PNN. The assessment effect of different scenarios is compared by using the average value of the results of five random test sets (Tab.4), and the near-distance experiment assessment effect is close, with the average error rate of 2%-3%; the average error rate of long-distance experiment assessment is 7%-12%, in which the average error rate is the lowest and prediction time is short, but the stability is not good as K-SVM; the average error rate of mixed data assessment is 10%-14%, in which PNN has the lowest average error rate and good stability, but the prediction time is about twice that of other methods.ConclusionsPNN model with the optimal smoothing factor had the lowest error rate in the complex outdoor environment, considering the allowable time range of the actual assessment, the PNN model was most suitable for use based on application of CCD damage status assessment of "cat's eye" echo information. The PNN model has better comprehensive assessment effect than the other two methods and has the best stability in the comprehensive environment. The research results are an exploration of laser damage status assessment, which is conducive to improving the assessment ability of the detection target and the intelligent degree of the system, and provides a new idea for the non-contact laser active detection and assessment technology and improving the defense and strike ability of the weapon system.
May. 25, 2023Vol. 52 Issue 5 20220537 (2023)
Hang Li, Gaoliang Peng, Hongzhao Lin, and Zhao Chen
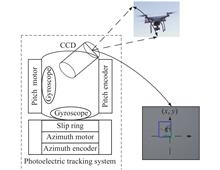
ObjectivePhotoelectric tracking system (Acquisition, Tracking, and Pointing, ATP) is a kind of equipment that uses photoelectric technology to realize the pointing and tracking of the target. It has the characteristics of high measurement and tracking accuracy. The existing ATP system usually carries precise optical systems and detectors, which can accurately locate, track and aim the target. For high-speed target tracking system, the time delay of sensor feedback such as image becomes the main factor that restricts the upper limit of tracking speed of the system. The delay link of system feedback has become the bottleneck restricting the improvement of ATP system's tracking ability. Therefore, an improved tracking feedforward control method is proposed based on sensor fusion prediction to solve the problem of ATP tracking high-speed targets.MethodsFirstly, the CCD and high-precision encoder are fused with sensor data, and the target motion state is tracked according to the differential tracking principle to obtain the high-order information of the target motion, and the noise caused by the difference is greatly reduced. Secondly, a reduced-order CA model is proposed to reduce the computation and estimation parameters, and compensate the pure delay link of miss distance according to the Kalman filter principle to obtain the low-delay target motion state information. Thirdly, the least-squares polynomial fitting is performed only by combining the results of the previous moment, which avoids the problem of ill conditioned matrix in the least-squares, and can greatly reduce the calculation amount of fitting, and realize the expansion of CCD feedback from low frequency signal to high frequency signal. Finally, according to the prediction results and higher-order motion information, a tracking feedforward control loop is designed to improve the response speed and tracking ability of the system.Results and DiscussionsA new control method for ATP system to track high-speed targets is proposed. The high-order motion information of the target is obtained through sensor fusion, and the Kalman prediction based on the reduced-order CA model is carried out. The input deviation after prediction compensation is shown (Fig.12), and the error is reduced by about 88.22%; Combining the least-squares fitting at the previous moment, the problem of ill conditioned matrix in the least squares is avoided, and the expansion of data signal is realized to ensure the data stability of the system.ConclusionsAn improved tracking feedforward control method is proposed based on sensor fusion prediction, aiming at the problem that the feedback frame rate of CCD camera in the photoelectric tracking system is low and the delay is large, resulting in poor tracking ability and response ability of high-speed targets. The simulation results and experimental results show that the tracking error caused by image lag can be greatly reduced without changing the closed-loop stability of the control system when tracking high-speed targets. The actual test results show that the tracking error after compensation is about 83.67% less than the tracking error before compensation. This method can more effectively compensate the image delay, improve the system control bandwidth, and provide an effective idea for the high-performance tracking control of ATP system.
May. 25, 2023Vol. 52 Issue 5 20220665 (2023)
Tiesuo Gao, Tao Jiang, Mingsong Ding, Qingzong Liu, Aoxiao Fuyang, Yong Xu, Peng Li, and Weizhong Dong
ObjectiveHypersonic vehicle travels at a very high speed in atmosphere. Due to the high flight velocity, hypersonic vehicle has to endure very high heating rates on surface, ablative material is widely used in the design of thermal protection system (TPS). During the ablation process, gaseous ablator species are injected into the flow field, these gaseous species can involve inflow air in the chemical reaction, which changes flow field species distribution and temperature distribution, thus changing the target infrared radiation characteristics of hypersonic vehicle. Infrared radiation characteristics are the foundation of aircraft detection, identification and interception. Therefore, it is necessary to study the effect of thermal protection material ablation on aircraft target infrared radiation characteristics. For this purpose, this paper focuses on strategic warhead blunt body configuration with carbon-based thermal protection material. Numerical simulation of flow field and its infrared radiation is conducted, ablation effects on infrared radiation of flow over reentry body are discussed.MethodsNumerical simulation of flow field is conducted by solving three-dimensional thermal-chemical non-equilibrium Navier-Stokes equations. To simulate the surface ablation effect, surface velocity boundary condition, surface mass balance condition and surface energy balance condition are introduced into the computation process of flow field simulation. Oxidation, catalytic reaction and sublimation reaction of surface ablation material are also taken into account. To simulate the chemical reactions in the flow field, chemical reactions model of high temperature air with gaseous ablator species is used. Based on spectral band radiation model and by solving high temperature gas radiation transport equation, numerical simulation of flow field infrared radiation is conducted, the radiation mechanism of NO, CO, CO2, CN, N2, O, N is considered. Results and discussionNumerical simulation results at typical condition agree well with experiments and numerical simulation results in literature (Fig.1-3), the computation model and method are validated. The main ablation product on surface is CO, infrared radiation in the waveband of 0.8-8 μm of flow field mainly comes from the radiation of high temperature CO, NO, CO2 and CN (Fig.4). Ablation effect can increase flow field infrared radiation intensity, this phenomenon is more significant in 3-8 μm waveband than 1-3 μm waveband (Fig.5). Radiation from 3-8 μm waveband mainly comes from CO and NO, mass fraction of these species and flow field temperature increases as flight altitude decreases and flight velocity increases. Due to this, the radiation of 3-8 μm waveband increases as the flight altitude decreases and flight velocity increases (Fig.7-8). Radiation from 1-3 μm waveband in flow field around vehicle body increases as flight velocity increases, the radiation from 1-3 μm waveband in wake flow shows nonmonotonic variation due to the change of flow structure (Fig.7-8). ConclusionsIn this paper, the ablation effects on infrared radiation of flow over reentry body covered with carbon-based thermal protection material is studied. By solving high temperature gas dynamics equations and radiation transfer equations, numerical simulation of thermal protection material ablation flow field and its infrared radiation is conducted. The distribution and changing rules of infrared radiation in different wavebands from ablation flow are analyzed. The study shows that ablation effect has significant influence on infrared radiation of reentry flow, which makes integral radiation intensity of wake flow increase more than one order of magnitude compared with non-ablation case in 3-8 μm waveband; The infrared radiation of ablation flow mainly comes from CO, NO and CO2, and the ablation effect has less effect on the radiation in 1-3 μm waveband; The infrared radiation intensity of ablation flow increases with the decrease of reentry height at the same flight velocity, which weakens with the decreasing reentry velocity at the same flight height in 3-8 μm waveband.
May. 25, 2023Vol. 52 Issue 5 20220606 (2023)

Junting Yu, Shaoyi Li, Ping Zhang, and Zhenyu Luo
SignificanceIn recent years, various military powers are actively applying AI technology to precision-guided weapons, and have made certain technological breakthroughs, such as the development of LRASM anti-ship missiles, "maritime destroyers", "SPICE-250" precision-guided bombs and other intelligent weapons and equipment to improve the operational effectiveness of complex battlefield environments. In the process of realizing the intelligence of precision-guided weapons, the significant improvement of the performance of imaging terminal guidance technologies such as autonomous perception of complex battlefield environment, automatic target acquisition (ATA), automatic target recognition (ATR), adaptive guidance and so on depends on the deep fusion application of artificial intelligence technology. Therefore, the research on the intelligent technology of imaging terminal guidance and its future development direction has important reference significance for following the development trend of guidance mode and realizing the revolutionary improvement of weapon operational performance.ProgressFirstly, the development status of typical photoelectric imaging terminal guidance equipment for sea-to-sea, ground-to-ground and air-to-air, the different complex interference environments and target characteristics faced by the terminal guidance process are analyzed. The typical terminal guidance intelligent information processing principles such as small target detection in the long-range target interception stage, identification, tracking and anti-interference in the medium-close target tracking stage, and identification of key parts at the end of the close range in three scenarios are analyzed. Secondly, the development status and intelligent equipment achievements of intelligent technology of terminal-guided weapons in the United States, Israel, Norway and other foreign countries are summarized, and the intelligent technology principles in automatic target recognition, track planning and other aspects are analyzed, as well as the combat requirements of intelligent weapons in the future complex combat mode, including the significant improvement of target survivability, the increasingly complex and changeable task environment, and the increasingly fierce confrontation environment. Finally, this paper proposes several key technologies for the intelligent requirements of future electro-optical imaging terminal guidance weapons: distributed/heterogeneous autonomous collaborative detection capabilities, multi-dimensional information intelligent fusion processing capabilities, battlefield environment awareness and situation understanding capabilities, detection and guidance integration and autonomous decision-making capabilities, self-learning self-evolution self-reasoning capabilities, collaborative identification and collaborative anti-interference capabilities. At the same time, it is proposed to divide the intelligence of imaging terminal guidance into three stages: functional intelligent technology, system-level single intelligent technology, and system-level group intelligent technology.Conclusion and ProspectsThis paper analyzes the challenges brought by future high-performance targets, complex confrontation environments, multi-task requirements, and new combat modes to the intelligence of imaging terminal guidance technology. Starting from artificial intelligence technology and future combat requirements, six capability feature requirements and three development stages for realizing intelligent imaging terminal guidance are proposed. Through the development analysis of foreign imaging terminal guidance intelligent technology, it provides reference for the development of intelligent technology of photoelectric imaging terminal guidance weapons in China.
May. 25, 2023Vol. 52 Issue 5 20220725 (2023)

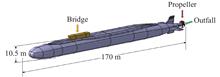
Analysis of airborne infrared detection performance of submarine thermal wake in stratified seawater
Yingchao Li, Ze Pan, Guanlin Li, Haodong Shi, and Qiang Fu
ObjectiveAt present, most of the calculation methods for thermal wake detection by MRTD analysis consider the water body as uniformly distributed seawater. The stratified nature of seawater temperature and density has great influence on the inversion accuracy of submarine thermal wake on the surface temperature distribution, rise time and wake rise distance. However, the research at home and abroad mainly focuses on the improvement of MRTD algorithm of infrared system or derivation of the detection ability of infrared detector based on other parameters of the system, as well as the influence of weather and other factors on wake detection, and has not analyzed the influence of seawater stratification on wake detection and inversion. Therefore, the research on infrared radiation detection of thermal wake under the conditions of stratified seawater temperature and density is of great significance to the infrared detection of submarines.MethodsFor the lack of infrared detection of submarine thermal wake under the condition of stratified sea water temperature and density, the calculation error of detection distance and inversion accuracy error of submarine are large. Based on the finite element analysis method, the research on submarine infrared radiation characteristics under the condition of seawater stratification is carried out in this paper. Firstly, the finite element analysis method is used to simulate the floating process of submarine thermal wake in stratified seawater by a full-size submarine model with propeller and bridge characteristics. Then, according to the sea surface infrared radiation model and atmospheric transmission model, the full-link mathematical and physical model of the wake from floating diffusion, atmospheric transmission atmospheric attenuation to sensor detection is built, and the detection distance of the infrared detector to the submarine thermal wake under the condition of layered seawater is calculated according to the specific infrared detector performance parameters.Results and DiscussionsThe comparison shows that the stratification condition of seawater has a great influence on the detection of wake. With 95% detection probability, the detection distance of the wake increases by 10.61%, the identification distance of the wake increases by 9.32%, and the recognition distance of the wake increases by 8.28% (Tab.2). In the case of stratified water, the wake is presented as a cold wake on the water surface. The temperature difference between the cold wake and the sea surface is 0.152 K larger than that between the hot wake and the sea surface in the case of non-stratified water. The submarine travels 340 m forward without stratified seawater and 101.8 m under stratified seawater temperature and density. Compared with seawater stratification, the inversion error of submarine without stratification reaches 238.2 m, and the wake temperature difference on the surface is not only 0.152 K, but also cold wake phenomenon. It can be seen that the seawater stratification condition has a great influence on the submarine's inversion accuracy, and even directly leads to incorrect results.ConclusionsThe mathematical and physical model of the wake from floating diffusion, atmospheric decay to full link of sensor detection under the condition of seawater temperature and density stratification is established. The influence of seawater temperature and density stratification on the wake floating speed, the detection distance of the infrared detection system to the wake and the inversion error of the wake are obtained by simulation calculation. That is, it takes 101.8 s for the wake to rise to the surface at 50 m under the condition of stratified seawater temperature and density. Under the same conditions, when the seawater is not stratified, the time taken for the wake to rise to the surface is 340 s, which is much longer than that for the stratified seawater. This is due to the lower underwater temperature of the stratified seawater and the large density difference conducive to the floating of the hot wake. The discovery distance of the delaminated water body wake is 6.451 km, the identification distance of the wake is 1.631 km, and the recognition distance of the wake is 0.824 km. The unclassified detection distance, identification distance and recognition distance are 5.832 km, 1.492 km and 0.761 km, respectively. Compared with seawater delamination, the inversion error of submarine wake is 238.2 m without delamination, the temperature difference of wake on water surface is 0.152 K, and the cold and hot wakes on sea surface are different.
May. 25, 2023Vol. 52 Issue 5 20220741 (2023)
Zhiyuan Zhou, and Baosen Shi
SignificanceIn this paper, spectrum transducing detection of infrared light with silicon detectors is systematic reviewed. Traditional infrared detection is based on semiconductor photonic detectors, such as AsGaIn and HgCdTe. These detectors have low detection sensitivities and relatively high noise at room temperature, and deep cooling is required to get better sensitivity. While the detection performances of silicon detectors are much better than those of the infrared detectors. Therefore, an effective method to detect infrared light is to transfer the wavelength of the infrared light to the detection window of silicon detector. Based on this principle, spectrum transducing detection of infrared light with silicon detectors is developed by using frequency up-conversion via sum frequency generation. This new detection scheme has the potential to offer single photon detection sensitivity at room temperature, which is very promising to be used in remote sensing at infrared regime.ProgressThe main progress for spectrum transducing detection of infrared light can be divided into two groups. The first group is aimed at improving the key parameters in frequency conversion, which are quantum efficiency, noise, frequency bandwidth and spatial bandwidth. The conversion efficiency in frequency transducing can be enhanced by using cavity and waveguide (Fig.4), both configurations are demonstrated to achieve near unity internal conversion efficiencies; Noise in frequency conversion is mainly caused by spontaneous Raman scattering and parametric down conversion of strong pump beam, which can be measured at different pump configuration, and some effective methods can be used to sufficiently reduce the noise. These methods include: long wavelength pump laser, narrow band filters and reduction of the operation temperature of the nonlinear crystals. The frequency bandwidth is strongly dependent on the phase matching conditions, therefore effective methods such as chirped poling and multi-angle cut crystal can be used to enhance the frequency bandwidth in frequency conversion (Fig.5). The spatial bandwidth is dependent on crystal dimensions and phase matching, crystals with large optical aperture and large phase matching angles are preferred for spectrum transducing detection of image with large field of view, about 30 degree field of view is realized in mid-infrared up-conversion based on chirped PPLN crystal (Fig.6). The second groups of progresses aimed at applications of the spectrum transducing detection in different fields, these fields are: single photon detection at mid-infrared regime and quantum frequency interface (Fig.7) for applications in quantum information processing; classical optical imaging such as large field of view and high frame rate imaging in the mid-infrared regime, phase contrast imaging (Fig.8) and spectrum analysis for material sciences.Conclusions and ProspectsFor the mutual restrictions between different key parameters in spectrum transducing detection, one need to balance between different parameters for specific applications. Though the performance of spectrum transducing detection at the near infrared regime is high enough for some mentioned applications, the performances at mid-infrared is still not satisfied for typical applications, great efforts should be taken to improve the performance at this wavelength regime. For imaging detection based on spectrum transducing plane detectors, most studies are focused on coherent illumination, many key problems for illuminating with large bandwidth incoherent blackbody radiations are still not solved yet. In summaries, there are still opportunities for researches inspectrum transducing detection, these opportunities are: (1) to extending quantum optics and quantum spectroscopy to mid-infrared regime; (2) by combining spectrum transducing in interferometers to realize detection of infrared signal with undetected photons and optical phase amplification; (3) to transduce all other spectrums to the detection windows of silicon detectors and greatly reducing the detection complexity in large optical systems.
May. 25, 2023Vol. 52 Issue 5 20230165 (2023)

Fahua Shen, Xuekang Li, Jiangyue Zhu, Chenbo Xie, Bangxin Wang, Liangliang Yang, Hui Zhou, and Hua Xu
ObjectiveThe high spectral resolution lidar (HSRL) based on Rayleigh scattering spectroscopy is currently one of the most effective equipment for remote sensing of atmospheric temperature below 20 km. Traditional HSRL for temperature measurement requires a single longitudinal mode laser source, which leads to the defects of high system cost, poor environmental adaptability and low laser energy utilization. Therefore, it is of great scientific significance and practical application value to study atmospheric temperature detection technology with high detection accuracy, high spatial and temporal resolution, strong environmental adaptability and low cost. For this purpose, the HSRL with multi-longitudinal mode (MLM) laser, i.e. MLM-HSRL technology based on two-stage Fabry-Perot interferometer (FPI) for temperature measurement is proposed and studied.MethodsThe temperature detection principle of MLM-HSRL based on two-stage FPI is analyzed (Fig.1). The theoretical model of temperature detection is constructed accordingly, and the measurement error formulas of temperature and backscatter ratio are derived. The frequency matching and locking conditions are studied, and the temperature measurement deviation caused by frequency matching error and locking error is analyzed. The frequency matching calibration method and steps based on the combination of FPI cavity length coarse scanning and fine scanning are presented (Fig.5-6). The MLM-HSRL system parameters (Tab.1) are designed, and its detection performance is simulated using the 1976 USA atmospheric model and simulated cumulus and cirrus clouds.Results and DiscussionsThe frequency matching condition is that the longitudinal mode interval of the MLM laser is an integer multiple of the free spectral spacing of the two-stage FPI. When this condition is satisfied, the MLM temperature measurement is equivalent to the superposition of each single longitudinal mode (SLM) temperature measurement. The analysis results show that the larger the backscatter ratio is, the greater the temperature measurement deviation caused by the same frequency matching error and locking error is; the frequency matching error has a great impact on temperature measurement; the frequency matching error and locking error should be less than 5 MHz and 10 MHz, respectively (Fig.4). The simulation results of MLM-HSRL detection performance show that in the altitude of 0-20 km, the temperature measurement deviation caused by the frequency matching error and locking error is usually very small, and it can be neglected above 2 km; If there are clouds, dust, etc., this deviation will be larger at the corresponding altitude (Fig.8); When the vertical resolution is 30 m at 0-12 km and 60 m at 12-20 km, and the time resolution is 1 min, the temperature measurement errors caused by noise during the day and night are below 3.7 K and 3.5 K, respectively, and the backscatter ratio relative measurement errors are below 0.40% and 0.38%, respectively (Fig.9).ConclusionsA MLM-HSRL technology for temperature measurement based on two-stage Fabry-Perot interferometer (FPI) is proposed and studied. This technology requires that the longitudinal mode spacing of the laser source is matched with the free spectral spacing of the two-stage FPI, and the center frequency of each longitudinal mode is locked at the peak of the periodic spectrum of the first stage FPI. When the frequency matching condition is satisfied, the MLM temperature measurement is equivalent to the superposition of each SLM temperature measurement. The frequency matching error and locking error will cause additional temperature measurement error, and they should be less than 5 MHz and 10 MHz, respectively, in order to ensure the accuracy of the low-altitude atmospheric temperature measurement, which can be achieved through frequency matching calibration. The simulation results show that the MLM-HSRL system based on this technology is capable of measuring temperature and backscatter ratio at the altitudes up to 20 km with high accuracy in all weather. These conclusions fully demonstrate the feasibility of this technology.
May. 25, 2023Vol. 52 Issue 5 20220573 (2023)
Aiqin Tu, Zhenzhu Wang, Hengchang Li, Qibing Shi, Hai Zhang, Dong Liu, and Ningquan Weng
ObjectiveTropospheric ozone is an important greenhouse gas and a pollutant harmful to organisms. It not only affects the radiation balance of the ground-atmosphere system, but also seriously endangers the ecological environment. When the near-ground ozone concentration exceeds a certain threshold, it will cause a series of adverse effects on human health and the growth of animals and plants. Since the near-ground ozone concentration depends largely on the physical conditions of the upper layer atmosphere, it is of great significance to carry out vertical ozone detection and study the ozone distribution characteristics for the source analysis and pollution prevention of ozone. In recent years, the near-ground ozone concentration in Weifang has been increasing, especially in summer, which has replaced fine particles as the main pollutant. Therefore, the temporal and spatial distribution characteristics of ozone in Weifang during summer are analyzed in this paper.MethodsThe differences of ozone distribution under two different weather conditions of fine day and rainy day are studied through analyzing typical cases in this paper. In addition, in order to study the differences in ozone distribution at different times of the day, the time of a day was divided into four periods, namely morning transition, daytime, evening transition and nighttime, and the vertical distribution characteristics of ozone at each period were statistically analyzed. The low-altitude ozone concentration data used for the analysis was detected by the GBQ L-04 ozone lidar (Fig.1) produced by Hefei Zhongke Guangbo Quantum Technology limited company. The monitoring period is from June 1, 2020 to August 31, 2020. The monitoring location is located in Weifang Environmental Monitoring Center Station (119.15°E, 36.70°N).Results and DiscussionsThe daily variation of low-altitude ozone concentration on sunny days is distinct, while on rainy days it varies with the time of the day when precipitation occurs. Ozone pollution will not be too strong when precipitation occurs in the evening because of good production conditions and weak diffusion conditions for ozone during the day due to cloud cover and atmospheric convective motion. Conversely, if precipitation occurs in the morning and the sky clears after rain, daytime ozone pollution is less influenced by precipitation. When meteorological conditions such as radiation, temperature and humidity are similar, strong winds will significantly reduce the ozone concentration. Before rainfall, strong convective movement and gale will make the convective ozone layer thicker and the ozone concentration lower (Fig.2). Many interfering bright blocks appear on the ozone distribution map detected by radar during precipitation. This indicates that the results of ozone concentration detected by ozone lidar during precipitation are not reliable. On non-precipitation days, the convective ozone layer is mainly distributed below 1500 m, showing the characteristics of diurnal variation of high in the day and low at night, and the high concentration value often appears at 12-18 o'clock (Fig.3). This may be closely related to the photochemical process of near-ground and the atmospheric vertical diffusion. The convective ozone layer on non-precipitation days can be divided into several layers from up to down (Fig.4). This may be related to the thermal vertical structure of the atmosphere.ConclusionsThe distribution characteristics of ozone under typical weather conditions and the statistical characteristics of ozone on non-precipitation days in Weifang are analyzed with data detected by a differential absorption lidar in this paper. The research shows that meteorological conditions have a great impact on ozone distribution. On non-precipitation days, the convective ozone layer is mainly distributed below 1500 m. It increases with height between 300-500 m , and reaches a maximum near 500 m, which is basically consistent with the boundary layer height detected by the Mie-scattering lidar. The ozone concentration of each period of a day at 1500 m tends to be consistent, and there is no obvious diurnal variation up from this height. The ozone concentration in this layer can be used as the atmospheric background value in ozone forecast.
May. 25, 2023Vol. 52 Issue 5 20220579 (2023)
Yeqi Zhang, Zhenfu Wang, Te Li, Lang Chen, Jiachen Zhang, Shunhua Wu, Jiachen Liu, and Guowen Yang
ObjectiveHigh reliability becomes very important for the application of high-power laser diodes, and lifetime prediction is the primary aspect of reliability assessment of high-power laser diodes. Accelerated degradation test is a test method to accelerate the degradation process in the laboratory in accordance with the degradation model, which can obtain statistically significant lifetime prediction in a short time. With the advancement of device technology and its reliability, single-stress accelerated degradation test faces problems such as long test time, high cost, and excessive stress application in the degradation mechanism. Therefore, it is necessary to propose an accelerated degradation test for lifetime prediction of highly reliable and long-lived devices. For this purpose, a double-stress cross-step accelerated degradation technological method is designed in this paper.MethodsA double-stress cross-step accelerated degradation test is proposed. Aging test platform for high-power laser diodes was built (Fig.5). The device (Fig.4) was subjected to 1600 h accelerated degradation test, and the accelerated degradation data of optical output power under different stress conditions were collected (Tab.1). Performance degradation model was established to analyze the data with the accelerated model to obtain the lifetime prediction values, and the accuracy of the model was tested for significance (Tab.5).Results and DiscussionsThe overall scheme of high-power laser diodes lifetime prediction (Fig.1) has three main steps of bringing degradation data into the model, fitting the lifetime probability density distribution function, and checking accuracy. The double-stress cross-step accelerated degradation test sets the temperature and current as the stress conditions, and the two stress conditions are cross-stepped to form a total of four different stress conditions (Fig.2) as A [22 ℃, 1.4 A], B [42 ℃, 1.4 A], C [42 ℃, 1.8 A], and D [62 ℃, 1.8 A], respec-tively. The performance degradation model is built according to the YamaKoshi equation and the laser optical output power failure threshold is set. The acceleration model is established according to the generalized Irene model, and the degradation track of the optical output power during the accelerated degradation test is expressed as a segmentation function. After the estimation of the model conversion parameters, the lifetime prediction results were obtained and the parameter errors were compared (Tab.5), and they were all below 10%, which verified the accuracy of the model. ConclusionsThe accelerated degradation test of 12 830 nm F-mount single-emitter device was conducted for 1600 h using four different current-temperature double-stress conditions in cross-step by self-designed experimental platform. The MTTF of the device is 5 811 h. The accelerated test method used in this paper saves at least 57.7% of the test time compared with the conventional single-stress constant accelerated lifetime test method, and has the advantages of less sample size and more flexibility in stress conditions. The method has been experimentally validated to provide statistically significant results for device lifetime prediction with experimental cost savings for different high-power laser diodes.
May. 25, 2023Vol. 52 Issue 5 20220592 (2023)
Dongdong Han, Zeyang Fan, Kaili Ren, Yipeng Zheng, Tiantian Li, Zhanqiang Hui, and Jiamin Gong
ObjectiveUltrashort pulse laser technology develops rapidly, it has been applied in various fields, such as industrial materials processing, biomedical diagnostics, and terahertz generation. The passive mode-locked fiber lasers have the advantages of high efficiency and low cost, which are usually used to generate ultrashort pulses. The passive mode-locking technology includes many kinds of technologies, among which the nonlinear polarization rotation technology has the advantages of high damage threshold, large modulation depth and short response time, etc. However, the mode-locked fiber laser based on the nonlinear polarization rotation technology is sensitive to the polarization state of laser pulses. The K-means algorithm is a classic algorithm based on distance segmentation and clustering. It is terse and has fast convergence speed when analyzing large data sets. This paper realizes a passive mode-locked erbium-doped fiber laser with nonlinear polarization rotation technology and K-means algorithm, which can automatically find the fundamental frequency mode-locked pulse state.MethodsAn electric polarization controller with programmable motion is used to adjust the polarization state of the pulse in a passive mode-locked erbium-doped fiber laser. First, all angles of the electric polarization controller are traversed and the output pulse data at different angles are collected simultaneously. The fundamental frequency mode-locked pulse points are obtained through the pulse decision algorithm. Then, the fundamental frequency mode-locked points are clustered and analyzed using K-means algorithm. When the pulse is out of lock or in other states, a set of rotating paddle angles is fed back to the electric polarization controller through the K-means algorithm. At last, the fundamental frequency mode-locked pulse are exported from the laser.Results and DiscussionsBy properly adjusting the manual polarization controller and the electric polarization controller, a traditional fundamental frequency mode-locked pulse (Fig.3) is obtained, when the pump current is about 230 mA. The central wavelength of the spectrum is 1 531 nm with the pulse duration and fundamental repetition frequency of 0.96 ps and 9.847 MHz, respectively. 1102 mode-locked points are obtained with the pulse decision algorithm and displayed in the three-dimensional coordinate space (Fig.4). The classification result is optimum when the K value is set as 6 using the Silhouette Coefficient method (Fig.5). Therefore, the mode-locked points are divided into 6 categories using the K-means clustering algorithm (Fig.6). After 100 tests, the fastest, slowest and average time for finding the fundamental frequency mode-locked point is 0.11 s, 0.92 s, and 0.25 s, respectively (Fig.7). A comparative test is conducted by randomly changing manual polarization controller state, in order to test the applicability of the algorithm (Fig.8). ConclusionsThe proposed method can quickly find the fundamental frequency mode-locked pulse points in a mode-locked fiber laser based on nonlinear polarization rotation technology and K-means algorithm. The average time required to adjust from other states to the fundamental mode-locked point is 0.25 s in 100 tests. This method can rapidly realize the output of fundamental frequency mode-locked pulse, and provides a new scheme for realizing efficient and convenient automatic mode-locking of fiber laser.
May. 25, 2023Vol. 52 Issue 5 20220609 (2023)
Yan Jiang, Jingguo Zhu, Ruqing Liu, Feng Li, Chenghao Jiang, Zhe Meng, and Yu Wang
ObjectiveIn the application of pulse laser detection, peak detection circuit is usually used to obtain target intensity information for object detection and recognition. Due to the inherent characteristics of pulse laser that the laser beam has a divergence angle, so that the light spot has a certain area. When the laser passes through some partially reflected or partially occluded multi-layered objects in space, multiple echoes will be generated and some of the echoes which are above the detection threshold will be received by the detection system. In order to avoid the echo interference generated by penetrable occluded objects and enhance capability of system recognition, the pulse laser detection system needs to be able to capture the multiple echoes, while the traditional peak detection circuit cannot accurately detect the peak values of multiple echoes. As an important functional module in the pulse laser detection system, many research institutions have carried out a lot of relevant researches. Most of them focus on improving the detection accuracy and response speed of single echo peak, while the researches on multiple echoes peak detection are relatively few.MethodsAccording to the requirements of pulse laser detection in complex scenes application, a smart pulse multi-echo peak detection circuit chip with high integration is designed based on the theory of pulse multi-echo peak detection. The chip uses a two-stage peak detector sample and hold circuit structure, which can realize the narrow pulse detection and maintain signal for a long time. Furthermore, it adopts interleaved sampling technology to reuse the first stage circuit for the rapid acquisition of narrow pulse signal, and then applies the multi-channel holding circuit of the second stage to maintain the signal for a long time, realizing the peak detection of multi-echo signal (Fig.4). The structure of the circuit module and time sequence of the logic control are described in detail (Fig.6-9). At the same time, through the error model of the peak detection circuit, the relationship between the output error of the peak detection circuit and the number of channels of the first stage circuit is simulated. The simulation result shows that the output accuracy of the peak detection circuit can be improved by simplifying and reusing the first stage circuit (Fig.5).Results and DiscussionsThe circuit was implemented and fabricated in a 0.18 μm CMOS process (Fig.10). The layout area of chip is about 2.6 mm×0.48 mm. Through actually carrying out test on the multi-echo experimental platform, the test results show that the output of each channel of the designed chip is normal (Fig.11). The proposed circuit can effectively detect pulse multi-echo signal with amplitude range of 50-500 mV and pulse width of 5 ns. The maximum error of the peak output is less than 4.8% (Fig.12), and the maximum relative error of output voltage between channels is 5.7% (Fig.13). The main parameters of the proposed peak detection circuit are compared with some similar works in the recently published papers (Tab.1). Compared with the published works, the main advantage of the designed circuit is that it can effectively detect the pulse multi-echo signal with ns-scale pulse width, and it has a low relative error. The total power consumption of the multi-echo peak detection circuit is similar to the other compared circuits.ConclusionsIn this study, a smart pulse multi-echo peak detection circuit chip with high integration is designed. The chip uses a two-stage peak detector sample and hold circuit structure and optimizes the circuit structure by adopting interleaved sampling and multiplexing techniques to realize peak detection of multi-echo signal. Compared with the common peak detection circuit, this designed scheme has more simplified circuit structure and lower relative error between channels. The test results show that the chip circuit has good linearity in the amplitude range of 50-500 mV for multi-echo pulses with 5 ns pulse width. The designed circuit can be integrated and applied to the pulse laser detection system, which makes the multiple echoes detection capability of the system more precise.
May. 25, 2023Vol. 52 Issue 5 20220625 (2023)
Jing Yang, Yuli Han, Xianghui Xue, Tingdi Chen, Yiming Zhao, and Dongsong Sun
ObjectiveThe wind field is one of the most critical impacts in the specifying stratospheric airships and plays a practical fundamental role in flying safety. The airship has attracted increasing interest and made it a tremendous potential of long-time fix-station residence missions at nearly the altitude range of the stratosphere bottom 18-22 km. Its integrating superiority, such as broad covering, and large load capacity, has been proven as effective and powerful operational buoyant platform to contribute to more accurate remote sensing of environment monitoring, resource exploration, and meteorological research. Due to the Earth’s periodic rotation, there is an extremely strong west wind region in low stratosphere while the wind speed changes along with the season, the latitude and longitude, and the height. The key challenges for applying a wind measurement system in the low stratosphere (20 km), which has significant differences from the terrestrial environment, are the low densities and the low pressures at the working height of the high-altitude airship. This represents a precise measurement that is essential to detect the atmosphere parameters of wind. For this purpose, a laser wind velocimetry system for the stratospheric airship is proposed.MethodsA compact laser anemometer is designed using dual-channel Fabry-Perot etalon to analyze Doppler shift due to high-speed thermal motion at molecular scale. Atmospheric molecular scattering mainly consists of a strong Rayleigh-Brillouin spectrum (Fig.1). The system generally consists of four major subsystems, which are the 532 nm fiber pulsed laser transmitter subsystem, the telescope subsystem, a photocounting detection (PD) subsystem and computer controlling subsystem (Fig.5). The liquid crystal phase variable retarder (LCVR) is chosen to be a controller between two lines-of sight (LOS) for the successive horizontal speed estimates with a novel non-mechanical structure in the detection. The radial wind velocity can be uniquely determined by measuring the ratio of the two channel edge signals of Fabry-Perot etalon.Results and DiscussionsIn the beginning of the experiment, it is an indispensable step of the laser anemometer system design and study that the theoretical parameters must be preliminarily confirmed (Tab.1). According to the thin air characteristics at the airship flying altitude of 20 km, the improvement of signal noise ratio (SNR) and velocity errors are simulated. Assuming the Doppler shift is 0, the FWHM of the outgoing laser spectrum is 400 MHz, and the low stratosphere temperature is set at 216.5 K. The radial wind measurement error as a function of the free spectral range (FSR) of the Fabry-Perot etalon is given (Fig.8). As shown, to fully analyze the Rayleigh-Brillouin spectrum, the free spectral range (FSR) of the Fabry-Perot etalon is chosen to be 6.5 GHz with the minimum error occurrence in the system (Fig.8). At the same time, the spectral spacing of the Fabry-Perot etalon is required to be 3.25 GHz due to the same velocity sensitivity for both molecular and aerosol backscattering (Fig.9). The SNR of more than 180 is obtained due to the fact that the spectral radiance value of the solar background is still very small in the daytime and nighttime (Fig.10). The velocity error is less than 1 m/s up to 500 m distance with wind velocity of 100 m/s (Fig.11).ConclusionsUsing dual-channel Fabry-Perot etalon with fixed cavity length for frequency discriminator and a 532 nm fiber pulsed laser, the structural design of the laser wind velocimetry was completed. The system referred to optical path of coherent wind measurement lidar and adopted monostatic telescope, which had no blind area and smaller receiving field of view, thus improving performance of all-sky detection. The polarization property of liquid crystal variable retarder was used to control direction of the detected optical path. The system performance of wind field detection was also analyzed. The average power of 500 mW laser, the integration time of 10 s, and the range resolution of 100 m during simulation are selected. The analysis results illustrate the maximum wind speed error of 1 m/s and wind direction error of 5° under the wind speed condition of larger than 10 m/s, respectively. The theoretical results highly meet wind detection requirements in navigation environment of stratospheric airships.
May. 25, 2023Vol. 52 Issue 5 20220642 (2023)
Jingpeng Zhang, Qihang Chen, Yanhui Wang, Lei Dong, Zhenzhen Zheng, and Wenxin Zhang
ObjectiveInverse Synthetic Aperture LADAR (ISAL) is an active imaging detection method. Its working principle is consistent with that of Inverse Synthetic Aperture Radar (ISAR). The signal works in the laser band (μm level), which obtains range high-resolution information by actively transmitting large broadband laser signals, and obtains azimuth high-resolution information through the virtual aperture formed by the movement of the target relative to the emitter. Relevant studies have evaluated and explored the ISAL imaging of GEO space targets, and there are also corresponding researches that have preliminarily analyzed the parameters of space-based SAL imaging. However, there is still a lack of detailed analysis and evaluation of ISAL imaging mode in LEO space. In this study, the performance analysis and feasibility of using space-based ISAL for skimming and flying-around imaging modes of LEO targets is explored to provide a basis for the study of space-based ISAL imaging of LEO targets.MethodsTwo kinds of observation modes, skimming and flying-around imaging modes, are set up. The skimming imaging mode is to use the natural rendezvous of ISAL payload satellite and target satellite for imaging. This imaging mode has many situations, such as co-orbital skimming and hetero-orbital skimming (Fig.1). Flying-around imaging mode means that during the target satellite rotating around the earth for one circle, ISAL satellite also orbits the target satellite for one circle (Fig.4). The key system indicators such as imaging resolution, coherent accumulation time (Fig.6-7), minimum pulse repetition frequency for unambiguous azimuth imaging (Fig.8) and SNR (Fig.9) for the two kinds of observation modes are comparedResults and DiscussionsFor the skimming imaging mode, all performance indicators of all rendezvous scenes under given parameters are within the range of both forward and reverse scenes on the same plane. The smaller the relative angular velocity is, the smaller minimum pulse repetition frequency for unambiguous azimuth imaging (PRF) and the higher the signal-to-noise ratio (SNR) are required, but coherent accumulation time required for imaging is increased, especially the revisit period will be greatly increased. Compared with the skimming imaging mode, the flying-around imaging mode can realize the continuous observation of the target, and the flying-around period is short, and can quickly obtain more abundant target information; Although the coherent accumulation time is longer, it is only 130-190 ms in the range of 300-2 000 km orbit height, which is completely feasible for engineering applications; The minimum unambiguous PRF is reduced by half and the SNR is higher.ConclusionsThe feasibility of using space-based ISAL to scan and fly around LEO targets is explored, and the key indicators of the system, such as imaging resolution, coherent accumulation time, minimum pulse repetition frequency for unambiguous azimuth imaging are analyzed and compared with the assumptions that meet the constraints of engineering application. Within the range of observation and simulation calculation of LEO targets, all indicators of the grazing imaging mode and the flying-around imaging mode are feasible for engineering application, and the flying-around imaging mode is applicable in rapid, high-resolution and all-directional continuous observation of important targets and high-value assets. The skimming mode is suitable for traversing and imaging the LEO target at the altitude of close orbit, so as to establish the feature library of the target.
May. 25, 2023Vol. 52 Issue 5 20220679 (2023)
Rui Wang, Bo Liu, Zhikang Li, Zhen Chen, and Hao Yi
ObjectivePhoton-counting lidar has the characteristics of high sensitivity and high time resolution. It can solve the application limitations and technical problems in traditional linear detection within a certain range, and the advantage is more obvious in long-distance detection. There are important applications in topographic mapping, autonomous driving, environmental monitoring, etc. However, when using single photon detection technology, the influence of background noise becomes non-negligible while the detection sensitivity is improved to single photon level. The arrival of noise photons in the active region of the Geiger mode avalanche photodiode detector may also trigger response. Therefore, in addition to the effective information for target imaging, the weak echo also carries a large amount of noise data. The noise photon count in the echo data is closely related to the size of the background noise. Although the narrowband filter module in the hardware system helps to reduce the interference of the background noise, the noise count generated in strong noise environment still restricts the improvement of image reconstruction quality. In order to realize the efficient extraction of target information in a large number of echo data and strong noise environment, an adaptive spatial-temporal correlation depth estimation algorithm is proposed.MethodsThe designed algorithm mainly completes filtering and depth estimation through three steps (Fig.2). Firstly, the algorithm analyses the photon statistical differences in the time domain based on the relationship between signal photons and noise photons in the echo data and laser pulse width, and reconstructs histogram with different time resolution adaptively. The size of the time window is adjusted adaptively to find the time interval where the signal photon is located based on the reconstructed histogram and the spatial correlation of neighboring pixels' photon counts data (Fig.2-3). This will significantly reduce the amount of subsequent processed data by only extracting the photon counts in the time window. Secondly, estimating the time information for each pixel by using the sliding window based on the extracted echo photon data. Finally, the flight time of each pixel can be obtained by adaptive mean filtering, and the corresponding distance information is solved. Mean Square Error (MSE) is used as the evaluation criterion of the algorithm effect.Results and DiscussionsThe simulation results of undulating terrain detection show that when the number of signal photons per pulse is about 14, compared with the Chen algorithm and the peak method, which lose the reconstruction ability when the noise intensity is higher than 3 MHz and 3.5 MHz respectively, the proposed algorithm can not only reconstruct the terrain information in the range of 6 MHz noise intensity, but also reduce the mean square error by at least about 20% (Fig.5). In the indoor static target imaging experiment, when the noise intensity is in the range of 5.08 MHz, the maximum mean square error of the proposed algorithm for target reconstruction is 0.017, and the imaging effect is obviously better than the other two methods (Fig.8). The experimental results show that the proposed algorithm has a good filtering effect on the echo data of undulating terrain and laboratory static target under strong noise.ConclusionsIn this study, an adaptive spatial-temporal correlation depth estimation method for strong noise data is designed by analyzing the temporal characteristics and spatial correlation of echo photon data. This method not only solves the problem of extracting signal photons when there are multiple maximum values or no single peak in the histogram, but also greatly reduces the amount of data and computational complexity. By processing the echo data of simulated terrain detection, and comparing with the peak method and the distance estimation method based on multi-scale time resolution proposed by Chen et al., the feasibility of the proposed algorithm in the filtering of photon counting data is preliminarily verified. Then, the superiority of the proposed algorithm in strong noise interference target detection is further verified based on indoor imaging experiments. With the increase of noise interference, the reconstruction effect of the proposed algorithm is more obvious than that of the other two methods. The proposed algorithm is suitable for processing the echo data of strong noise environment detection, and does not need to use the noise intensity as a priori information, which provides a new data processing idea for target reconstruction.
May. 25, 2023Vol. 52 Issue 5 20220682 (2023)
Zhongyu Hu, and Lingbing Bu
SignificanceAtmospheric wind field is a crucial element in meteorology and a primary driving factor for global carbon cycling, aerosol transport, energy exchange, and weather changes. Although satellite-based atmospheric observations have a history of several decades, progress in measuring the global 3D wind field has been slow. A clear need for improving this situation is to establish a globally covered, high-resolution atmospheric wind observation system. Currently, the primary observation method for wind profiles is by using radiosondes, but it is impossible to obtain corresponding sounding data for regions where instruments are difficult to install and maintain, such as oceans or deserts. Therefore, wind measurement in these regions is usually performed by carrying sounding instruments on flights or ships, which is costly and subject to the conditions of detection. Satellite-based Doppler wind lidars can achieve wide-range, high-precision, and uninterrupted wind field measurements, which are not affected by terrain and time compared with ground-based and airborne detection. Satellite-based wind measurement is of great significance for improving numerical weather forecast accuracy, long-term climate research, pollutant transport, and environmental protection. Research on satellite-based Doppler wind lidars has been underway for nearly 30 years since the last century, and Aeolus is currently the only successfully launched satellite for satellite-based wind measurement.ProgressIn the 1980s, research on laser radar technology was conducted in space, followed by some research on coherent wind measurement in the 1990s. However, due to its technical difficulty, it has not been successfully applied so far. In the 1990s, the ADM-Aeolus project was proposed. Starting in 2000, EADS-Astrium, a subsidiary of the European Aerospace and Defense Group, and more than 30 European companies jointly conducted research and development on the ALADIN payload principle prototype (Fig.2). In 2001, ESA developed a direct-detection lidar simulator for the ADM-Aeolus instrument. The simulator has a resolution of 15 m and incorporates the latest design of ALADIN in real-time. Before the official launch, ESA conducted six airborne testing activities to observe atmospheric wind profiles for various atmospheric scenarios (Tab.2) and to test, verify, optimize the data quality control algorithm, evaluate the measurement error of line-of-sight wind speed, and propose a series of data inversion optimization schemes for different situations. Aeolus was successfully launched in France in August 2018.Conclusions and ProspectsThis paper summarizes the main data verification activities and results of the Aeolus satellite since its launch. Until April 2022, the global random error of the L2 B data product for the Rayleigh channel is about 6 m/s and for the Mie channel is about 3.3 m/s. However, in long-term experiments, the L2 A product has significant errors in the backscatter coefficient under 2 km due to cloud interference and other factors including but not limited to low laser emission energy, calibration defects, and fluctuations in thermal pixels. This paper focuses on the practical application of the Aeolus data product and quantifies the improvement of numerical weather forecast accuracy, advancement of atmospheric dynamics research, and progress on pollutant and environmental research. Based on the Aeolus design, parameter optimization and simulation were conducted, and the simulation results were presented. Finally, the data characteristics of Aeolus were analyzed, and seven factors that need improvement were proposed based on China's research progress in satellite-based wind measurement and wind measurement requirements in the meteorological field, including laser emission energy, data inversion, and equipment development. The paper also analyzed the characteristics of coherent lidar wind measurement and hybrid lidar wind measurement schemes. Among them, the hybrid lidar wind measurement scheme has advantages in the accuracy and quantity of the detection data, and can be considered as the main direction for China's future development of satellite-based wind measurement.
May. 25, 2023Vol. 52 Issue 5 20220691 (2023)
Fu Yang, Wenhao Chen, Yanyu Lu, and Yan He
ObjectiveThe ocean is an important link in the global carbon cycle, carbon is transferred along the ocean's food chain starting with phytoplankton photosynthesis and exists as particulate organic carbon (POC). The measurement of the ocean's ability to store carbon will be greatly influenced by the discovery of its particulate organic carbon content. The realization of ocean particulate matter profiling can clarify the key processes of its formation, evolution and transport, which is of great significance to regional and global ecological research and climate problem solution. It will help human beings to better understand the ocean and explore its deep resources. Half of the current contribution to ocean observation data comes from satellite remote sensing, a technique that allows simultaneous observation of large areas, but lacks access to ocean profile information. The performance of the oceanic particulate organic carbon concentration profile detection system based on high spectral resolution technology is simulated and analyzed because lidar can detect profile information based on the change in optical properties caused by phytoplankton in clear ocean waters.MethodsHigh Spectral Resolution Lidar (HSRL) is a type of lidar that uses narrowband filters (or filters) to achieve spectral separation by taking advantage of the difference in the magnitude of the spectral width of particle scattering and molecular scattering in the backscattering spectrum of the echo signal (Fig.1). HSRL technology is the current preferred solution for the development of particle detection lidar. The simulation software (Fig.2) is used to obtain the ocean water parameters combined with the preset lidar system parameters (Tab.1), and then the lidar equation is used to simulate the return profile photoelectron number. Utilizing an iodine molecular absorption cell as a filter, the transmission window of the oceanic water column, and the laser's engineering design are combined to analyze the detection system's optimal operating wavelength under various loading platforms.Results and DiscussionsWhen the detection requirement of a single detection system with a signal-to-noise ratio of 5 is met, simulation results reveal that the detection depth in the 50 dB dynamic range of the oceanic water column averages at 80 m (Fig.4). Depending on the return spectrum (Fig.5, Fig.7) and filtering capabilities of the filter, the best center wavelength for lidar operation in various usage scenarios can be chosen. The absorption line of the iodine molecule absorption cell near 532 nm can be used as the working wavelength to be selected. The optimal operating center wavelength of the shipboard platform needs to consider the transmission characteristics of the laser in seawater (Tab.2). The optimal operating center wavelength of the airborne platform needs to take into account the atmospheric transmission characteristics of the laser (Tab.3). According to the filter's ability to absorb the meter scattered signal in the echo spectrum, and the stability requirements, the most effective working wavelength for airborne detection systems and shipborne detection systems is 532.292 8 nm and 532.245 1 nm.ConclusionsBecause the development of a lidar system is a time-consuming and difficult project, it is essential to simulate and optimize the system parameters early on to ensure the viability and usability of the lidar system. The water body has an effect on the maximum detectable depth of lidar, according to simulation results. The actual ocean exploration can choose the appropriate sea area to obtain better results. The determination of the optimal operating wavelength for high spectral resolution lidar based on iodine molecular absorption cell can provide a reference for the subsequent construction of practical systems.
May. 25, 2023Vol. 52 Issue 5 20220715 (2023)
Hongyou Bian, Xiaowen Xu, Weijun Liu, Wei Wang, Fei Xing, and Huiru Wang
ObjectiveDD5 nickel-based single-crystal (SX) alloy has been widely applied to manufacture the aeroengine turbine blades due to its excellent high-temperature strength and creep resistance. However, many types of damage to SX turbine blades, e.g., blade tip erosion, crack, are unavoidable in the harsh working environment, which shortens the service life of SX turbine blades. Therefore, it is urgent to study the repair of damaged SX turbine blades. The laser deposition technology, which can provide high temperature gradients and allows the addition of controlled amounts of material to required locations, is beneficial to repair the damaged SX alloy parts. According to investigation on laser deposition repair of SX alloy by scholars, the damaged SX alloy can be successfully repaired by properly controlling laser process and repairing SX alloy with different materials has bright prospects. At present, minimal reports have discussed the laser deposition repair of DD5 SX alloy using different materials. Therefore, the DD5 SX alloys are repaired by laser deposition technology using the DZ125 superalloy powder. The influence of laser power, scanning velocity and powder-feeding on dendrite epitaxial growth is systematically investigated by the orthogonal experiment method. The microstructure and microhardness of the single multi-layer as-deposited sample are analyzed. This study is aimed at providing a guide for the repair of damaged DD5 SX alloy.MethodsThe gas-atomized DZ125 superalloy powders were used as the depositing materials in this experiment and the cast DD5 SX alloys with the crystallographic orientation ((001)/[100]) normal to the depositing surface were applied as the substrate. Firstly, the DD5 SX alloys were repaired by laser deposition technology. The influence of laser power, scanning velocity and powder-feeding on dendrite epitaxial growth is systematically investigated by the orthogonal experiment method. Then, the laser deposition experiment of single multi-layer was carried out. The microstructure of the single multi-layer as-deposited sample was characterized by optical microscope, scanning electron microscope and the chemical composition was determined by EDS analysis. Finally, the microhardness of substrate and deposition zone was tested by Vickers hardness tester to explore the variation trends of microhardness and the relationship between the variation trends of microhardness and the microstructure.Results and DiscussionUnder the conditions of different heat input and powder-feeding rate, the dendrite epitaxial growth in the deposition zone is different (Fig.4). It is obvious that the influence of laser powder and powder-feeding rate on the dendrite epitaxial growth is remarkable, and the effect of scanning speed on the dendrite epitaxial growth is relatively weak (Fig.6). An increase in laser powder can heighten epitaxial growth height, it also significantly decreases the ratio of epitaxial growth. Similarly, the influence of powder-feeding rate on the variation trends of the height and ratio of dendrite epitaxial growth is similar to the laser powder. Therefore, the ratio of dendrite epitaxial growth can be prominently improved with the lower heat input and powder-feeding. When the laser power is 420 W, the scanning speed is 6 mm·s-1 and the powder-feeding rate is 1.5 g·min-1, the ratio of dendrite epitaxial growth is about 100% (Fig.7). According to the microstructure of the single multi-layer as-deposited sample, it is known that the dendrites are planar crystals and columnar crystals along the deposited direction at the bottom and middle of the deposited zone. There are equiaxed crystals at the top (Fig.8). Moreover, the γ′ particles in dendrite epitaxial region of deposition zone unevenly distribute in the γ matrix and the size of γ′ particles in the inter-dendrite is much bigger than that in the core-dendrite (Fig.9(c)). In addition, short rod-like MC carbides with high Ta content are distributed in the inter-dendritic region at the bottom of the deposition zone (Fig.12(c)). Small blocks and octahedral MC carbides are randomly distributed at the top (Fig.12(e)). This is because the heat accumulation at the bottom of the deposition zone is serious and the top of deposition zone is relatively weak. Through the analysis of the microhardness of deposition zone, it is concluded that the average microhardness of the deposition zone is 449 HV0.5, which is slightly higher than that of the substrate 425 HV0.5 (Fig.13). Moreover, the microhardness of the different deposition zone is slightly different. The microhardness at the bottom of the deposition zone is higher than that at the middle and top due to the higher content of Ta in MC carbides (Tab.3). ConclusionsThe DD5 SX alloys are repaired by laser deposition technology using the DZ125 superalloy powder. The specific conclusions are as follows: (1) The influence of laser powder and powder-feeding rate on the ratio of dendrite epitaxial growth is remarkable and an decrease in the heat input and powder-feeding rate can effectively increase the ratio of dendrite epitaxial growth. When the laser power is 420 W, the scanning speed is 6 mm·s-1 and the powder-feeding rate is 1.5 g·min-1, the ratio of dendrite epitaxial growth is about 100%. (2) The dendrites are planar crystals and columnar crystals along the deposited direction at the bottom and middle of the single multi-layer deposition zone. There are equiaxed crystals at the top. In addition, the size of γ′ particles in the inter-dendrite is much bigger than that in the core-dendrite due to the higher content of elements of Al and Ta in the inter-dendritic. (3) Affected by the high temperature of the molten pool, the carbides in the heat affected zone can dissolve in γ matrix, which reduces the carbides size. The carbides are distributed in the inter-dendritic region at the bottom and middle of deposition zone, while the carbides are randomly distributed at the top. Due to the heat accumulation, the shape of the carbides at the bottom and middle of deposition zone are mostly short rod-like. Compared with the bottom and middle of the deposition zone, the heat accumulation at the top is weak, which induces the formation of small blocks and octahedral carbides. (4) The average microhardness of the deposition zone is slightly higher than that of the substrate. Compared with the middle of the deposition zone, the microhardness at the bottom and top is slightly higher, and the microhardness at the bottom is the highest.
May. 25, 2023Vol. 52 Issue 5 20220731 (2023)
Jiayu Huang, Haifeng Lin, and Peiguang Yan
ObjectiveThe mid-infrared (MIR) laser of 3-5 μm has low propagation loss in the atmosphere, which is located in the atmospheric transparency window, and contains many absorption spectral lines of molecules and atoms. It is also known as the "molecular fingerprint region". Therefore, mid-infrared laser in this wavelength range have important applications in many fields such as environmental monitoring, military, medical, and remote sensing. Currently, the main methods for generating MIR laser output include fiber lasers, quantum cascade lasers, transition metal ion-doped solid-state lasers, and optical parametric oscillator (OPO) based on nonlinear frequency conversion technology. Among them, OPO has many advantages such as compact structure, flexible tuning methods, and high output efficiency, which has become an important means for generating mid-infrared lasers. A nanosecond mid-infrared fan-out MgO-doped periodically poled lithium niobate (MgO: PPLN) OPO is studied with wide tunning range and high conversion efficiency. It is pumped by a 1 064 nm Q-switched laser.MethodsThe entire system consisted of a pump source, mirrors, half-wave plate (HWP), polarizing beam splitter (PBS), optical isolator (ISO), lens, OPO resonant cavity, nonlinear crystal, and filters (Fig.1). The power and polarization of the pump were adjusted by the HWP and PBS. An optical isolator was used to prevent the reflection of pump wave back into the laser source to avoid damaging the source. The pump wave was then focused by the lens into the center of the MgO: PPLN crystal. Under high-power pumping conditions, the parametric light oscillated inside the cavity, and the output light was separated by a long-pass filter (LPF) with cut-off wavelength of 1 100 nm and a germanium (Ge) window.Results and DiscussionsBy reducing the repetition rate of the pump, the oscillation threshold of the OPO was effectively reduced. At the repetition rates of 10 kHz, 20 kHz, and 30 kHz of the pumping laser, the OPO oscillation thresholds were measured to be 0.4 W, 1 W, and 1.6 W, respectively. When the pumping power was 4.68 W and the poling period of MgO: PPLN was 30.47 μm, a maximum MIR laser output power of 0.833 W at 3.4 μm was obtained, corresponding to an optical-to-optical conversion efficiency of 17.8% (Fig.2). The poling periods of MgO: PPLN can be changed by shifting the crystal from 31.05 to 28.8 μm. This corresponds to the generation of a signal wave from 1 440.7 to 1 670.0 nm and an idler wave from 3 171.1 to 4 088.1 nm (Fig.3), respectively. The experimental results were in good agreement with the theoretical simulation values (Fig.4). Using a photodetector and an oscilloscope, the pulse widths of the pump and signal waves were measured to be 10.9 ns and 8.1 ns, respectively (Fig.5).ConclusionsA mid-infrared optical parametric oscillator based on a fan-out MgO: PPLN crystal was designed, which features a wide tuning range, high output efficiency, and narrow pulse width. At a pumping frequency of 10 kHz, the maximum output power of 3.4 μm mid-infrared laser was 0.833 W, with a pumping power of 4.68 W, and the corresponding optical-to-optical conversion efficiency was 17.8%. The output wavelengths at the different poling periods of MgO: PPLN were measured, which were well-matched with the theoretical values. By means of period tuning, signal light with wavelengths of 1 440.7-1 607.0 nm and idler light with wavelengths of 3 171.1-4 088.1 nm were obtained. And the FWHM pulse width of the signal light was ~8.1 ns. This experiment provides a feasible solution for developing compact, high-power, wide-tuning nanosecond mid-infrared laser sources.
May. 25, 2023Vol. 52 Issue 5 20220605 (2023)
Xuan Wang, and Chenqi Zhao
ObjectiveIn order to reduce the thermal expansion deformation of the support structure of the missile-borne optical system at service temperature, the carbon fiber reinforced composite with low thermal expansion coefficient in the fiber direction, strong designability and small specific gravity is used to replace titanium alloy as the main material of the support structure, and the composite support structure is designed by optimization. The optimized carbon fiber reinforced composite support structure shall meet the following requirements: (1) The main geometric size and the interface position shall remain unchanged; (2) Under the condition of 50 ℃ temperature rise, the axial thermal expansion deformation is reduced by more than 85% compared to the titanium alloy support structure; (3) The weight is lighter than titanium alloy support structure; (4) The fundamental frequency shall not be lower than the titanium alloy support structure.MethodsFirstly, according to the ASTM (American Society for Testing and Materials) E381 standard, the linear thermal expansion coefficients of the carbon fiber reinforced composite along the fiber direction and perpendicular to the fiber direction are measured using a thermal dilatometer (Fig.6) for two kinds of particular layup. On this basis, a thermal expansion simulation model for the composite structures is established in ABAQUS, and the feasibility of the model is validated by comparing with test results. Then, taking the axial thermal expansion deformation as the optimization objective, the Optistruct software is used to optimize the layer shape, layer thickness, and layer sequence step by step for the two-dimensional carbon fiber composite support structure until the axial thermal expansion deformation meets the design requirements. Based on the optimized two-dimensional model, considering the influence of thermal expansion deformation in the thickness direction, a three-dimensional finite element model of the composite support structure is established in ABAQUS to conduct the analyses of thermal expansion, weight and vibration mode.Results and DiscussionsFrom the thermal expansion coefficient tests, the linear thermal expansion coefficients of carbon fiber reinforced composites along the fiber direction and perpendicular to the fiber direction are obtained as 1.397×10⁻⁶/℃ and 37.95×10⁻⁶/℃ respectively (Tab.2). The thermal expansion deformation obtained from the simulation (Fig.7-8) for the laminates with three kinds of layup is in good agreement with the test results (Tab.2). It is shown that the established simulation model can effectively predict the thermal expansion deformation of the composite structures. After five optimization iterations, compared to the titanium alloy support structure, the carbon fiber reinforced composite support structure meets the design requirements with 87.8% reduction in the axial thermal expansion deformation within a temperature rise range of 50 ℃ (Fig.13), with 63.2% reduction in the weight and 24.4% increase in the fundamental frequency (Tab.9). ConclusionsCompared to titanium alloy, carbon fiber reinforced composite not only has lower density and greater specific stiffness, but also can achieve low thermal expansion deformation in one direction through reasonable design. Therefore, using carbon fiber reinforced composite instead of titanium alloy as the main material for the support structure of missile-borne optical systems can significantly reduce the axial thermal expansion deformation of the support structure through optimal design, while also achieving structural lightweight and improving structural stiffness.
May. 25, 2023Vol. 52 Issue 5 20220742 (2023)
Xin Zhang, Le Zhang, Chi Song, Lisong Yan, Xiaolin Yin, and Binzhi Zhang
ObjectiveAs a novel material leading the third-generation semiconductor technology revolution, monocrystalline silicon carbide has a very excellent prospect in the application of semiconductor field. And because of its high thermal conductivity, high elastic modulus, and high temperature stability, it is a highly competitive material in traditional imaging optics, high-power laser optics and other fields. Under some circumstances, such as application scenarios as high-power laser optics or EUV optics, the surface roughness Ra needs to be less than 1 nm or even much lower. Obviously, such high-performance specifications necessitate much more precise optical manufacturing for these types of optical applications. In traditional optical manufacturing, the technology of CCOS (Computer Controlled Optical Surfacing) is a commonly utilized manufacturing procedure in the whole process of optical manufacturing. Although some researchers at home and abroad have conducted detailed investigations on the influence of CCOS processing on MSF (Middle Spatial Frequency) errors for optical surfaces, there is a lack of research on the influence of CCOS processing on HSF (High Spatial Frequency) errors for optical surfaces. The intensity of the HSF errors of optical surfaces directly determines the surface roughness. Therefore, it is necessary to find a proper solution to how to evaluate the HSF errors for optical surfaces and how to reduce the HSF errors, which determines the surface roughness, when the overall HSF errors and surface roughness don’t meet expectations. MethodsPSD (Power Spectral Density) is the most commonly utilized indicator to evaluate the distribution of intensities of different frequencies for a certain signal. The sudden-peak form on a PSD curve indicates a sudden increase of the intensity of certain frequency band for the said signal, and at the same time, the peak form on a PSD curve will directly lead to the increase of the surface roughness. Inspired by the principle of the increase of entropy, experiments were conducted on two monocrystalline SiC flat surfaces with similar initial surface roughness distributions. One surface was processed with a pseudo-random tool path which was based on the Gilbert space-filling curve (Fig.2), while the other was processed with a conventional deterministic rasterized trajectory (Fig.1(a)). Finally, the surface roughness distributions and PSD curves of the two surfaces after the experiment were analyzed.Results and DiscussionsThrough the comparison of the experiment of the two surfaces, it can be seen that both two monocrystalline SiC surfaces have an approximate initial roughness Ra=7 nm (Fig.4) and then get experimented with 10 sets of 40 minutes' polishing. And after the polishing process is completed for both surfaces, the PSD curve of the surface processed with a deterministic rasterized tool path contains a sudden peak nearby frequency domain 0.01 μm-1 (Fig.6), whereas the PSD curve of the surface processed with pseudo-random tool path appears to be much smoother (Fig.8). In the meantime, the test results show that the surface processed with the pseudo-random tool path has lower roughness, which in turn indicates that the surface quality is higher after processing with the pseudo-random tool path. ConclusionsPSD is one of the most versatile indicators when it comes to signal analysis. And enlightened by law of the increase of entropy in thermodynamics, and all other things being equal, the deterministic rasterized tool path is simply replaced with a pseudo-random one. And the final testing results are significantly different. That is, when making use of CCOS technology to process monocrystalline SiC, the pseudo-random tool path can be utilized to reduce the relative intensity of HSF errors of a certain surface. And it proves that the pseudo-random tool path in the CCOS processing stage has a great inhibiting effect on the HSF errors of optical surfaces and therefore facilitates lower surface roughness and better surface quality.
May. 25, 2023Vol. 52 Issue 5 20220838 (2023)
Boren Guan, Mingyu Li, Renhui Deng, Haiyang Hu, and Zhe Lian
ObjectiveAs the communication rate increases, the power consumption of optical modules increases. Therefore, the heat dissipation environment of optical modules must be ensured. In order to ensure that the optical module can still maintain good performance under extreme environment, it is necessary to add extreme temperature cycle experiment in the delivery test of the optical module. With the increasing demand for optical modules, improving the efficiency of optical module delivery test has become the first engineering problem to be solved. Therefore, the design of the thermal control system for the high-speed communication optical module is important.MethodsFirst, according to the characteristics of the semiconductor cooler, the thermoelectric cooler assembly of the device under test was designed (Fig.3-4) and the results of Foltherm simulation indicate the availability of thermoelectric refrigeration components (Fig.6-7). Then, according to the principle and characteristics of the semiconductor refrigerator, the heat dissipation system is designed (Fig.17-19). Finally, the temperature control efficiency and the effect of the thermal control system and the water cooler are compared.Results and DiscussionsThe thermal control system of high-speed communication optical module uses a semiconductor cooler as the refrigeration unit, and the rise and fall time of the optical module in QSFP-DD packaging mode can be controlled within 110 s (Tab.11 and Fig.24). The rise and fall time of the optical module in QSFP-28 encapsulation mode can be controlled within 60 s (Tab.11 and Fig.25). The effect of temperature control is good, and the high-speed communication optical module manufacturers can analyze the performance of the optical module within the operating temperature range of commercial grade. The system is mainly composed of the device under test, thermoelectric cooler, the fixture, the controller of the semiconductor cooler and the heat dissipation system. Among them, the thermoelectric cooler assembly of the device under test is made up of the cylinder bracket and the cold plate radiator mounting box, which effectively reduces the heat leakage (Fig.3-4); Flotherm software is used to establish a thermal simulation model of cold plate heat exchanger in thermoelectric refrigeration components. The simulation results show that the module shell temperature can be stabilized at -0.382 ℃, and the cold plate heat exchanger can meet the requirements (Fig.6-7). And in the meantime, Flow Simulation is adopted to optimize the water flow of the cold plate heat exchanger in the heat dissipation system. The flow velocity of the optimized water flow in the cold plate heat exchanger is greater than 0.02 m/s (Fig.14), and the optimized water structure is available. This system has the advantages of little vibration and low noise, and only one-third volume of the water cooler (Fig.20). Meanwhile, this thermal control system basically meets the temperature control requirements for the high-speed communication optical modules with the common packaging methods.ConclusionsThe time of temperature control of the optical module with the thermal control system is 10 s longer than that with the water cooler. But it has the advantages of miniaturization, low noise and zero vibration, which is more conducive to the integrated testing of optical modules. Using this system can not only test the optical modules in the QSFP-DD package mode independently, but also realizes the dual-channel parallel test of the optical modules in the QSFP-28 package mode to double the test efficiency of optical module.
May. 25, 2023Vol. 52 Issue 5 20220705 (2023)
Hang Ren, Tianshu Wang, Lei Du, Xin Li, Lin Xiao, and Jianhong Zhou
ObjectiveSupercontinuum light source has the advantages of wide spectral range and good spatial coherence. Thus, it is widely applied in optical communication, optical frequency comb, optical fiber sensing, spectrum detection, and other fields. With the development of new technology such as optical coherence tomography and fluorescence lifetime imaging, supercontinuum light source has become an interesting research field. Although the combination of 1.55 μm mode-locked pulse and highly nonlinear fiber can realize all-fiber near-infrared supercontinuum light source. However, due to the low output energy of the mode-locked pulse, the energy of the supercontinuum light source is mainly concentrated in the spectral region of the pump wavelength. How to enhance the coverage and flatness of the near-infrared supercontinuum is a problem need to be solved. For this purpose, we designed a high-energy erbium-doped fiber laser.MethodsThe generation of flat supercontinuum via wave-free breaking pulse is proposed. Nonlinear polarization rotation (NPR) is employed as a mode-locking way to switch the output of dissipative soliton pulse and wave-free breaking pulse (Fig.1). Dissipative soliton pulse is obtained at 0.3 W pump power (Fig.3). The pulse width is 5.8 ps, and the pulse interval is 54 ns corresponding to the cavity length of 11.05 m. The signal-to-noise ratio is 55 dB, and the compressed pulse width is 0.61 ps (Fig.4). The pulse peak power can be increased to 1.18 kW. By properly adjusting the cavity polarization state and increasing the pump power, the dissipative soliton pulse can evolve into wave-free breaking pulse (Fig.5). With the increase of pump power, the pulse width increases almost twice from 11.7 ps to 20.2 ps. After calculation, the time bandwidth product increases from 23.9 to 53.43. The larger chirp can resist the influence of nonlinear phase shift, avoiding pulse splitting. The pulse energy of wave-free breaking pulse can be increased to 3.89 nJ, which is five times of the pulse energy of dissipative soliton (Fig.6).Results and Discussionswe use dissipative soliton pulse and wave-free breaking pulse as seed sources to obtain supercontinuum in tapered highly nonlinear fiber. After the taper is pulled, the core diameter will change from 9 μm to 6 μm. Since the peak power of the wave-free breaking pulse has been maintained at about 197 W, which can effectively avoid the pulse splitting caused by higher-order dispersion and nonlinear disturbance of the tapered high nonlinear fiber, and the spectrum can be effectively broadened by self-phase modulation. In the experiment, the total length of the tapered highly nonlinear fiber is 4 m, the waist area is 3 m, and the taper region is 1 m (Fig.2). The results show that the supercontinuum range and flatness produced by wave-free breaking pulse is better than dissipative soliton pulse in tapered highly nonlinear fiber (Fig.7). The supercontinuum range based on dissipative soliton pulse and wave-free breaking pulse is 1 400-2 000 nm covered communication region of S-band, C-band, and L-band. And the 20 dB bandwidth is 310.3 nm and 426.4 nm respectively.ConclusionA passively mode-locked structure of nonlinear polarization rotation is used to realize ultra-fast pulse output. And the conversion of dissipative soliton pulse and wave-free breaking pulse is realized through dispersion management. Under the mode-locked state of dissipative soliton pulse, the maximum output pulse energy is 0.82 nJ, and the peak power is 124.4 W. By adjusting the cavity parameters and increasing the pump power, the mode-locked state of wave-free breaking pulse can be realized. The pulse energy of wave-free breaking pulse can be increased to 3.89 nJ, which is 5 times of the energy of dissipative soliton pulse. In tapered HNLF, the flatness of supercontinuum generated by employing wave-free splitting pulse as seed source is better than dissipative soliton pulse. At the same time, the supercontinuum range covers three main communication bands (S-band, C-band and L-band). This flat supercontinuum is not only of great significance for the research of multi-channel wavelength division multiplexing light source applications, but also can be applied in biomedical imaging and other fields. This work will contribute to the development of high-energy pulse fiber lasers and improve their potential applications in supercontinuum generation and optical communication.
May. 25, 2023Vol. 52 Issue 5 20220745 (2023)
Yaohu Cui, Zixiong Wang, Yitong Xu, Xunhe Zuo, Yang Jiang, Jinlong Yu, and Zhanhua Huang
ObjectiveOptical frequency comb (OFC) is widely used in optical communication system and spectroscopy. OFC can be generated by using mode-locked laser and electro-optic modulators (EOMs). Although the EOM-based OFC has good performance of flexibility, its flatness performance can be improved. The flatness of OFC is determined mainly by the modulation index and phase of driving microwave signal in phase modulation, which is the fundamental process of electro-optic modulation. Therefore, the optimized modulation index and phase of driving signal as well as other parameters are critical to the generation of flat OFC. In addition, due to the periodicity of driving signals' phases, one of the phases can be left without adjustment in the experiment to achieve flat OFC. However, to the best of the authors' knowledge, this phenomenon has seldom been investigated.MethodsAn approach to the generation of flat OFC is proposed, where cascaded phase modulator (PM) and intensity modulator (IM) are driven by combined harmonics (Fig.1). The parameters of driving harmonics and IM are optimized, where the optimization problem is formulated to minimize the variance of power for the OFC with certain number of comb lines. Differential evolution (DE) algorithm is applied to solve the optimization problem. Feasible solutions for combined harmonics are investigated in simulation. Experiment is also carried out to verify the feasibility of proposed approach (Fig.13). Although the phases of all the combined driving harmonics can be optimized, it is found that one of the driving harmonics' phases can be left without optimization while the performance of flatness is not affected.Results and DiscussionsWhen the fundamental tone and third harmonic are combined to drive the PM and the fourth harmonic drives the IM, a 13-line OFC is generated, where the flatness is 0.27 dB and 0.83 dB under simulation and experiment respectively (Fig.3, Fig.14). When the fundamental tone, third harmonic, and fifth harmonic are combined to drive both the PM and IM, a 19-line OFC with 0.56 dB flatness is achieved in simulation (Fig.4). The rest feasible solutions to generate flat OFC are listed (Tab.1). The relationship between number of comb lines and flatness is also investigated (Fig.12). When the number of comb lines is no larger than 7, the flatness is 0 dB; when the number of comb lines is larger than 7, the flatness increases as the number of comb lines grows. If the phase of one of the driving harmonics is fixed when the optimization problem is being solved, the flatness performances for the cases listed (Tab.1) are not affected (Fig.5, Fig.9-11). Regarding the case in Tab.1(b), the modulation indices for all the three driving harmonics are also investigated, when one of three harmonics' phases is fixed in the simulation (Fig.6-8).ConclusionsThis work investigates the approach to generate flat OFC by using cascaded PM and IM. These EOMs are driven by combined harmonics, where the parameters are optimized, such as the modulation index and phase of each driving harmonic as well as the bias phase caused by the bias voltage of IM. The optimized parameters are obtained by using DE algorithm, which solves the optimization problem to minimize the variance of power for the OFC. Both simulation and experiment have been carried out to achieve flat OFC. When the combined fundamental tone as well as third harmonic drive the PM and the fourth harmonic drives the IM, a 13-line OFC is generated with 0.27 dB and 0.83 dB flatness under simulation and experiment respectively. It is found that when one of the driving harmonics' phases is fixed, flat OFC can also be achieved by solving the same optimization problem. This phenomenon makes it possible to generate flat OFC in the experiment without adjusting that phase. Therefore, both the feasibility and robustness of the proposed approach are guaranteed.
May. 25, 2023Vol. 52 Issue 5 20220756 (2023)
Kaiyi Ji, Yujie Xing, Xinshang Niu, Chunling He, Xiong Dun, and Xinbin Cheng
ObjectiveThe greatest advantage of hyperspectral imaging technology over traditional detection technology is that it can record both spatial information and "fingerprint" spectral information of the observed target, with higher spectral resolution, higher detection capability, and can effectively identify and classify the target to be measured. With the development of hyperspectral imaging technology, the technology related to its core instrument, the Imaging Spectrometer, is also becoming more and more mature. Early developed Imaging Spectrometer are limited by the performance of spectroscopic devices, the band coverage is usually narrow. In order to achieve higher spectral coverage capabilities, multiple Imaging Spectrometer with completed stitching is usually needed, its volume and weight is large. Therefore, the study of a single broad-band spectral imaging system (0.4-1.7 μm) has important research significance. Grating has become the mainstream beam splitting element for broad-band spectral imaging systems because of its high dispersion capability and high environmental stability. The grating-based broad-band spectral imaging system suffers from the problem of crosstalk between multi-order diffraction spectra, which introduces serious stray light, which has a great impact on the performance of the optical system. Therefore, it is particularly important to carry out stray light analysis and suppression schemes for broad-band spectral imaging systems.MethodsStarting from a typical Schwarzschild structured grating-type broad-band spectral imaging system (Fig.1), the stray light of the optical machine system was analysed using the Monte Carlo non-sequential ray tracing method, Tracepro software was chosen to implement the simulation analysis of the broad-band spectral imaging system (Fig.3). The system stray light was evaluated based on the simulation analysis results (Fig.5), the theoretical calculation of the system stray light was carried out (Tab.3), and the theoretical calculation matched the simulation results. Secondly, based on the stray light path of the system obtained from the simulation, the source of multi-order stray light of the broad-band spectral imaging system was analysed in depth. A scheme of adding filters is proposed to suppress multi-level diffracted stray light. Two types of filters are designed: a sub-area filter (Fig.8) and a linear gradient bandpass filter (Fig.11), respectively.Results and DiscussionsThe stray light coefficient is significantly reduced after the addition of the sub-area filter, and the long-wave stray light is better suppressed with a maximum stray light coefficient of 0.011, but in the short-wave band, the stray light is still larger with a maximum stray light coefficient of 0.0826 (Fig.10). Therefore, the stray light in the long wavelength band can only be suppressed by using the sub-area filter, but the stray light in the short wavelength band is not effectively suppressed, which cannot meet the requirement of suppressing multi-order diffracted stray light in the broad-band imaging system. With the addition of a linearly graduated bandpass filter, stray light is not only suppressed at long wavelengths, but also at short wavelengths, and the stray light coefficient is reduced to the order of 10-4 (Fig.14). Therefore, the use of a linear gradient bandpass filter for the suppression of stray light in a broad-band spectral imaging system can meet the requirements of the system. ConclusionsThis paper analyzes the stray light problem of Schwarzschild structured planar grating type broad-band spectral imaging system. The analysis results show that there are two main types of stray light in broad-band spectral imaging system: one is the long wavelength multi-order diffracted light in the optical path multiple reflections and diffraction and short wavelength spectral channel overlap; the other is the short wavelength multi-order diffraction, adding linear gradient bandpass filter can effectively suppress the system multi-order diffracted stray light, which meets the requirements of broad-band spectral imaging system. The work of this paper provides a theoretical basis for the design of grating type broad-band spectral imaging system, and can be used for high-performance broad-band spectral imaging system.
May. 25, 2023Vol. 52 Issue 5 20220645 (2023)
Feng Yang, Zhendong Shi, Yong Jiang, Jie Leng, Yalan Wang, Dezhang Chen, Lin Xu, Zhao Song, Shiyue Xu, Kai Jia, Jianbo Gao, Yang Bai, and Shouhuan Zhou
ObjectiveThe prism scanning system is used to achieve optical imaging with both large field of view and high resolution by adjusting the beam direction or optic axis. It is widely used in optical reconnaissance, laser communication, lidar, etc. In airborne laser imaging lidar, the prism scanning system, as a transmission scanning structure, has high optical utilization, effectively reduces the volume of the system, and has the advantages of low power consumption, high precision and good stability. In array imaging lidar, high energy efficiency, high resolution, and broad field detection are all achieved by means of array beam illumination and Risley-prism scanning. However, when sub-beams are obliquely incident on the prism, the rotational symmetry of the traces of ray propagation is broken, the beam deflection of the sub-beams through the prism is different, and the regular beam array produces shape distortion, resulting in beam pointing error and affecting the position accuracy of the point cloud. Therefore, it is necessary to analyze the rules of beam array distortion to improve the accuracy of the point cloud.MethodsThe conical scanning mode that combines the array beam and prism is broken down into multi-beam parallel scanning with numerous incident angles, and the propagation characteristics of the array beam are thoroughly described by the propagation characteristics of all sub-beams (Fig.2). The three-dimensional vector optical approach is used to establish the laser transmission process of the array beam through a Risley-prism (Fig.3), and the relationship between the pointing variation of the sub-beam and the scanning angle of the prism is obtained (Fig.4). The association between beam pointing variability and point cloud data quality is demonstrated by the numerical simulation of imaging process with prism scanning by flight experiment of airborne lidar (Fig.6-7).Results and DiscussionsWhen the array beam is orthographically and obliquely incident into the prisms with different angles, the beam steering of the prism to each sub-beam is different at various scanning angles (Fig.5(a)). The spatial shape distortion analysis of the array beam is based on the spatial angle difference between the outgoing sub-beam and the central sub-beam. When the prism rotates one cycle, the spatial shape distortion of the array beam is shown (Fig.6(b)). The quality of point cloud data affected by the array beam distortion is evaluated by using plane fitting RMS value as the quantitative index of point cloud position accuracy (Fig.7). Simulation results of ground scanning imaging process of prism in airborne lidar indicate that the plane error RMS is approximately 5 cm at a navigation height of 0.5 km (Fig.8(a)), which varies linearly with navigation height, and slopes at a rate of around 0.1 m/km in prism scanning system with beam array (3×3) (Fig.8(b)) and the accuracy of point cloud plane decreases with the increase of array beam scale (Fig.9) and sub-beam angular separation (Fig.10).ConclusionsThe combination of array beam illumination and prism scanning improves the energy utilization, spatial resolution and detection field of view of airborne lidar system. However, the shape distortion of array beam leads to beam pointing error and affects the accuracy of point cloud position. The array beam incidence prism includes orthographic and oblique incidence. The oblique sub-beam destroys the rotational symmetry of the beam propagating in the prism, and the beam steering ability is different at different scanning positions. Furthermore, the larger the oblique angle is, the stronger the steering ability of the prism to the beam is. Given that the above two work together, the time-varying array beam is emitted when the regular array beam is incident. The relationship between beam pointing error and spatial position error is obtained by using the three-dimensional vector optics method. The increase of the incident angle of the sub-beam and the altitude will lead to the dispersion of the point cloud and the decrease of the data quality. The law of beam array distortion during prism scanning lays a foundation for the correction of subsequent airborne flight test data, especially for the improvement of position accuracy of medium and long-distance airborne lidar. In addition, it provides a reference for the design of array beam combined with multi-prism scanning system.
May. 25, 2023Vol. 52 Issue 5 20220689 (2023)
Jianchao Jiao, Chao Wang, Yue Yu, Chenhui Guan, Mingyang Hou, and Wenyu Zhang
ObjectiveThe space-based space target detection system based on the micro-satellite has the advantages of large-scale high-frequency observation and low cost, so it has developed rapidly. At present, foreign space-based space target detection systems have adopted a large number of micro-satellite platforms, such as Canadian MOST satellite, Sapphire satellite, NEOSSat satellite, STARE satellite, etc., with a payload weight of tens of kilograms, the weight of the whole satellite is about 100 kg, and the faint target detection ability can usually reach more than 13 magnitude. The article has designed and developed a compact, large field of view (FOV) and high-sensitivity optical camera for space target detection, which has a detection magnitude of more than 13 Mv, a detection FOV of 8°×8°, and a weight of 5 kg. It can be widely deployed on micro-satellite platforms or hosted on large satellites. It can give full play to the advantage of cluster detection, realize the wide-range, high-sensitivity, and high-frequency detection of faint space targets such as space debris and asteroids, and provides high real-time data support for space debris collision warning and asteroid research.MethodsA compact, large FOV and high-sensitivity optical camera is built in this paper. Aiming at the application requirements of lightweight, small size, large field of view and high sensitivity of the detection camera, the paper comprehensively optimizes the optics, structure, electronics and stray light suppression to achieve the best detection capability. In terms of optics, a large field of view and small F-number optical lens has been designed and realized. During the optimization process, the lens size is strictly controlled, and the low-density glass material is optimized. On the premise of ensuring the optical performance, the lightweight and miniaturization is realized, and the optical system field of view is 8°×8°, the optical system length is 280 mm and optical energy concentration is 90% (Fig.6). In terms of structure, an integrated long lens tube structure is designed and realized to ensure that the lightweight lens has high structural stiffness and dimensional stability, and the lens tube weight is less than 1.8 kg. In electronics, the combination of high-sensitivity detector and high-integration low noise circuit is used to achieve good noise suppression and lightweight. In the aspect of stray light suppression, the extinction structure is designed at the key part of the lens barrel, the light shield with chamfer is designed, and the ultra-black coating is sprayed inside to achieve good stray light suppression effect. Results and DiscussionsThe lightweight and highly sensitive optical camera has been developed and integrated (Fig.7), with a total weight of 4.9 kg. Through the ground observation test, it is verified that the detection capability of the camera is 13.2 Mv.ConclusionsWith the increasing frequency of space activities, the space situational awareness is crucial for the safe development and utilization of space. Space situational awareness based on micro-satellite is an efficient and cost-effective approach. Aiming at the application requirements of space target detection on micro-satellite platform, a lightweight and highly sensitive optical camera for faint target detection was designed and developed, with a weight of 5 kg and a detection FOV of 8°×8°. It was verified by ground tests that the detection ability was better than 13 Mv. The camera can be widely deployed on micro-satellite, and can detect faint space targets with high sensitivity and high frequency, providing high real-time data support for space debris research and collision warning.
May. 25, 2023Vol. 52 Issue 5 20220709 (2023)
Ruolan Li, Yang Wang, Qianzhi Xu, Lei Zhang, and Yuegang Fu
ObjectiveEnlarging the field of view of an optical system while maintaining good imaging quality is a difficult problem in modern optical design. The large field of view and high resolution of optical lenses are mutually restricted, and it is generally difficult to realize them at the same time. It requires complex structure design, expensive manufacturing, and large volume. Each surface of the monocentric lens is monocentric, and the curved imaging plane is also monocentric with each surface. The special structure enables it to achieve a large field of view and high resolution. It also has the advantages of simple structure, small size, and light weight. It is widely used in aerial remote sensing, security monitoring, photography, videography and so on, and may be first applied in miniaturized mobile phone lenses in the future. However, because the monocentric lens sets a conventional stop in the center to block the light beam of the off-axis field of view, when the field of view is larger, more light will be blocked, which causes greater vignetting, reduces the uniformity of illumination of the imaging plane, and affects the imaging quality. In order to improve the relative illuminance of the monocentric lens, a monocentric reflective mobile phone lens that uses a total reflection surface to control the light beam is designed.MethodsA monocentric reflective mobile phone lens structure is designed in this paper. The initial structure is obtained by calculating the optical path of two reflective monocentric lenses (Fig.4). The optimized structure consists of a meniscus lens and a hemispherical lens, which are glued together using a low-refractive-index cement (Fig.5(a)). The spot for different fields of view of monocentric reflective lenses using conventional stop and virtual stop are simulated (Fig.6, Fig.8). Under different stop conditions, the relative illuminance curves of monocentric reflective lens are drawn (Fig.9).Results and DiscussionsThe designed monocentric reflective mobile phone lens has a focal length of 2.7 mm, a maximum field of view of ±50°, a system F number of 1.8, a total length of 2.7 mm, and a maximum RMS radius of no more than 0.8 μm (Fig.5(b)). Under the conditions of conventional stop and virtual stop, the spot illuminance simulation of monocentric reflective lens is carried out. From the illumination diagrams of different fields of view, it can be seen that under the condition of conventional stop, the shape of the spot becomes ellipse when the field of view is 30°, and the minor axis of the ellipse is smaller when the field of view is 50° (Fig.6). Under the condition of virtual stop, the spot is circular in the 30° field of view, and the spot in the 50° field of view is rounder than the spot with the conventional stop. The relative illuminance curves of the mobile phone lens under the two kinds of stops are drawn, and the results show that the relative illuminance of the monocentric lens using the virtual stop is above 0.85, and the relative illuminance of the monocentric lens using the conventional stop is above 0.64 (Fig.9). ConclusionsA monocentric reflective mobile phone lens is designed with a total reflection surface to restrict the light. Based on the establishment conditions of the virtual stop and the requirements of the mobile phone lens, an initial structure of the mobile phone lens based on the monocentric reflective lens is calculated. The focal length of the optimized system is 2.7 mm, the maximum field of view is ±50°, the system F# is 1.8, and the total length is 2.7 mm. The illuminance analysis results show that the relative illuminance of the mobile phone lens using the conventional stop gradually decreases with the increase of the field of view, and it is only 0.64 in the 50° field of view. However, the relative illuminance of a mobile phone lens with a virtual stop remains constant at 0° to 28° and is above 0.85 in the 50° field of view. The illuminance uniformity of the full field of view of the monocentric reflective lens using the virtual stop has been significantly improved, which can effectively improve the imaging performance of the system.
May. 25, 2023Vol. 52 Issue 5 20220763 (2023)
Hu Liu, Lei Zhu, Yan Wu, Yu Gao, Weiliang Yan, and Kai Cui
ObjectiveThe electro-optic system is an important component of loitering munition. With the rapid development of loitering munition in recent years, the electro-optic systems of loitering munition are expected to be more compact, light, and with more excellent performance. Therefore, advanced design methods are urgently needed to solve the above problems in the electro-optic system design. In order to meet the multiple requirements of loitering munition, an effective design method for key structures of electro-optic systems based on topology optimization was proposed.MethodsThe advanced topology optimization method was employed to raise the design standard of electro-optic systems. Specifically, the stiffness under acceleration conditions in X,Y, Z directions and the first modal frequency were all considered as the optimization design constraints, and mass minimization of the design structure of electro-optic systems of loitering munition was taken as the optimization objective function in the proposed topology optimization method. The variable density method was employed to establish the topology optimization model. The optimized topology layout of the electro-optic systems structure can be obtained by solving the topology optimization model with the help of Altair HyperWorks software, then it would be used to reconstruct the geometric models based on production technology with the software of Unigraphics NX. In the next step, the reconstruction model would be analyzed to confirm if the optimized design could meet all the requirements. Results and DiscussionsAs the key structure of electro-optic systems of the loitering munition, the optical bench was analyzed and optimized to improve the design performance using the proposed method. In this typical example, the topology optimized result of optical bench was obtained (Fig.5) and reconstructed (Fig.7). Then the modal analysis (Fig.8) and overload analysis (Fig.9) were executed to verify the performance of optimized reconstructed optical bench. The result showed that the mass of optical bench of electro-optic systems was reduced by 22.4% with stiffness under acceleration conditions in X, Y, Z directions and the first modal frequency maintaining equivalent performances (Tab.1). In the completed example, the optimization method has greatly improved the lightweight level of electro-optic systems of loitering munition, and it offers great help in meeting the requirements of loitering munition system. In especial, the optimized design of optical bench has been produced and successfully applied to the electro-optic systems. Obviously, the proposed method can also be extended to the design of other parts to improve the overall design level. ConclusionsIn this study, an effective design method for key structures of electro-optic systems based on topology optimization is proposed. The mass, stiffness and the first modal frequency of the key structure are all considered in the optimization design method to ensure design effectiveness. As a typical example, the optical bench was analyzed, optimized, reconstructed and checked successively during the whole design flow and the optimized design of optical bench has also been produced and verified in the physical test. Compared to experiential design, the topology optimized optical bench has a significant advantage in weight and stiffness. The result of the example showed that the proposed topology optimization method can effectively benefit the lightweight design of the electro-optic systems of loitering munition. Therefore, the topology optimization method for key structures of electro-optic systems of loitering munition has great appliance and good popularization value.
May. 25, 2023Vol. 52 Issue 5 20220767 (2023)
Qiuyue Yu, Wen Guo, Jinghua Wang, Mengjuan Li, Tianbin Lv, Changsuo Yu, Yilun Li, and Ziyue Zhao
ObjectiveComputer controlled optical surface technology (CCOS) is widely used in the grinding and polishing process of mirror, it uses a small grinding head controlled by a computer to quantitatively grind and polish the surface of the workpiece. The removal function is a key parameter in CCOS, which is mainly related to process parameters such as the dwelling time of the grinding head on the workpiece, the rotation speed of the grinding head, and the processing pressure. The current CCOS removal function usually uses a near-Gaussian removal function, which has high removal efficiency and stable removal. However, it is easy to cause edge warping during processing. Generally, manual repair is used to remove the warping, which not only requires a large amount of labor costs, but also seriously affects the rapid improvement of processing accuracy. The larger the aperture of the mirror is, the larger the edge area is needed to be processed. If the edge warping is not properly controlled, it will seriously affect the processing efficiency and the convergence rate of the mirror. Aiming at the problem of edge effect in the CCOS grinding process, a non-eccentric processing technology was proposed and the removal function of the non-eccentric tool was analyzed.MethodsThe theoretical analysis of the removal function of non-eccentric tool was conducted. The removal function of non-eccentric tool was extracted by single factor fixed point pit test (Fig.1-2). Using the control variable method, the influence of process parameters such as processing force, grinding head rotation speed, and dwelling time on the removal efficiency was studied (Tab.1). In order to verify whether the non-eccentric tool could effectively control the edge effect, an experimental mirror with an aperture of 407 mm was selected; Firstly, the whole surface of mirror was processed with an eccentric tool whose removal function was a near-Gaussian type. When the edge was warped, the non-eccentric tool was used to process the edge (Fig.6).Results and DiscussionsCompared to the Gaussian shaped removal function of the eccentric tool, the non-eccentric tool removal function was an inverted V shape, with the minimum removal amount at the center of the tool and the maximum removal amount at the edge. From the impact of process parameters on the removal efficiency of non-eccentric tool, it could be seen that when the processing force was within 21 N, the removal efficiency increased linearly with the increase of the processing force; When the force was greater than 21 N, the removal efficiency tended to decrease (Fig.3). This was because the force was too large, which prevented the grinding fluid from entering smoothly. With the increase of rotation speed, the removal efficiency increased significantly (Fig.4). The effect of dwelling time on the removal efficiency was linear (Fig.5). From the surface processing result of the Ф407 mm experimental mirror, it could be seen that using the eccentric tool to process the whole surface and the non-eccentric tool to process the warped edge, the PV value of the mirror surface could be quickly converged from 66 μm to 10 μm by reasonably adjusting the processing parameters (Fig.6-7). Compared with previous mirror of the same type that only used eccentric tool to process, the surface convergence efficiency could be improved by more than 20%. It could be seen that by using the non-eccentric processing technology to process the edge part of the mirror, the edge effect problem had been well solved, which not only saved labor costs, but also greatly improved the processing accuracy and efficiency. ConclusionsAiming at the edge effect problem in the CCOS grinding process, a non-eccentric processing technology was proposed and the removal function of the non-eccentric tool was analyzed. The influence of process parameters such as processing pressure, grinding tool rotation speed and dwelling time on removal efficiency was studied by using the control variable method, and the edge processing effect using non-eccentric tool was experimentally verified. The results show that the non-eccentric tool could effectively remove the warping edge by properly adjusting the processing parameters such as processing force, rotation speed, grinding tool suspension ratio and processing area, the mirror surface after processing is flat, the problem of edge effect is solved. Finally, a new process flow was proposed for the grinding stage which was combining eccentric tool and non-eccentric tool, the eccentric tool was used to process the whole mirror surface and the non-eccentric tool was used to process the warping edge of mirror. This method could quickly improve the convergence efficiency of mirror surface processing, so as to achieve high efficiency and high precision processing.
May. 25, 2023Vol. 52 Issue 5 20220711 (2023)
Songqing You, Boya Xie, Kaikai Wu, Jing He, and Peng Yang
ObjectiveThe emergence and development of laser ranging technology has solved the problem that traditional measurement methods cannot take into account large-scale and high-precision measurement. It has the advantages of high resolution, large measurement range, and easy integration, which promotes the development of remote sensing, radar, equipment manufacturing and other related fields. Although the existing laser ranging technology has made great progress in terms of ranging range and resolution, it is easily affected by interfering signals in space and equipment time base frequency errors during the ranging process, resulting in laser signal. The echo is easily disturbed by noise during the propagation process, which affects the measurement accuracy. Therefore, a large-scale, high-precision, and traceable ranging method is an urgent requirement in current practical engineering applications. Aiming at the problems of being susceptible to environmental noise interference and frequency traceability in laser ranging applications, this paper studies the method of dual-frequency optical scanning ranging without optical interference that traces the Beidou time base. This method has strong anti-interference ability against noise. The Beidou time base improves the accuracy and stability of laser modulation, and provides a new research idea for absolute distance measurement.MethodsIn this paper, a theoretical model of dual-frequency optical scanning ranging without optical interference is established, and the relationship among distance, signal phase and scanning frequency is obtained. A Beidou/GPS dual-mode clock is designed as the frequency reference of the ranging experiment device to achieve the effect of remote source tracing (Fig.6). An experimental device of distance measurement was built, and a dual-frequency laser was prepared based on a fiber electro-optic modulator, which has the advantages of large frequency tuning range and fast scanning speed (Fig.10). A demodulation scheme combining electronic heterodyne detection and self-mixing is designed, and the polarization orthogonal dual-frequency laser is used as the carrier of the Michelson interferometer to achieve the effect of non-optical interference, and the high-frequency photocurrent signal is demodulated to the low-frequency ranging signal, reducing environmental noise and electronic noise (Fig.11).Results and DiscussionsThe Beidou/GPS clock uses the second pulse signal output by the dual satellite navigation system receiver as a reference, and uses the PID algorithm with dead zone to correct and compensate the frequency drift of the constant temperature crystal oscillator. Long-term frequency stability can be obtained without destroying the stability of the crystal oscillator. The frequency accuracy reaches 0.03 ppm (Fig.7). In the experiment, a device measuring dual-frequency optical sweeping distance was built that traces back to the Beidou time base. Using the signal analysis method of curve fitting, a large number of experimental data were calculated, and the measured distance in the ranging experimental device was 9.843 6 m. The measurement uncertainty is 1.25 mm, better than the untraceable 1.72 mm (Tab.3).ConclusionsIn this paper, the research on the absolute distance measurement of dual-frequency light is carried out, and the theoretical model of frequency-sweeping distance measurement by dual-frequency light is established. A method of using EOM to generate dual-frequency synthetic laser is proposed, and the time base calibration of the modulation signal source is performed through remote traceability, so that the time-frequency accuracy of dual-frequency light can meet the experimental requirements. A dual-frequency optical scanning ranging device was built, and a Beidou/GPS clock and electronic signal demodulation scheme was designed. Through Beidou/GPS clock timing calibration, the signal source time base frequency accuracy reaches 0.03 ppm (1 ppm=1×10⁻⁶). In the process of data processing, the measured distance is obtained by curve fitting the demodulated signal, and the Gaussian distribution of a large number of experimental data is counted to obtain an absolute distance measurement result of 9.843 6 m, with a measurement uncertainty of 1.25 mm (Fig.14). This method not only avoids the frequency error caused by the internal time base of the signal source due to the factors such as crystal oscillator aging and temperature which affect the measurement results, but also has a good ability to suppress environmental noise and electronic noise, and can achieve large-scale absolute distance measurement. The measurement accuracy is improved by an order of magnitude due to the use of AOM frequency sweep ranging, so it has a wide application prospect.
May. 25, 2023Vol. 52 Issue 5 20220582 (2023)
Liang Xu, Luyang Wang, Ziming Wan, Shiwei Zhao, Liye Zhou, and Tao Wang
ObjectiveDriven by military applications, the new generation of precision-guided weapons continues to develop toward improved guidance and strike accuracy. Imaging deviation is an important indicator of the aero-optics effect, which portrays the deflection effect of the aero-optics flow field on light propagation. The study of the imaging deviation of aero-optics can improve the guidance and strike accuracy of aircraft and provide support for the development of high-end military equipment in China, so it is necessary to conduct an in-depth study of its related problems.MethodsA typical blunt-headed vehicle was modeled and meshed using software (Fig.2) and a large number of flow field calculations were made based on the computational fluid dynamics software Fluent to obtain the flow field density around the vehicle under different operating conditions (Fig.5). The corresponding refractive index distribution was obtained by the correspondence between density and refractive index. The light transmission equation was solved using the fourth-order Runge-Kutta method, and the imaging deviation data were obtained using the inverse ray tracing method and the stopping criterion.Results and DiscussionsThe analysis of the refractive index distribution at different altitudes in the reverse light tracing (Fig.6) shows that the refractive index increases and then decreases along the propagation path as the light enters the aerodynamic optical flow field. The light tracing starts from the starting point inside the window, and the refractive index increases and then decreases against the direction of light incidence through the non-uniform flow field and finally reaches the free flow refractive index decreases until the end of the tracing. The refractive index of the non-uniform flow field near the optical window decreases with increasing altitude, and although the refractive index distribution of the light propagation path at different altitudes has the same trend, it has a different degree of change. As the altitude increases, the refractive index distribution on the light propagation path becomes flatter and the imaging shift becomes smaller (Fig.7, Fig.9, and Fig.11). Within 0-25 km, the slope of the imaging deviation increases in the negative direction of 0 as the angle of attack increases, indicating that a larger change in angle of attack results in a larger imaging deviation. The slope of 0° angle of attack is closer to 0 for the same altitude condition, which indicates that 0° angle of attack is the least sensitive to changes in deviation values. Also as the altitude increases, the slope of the deviation at the same angle of attack gradually approaches 0 in the negative direction of 0, which also indicates that a change in lower altitude causes a larger imaging deviation (Fig.8, Fig.10, and Fig.12).ConclusionsThe effect of different altitudes of 0°-15° angle of attack on the aero-optical imaging deviation of the blunt-headed vehicle was investigated. The computational analysis of the imaging deviation for every 1° angle of attack in the 0°-15° range was carried out one by one. The results of the study show that as the altitude increases, the refractive index distribution of the light propagation path at different altitudes becomes flatter and the imaging deviation value becomes smaller. As the angle of attack increases, the refractive index distribution on the light propagation path becomes more uneven, and thus the imaging deviation increases. The slope of the imaging deviation approaches 0 at higher altitudes and increases in the negative direction of 0 at larger angles of attack. This indicates that the imaging deviation value will show a large variation at low altitudes and a large angle of attack. The results show that the effect of a high Mach number at 25 km on the imaging deviation is greater than that of atmospheric density, and this result is going to be analyzed in the future in a comprehensive analysis of the results of high Mach number calculations for more different operating conditions, and then to explore the influence of related factors on practical applications. The results are expected to give a reference for theoretical calculations for the integrated design of flight altitude, velocity, and imaging attitude of infrared-guided vehicles.
May. 25, 2023Vol. 52 Issue 5 20220671 (2023)
Chuangwei Guo, Yang Wang, Wenzhe Zou, Yuqing Guan, Yujie Zhang, Liqin Liu, Zhishan Gao, and Lihua Lei
ObjectivePhase Measurement Profilometry (PMP) has become the mainstream optical three-dimensional measurement method due to its advantages of high imaging accuracy and fast reconstruction speed. Phase Measurement Profilometry performs surface reconstruction through phase calculation of projected images. The accuracy of phase calculation largely determines the final three-dimensional reconstruction accuracy. Therefore, obtaining high-precision unwrapped phase is the key step of measurement. Multi-frequency heterodyne is a commonly used unwrapping phase algorithm in phase measurement profilometry. When unwrapping the wrapped phase, due to the influence of the measurement environment, the characteristics of the object surface, the nonlinear error of the camera and projector, and other factors, the fringe series will be incorrectly rounded, and the unwrapped phase will produce a jumping phase error. This jumping error will lead to the wrong concave and convex areas or burrs on the surface of the reconstructed object, which greatly affects the accuracy of 3D reconstruction. Therefore, it is necessary to study a correction method that can eliminate or compensate the jumping error. Thus, a phase correction method based on multi-frequency heterodyne principle is proposed.MethodsThe specific flow of the phase correction method based on the principle of multi-frequency heterodyne is drawn (Fig.2). The initial wrapped phase and the unwrapped phase are calculated by using the traditional phase shift method and multi-frequency heterodyne. Because there are two different jumping errors in the unwrapped phase, the cause of the error and the error location are preliminarily determined by the gradient and amplitude of the unwrapped phase. By comparing the phase amplitude of multiple wrapped phases with different frequencies at the problem point, whether the error at the problem point really exists is determined. According to the principle of multi-frequency heterodyne, the error amplitude introduced by the error item is analyzed, and the pixel with the error is corrected to obtain a new unwrapped phase.Results and DiscussionsPhase Measurement Profilometry is used to reconstruct the standard sphere in three dimensions, and the proposed phase correction method is used to correct the error of the unwrapped phase. By comparing the original unwrapped phase (Fig.4(a)) and the corrected unwrapped phase (Fig.4(c)), it can be observed that the phase mutation region in the original phase distribution map has been successfully eliminated and the phase error has been successfully repaired. The 470th line of the unwrapped phase before and after correction is observed (Fig.4(b) and Fig.4(d)). The abrupt phase area of the original unwrapped phase map at the corresponding pixel position has been successfully repaired. The corrected unwrapped phase transition is smooth without phase abrupt change. The point cloud reconstruction before and after correction is compared (Fig.6), the surface defect area caused by unwrapping phase error has been well repaired.ConclusionsIn view of the jumping error in the existing multi-frequency heterodyne phase demodulation process, a phase error correction algorithm is proposed based on the full analysis of the reasons for the jumping error in the principle. The principle of this method is simple and easy to implement, the error correction is accurate and the correction speed is fast. The source terms that cause the error are analyzed, the error type is determined and phase correction is carried out through multiple discussions. After correcting the standard sphere unwrapped phase of the traditional multi-frequency heterodyne measurement, all the jumping errors in the original unwrapped phase are corrected. The experimental results show that this method can accurately locate the cause and region of the jumping error and effectively correct the jumping error in the unwrapping phase. The unwrapped phase corrected by this method is smooth without jumping, and the 3D point cloud reconstruction surface has no abnormal concave and convex areas, which realizes the elimination of the jumping error in the unwrapping phase, and verifies the feasibility and effectiveness of this correction method.
May. 25, 2023Vol. 52 Issue 5 20220697 (2023)
Xiaoming Li, Guoshuai Zhu, Minghang Guo, Yingze Liu, and Chong Zhang
ObjectiveIn laser communication and photoelectric tracking systems, the pointing, acquisition and tracking (PAT) mechanism based on optional grating or wedge has been used to adjust the angle of the optical axis. This structure is light in weight and small in size, which is very beneficial to the lightweight and miniaturization of the system. Since the coaxiality error of the two rotating axes of the structure seriously affect the performance of the PAT mechanism, it is necessary to strictly ensure the parallelism of the two axes during mechanical assembly. For the cross-tracking frame gimbal, the precision of shafting angle position depends on the verticality of two axes, which can be measured by autocollimator with optical mirror. But in optional grating or wedge PAT system, the gimbal is characterized by two rotating axes coaxially arranged to drive two gratings to rotate respectively, and the test method for cross-tracking frame gimbal is not applicable. The existing parallelism measurement methods, such as contact measurement and non-contact measurement, are straight-line measurements, contact measurement includes micrometer measurement and three-coordinate measurement, and the required angular deviation between two rotating axes of a coaxial turntable can be obtained only after data conversion. When the diameter of the distribution circle is small, its accuracy is low, and there are problems such as inconsistent conversion standards, poor conversion data accuracy, and low confidence. Therefore, it is necessary to establish the methods for angle parallelism measurement of grating or wedge PAT system with high precision, high reliability and high convenience to solve the engineering problems in the process of gimbal test and assembly.MethodsA non-contact optical measurement method is proposed, and it uses an autocollimator as the only reference to measure the axis angle of two coaxial shafting without moving the autocollimator and the test gimbal in the test (Fig.4). Data processing is used to eliminate the influence of shafting sloshing to get the spatial position of the rotating axes. By comparing the angular deviation of the two axes, the parallelism of the two rotating axes can be measured. A semi-reverse semi-transparent reference mirror is designed in order to solve the problem of mutual occlusion of mirrors (Fig.4). The semi-reflection semi-transmission reference mirror can reflect collimating laser when testing its own shafting and project self-collimating light when testing another shafting (Fig.5). The spatial position of the axis of the rotating shafting is obtained by fitting the measured data with a least squares. Then the influences of the number of data points (Fig.6), the uniformity of data distribution (Fig.7), the dispersion of data distribution (Fig.8) and the accuracy of test points on the accuracy of test results are analyzed.Results and DiscussionsThe fitting program is compiled by MATLAB , and a double-grating PAT mechanism is tested, the required coaxiality is better than 10″. In the test, 16 measuring points data are measured by TAHS 300-57 autocollimator whose measuring accuracy is 0.75′, and the distribution error of measuring points is less than 10°. Then the uncertainty of the measurement result is 0.8″, and the measuring precision of this method fully meets the requirement. In the test the error of comprehensive parallelism is 5.1″, and the sloshing error of two shafting is 3.96″ and 3.12″ (Fig.9). The two-axis combined swing error caused by unparallelism and shafting sloshing is calculated as the square root of two-axis parallelism error and two-axis sloshing error respectively (6.5″, 5.8″). After the alignment of the liquid crystal grating, the performance of the system axis is calibrated by optical method. In the two tests, the maximum value of the swing error of the synthetic shafting on the x-axis and y-axis is about 5.82″ and 5.48″, and the maximum value of the swing error on the x-axis and y-axis is about 6.01″ and 5.66″ (Fig.10). The deviation between the assembly period and the test results is (10%, 5.5%, 7.6% and 2.4%) respectively. ConclusionsIn this study, a parallelism testing method based on auto-collimation principle is proposed, and a testing device is designed. It innovatively realizes that the angle and parallelism of two parallel shafting axes can be measured under the same reference without adjusting the test and the tested equipment. This method only needs one test equipment, which eliminates the measurement and transformation errors in the benchmark conduction and transformation when the traditional multiple test equipment is used for joint measurement, and improves the test accuracy and efficiency. Then the error link in the test is studied, and the uncertainty of the test method is analyzed. The method of the paper can solve the problem of high precision and high reliability parallelism measurement of PAT mechanism. It is used in an coaxial PAT gimbal with grating. Through the experiment and test, it is proved that the deviation between the test result and the final-state test result is less than 10%. It is proved that the testing precision is good and the parallelism between coaxial rotors can be effectively measured.
May. 25, 2023Vol. 52 Issue 5 20220794 (2023)
Ming Liu, Wenbo Yang, Delong Liu, Jiannan Sun, Zhe Kang, and Zhenwei Li
SignificanceAt present, the mobile tracking station, with its advantages of high mobility, high flexibility, wide observation range and low networking cost, is gradually becoming an important system component in the space target monitoring network and is widely used for common-view observation and precision tracking of spatial objectives. The rapid angular velocity motion of the space debris causes the dynamic axis of the telescope to become unstable during tracking, resulting in a dynamic bias in the telescope's pointing. In particular, the operating conditions of the mobile station are complex and frequently changing, leading to deviations in the pointing accuracy provided by the telescope's encoder. However, precise pointing accuracy is a prerequisite for astronomical positioning and target identification by optoelectronic telescopes, so dynamic pointing errors in mobile stations must be corrected to ensure the accuracy of space target positioning. To address the dynamic pointing errors caused by the above factors, a pointing error correction method based on star pattern matching deviation calibration is provided.MethodsFirstly, the acquired images are processed by extracting the centroid coordinates of the measured stars, filtering the catalogue of calibration stars, and converting the stellar position coordinates. The Source-Extractor software is used to perform threshold segmentation, contour extraction and centroid coordinate extraction of the measured stars on the acquired images (Fig.2). The catalogue of calibration stars is filtered by the rough pointing provided by the telescope's encoder to determine the population of calibrated stars at the current pointing and the field of view. The SOFA package is called to perform a coordinate transformation of the coordinates of the calibration stars, transforming the flat position of the filtered calibration star at J2000 to the apparent position of the station, i.e. the azimuth and elevation of the calibration stars (Fig.4); Secondly, a rapid star pattern matching algorithm for star deviation calibration is used to identify the coordinates of calibration stars that match the measured stars, and take them as the theoretical positions. The star pattern matching algorithm for the first frame is based on classical triangle matching to improve robustness and adds star deviation calibration features to speed up the construction of feature triangles (Fig.5), the matching of subsequent frames uses the plate constants derived from the first frame to calculate the celestial coordinates of the measured star and compares them with the calibration stars in the filtered catalogue to determine whether the difference is within the tolerance limits (Fig.6); Finally, the pixel coordinates of all the measured stars are brought into a mathematical model of star deviation calibration to fit and calibrate the telescope pointing (Fig.1).Results and DiscussionsIn order to verify the effectiveness of the pointing correction method and the accuracy of the correction, a verification experiment of the pointing correction algorithm was carried out on a 400 mm aperture photoelectric telescope at a station located at 125.4443° longitude and 43.7907° latitude. The relevant telescope parameters are given (Tab.1). The experimental results demonstrate that the correction period of a single frame is about 2.2 s when a set of sequential images is acquired to correct the optical centre pointing, and the amount of correction generally stabilises from the 10th frame onwards. The pointing corrections were applied to a group of sub-sky regions with a typical distribution of the total sky area, and the mean pointing error is increased from 124.24″ to 4.97″ (Fig.9) and the standard deviation is increased from 41.50″ to 4.76″ before the correction (Fig.10). The telescope was pointed at the standard source Polaris, and the corrected photocentre pointing is 1.776″, which is different from the theoretical value, that is, the correction accuracy of this method is better than 1.8″ (Fig.11).ConclusionsThe above experiments show that the pointing correction method based on star pattern matching deviation calibration is effective in improving the pointing accuracy of the station's telescope. The method is reliable and accurate in complex mobile station conditions and is suitable for correcting the pointing of the mobile station's telescope. In addition, the correction process is independent of the telescope's frame configuration, so it can be applied in pointing corrections for telescopes with different frame configurations, such as equatorial or geostrophic.
May. 25, 2023Vol. 52 Issue 5 20220813 (2023)
Xinxin He, Bin Liu, Chunliu Wang, and Guanhao Wu
ObjectiveFringe projection profilometry (FPP) has been established in a wide range of industrial applications. Its key advantages include high accuracy, fast speed, robustness, and non-contact operation. However, image saturation occurs inevitably in measuring high-reflective surface due to the light intensity exceeding the dynamic range of camera sensor. It leads to absolute phase errors and 3D reconstruction failures. It is not an effective approach to address this issue by roughly reducing the exposure time of the camera or shrinking the size of the lens aperture because the SNR of the fringe patterns would decrease. Therefore, measuring high-reflective surface is still a challenging task for conventional FPP. In this paper, we propose a block-smoothed adaptive fringe projection method for high-reflective surface measurement to achieve accurate 3D reconstruction.MethodsFirstly, the saturated region is extracted and then divided into several blocks by projecting several uniform gray patterns. The initial projection intensity of each block is calculated according to the saturation degree. Secondly, the surface is illuminated by one set of bright fringe patterns and one set of dark ones in the unsaturated condition. The absolute phase map in the extracted saturated region is obtained by fusing the phase maps of the bright and dark fringe patterns. The coordinate mapping between the camera pixels and the projector units is carried out by the integrated phase map. And the initial mapping projection intensity on the projector is gathered. Thirdly, the polynomial function is fitted to the initial mapping projection intensity. The function is utilized to construct the smooth projection intensity curve. The optimal projection intensity of each saturated pixel is refined. And the mapping holes caused by the inconsistent resolution of the camera and projector are filled simultaneously. The adaptive fringe patterns are eventually generated. Finally, the adaptive fringe patterns are projected to the high-reflective surfaces to implement accurate phase retrieval and three-dimensional reconstruction.Results and DiscussionsTwo metal parts and one porcelain were measured to verify the performance of the proposed method. Compared with the traditional and two previous methods, the proposed method is capable of generating more accurate and smooth optimal projection intensity (Fig.11-13). As a result, the image saturation is efficiently avoided while the SNR is guaranteed. The reconstruction of the proposed method achieved more smooth boundaries between the high-reflective and normal regions. Moreover, the reconstruction of the high-reflective region had no holes and less burrs. One metal plane was employed to evaluate the measurement precision of the methods (Fig.14). The measurement error of the proposed method decreased by 40% and 28.6% over the previous methods (Tab.1).ConclusionsThe experimental results proved that the proposed method could generate more accurate and smooth optimal projection intensity map to deal with the image saturation problem while measuring high-reflective surface. The ambiguity of the refined optimal projection intensity is also corrected by using the proposed method, thereby establishing more accurate coordinate mapping between the camera pixels and projector units. In addition, the mapping holes are filled. The method improves the precision of measuring high-reflective surface effectively.
May. 25, 2023Vol. 52 Issue 5 20220825 (2023)
Weiwei Chen, Jianrong Qiu, and Guoping Dong
SignificanceAt present, gain fibers of lasers and amplifiers used in optical communication systems are more common in rare earth ion-doped glass fibers. However, the inherent f-f transition of rare earth ion leads to the narrow transmission bandwidth which cannot meet the increasing demand for network data traffic transmission. Bi-activated optical glasses and fibers can exhibit broadband NIR luminescence in a spectral region of 1000-1800 nm spanning the whole low-loss optical communication window, which possesses unique advantages over traditional rare-earth ions and transition metal ions doped glasses or glass-ceramics. Moreover, Bi-doped glass fibers have achieved laser output and optical signal amplification in the range of 1150-1550 nm and 1600-1800 nm. This fully shows that Bi-doped glass fiber is expected to solve the problem of insufficient data transmission capacity, and becomes a gain material for the next generation of fiber lasers and amplifiers.ProgressThe research progress of Bi-doped glass and fiber can be illustrated by the discussion of the luminescence mechanism, the performance improvement of Bi-doped glass, the exploration of optical fiber preparation methods, and the application progress of Bi-doped fiber. Bi has the electronic configuration of (Xe) 4f145d106s26p3, where the outer 6s and 6p electrons have the significant interaction with the host glass, thereby showing host dependent absorption and emission properties and exhibiting a number of oxidation states such as +1, +2, +3 and +5. Thus, there are a number of hypotheses regarding the origin of NIR luminescence centers in Bi glasses: Bi clusters, BiO, Bi5+, Bi+ and some other low valence states of Bi ions including metallic Bi, point defects, and Bi dimers. At present, it is generally accepted that the NIR luminescence of Bi comes from low-valence Bi ions such as Bi+ and Bi0 (Fig.1 and Fig.2). Because Bi related NIR photoluminescence is quite sensitive to the local chemical environment, broadband NIR luminescence can be achieved in a variety of matrix glasses. However, low efficiency and narrow bandwidth (emission bandwidth is difficult to cover the communication C- and L-band with important applications) are the main problems of Bi-doped glass. Thus, diverse strategies were proposed to improve the optical performance of Bi-doped glass, such as modifying glass structure, constructing local reduction environment, employing high-energy radiation, co-doping multiple ions and inducing multiple Bi emission centers (Fig.4-8). The efficient luminescence of glass is critical to the gain characteristics of subsequent fibers. Similarly, the preparation method of the optical fiber is also very important to obtain a high-performance optical fiber. Thus, various fiber preparation methods, such as MCVD (Modified Chemical Vapor Deposition), molten core, and rod-in-tube method, were explored for the preparation of Bi-doped fibers with different needs (Fig.9-11). The Bi fiber prepared by MVCD method shows the characteristics of high purity and low loss, and is the most commonly used method at present. By co-doping Bi and different modified ions (Al, P, and Ge) in the core glass, laser output and optical signal amplification in different spectral regions (1160-1775 nm) can be achieved and expanded (Fig.12 and Tab.1). The wavelength of Bi fiber lasers and amplifiers can cover the 1160-1775 nm region, which not only includes the area covered by rare earth ions-activated fiber lasers, but also makes up for the gaps in other communication bands of today's fiber lasers. Conclusions and ProspectsOver the years, significant results have been achieved in theory, preparation method, performance optimization and practical application for Bi-doped glass and optical fiber, which have laid the foundation for the development of new, broadband, high-efficiency and tunable lasers and amplifiers, and are also very in line with the development needs of large-capacity and high-speed optical communications in the future. In addition, there are many other challenges, one of which is figuring out the active state in the Bi-doped glass and optical fiber that causes NIR emission. Many hypotheses were reported based on experimental facts, but none confirmed all the properties in the Bi-doped fibers. By understanding the active state of the Bi that contributes to NIR emission, fiber manufacturing conditions can be optimized to develop highly efficient fibers for lasers and amplifiers. This requires a great deal of attention, and once solved, it will revolutionize the next generation of Bi-doped fiber lasers and amplifiers.
May. 25, 2023Vol. 52 Issue 5 20230097 (2023)
Xiran Zhu, Bin Zhang, Zilun Chen, Desheng Zhao, Linyong Yang, and Jing Hou
ObjectiveMid-infrared superfluorescent fiber sources (SFS), working between fluorescent and laser, not only have good spatial coherence, wide emission spectrum and high brightness, but also have no mode competition, no relaxation oscillation and high temporal stability compared to laser. It has been applied to gas detection, optical coherence tomography, and optical fiber sensing. At present, most of the reports on SFS focus on the near infrared band of 1-2 µm, while in the mid-infrared band, there are few reports. Besides, all the works on mid-infrared SFS is based on the space pumping structure, which is mainly caused by the lack of mid-infrared side-pump combiner. In the scheme of space pumping, pump laser is collimated and then focused into the end face of the gain fiber to realize the coupling, and the mid-infrared SFS filtering is realized through a dichroic mirror and a long-wave filter. The structure of this scheme is relatively complex and the system stability is poor. Besides, the end face of the fluoride fiber is easy to be damaged due to the end face pumping, so the injected pump power is limited. Therefore, the development of the mid-infrared side pump combiner can not only realize all fiber structure of mid-infrared SFS and overcome the problems caused by space pumping, but also realize high-power mid-infrared SFS output through backward pump. For this purpose, a home-made mid-infrared fiber side-pumping combiner and mid-infrared all fiber SFS are designed and realized in this paper.MethodsFirstly, a home-made mid-infrared fiber side pumping combiner is developed on a passive double clad fluoride fiber with 125 μm cladding diameter by tapered fiber side coupling principle (Fig.1). Influence of different tapering fiber profiles on combiner’s coupling efficiency has been studied. The output power and heating condition of the combiner as the pump power increasing have also been studied. Secondly, a home-made mid-infrared fiber side pumping combiner is developed directly on a Er3+-doped double clad fluoride fiber to obtain mid-infrared all-fiber SFS by the same way. Both ends of the gain fiber are cut at 12° to reduce the threshold of laser self-excited oscillation and increase the output power of mid-infrared SFS. When the output is measured, the output is collimated through a calcium fluoride lens at first and then filtered through a 2.4 µm long wave filter (LF) to remove the residual pump light at 976 nm and SFS near 1550 nm to obtain pure mid-infrared SFS (Fig.2). Both forward and backward output power and spectrum are measured. Results and DiscussionsOptimized tapering parameters of 5 cm taper length, 1.5 cm waist length and 15 µm waist diameter has been chosen. At the maximum pump power of 87.5 W, the output power of the combiner reaches 71.3 W, and the highest hot spot of combiner reaches 105 ℃. The corresponding coupling efficiency and the maximum pump power are up to 82.3% and 87.5 W, respectively. By fabricating side-pumping combiner on the Er3+-doped double clad fluoride fiber directly, the generation of all-fiber mid-infrared SFS source is achieved. The mid-infrared SFS power sum is 91.09 mW (backward output of 53.67 mW, forward output of 37.42 mW), and the output spectrum ranges from 2702 nm to 2830 nm. The maximum 20 dB bandwidth reaches 108 nm when SFS power is 33.03 mW. This proposed scheme overcomes the problems of spatial pump’s high complexity and difficult adjustment, and is of great significance for further power amplification of mid-infrared SFS. However, the gain fiber used in this paper has a low doping concentration and a short fiber length, which limits the improvement of the output power and efficiency of mid-infrared SFS. In the future, the power can be further improved by increasing the doping concentration of fiber to alleviate the self-terminating phenomenon of Er3+ level and optimizing the length of gain fiber to improve the absorption efficiency of pump laser. ConclusionsThis paper reports the development of mid-infrared side-pumping combiner and all-fiber SFS source. Based on the side-coupling principle of tapered fiber, a mid-infrared side-pumping combiner is developed on the passive double-clad fluoride fiber with a cladding diameter of 125 μm. The coupling efficiency of the combiner is up to 82.3%, and the maximum available pump power is 87.5 W. By directly fabricating the combiner on the gain fiber, this paper realizes the generation of all-fiber mid-infrared SFS source for the first time. The maximum power sum of mid-infrared SFS output forward and backward is 91.09 mW (backward output of 53.67 mW, forward output of 37.42 mW), and the output spectrum ranges from 2702 nm to 2830 nm. When the total output power of mid-infrared SFS is 33.03 mW, the maximum bandwidth of 20 dB at 108 nm is obtained. The mid-infrared side-pumping combiner and the all-fiber SFS source developed in this paper can not only improve the compactness and reliability of the mid-infrared SFS source, but also provide a good solution for further power amplification of the mid-infrared SFS source.
May. 25, 2023Vol. 52 Issue 5 20230101 (2023)
Jinjin Chen, Gangjie Zhou, Yan Tan, Shixun Dai, and Changgui Lin
ObjectiveInfrared thermal imaging technology has irreplaceable application value in the current national defense and military field. It is the key component of infrared warning, search and tracking, precision guidance and other modern all-weather war applications. In order to meet the compatibility requirements of various high-performance photoelectric weapon platforms, the lightweight, miniaturization and low-cost of infrared optical systems have become important indicators for the comprehensive performance evaluation of new-generation infrared imaging systems. To realize the fabrication of a new generation of thin and light infrared optical system, it is urgent to develop a new type of manufacturable infrared optical materials, striving to provide more material choices and more freedom of design for the design of infrared optical system. For this purpose, the new generation of infrared imaging optical system based on novel chalcogenide glasses is designed here.MethodsThree new typical optical systems based on novel chalcogenide glass materials are developed in this paper. We have exploited novel chalcogenide glass materials by taking full advantage of the special characteristics of modifiable glass components and tunable dispersion parameters. Using the high refractive index chalcogenide glass NBL-TQIR-1, whose refractive index is 3.18, the small-sized germanium-free design of the mid-wave infrared (MWIR) imaging optical system can be effectively realized (Fig.2). To match the uncooled mid/short-wave infrared (MW/SWIR) confocal plane infrared detector, the lightweight common path optical system is designed utilizing the novel stacked gradient refractive index (GRIN) sulfide glass lens with different refractive index difference Δn=0.25 (Fig.3). To match the cooled medium/long-wave infrared (MW/LWIR) confocal plane infrared detector, the compact common path optical system is designed utilizing the novel GRIN sulfide glass lens with different refractive index difference Δn=0.3 (Fig.4). Under the requirements of the same system index, the performance of infrared optical systems based on traditional infrared materials and novel chalcogenide glass is compared respectively (Tab.4-Tab.6). Results and DiscussionsBased on the novel high refractive index chalcogenide glass NBL-TQIR-1 lens, the small-sized non-germanium MWIR double-fields optical imaging system is designed. The results of CODEV simulated analysis show that the performance of this NBL-TQIR-1 optical system is better than that of the traditional infrared materials. At the same time, the new optical system has two fewer lenses and one less aspheric surface than the traditional crystal optical system, the weight of the optical system is reduced by 35%, the length of the optical system is reduced by 15%, and the transmittance is increased by 10%. Based on the novel Δn=0.25 GRIN sulfide glass lens, the lightweight common path MW/SWIR confocal optical system is designed. The results of CODEV simulated analysis show that the novel dual-band NBL-GRIN MW/SWIR optical system is designed using only two new sulfide lenses, two fewer lenses and one fewer aspheric surface than the traditional materials optical system, and the removal of diffraction surfaces. Under the same performance requirements, the weight of the new optical system is reduced by 40%, the length of the system is reduced by 30%, and the transmittal rate is increased by 15%. The optical transfer function MTF (@ characteristic frequency 42 lp/mm) of the former is 10% higher than that of the latter. Based on the novel Δn=0.3 GRIN sulfide glass lens, the compact common path MW/LWIR confocal optical system is designed. The results of CODEV simulated analysis show that the novel dual-band optical system is designed by using only two lenses, the performance of the NBL-GRIN MW/LWIR optical system is comparable to that of the conventional optical system. However, the total length of the system is reduced by 20%, the weight is reduced by 25%, and the transmittance is increased by 18%. As the NBL-GRIN chalcogenide glass dual-band optical system has two fewer lenses and two fewer aspheres, the fabrication and assembly costs of the new system have been greatly reduced. ConclusionsIn this study, the novel chalcogenide glasses with high refractive index and gradient refractive index are exploited. High refractive index chalcogenide glass NBL-TQIR-1 can replace germanium lens in MWIR optical system so as to realize the small-sized and low cost design. The GRIN chalcogenide glass with different refractive index difference Δn has excellent chromatic aberration correction ability in the dual-band imaging system, providing rich dispersion options for the miniaturization design of a new generation of confocal dual-band infrared imaging systems. The appearance of novel chalcogenide glass is a beneficial supplement to the existing infrared materials, and provides more material choices and more freedom of design for the new generation of transmissive infrared imaging system.
May. 25, 2023Vol. 52 Issue 5 20230102 (2023)
Xiaogang Liu, Yantao Xu, Haitao Guo, Xingtao Yan, Depeng Kong, Xiaoming Shen, Yanjie Chang, and Hao Zhang
ObjectiveThe 8-10 μm far-infrared spectrum is in the infrared radiation band at natural temperatures and covers the characteristic "fingerprint spectrum" of many molecules, so it has important applications in the military, medical and environmental monitoring fields. Infrared coherent fiber bundles which can realize the flexible transmission of infrared image are the basic components for assembling various infrared optical systems, and they can be used in the narrow space, high-intensity electric or magnetic field in particular. The main types of far infrared fibers mainly include crystal fiber, hollow fiber, photonic crystal fiber and Te- based chalcogenide glass fiber. Among them, Te-based fiber is an excellent far-infrared transmission material due to its wide transmission band, stable thermal, chemical properties, which means it is especially suitable for the preparation of coherent optical fiber bundles with large array. Until now, a series of components such as Ge-As-Se-Te, GeTe-AgI, Ga-Ge-Te, Ge-Te-I and As-Se-Te have been studied. However, the optical loss of Te-base fiber is still higher at present, which limits the transmission distance of infrared signal and the resolution of the infrared bundles. Therefore, it is necessary to study the purification technology for optimizing the optical loss.MethodsHigh purity raw materials of As, Se and Te were purified by multi-distillation purification technique and the content of O element was examined by EPMA. As-Se-Te chalcogenide glass was chosen and melted by different preparation process and their infrared transmission spectra were measured by FTIR. The optical fiber was drawn by the rod-in-tube method. The drawing temperature was 240 ℃ with the accuracy of ±0.2 ℃, and the drawing speed was about 10 m/min. The coherent fiber bundle was prepared by ribbon-stacking technique. The end face was observed by microscope. Infrared image was detected by home-made optical system and mercury cadmium telluride detector was used (Fig.2).Results and DiscussionsThe oxygen content of As, Se, Te raw materials decreased from 1.3 at%, 0.46 at% and 0.48 at% in raw materials to 0 at% (undetected), 0.06 at% and 0.15 at% in purified materials respectively, indicating that the distillation process was effective (Tab.1). The transition temperature Tg is 137.5 ℃ for core material and 139.1 ℃ for clad material (Fig.3), which are very close and match well. No obvious crystallization peak was observed in the test temperature range, indicating that the core and clad glass are suitable for fiber drawing. Smooth spectrum was obtained in the sample of aluminum as a deaerator (Fig.4). The optical fiber with an outer diameter of 100 μm was obtained. Its bending radius is less than 5 mm, and the baseline of the optical loss is about 0.2 dB/m in the far infrared range (Fig.5). Finally, the coherent fiber bundle with 22.5 thousand pixels and close-packed arrangement was prepared. The total fracture rate is less than 3‰ and there are none black or dark pixels in the center region of the bundle. The bundle transmits infrared beam uniformly and the image of the infrared target is clear and distortionless, which indicates that the comprehensive properties of the bundle are satisfactory (Fig.6).ConclusionsFar-infrared fiber bundles was prepared and measured. In order to eliminate impurities, As-Se-Te chalcogenide glass was chosen and the high purity raw materials of As, Se and Te were purified. As-Se-Te glasses were melting by different preparation process and their infrared transmission spectra were measured and analyzed. The results show that excellent thermal and far-infrared transmitting performance can be obtained in the sample of Al as deoxidizer process. The optical fiber was drawn with an outer diameter of 100 μm, bending radius of less than 5 mm, optical loss of 0.2 dB/m. The coherent fiber bundle was prepared by ribbon-stacking technique. It has 22.5 thousand pixels and the total fracture rate is less than 3‰. The infrared target imaging was distortionless and showed fine temperature resolution, demonstrating that the bundles can be widely used in infrared imaging systems.
May. 25, 2023Vol. 52 Issue 5 20230110 (2023)
Yifan Zhang, Yifeng Hong, Yulin Sheng, and Yingying Wang
SignificanceMid-infrared optical fiber is an important tool in the field of mid-infrared optics with applications in mid-infrared laser generation and transmission, biomedical detection, environmental detection and other fields. However, traditional mid-infrared optical fibers suffer from fabrication difficulties and poor chemical stability of substrate materials, substantially limiting their developments. Compared with solid-core fibers, hollow-core fibers release the dependence on the substrate materials. By constructing microstructures in the cladding, light is confined, in the central air core, thus providing an ideal transmission channel with low loss, low dispersion, low delay, low nonlinearity, and high damage threshold. It opens a new path in the development of mid-infrared fibers.ProgressThis paper reviews the development history, research status and application prospects of silica-based and soft glass-based mid-infrared hollow-core fibers in terms of fiber structure, fabrication method, material absorption and transmission performance. By numerical simulations, we show the relationship between absorption loss and confinement loss with core size, wall thickness and wavelength in silica-based single-ring structure and nested tube structure anti-resonant hollow-core fiber. It provides design guidelines for the low-loss mid-infrared anti-resonant hollow-core fiber.Conclusions and ProspectsCompared with mid-infrared (MIR) solid core fiber, MIR hollow-core fibers (HCF) have overcome the material absorption of silica in the mid-infrared band, expanded the guiding window of silica-based HCF, and realized low loss light transmission in the mid-infrared band. The characteristics of low dispersion, low delay, low nonlinearity and high damage threshold make more advantageous in the field of mid-infrared laser. Although the bending loss of MIR-HCF is continuously reduced by iteration and optimization of the fiber structure, there is still a certain gap between them and solid core fiber, which will be an important research direction in the field of mid-infrared hollow core fiber in the future. Currently, mid-infrared hollow fibers have a wide range of applications in the fields of mid-infrared laser generation and transmission, biomedical sensing, communication and other fields. In addition to silica materials, many soft glass materials (such as sulfide glass and tellurite glass) have inherent low material absorption properties, which provide more material choices for the preparation of MIR-HCF. In the future, the development of MIR-HCF will continue in improving the fabrication technology, optimizing the fiber structure, broadening the transmission window, reducing the attenuation and be applied to various fields.
May. 25, 2023Vol. 52 Issue 5 20230132 (2023)
Ruicong Wang, Zhi Zhang, Changjun Xu, Shunbin Wang, Shijie Jia, and Pengfei Wang
SignificanceThe 3-5 μm mid-infrared band contains the atmospheric transmission window and the molecular fingerprint area, and has important research significance and development prospects in the fields of remote sensing, national defense, biomedicine and materials processing. Fiber lasers have good beam quality, high light-to-light conversion efficiency, good heat dissipation characteristics, compact structure and high reliability. The output wavelength of fiber lasers is currently expanding to the mid-infrared band, however, the phonon energy of the glass matrix is an important factor affecting the generation of mid-infrared lasers. The lower the phonon energy of the matrix material, the lower the multi-phonon relaxation rate of the rare-earth ions, thus promoting the radiation transition process. Heavy metal fluoride glasses demonstrate great potential for applications in mid-infrared fiber lasers due to their relatively low phonon energy, wide mid-infrared transmission window, high solubility of rare earth ions and high thresholds of laser damage resistance. With the increasing demand for 3-5 μm laser sources in the mid-infrared band, the development of a relatively low phonon energy fluoride glass is essential. The most extensively investigated fluoride fibers are fluorozirconate fibers such as ZBLAN fibers. In recent years, it has attracted interest as researchers have found that fluoroindate glasses have lower phonon energy, superior physical and chemical stability compared to fluorozirconate glasses. The relatively wide mid-infrared transmission window and low theoretical loss of fluoroindate fibers indicate that fluoroindate fibers have important research significance in the field of mid-infrared fiber lasers.ProgressThis paper first introduces the research progress of fluoroindate glasses, including the investigation of the components, structure and luminescence properties of fluoroindate glasses. It is shown that the design of fluoroindate glass components is very complex and requires comprehensive consideration of the properties of each cation and application requirements. The structure of fluoroindate glasses is analyzed to be mainly composed of [InF6]3- octahedra. It is introduced the main rare earth ions that can achieve 3-5 μm mid-infrared fluorescence in fluoroindate glasses are Er3+ ions, Dy3+ ions, Ho3+ ions and Pr3+ ions, indicating that fluoroindate glasses are the promising gain material to achieve mid-infrared fiber lasers. Subsequently, the preparation of low-loss fluoroindate fibers is presented, laying the foundation for the establishment of mid-infrared fluoroindate fiber lasers. The research advances in fluoroindate fiber lasers are presented. The rare earth ions that can achieve 3-5 μm mid-infrared lasers in fluoroindate fibers are Er3+ ions, Dy3+ ions and Ho3+ ions, in which the ~3.9 μm laser of Ho3+ ions is the longest wavelength laser achievable in fluoride fibers, and the ~3.9 μm laser has been achieved only in fluoroindate fibers at room temperature so far, indicating that fluoroindate fibers are the potential mid-infrared fiber lasers. Conclusions and ProspectsThis paper reviews the latest research advances in the components and structures of fluoroindate glasses, presents the research advances of the luminescence properties of fluoroindate glasses. The preparation of low-loss fluoroindate fibers is presented, laying the foundation for the establishment of mid-infrared fluoroindate fiber lasers. The research advances of fluoroindate fiber lasers is reviewed, showing that fluoroindate fibers are the most promising material to achieve mid-infrared fiber laser. The preparation of low loss double cladding fluoroindate fibers can be achieved in the future by investigating the double cladding fluoroindate glass components and the double cladding fiber drawing process, which is conducive to achieving high power mid-infrared laser output. The output performance of the mid-infrared fiber laser can be further optimized by adjusting the rare-earth ion doping concentration of the fluoroindate fiber and constructing an all-fiber laser system to reduce the influence of the environment on the fiber laser system, thus achieving high power and high efficiency mid-infrared laser output.
May. 25, 2023Vol. 52 Issue 5 20230149 (2023)
Senyu Wang, Junsheng Chen, Xinsheng Zhao, Hao Lei, Hongyu Luo, and Jianfeng Li
SignificanceIn the mid-infrared band, 3-5 μm is a very special window, and it covers many intrinsic absorption peaks of molecules and atoms. Moreover, it is one of the transparent windows of the atmosphere. Therefore, lasers working in this band have great application prospects in various fields such as gas detection, material processing, biomedicine, military confrontation and remote sensing. Compared with quantum cascade lasers, solid-state lasers, and optical parametric lasers, fiber lasers have advantages of excellent beam quality, good heat dissipation, easy miniaturization and integration, high conversion efficiency, and good robustness. It stands out in the field of mid-infrared laser and has become a cutting-edge research hotspot in the field of laser. At present, the methods of generating 3-5 μm mid-infrared fiber laser can be roughly divided into the following three categories: 1) Direct lasing method based on rare earth ion-doped fiber; 2) Nonlinear wavelength frequency shift; 3) Supercontinuum generation. However, the latter two schemes usually using rare earth doped fiber lasers as the pump sources. In addition, the rare earth ion doped fiber lasers have advantages of high gain, large bandwidth, high nonlinear, easy integration and so on, and have gradually become one of the ideal platforms for mid-infrared. Therefore, the rare earth ion doped fiber lasers are the foundation and core of the development of 3-5 μm band laser technology.ProgressThree kinds of gain ions, Er3+, Ho3+ and Dy3+, which are commonly used in 3-5 μm fiber lasers, are introduced in detail. The current development of continuous and pulsed fluoride fiber lasers based on these ions doping is reviewed, respectively. In recent years, the performance of 3-5 μm continuous wave fiber lasers has been greatly improved. The output power of 15 W, 10.1 W and 200 mW was achieved in the 3.5 μm (Er3+: ZBLAN), 3.2 μm (Dy3+: ZBLAN), and 3.9 μm (Ho3+: InF3), respectively. Moreover, broadly tuning of ~700 nm is realized in the spectral range of 2.710-3.415 µm for a Dy3+: ZBLAN continuous wave laser. On the other hand, with the rapid development of mid-infrared gain-switching, Q-switching technology and related devices, 3-5 μm short-pulse lasers have made great technical breakthroughs. The largest output power of 1.4 W is achieved in a 3.22 μm Er3+: ZBLAN fiber. However, there is still a long way to go for further improvement in stability, peak power and pulse energy. Ultra-short pulse fiber lasers with 3-5 μm band have achieved breakthroughs, the longest wavelength of 3.61 μm is achieved for mode-locked mid-infrared pulses. But the mode-locking pulse performance, including pulse width compression, power/energy improvement, wavelength expansion, noise suppression and stability improvement, still have many problems to be solved and studied. Conclusions and Prospects:In recent years, with the development and maturity of fluoride fiber drawing and doping techniques and the optimization and innovation of pumping mode, significant progress has been made in the field of middle infrared fiber lasers based on rare earth ions doping. The reported rare earth doped mid-infrared fiber lasers in the 3-5 μm band are reviewed from the perspective of continuous lasers and pulse lasers, respectively. The following trends are summarized: (1) The output power will be further improved. In recent years, continuous fiber lasers over 3 μm have achieved output power of 15 W. However, compared with the ~2.8 μm fiber lasers, the output power of this band still has a large room for improvement. In future studies, the output power can be further increased to tens or even hundreds of watts by further optimizing the pump structure, optimizing the preparation process of fluoride fiber, optimizing the fiber welding technology and the performance of fiber passive devices such as fiber grating and fiber end caps. (2) The wavelength will be further extended to longer wavelengths. For rare-earth ions doped continuous laser, the current recorded wavelength output is 3.92 μm, and no further breakthrough has been achieved since 2018, and the field of rare-earth ion doped fiber laser >4 μm is still a blank. In future studies, it is worthwhile to further extend the output wavelength by developing new doping ions such as Tb 3+. (3) Toward all-fiber configuration. There is no doubt that the all-fiber system is in line with the development trend of fiber lasers. In the band of 3-5 μm, due to the lack of fiber functional devices and the imperfection of high quality fiber processing technology, the overall all-optical fiber level is low. In the future research, the development of active and passive fiber functional devices for mid-infrared laser generation should be accelerated. It can be predicted that in the near future, high performance, all-fiber 3-5 μm rare earth ion-doped mid-infrared laser will move from the laboratory to many practical fields, and promote the technical development and progress of industry, medical, national defense and other related fields.
May. 25, 2023Vol. 52 Issue 5 20230215 (2023)
Yadong Jiao, Zhixu Jia, Xiaohui Guo, Chengyun Zhang, Weiping Qin, and Guanshi Qin
SignificanceHigh-power mid-infrared fiber laser sources have important applications in molecular spectroscopy, optical communications, biomedical, remote sensing, environment monitoring, and national defense security. Currently, mid-infrared laser sources mainly include rare ion doped fiber lasers, Raman fiber lasers and broadband supercontinuum light sources. At present, 3-4 µm fiber lasers have been demonstrated based on rare ions (such as holmium ions, erbium ions, dysprosium ions and so on) doped fluoride glass fiber. However, limited by the inherent energy levels of rare earth ions and large quantum defects, rare earth ion-doped fiber lasers are difficult to achieve lasing at any wavelength in mid-infrared band, and the laser output power decreases significantly with the increase of wavelength. Raman fiber lasers based on the stimulated Raman scattering (SRS) effects have the characteristic of low quantum loss and flexible output wavelength. SRS is an important nonlinear optical process in optical fibers, and it is an inelastic scattering with stimulated radiation properties. Raman fiber laser has a wide gain spectral bandwidth and can realize the cascade operation. So, with an appropriate pump source and a low loss gain fiber, Raman fiber lasers operating at any wavelength within the transmission window of the fiber glass matrix can be achieved, which is inaccessible for rare earth ions doped fiber laser. In addition, the Raman soliton lasers achieved by using soliton self-frequency-shift effect is also one important way to obtain widely tunable mid-infrared laser sources. Researchers are focus on developing fiber materials with wide mid-infrared transmission window, high laser damage threshold, big Raman shift, large Raman gain coefficients, and corresponding high power mid-infrared Raman laser sources.ProgressThis paper introduces the progress of several mid-infrared glass optical fiber materials and the corresponding Raman laser sources. At present, the nonlinear medium used in the development of mid-infrared Raman laser source is mainly based on glass fibers with low loss in the mid-infrared region, including fluoride, chalcogenide and tellurite glass fibers. Fluoride glass fibers have a low transmission loss. By using fluoride glass fiber as Raman gain media, researchers have reported a 3.7 W Raman fiber laser at 2231 nm and a Raman soliton laser source with a tunable wavelength rang covering 2-4.3 µm. Chalcogenide glasses have the widest mid-infrared transmission window and the largest Raman gain coefficients among mid-infrared glasses. By using chalcogenide glass fiber as Raman gain media, researchers reported a second-order cascaded Raman laser operating at 3.77 µm, which is the longest wavelength for the Raman fiber lasers obtained in mid-infrared glass fibers. However, its output power is quite low (several milliwatts). Compared with the fluoride and chalcogenide glass, tellurite glasses have a larger Raman frequency shift and stronger laser damage resistance. Theoretical studies show that using tellurite glass fibers as Raman gain media, a Raman fiber laser with an average output power of tens of watts and a Raman soliton laser source with a tunable wavelength range covering 2.8-4.8 µm could be achieved. Very recently, to further improve the performances of tellurite fiber-based laser sources, fluorotellurite fibers with a broadband transmission window (0.4-6.0 µm), high laser damage threshold, big Raman shift (~785 cm-1), and large Raman gain coefficient (1.28×10⁻¹² m/W@2 µm) have been developed by the authors. By using them as Raman gain medium, the authors achieved fifth-order cascaded Raman shift at ~3.75 µm and build cascaded Raman amplifiers. Besides, the authors also obtained Raman soliton laser sources with wavelength tuning rang covering 1.98-2.82 µm, and dispersive wave at ~4 µm. Conclusions and ProspectsAs one of the important technologies to obtain mid-infrared laser sources, Raman fiber lasers have received extensive attention. At present, by using fluoride, chalcogenide or tellurite glass fibers as gain media, the Raman fiber laser operating at 3.77 µm and Raman soliton laser source with a tunable wavelength range of 2-4.3 µm have been developed. The authors developed fluorotellurite fibers with good stabilities and high laser damage threshold, and preliminarily verified their potential for constructing high power mid-infrared Raman laser sources. It is believed that, in the near future, by further improving the quality of fluorotellurite glass fibers, mid-infrared Raman fiber lasers with output power up to tens of Watts or even hundreds of Watts and the mid-infrared Raman soliton laser source with a tunable wavelength range covering 2-5 µm can be realized.
May. 25, 2023Vol. 52 Issue 5 20230228 (2023)
© Copyright 2018-2021 | Chinese Laser Press.
All Rights Reserved 沪ICP备15018463号-20