


 View fulltext

2023
Volume: 52 Issue 4
33 Article(s)

Lili Qin, Lijuan Li, Jiaojiao Ren, Jian Gu, Weihua Xiong, Dandan Zhang, Lili Zhu, Jiyang Zhang, Junwen Xue, Baihong Jiang, and Zenghua Gao
ObjectiveBonding structure is widely used in aviation, aerospace, national defense and other fields. But during service, the bond interface may appear disbonding defects or damage, seriously reducing the bearing capacity of the structure and affecting the structure safety. Terahertz nondestructive testing technology is widely used in the nondestructive test of composite materials. Terahertz time-domain spectroscopy technology can effectively realize the nondestructive test and identification of internal defects of multilayer adhesives. However, the terahertz detection signal carries a large number of invalid redundant features, noise and other invalid information. With the gradual increase of detection data, the redundant and invalid information in the data, and the workload of data processing are also increasing. A large amount of invalid information not only consumes a lot of data processing and analysis time, but also brings great interference to the subsequent signal analysis work such as defect identification. To solve this problem, a gradient threshold adaptive sparse compression algorithm is proposed based on time-domain characteristics of terahertz signals with multi-layer adhesive structures.MethodsThe gradient threshold adaptive sparse model is established. Effective time-domain features of terahertz signals were extracted using the second-order gradient (Fig.3), and the time-domain features of signals were used as constraints to determine the threshold sparse time-domain signals based on the time-domain features of signals, and the terahertz signals were recovered by the multi-Gaussian fitting function (Fig.4). The compression performance of the algorithm was evaluated according to the compression ratio, relative root mean variance and correlation coefficient, and the data processing time and memory occupied space were used to characterize the compression efficiency of the algorithm.Results and DiscussionsTerahertz detection signals were divided into normal signals and defective signals (Fig.5), and signal characteristic peaks were extracted (Tab.1) to determine effective feature intervals. The maximum allowable error was set as 0.05, and the threshold was determined adaptively. The sparse recovery results of terahertz signals were shown (Fig.7). The reconstruction error of the recovered signal is less than 0.006 (Fig.8). The compression rate of this algorithm reaches 81%, which is 59% higher than that of discrete cosine transform, 75% higher than that of principal component analysis, and 26% higher than that of K-singular value decomposition. The relative root-mean-square error of the algorithm is less than 2%, and the correlation coefficient is greater than 0.97 (Fig.9). Compared with the traditional signal compression algorithm, the data processing time is reduced by 20%. Space utilization is reduced by 95% (Fig.12). This algorithm achieves effective compression of terahertz signal. Combined with terahertz imaging technology and binarized threshold segmentation method, the debonding defects of the sample were identified, and the identification deviation was less than 0.05 (Tab.3). The results show that the algorithm improves the efficiency of data analysis and guarantees the accuracy of defect identification.ConclusionsA gradient threshold adaptive sparse algorithm is proposed to solve the problem of terahertz signal feature redundancy and low processing efficiency. The algorithm has the advantages of strong adaptive ability, high compression rate, fast running speed and low complexity. The second order gradient is used to extract the signal feature peak and determine the effective feature region. Then, according to the time-domain characteristics of terahertz signals, sparse thresholds and sparse signals of effective and invalid feature regions are determined. Finally, signals are restored by using multiple Gaussian functions. The compression ratio of the algorithm is greater than 81%, the relative root mean square error is less than 2%, the correlation coefficient is greater than 0.97, and the defect identification error is less than 5%. Compared with the traditional signal compression algorithm, the data computation time is reduced by 20% and the space is reduced by 95%. The algorithm reduces a large number of invalid features and retains effective features, ensuring the accuracy of terahertz image defect recognition. It is suitable for compression of normal terahertz signals and defective terahertz signals with complex redundant characteristic information.
Apr. 25, 2023Vol. 52 Issue 4 20220443 (2023)
Jie Feng, Yang Feng, Xiang Liu, Chenjin Deng, and Zhongjun Yu
ObjectiveLidar is a kind of sensor using laser active imaging, with the advantages of high detection accuracy, all-weather working, easy access to high-precision three-dimensional information, far effective detection range, etc. It has been widely used in recent years, especially in the field of autonomous driving, as a three-dimensional environment perception device in the autonomous driving vehicles. When lidar is applied to perimeter surveillance and working in long-range mode, the target point cloud is relatively sparse which is different from microwave high-resolution imaging radar such as ISAR. The recognition speed of 3D point cloud data with the number of point clouds of 6 000-7 000/frame is lower than 12 frame/s when using training and real-time recognition of cooperative targets by deep learning method, while more missed alarms emerge. The rate of targets recognition needs to be improved. In order to guide the high-resolution infrared camera to carry out high-resolution fine imaging of the detected target before recognition, the method of fast detection of moving targets is investigated. The processing method of complex scenes using 3D Gaussian method and clutter map CFAR to detect moving targets is provided.MethodsThe flow diagram of lidar moving target detection based on 3D point cloud data is given (Fig.2), including 3D point cloud mesh construction, noise filtering by 3D bilateral filtering, target and background segmentation. The principles of 3D single Gaussian method and 3D Gaussian mixture method for segmentation of target/background are given, and the method of using clutter map CFAR detection is proposed (Fig.1). Using 72 frames of data from actual equipment, the result of application of the Faster RCNN Resnet50 FPN deep-learning method, two-dimensional single Gaussian method, three-dimensional single Gaussian method, three-dimensional Gaussian mixture method, and clutter map CFAR method are compared.Results and DiscussionsComparative experiments show that the average accuracy rate of using the Faster RCNN Resnet50 FPN deep learning model is 0.318 4, the average recall rate is 0.329 4, the processing time of a single frame is 0.5 s, and the point cloud data is 2 s, which means this method is hardware-intensive and difficult to meet the general engineering requirements. In other methods (Tab.2), under the two-dimensional single-Gaussian model, the real-time performance is very high, but there are many false alarms, and almost every frame has false alarms. There are false alarms in some frames of 3D single Gaussian model (Fig.7). By adjusting the parameters of the 3D Gaussian mixture model, the number of false alarms can be reduced to 0 while there are no missed alarms (Fig.8). The false alarm rate will also decrease significantly after using the clutter map CFAR method (Fig.9). At the same time, it can be seen that the processing time of the clutter map CFAR method is basically the same as that of the 3D single Gaussian model method, which is much less than that of the 3D mixed model method, and can meet the actual engineering needs. The 3D Gaussian mixture model needs further optimization or parallel processing to improve real-time performance.ConclusionsAt present, when the deep learning method is directly used to detect and recognize moving targets for the lidar working in the remote monitoring mode, the real-time performance and detection rate can not fully meet the actual engineering requirements. The combination of lidar and high-resolution infrared camera in the project requires lidar to detect moving targets and guide the imaging and recognition of infrared high-resolution camera. Due to the high false alarm rate of two-dimensional single Gaussian method and three-dimensional single Gaussian method, it is difficult to adapt to complex background and cannot meet the requirements. Three-dimensional Gaussian mixture model can adapt to complex background very well, but the real-time performance is reduced because of the increase in the amount of computation caused by the update of background parameters. This means that it can not meet the requirements. In contrast, for the scene with complex background, the method of using clutter map CFAR to detect and process point cloud data can improve the accuracy and the real-time performance of detection, thus meeting the requirements of practical engineering.
Apr. 25, 2023Vol. 52 Issue 4 20220506 (2023)
Xiangsheng Meng, and Lekun Li
ObjectiveIn order to meet the tactical requirements of modern naval warfare, air-to-air missiles should be capable of intercepting ultra-low altitude sea-sweeping flight targets such as anti-ship missiles and cruise missiles. At present, the advanced level in the world has been able to fly at a height of 3 m above the sea. In this case, the complex sea background clutter will not only affect the detection and tracking of the missile guidance system to the target, but also enter the range of the fuze at the end of the rendezvous phase, which will seriously affect the fuze work, leading to false alarm or reduced starting ability. Therefore, improving the ability of fuze to resist ultra-low altitude sea background interference has always been a research focus to expand its battlefield adaptability. At present, conventional laser fuzes use multi-quadrant zonal wavegate compression, dual-beam detection and other technologies to suppress sea clutter, but each has certain application limitations. In this paper, a low altitude sea background target recognition method based on digital laser imaging is proposed. This method is based on the difference of imaging characteristics between the sea level and the physical target in the space distribution, and uses the fine recognition ability of laser imaging to the echo characteristics of different azimuth angles, which can improve the adaptability of proximity fuze to work reliably in the ultra-low altitude sea environment.MethodsThe dynamic sea surface laser echo simulation system is established to obtain the laser scattering characteristics of sea level and target. The simulation system can set the field angle parameters of the laser imaging system, and can obtain the echo signal characteristics under different intersection conditions and different sea conditions in real time. The scattering model of sea surface panel segmentation is used to calculate the laser echo distribution characteristics under different detection field angle parameters. The simulation flow chart is shown (Fig.1). Through the statistics and analysis of the distribution characteristic data of the laser scattering echo on the sea surface, a target recognition method based on the laser imaging system for low altitude sea background is designed and verified by simulation.Results and DiscussionsIn terms of target characteristic simulation, for the imaging detection system that uses spatial narrow field of view subdivision, due to the undulation of the sea surface, the sea surface echo presents discrete flicker feature in the spatial distribution (Fig.5), which is significantly different from the imaging feature of continuous solid targets (Fig.6) in the spatial distribution. In terms of target recognition method design, a circumferential 360° solid-state array laser high-speed scanning detection system is proposed, and full digital echo signal processing is realized through high-speed AD sampling. According to the characteristics of high-speed rendezvous between missile and target, a method of low altitude sea background target recognition based on intra-frame judgment and inter-frame accumulation is proposed. This method can quickly filter out the sea background clutter by means of straight-through filtering, mathematical morphology filtering, target morphology features and other methods to ensure the real-time and reliability requirements of missile-borne detection and recognition. The average recognition accuracy of this method under different sea conditions is 96.9% (Tab.2) through simulation verification of different intersection conditions.ConclusionsIn this paper, a target recognition method based on digital array laser scanning imaging is proposed. This method can realize circumferential 360° solid state scanning detection through the time-sharing and high-speed operation of the electronically controlled array laser, and digitize the echo imaging features through high-speed AD sampling. It has the characteristics of fast recognition speed and high degree of digitalization, and can meet the real-time requirements of high-speed target recognition. The digital modeling of sea surface and laser detection has been carried out, and the optical reflection characteristics of sea clutter have been simulated and analyzed. Based on the target characteristics, a low-altitude sea background target recognition method of intra-frame judgment and inter-frame accumulation has been designed. Through simulation and test verification, the average recognition accuracy of this method under different sea conditions is 96.9% (Tab.2). The relevant technologies in this paper can provide methods and ideas for laser fuze anti-low altitude sea environment interference technology.
Apr. 25, 2023Vol. 52 Issue 4 20220548 (2023)
Feiyu Zhao, Liang Wang, Kai Guo, Jingyuan Zhang, Bochen Pan, and Shuchao Guo
ObjectivePoint-surface composite infrared decoy is one of the advanced infrared jamming equipment used in aircraft platforms at home and abroad, which has a good capability against infrared guided missiles. For aircraft platforms, it is important to master the use strategy of point-surface composite infrared decoy. It determines the aircraft’s survivability during terminal defense. Currently, the use of infrared decoy lacks simulation analysis support, and there is a certain degree of blindness. With the improvement of couter-coutermeasure ability of infrared guided missiles, it brings higher requirements for the development and use of infrared decoy. Besides, there is a lack of simulation and research related to point-surface composite infrared decoy. So the airborne dynamic dispersion characteristics and application of point-surface composite infrared decoy is studied.MethodsTo obtain the dynamic walk characteristics of point-surface infrared decoy in the air, theoretical basis for its use is provided, and the effectiveness of point-surface infrared decoy is improved, dynamic and kinematic analysis of point source decoy and surface source decoy of point-surface infrared decoy (Fig.3) is performed, the simultaneous equations are solved, so the trajectory of point source decoy and dispersion of surface source decoy in the air were obtained. Then by changing the aircraft platform speed, the relative motion trend of the point source decoy and surface source decoy, and the influence law of the platform speed are obtained. Based on the simulation of airborne dynamic dispersion characteristics of point-surface infrared decoy, the use research is conducted, and the jamming characteristics and mechanism of the point-surface infrared decoy are described. Jamming characteristics mainly include radiation intensity value, rate of radiation intensity change and radiation area. The formation characteristics of point-surface infrared decoy in the field of view of infrared guided missiles are analyzed. And based on this, the mechanism research is carried out.Results and DiscussionsThrough simulation analysis, airborne dynamic dispersion characteristics are acquired (Fig.6). It provides a good foundation for the use of point-surface composite infrared decoy. At the same time, the infrared radiation characteristics of point-surface composite infrared decoy are acquired (Fig.9). For infrared guidance seeker, it is sensitive for radiation intensity change rate (Fig.10) and radiation area (Fig.11) of infrared decoy. The jamming mechanism of the point-surface infrared decoy in the imaging phase (Fig.13) and the non-imaging phase (Fig.12) of the infrared guided missile is analyzed, which can provide reference for the formulation of decoy use strategy and improve the battlefield survivability of aircraft platforms.ConclusionsIn this study, starting from the basic physical laws, the dynamic dispersion characteristics of point surface composite infrared decoys in the air are studied, and the impact of platform speed on the dynamic dispersion of point-surface composite infrared decoys in the air is simulated. The results show that the faster the platform speed is, the smaller the relative separation speed of point-surface composite infrared decoy relative to area source decoys is, and the greater the diffusion speed of area source decoys is. The interference characteristics and mechanism of point-surface composite infrared decoy during use are analyzed. Its key characteristics such as radiation intensity value, radiation intensity change rate, and radiation area have the ability to interfere with infrared guided missiles. The interference mechanism of point-surface composite infrared decoy in the imaging and non-imaging stages of infrared imaging guided missiles is described, and the confrontation process is described based on simulation results. The research on the dynamic dispersion characteristics simulation and use of point-surface composite infrared decoy in the air conducted in this paper is mainly based on the characteristics of the decoy itself and the basic interference principles. The actual use strategy should be comprehensively studied and determined in combination with multiple factors such as missiles, aircraft targets, and maneuver strategies.
Apr. 25, 2023Vol. 52 Issue 4 20220476 (2023)
Jianxin Hao, and Li Wang
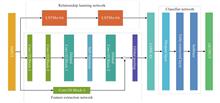
ObjectiveA rapid and accurate detection of the fault occurring to the airborne electronic system plays a crucial role in ensuring the safety of civil aircraft. However, due to the increase of circuit board size and component density in airborne electronic system, the traditional contact fault diagnosis method encounters various problems such as low accuracy, huge time cost and the demanding requirements on personnel competency. Therefore, this study aims to explore the solution to circuit board fault diagnosis based on non-contact infrared technology, which is essential for improving the accuracy of fault diagnosis for the airborne electronic system.MethodsAfter the sequential thermal image of the circuit board is captured by using the infrared camera, the region of interest in the thermal image is processed as the infrared temperature series. Since the infrared temperature series of the circuit board contains various fault-related information, the accuracy of fault diagnosis can be improved by making full use of its local and global features. In this study, a fault diagnosis algorithm is proposed to achieve this purpose. Composed of the features extraction network (FEN) and the relationship learning network (RLN), it utilizes the local features of temperature series and the relationship between the features. Built on a residual structure with multi-scale dilated CNN, FEN plays the role of a local-feature extraction network to construct a multi-scale receptive field without increasing the number of training parameters and to learn the spatial features of temperature series of different ranges. Based on the embedded structure of two identical layers, attention mechanism and LSTM network, RLN is a network that can apply control on the transmission of temperature series to learn the importance of features and assign attention weights for mining the correlations between the features extracted from different positions. To develop a complete circuit board fault diagnosis algorithm, the parallel FEN and RLN networks are connected to the "Softmax" classifier.Results and DiscussionsThe temperature series datasets representing 27 different fault categories are constructed based on the infrared thermal image of airborne power board (Tab.1, Tab.5). (1) By analyzing the temperature series datasets, it can be found that there are significant differences between the temperature curves of the chip under different fault conditions, and the temperature curves of non-faulty chips are also affected by faulty chips (Fig.5). (2) The experimental results show that the proposed algorithm achieves a better diagnostic performance than FCN, MFCN, LSTM and LSTM-FCN on the datasets of the temperature series testing on two self-built circuit boards. To be specific, its diagnostic accuracy reaches 91.15% and 96.27%, respectively (Fig.8) (Tab.5). (3) Given the identical hyperparameter setting, the increase in dimension of temperature sequence feature vector contributes to improving the diagnostic performance. That is to say, appropriate sample is one of the key influencing factors in improving the accuracy of fault diagnosis (Tab.5). (4) Ablation studies reveal that the performance of FEN in feature extraction capability can be improved by the proper setting of hyperparameters, which is conducive to enhancing the diagnostic accuracy of the algorithm (Tab.6). (5) The long Short-term Memory hybridized with Attention (LSTMwAtt) plays a role in improving the performance of the proposed algorithm in terms of relation extraction. By fully utilizing the intrinsic relationship between the characteristics of different locations of temperature series, the proposed algorithm is more likely to capture the differentiated data carried by similar faults (Tab.6).ConclusionsIn this study, a fault diagnosis algorithm intended for the airborne circuit board is proposed by using infrared temperature series. In this algorithm, the features extraction network is responsible for extracting local features and learning the spatial features of temperature series of different ranges, while the relationship learning network is proposed to discover the intrinsic relationships among the representations learned from infrared temperature series. According to the experimental results, the proposed diagnosis algorithm performs well on self-built testing datasets. However, it is worth noting that the small size of the self-built datasets reduces the accuracy of the algorithm when the proposed algorithm is applied to the new datasets. As the size of self-built datasets increases, it performs better in fault diagnosis. Hopefully, it would be applicable in circuit board fault systems to deal with the fault that occurs to the airborne electronic systems.
Apr. 25, 2023Vol. 52 Issue 4 20220492 (2023)
Tianhang Yang, Chunming Zhang, Fenghua Zuo, Yong Hu, and Mingjian Gu
ObjectiveSpaceborne infrared hyperspectral sensors and multi-channel spectral sensors can continuously observe the earth for a long period of time, and have important applications in the fields of climate prediction, weather change, environmental monitoring, etc. The high-precision spectral calibration and radiation calibration of their observation data are crucial to the quantitative application of remote sensing. With the increase of operational time of satellite after being launched, the performance of the spaceborne sensors will change, which will lead to the deviation of observation data accuracy. Therefore, it is necessary to effectively improve the calibration accuracy and the data quality of the instrument through on-orbit inter-calibration. The samples of inter-calibration are generally collocated and filtered through the method of the on-orbit alternative calibration of the Global Space-based Inter-Calibration Sytem (GSICS), including spatial, temporal, observation geometry and spectral collocation through simultaneous nadir overpass (SNO) observations, and consequently achieve the goal of inter-calibration with the target sensor. The SNO observations can make two satellite sensors observe the earth from different heights at the similar time and place, which fully reduces the comparison uncertainty caused by different observation time and angle of satellites. This is a necessary prerequisite for the feasibility of inter-calibration, but these factors are also the main source of calibration uncertainty, and the uncertainty of collocating bias will have effects on the inter-calibration accuracy finally. Therefore, we analyze the uncertainty of the samples collocating processing in this paper, including spatial collocation, observation angle collocation and spectral response function collocation between sensors.MethodsWe establish the sifting process of inter-observation sample pairs above uniform clear-sky background scenes (Fig.1) of the infrared hyperspectral atmospheric sounder HIRAS-II and the low-light medium-resolution spectral imager MERSI-LL onboard the same platform of the FY-3E of China Fengyun-3 series sun-synchronous orbit meteorological satellite. Collocating MERSI-LL pixels within HIRAS-II nadir instantaneous field of view (IFOV) based on line-of-sight (LOS) vectors, HIRAS-II projects the FOV footprint from the satellite to the earth's surface at a fixed solid angle, and all coordinates are converted into Earth Centered Earth Fixed (ECEF) coordinate system after calculation. All MERSI-LL pixels in the coverage area of HIRAS-II FOV footprint can be determined by calculating the line-of-sight vector (Fig.3). The uncertainty of the samples collocation introduced by spatial, observation geometry and spectral collocating bias is separately analyzed by simulating IFOV shift, observation zenith angle deviation and spectral response function change, respectively.Results and DiscussionsThe results of uncertainty analysis above each section of collocating process through cross observation of sensors on the same platform, radiation transmission model simulation and statistical analysis show that, in terms of spatial collocation, we evaluated the percentage deviation and standard deviation of radiance brightness temperature between the disturbed value and the standard value (Fig.5) by comparing the standard value of radiance brightness temperature in the target area with the disturbed value of radiance brightness temperature after simulating pixel offset, the spatial mis-collocation causes the changes of radiance brightness temperature above observed background scenes, the relative uncertainty is approximately 10% when the IFOV is shifted by half a pixel. In terms of geometric collocation, we evaluated the deviation and relative accuracy of the brightness temperature of the observed and simulated spectrum by comparing the brightness temperature sample of spectrum observed by HIRAS-II with the simulated spectral brightness temperature after changing the satellite zenith angle, it is found that the misalignment of observation geometry causes deviation of spectrum radiance brightness temperature, the uncertainty is less than 0.2% when the observed zenith angle is shifted by 20 degree (Fig.7). In terms of spectral collocation, the hyperspectral equivalent radiance can be obtained by simulating and calculating the HIRAS-II infrared hyperspectral radiance and channel spectral response function of MERSI-LL. The difference of the spectral response function causes bias of spectral equivalent radiance brightness temperature, the uncertainty of the absorption channel and window channle is approximately 2.5% and 0.4% respectively for expanding the response function, and the uncertainty is better than 0.3% overall for shrinking the response function, the uncertainty is relatively small for shifting response function, and it is better than 0.1% when shifting five times the wavelength interval (Fig.9).ConclusionsIn this study, we analyzed the uncertainty and its influence introduced by observation collocation in terms of spatial, observation geometry and spectral collocation, which are aimed at the spaceborne infrared hyperspectral sensors and multi-channel spectral sensors before inter-calibration. We used the pixel matching method above observation field based on the line-of-sight vector to separately analyze the uncertainty introduced by spatial, observation geometry and spectral collocating bias. The spatial mis-collocation caused by IFOV shift leads to the change of observation background radiance, the relative uncertainty is approximately 25%-30% when the IFOV is shifted by a pixel. In order to reduce the uncertainty introduced by pixel offset, the offset distance should be limited to half of the spatial resolution of the nadir instantaneous field of view. The misalignment of observation geometry caused by observation zenith angle difference leads to the bias of observation background radiance, and the bias is more obvious in vapor channel, the deviation of observation zenith angle should be constrained within 10 degree or more less. The deviation of hyperspectral equivalent radiance caused by the difference of spectral response function has an impact on the calibration accuracy, the effective bandwidth change of spectral response function will cause greater uncertainty relative to the central wavelength shift of spectral response function. This study provides a reference for setting reasonable threshold in the condition of sifting collocated samples before inter-calibration, and also provides support for improving accuracy of inter-comparison and calibration.
Apr. 25, 2023Vol. 52 Issue 4 20220616 (2023)

Zhiru Xiao, Qinglin Niu, Zhenhua Wang, and Shikui Dong
ObjectiveThe rocket exhaust plume is one of the key objects of the space-based infrared system (SBIRS) due to its strong infrared radiation characteristics. The infrared radiation signature of the plume is not only related to the motor prototype parameters but also to the flight parameters of the vehicle. In practical applications, the variation characteristics of infrared radiation signature of the rocket exhaust plume can be predicted through numerical methods based on the known motor and flight parameters. However, the flight parameters of non-cooperative targets are often difficult to obtain accurately, which means that there must be some deviation in predicting the infrared radiation signatures of the rocket exhaust plume by numerical methods. Therefore, it is necessary to study the influence of flight parameter disturbance on the infrared radiation of rocket exhaust plumes. For this purpose, the non-intrusive polynomial chaos (NIPC) method is used for the uncertainty quantification and sensitivity analysis of free stream parameters on the infrared radiation signatures of the rocket exhaust plume.MethodsThe Latin hypercube sampling (LHS) method is used to design the samples of frees tream parameters. The infrared radiation characteristics of the rocket exhaust plume are calculated based on the infrared signature analysis tool (IRSAT), and the corresponding infrared response values of the plume at each sample point are obtained. The regression analysis method is used to solve the polynomial chaotic expansion coefficient and the statistical characteristics of the plume infrared signatures, including the mean value, standard deviation and uncertainty. Based on the Sobol index, the NIPC method can be utilized to quantify the uncertainty and sensitivity of the infrared radiation signature, and analyze the impact of a single variable and multiple variables on the infrared radiation characteristics of the rocket exhaust plume.Results and DiscussionsThe free stream velocity has a high sensitivity to spectral radiation intensity in most spectral bands except for 4.3 μm, and the corresponding Sobol index is above 0.5. The maximum sensitivity of free stream pressure occurs in the 4.3 μm band, and the peak of the Sobol index is close to 1.0. The Sobol index of angle of attack to spectral radiation intensity is about 0.4, and it shows high sensitivity in multiple bands. The influence of the ambient temperature on the radiation spectrum is negligible. The Sobol index of the in-band radiance shows that the free stream velocity is the most sensitive to the radiation intensity in most bands. The free stream pressure and the angle of attack are the second, and the free stream temperature is the smallest. The coupling effect of free stream velocity and ambient temperature has the most obvious contribution to the in-band radiance. The coupling effect of free stream velocity and pressure, and the coupling effect of temperature and angle of attack only affect some extremely narrow spectral bands. The coupling effect among other parameters can be almost ignored.ConclusionsThe low altitude under-expanded Atlas-IIA plume is taken as the research object, and the uncertainty quantification and sensitivity analysis of infrared radiation signatures of free stream velocity, temperature, pressure and angle of attack are carried out using NIPC method. The uncertainty of radiation intensity caused by the incoming flow has a high correlation with the spectral band. The standard deviation of the in-band radiance is positively correlated with the mean value, and the uncertainty of the radiance is opposite to the mean value of the radiation intensity. In most wavebands, the free stream velocity is the most sensitive to the radiation intensity, followed by the free stream pressure and angle of attack, and the ambient temperature is the least. The coupling effect of velocity and temperature have the most obvious contribution to the radiance. The coupling effect of velocity and pressure, and temperature and angle of attack only have an effect in some very narrow spectral bands. The ratio of angle of attack to the main Sobol index of the radiation intensity is between 15% and 23%. The main Sobol index of the inflow velocity accounts for nearly 80% except for the 4.3 μm band. The impact of inflow pressure in the 4.3 μm band is dominant. The coupling effect of each incoming flow parameter has little influence on the radiation intensity in each spectral band, which is less than 4%.
Apr. 25, 2023Vol. 52 Issue 4 20220621 (2023)
Xiuxiu Ma, Haiyan Wang, Qijin Han, Xuewen Zhang, Hang Zhao, Zhaopeng Xu, Jian Zeng, Lingling Ma, and Ning Wang
ObjectiveThermal infrared remote sensing has the ability of day and night detection and good environmental adaptability, which makes it have important applications in natural ecological environment monitoring, urban heat island effect monitoring, lake and reservoir water quality monitoring, etc. The application of thermal infrared remote sensing has gradually changed from qualitative to quantitative, and absolute radiometric calibration is the prerequisite for the quantification of remote sensing information. Among them, on-board blackbody calibration uses on-board blackbody as the calibration source, which is not limited by time, environment and other factors. It can produce corresponding calibration coefficients for each orbit data, improve the frequency of on-orbit absolute radiometric calibration. Based on the on-board 0-level blackbody calibration data of GF5B VIMI (Hyperspectral observation satellite, visible and infrared multispectral image), the absolute radiometric calibration research of satellite thermal infrared channel is carried out. In this way, reliable calibration results can be obtained to provide a method basis for the subsequent blackbody calibration of satellite thermal infrared remote sensing.MethodsBased on the laboratory calibration before the launch of GF5B satellite, the on-board blackbody calibration data is used to establish the on-board absolute radiometric calibration model applicable to the GF5B thermal infrared channel. Firstly, relative radiometric correction is carried out for the high and low temperature blackbody image data transmitted from satellite; based on the blackbody image data after relative radiation correction, the average DN of each channel corresponding to the high and low temperature blackbody is obtained. At the same time, the high and low blackbody temperature is calculated based on the high and low temperature blackbody auxiliary data, and then the radiance value of the corresponding channel of the high and low temperature blackbody is calculated using the Planck function. Then, according to the actual response average DN of the high and low temperature blackbody image and the corresponding channel radiance, the inner blackbody absolute radiometric calibration coefficient is calculated. Finally, the internal and external blackbody calibration conversion coefficients are used to convert the internal calibration coefficients into the absolute radiometric calibration coefficients of the on-board blackbody (Fig.1). In addition, according to the error sources of the on-board calibration system, various indicators affecting the accuracy of the on-board calibration system are analyzed. The accuracy of on-board blackbody calibration is evaluated and verified by using the ground synchronous buoy measurement data.Results and DiscussionsThe on-board blackbody calibration data of the 1 850th orbit on January 12, 2022 are selected to conduct the on-board blackbody absolute radiometric calibration, and its on-board absolute radiometric calibration coefficient (Tab.3) is obtained. Through the analysis of various indicators affecting the accuracy of the on-board radiometric calibration system, the results show that the total error of the on-board radiometric calibration of the camera is 1.268% (Tab.4), and the equivalent temperature is 299.1 K@300 K. Therefore, the absolute calibration accuracy of the on-board calibration system is 0.9 K. The verification results of satellite-ground synchronization show that the relative differences of radiance of B11 and B12 channels are 0.64% and 1.35% respectively. The brightness temperatures of B11 channel monitored by satellite and ground measurements are 273.78 K and 273.45 K respectively, with a difference of 0.33 K; the brightness temperatures of B12 channel monitored by satellite and ground measurements are 272.58 K and 273.35 K respectively (Tab.5), with a difference of 0.77 K, which shows that the brightness temperature difference is within 0.8 K. The satellite-ground data have a good consistency, which indicates that the thermal infrared channel of GF5B satellite has a high calibration accuracy on orbit, and the results are true and reliable.ConclusionsThe on-board blackbody calibration method based on GF5B thermal infrared channel has good accuracy and reliable calibration results, which can meet the needs of remote sensing data quantification application. It provides a method reference for real-time and accurate acquisition of thermal infrared channel calibration coefficient. The construction of the research method is based on GF5B on-board calibration blackbody, which has important reference value for the on-board blackbody calibration of other satellites.
Apr. 25, 2023Vol. 52 Issue 4 20220644 (2023)
Linwei Song, Jincheng Kong, Peng Zhao, Jun Jiang, Xiongjun Li, Dong Fang, Chaowei Yang, and Chang Shu
SignificanceDue to the high quantum efficiency and ultra-wide infrared wavelengths (from SWIR to VLWIR), Mercury cadmium telluride (Hg1-xCdxTe, MCT) is regarded as the preferred material for high-performance infrared focal plane arrays (FPAs). Compared with p-on-n, n-on-p FPAs have the advantages of simple and reliable manufacturing process. However, in n-on-p FPAs, P-type material with intrinsic mercury vacancy is generally used as the absorption layer. The mercury vacancy belongs to the deep-level defect, which leads to the low carrier lifetime of the absorption layer and the difficulty in controlling the dark current of the device at a low level. Replacing Hg-vacancy with Au (gold) in P-type materials is meaningful to increase minority carrier lifetime, and reduce dark current, which is the most effective way to improve the overall performance of MCT LWIR n-on-p devices. In Kunming Institute of Physics (KIP), the Au-doped MCT devices have been investigated since 2010. After years of continuous research, the key technologies including Au-doped material growth, electrical parameters control, device manufacturing and so on have been successfully broken through, which promoted the fabrication of the high-performance Au-doped n-on-p devices. In this paper, the progress of extrinsic Au-doped MCT LWIR n-on-p technologies in Kunming Institute of Physics was reported comprehensively, which was expected to pave a way for mass production of high-performance LWIR n-on-p FPAs. ProgressIn Kunming Institute of Physics, Te-rich liquid phase epitaxy technology was used to prepare Au-doped LW material. The mercury vacancy concentration was tuned through the heat treatment process with mercury saturation, so as to achieve effective control of electrical parameters. Through the optimization of heat treatment process, the preparation of high-quality Au-doped MCT LW materials was realized, and the carrier concentration can be controlled within 1.0-4.0×1016 cm-3. The dark current is a significant parameter that determines the performance of device. The substitution of Au atoms for mercury vacancies is efficient to reduce the deep-level defects in the MCT materials, increase the minority carrier lifetime of P-type materials, and reduce the dark current of devices. The high-performance MCT LWIR devices (10.5 μm@80 K) have been fabricated by Au-doping technology in Kunming Institute of Physics. Compared with the Hg- vacancy n-on-p device, R0A of the Au-doped LWIR n-on-p device increased from 31.3 Ω·cm2 to 363 Ω·cm2, which was close to the level of p-on-n devices (Rule07) and laid a foundation for the development of high-performance LWIR FPAs. Based on the Au-doped technology, LWIR FPAs including 256×256 (30 μm pitch), 640×512 (25 μm pitch), 640×512 (15 μm pitch) and other specifications were fabricated at Kunming Institute of Physics. The performance of these devices was comparable to those reported abroad. The series development and further mass production of non-intrinsic Au-doped MCT LWIR FPAs have been realized. Furthermore, the researches involved high and low temperature storage, high and low temperature cycle (+70--40 ℃) and long-term storage stability were carried out, and the results show that after 7 years of long-term storage, the performance of the devices have no obvious change. Conclusions and ProspectsIn this paper, the development progress of extrinsic Au-doped MCT materials and devices in Kunming Institute of Physics was reported. The stability of Au-doped HgCdTe materials, dark current control and other key technologies have been broken through up to now. The merit factor (R0A) has been improved from 31.3 Ω·cm2 to 363 Ω·cm2(λcutoff=10.5 μm@80 K) for LWIR HgCdTe focal plane arrays by use of Au-doped technology. The dark current has been reduced by one order of magnitude compared with Hg-vacancy n-on-p devices. And the performance of n-on-p LWIR HgCdTe focal plane arrays has been greatly improved. The performance has not change by storage more than 7 years of the Au-doped HgCdTe device, which shown that the devices have better long-term stablity. Based on this, Kunming Institute of Physics has realized the series development of Au-doped LWIR HgCdTe with a format of 256×256 (30 μm pitch), 640×512 (25 μm pitch), 640×512 (15 μm pitch), and 1 024×768 (10 μm pitch), which has provided a foundation for the mass production of long wave HgCdTe focal plane arrays.
Apr. 25, 2023Vol. 52 Issue 4 20220655 (2023)
Weizhou Zhu, Yong Xie, Jianjun Jia, Liang Zhang, Ruihong Gao, and Xue Wang
ObjectiveTo detect low-frequency gravitational waves, it is necessary to eliminate the interference of geo-noise and build a laser interference gravitational wave detection device in space. Taiji, LISA, Tianqin and other space gravitational wave detection missions have been planning to achieve pm-sensitivity on the arm length of several million kilometers to meet the requirements of gravitational wave detection. Because of orbit evolution and time delay in the interferometer arms, the direction of transmitted laser beam changes, consequently, a remote telescope cannot receive the laser beam to complete the inter-satellite laser interference. Aiming at the need for the point ahead angle of the emission beam, a beam pointing mechanism that provides the point ahead angle in the laser interference link is designed and developed for the space gravitational wave detection device, called the Point Ahead Angle Mechanism.MethodsBased on the design concept of aligning the rotary axis on the mirror surface, the Point Ahead Angle Mechanism employs the structural form of flexible hinges and lever (Fig.2), and the control scheme of piezoelectric ceramic self-closing loops to achieve one-dimensional high-precision beam rotation (Fig.3). Mechanical properties are verified by the simulation analysis (Fig.4-5). Rotary range of the mechanism is verified by the simulation analysis (Fig.6). Under the condition of normal temperature and pressure with a relative humidity of 60%, the rotary characteristic test is carried out by using an autocollimator (Fig.7). And under the conditions of normal temperature (24 ℃) and vacuum environment (less than 50 Pa), a special interferometer is built to test the optical path difference (Fig.9).Results and DiscussionsA series of experiments are conducted on the mechanism, and the results show that the rotary range of the mechanism is ${\rm{709}}{{.4\; \text{μ} {\rm{rad}}}} $, rotary accuracy is ${\rm{0.44}}{{\; \text{μ} {\rm{rad}}}} $, and the results meet the requirements (Fig.8). The optical path differences are better than $10\; \mathrm{pm} / \sqrt{\mathrm{Hz}}$ when the frequency is between 1 Hz and 10 Hz, and the results meet the requirement (Fig.10). But when the frequency was between 1 mHz and 1 Hz, the optical path differences are greater than $10 \;\mathrm{pm} / \sqrt{\mathrm{Hz}}$. After simulation analysis, they are mainly related to the influence of temperature changes in the experimental environment (Fig.11). This is also the direction of further research. In short, it is proven that the principal design of the mechanism is feasible, and it is a reasonable reference for achieving ultra-stable and high-precision beam rotation. ConclusionsIn this study, the Point Ahead Angle Mechanism for space gravitational wave detection is designed and developed, and the corresponding index tests are completed, which verify the rationality of the mechanism design. The mechanism is a one-dimensional and two-way rotation, the maximum rotary range can reach about 709.4 μrad, and the rotary accuracy can reach about 0.44 μrad, all of which meet the expected design requirements. When the frequency is between 1 Hz and 10 Hz, the optical path difference caused by the mechanism is better than $10\; \mathrm{pm} / \sqrt{\mathrm{Hz}} $, and when the frequency is between 1 mHz and 1 Hz , the optical path difference is greater than $10\; \mathrm{pm} / \sqrt{\mathrm{Hz}} $. The optical path difference of the Point Ahead Angle Mechanism developed in this paper still has a gap with the foreign advanced level and design requirements, and the mechanism needs to be optimized. At the same time, the influence of temperature on the optical path difference test should be considered in further research.
Apr. 25, 2023Vol. 52 Issue 4 20220423 (2023)
Zihao Zhang, Xu Wang, Yichen Huang, Fuquan Li, Liqun Li, Xiaochao Lin, Shirui Yang, and Peng Guo
ObjectiveThe uniformity of oil injection flow of the aerospace engine oil supply device is a key technical index to determine its performance quality, in which the shape and size of the injection hole and the state of the internal surface are important influencing factors of the oil injection flow. The traditional oil injection hole processing method is based on EDM, there is a thick recast layer, and the processing efficiency is low. The laser hole is made with a typical non-contact hole making method, which has significant advantages of high processing efficiency, good quality and less recast layer. In order to meet the high-efficiency and high-quality manufacturing requirements of a certain type of aerospace engine fuel supply device, the ultra-short pulse femtosecond laser screw hole making process with a pulse width of 200 fs was adopted, and the flow numerical simulation and process test study with 0.39 mm hole diameter as the processing benchmark were carried out for the 1.5 mm thick GH3044 nickel-based alloy material.MethodsBy means of numerical simulation, the effect of hole diameter (Fig.6), taper (Fig.8), roundness (Fig.9), internal wall roughness (Tab.2) and hole depth (Fig.10) on the flow rate of oil supply hole is studied. The effect of single pulse energy (Fig.13), single layer scan time (Fig.14) and single layer feed (Fig.15) on the hole diameter is analyzed, and the hole diameter deviation is controlled by process optimization to ensure the flow stability.Results and DiscussionsNumerical simulations were used to investigate the factors influencing the hole flow rate. The results show that the hole diameter is the main factor affecting the hole flow rate, and the flow rate is linearly related to the square of the hole diameter (Fig.6). The internal wall roughness has an inhibitory effect on the flow rate of holes. For a 0.39 mm diameter micro-hole, the flow rate is reduced by 3.3% when the roughness is 0.01 mm and by 5.96% when the roughness is 0.05 mm (Tab.2). The roundness (Fig.9) and height (Fig.10) of the micro-hole had no significant effect on the flow rate. Since the hole internal wall roughness of the femtosecond laser hole making was low and did not change significantly for different process parameters, only the effects of single pulse energy, single layer scan time and single layer feed on the micro-hole diameter were investigated. The process optimization was carried out according to the effect law of different process parameters on the micro-hole diameter. Using the optimized process for drilling, the maximum deviation of micro-hole water flow rate is finally less than 1.8% to meet the usage requirements.ConclusionsIn this paper, the influence law of micro-hole quality on water flow is studied by numerical simulation. The micro-hole flow rate is mainly determined by the diameter of the hole entrance and exit. Under the premise of the same entrance and exit hole diameter, the depth and roundness of the hole have basically no effect on the hole flow rate. The larger the roughness of the internal wall of the micro-hole is, the smaller the flow rate is. The smaller the hole diameter is, the more significant the effect of roughness is. When the roughness height is 0.01 mm, the flow rate of 1 mm diameter is reduced by 0.32%, and the flow rate of 0.39 mm diameter is reduced by 3.30%. The effect of process parameters on the micro-hole diameter was analyzed. With the increase of single pulse energy, the entrance and exit hole diameter increased simultaneously and the taper decreased. The effects of single layer scan time and single layer feed on hole diameter were not significant. Finally, the deviation of the hole diameter was controlled within ±5 μm and the taper was 0.01° by process optimization. The water flow rate test was conducted, and the maximum flow rate was 3.28 g/s, the minimum flow rate was 3.17 g/s, and the average flow rate was 3.23 g/s with a maximum deviation of 1.8%, which satisfied the usage requirements.
Apr. 25, 2023Vol. 52 Issue 4 20220454 (2023)
Jun Hui, Hongzhou Chai, Minzhi Xiang, Zhenqiang Du, and Kaidi Jin
ObjectiveSpaceborne photon-counting LiDAR plays a vital role in various optical detection applications such as ranging and remote sensing. The spaceborne lidar system transmits pulses and receives the detection echo signal through the satellite platform to detect the target, and then completes the ranging or altimetry task. The traditional linear system extracts the echo signal through light intensity detection, which requires high laser energy and does not make full use of photon information, resulting in low gain of linear detector. In contrast, photon-counting lidar can improve the sensitivity of the system to the response limit of a single photon, and the avalanche photodiode array detector based on Geiger mode is more capable of resolving multi-photon. In practical applications, the laser pulse signal needs to be transmitted back and forth in the space-ground long-distance space. Even though the laser intensity is very high, the number of effective signal photons that can be received is often very small. At this time, if the quantum statistical characteristics of the echo photons arriving at the receiving end of the lidar system are considered, and a reasonable quantum detection threshold is set to make judgments and estimates on the echo signal, it is expected to improve the detection performance of the spaceborne lidar system under specific circumstances.MethodsAccording to the working principle of spaceborne photon-counting LiDAR, a quantum threshold detection model based on quantum statistics theory is established. Advanced photon-number-resolving detection devices are used to filter out photons that fail to reach the minimum detection signal-to-noise ratio, and the signal-to-noise ratio detection formula are reconstructed according to the statistical law of photons. Compared with the classical intensity detection scheme, the minimum detectable signal-to-noise ratio is further reduced. At the same time, the detection probability and false alarm probability of the new quantum threshold detection scheme are analyzed.Results and DiscussionsThe numerical simulation results show that the signal-to-noise ratio of the quantum threshold detection scheme based on photon number-resolving detection is better than that of classical light intensity detection under the condition of few photons arriving (Fig.5). In addition, the quantum threshold detection performance can be further enhanced by using quantum squeezed state (Fig.6). Finally, a simulation experiment of spaceborne photon-counting lidar altimetry is carried out, and the results show that the performance of the quantum threshold detection scheme can obtain a significant gain in detection probability when returning a small number of photon signals (Fig.7).ConclusionsPhoton-counting lidar can achieve the gain of quantum threshold detection, while other detection schemes based on quantum statistical properties may also provide higher local photon distribution gain, thus improving SNR. Many detection schemes need information about signal strength, and are suitable for applications with known signal strength. While quantum threshold detection does not need to know signal strength, so it is suitable for applications with lidar ranging and measuring unknown prior signal strength. This study shows that in the case of weak signal and strong background noise, PNRD can provide better SNR by thresholding the number of photons rather than directly detecting the intensity, and the detection performance of the system can be further enhanced by using quantum compression emission source. However, the results of photon number resolution under non-ideal conditions will lead to slightly lower SNR, which still needs further study. The combination of quantum compression laser source and quantum threshold detection method can almost always improve SNR in the case of strong noise and weak signal. It can be used not only in navigation ranging and remote sensing detection, but also in any application of weak signal detection under the influence of thermal noise, which also provides a certain reference for the development of new laser radar satellites using quantum characteristics in the future.
Apr. 25, 2023Vol. 52 Issue 4 20220469 (2023)
Lu Li, Kunming Xing, Ming Zhao, Qian Deng, Bangxin Wang, Peng Zhuang, and Yun Shi
ObjectiveWith the development of society and economy, environmental problems are becoming more and more serious. The environmental protection and meteorological departments pay more and more attention to obtaining atmospheric parameters (such as aerosol, water vapor, temperature, etc.). The accuracy of weather forecast can be improved by continuously detecting atmospheric aerosols and water vapor. It is of great scientific significance to study the characteristics and diffusion mechanism of atmospheric pollution aerosols, the formation of clouds, rainfall and so on. As an active remote sensing tool, lidar has better temporal and spatial resolution and continuity than traditional atmospheric detection methods, and plays an important role in the measurement of atmospheric parameters. With the development of lidar technology, the development of lidar is towards miniaturization, production and simplification. In order to meet the requirement of environmental protection department to know the atmospheric parameters in time, an outdoor all-weather atmospheric aerosol-water vapor lidar has been developed by the key laboratory of atmospheric optics of the Anhui Institute of Optics and Fine Mechanics to long-term detection of aerosols and Chinese Academy of Sciences.MethodsAll-weather outdoor lidar system with emission wavelengths of 355 nm and 532 nm is designed and established for detecting atmospheric aerosols and water vapor. Adopting the existing mature technology of Mie-scattering of 355 nm and 532 nm, polarization of 532 nm, Raman lidar remote sensing of nitrogen and water vapor molecules, the lidar system is used for automatic continuous detection of planetary boundary layer, tropospheric aerosol particle and cloud particle optical characteristics and their morphology, water vapor mixture ratio. The lidar structure is compact and convenient for transportation with remote operation, data transmission, one-touch button functions.Results and DiscussionsThe system is used to detect atmospheric aerosols and water vapor, the detection results show that the mixed-layer depth is lower under heavy pollution conditions than that of the clean weather conditions. The mixed-layer depth is below 0.5 km in the heavy pollution days, while in clean days are around 1 km. Through the analysis of extinction coefficient, Angstrom index and depolarization ratio, it can be seen that the bottom atmospheric aerosol is dominated by spherical coarse particle pollutants under heavy pollution conditions, and spherical fine particle pollutants under clean weather conditions. In the cloud layer, the Angstrom index is significantly reduced to a negative value, indicating that the cloud particle radius is large. In the process of water vapor detection, the system calibration constant obtained by the self-calibration method is 121. Compared with the calibrated lidar system, the error is within ±0.3 g/kg for the water vapor mixing ratio. The continuous detection results show that the water vapor content within 5 km at night and the mixed-layer during the day can be detected.ConclusionsUnlike the traditional atmospheric aerosol and water vapor lidar, the system has the functions of 355 nm and 532 nm wavelength Mie-scattering detector, 532 nm depolarization detector, and Raman detector for nitrogen and water vapor molecules. The two-wavelength Mie-scattering detection function can detect the structure of atmospheric boundary layer, the extinction characteristics of aerosol and cloud, and the distribution of coarse and fine particles. The 532 nm depolarization detection function can reflect the shape characteristics of aerosol and cloud particles, and can recognize spherical particles (water cloud, pollution aerosol and haze) and non-spherical particles (sand dust and ice crystal cloud). The Raman detection function of nitrogen and water vapor molecules can obtain the spatial-temporal distribution characteristics of water vapor mixing ratio. The following detection unit of the system adopts a high-stability integrated structure, and the shelter is equipped with the constant temperature function of dust-proof and water-proof, so it can be directly detected in the open air for a long time, it is useful for statistical analysis of physical parameters such as local aerosol particles, cloud particles and water vapor, and has been used in research fields such as atmospheric environmental monitoring and science.
Apr. 25, 2023Vol. 52 Issue 4 20220484 (2023)
Yanshuo Feng, Misheng Liang, Xiaomeng Bian, Guanghui Ren, Honglu Bian, and Lianqing Zhu
ObjectivePlasma nanostructures composed of multiple metals have been widely applied in various fields such as photocatalysis, medical imaging, solar cells, surface-enhanced Raman scattering (SERS), biosensors, and information technology, due to their localized optical near-field properties and surface plasmon resonance effects. Compared with single-metal nanostructures, multi-metal plasma nanostructures exhibit significant enhanced resonance effects in the UV-VIS wavelength range. At present, there are few studies on multi-metal plasmonic nanostructures, and the fabrication methods are complicated, such as tedious processing, poor controllability, and long preparation period. Therefore, in this study, a scheme based on multi-metal thin film plasma nanostructures was designed, and simulation methods were used to demonstrate that the designed multi-metal plasma nanostructures have the characteristic of enhanced electric field. Furthermore, multi-metal plasma nanostructures were fabricated and evaluated using Rhodamine 6G (R6G) with a femtosecond laser direct writing system, demonstrating the enhanced SERS signal of the structure.MethodsThis article describes the construction of a femtosecond laser direct writing system. A titanium-sapphire oscillator laser (with an output power of 3.5 W, a central wavelength of 800 nm, and a repetition frequency of 85 MHz) is used as the femtosecond laser source (Fig.1). Magnetron sputtering technology was used to deposit a dual-layered gold-silver metal film on a silicon dioxide substrate. Rhodamine (R6G) solution was used as the test molecule for evaluating the SERS performance of multi-metal plasmonic nanocavity structures. Confocal Raman spectroscopy imaging was used to analyze the SERS performance of the multi-metal plasmonic nanocavity structures.Results and DiscussionsA multi-metal plasmonic nano-cavity structure was fabricated using a femtosecond laser direct writing system. Different sizes of nanoparticles were produced by adjusting the laser power and pulse irradiation time. The three-dimensional morphology of the experimental results was characterized using AFM and SEM, verifying the size variation law of multi-metal plasmonic nanostructures fabricated by femtosecond laser processing (Tab.1, Tab.2). The FDTD simulation software was used to simulate and analyze the changes in the electric field intensity. The electric field distribution of the planar metal was clearly reorganized, mainly concentrated at the edge of the metal plasmonic nanostructure, and the electric field intensity of the multi-metal plasmonic nanostructure was significantly enhanced compared to that of the single metal, usually manifested as an increase in the localized surface plasmon resonance effect (Fig.2, Fig.3). Evaluation using Rhodamine (R6G) solution showed that the gold-silver bilayer metal plasmonic nanostructure exhibited a stronger Raman signal, while the single-layer planar metal film still did not show any peak (Fig.5, Fig.6).ConclusionsBased on the high-precision, high-flexibility, simple and convenient femtosecond laser processing technology, the metal plasmonic nanostructures were directly fabricated on the surface of metal thin films in this study. Through continuous optimization of processing parameters, uniform and regular nanostructures were obtained, and the structure was characterized to demonstrate the significant enhancement of localized surface plasmon resonance in multi-metal plasmonic nanostructures. Surface-enhanced Raman scattering (SERS) signal enhancement was verified using Rhodamine (R6G). The Raman test results showed that the structure had excellent SERS signal enhancement performance. Experimental simulations were performed using FDTD software, and the results showed that the electric field intensity between multi-metal plasmonic nanostructures was significantly enhanced. Femtosecond lasers can be used to process any material, such as semiconductors, polymers, alloys, and others, with various processing methods. In the future, spatiotemporally shaped femtosecond laser direct writing technology will be used to expand the size processing range of femtosecond lasers and control more material properties.
Apr. 25, 2023Vol. 52 Issue 4 20220522 (2023)
Chao Wei, Fenghong Chu, Zhenglan Bian, and Fang Wei
ObjectiveShort coherent laser light source can eliminate the stray light formed by the reflection of the front and rear surfaces of the optical element to be measured in high-precision interferometry, which is an ideal light source for low-coherence interferometers. There are important applications in optical coherence tomography, refractive index and thickness measurement of organic materials, surface profile detection of optical elements, etc. The imaging quality of the interferometer will be affected by the light source, and the appropriate parameters are very important for the semiconductor laser to obtain high-quality short coherent light source through RF modulation. However, the spectral linewidth of semiconductor lasers is narrow. It is of great significance to reduce coherence length through the coherence control technology.MethodsA short coherent light source was obtained by radio frequency modulation using a Fabry-Perot laser diode with central wavelength of 637 nm. The spectral properties of short coherent semiconductor lasers under RF modulation are theoretically studied based on laser rate equations and modulation characteristics. A short coherent light source system (Fig.2) was built to study the effects of laser slope efficiency, bias current, RF signal frequency and amplitude on the coherence length of semiconductor lasers. Compared with the existing short coherent light source with RF modulation under the same conditions, its improvement effect on the interference image quality was verified.Results and DiscussionsThe spectral linewidth of laser was measured by spectrometer. The short coherence characteristics of two Fabry-Perot lasers with different slope efficiency were studied and the results show that the semiconductor laser with high slope efficiency has greater output power variation under the same modulation signal, which is helpful to achieve good modulation effect. The coherence length of a semiconductor laser is the smallest when the bias current is slightly larger than the threshold current (Fig.4). When the bias current is small, the linewidth of the laser is narrow. This is because some RF signals work below the threshold current, which leads to the abnormally low output power of the laser and affects the RF modulation performance. When the bias current is too large, the coherence of the light source is enhanced, and the increased injection current intensifies the mode competition, the number of longitudinal modes output by the semiconductor laser is reduced and the spectral line width is narrowed. The coherence length of the semiconductor laser is negatively correlated with the frequency (Fig.5) and amplitude (Fig.6) of the RF modulation signal. With the increase of the frequency and amplitude of the modulation signal, the emission spectrum of the semiconductor laser shows multi-longitudinal mode output, the spectral line width is broadened, and the coherence length decreases. An experimental setup for measuring the surface profile of transparent parallel plate glass was built (Fig.8). The short coherent light source obtained by using the parameters in this paper makes the interference image have higher image quality. Compared with the existing short coherent light source, the contrast can reach 0.9318, which is increased by about 51.1%. While avoiding background noise, the interference fringes with surface information are displayed more clearly (Fig.9).ConclusionsUnder the condition of bias current ${I~~{\rm{b}}} = 1.3{I~~{{\rm{th}}}}$, a semiconductor laser with higher slope efficiency is selected. With the increase of modulation signal frequency and amplitude, the coherence length of the laser decreases, and the shortest coherence length can reach 90 $ {\text{μm}} $ at RF signal frequency $ {f~~m} = {\text{950 MHz}} $ and amplitude $ {A~~m} = {\text{19 dBm}} $. It can be used to measure transparent parallel plate optical elements as thin as 0.09 mm, and the interference image contrast is 0.9318, which is higher than the existing short coherent light source. The research improves the performance of short coherent light source and has broad application prospects in the field of low coherent interferometry.
Apr. 25, 2023Vol. 52 Issue 4 20220553 (2023)
Guanglei Liang, Shufeng Sun, Jin Wang, Mingming Jiang, Fengyun Zhang, Xi Wang, Jing Shao, Zhihao Qu, and Pingping Wang
SignificanceMicro-optics theory is a new discipline for the study of the design and manufacturing of micron-sized and nano-sized optical components, as well as the use of such components to achieve the theory and technology development of light waves. As a research field of optics, diffractive optics is based on the diffraction principle of light waves developed microoptics. Diffractive optical technology is of great significance in realizing lightweight, miniaturization, integration, high efficiency and low cost of optoelectronic systems, and the development of diffractive optical technology has also become one of the important ways to develop modern optical systems. As a typical micro-optical element, diffractive optical elements have broad application prospects in industrial and civil fields such as optical imaging, laser technology, and biomedicine due to their small size, light weight, multiple degrees of design freedom and good imaging quality. The processing methods of optical element can be summarized into two types of mechanical processing and optical processing, both of which have their own advantages and disadvantages. The advent of laser provides a new idea for the preparation of diffractive optical elements. Laser processing is a non-contact wear-free technology with high precision and high flexibility, which can process complex contours and has the characteristic of environmental friendliness and simple production process, so the study of laser processing technology in the application of diffractive optical elements is of great significance.ProgressWith the continuous development of modern optical systems, higher requirements are put forward for the processing efficiency and preparation accuracy of diffractive optical elements. Laser direct writing technology does not need mask plate in the process of preparing diffractive optical elements, simplifies the steps, shortens the production cycle (Fig.1(a)). There are many factors affecting the preparation quality of diffractive optical elements, the article summarizes the main factors affecting the surface quality of diffractive optical elements (Fig.1(b)), and explains the influence of focusing system (Fig.2), laser energy (Fig.3) and scanning speed on the preparation of diffractive optical elements, which is very important for improving the preparation accuracy and surface quality of optical components. Different types of laser direct writing systems should also be considered in the preparation of diffractive optical element with different structures (Tab.1). From the aspects of process and system, the research progress of femtosecond laser direct writing system based on Cartesian coordinate system and polar coordinate system in processing diffractive optical element is discussed (Fig.4, Fig.6). Besides, in order to solve the problems of low energy utilization and poor processing efficiency in the process of laser preparation of diffractive optical element, a multi-beam parallel processing method based on laser direct writing technology is proposed (Fig.7). Diffractive optical elements have a variety of functions in optical systems due to their unique characteristics, and the article summarizes the typical applications of diffractive optical elements, such as infrared imaging (Fig.8), chromatic aberration correction, beam shaping, laser processing (Fig.9), image display, etc.Conclusions and ProspectsIn the field of optics, the development of micro-optics theory technology continues to promote the advancement of diffractive optics theory. The application of diffractive optical element has also been expanded in more fields. As a high-precision, programmable, short cycle and flexible processing method, laser direct writing technology has incomparable advantages in the preparation of diffractive optical element. But in the actual processing process, there are problems of limited processing materials, insufficient utilization of laser energy, and the complexity of the system caused by the alignment mechanism in the preparation of curved element, so the research on expanding materials, simplifying equipment, optimizing processes and seeking applications is a continuous and important topic.
Apr. 25, 2023Vol. 52 Issue 4 20220567 (2023)
Lei Chen, Jiajing Zhu, Pan Li, Heshan Liu, Changjun Ke, Jin Yu, and Ziren Luo
ObjectiveDistributed Bragg reflection (DBR) single longitudinal mode fiber lasers have been widely studied and applied due to their simple resonant cavity structure and good stability. However, the narrow tuning range of current DBR lasers limit their applications in many important fields such as spectral synthesis, laser frequency locking, and coherent detection, etc. Therefore, how to improve its tuning range is of greater research value. And improving the mode-free hopping tuning range of DBR fiber lasers has become the research objective in this study.MethodsFirst of all, according to the principle that the center wavelength of fiber grating drifts is caused by resonant cavity temperature change, the equivalent length theory of the fiber grating, the longitudinal mode spacing theory, and the relationship between the gain spectrum of the doped fiber and the intracavity mode competition, the mechanism of DBR single longitudinal mode fiber laser to achieve single longitudinal mode output and the variation of the longitudinal mode in the resonant cavity during the temperature tuning process are theoretically analyzed. Secondly, DBR single longitudinal mode fiber lasers were built based on the theoretical analysis, and two DBR lasers with different equivalent cavity lengths were constructed by using two different lengths of doped fibers. A temperature controller built with a Thermoelectric Cooler (TEC) and a brass sheet was used to control the temperature of the resonant cavity, and the variation of the center wavelength of the output laser and the longitudinal mode of the output laser during the change of the resonant cavity temperature from 0 ℃ to 100 ℃ were tested.Results and DiscussionsAs a result, the conditions that the cavity length of the resonant cavity of DBR single longitudinal mode fiber laser needs to meet in order to realize the temperature tuning without hopping mode are deduced. Besides, different single and multiple longitudinal mode output results during temperature tuning of lasers with different equivalent cavity lengths verify the correctness of the analytical result of cavity length constraint condition for DBR single longitudinal mode laser (Fig.3, Tab.1). And then, 8 mm high-concentration Yb3+ doped single mode fiber is used to achieve a stable single-longitudinal-mode laser at the wavelength of 1064 nm with the distributed Bragg reflection method. The effective cavity length of the DBR resonator is 16 mm and the maximum laser output power is 7.4 mW. The single longitudinal mode tuning of 0.824 nm without mode hopping is achieved by varying the resonant cavity temperature (Fig.4). With the low loss circulator and the fiber mirror to multiply delay fiber length of the heterodyne method to improve measurement accuracy (Fig.7), the measured maximum linewidth of the laser is 4.4 kHz. The relative intensity noise of the laser was tested using a photodetector. The relaxation oscillation peak of the output laser is located at 900 kHz with a relative intensity noise of -110 dB/Hz. The relative intensity noise is -145 dB/Hz when the frequency is greater than 1.5 MHz. ConclusionsIn summary, through theoretical and experimental studies, a 1064 nm, mode-hopping-free tuning range of 0.8 nm distributed Bragg reflective single longitudinal mode fiber laser was proposed, and a series of its key parameters were tested, which has certain application value.
Apr. 25, 2023Vol. 52 Issue 4 20220570 (2023)
Abulikemu Aiziheerjiang, Jiashaner Dana, Yuxia Zhou, and Yusufu Taximaiti
ObjectiveWidely tunable, high-energy, stable, compact, high-beam-quality, mid-infrared 3-5 μm light sources based on optical parametric oscillator (OPO) and optical parametric amplifier (OPA) systems, known as the fingerprint region, are of considerable importance in applications including remote sensing, atmospheric monitoring, spectroscopy analysis, and photoelectric detection surveys. In particular, it is desirable to utilize high-energy, mid-infrared light sources with large wavelength tunability for highly sensitive and selective photoacoustic trace-gas sensing, in which most molecules have strong vibrational transitions. At present, the technologies available that can achieve the desired laser output in the widely tunable and highly-energized mid-infrared region of 3-5 μm are primarily quantum and inter band cascade lasers (QCLs) and OPOs. Although OPO technology has been around for a long time, it is still an excellent light source choice for the widely tunable mid-infrared region. It provides selectivity owing to its large wavelength tunability, high energy, increased beam quality, and compact, cost-effective devices for the generation of mid-infrared light in the 2-5 μm spectral range.MethodsExperimental setup for the high beam quality, idler-resonant MgO: PPLN-OPO is shown (Fig.1). A solid-state Nd:YAG laser (pulse duration: 25 ns, wavelength: 1.064 μm, PRF: 50 Hz, maximum pulse energy: 21 mJ, spatial form: Gaussian profile) was used as the pump source of the OPO. The pump beam was observed by a conventional CCD camera. The spatial forms of the signal and idler outputs were measured by using a Spiricon pyroelectric camera III (Fig.2). The energy scaling of the compact idler-resonant OPO has been investigated with the increasing pump energy (Fig.3). Spectral properties of a compact idler-resonant OPO have been measured by spectrometer (SpectraPro HRS-500, 300 line/mm) (Fig.4). Idler output energies as a function of the idler wavelength at a pump energy of 21 mJ was shown (Fig.5). To validate the high beam quality idler output, the beam quality factor (M²) of the mid-infrared idler output was measured by means of the knife-edge method (Fig.6). Results and DiscussionsThe maximum signal and idler output energies of 3.2 mJ and 1.12 mJ were obtained at a pump energy of 21 mJ, corresponding to the slope efficiency of 24% and 9%, respectively (Fig.3). The wavelengths of the signal and idler outputs were tuned in the ranges of 1.505-1.566 μm and 3.318-3.628 µm by changing the MgO: PPLN crystal temperature in the range of 25-200 ℃ (Fig.4), and the beam quality factor of the mid-infrared idler output was measured by means of the knife-edge method, resulting beam quality factors were estimated as 1.2 and 1.2 along the horizontal and vertical directions, respectively (Fig.6).ConclusionsWe have successfully demonstrated the high-beam-quality, idler-resonant tunable optical parametric oscillator based on single-grating MgO: PPLN crystal. A maximum idler output energy of 1.12 mJ and signal output energy of 3.2 mJ was achieved at a pump energy of 21 mJ, and the beam quality factors of 1.2 and 1.2 in the two orthogonal directions, respectively. The wavelengths of the signal beams and idler beams outputs were tuned in the ranges of 1.505-1.566 µm and 3.318-3.628 µm by changing the MgO: PPLN crystal temperature in the range of 25-200 ℃. In the future work, by using a PPLN crystal with multiple gratings, a broader range of wavelength tuning is expected.
Apr. 25, 2023Vol. 52 Issue 4 20220595 (2023)
Huahang Wang, Jiajia Mao, Shuai Ye, Ping Hu, Xue Zhou, Hongkun Nie, Tao Li, Baitao Zhang, Jingliang He, and Kejian Yang
SignificanceHigh-power continuous wave (CW) single-frequency ultraviolet (UV) lasers have the advantages of narrow linewidth and concentrated energy distribution, and have shown promising applications in scientific research, industrial production and manufacturing, medical diagnosis and treatment, and civil life, including semiconductor lithography, fine material processing, and high-precision spectral analysis. Compared with traditional excimer lasers, ion lasers and free-electron lasers that produce ultraviolet lasers, all-solid-state ultraviolet lasers have more compact structure, lower cost, higher long-term stability and better beam quality. These advantages make people pay more attention to all-solid-state ultraviolet lasers, and all-solid-state continuous-wave single-frequency ultraviolet lasers will continue to develop towards high power and high reliability.ProgressThe basic properties of nonlinear optical crystals used to produce high-power 266 nm ultraviolet laser are comprehensively compared (Tab.1). In the design and manufacturing of ultraviolet laser, the selection of nonlinear optical crystals and their optical properties and quality will directly affect the output power and beam quality of ultraviolet laser. In order to obtain higher-performance UV laser output, β-BaB2O4 (BBO) crystal, CsLiB6O10 (CLBO) and other borate crystals with wide optical band, excellent nonlinear optical effect, stable physical and chemical properties, and high laser damage threshold have been discovered successively, greatly promoting the development of high-power ultraviolet lasers. At present, the method to obtain 266 nm CW single-frequency ultraviolet laser is mainly obtained by external cavity frequency doubling based on nonlinear optical frequency conversion. Among them, the external cavity resonance enhanced frequency doubling technology based on continuous wave single-frequency 1064 nm all-solid-state laser to generate fourth harmonic has become an important method to obtain continuous wave 266 nm single-frequency laser output under low power conditions. For the resonance enhanced external cavity frequency doubling technology, because the resonance enhanced cavity length of the laser system will change under the interference of external environment such as external temperature, air humidity and mechanical vibration, the resonance state of the frequency doubling cavity will be damaged, resulting in poor laser output stability and even lower laser output power, so it is very important to use the electrical feedback control system to achieve accurate, stable and real-time control of the cavity length. At present, the frequency stabilization methods such as Hänsch-Couillaud (H-C) frequency locking, Pound-Driver-Hall (PDH) frequency locking and side-mode bias frequency locking are used for electrical feedback and control of the laser resonator. According to different laser frequency locking methods, this study mainly summarizes the development status of continuous wave single-frequency 266 nm laser using H-C frequency locking and PDH frequency locking methods at home and abroad. Compared with H-C frequency locking method with simple optical path, PDH frequency locking method is easier to obtain error signals with high signal-to-noise ratio, which is conducive to more stable UV laser output. Through comprehensive investigation, the development trend of all-solid-state ultraviolet laser is prospected at the end of this paper, aiming to provide reference for the development and research of all-solid-state ultraviolet laser technology. And this study introduces the latest research result of our research group, which is the stable output of a 1.1 W single-frequency continuous wave 266 nm ultraviolet laser based on the H-C frequency locking method. Conclusions and ProspectsThe all-solid-state CW single-frequency ultraviolet laser is developing rapidly with the efforts of researchers. The all-solid-state single-frequency CW 266 nm laser has achieved a certain degree of productization, but there are still some problems to be solved for its development towards high power, mainly focusing on the poor anti-damage ability of frequency doubling crystal and the low frequency doubling efficiency caused by the intrinsic characteristics of crystal, and it is difficult to achieve higher power laser output. This study aims to provide some references for the design and optimization of all-solid-state ultraviolet lasers in the future. In order to meet higher production requirements and fully realize the commercialization of ultraviolet lasers, all-solid-state ultraviolet lasers will eventually develop towards a more stable and higher power direction.
Apr. 25, 2023Vol. 52 Issue 4 20220885 (2023)
Jiubing Mao, Yuanxing Guo, Yulai She, Qiang Liu, Junhua Zhang, Wei Yang, Jian Yang, and Quanying Li
ObjectiveThe traditional electric interconnection method has become the bottleneck to limit the rapid development of high-speed communication electronic products for its inherent physical characteristics in the case of high frequency. Optical interconnection technology can be used instead of electric interconnection technology to realize high-speed, large-capacity, high-density and flexible information transmission in electronic products and eliminate the technical bottleneck. As a new development direction of board-level optoelectronic interconnection technology, FEOPCB can realize flexible interconnection among different subsystems and meet the development trend of lightweight, miniaturization and high performance of high-speed electronic systems. However, during the high-temperature lamination manufacturing process of FEOPCB, the embedded fibers will generate thermal stress, which will cause damage to the embedded fibers, affecting high-speed signal transmission performance and reliability of FEOPCB. Therefore, it is necessary to establish the finite element model with bare optical fibers embedded for simulating and analyzing the thermal force to guide the design and manufacturing of FEOPCB. For this purpose, the research work on simulation and test of fiber characteristics in FEOPCB process was carried out in this paper.MethodsIn order to reduce the bending radius and improve its reliability, high-precision rectangular positioning grooves for the fibers were designed and fabricated on polyimide substrate with double-sided copper-clad. Firstly, finite element simulation models of fibers with and without coating layer embedded in PI substrate were established and the manufacturing process of FEOPCB was simulated and analyzed with the influence factors of stress for embedded fibers (Fig.1). The results indicate that the stress of the coated fibers is much smaller than that of the uncoated fiber (Fig.5-7). Then, the laser-etching technology was used to fabricate the high-precision rectangular positioning grooves on the double-sided copper-clad PI substrate for the coated fibers (Fig.8). FEOPCB was fabricated by the high-temperature lamination process (Fig.9).Results and DiscussionsFEOPCB has completed the reliability tests of temperature shock, low temperature, high temperature, wet heat and bending fatigue for 100 000 times (Fig.11). Through the observation and analysis with optical microscopy, the result shows that the embedded fibers have no high temperature degradation and cracking defects under high temperature lamination process (Fig.12). The minimum bending radius of FEOPCB is as small as 2 mm, and the bending loss is 0.57 dB and 1.12 dB respectively under 90° and 180° bending conditions (Fig.14). The measurement results show that there is no crosstalk between adjacent fibers. Finally, the high-speed signal transmission performance was measured which indicated that a 10 Gbps communication rate with bit error rate of 10-16 could be reached at the wavelength of 850 nm (Fig.17).ConclusionsIn this study, the finite element analysis method is used to establish the model with coated or uncoated optical fiber embedded in rectangular groove of PI substrate, and the stress and influence factors of embedded optical fiber are analyzed. The results show that the stress of uncoated fiber decreases from 129.72 MPa to 116.80 MPa, and the stress of coated fiber decreases from 89.47 MPa to 52.02 MPa with the increase of intermediate PI layer thickness. The stress value tends to be stable, when the thickness value is greater than 140 μm. With the increase of the thickness of the filling adhesive at the bottom of the optical fiber, the stress on the uncoated optical fiber decreases from 125.04 MPa to 86.82 MPa, and then increases to 93.53 MPa, and the stress on the coated optical fiber increases from 81.30 MPa to 84.52 MPa. The transverse and longitudinal offsets of the embedded optical fibers at both ends of FEOPCB were measured, and the maximum values were 3.87 μm and 7.15 μm, respectively. It can ensure high coupling efficiency between bare optical fiber and photoelectric chip. FEOPCB has completed the reliability experiments and performance tests perfectly. The research results show that the coated optical fiber can be compatible with the printed circuit board lamination process. FEOPCB has high reliability and can meet the requirements of high-speed signal transmission.
Apr. 25, 2023Vol. 52 Issue 4 20220514 (2023)
Han Tang, Wanxiang Zheng, Xingrong Zeng, Dan Yang, Chunfen Zhou, Ling Cao, Man Xu, Hongbing Li, and Kaiyu Yang
ObjectiveWith the rapid development of infrared technology, the concept of SWaP-C (small size, light weight, low power consumption and low cost) has been expanded from infrared detector to the whole design process of infrared thermal imager. In the design of uncooled continuous zoom infrared thermal imager, compared with the modularized uncooled detector and imaging circuit, the optical system affects its envelope size, product weight and price cost. A light, small, low-cost, high-performance uncooled infrared optical system needs to achieve the following five goals. First, the number of lenses is as small as possible. Second, the length of the optical system is short. Third, the diameter of the large objective lens is small. Fourth, the optical system has high MTF. Fifth, the optical system has good environment adaptability. Therefore, the design of an uncooled LWIR continuous zoom optical system with short length, light weight, low cost and high performance will have broad market prospects.MethodsThere are difficulties in miniaturization and athermalization design of uncooled LWIR continuous zoom optical system due to its large relative aperture and few kinds of infrared optical materials. The purpose of compressing the total length of system and balancing aberration is achieved by using three groups of linkage zoom technology. Through the active compensation of athermalization technology, the system has good imaging quality in the temperature range of -40-60 ℃. The specific design process of the optical system is as follows. Firstly, the calculation program is compiled according to the three groups of linkage continuous zoom models. According to the design index, the initial optical form is calculated by considering the total optical length, lens focal length distribution and lens spacing. The parameters are input into Zemax optical design software to establish the ideal optical model. Secondly, the shape and material are reasonably selected according to the focal length of the lens, and the evaluation function is set to enter the optimization and global optimization. Thirdly, according to the results of the evaluation function, the imaging quality at normal temperature and at high and low temperature is evaluated. Then, the tolerance analysis of optical system is carried out to make the system meet the tolerance range of processing and assembly requirements. Finally, the optical system zoom curve renormalization operation is carried out to complete the optical system design. The design flow chart is shown (Fig.2).Results and DiscussionsThe final design result of the compact and low-cost uncooled LWIR continuous zoom optical system is shown (Fig.4). The whole system uses four lenses with the working band of 8-12 μm, the focal length range of 20.7-126 mm, the corresponding F# of 1.05-1.2, the field of view range of 21°×16.8°-3.5°×2.8°. The zoom ratio is 6.0×, the maximum machining diameter is 116 mm, the total length of the optical system is 180 mm, the total weight of the optical part is 418 g, and the telephoto ratio is 1.44. The MTF, SPT and distortion of the optical system are analyzed by Zemax optical simulation software. The system imaging is clear and meets the requirements. The MTF of the optical system at normal temperature (Fig.5), the SPT of the optical system (Fig.6). and the system distortion (Fig.7) are shown. The imaging quality of the optical system is evaluated at high and low temperature, and the optical system meets the requirements of athermalization. The tolerance of the optical system is estimated by statistical algorithm, and the tolerance of the system meets the actual use requirements. By renormalizing the cam curve of the optical system, the motion curves of the three lenses are obtained (Fig.15). The optical system achieves the SWaP-C goals. ConclusionsBased on a 640×512 uncooled focal plane detector with pixels size of 12 μm, a compact low-cost continuous zoom optical system composed of four lenses was designed using variable F# design method, three groups of linkage zoom design technology and active compensation for athermalization. The focal length of the system varies from 20.7 mm to 126 mm, the total optical length is 180 mm, the lens processing technology is mature, the processing and adjustment tolerance is good, the zoom cam curve is smooth, the cam track is easy to process, and the motion servo control is simple. The system has clear imaging in the environment of -40 ℃ to +60 ℃. The optical system has the characteristics of light weight, high performance and low cost. It will be widely used in unmanned equipment platform and handheld thermal imager equipment, and promote the development of uncooled infrared thermal imager in the direction of reducing SWaP-C.
Apr. 25, 2023Vol. 52 Issue 4 20220607 (2023)
Yongjian Wu, Dawei Yang, Xin Sun, Yong Liu, and Yongli Hu
ObjectiveVertical assembly and adjustment is one of the key technologies of long focal length and large aperture space camera. In order to overcome the inconsistency between the on-orbit and the ground caused by gravity change, material deformation and other factors, the secondary mirror adjustment has become one of the key technologies to correct the defocus of the optical remote sensor and the relative position change of the primary mirror and the secondary mirror. Precision secondary mirror adjustment technology has been widely used in high-resolution space optical remote sensors. For example, Stewart platform 6-DOF parallel mechanism, which has been successfully applied in Hubble telescope and reconnaissance camera, has the advantages of high accuracy, high bearing capacity and high rigidity, and has the ability to precisely adjust the secondary mirror components in the optical system. Many theoretical analysis and engineering research have been done on the 6-DOF adjustment mechanism in China, but the 6-DOF adjustment mechanism also has the disadvantages of complex structure and control system, high cost and relatively large weight. Therefore, it is necessary to develop a single-degree-of-freedom secondary mirror adjustment mechanism with high accuracy, high integration and high reliability to solve the inconsistency between heaven and earth faced by the current high-resolution space optical remote sensor.MethodsIn order to meet the secondary mirror adjustment requirements of a high-resolution camera, a high-precision and high-stability secondary mirror adjustment mechanism combining precision linear transmission, flexible transmission and flexible support technology is built in this paper (Fig.1). The linear transmission device (Fig.4) adopts the redundancy design of one main and one standby, and has precision position telemetry capability. The flexible transmission hinge with transmission ratio of 10∶1 is used for motion transmission. Compared with the traditional gear reducer, it has the advantages of small impact, no wear, stable transmission, and high reliability. At the same time, the flexible hinge has the advantages of high-precision transmission in the range of small displacement. The secondary mirror uses bipod flexible support to design unloading force thermal deformation, and ensures its flexibility along the optical axis direction (focusing direction) through three pairs of 120° flexible guide hinges.Results and DiscussionsThis set of precision adjustment mechanism has carried out adjustment precision test after completing the mechanical environment assessment. The test is carried out according to 0.088° rotation of step motor (corresponding theoretical step distance of secondary mirror 8.858 μm). The initial position of the secondary mirror is zero. The secondary mirror is drived to complete the whole adjustment cycle of "zero position→positive limit position→zero position→negative limit position→zero position". The adjustment accuracy test results after the mechanical environment assessment of the optical and mechanical products of the adjustment mechanism show that the mechanism has the ability to achieve high-precision adjustment in a large range (Fig.8-11), and meets the requirements of the on-orbit application of space optical remote sensor.ConclusionsIn this paper, a set of high-precision secondary mirror adjustment mechanism is designed by combining the flexible support, precision linear drive and flexible hinge transmission technology of the second mirror. This paper first introduces the optical and mechanical structure, working principle and transmission link of the mechanism, then describes the design of ultra-light secondary mirror assembly, high-precision linear actuation and high-precision focusing transmission, and finally introduces the adjustment accuracy test after the vibration test. The test results show that the measured adjustment stroke of the set of precision adjustment mechanism is more than ±120 μm, the axial adjustment step precision is 0.18 μm, the maximum translation error of the secondary mirror within the adjustment stroke is 1.3 μm, and the maximum tilt error is 1.9″. It has the characteristics of wide adjustment range and high adjustment accuracy, and meets the requirements of the precision secondary mirror adjustment of the space optical remote sensor.
Apr. 25, 2023Vol. 52 Issue 4 20220635 (2023)
Bin Xuan, Zeyu Zhao, Yaowei Luo, Qun Wei, Yixian Zhu, and Yajun Wang
ObjectiveThe industrial lens for machine vision inspection needs not only to meet the design requirements of lightweight and large field of view, but also have high luminous flux. In this paper, based on the needs of machine vision engineering applications, an optical system for wide-spectrum visible-short wave infrared imaging is designed using the optical design software ZEMAX. The Wide spectrum visible-short wave infrared imaging system can operate in the band of 0.4-1.7 μm. The system is composed of 7 groups of 10 lenses. The MTF value is greater than 0.4 at the Nyquist frequency of 100 lp/mm. The F number of the system is 2.8, and the distortion is less than 1.4%. All kinds of aberrations have been well corrected and balanced. And the system has good imaging performance. It has certain reference value for the design of similar optical systems. MethodsThe optical system structures are usually divided into refractive system, reflective system and hybrid system. Different optical system structures have their own advantages and disadvantages. According to the imaging performance of the system and the cost-performance ratio in industrial applications, the refractive system can meet the requirements of large field of view, low distortion and compact structure. The refractive system is used to observe through refraction of transmitted light, so it is widely used in optical structure selection. At the time, by using the conventional processing and adjustment methods, it can meet the accuracy requirements. It has the characteristics of stable image quality, small stray light and high element transmittance.Results and DiscussionsAccording to the actual needs of industrial testing, the main parameters to be considered in the structural design of the wide-spectrum visible-short wave infrared imaging optical system are lens material, working band, focal length, F number, field angle, total length of the system, etc. Based on the analysis of the parameters of the wide-band infrared imaging system, the resolution CMOS area array detector is 2448×2048. The pixel size is 3.45 μm. The target size is 2/3 inch (1 inch=2.54 cm), and the lens has stable optical performance and good imaging quality in the operating temperature range of 0-50 ℃. After the initial structure of the system is determined, the design structure is further optimized using subsequent repeated aberration correction. The optimized wide-spectrum visible-short wave infrared imaging optical system is composed of 7 groups of lenses, and the number of the lenses is 10. The diaphragm is located on the rear surface of the fourth lens, and the front surface of the tenth lens is aspheric. The total length of the system is 79.6 mm, the diameter of the entrance pupil is 9.9 mm, and the F-number is 2.8. It can image in the visible light and short-wave infrared bands. After testing, the point array of the system's field of view is very close to the Airy spot, which is close to the diffraction limit, and meets the imaging requirements. The maximum astigmatism and field curvature of the system is 0.1 mm, and the maximum distortion is 1.4%, which meets the requirements of the system design for field curvature and distortion. The systematic tolerance is analysed based on diffraction MTF average. According to the experience and actual technological level, firstly, relatively loose tolerance preset value of each parameter is given, and then the tolerance analysis is carried out based on the design results, finally the particularly sensitive tolerance is found out and the tolerance is reallocated. Through Monte Carlo analysis of MTF, the results show that at 100 lp/mm, the nominal value of MTF is 0.559, the best value is 0.554, the worst value is 0.333, the average value is 0.481, and the standard deviation is 0.052, the MTF of 90% of the lens≥ 0.410, the MTF of 50% of the lens ≥ 0.427, and the MTF of 10% of the lens≥ 0.540. Based on the results, the MTF can meet the technical index requirements under the given tolerance. In order to better prove the performance of the optical system, the bruises in the interior of agricultural products are taken with a visible light band camera and a short-wave infrared camera respectively, which proved that the bruises can be clearly seen in the object image of this wavelength by SWIR imaging. The ability of SWIR to penetrate plastic was proved by shooting through plastic bottles. The experiment proves that the system has good detection effect in industrial detection. ConclusionsWith the increasing demand of machine vision for composite image information, the modern optical imaging technology will expand beyond the visible and near-infrared bands. Short-wave infrared will be more widely used in the future because of its resolution comparable to visible light and unique optical performance.
Apr. 25, 2023Vol. 52 Issue 4 20220638 (2023)
Tiejun Li, Luming Xue, Jinyue Liu, and Xiaohui Jia
ObjectiveIn the three-dimensional reconstruction of surface structured light, due to the limitation of the reconstruction depth of field, the problem of reconstruction error occurs when the measured object exceeds the reconstruction depth of field. In the large scene where the longitudinal shooting range is required, a single shot cannot meet the reconstruction requirements. It is necessary to move the structured light system along the longitudinal direction and re-calibrate, which increases the complexity and repeatability of the task. In this paper, a depth-of-field extended 3D reconstruction technology based on auxiliary camera is proposed, and the objects inside and outside the reconstructed depth of field are reconstructed adaptively with the help of phase threshold.MethodsThe absolute phase is obtained by the combination of four-step phase shift and complementary gray code, and the camera and projector are calibrated by polynomial fitting method. With the help of the depth of field calculation model, the depth of field range of the main camera and the auxiliary camera is calculated and the device is fixed according to the specific position (Fig.2). The auxiliary camera is used to obtain the pixel coordinates of the calibration plate beyond the depth of field reconstructed by the main camera. The joint calibration results of the binocular camera are used to convert it into the main camera coordinate system. Combined with the phase value obtained by the main camera, the phase-height mapping relationship beyond the depth of field reconstructed by the main camera is established (Fig.4). Based on the traditional phase method model, the relationship between phase and shooting distance is quantitatively analyzed, and the phase adaptive threshold is proposed.Results and DiscussionsThree-dimensional reconstruction is carried out by using different mapping relationships for four different objects to be measured (Fig.7). The effect pictures of the traditional method (Fig.7(d)) and the method in this paper (Fig.7(e)) are shown respectively, and the reconstruction contrast effect is obvious. In this paper, the three-dimensional reconstruction of the object to be measured inside and outside the reconstructed depth of field is carried out by establishing a global mapping. The reconstruction effect is not as good as the local corresponding mapping reconstruction effect (Fig.8), so the phase adaptive threshold is introduced. When the system is calibrated, the specific order of the calibration number and the shooting distance is strictly followed to verify the linear relationship between the phase and the shooting distance (Fig.9), which proves the correctness of the adaptive threshold.ConclusionsThe maximum error between point cloud data and real data is 0.041 mm by three-dimensional reconstruction of the inner step of the main camera depth of field. With the help of the auxiliary camera, the mapping relationship beyond the reconstructed depth of field of the main camera is established. Based on the depth of field calculation model, the reconstructed depth of field range in this scene is quantitatively calculated. Experiments show that this method can improve the reconstructed depth of field range by about 50%, which greatly improves the reconstruction range of surface structured light.
Apr. 25, 2023Vol. 52 Issue 4 20220647 (2023)
Mingze Ma, Xu He, Jinxin Wang, Jing Luo, Tianxiao Xu, Cui Lin, and Haoran Zhou
ObjectiveWhen the large aperture off-axis three-mirror anastigmat (TMA) is launched to space, surface degradation appear on the the optical surface of its components due to gravity unloading, which will affect the imaging quality of the system. In order to ensure the imaging quality of the large aperture space reflecting telescope in orbit, it is necessary to explore the surface figure error compensation mechanism of the position of optical elements. Then the compensation mechanism of the secondary mirror position for the primary mirror and the third-mirror shape of the off-axis TMA system was investigated. So that the space telescope can actively use the element pose adjustment to compensate the impact of surface figure degradation on the imaging quality of the system.MethodsIn order to analyze the progressive compensation mechanism of the surface figure error, the compensation mechanism and compensation amount are defined and calculated based on the nodal aberration theory(NAT). Firstly, the Zernike polynomial vector form is used to describe the surface figure error of the off-axis TMA system based on the vector multiplication rule, and its derived aberration distribution is analyzed. Different from the aberration characteristics of the position of the primary mirror at the stop, the third mirror in the non-stop position of each field of view on the surface of the beam trajectory is different (Fig.1). Therefore, when compensating for the surface figure error of the third mirror, the situation of each field of view is different. This is also the focus of the investigation on the analysis and discussion of using pupil position transformation and least square method to solve the problem. Then a vector aberration correction model is proposed and an aberration compensation model of off-axis TMA system is constructed. In order to objectively evaluate the imaging quality of the imaging system, the exit pupil wave aberration RMS value is taken as the evaluation standard, and the secondary mirror adjustment with small aperture and the highest sensitivity in the TMA system is used to compensate the system exit pupil wave aberration with surface figure errors in the primary mirror and the third mirror.Results and DiscussionsSimulation experiments show that when the primary mirror of the system has 0.5λ astigmatism and coma, the constructed aberration compensation model can compensate the exit pupil wave aberration RMS value from 0.18λ to 0.08λ (Tab.5). When 0.05λ astigmatism and coma exist on the system's third mirror, the exit pupil wave aberration RMS value can be compensated from 0.3λ to 0.1λ (Tab.8). In order to verify the applicability of the aberration compensation model, Monte Carlo experiment was carried out, which proved that when the third-mirror figure error (astigmatism and coma) was within the range of (-0.03λ, 0.03λ), the RMS value of each field of view of the system could be compensated to the design value of the system (Fig.9). ConclusionsA portable surface figure error compensation model of the TMA system is designed. It can compensate the RMS value of the TMA system with 0.5λ in the primary mirror and 0.05λ in the third mirror respectively to the nominal state. Through analysis, it is found that the third-order coma in the non-stop position is derived from the linear correlation astigmatism with the field of view by optical symmetry coordinate transformation. The astigmatism and coma distribution rules can be verified during the analysis of the surface error of each position of the system, which provides a theoretical reference and basis for other types of aberrations and further theoretical guidance for the active in-orbit installation of large aperture reflecting space telescopes. It provides the basic theory and framework for constructing the surface figure error compensation model of the primary mirror and the third-mirror of off-axis TMA system.
Apr. 25, 2023Vol. 52 Issue 4 20230053 (2023)
Yang Huang, Yinglong Zhao, Shengjie Zhang, Xiaohan Du, and Chao Zhang
ObjectiveDue to the characteristics of large field of view, small size and low cost, infrared refractive lenses have been widely used in aerospace remote sensing, military reconnaissance, biological detection and other fields. With the development of infrared imaging technology, higher requirements are put forward for the technical specifications of imaging systems. Therefore, improving the imaging performance of lenses becomes the key in the alignment process. At present, the high-precision alignment of infrared refractive lenses at home and abroad mainly adopts the method of centering error measurement, which makes the centering error of each optical element within the tolerance range by adjusting its position. However, due to the preparation process characteristics of infrared optical materials, the refractive index homogeneity of most materials is difficult to guarantee (Fig.2), which must introduce additional irregular aberrations into the optical system, and lead to the degradation of lens imaging performance. The core of precise centering error measurement and alignment is the control of optical axis consistency and spacing of optical elements, which can't do anything to correct the irregular aberrations of the system. For this reason, a system wavefront compensation method combining the iterative adjustment position and the surface modification for the optical elements was presented to realize infrared lenses alignment based on high performance.MethodsBased on the precise centering error measurement of lens, an online device with lenses alignment and image quality measurement was designed (Fig.3), which can switch the measurement and alignment conditions through the planar mirror switching device to cut in and out. According to the measured wavefront results of the lens and the computer aided alignment technology, the positions of the optical elements were iteratively adjusted by the clamping devices and jackscrews to correct the first-order aberrations (Fig.4). The residual medium and high-order aberrations of the system were compensated by repairing the optical element surface at the pupil and introducing the anti-residual wave aberrations, on the basis of comprehensive analysis and calculation of system wavefronts measured in several fields of view (Fig.6).Results and DiscussionsA medium wavelength infrared refractive lens was aligned by means of systematic wavefront compensation. Due to the refractive index inhomogeneity of materials, the RMS (λ=3.39 μm) of the system wavefronts for the lens's three fields of view were 0.162λ, 0.118λand 0.166λ respectively after precision centering (Tab.2). Based on the sensitivity matrix, the first-order aberrations were corrected by iteratively adjusting the positions of the optical elements, which decreased the RMS (λ=3.39 μm) of the three fields of view to 0.090λ, 0.083λ and 0.098λ (Tab.3). Then, the residual medium and high-order aberrations were compensated by repairing the surface of the optical windows (Tab.4), and the RMS (λ=3.39 μm) of the three fields of view were reduced to 0.064λ, 0.040λ and 0.067λ at last (Tab.5). The results show that this alignment technology can effectively compensate the system wavefronts of the infrared lenses and greatly improve the image performance, which has important engineering application value. ConclusionsDue to the high deviation of the refractive index homogeneity of infrared optical materials, it was very difficult to align infrared refractive lenses with high performance. In this study, the alignment technology for infrared refractive lenses based on high performance is proposed. Through the introduction of online device with lenses alignment and image quality measurement, the lens alignment and measurement were integrated, and the positions of the optical elements were iteratively adjusted to correct the first-order aberrations based on the system sensitivity matrix. At the same time, the residual medium and high-order aberrations of the system were compensated by repairing the optical element surface at the pupil and introducing the anti-residual wave aberrations. Through an example of lens alignment, it was verified that this technology can significantly improve the imaging performance of infrared refractive lenses, break through the limitations of traditional methods of lens alignment, and provide a feasible way for developing high performance infrared lens.
Apr. 25, 2023Vol. 52 Issue 4 20220790 (2023)
Yutong Liu, Yan Li, Lu Jin, Huaxu Tang, Shun Wang, Yucong Wu, and Yueshu Feng
ObjectiveMicroscopic imaging technology is the primary research method for biological organs, tissues and cells. It plays a significant role in promoting the development of biology and medicine. However, the diversity and complexity of biological samples, the low signal-to-noise ratio, and the optical diffraction limit of traditional optical microscopy significantly limit its application. Different biological samples and different application scenarios have different requirements for microscopic imaging technology. Therefore, in clinical applications, how to obtain images with appropriate resolution through practical needs, and how to shorten imaging time while ensuring imaging quality are the problems that need to be solved urgently in microscopic imaging applications.MethodsThe microscope is modified by adding a beam-splitting device in the optical path. The light that carries the sample information was exported to the multi-resolution microscopic correlation imaging system after being magnified by the objective lens. The experimental system was integrated into the shell (24 cm×18 cm×12 cm, Fig.2). The optical signal is illuminated to DMD, and the signal light is modulated by DMD and received by a single-pixel detector. The reconstructed images of the sample are obtained through the second-order correlation operation of the modulation matrix and detection intensity of a single-pixel detector. The imaging system was equipped with an industrial computer and a data acquisition card, which are used to control the DMD, load the preset pattern and record the light intensity collected by the detector. The reconstructed images of the sample are obtained through the second-order correlation operation of the modulation matrix and detection intensity of a single-pixel detector. Then the images are processed through deep learning.Results and DiscussionsThe tissue slice was used as the target object, and the performance of the DLGI system after hardware and software design were tested. The imaging results under five different sampling rates were obtained (image resolution: 128×128, Fig.5 and Fig.6). With the decrease of the sampling rate, the imaging quality is reduced significantly, accompanied by a large amount of noise. When the sampling rate reaches 60%, the internal details of biological tissue in traditional correlation imaging (GI) cannot be recognized, and it is unacceptable for pathological section observation. The image quality is significantly improved after using the deep learning method. Even when the sampling rate is 60%, the internal details and edge contours of biological tissues can be restored clearly, and the image noise is significantly improved. In this paper, the ultra-efficient and lightweight hyper-division network based on heavy parameterization reduced the complexity of image calculation significantly (Fig.3), and the reasoning time can reach 51 ms. The imaging time of the imaging system in this paper can save 0.37 s while ensuring the imaging quality and significantly reducing the memory occupation (Tab.1) .ConclusionsA multi-resolution microscopic correlated imaging based on deep learning is designed to meet the diverse needs of microscopic imaging and solve the contradiction between imaging quality and imaging time in practical application. The system combines deep learning with correlation imaging technology through hardware design and software processing of the microscope. The imaging system can restore image details with a sampling rate of only 60%, significantly reduce the noise caused by under-sampling, and significantly improve the time resolution of the system. In addition, to meet the actual needs of the small-scale imaging systems, an ultra-efficient super-resolution network is adopted based on the overparameterization method to realize real-time imaging under equipment with limited resources. The proposed imaging system can significantly reduce the imaging time and memory occupation while maintaining imaging quality. The test results of different types of biological samples and resolution boards further show the robustness and anti-noise performance of the system. The research results of the system have great significance for the biomedical field.
Apr. 25, 2023Vol. 52 Issue 4 20220461 (2023)
Jiulong Wang, Rui Wang, Luwei Zhang, Xinlong Chen, Weichun Chen, Jitang Guo, and Sheng Cai
ObjectiveGeosynchronous orbit is a strategic location in space. It contains communications satellites, data relay satellites, electronic reconnaissance satellites, missile early warning satellites and weather satellites. With the continuous expansion of space mission scope, the application of GEO satellites has been extended to new space missions such as space-based situational awareness, acquisition of non-cooperative target characteristics, in-orbit control, rendezvous and proximity, etc. GEO region has gradually become the focus of attention of various countries, and related technologies have also become the forefront of international competition. In order to control this strategic area and ensure its superiority in space, the US military, supported by its military strategy, advanced technology and financial resources, has deployed a large amount of space offensive and defensive equipment. The United States Air Force put forward the Geosynchronous Space Situational Awareness Program (GSSAP). Through close tracking and monitoring of high-value targets, it can master the mission function, configuration, performance indicators, activity rules and other information of each satellite, and understand the intention, process and effect, so as to strengthen the one-way transparency advantage of space posture. Therefore, it is necessary to conduct in-depth research and analysis on the development history, platform condition, orbit characteristics, mission control and overall index of GSSAP satellite.MethodsA portable imaging simulation process is built in this paper. GSSAP imaging simulation system includes target and background modeling, photoelectric sensor modeling, scene imaging generator (Fig.8). The event of GSSAP-4 close to Shijian-20 was selected as the research object (Fig.9). The phase angle and relative distance between GSSAP-4 and Shijian-20 satellite were calculated. The parameters of GSSAP electro-optical sensor were selected, with a 500 mm aperture (Tab.4). The imaging effect of GSSAP EO/IR sensor on Shijian-20 satellite was simulated (Fig.10).Results and DiscussionsThe sun phase angle between GSSAP and the target was calculated, which is generally kept between 40° and 160° (Fig.7). At this time, the target was located in the down-light observation area of GSSAP, which can effectively avoid the influence of solar stray light on imaging. The sun phase angle and relative distance between GSSAP-4 and Shijian-20 satellite were calculated (Fig.9). The closest distance of them was 9.54 km. The imaging effects of GSSAP-4 were simulated at different distance and sun phase angle (Fig.10-11). At a distance of 10 km, the target body, solar panels and payload can be clearly seen.ConclusionsIn this study, the approach imaging mode of GSSAP satellite is analyzed, and the on-orbit operation mode of orbiting imaging and grazing imaging is extracted. The two-lines elements of GSSAP satellites in recent years were studied. Combined with the orbital information of Chinese high-orbit satellites, dozens of potential close-in reconnaissance activities of GSSAP for Chinese high-orbit satellites were found out. Based on the measured data, the whole process of GSSAP-4 close to the Shijian-20 was analyzed, and the relative distance and solar phase angle of the two were calculated. Under the conditions of distance of 10-133 km and solar phase angle of 44.67°-134.37°, the imaging effect of GSSAP electro-optical sensor was simulated. The results show that GSSAP has carried out multiple close-in surveillance of China GEO satellites. When the aperture is 500 mm, Fnumber is 10, pixel pitch is 6.5 μm, pixel number is 1 024 pixel×1 024 pixel, and integration time is 20 ms, high-resolution fine imaging can be carried out on the target, and the details of the target can be clearly seen, which brings a serious threat to the high value assets of GEO in China.
Apr. 25, 2023Vol. 52 Issue 4 20220759 (2023)
Lin Zhao, Xiaodong Zhang, Lihua Lei, Qun Yuan, Suoyin Li, Faguo Liang, and Aihua Wu
ObjectiveThere are a large number of high-aspect-ratio structures in silicon-based MEMS devices, and non-destructive testing of linewidth and depth of these structures is a hot issue at present. Generally, the depth-to-width ratio of MEMS high-aspect-ratio structures is generally between 10∶1 and 100∶1, and the trench width is a few microns to tens of microns. At present, in the silicon-based MEMS process line, anatomical testing is the main means of high-aspect-ratio structure testing, but there are the following defects: it is necessary to use scanning electron microscopy (SEM) for auxiliary measurement, which is inefficient and cumbersome; It is a destructive measurement that causes irreversible damage to MEMS products; It can only be sampled and cannot fully reflect the characteristics of the process. Based on this, a non-destructive measurement system with high-aspect-ratio structure near-infrared broad-spectrum microscopy measurement system was developed, and its measurement accuracy will directly affect the overall performance of the device under test, so it is necessary and urgent to calibrate the measurement system.MethodsIn order to achieve the accurate calibration of the non-destructive measurement system of high-aspect-ratio structure, a series of standard samples of high-aspect-ratio trenches are designed and developed by semiconductor process, with a width range of 2-30 μm, a depth range of 10-100 μm, and a maximum high-aspect-ratio of 30∶1 (Tab.1). The samples were characterized and fixed, and finally the developed standard samples were applied to the calibration of the near-infrared broad-spectrum microscopy measurement system (Fig.13).Results and DiscussionsIn order to meet the calibration function of the standard samples, a variety of characteristic structures are designed (Fig.1), including auxiliary fixed value structure, measurement positioning structure and positioning angle structure, etc., and the characterization and assessment method of the sample value are designed (Fig.5-6). Measurement values include line width size, trench depth size, and uniformity. Finally, the developed standard template is applied to the near-infrared broad-spectrum microscopy measurement system to further verify the accuracy of the developed system, that is, the applicability of the template (Tab.2).ConclusionsIn order to solve the calibration problem of the near-infrared broad-spectrum interferometric microscopy system, a series of standard samples of high-aspect-ratio grooves were developed, with a width range of 2-30 μm and a depth range of 10-300 μm, and its high-aspect-ratio reached a maximum of 30∶1. In order to meet the calibration function of the template, a variety of characteristic structures are designed, including auxiliary fixed value structure, measurement positioning structure and positioning angle structure, etc., and the characterization and assessment method of the sample measurement value is designed. Since there is no suitable measuring instrument to directly characterize the value of the standard template of the composite high-aspect-ratio trench, an auxiliary fixed value structure is designed for the standard template, and the cross-section of the high-aspect-ratio trench structure is displayed by sectioning, and then it is measured by scanning electron microscope or atomic force microscope, and the uniformity of the template is characterized to ensure the consistency of the measurement results of the template. Finally, the developed standard template was measured by the near-infrared broad-spectrum interferometric micrometry system, and the measurement results showed that the magnitude was basically consistent with the characterization results.
Apr. 25, 2023Vol. 52 Issue 4 20220646 (2023)
Yujie Zhang, Lei Xu, Yuqing Guan, Wenzhe Zou, Chuangwei Guo, Lihua Lei, Yunxia Fu, Zhenyan Guo, Zhenjie Gu, and Xiao Deng
ObjectiveNano-displacement measurement technology is an important branch in the field of precision measurement, its development and improvement are important guarantee for realizing high-precision nano-manufacturing. With the rise of laser self-mixing interference technology, the precision displacement measurement method with simple structure, low manufacturing cost and measurement accuracy up to nanometer level has been vigorously developed. Laser self-mixing interference technology has been widely used in displacement measurement, absolute distance measurement, speed measurement, and vibration measurement, etc. With the advantages of single optical path structure and the comparable measurement accuracy as double beam interference, the self-mixing interference technology has better application prospect in the industrial area. Traditional laser self-mixing interference schemes mostly take mirrors or scattering surfaces as target mirrors, which take laser wavelengths as measurement benchmarks and are easily disturbed by environmental changes. In order to increase the robustness of the measurement benchmark, this paper studies a laser self-mixing nanometer displacement measurement method based on a planar reflective holographic grating. Different from traditional laser self-mixing interference, the displacement measurement value based on grating feedback is determined by the period of the grating.MethodsFor the laser self-mixing displacement measurement method based on the plane reflective grating feedback, the vibration displacement value of the holographic grating is reconstructed in this paper. The displacement measurement value of this method is based on the grating period. The system setup is shown (Fig.1). The light emitted by the laser is incident on the grating surface at the Littrow angle, so the retro-reflect one-order diffraction light carry the Doppler phase shift caused by the displacement along the grating period direction. The self-mixing interference output laser is splitted by the structure composed of a half-wave plate and a polarized beam splitter, and the self-mixing signal is collected through a photodetector. In terms of signal processing, the grating self-mixing interference signal is firstly denoised by a low-pass filter and then normalized. Combining the threshold setting method to decide the inversion point of the displacement direction and the phase unwrapping algorithm of arccosine, the displacement of the grating is reconstructed. The grating used in this experiment is a plane diffraction grating with the period of 2400 lines/mm, which equals 416.67 nm. The constructed displacement is compared with the measurement result of a commercial laser interferometer.Results and DiscussionsIn the grating self-mixing interference experiment, the signal under the condition of weak feedback intensity was measured, and the normalized interference signal was shown (Fig.5). After signal processing based on the arccosine method, the corresponding nano-displacement reconstruction results were obtained (Fig.7). The result represents the linear displacement of reciprocating motion as shown in the experiment setting. By calculating the variance of the linear displacement, the entire system has a displacement noise of 5.82 nm, which is expected to be optimized by performing a finer filtering on the signal. From the displacement reconstruction results, the entire measurement result has a linear deviation coefficient of 1.1086 times the actual displacement. A commercial laser interferometer and a grating self-mixing interferometer were also used to compare the displacement measurement data. After the linear correction, the measurement results show that the displacement error does not exceed 0.241% (Tab.2).ConclusionsLaser self-mixing nano-displacement measurement method based on the feedback of a planar diffraction grating is studied in this article, and a calculation method using the arccosine method for wrapping phase is proposed. Experimental research was carried out under weak feedback conditions, and the experimental results were reconstructed based on the arccosine method. Compared with the measurement results of commercial laser interferometers, it was found that the laser self-mixing interferometry method based on planar diffraction grating feedback could be used as an effective scheme for nano-displacement measurement. In the future, the measurement accuracy and precision of the grating self-mixing interferometer can be further improved by optimizing the geometric alignment, adopting a more accurate grating, and performing more effective filtering on the signal.
Apr. 25, 2023Vol. 52 Issue 4 20220676 (2023)
Peidong Zhang, Wei Liu, Wenqi Wang, Likun Si, Yang Zhang, and Mengde Zhou
ObjectiveCutting occupies a dominant position in mechanical manufacturing, which is the key factor in the development of aerospace, automotive, and electronic industries and other fields. As one of the most important terminals in manufacturing, cutting tool plays an outsized role in removal machining. It is proved that the geometrical parameters have a significant influence on the quality of the workpiece, the efficiency of cutting and the tool life. Given the importance of tool geometry parameters, it is essential to measure these parameters precisely before and during manufacturing. With the increasing requirements of different materials to process, the structures of the cutting tools used to machine become more complex than traditional cutting tools which brings a challenge for the precision measurement. Compared with the common method based on feature images and structured light sensors, the measurement method based on depth from focus presents the advantages of high precision and plenty of data. Hence, a geometry measurement method of cutting tools based on the depth from focus is proposed and the key technique is discussed.MethodsFirstly, to solve the problem that the existing focusing function is not suitable for the sequence images of the measured cutting tools and improve the accuracy of the 3D reduction, an improved focus evaluation function based on the double-threshold Tenengrad function is proposed. Due to the surface irregularities of complex tools, the cutting edge is interrupted, resulting in sharp and diverse edge properties. In order to boost the gray gradient and calculate the edge information that the original convolution operator ignored, the function is improved by adjusting the convolution operator and expanding the direction angle of the edge gradient. Moreover, noise information is taken down using an image preprocessing algorithm and a double threshold constraint to generate a high-quality 3D point cloud. Specifically, Gaussian filtering and the Laplacian image enhancement algorithm are applied to remove the image's natural noise while maintaining all of the image's feature information. The threshold determined by the average value and dispersion degree of the gray gradient is then used to reduce noise from the 3D point cloud. After determining the improved function, the properties of no obvious texture on the tool surface serve to establish the size of the computation window for the function. Secondly, the 3D reduction method of the tool flank is optimized using the image processing algorithm, and a technique of measuring the geometric parameters of the tool flank based on vector arithmetic is proposed. To obtain high-contrast sequence images of the tool surface appropriate for calculation, an image enhancement algorithm based on the adaptive sigmoid function is used. Next, the processed sequence images of the 3D point cloud of the tool flank are produced by using the improved focusing function. Additionally, the cutting tool end face parameters defined by the space measurement plane are described and calculated using the vector angle formula and geometric relationship. Besides, it is necessary to carry out plane fitting on the 3D point cloud of the flank based on the RANSAC (Random Sample Consensus) algorithm. Finally, premised on the previous measurement method, a 3D measurement system is built. Utilizing a ladder formed from standard gauge blocks, the system's depth reduction accuracy is confirmed. Conjointly, a comparative experiment is conducted to measure the geometric parameters of the complex tool end face using a variety of measuring systems and techniques.Results and DiscussionsThroughout every experiment that was done, to test the effectiveness of the improved focus evaluation function, different tool surface sequence images are collected, and focus evaluation function curves related to pixels and the whole image are computed by various focus evaluation functions. The results show that the improved focusing function curve is steeper than other function curves intuitively (Fig.4). The sharpness ratio, steepness, sharpness change rate, and local fluctuation are employed to provide a more objective assessment. It also indicates that other functions pale in comparison to the improved focus evaluation function. The average value is 2 082.9%, 5.4%, 6.7%, and 25.7% better than the Tenengrad function, respectively, according to the index order (Tab.1). Furthermore, it is proved that the depth reduction error of the built system is 0.32% (Fig.8). Eventually, the system and measurement method's data for parameter evaluation reveal that the diameter measurement error is less than 3 μm and the apex angle measurement error is less than 0.3° (Tab.3). It is superior to the Tenengrad function's measurements of the angle (less than 1.9°) and diameter (less than 13 μm). In conclusion, the 3D measurement method based on depth from focus can precisely quantify the geometrical characteristics of cutting tools.ConclusionsIn this study, an improved double-threshold Tenengrad focusing evaluation function is proposed, which is more suitable for the depth calculation of tool surface sequence images. And the sigmoid function-based image enhancement algorithm is performed to enhance the contrast of sequence images, effectively improving the efficiency and accuracy of the calculation of depth. Further, a prototype of three-dimensional measurement of tool geometric parameters is constructed, and high-quality 3D morphology reconstruction of the tool surface morphology is obtained. Besides, a method for measuring tool geometric parameters based on vector calculation is proposed, and the apex angle and diameter of the tool's inner and outer edges of the main cutting edge are measured. The measured results are within the tolerances of a length measurement error of no more than 10 m and an angle measurement error of no more than 0.5°.
Apr. 25, 2023Vol. 52 Issue 4 20220686 (2023)
Weichao Wang, Shiqi Gan, Shuang Liu, Haoyuan Zhang, and Peijian Wu
ObjectiveThe static angle measurement error for an optical electronic theodolite is generally measured by the star calibration method in the shooting range. Affected by the change of atmospheric refractive index, the empirical formula of atmospheric refraction error is usually used to correct the angle measurement data in the pitching direction of stars. However, the difference between the atmospheric composition in various areas and over time leads to a significant error in the empirical formula. This error results in a significant error in the pitch angle measurement results obtained by the star calibration procedure and affects the separation of other error factors. Therefore, the correction of atmospheric refraction error, which is obtained by the empirical formula, is very important to calculate the total error in measuring the pitch angle of an optical electronic theodolite. To precisely correct atmospheric refraction error, it is usually necessary to use sounding balloons or meteorological aircraft to collect atmospheric parameters at different altitudes. But this traditional method is complicated to organize and difficult to implement. For this purpose, a new method for correcting the empirical formula of atmospheric refraction error is proposed in this paper.MethodsA method for correcting the empirical formula of atmospheric refraction error is built in this paper. The method is based on the correlation analysis of star measuring data from multiple theodolites. According to the residual error model for measuring the azimuth and pitch angle of the theodolite, the atmospheric refraction error correction model is derived. Based on this error model, using the residual data of the pitch angle from multiple photoelectric theodolites distributed at different points in the same area, the coefficient for correcting atmospheric refraction error is obtained by fitting the pitch angle measurement residuals and the tangent of the pitch angle with the least square method, and the residual pitch angle data are corrected with the atmospheric refraction error correction model.Results and DiscussionsAnalysis results based on the data of six phototheodolites distributed in the same area show that there were obvious components of the pitch angle measurement residuals that varied linearly with the tangent of the pitch angle (Fig.1). According to the atmospheric refraction error correction model, the pitch angle measurement residuals of the six phototheodolites were linearly fitted to obtain six correction coefficients (Tab.1), and the average value was taken as the comprehensive correction coefficient. After using the comprehensive correction coefficient to correct the atmospheric refraction error, the correlation between the pitch angle residuals and the tangent of pitch angle was significantly decreased (Fig.2), and the total static angle measurement error of the pitch angle of the six devices was significantly reduced (Tab.1). Moreover, before the atmospheric refraction error correction, the peak values of the normalized correlation curves (Fig.6) of the azimuth and pitch angle measurement residuals of each phototheodolites were generally under 0.7 (Tab.2). After the correction of atmospheric refraction error, the peak values of the normalized correlation curves of the azimuth and pitch angle measurement residuals were greater than 0.7, indicating that the correlation of azimuth and pitch angle measurement residuals is enhanced, and this correlation is mainly caused by the correction error of vertical axis tilt angle.ConclusionsA method for the correction of atmospheric refraction error based on the correlation analysis of star measurement residual data is proposed. The atmospheric refraction error correction model is derived based on the residual error model for measuring the azimuth and pitch angle of the theodolite. With the residual data of the pitch angle obtained from multiple photoelectric theodolites distributed at different points in the same area, the coefficient for correcting atmospheric refraction error is obtained by the least square method and the residual pitch angle data are corrected. As a result, the total error in measuring the pitch angle of an optical electronic theodolite is significantly reduced after correction of the atmospheric refraction error, and the features of the azimuth and pitch angle residuals caused by the error in correcting the vertical axis tilt error are revealed. The proposed method makes it possible to correct residual pitch angle data of multiple optical electronic theodolites distributed in the same area without using sounding balloons to obtain atmospheric parameters, and the corrected data can be used to separate other error factors, which is of high engineering application value.
Apr. 25, 2023Vol. 52 Issue 4 20220732 (2023)
Liqing Yue, Dongjie Wang, Yue Xiao, Wenjin Wu, Qing Sui, and Yang Chen
As an important internal parameter of the camera, the measurement accuracy of distortion directly affects the image processing accuracy and the geometric positioning accuracy of the camera on orbit. The traditional high-precision laboratory calibration method relying on three-axis turntable has strict requirements for test equipment and test environment. With the increase of camera focus, aperture and volume, this method has increasingly high requirements for equipment and site. The idea of achieving high-precision geometric distortion calibration simply by improving the volume and accuracy of equipment is not applicable. On the basis of the traditional precision angle measurement method, this paper proposes a geometric distortion calibration technology of large aperture and long focal length optical system based on the interference principle. Compared with the traditional precision angle measurement method, this method does not require a high-precision experimental turntable, has good robustness and high accuracy. This paper introduces the basic principle, test method and error link of the distortion test method. The test results of this method are compared with the traditional distortion test method, which shows that the test accuracy of this method meets the requirements of remote sensing camera development and has a wider application range. It can be used for reference for the distortion test of aerospace long focal length and large aperture remote sensing camera.ObjectiveAs an important internal parameter of the camera, the measurement accuracy of distortion directly affects the image processing accuracy and the geometric positioning accuracy of the camera on orbit. At present, the distortion test methods for optical cameras are generally divided into three categories, the high-resolution spaceflight remote sensing camera is more suitable for the test method based on the precision angle measurement theory. However, the precision angle measurement method has strict requirements for the test equipment and the test environment. With the increase of the focal length, aperture and volume of the spatial high-resolution optical system, higher requirements are also put forward for the size and test accuracy of the turntable. It is difficult to realize in engineering and cannot meet the development requirements of various types of space high-resolution remote sensing cameras. Meanwhile, for the space high-resolution optical systems with ultra-large aperture and ultra-long focal length, in order to reduce the influence of gravity in the process of alignment, the vertical method is usually used for alignment. The visual axis of the lens is always perpendicular to the earth in this case, and it is impossible to use the traditional precision angle measurement method to calibrate the distortion of the optical lens in the laboratory. In order to solve this problem, a geometric distortion calibration technology of large aperture and long focal length optical system based on the interference principle is proposed.MethodsThe whole test system includes laser tracker, special target ball, 4D interferometer, a measured lens, high-precision angle measuring system and plane reflector (Fig.2, Fig.5). In the measurement space coordinate system, the target ball of the laser tracker is placed at the image point (Fig.3). When the center of the target ball coincides with the focus position of the interferometer, the interference self-collimation fringe can be formed (Fig.4). When the target ball is precisely positioned at the image point, the laser tracker can be used to test the image point coordinates to obtain the image height data. The field angle corresponding to the image height of the lens can be obtained by using the high-precision angle measurement system (Fig.6), and the lens distortion value can be calculated by the image height and its corresponding field angle.Results and DiscussionsComparative experiments were carried out on optical lens with a focal length of 2 000 mm and a field angle of 2.8° using the traditional angle measurement method and the distortion measurement method based on the interference principle. The calibration results show that the results of the two test methods are highly consistent, and the maximum relative distortion of the two methods are 1.48% and 1.49% (Tab.1). This shows that the method based on interference principle can meet the development requirements of remote sensing camera. A long focal length and large aperture optical lens is tested with the new method. During the test, a total of 21 test points were taken from the full field of view, and three effective tests were conducted (Tab.1). The root-mean-square distortion of the three tests is less than 3 microns, and the maximum relative distortion value is 1.43%. The maximum relative distortion design value of the lens linear array direction is 1.5% (Fig.7), and the test results are in good agreement with the theoretical design value.ConclusionsBased on the traditional angle measurement method, a distortion measurement method for aerospace large aperture and long focal length optical system is proposed. This method can meet the distortion test requirements of various types of optical systems. It is used to calibrate the distortion of the traditional optical lens and the large-aperture high-resolution optical lens with vertical adjustment in the laboratory. The results are consistent with the design values, which provides a reference for the development and test of space high-resolution optical remote sensor.
Apr. 25, 2023Vol. 52 Issue 4 20220862 (2023)
© Copyright 2018-2021 | Chinese Laser Press.
All Rights Reserved 沪ICP备15018463号-20