


 View fulltext

2023
Volume: 52 Issue 11
32 Article(s)

Ying Chen, Dengfeng Ren, and Yuge Han
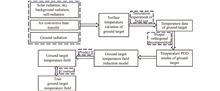
ObjectiveWith the development of infrared guidance technology, the ground targets with obvious infrared characteristics are increasingly threatened on the battlefield. In order to improve the survivability of ground targets on the battlefield, it is necessary to master the infrared radiation characteristics of ground targets. The traditional methods for studying the infrared radiation characteristics of ground targets include theoretical modeling analysis method and field testing method. The theoretical modeling analysis method is faced with such problems as a huge amount of calculation, high cost of field testing, obtained limited data, and being unable to obtain the overall infrared radiation characteristics of ground targets at any time. For the ground target, if the thermocouple is arranged on the typical part of the surface of the ground target and the relationship between the typical part and the overall temperature distribution is established, the rapid prediction of the temperature field of the ground target can be achieved. Therefore, how to arrange thermocouple on the surface of ground target and establish the relationship between the data of finite measuring points and the whole temperature field of ground target has become an urgent problem to be solved. Therefore, proper orthogonal decomposition (POD) method is introduced to extract the characteristics of the ground target temperature field, and a reduced order model of the temperature field is established. On this basis, combined with QR (orthogonal right triangular) decomposition algorithm, the rapid prediction of the temperature field of the ground target is realized by using the data of finite measuring points.MethodsPOD method is introduced into temperature field characteristics analysis of ground targets, and the specific implementation process is shown (Fig.1). Taking square cavity and model tank as the research objects, POD method was used to extract the temperature field characteristics of ground targets, and two kinds of ground target temperature field reduction models were established to predict the temperature distribution of ground targets at multiple moments and compare it with the real temperature field at the same moment (Fig.7, Fig.15). Based on the reduced order model of temperature field combined with QR decomposition algorithm, the position of the best sensor was determined, and the temperature field was predicted by using the measured data of the best sensor, and compared with the real temperature field (Fig.9-10, Fig.16-17). Finally, the reliability of the method is verified by error calculation and analysis.Results and DiscussionsPOD method can extract the main characteristics of the ground target temperature field well. On this basis, the reduced order model is established, and the predicted temperature distribution is basically consistent with the real ground target temperature distribution. After combining POD and QR algorithm, the best sensor measurement data obtained by QR decomposition algorithm is used to predict the temperature field of two ground targets. The predicted temperature distribution trend of the two ground targets is basically the same as the real temperature distribution trend. Based on the POD temperature field reduction model, the calculation time is further reduced and the calculation efficiency is improved. The average absolute error of the temperature field of the square cavity with heat source is less than 1.5 K. The average absolute error of the temperature field of the model tank target is less than 2.5 K. This indicates the accuracy of the method.ConclusionsIt can be seen that POD can better extract the characteristics of the temperature field of the ground target, so as to establish the reduced order model of the temperature field of the ground target. After combining with the QR algorithm, the temperature field can be quickly and accurately predicted through the calculated best sensor measurement data, greatly reducing the calculation time. If conditions permit, the number of training sets and sensors can be increased to improve the accuracy, which provides a new method and idea for the rapid prediction of transient temperature field of ground targets by using finite measuring point data.
Nov. 25, 2023Vol. 52 Issue 11 20230103 (2023)
Hanfu Zhang, Jie Liu, Qichang An, and Jianli Wang
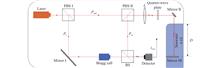
ObjectiveOwing to the large loss of the laser during the transmission process, the echo signal light is weak when the target is faint; Therefore, the requirements for the single pulse energy of the laser and the aperture of the telescope are extremely high. Photon counting detection has the advantage of high sensitivity, and can detect weak echo signals. By combining the two technologies of single-photon detection and time-correlated single-photon counting (TCSPC), laser energy consumption and telescope aperture size can be significantly reduced when detecting faint targets. Photon counting ranging lidar has great application potential in faint target detection and laser remote sensing, etc. Although detection method using solid-state dense beam splitting laser illumination can effectively improve detection timeliness compared to point-by-point scanning methods and ensure high detection spatial resolution, laser energy loss is significant. In order to ensure the efficient detection of targets and reduce the consumption of laser energy caused by dense beam splitting, a detection method combining rotary scanning and push scanning was proposed. In order to better understand the influencing factors of photon counting ranging, the relationship between the above two and photon counts was explored.MethodsA single-photon ranging system was built. After illuminating the target by laser beam splitting method, which divides the laser into three beams using optical fibers, a single-photon array detector is used to collect signal photons from different target points in parallel (Fig.2). After data collection is completed, the optical fiber bracket is rotated 30° to simulate rotational scanning, and signal-photon counting is collected again. After rotation, an electric displacement table is used to move the fiber optic bracket to simulate scanning, and signal-photon counting data is collected. This process is repeated to collect a total of 18 target point data. 50 sets of data are collected repetitively at each target point, using the standard deviation of the measured distances as the ranging accuracy of the LiDAR system; The root mean square error (RMSE) between the measured distances and the true distance is used as the ranging accuracy. Taking the laser echo photon data collected by a single pixel of an array detector as an example, the relationship between ranging accuracy and photon counting is explored. After illuminating the target, a single-photon detector is used to collect signal-photon data, changing the acquisition time of the detector to change the number of detection photons. Under each detection photon condition, 30 sets of data are repeatedly collected, and then the ranging accuracy and precision under different photon counting conditions are calculated. To further investigate the impact of target position on ranging accuracy and accuracy, after each acquisition, the target is moved back 3 cm to change the target position, and then the detector acquisition time is changed to change the number of detected photons. Under the conditions of each target position and photon count, 30 sets of photon data are repeatedly collected, and the ranging accuracy at different positions are calculated under different photon counts. Based on the measured distance values of 18 target points, the three-dimensional features of the target are restored using interpolation method. And the 3D image of the target recovered from rotating scanning detection is compared with the 3D image recovered from without rotating scanning to demonstrate the feasibility of using rotating scanning for high spatial resolution detection.Results and DiscussionsThe ranging precision and accuracy at the pixels corresponding to the target points are calculated for the system built in the experiment. Ranging precision and accuracy decrease with the increase of the number of photons and gradually tend towards a constant (Fig.3). Their relationship with photon counts is independent of the target position (Fig.4). The depth information measured after rotary scanning increased by 33% compared to the depth information measured without rotary scanning (Fig.6). It can be concluded that the method with rotating scanning can effectively improve the spatial resolution of the detected target. Meanwhile, compared to the method without rotating scanning, the detection method based on rotating scanning reduces the laser energy loss under the condition that the total number and distribution of detected target points are the same.ConclusionsA new high-efficiency photon counting ranging lidar is proposed, which plays a certain role in promoting the high spatial resolution detection of target depth features. The laser beam is splitted to detect multiple target points, and push scanning is used to expand the detection area; During the push scanning process, the laser beam group is quickly rotated to measure the distance of more dense scanning points within the same time. While improving the timeliness of detection, it also improves the spatial resolution of detection, making the depth characteristics of the target more obvious in space. Meanwhile, compared to pure solid-state laser beam splitting illumination methods, the total laser energy consumption is reduced. And the distance information of the target increased compared to the distances obtained without rotary scanning. The ranging accuracy and accuracy of the system were measured, and the ranging accuracy was better than 1.48 cm and the accuracy was better than 2.78 cm. And both values are negatively correlated with the number of photons until they tend to remain unchanged, which is independent of the target position. The proposed method has advantages such as high timeliness, low total energy, and high detection spatial resolution, and has application potential in distance detection of targets with spatial two-dimensional features.
Nov. 25, 2023Vol. 52 Issue 11 20230112 (2023)
Yaqing Zhu, Rongyi Ji, Dengfeng Dong, and Weihu Zhou
ObjectiveThe ranging accuracy is one of the important indicators that characterize the performance of phase-based laser ranging systems. The improvement of ranging accuracy is mainly achieved by improving modulation frequency and phase discrimination accuracy. If the modulation frequency is too high, meeting the high sampling frequency required for Nyquist sampling will result in high requirements for ADC hardware and increase system design costs. The traditional differential frequency phase detection method has complex circuit design, which can easily lead to the loss of signal frequency, phase and other information during the mixing process. Due to direct sampling of high-frequency signals, undersampling technology can maximize the retention of the original phase information of the signal, with simple circuit design and low hardware costs. In digital phase detection, spectrum leakage is a prominent drawback of traditional spectrum analysis, and the degree of spectrum leakage directly affects the accuracy of phase detection. All-phase FFT (apFFT) has "phase invariance", which can effectively suppress spectrum leakage and improve phase detection accuracy. In the actual measurement process, it is unavoidable to produce Gaussian white noise that affects the stability of the measurement results. Kalman filtering algorithm is a recursive time-domain filtering algorithm that meets the minimum mean square error estimation, and can effectively remove the Gaussian white noise generated in the measurement process. In order to improve the ranging accuracy, this paper proposes an undersampling all-phase FFT phase detection method based on Kalman filtering.MethodsThis paper first introduces the principle of phase laser ranging (Fig.1) and the principle of undersampling apFFT phase detection based on Kalman filter (Fig.3), and analyzes the phase detection performance under different sampling frequencies and signal frequencies (Fig.5) through simulation, as well as the phase detection performance under the influence of Gaussian white noise, frequency shift, stray frequency, harmonics and other factors (Fig.6). On the basis of simulation analysis, an undersampling phase detection circuit (Fig.9) was developed based on the FPGA chip of XC7K325T-1FFG676C model and the AD9250-170 chip. Phase detection performance verification experiments and laser ranging verification experiments were conducted, respectively (Fig.12).Results and DiscussionsThe simulation results show that undersampling does not affect the phase detection accuracy (Fig.4). The ability of noise resistance and overcoming frequency offset of the undersampling apFFT method are significantly better than those of the undersampling FFT method (Fig.7). The phase detection accuracy of the undersampling apFFT method is ± 0.012°, and the phase detection accuracy of the undersampling apFFT method is better than that of the FFT method (Fig.8). The experimental results of phase discrimination performance show that the undersampling apFFT method has better noise resistance and anti-interference ability than the FFT method (Fig.10), and the phase discrimination accuracy of the undersampling apFFT method is better than 0.04° (Fig.11). The experimental data of the laser ranging system shows that the phase discrimination accuracy of apFFT is 0.134° without Kalman filtering, and 0.023° after filtering. The phase discrimination accuracy has been improved by 82.84% (Tab.1), and Kalman filtering can significantly improve the phase discrimination stability of apFFT (Fig.13). When the modulation frequency is 201 MHz, the ranging accuracy can reach 0.20 mm, achieving submillimeter precision ranging.ConclusionsIn order to improve the ranging accuracy, a phase detection circuit was designed using undersampling method and all-phase FFT algorithm, and Kalman filtering was used to improve the stability of the measurement data. According to the principle of phase detection, the phase detection accuracy under different sampling frequencies and signal frequencies is simulated and analyzed, and the phase detection performance of FFT phase detection method based on undersampling and apFFT phase detection method under the influence of Gaussian white noise, frequency offset and other factors is compared. The simulation results show that undersampling does not affect the phase detection accuracy, and the phase detection accuracy of the undersampling apFFT method is better than that of the undersampling FFT method. Experimental verification of phase discrimination performance was conducted, and the experimental data showed that when the sampling frequency was 100 MHz and the signal modulation frequency was 201 MHz, the phase discrimination accuracy of apFFT was 0.134°. After Kalman filtering, the phase discrimination accuracy was better than 0.023°, and the ranging accuracy could reach 0.20 mm. Therefore, the undersampling apFFT phase detection method based on Kalman filtering has the advantages of high accuracy and strong anti-interference ability, and has important application value in phase laser ranging systems.
Nov. 25, 2023Vol. 52 Issue 11 20230119 (2023)
Shiwen Zhang, Liyan Li, Yan Zhou, Qin Liu, Yongjie Wang, and Yuliang Liu
ObjectiveWhen it comes to the research of ocean density and ocean salinity, refractive index measurement has become a research hotspot in recent years as it has better correlation and stability than traditional conductivity measurement methods in those fields. A variety of seawater refractive index measurement techniques have been developed and have shown great scientific value in recent years. However, those refractive index sensors proposed so far generally have measurement accuracies in the order of $ {10}^{-6}\;\mathrm{R}\mathrm{I}\mathrm{U} $ and are typically used in static seawater sampling scenarios, which makes the sampling frequencies of those sensors are around 1 Hz. Studies have shown that the refractive index of seawater varies by $ 4\times {10}^{-8}\;\mathrm{R}\mathrm{I}\mathrm{U} $ per 100 km due to ocean currents, whereas the refractive index variation in the vessel-caused flow field is not only very small, but also has a very short period of variation, requiring a sampling rate of at least 100 Hz for fine structure analysis. For seawater climate studies and dynamical seawater flow field monitoring, current refractive index sensors cannot meet the requirements, and measuring techniques with high accuracy and high sampling frequency are needed to fill the gap in this part. MethodsA seawater refractive index measurement system based on optical heterodyne interference principle is proposed. The optical structure is shown (Fig.1) and the corresponding demodulation algorithm is introduced (Fig.2). Through analysis, it is illustrated which parameters of the device designed in the proposed structure are related to the shot noise. The effect of white noise on the measurement results is investigated through simulation experiments, which verifies the correctness of the above analysis and gives an empirical formula for the standard deviation of the measurements under the influence of white noise. What's more, the magnitude of the error introduced in the data demodulation process is given according to the performances of the electronic components used in the demodulation system. Based on the above optical path structure and demodulation algorithm, an optical heterodyne interference seawater refractive index sensor prototype was developed, using a laser with 633 nm light, an acousto-optical modulator with 40 MHz frequency shift. The sampling frequency of the sensor is 24 kHz and the measurement interval is 100 mm. The sensor is waterproof and pressurized (Fig.5). A verification experiment was carried out on the proposed device, in which the refractive index of the measured liquid was varied by changing the temperature, and a commercial refractometer was used as a contract, the experimental data is shown (Fig.7). In addition, the repeatability experiment was carried out on the device, and the actual data were given to verify the sensor's standard deviation performance of the refractive index measurement (Tab.1).Results and DiscussionsThe experimental results show that the proposed device can measure the refractive index variation of liquid and the measurement results are in good agreement with both theoretical calculations and existing commercial refractometers. Besides, the device has a refractive index measurement standard deviation of $1.584\;8\times {10}^{-8}\;\mathrm{R}\mathrm{I}\mathrm{U}$, which is among the world's leading high-accuracy seawater refractive index sensors. The results of this measurement standard deviation can also correspond to the error analysis in the previous section. ConclusionsThis technique promoted the application of seawater refractive index measurement in the sea climate monitoring and ocean flow field measurement, making high-accuracy and high-frequency seawater refractive index measurement possible. Furthermore, through noise analysis and experimental validation, it is concluded that demodulation noise is currently the bottleneck limiting further improvement in accuracy. Denoising algorithm and improving performances of electronic devices can be future research targets.
Nov. 25, 2023Vol. 52 Issue 11 20230134 (2023)
Yunzhe Liu, Yan Dong, Wei Wang, and Jianlin Song
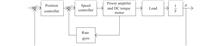
ObjectiveThe photoelectric tracking system is affected by frictional torque during operation, resulting in jitter and climbing during the tracking process, which seriously affects the tracking accuracy. For the accurate compensation of frictional torque, this paper proposes a method of least squares method combined with particle swarm optimization algorithm for parameter identification with reference to Stribeck friction model, and uses the disturbance separation active disturbance rejection control (DSADRC) algorithm to compensate the identified friction model.MethodsFirst, the turntable system is modeled to analyze the disturbance of friction on the system. According to the characteristics of Stribeck friction model, the corresponding data were measured by constant speed-torque experiment, and the minimum squares method and particle swarm algorithm were used to identify the moment data, and the Stribeck model was established and added to the system. Then the identified friction model is compensated by using DSADRC. Last, the compensator is designed based on DSADRC. Experimental results show that the average error between the friction model identified by the combination of least squares method and particle swarm algorithm and the measured data is 3.4%. Then PID control, active disturbance rejection control and disturbance separation active disturbance rejection control algorithms are used to control and compensate the friction torque. The results show that the maximum speed error of the disturbance separation active disturbance rejection control is 77.72% and 58.78% (Fig.8, Tab.4) lower than that of the PID control and the active disturbance rejection control respectively. The friction torque suppression of the disturbance separation active disturbance rejection control improves the PID control and the classical ADRC by 73.59% and 60.59% (Fig.9, Tab.5) respectively. The steady state error of the tracking system is reduced, and the tracking performance of the system is improved.Results and DiscussionsBy comparing the results of parameter identification of Stribeck model (Tab.3) with experimental results by using the least squares method and particle swarm algorithm, the average error between the identified friction model and the measured data is 3.4% (Fig.7). And then PID control, active disturbance rejection control and disturbance separation active disturbance rejection control algorithms are used to control and compensate the friction torque. The results show that the single-side maximum speed error of the disturbance separation active disturbance rejection control is 77.72% and 58.78% (Fig.8, Tab.4) lower than that of the PID control and the active disturbance rejection control respectively. The friction torque suppression of the disturbance separation active disturbance rejection control improves the PID control and the ADRC by 73.59% and 60.59% (Fig.9, Tab.5) respectively.ConclusionsThe parameters of the linear and nonlinear parts of the Stribeck friction model were identified by combining the least squares method and particle swarm algorithm, and the average error between the identification results and the experimental data was 3.4%, which could better reflect the friction model. The friction model is compensated by using disturbance separation ADRC and compared with PID control and ADRC control. The comparison results show that the single-side maximum speed error of the disturbance separation ADRC is 77.72% and 58.78% lower than that of PID control and ADRC control. Compared with PID control and ADRC control on friction torque suppression, the proposed method increases by 73.59% and 60.59% respectively. Through experimental results, it is proved that the disturbance separation self-rejection can not only make full use of the basis of the known information of the system, reduce the waste of information caused by the design, save time, but also reduce the steady-state error of the system, improve the tracking performance of the system, and have certain application value in engineering.
Nov. 25, 2023Vol. 52 Issue 11 20230151 (2023)
Yufei Wang, Jiaxing Zheng, Dongkai Dai, and Wenfeng Tan
ObjectiveThe most often used technique to lessen the lock-in effect of a ring laser gyroscope (RLG) is mechanical dithering. However, the RLG output will maintain the dither rate which must be demodulated to obtain the true body rate. The integer period sampling method, high-frequency sampling filtering method, and dither stripping method are commonly used in RLG demodulation. For high dynamic tracking applications, since the sampling frequency is low, the integer period sampling method cannot meet the requirement of high bandwidth. Thus, the high-frequency sampling filtering method is applied. Due to the characteristic of a finite impulse response (FIR) filter, the high-frequency sampling filtering method inevitably introduces a time delay, which will result in significant tracking errors. Based on the correlation of signals, the dither stripping method can remove the dither signal in real-time through the correlation cancellation algorithm. In order to solve the problem that the time delay affects the accuracy of tracking in a highly dynamic environment, this paper proposes a demodulation scheme that combines FIR filtering with dither stripping. The dither stripping method is employed in the delay period of the FIR filtering so that the RLG demodulation can be zero-latency.MethodsAiming at the case that the RLG fitted on a radar antenna concurrently rotates, a non-delay measurement method based on the combination of FIR low-pass filtering and dither stripping is creatively proposed. To avoid the accumulation of stripping errors of angular increment during the time delay period, the dither stripping is directly carried out in the angle output of RLG. The angle output of RLG after bandpass filtering is taken as the dither feedback signal and the low-frequency angular acceleration is regarded as a random walk process. Based on the correlation between the dithering feedback signal and the dithering bias signal, the gain factor of dither stripping is dynamically tracked through Kalman filtering, and the amount of dither before and after delay is calculated in real-time.Results and DiscussionsThe RLG experiment is conducted to verify the effectiveness of the proposed non-delay measurement method. The test results reveal that the dither stripping gain factor can be tracked through the Kalman filtering in real-time (Fig.3), and the dither stripping error varies within one pulse. The method can eliminate the dither component in a FIR filter delay period of 10 ms, where cumulative angle increment error is less than two pulses (Fig.4) and stripping in the angle output can effectively limit the accumulation errors (Fig.5). Compared to the 80-order FIR filter, the dither stripping accuracy has a negligible residual error of about one pulse, corresponding to 0.466′′, which achieves accurate demodulation without latency.ConclusionsIn order to achieve high accuracy of RLG demodulation in a highly dynamic environment, a non-delay measurement method is proposed in this paper. The combination of FIR filtering and dither stripping gives consideration to the characteristics of high-bandwidth and real-time performance, which eliminates the negative effect of time delay introduced by FIR filtering. The experiment results indicate that the accuracy of the proposed dither stripping method is better than 0.5″ during the delay period of 10 ms, which achieves zero-latency measurement. This paper provides a new demodulation scheme for RLGs applied in fast-tracking scenarios.
Nov. 25, 2023Vol. 52 Issue 11 20230171 (2023)

Wanxiang Gou, Shuai Tong, Jingyu Jia, Zixuan Qin, Jifu Sun, and Chonghui Li
ObjectiveFor all-time star sensors, traditional wide optical response bandwidth design can easily cause imaging chromatic aberration, which is not conducive to star detection and extraction; Some bands have low atmospheric transmittance, and excessively wide response bandwidth can easily reduce the signal-to-noise ratio of star detection. With the rapid development of infrared sensor technology, these issues have gradually become important bottlenecks that limit the further improvement of the accuracy of all-time star sensors. Due to the significant spectral correlation between atmospheric background radiation and transmittance, there are significant differences in the number of observable stars in different bands, resulting in significant differences in the actual star measurement capabilities of all-time star sensors using different optical sensitive bands. Therefore, according to the characteristics of the near-infrared band atmospheric window, it is of great significance to select an appropriate optical response band to improve the star detection capability of the all-time star sensor.MethodsBased on the definition of 0 magnitude star radiation flux in different optical response bands, and taking into account factors such as atmospheric background radiation and transmittance in different bands, the signal-to-noise ratio relationship of 0 magnitude star corresponding to different optical response bands under the same hardware conditions is derived (Tab.5); Using Modtran software to simulate and calculate atmospheric parameters in relevant bands, and combining with the statistical number of stars in different bands, the quantitative analysis adopts the relationship between the number of star detections in different optical response bands (Fig.3, Tab.7). A daytime star observation platform is built and the model of the relationship between the number of star detections is verified by taking pictures of Polaris and Sadr. On this basis, based on the distribution of stars in different bands of the same magnitude (Fig.5), combined with the attitude determination conditions of the star sensor, Monte Carlo simulation was used to calculate the actual success rate of the star sensor's attitude determination using different optical response bands.Results and DiscussionsUnder the same hardware conditions, the star detection ability of the all-time star sensor using the H-band as the optical response band is about 17 times, 10 times, and 2 times that of the R, I, and J bands (Fig.4). The correctness of this conclusion was verified through actual observations of one or two stars in North Star and Sadr (Fig.9). The field of view of the star sensor is taken as 5°×5°, when the signal-to-noise ratio of the star sensor to R-band 0 magnitude stars reaches 100. Using the H-band can achieve the detection of more than 3 stars in a field of view of 99.23%, while under the same conditions, the R-band, I-band, and J-band are only 6.09%, 48.30%, and 77.28%, respectively (Tab.8). ConclusionsIn order to reduce the chromatic aberration of the all-time star sensor imaging and improve the daytime star measurement signal-to-noise ratio of the all-time star sensor, a comparative analysis was conducted on the star measurement capabilities of the all-time star sensor in various optical response bands. Through comparative analysis, it is found that the use of different optical response bands has a significant impact on the actual star measurement ability of all-time star sensors; Under the same hardware conditions, the all-time star sensor has the most outstanding ability to detect stars in the H-band, with a detection number of stars about 17 times, 10 times, and 2 times that of the R, I, and J bands. The success rate of attitude determination also has a significant advantage. A daytime star observation platform was built, and the actual star measurement capabilities using different optical band platforms were experimentally calculated. The experimental results showed that the H-band all-time star sensor has significantly stronger star measurement capabilities than other optical bands, making it the optimal optical response band for all-time star sensors.
Nov. 25, 2023Vol. 52 Issue 11 20230221 (2023)
Chunsheng Sun, and Yilun Wu
ObjectiveThe airborne electro-optical pods require high accuracy in viewing angle orientation when performing tasks such as autonomous target localization and simulating counter targets. Medium and large military airborne electro-optical pods often use high-performance measurement units, such as integrated sub-inertial guidance systems, to avoid the effects of errors caused by vibration to improve guidance accuracy. However, due to the limitation of size, weight, and power of the small and micro-unmanned airborne optoelectronic pods, their related measurement modules for viewing angle orientation are degraded in performance, and the viewing angle orientation accuracy is bound to decrease. In addition, the cost-effectiveness ratio is also an essential factor of modern unmanned combat. Therefore, how to select cost-effective components while ensuring overall accuracy is the primary problem when conducting the overall design of small and micro-unmanned airborne electro-optical pods. For this reason, an improved sparrow algorithm based on the simplex strategy is proposed in this paper to study the error distribution problem of small and micro-unmanned airborne electro-optical pod viewing angle from the perspective of multi-objective optimization, which provides a basis for engineering design and equipment selection.MethodsFirstly, the coordinate system is established according to the characteristics of the small and micro UAV photoelectric pod, and the viewing angle measurement model is derived by using the spatial homogeneous coordinate transformation method; Then the principal sources of errors are analyzed, the viewing angle error model is established, and error analysis is performed based on Monte Carlo simulation method; Finally, based on the viewing angle error model, the improved sparrow algorithm based on the simplex strategy proposed in this paper is used for error distribution, and compared with the average distribution method, the weighted distribution method, and the error distribution methods based on genetic algorithm and particle swarm algorithm.Results and DiscussionsThe improved sparrow algorithm based on simplex strategy proposed in this paper has certain advantages in solving the error allocation problem with multiple error parameters and complex error transmission process. Compared with the sparrow algorithm, genetic algorithm, and particle swarm algorithm, the improved algorithm has faster convergence and better optimization effect, overcomes the problem that the sparrow algorithm falls into local extremes, and has good global search ability (Fig.11). Compared with the traditional error distribution method, the error distribution margin of the optimal distribution scheme obtained by the improved algorithm can reach the magnitude of $ 1{0}^{-8} $(Tab.5), which significantly improves the efficiency of the error distribution. ConclusionsIn this paper, Monte Carlo simulation method is used to analyze the error of the viewing angle of the electro-optical pod, and an improved sparrow algorithm based on the simplex strategy is proposed for error distribution. The simulation results of error analysis show that the carrier yaw angle error and vibration yaw angle error have the greatest impact on the total error of the viewing angle, and the error transfer efficiency is slightly more than 100%, while the carrier roll angle error and vibration roll angle error have the least impact on the total error of the viewing angle, and the error transfer efficiency is only about 34%; The simulation results of error distribution show that the error distribution margin of the improved sparrow algorithm can reach the magnitude of 10-8, which significantly improves the distribution efficiency compared with the traditional error distribution method, and verifies the effectiveness of the improved sparrow algorithm based on the simplex strategy to solve the error distribution problem of the viewing angle of the electro-optical pod. However, the error distribution method based on the optimization algorithm is a kind of data fitting. When guiding practical engineering applications, it will be more instructive if the optimization range can be set with the design focus to determine the optimal error allocation scheme and use this scheme to guide the selection of crucial devices, which is also the subsequent research direction of this paper.
Nov. 25, 2023Vol. 52 Issue 11 20230238 (2023)
Ke Li, Jiaping Liang, Yao Yao, Yang Zhang, Siguang Zong, and Tao Liu
ObjectiveDue to the strong attenuation of electromagnetic waves by seawater and the complex and variable characteristics of ocean acoustic channels, a single communication method can not meet the long-distance communication needs of aerial platforms for underwater targets. Optical-to-acoustic technology can convert laser signals in the atmosphere into underwater acoustic signals, combining two optimal channels to overcome the bottleneck problems, that is, large attenuation of single electromagnetic waves in water and strong divergence in the atmosphere. And this technology does not require sound waves to be transmitted remotely through underwater channels, resulting in minimal interference to the signal and extremely high transmission efficiency. However, different incident angles play an important role in the photoacoustic conversion efficiency and confidentiality of air-underwater transboundary communication. And vaporization mechanism is more feasible than other mechanisms. Therefore, it is necessary to use numerical calculation methods to study the three-dimensional scattering characteristics of laser on rough sea surfaces at different sea conditions and incidence angles, in order to improve the confidentiality of optical-to-acoustic transboundary communication in vaporization mechanism and accurately grasp the variation characteristics of laser transmission energy intensity with incidence angle.MethodsTo improve the accuracy of simulation results, mathematical model of three-dimensional laser scattering field on sea surface was established (Fig.1). To enhance the calculation efficiency, three-dimensional surface integral equation of laser on sea surface was solved with preconditioned conjugate gradient method. And the interface was divided into strong zone and weak zone according to the characteristics of incident light wave to enhance the computing efficiency (Fig.2). And different rough surface in different sea state are simulated (Fig.3). In order to obtain the three-dimensional energy distribution characteristics of the laser scattering field on a fluctuating water surface, we used the Monte Carlo method to statistically analyze the effects of different incident angles and sea conditions on the energy distribution of the scattering field. The number of Monte Carlo simulations was 5000 times. Finally, the simulation experimental system was established, and the simulation results were validated by indoor simulation experiment (Fig.8).Results and DiscussionsThe effect of different incident angles and different sea conditions on the energy distribution characteristics of scattering field and transmitting field are statistically analyzed (Fig.4-7). The simulation results show that the incident angle have important effect on the conversion efficiency and confidentiality of air-underwater transboundary communication. A simulation experimental system is built in the laboratory to test the conversion efficiency of optical-to-acoustic in vaporization mechanism at different incident angles and the experiment results are shown (Tab.1). The experiment results show that the optimal range of incidence angle is ${\theta ~~i} \in [0^\circ ,60^\circ ]$. The feasibility of transboundary communication with optical-to-acoustic in vaporization mechanism has been proven by the laser induced acoustic characteristic parameters at vertical incidence after convergence (Tab.2). ConclusionsIt is found that as the incident angle increases, the water surface spot area and transmittance will change so that spot power density and convergence efficiency decrease continuously through the analysis of three-dimensional numerical calculation results and indoor simulation test results. When the incident angle is greater than 60°, the sound source level and photoacoustic conversion efficiency measured in the experiment begin to decrease significantly. The spectrum analysis results of the acoustic pulse signal show that the energy peaks of the acoustic pulse appeared at 126 kHz, 36.8 kHz, and 4.647 kHz, with most of the energy concentrated around 200 kHz. The experiment results show that the optimal range of incidence angle is ${\theta ~~i} \in [0^\circ ,60^\circ ]$. When the power density of the light spot decreases, the vaporization phenomenon on the water surface also weakens. Which means the power density of the water surface spot area cannot reach the vaporization threshold so as to make the vaporization phenomenon and the thermal expansion phenomenon happen together. The experimental result shows that the photoacoustic conversion efficiency is almost 10-3 in the above case.
Nov. 25, 2023Vol. 52 Issue 11 20230100 (2023)
Lingjun Shen, and Yingxiong Song
ObjectiveSatellite-ground laser communication has the potential for high-bandwidth communication, but atmospheric turbulence can significantly affect the capabilities of communication systems. Outdoor experiments of satellite-ground communication systems are expensive and difficult to reproduce. Most of the existing numerical simulations are based on horizontal uniform paths, and are not suitable for turbulence paths of non-uniform satellite-ground links. In order to evaluate the impact of turbulence on communication systems, it is very important to develop numerical simulations suitable for satellite-ground links. In numerical simulation, simulating with too many phase screens will increase the complexity of the system. Therefore, it is necessary to develop a simple and reliable numerical simulation model for ground-satellite or satellite-ground turbulence path.MethodsThe phase screens under the Kolmogorov spectrum and the non-Kolmogorov spectrum are simulated by Fourier inversion method, and the subharmonic compensation method is used to compensate the phase screens. By calculating the constraints of the numerical simulation, a three-layer transmission simulation model is proposed. In order to verify the model, the laser transmission under the traditional Kolmogorov turbulence spectrum model with 2, 3, 6, 11 and 21 layers is simulated on the basis of the split-step method.Results and DiscussionsSimulations of phase screens under the Kolmogorov spectrum and the non-Kolmogorov spectrum show that the spectral index has a great influence on the phase screen simulation (Fig.4-5). Different spectral indices have different requirements for subharmonic compensation (Fig.6). The mutual coherence factor of the optical field on the observation surface is calculated, and compared with the theoretical value (Fig.7). The mean square error was used to measure the distortion between simulation and theory for different layers of phase screens (Tab.2). It is found that the three-layer model can ensure the accuracy of transmission and reduce the complexity of the system. The changes in the amplitude profile of Gaussian beam (Fig.11) and the changes in the coherence of the received beam under different turbulence spectrum models (Kolmogorov spectrum and non-Kolmogorov spectrum) (Fig.12) are analyzed, the simulation results show that under the same atmospheric conditions, the Gaussian beam in the non-Kolmogorov spectrum will produce obvious amplitude attenuation and beam spread, and the coherence of the optical field at the observation plane will decrease faster.ConclusionsIn this study, a simple and reliable numerical simulation model for ground-satellite turbulence path system is designed. In this model, the turbulent path is divided into three layers, and each layer is described by different spectral indices according to the characteristics of atmospheric turbulence. The mutual coherence factors were calculated and compared with the theoretical value under the traditional Kolmogorov spectrum with 2, 3, 6, 11 and 21 phase screens. The feasibility of the three-layer transmission model was verified, the proposed model can ensure the simulation accuracy and the efficiency of computer simulation. Based on the proposed three-layer transmission model, the transmission process of the traditional Kolmogorov spectrum and the non-Kolmogorov spectrum with the spectral index varying with the height are simulated, and the changes of the optical amplitude and the observation plane coherence are compared between the two. The results show that under the same atmospheric conditions, the Kolmogorov spectrum in the near-surface region is basically consistent with the results of the non-Kolmogorov spectrum, while with the increase of transmission distance, the Gaussian beam uplink will generate obvious amplitude attenuation and beam spread in the non-Kolmogorov spectrum. The coherence of the light field on the observation surface decrease faster at the same time. The proposed simulation model can be used to evaluate the optical transmission characteristics of the ground-satellite uplink under the influence of complex atmospheric turbulence with fewer phase screens and simulation time, which provides convenience for predicting the expected wavefront behavior at the aperture of the satellite optical receiver.
Nov. 25, 2023Vol. 52 Issue 11 20230125 (2023)
Lijuan Zhao, Lixing Yin, and Zhiniu Xu
ObjectiveBrillouin dynamic grating (BDG) based fiber optic sensing was first proposed in 2008. BDG can effectively separate the pump light, detection light and reflected light to improve the measurement accuracy and spatial resolution while achieving simultaneous sensing of temperature and strain, etc. Both ambient temperature and pressure changes can lead to changes in the birefringence coefficient of the fiber, which in turn can change the birefringence frequency shift of BDG. Therefore, temperature and pressure sensing can be achieved based on the birefringence frequency shift of BDG. The structure of the photonic crystal fiber has a large impact on the birefringence coefficientnd. And its mechanics, thermal, and optical properties can be optimized by designing the shape and arrangement of the air holes. The existing distributed transverse pressure sensors have problems such as low sensitivity and small temperature measurement range. Therefore, a new multilevel structure of photonic crystal fiber is designed in this paper.MethodsThe core area of the designed new multilevel structure photonic crystal fiber is surrounded by two types of elliptical air holes, and all air holes are stacked along the y-axis and symmetric about the x-axis (Fig.2). The geometric model of the photonic crystal fiber is constructed according to the fiber structure, and the fiber length is set to 1 m. Then, the two-dimensional model of the fiber is numerically analyzed by the finite element method, and the temperature study range is extended to -100-100 ℃ with the applied transverse pressure of 0-40 MPa. The birefringence frequency shift at different temperatures and pressures is calculated at low temperatures and high pressures to study its temperature and pressure sensing characteristics. To improve the reliability of the results, we added a perfect matching layer (PML) outside the fiber for simulating the boundary absorption conditions, and then used extra fine accuracy for meshing. Finally, the model is solved. Results and DiscussionsThe results show that in the temperature range of 0-100 ℃ and pressure range of 0-40 MPa, the pressure sensitivity in the x-axis direction of the photonic crystal fiber is about -1.004 GHz/MPa, and the pressure sensitivity in the y-axis direction of the photonic crystal fiber is about 1.021 GHz/MPa. The temperature sensitivity is about 0.554 3 MHz/℃ when the applied temperature ranges from -100 ℃ to 100 ℃ and applied pressure ranges from 0 MPa to 40 MPa, and it has temperature insensitive characteristics. For every 10° change in force application angle, the change in pressure sensitivity is greater than or equal to 75 MHz/MPa, which is sensitive to the force application angle. ConclusionsA new type of photonic crystal fiber with multilevel structure is proposed, which is made of pure silica, and the core area is surrounded by two types of elliptical air holes, all of which are stacked along the y-axis and symmetric about the x-axis. The two-dimensional model of the fiber is numerically analyzed using the finite element method to study its temperature and pressure sensing characteristics at low temperatures and high pressures. It is concluded that the pressure sensitivity in the x-axis direction of the photonic crystal fiber is about -1.004 GHz/MPa, and the pressure sensitivity in the y-axis direction of the photonic crystal fiber is about 1.021 GHz/MPa for pressures ranging from 0 MPa to 40 MPa and temperature ranging from 0 ℃ to 100 ℃. The temperature sensitivity is about 0.554 3 MHz/℃ when the applied temperature ranges from -100 ℃ to 100 ℃ and applied pressure ranges from 0 MPa to 40 MPa, and it has temperature insensitive characteristics. The new photonic crystal fiber proposed in this paper is suitable for high-sensitivity monitoring in high-temperature and high-pressure environments such as subsea and civil engineering.
Nov. 25, 2023Vol. 52 Issue 11 20230137 (2023)
Yali Sun, Jing Tian, Yumin Zhang, Jifeng Yao, Zheng Lv, and Lianqing Zhu
ObjectiveType Ⅰ fiber Bragg grating can work well below the temperature of 300 ℃. However, when the temperature further rises, the reflectivity of Type Ⅰ fiber Bragg grating will be reduced. If it operates in high temperature for a long time, the fiber Bragg grating will fail. There is a new type of grating called regenerated fiber Bragg grating attracting worldwide attention that promised to solve the problem. It is essentially formed from the initial Type Ⅰ "seed" grating, precipitating through thermal processing with a structure that is set by the laser written seed. Regenerated fiber Bragg grating is an important optical fiber sensor for high-temperature sensing. But the stability and repeatability of the regenerated fiber Bragg grating under high temperature is less commonly reported, especially for different environmental atmospheres. For this purpose, environmental atmospheres are introduced during the process of regeneration and testing in this paper.MethodAir and nitrogen environmental atmospheres are designed during the regeneration of two type Ⅰ seed gratings written by UV laser. The whole regeneration process is performed in a high-temperature furnace and recorded by optical spectrum analyzer and fiber Bragg grating interrogator (Fig.1). The temperature characteristic of the obtained regenerated fiber Bragg grating is tested by fiber Bragg grating interrogator under air and nitrogen environmental atmospheres (Fig.2). The regeneration results are shown in the form of evolution of central wavelength and transmission depth (Fig.5). The repeatability and stability of the regenerated fiber Bragg gratings are characterized by wavelength (Fig.6-8). And the temperature accuracy is verified at 700 ℃.Results and DiscussionsThe reflectivity of the two kinds of regenerated fiber gratings is not much different. The one in air has a reflectivity of 21.68%, and the other in nitrogen has a similar value of 21.73%. However, under the temperature cycle of 350-750 ℃, the regenerated fiber grating in the nitrogen environment has good temperature stability, and the temperature measurement accuracy can reach ± 2.9 ℃ at 700 ℃. The regenerated fiber grating prepared under the condition of nitrogen atmosphere is helpful to improve its stability and measurement accuracy.ConclusionThe fabrication methods of regenerated fiber Bragg gratings under two different atmospheres of air and nitrogen are studied. The whole process record of regeneration of seed gratings written by ultraviolet laser at a high temperature of 850 ℃ is obtained, and the temperature characteristics and temperature measurement accuracy of the above two kinds of gratings are systematically studied. The research results show that the regenerated fiber Bragg gratings obtained under the heating atmosphere of air and nitrogen have similar reflectivity, but the growth of regenerated fiber Bragg grating under nitrogen is faster and has good thermal stability, and its temperature measurement accuracy can reach up to ±2.9 ℃. Therefore, changes in the environmental atmosphere will affect the thermal stability and temperature measurement repeatability of regenerated fiber Bragg grating. By optimizing the fabrication method of regeneration, regenerated fiber Bragg grating will play an important role in the field of high-precision high-temperature measurement.
Nov. 25, 2023Vol. 52 Issue 11 20230229 (2023)
Lijie Liang, Liqin Liu, Yuqing Guan, Jiayuan Sun, Wenzhe Zou, Chuangwei Guo, Yujie Zhang, Xiaoyao Chu, Bin Guo, and Lihua Lei
ObjectiveDiffraction gratings are widely used in ultra-high precision displacement measurement systems, instrument calibration and other fields. The self-traceable grating prepared by atomic lithography is different from ordinary diffraction gratings in that its characteristic parameters can be directly traced to "meters" through natural constants, so the grating has the natural advantage of being used as a ruler without measuring a fixed value. Diffraction efficiency is an important indicator to measure the performance of gratings, and the diffraction efficiency of self-traceable gratings will affect the accuracy and precision of measurement results. Therefore, by analyzing the diffraction efficiency of self-traceable gratings, an important basis is provided for the preparation and application of self-traceable gratings.MethodsBased on the vector diffraction theory and rigorous coupled-wave method, a theoretical model of self-traceable grating with a sinusoidal structure and its diffraction efficiency under different incident conditions are established (Fig.2). The influence of structural parameters and laser incident conditions on the diffraction efficiency of self-traceable gratings are analyzed using the method of controlling variables. The results of model calculation are compared with the Gsolver simulation results to verify the feasibility of model calculation. A measurement system for grating diffraction efficiency is constructed (Fig.10). Combined with the grating equation, the diffraction efficiency corresponding to different Littrow angles is calculated (Tab.1).Results and DiscussionsThe simulation results show that the diffraction efficiency of the self-traceable grating -1-order is at its peak state, reaching 4.3%, when the incident wave is TM polarized, the incident wavelength is 420 nm, and the incident angle is 80° (Fig.6). In the Littrow structure, the diffraction efficiency of the self-traceable grating -1-order is at its maximum, and is close to the peak diffraction efficiency of the self-traceable grating corresponding to non-Littrow angles, when the incident wave is TM polarized, the incident wavelength is 415.51 nm, and the Littrow angle is 77.5° (Tab.1). The experimental results show that the variation trend of diffraction efficiency is consistent with the theoretical calculation results (Tab.2, Fig.4).ConclusionsThe diffraction efficiency of the self-traceable grating is analyzed by establishing a strict coupled wave model of the self-traceable grating and solving the accurate solution of Maxwell's equation system that satisfies the boundary conditions of the electromagnetic field in each region after the laser incident self-traceable grating structure. Through the measurement and research of the diffraction efficiency of self-traceable gratings, this paper provides an important basis for the preparation and application of self-traceable gratings. In the practical application of self-tracing gratings, it is necessary to combine the influence of various parameters on the diffraction efficiency and select the best incident conditions to maximize the diffraction efficiency. For the diffraction efficiency analysis of self-traceable gratings, the factors affecting the structural parameters of self-traceable gratings during the preparation process will be studied from the preparation principle of self-traceable gratings, and combined with the grating diffraction efficiency analysis in this paper, so as to prepare a self-traceable grating that maximizes diffraction efficiency.
Nov. 25, 2023Vol. 52 Issue 11 20230356 (2023)
Weifeng Du, Yanqing Wang, Xunjiang Zheng, Yongkang Wu, and Tingan Xie
ObjectiveVery high-precision and miniature star sensor is applied to LEO or MEO satellites for resource exploration and commercial uses. It has characteristics of high accuracy, light weight, small volume, high reliability and short production cycle. To fulfill the design objectives according to the above mentioned characteristics, technical indicators requirements should be researched in the development phase. The existing literatures regarding the optical system design of star sensors determine the effective aperture commonly based on noise and the observed stars, and estimate working field through magnitude and star number. However, the information of color temperature and star database is lacked in the analysis of these literatures, which causes the deviation of analysis result and engineering practice. Also, the verification is less pointing at the encircled energy of diffused light spot and working band. The paper aims to study the key optical specifications of very high-precision and miniature star sensors, and to verify the indicators based on the characteristics of optical material and star point extraction algorithm.MethodsTaking measurement accuracy of the star sensor as breakthrough point, the paper demonstrates the verification of technical indicators of the optical system. The color temperature information of stars is presented based on the revised HipJ2000 star catalogue (Tab.1). Combining the manual of CDGM, the impacts on the absorptivity and refractivity of material in different wavelengths are analyzed and the operating band for light and small optics is confirmed accordingly. Based on the mathematical model of diffused light spot, the relationship between the accuracy and the radius of Gaussian beam is analyzed. And based on the light design features, the radius of Gaussian beam for centroid extraction of high accuracy is obtained (Fig.1-2). In view of the theoretical analysis of blackbody radiation law (Fig.3) and the given detector, the sensitivity of the system is analyzed and the aperture for extracting 6.5 magnitude star under different integration time is determined (Fig.4). According to the relationship between color temperature and star magnitude in Hipparcos catalogue, the working field of view of the star sensor is fixed by analyzing Monte Carlo method (Fig.5). The design indicators of the optical system for very high-precision and miniature star sensor is determined (Tab.2).Results and DiscussionsThe design of optical system is based on the requirement of design parameters in Tab.2. The optical lens is composed of six optics (Fig.6). To adapting to spacial environment, the first optic uses SiO2material, and the other optics uses ZF6, HZPK5 material. To further enhance the anti-radiation performance of the optical system, ZF6 material could be replaced by ZF506 material. The RMS deviation of diffused light spot is less than one pixel in full field of view, and the diffused light spot is close to circle with the biggest 11.281 μm at the edge of the field of view (Fig.7). The maximum centroid distortion is 1 μm (Fig.8). The geometric encircled energy under 0.9 field of view and 3 pixel×3 pixel is more than 90% (Fig.9). The lateral color of full field of view is less than 1.5 μm (Fig.10). Athermalization analysis is executed on the optical lens, and the sampling point is in steady state under temperature of -40 ℃ to 60 ℃. The variation of dimension of diffused light spot is less than 1 μm. Due to the relationship between RMS dimension and encircled energy, there is almost no change of encircled energy within this temperature range (Fig.11). Centroid shift of the diffused light spot is less than 0.05 μm (Fig.12). All design results conform with the standard in Tab.2. In the last part of the paper, the accuracy and reliability of the optical system is verified through calibration, out-field stargazing and anti-radiation test. According to the data calibration, by using the optical system in this paper, the calibration accuracy of 0.6″ (Fig.15) and measurement accuracy of 1.5″(3 $ \sigma $)(Fig.17), could be realized. The limit detection of the star sensor is 6.51 magnitude star (Fig.18). After cumulative radiation of 60 krad (Si), 6.01 magnitude star could be detected (Fig.19-20). ConclusionsThe measured data indicates that the analysis method of system indicators in this paper is effective. The optical system could be designed to extract stellar attitude of high accuracy. The analysis scheme of technical specifications of the optical mechanical system mentioned in this paper, the design method of optical system, as well as the measured data could be used as a reference for other photoelectric sensor designs.
Nov. 25, 2023Vol. 52 Issue 11 20230104 (2023)
Shanmeng Yu, Fan Jiang, Chunping Du, Hang Wang, Hongyu Guan, Fengwei Guan, Ju Liu, and Lingjie Wang
ObjectiveThe extra-wide field-of-view camera adopts an off-axis four-mirror optical system, and the second and forth mirror adopt an integrated free-form surface structure. A free-form surface is an asymmetric structure that is highly sensitive to thermal changes. Even with a uniform change in bulk temperature, the optical-mechanical structure still undergoes asymmetric geometric changes. In addition, the extra-wide field-of-view camera needs to meet the design requirements of a width of 860 km and a field of view of 65.6°, and the entrance mask adopts a wide special-shaped opening design. The sun shines directly on the inside of the hood for a duration of 5.5 minutes as it enters and exits the Earth's shadow. Both optical and mechanical errors are caused by heat cause line of sight drift (LOS) and wavefront distortion (WFE) in the camera. These issues seriously affect the optical transfer function of the system. Considering its structural characteristics and the thermal control challenges brought about by the large change of heat flow outside the light entrance, targeted thermal control measures must be taken for different parts of the camera to meet the thermal control index requirements of off-axis free-form surface cameras with special-shaped optical apertures in orbit.MethodsSix aspects of the camera are analyzed, including its on-orbit state, structural layout, task requirements, orbital environment, technical indicators, and heat sources. The thermal control design is implemented by using composite multi-layer heat insulation components for thermal isolation (Fig.7), graded thermal control for mirrors (Fig.8), and high thermal conductivity graphite film for thermal conduction (Fig.9). This design allows for precise control of the optical-mechanical structure and efficient heat dissipation of high heat consumption/heat flux electronic equipment. The temperature of the camera is simulated and analyzed under high and low temperature conditions using the finite element analysis software UG12.0/Space thermal. The effectiveness of the thermal control scheme is verified through thermal analysis, thermal test, and satellite on-orbit telemetry temperature data.Results and DiscussionsThe transient temperature changes of the camera mirror assembly and electronic components are presented. Under low temperature conditions, the primary mirror exhibits a temperature fluctuation ranging from 19.83 ℃ to 20.10 ℃, while the second and fourth mirrors experience a temperature fluctuation between 19.80 ℃ and 20.13 ℃. The temperature fluctuation of the third mirror falls within the range of 19.91 ℃ to 20.04 ℃ (Fig.13(a)). Similarly, under high temperature conditions, the temperature fluctuation of the primary mirror ranges from 19.88 ℃ to 20.10 ℃, while the second and fourth mirrors exhibit a fluctuation between 19.81 ℃ and 20.14 ℃. The temperature fluctuation of the third mirror ranges from 20.02 ℃ to 20.20 ℃ (Fig.13(b)). It is worth noting that the reflector assembly maintains a stable temperature, with fluctuations not exceeding ±0.2 ℃ under both high and low temperature conditions. During the non-camera period, the CMOS component maintains a temperature range of 19.5 ℃ to 19.8 ℃ (Fig.13(c)). However, during the imaging period, the temperature of the CMOS component varies between 19.6 ℃ and 23.6 ℃. The temperature fluctuation of the CMOS focal plane component does not exceed 4.5 ℃, and the imaging electrical box experiences a temperature fluctuation within 8 ℃ (Fig.13(d)). The overall temperature level of the camera, as determined by thermal analysis, is compared with the thermal test results (Tab.2). The table shows that the temperature of the primary mirror and the second and fourth mirrors remained constant during the test, while the temperature of the third mirror fluctuated by 0.23 ℃. The maximum deviation between the thermal analysis and thermal test results is within 5%. The comparison of the thermal analysis results with the thermal test results confirms the validity of the thermal analysis.ConclusionsThe deviation between the on-orbit telemetry data and the thermal analysis and thermal test results is within ±0.5 ℃. This indicates that the thermal design of the camera is accurate and feasible, and the thermal analysis and test process are reasonable and reliable. The employed thermal control measures and design methods are suitable for the thermal design of extra-wide space optical camera.
Nov. 25, 2023Vol. 52 Issue 11 20230187 (2023)
Yongkun Li, Changchun Gao, Jianchao Jiao, Limin Wu, and Zhentao Yu
In accordance with the requirements of a satellite-borne remote sensing camera, the lens and focal detector work at different temperatures, which results in a large temperature difference between them. The cold radiation of the focal detector window makes the surface parameters and temperature gradient of the lens change greatly, which cannot meet the imaging requirements. In order to eliminate the influence of radiant heat difference, this paper proposes a design of adding a light blocking window between the detector window glass and the lens, which is used to elininate the cold radiation of the focal window glass so that the imaging quality of the lens system can meet the requirements. Through comparative simulation, it is proved that the design form of this paper can eliminate the influence of the radiant heat of the focal plane, which verifies the rationality and correctness of this design and provides a certain design guidance for the design of high-precision lens to eliminate the radiant heat difference.ObjectiveTemperature is an important parameter that affects the performance of the lens system of high-precision satellite-borne remote sensing camera. Temperature change produces temperature gradient, which results in thermal stress and thermal deformation. And the mirror element curvature radius, center thickness, air interval, refractive index change greatly, especially on the edge area of optical element. Even edge collapse and warping phenomenon appeared, resulting in mirror element tilt, imaging plane drift and other problems, which affects the imaging quality of camera. So athermalization design and temperature control must be adopted for remote sensing camera. Many athermalization designs are based on the temperature gradient introduced by heat conduction to affect the mirror displacement of optical elements, but the effect of temperature gradient introduced by radiant heat difference is less studied. Therefore, based on the surface parameter change of a satellite-borne remote sensing camera lens assembly caused by the cold radiation of the focal plane detector window glass, which is not satisfied for optical image quality, a design for eliminating the radiant heat difference of the focal plane window glass is proposed, which provides some guidance for the design of the radiant heat difference between the eliminating components of the satellite-borne high-precision camera.MethodsIn order to eliminate the radiant heat difference between the focal plane and the optical lens, a blocking light window is designed between the focal plane detector window glass and the mirror 8(Fig.4). The blocking light window is fixed on the focal surface box shell through adhesive. Through active temperature control, the focal surface box temperature is stabilized at 14 ℃, and the temperature of the blocking light window fixed on the focal surface box shell is also stabilized at 14 ℃, so that a radiation barrier is formed between the focal plane detector and the mirror 8 components. Through the 14 ℃ blocking light window, the cold radiation of the focal plane window glass is blocked, so that the surface parameters of lens 8 and the overall temperature difference of the lens can be repaired, and the imaging quality requirements of the lens system can be met.Results and DiscussionsWith the addition of the light blocking window, the body temperature of mirror 8 is 18.32-19.15 ℃, the gradient temperature difference of mirror 8 is reduced from 2.7 ℃ without the blocking light window to less than 1 ℃, the temperature difference is increased by 1.7 ℃ (Fig.6). The surface profile parameters of mirror 8 can be repaired by the temperature difference gradient within 1 ℃, which can meet the requirements for camera imaging quality. As a result, the modulation transfer function (MTF) of the entire lens system is repaired from 0.57 to 0.75 (Fig.8), improving the image quality of the camera.ConclusionsIn order to eliminate the influence of the cold radiation of the window glass of the focal plane detector on the surface parameter of the mirror near it, this paper adopts a design form of adding a blocking light window to block the cold radiation effect so as to eliminate the radiant heat difference between the mirror and the focal plane detector. The surface parameters of the mirror near the focal plane detector and the MTF of the whole lens system are greatly improved, which verifies the correctness and rationality of the design, and can provide a certain guidance for the design of eliminating the radiant heat difference of the satellite-borne high-precision remote sensing camera.
Nov. 25, 2023Vol. 52 Issue 11 20230257 (2023)
Xiaoyi Fu, Yuntao Hua, Wenlai Ma, Hutao Cui, and Yang Zhao
ObjectiveThe computational simulation of external heat flux in space is a crucial aspect of spacecraft thermal management design and ground test validation. Monte Carlo (MC) techniques are currently the prevailing approach for addressing spacecraft external heat flux calculations. Nevertheless, the inherent shortcoming of MC methods is their comparatively slow rate of convergence. To achieve a statistical solution for the external heat flux approximating the precise solution, a considerable number of rays must be emitted, resulting in substantial computational overhead. Consequently, the exploration of efficient algorithms for solving external heat flux is of paramount importance. To this end, a comprehensive examination of Earth radiative external heat flux is conducted, leading to the development of an innovative computational algorithm. The findings of this study will offer valuable theoretical insights for enhancing the calculation efficiency of Earth infrared and albedo radiation external heat flux, and serve as a reference for research on the localization of spacecraft external heat flux computation software.MethodsFirstly, an analysis and comparison of the contribution of each random variable dimension within the Earth radiative external heat flux integral are conducted, revealing that the foremost four dimensions of random variables yield the most significant contributions to the integral. Subsequently, Quasi-Monte Carlo (QMC) techniques are employed in lieu of traditional MC methods for the first four dimensions of the external heat flux integral to sample the ray emission point and direction for the target surface element in question, while MC is utilized for the remaining integration dimensions. This novel algorithm combines both MC and QMC approaches to compute the external heat flux. Lastly, a spacecraft serves as a computational example to ascertain the accuracy and convergence rate of the external heat flux through a large-scale ray tracing experiment.Results and DiscussionsThe comparative accuracy of the three methods employed to calculate Earth infrared and albedo external heat flux reveals the superior performance of hybrid-QMC, followed by Latin Hypercube Sampling (LHS), and lastly, the least accurate being MC (Fig.7-8). When utilizing the hybrid-QMC approach to solve Earth albedo and infrared radiative external heat flux, the convergence rate surpasses that of the other two methods. In ray tracing individual surface elements to solve the Earth radiative external heat flow, the surface elements without reflected rays can obtain a better convergence speed. For these surface elements, the hybrid-QMC method has the most significant improvement in the convergence speed of the external heat flow accuracy (Tab.6-9).ConclusionsThe importance of each integration variable dimension in the Earth radiative external heat flow is analyzed, and the results show that the first four integration dimensions contribute the most to the integration of the Earth albedo and infrared radiative external heat flow. A spacecraft is used as an example for calculation, and the results show that the hybrid-QMC method has the highest accuracy and convergence speed when dealing with the external heat flow of different surface elements of the spacecraft. The advantage of hybrid-QMC is more prominent when there is no reflection behavior of the ray emitted by the surface element. This method can provide some reference to improve the speed and accuracy of the spacecraft external heat flow calculation.
Nov. 25, 2023Vol. 52 Issue 11 20230133 (2023)
Jingxu Sun, Qiang Fei, Hongbo Xie, Shuo Wang, and Xinwang Xie
ObjectiveWith the development of infrared technology, infrared band detectors are widely used in military, industrial, agricultural, aerospace and other fields.The optical aperture of infrared payloads is increasing to meet the needs of higher resolution applications, and ultra large aperture infrared radiation sources can simulate the targets observed by infrared payloads in orbit.The infrared radiation energy of these targets is very weak. Under the normal temperature environment, the weak infrared target radiation will be submerged by stray radiation and the thermal radiation of the optical system itself, which cannot provide the true radiation for infrared payload detection targets.Therefor, an infrared radiometer is used to test ultra large aperture infrared radiation sources under vacuum and low-temperature environment, and to evaluate radiation/temperature uniformity.In order to accurately evaluate the uniformity of large-area black-body radiation source under vacuum and low temperature, a high-sensitivity mid-infrared radiometer is designed.MethodsThe physical model of radiation calibration is given, and the signal-to-noise ratio of the target temperature of 200 K and 213 K is analyzed in detail. The signal-to-noise ratio of 200 K and 213 K target under vacuum and low temperature is 460 and 1 492 times respectively. The overall scheme of measuring 200 K target with high signal-to-noise ratio is designed, and the mid-infrared radiometer with high sensitivity under vacuum and low-temperature environment is developed. The transmission optical system and temperature coefficient matching stable high-rigid optical mechanical structure support is adopted to meet the vacuum and low-temperature environmental conditions. Calibration of temperature/radiation responsivity of mid-infrared radiometer with external blackbody, the modulator is innovatively used as the interral calibration radiation source. Using four-stage TE refrigeration mid-infrared detection unit, together with high-performance detection unit and 80 dB dynamic range synchronous integral phase-locked amplifier, the high-quality square wave signal with large duty cycle for radiation calculation is obtained.Results and DiscussionsA high-precision measurement method for low-temperature targets of mid infrared radiometers in vacuum low-temperature environments is proposed to meet the performance evaluation requirements of large-scale mid infrared radiation sources under vacuum low-temperature conditions,a detailed analysis is conducted on the radiation model for measuring low-temperature targets, the system composition and working principle of the radiometer are introduced, and the optoelectromechanical and thermal control systems are designed in detail.Testing 213 K target blackbody source under the environment of 77 K and 10-5 Pa, the experimental results indicate that the signal instability within one hour is 0.24%. The NETD value is 0.034 K. The measurement accuracy is better than 2%. Mid-infrared radiometer meets the requirements of high-precision measurement of weak target in vacuum and low-temperature environment. ConclusionsAiming at the requirement of performance evaluation of large-area mid-infrared radiation source under vacuum and low-temperature conditions, a high-precision measurement method of low-temperature target under vacuum and low-temperature conditions is proposed. The radiation model of measuring low-temperature target is analyzed in detail. The signal-to-noise ratio of measuring 200 K low-temperature target is 430 times. The system composition and working principle of mid-infrared radiometer are introduced, and the opto-electro-mechanical and thermal control systems are designed in detail. Finally, the mid-infrared radiometer is tested and evaluated in detail under vacuum and low-temperature environment. The test results show that the mid-infrared radiometer can be used for high-precision and high signal-to-noise ratio test of cryogenic targets in vacuum and cryogenic environment
Nov. 25, 2023Vol. 52 Issue 11 20230136 (2023)
Li Yi, Yong Shan, Jingzhou Zhang, and Zhongcheng Wu
ObjectiveThe development of long-wave infrared radiation imaging technology is more and more threatening to helicopter. The sources of helicopter long-wave infrared radiation include the infrared radiation of the helicopter's own power system and its energy transfer with the engine compartment as well as the local heating of the fuselage by solar radiation. A large number of experiments and numerical analyses have been carried out on the highly efficient ejection blending system and infrared suppressor, which can effectively reduce the infrared radiation of the helicopter itself. Solar radiation has a heating effect on the local skin of the helicopter in flight, thus changing the infrared radiation distribution characteristics of the whole aircraft, but it is often ignored in numerical simulation calculation, and there are relatively few studies on the characteristics of solar radiation and infrared radiation of the whole aircraft considering various factors. Therefore, it is necessary to carry out the research on the effects of solar radiation on the fuselage infrared radiation characteristic.MethodsA physical model including helicopter fuselage skin, main rotor, engine casing and exhaust system was constructed to establish a structured and unstructured hybrid grid (Fig.6). The heat transfer of engine casing (Tab.1), exhaust system (Tab.2) and engine compartment skin is comprehensively considered, coupled with the helicopter forward incoming flow, rotor downwash flow and tail rotor flow (Fig.5). The solar radiation is simulated by the equation of normal direct irradiation applying the fair weather conditions method. A forward-backward ray-tracing method is used to calculate the helicopter infrared radiation.Results and DiscussionsThe whole helicopter model including the engine casing and the exhaust infrared suppressor is simulated and calculated (Fig.3). In the calculation of the flow field, the mixed flow field including the forward incoming flow, the main rotor downwash flow, the exhaust jet flow and the tail rotor flow are considered (Fig.4). With time, season and helicopter flight direction as variables, different solar radiation loading conditions are set (Fig.8-10). The detection points are evenly arranged on the horizontal, transverse and longitudinal detection planes (Fig.7), to calculate and analyze the effect of solar radiation on the infrared radiation characteristics of helicopter in 8-14 μm band.ConclusionsThe calculation results show that the direct sunlight at noon in summer can increase the overall temperature of the fuselage to the sun side by more than 20 K, and the local maximum temperature can be increased by 25 K. The infrared radiation intensity of 8-14 μm band on the sun side of the helicopter fuselage showed a peak-like trend throughout the day, and its peak appeared around 12 o 'clock. The closer to the top side of the fuselage is, the more significant the enhancement effect of solar radiation on the infrared radiation intensity of 8-14 μm band is, up to 25%. Taking winter as the benchmark, the infrared radiation of the whole aircraft at the autumn equinox, spring equinox and summer solstice increases by about 7%, 11% and 21% respectively. Except summer, the infrared radiation intensity distribution of 8-14 μm band on both sides of the fuselage in other seasons presents asymmetry, and the difference between the two sides is about 5%. On the whole, the solar radiation at 10 am in summer has little effect on the infrared radiation intensity distribution of 8-14 μm band of helicopters in different flight directions.
Nov. 25, 2023Vol. 52 Issue 11 20230146 (2023)
Zexuan Li, Jiapeng Wang, Shangzhong Jin, Chunlian Zhan, and Kexuan Wu
ObjectiveWith the rapid development of infrared detection system in military war and aerospace, it is very important to evaluate the performance of infrared detection system quickly and accurately. The system test in the real environment will increase the cost of human and material resources, and will also result in poor repeatability of test results and long test cycle due to the impact of external environment and terrain factors. Therefore, the method of infrared hardware-in-the-loop simulation based on infrared dynamic target simulator can effectively reduce the test cycle and test cost, and improve the stability of test results. At present, it mainly adopts the infrared imaging technology based on digital micro-mirror device (DMD), but the core devices of this technology are monopolized by foreign countries. Only by replacing the visible light DMD chip window, which is a complex method, can it be applied in the infrared band. Its processing technology is quite complex, which also hinders its further development. Besides, the size of DMD micro-mirror is 13 μm, which is similar to the wavelength of long-wave infrared, strong diffraction will be generated, so the infrared dynamic scene with high resolution and high contrast cannot be produced. Based on the current development, the micro-radiation array chip is designed and prepared. By converting visible light into infrared radiation, the infrared dynamic scene can be simulated with high resolution, high frame rate and wide temperature range. At the same time, the infrared dynamic scene simulation system prototype is built with this as the core device, in combination with multiple infrared shaping lenses and large aperture horizontal light tubes, which can cover conventional infrared imaging equipment, and realize high-quality dynamic scene simulation in two bands of medium and long-wave infrared. Semiconductor laser is used instead of traditional light source mercury lamp on the light source to effectively improve the simulation performance of the system, the simulated temperature difference is more than 50 K, the contrast is more than 3∶1, and the frequency is more than 80 Hz.MethodsIn this paper, an infrared dynamic scene simulation system based on micro-radiation array is established. The system (Fig.1) is composed of visible light projection system, infrared micro-radiation array (Fig.3), vacuum packaging system (Fig.7) and infrared lens. A theoretical model of micro-radiation array was established through heat transfer equations, and simulation experiments were conducted. By comparing the high-power semiconductor laser with the traditional mercury lamp light source, the high-power semiconductor laser is finally used as the system light source to effectively improve the contrast of the system. After analyzing the optical system, a set of complex battlefield environment infrared scene simulation and verification system based on micro-radiation array is formed after vacuum packaging. Through the whole system test (Fig.15), it can achieve high-quality dynamic scene simulation in the two bands of medium and long-wave infrared.Results and DiscussionsThe infrared dynamic scene simulator (Fig.2) based on the micro-radiation array (Fig.3) can conduct infrared imaging in the medium wave (Fig.8) and long wave (Fig.11) through the analysis of Zemax software, and has been applied in the infrared simulation system. High-power semiconductor laser is used to replace the traditional mercury lamp light source to improve the test performance of the system. The simulated temperature difference is more than 50 K and the contrast is more than 3:1. Especially in the long-wave infrared band, it has high contrast, which makes up for the disadvantage of the low contrast in the long-wave band of the DMD system and the resolution can be further improved. The imaging results are shown (Fig.16), dynamic images can be clearly simulated.ConclusionsThe theoretical model of micro-radiation array chip is established by heat transfer equation, and the lighting optical system and mid-wave and long-wave infrared system are designed. After vacuum packaging of the chip, the infrared scene simulation verification system based on micro-radiation array is composed. This system has simple structure, its array resolution can be further improved according to the target simulation requirements, and the cost is low. At the same time, frame frequency is limited by the heat conduction efficiency of the chip due to passive radiation. The experimental results show that the system can convert visible image into infrared image, the simulated temperature difference is greater than 50 K, the contrast is greater than 3:1, and the frame frequency is greater than 80 Hz, which verifies the feasibility of infrared simulation technology based on micro-radiation array.
Nov. 25, 2023Vol. 52 Issue 11 20230170 (2023)
Qi Li, Jinyan Wang, Xin Ji, Bin Wang, Xi Chen, and Quan Zheng
ObjectiveCompared with all-solid-state UV lasers which use nonlinear crystals to perform tertiary or quadruple harmonic conversion of infrared light, the alexandrite lasers can obtain ultraviolet lasers by single frequency doubling. It has the characteristics of superior broadband emission spectrum which enables it to achieve tunable ultraviolet laser output. Therefore, tunable continuous ultraviolet laser plays an important role in applications. The ultraviolet 371-385 nm laser can be used in many fields, such as the ultra-precision material processing, laser Doppler cooling, entangled photon pair generation and quantum communication. Therefore, developing the tunable continuous ultraviolet laser has a great research value.MethodsIn order to achieve the laser output in the wavelength range of 371-385 nm, a tunable alexandrite continuous laser was developed. The experimental structure is a V-folded cavity and the length of the cavity is about 13 cm. A fiber-coupled 635 nm LD (Changchun New Industry Optoelectronic Technology Co., Ltd) with the polarization ratio of greater than 100:1 is used as the pump source. The maximum pump power is 17 W. A c-axis-cut alexandrite crystal with Brewster angle, a size of 3 mm×3 mm×10 mm and Cr3+ doping concentration of 0.2 at.%, was used as the gain medium. It is wrapped with an indium foil and mounted in a water-cooled heat sink. A type-I phase-matched β-BaB2O4 (BBO, θ=31°, φ=0°) with the size of 3 mm×3 mm×7 mm was used as the frequency doubling crystal. In the experiment, the polarization direction of the pump beam was adjusted by a half-wave plate to match the maximum absorption direction (the b axis) of the crystal. The optimization of the resonator mirror coating and the theoretical simulation cavity length reduce the loss of resonator and improve the conversion efficiency. The continuous tunable ultraviolet laser output at 371-385 nm is realized by adjusting the BBO angle. Results and DiscussionsThe experimental schematic of the ultraviolet tunable alexandrite laser is shown (Fig.1). The maximum laser output power with the center wavelength of 378 nm is obtained by turning the half-wave plate and adjusting the resonator mirror and BBO crystal angle. The 378 nm laser light threshold is 4 W. As the pump power increases, the output power increases first rapidly and then becomes slowly. When the 635 nm LD output power is 17 W, the 378 nm laser power is 1.25 W (Fig.5), corresponding to the optical-to-optical conversion efficiency of 7.3% from 635 nm pump laser to 378 nm UV laser. In the experiment, the angle of BBO (θ=31°) is cut according to λ=756 nm/378 nm as the center wavelength. Therefore, the farther the fundamental frequency optical wavelength deviates from the central wavelength, the greater the angle of incidence is, the greater the reflection loss is, and the smaller the corresponding frequency doubling light energy is. Due to the limited angle of the BBO crystal, the continuous tunable wavelength range of the output ultraviolet is only from 371 nm to 385 nm. When the pumping power is 17 W, the farther the wavelength deviates from the central wavelength of 378 nm, the smaller the laser output power is (Fig.7). The laser beam quality along the x and y axis at 378 nm is 1.13 & 1.12, respectively (Fig.8). ConclusionsIn summary, through theoretical and experimental research, a tunable 371-385 nm continuous ultraviolet laser was realized. The UV laser is characterized by simple structure, adjustable wavelength, high efficiency and high beam quality. And a series of its key parameters were tested, which has certain application value.
Nov. 25, 2023Vol. 52 Issue 11 20230129 (2023)
Xiong Luo, Yue Shi, Qi Fan, Wei Yin, Tao Peng, Peie Zhao, Ke Wang, and Dingfu Zhou
ObjectiveCoherent lidar has the characteristics of small size, high detection efficiency and strong signal-to-noise ratio, and has been widely used in meteorology, aviation and wind power industries. But at present, most coherent wind lidar data products only use echo Doppler frequency shift information to retrieve wind field related products, and do not mine lidar echo signal strength information. Therefore, it is necessary to deeply process the echo signal data of lidar.MethodsConsidering the insufficient development of the current coherent lidar data products, a new lidar detection technology based on coherent detection was introduced (Fig.1), which can detect various meteorological factors such as cloud height, extinction coefficient and visibility while detecting the wind field. Firstly, by analyzing the characteristics of the echo signal of the coherent wind lidar, the calculation method of the spectrum echo signal power of the coherent wind lidar was derived, and the echo signal strength information of each distance position in the detection range was obtained. Then the differential zero cross and threshold method were used to inverse the cloud bottom height, and the improved Klett method algorithm was used to inverse the atmospheric extinction coefficient, and the visibility measurement was realized. Finally, it was compared with horizontal visibility meter in weather station (Fig.3), laser altimeter (Fig.4) and 532 nm aerosol lidar (Fig.5) for verification.Results and DiscussionsThe results showed that the cloud height, visibility and the extinction coefficient were in good agreement, and lidar can continuously work in various meteorological environments. The cloud height detected by lidar and Vaisala showed that the correlation coefficient is 99.57%, which fully demonstrates the feasibility and accuracy of cloud height by lidar (Fig.3). The standard deviation and root mean square error of lidar are 5% and 7.2% respectively. The trend of visibility data measured by lidar and visibility meter is consistent, and the correlation coefficient is 82.06% (Fig.4). Within 30 km visibility, the accuracy of standard deviation was 12.2%, and root mean square error was 22.5%, which may be due to the following reasons. Firstly, the parameter selection in the algorithm was not accurate enough, and there is still room for optimization in the algorithm; Secondly, at present, the coherent wind radar system was a single polarization channel detection system, which still had signal detection defects. To solve this problem, the optimization algorithm and the integrated dual-polarization detection channel system were needed for further research and optimization. The measurement of extinction coefficient had experienced many meteorological environments such as sunny day, cloudy day, rainy day and foggy day. Extinction coefficient comparison in haze day showed that the results were basically consistent, including the position and thickness of clouds, extinction coefficient, aerosol content and some detailed characteristics (Fig.6). Extinction coefficient comparison in clear day showed that the detection value of coherent lidar increased steadily, while aerosol lidar increased speedily (Fig.7). The reason may be that there are differences between the two devices, which needs further study. Extinction coefficient comparison in overcast and rainy day showed that the detection values of the two devices were consistent with the actual weather conditions. When precipitation occurs, there was a lack of detection by coherent detection lidar. Although aerosol lidar had detection data, it was still unacceptable (Fig.8). Affected by heavy fog, the detection distance of the two lidars were limited, which was less than 500 m. In the morning, the aerosol lidar was missing data in heavy fog, while coherent lidar is still working (Fig.9). There were two main reasons for this phenomenon. First, the geometric factor for the separate antenna mode of transceiver and receiver. Second, in foggy day, the aerosol content was high, and the detection of aerosol lidar reached saturation.ConclusionsThe results showed that the 1550 nm coherent lidar had the ability to detect atmospheric extinction coefficient, cloud height and visibility. The accuracy of cloud height comparison can reach 5.0%, and the accuracy of visibility comparison can reach 12.2%. The detection results were highly consistent with the detection results of aerosol lidar. It can be measured in sunny, cloudy, rainy and foggy weather continuously.
Nov. 25, 2023Vol. 52 Issue 11 20230138 (2023)
Yutong Wang, Chunrui Han, Changjun Ke, Yuanyuan Fan, and Yi Zhou
ObjectiveGraphene has been widely and actively used for photodetector due to its unique properties of extremely high mobility and broad optical bandwidth. However, the weak optical absorption of single-layer graphene and short photogenerated carriers' lifetime result in low responsivity of graphene photodetectors. In order to overcome the above problems, doping of heteroatoms is a good option for changing the charge transport properties and manipulating the chemical behavior of the graphene. The nitrogen atom is considered to be an exceptional dopant for carbon material, which has comparable atomic radius to the carbon atom to minimize the disruption of graphene and form strong covalent bond with the carbon atom. However, the traditional methods of doping nitrogen atoms often require complex experimental conditions and long reaction times. Therefore, the development of a convenient, time-saving and efficient strategy for the in-situ preparation of nitrogen-doped graphene has become a critical problem to be solved. Laser induced graphene (LIG) has been demonstrated to be an effective technique for fabricating designed device. On the one hand, the high porosity of LIG overcomes the weak light absorption of single layer graphene. On the other hand, the laser preparation process facilitates selective doping. Therefore, LIG provide a facile method for the fabrication of nitrogen-doped graphene photodetector.MethodsA one-step strategy for in-situ fabricating nitrogen-doped porous graphene by laser was demonstrated (Fig.1). The doping contents of melamine in poly (amic acid) (PAA) solution are 0, 1, 3 and 5 wt%, respectively. A continue-wave CO2 laser with an aid of a control software is applied to mark patterns on melamine/polyimide layer. The length and width of pattern are 10 mm and 700 µm, respectively. The laser scribing time is 6 with the adjacent of two scribing lines of 100 µm. The wavelength and spot size of laser beam are 10.6 and ~180 µm, respectively. The laser power is set to 6 W and the scanning speed is 300 mm·s-1. Laser processing is performed under ambient conditions. Scanning Electron Microscopy (SEM) was used to test the surface morphology and structure characteristics of nitrogen-doped LIG (N-LIG) and LIG. The crystal structure and defect degree of LIG and N-LIG were characterized by Raman spectroscopy. Energy Dispersion Spectroscopy (EDS) and X-ray photoelectron spectroscopy (XPS), were used to characterize the elemental composition of LIG and N-LIG and the specific doping ratio of N element in N-LIG. The wavelength of 343, 630 and 1550 nm light sources were used to test the photoelectric response. Results and DiscussionsBoth LIG and N-LIG show porous structures according to the SEM images (Fig.2). Raman spectra show that LIG and N-LIG have the characteristic structure of graphene, and the lattice defect degree of N-LIG is higher (Fig.4). EDS and XPS measurement results show that the main component of LIG and N-LIG are carbon. There is a small amount of oxygen in LIG and N-LIG. There is almost no nitrogen element in LIG, but the proportion of nitrogen element in N-LIG reaches 8.14 wt%, which proves that nitrogen element is successfully introduced into graphene by laser in-situ doping (Fig.5). The time-dependent photocurrents of LIG and N-LIG with light on/off cycles under illumination of 630 nm show good repeatability and stability (Fig.8). The photocurrent of N-LIG with doping content of 5 wt% is 12 µA, which is 5 times higher than that of LIG (1.8 µA). The N-LIG photodetector shows good responsivity in the range of 343 to 1550 nm (Fig.10).ConclusionsIn summary, a nitrogen-doped graphene photodetector is prepared by one-step laser direct writing. The photoelectric response of N-LIG with different doping concentrations are tested under 630 nm light illumination. The test results show that the photoelectric response increased with the increase of doping concentration. Especially for the N-LIG at the doping concentration of 5 wt%, the responsivity is an order of magnitude more than LIG photodetector. Finally, the photoresponse of N-LIG photodetector at 343 nm and 1550 nm wavelength are tested. The results show that the device can achieve a wide spectral response from ultraviolet to infrared. This work shows that the photoelectric properties of graphene can be regulated by laser induced doping, which provides a feasible scheme for low-cost and efficient fabrication of high-performance broadband photodetectors.
Nov. 25, 2023Vol. 52 Issue 11 20230140 (2023)
Xiaodong Jia, Fengxue Qian, Wurui Ta, Hang Zhao, Xiaoqiang Wang, and Juanjuan Zhang
ObjectiveWhen a high-energy laser passes through the target airflow boundary layer, its optical path transmission path will change, and its energy density will also decay. It is the key to study the influence mechanism of the target gas boundary layer on the laser transmission performance for the application of laser as energy carrier in military field. The laser passing through the high-speed flow field to reach the target material is a nonlinear dynamic problem involving the coupling of electric fields, magnetic fields, temperature fields, and flow fields. In order to study the transmission and attenuation characteristics of laser, it is necessary to accurately describe and characterize the interaction between laser and flow field.MethodsBased on the classical electrodynamics theory, a theoretical model describing the laser propagation behavior in the atmosphere is constructed. At the same time, the flow field distribution characteristics of different Mach numbers are calculated based on the flow field governing equation. On this basis, considering the influence of flow field density, temperature, velocity and pressure, the nonlinear refractive index model is established, the influence of each factor on laser refractive index is studied. Finally, based on the laser transmission and attenuation characteristics, the influence of the gas boundary layer on the laser-to-target parameters is revealed.Results and DiscussionsThe radius of the laser spot gradually increases with the increase of transmission distance, which indicates that the flow field and glass have a divergent effect on the beam (Fig.2-4). Under the action of glass and flow field, the power to target is in good agreement with the experimental data. The electric field intensity decreases gradually with the increase of transmission distance, which indicates that the flow field and the glass have a weakening effect on the beam energy. The loss of laser transmission power is directly proportional to density and pressure, and inversely proportional to temperature (Fig.19). At the same Mach number, the influence of the flow field on the laser mainly comes from the refractive index of the flow field, which is closely related to the flow field density. The smaller the flow field density is, the greater the attenuation rate of the laser passing through the flow field is. The smaller the pressure in the flow field is, the thinner the air is, which affects the refractive index of the gas.ConclusionsThe distribution characteristics of laser cross section always follow the middle electric field value to the maximum, and then gradually decrease to the surrounding, which shows that laser is a typical nonlinear light. Different Mach numbers correspond to different gas densities. From air to high-speed flow field, there will be a sudden change in gas density. Under the same transmission distance, the power at high Mach number is greater than that at low Mach number. When the Mach number is fixed, the corresponding power decreases approximately linearly with the increase of transmission distance.
Nov. 25, 2023Vol. 52 Issue 11 20230150 (2023)
Zhenfang Fan, Hui Luo, Shaomin Hu, Tuo Luo, Zhikun Liao, Zhongqi Tan, Haoshen Ding, and Jincheng Fan
ObjectiveRing laser gyro is widely used in navigation, positioning, precision goniometer and other fields. Due to the backscattering of the reflectors and the non-uniformity of the optical loop, ring laser gyro has the lock-in phenomenon. In order to reduce the influence of the locking zone, the laser gyro must be biased. Mechanical dither bias is the method with the highest accuracy and is most widely used. However, mechanical dither bias has the defect that it needs to pass through the locking region twice in one cycle, and certain rotation signal loss will be generated each time it passes through the locking region. Jitter noise injection can randomize the rotation signal loss during the locking process, but it cannot eliminate this error, which will generate random walk error in the output of the gyroscope. In order to eliminate the lock-in error, the lock compensation is carried out.MethodsThe lock compensation can obtain the error through the locking area and further compensate the error. In this paper, the lock compensation of laser gyro is realized for the first time through reasonable engineering design. The two instantaneous beat signals of the photocell are obtained by a high-speed ADC. After filtering the two signals, it can be judged whether the gyroscope has passed the locking area. If so, we can process it through the process in Fig.1. By orthogonal demodulation of read signal of laser gyro, the output pulse number of gyro can be obtained by reversible counter. Through the compensation expression, the compensation expression of the locking area is obtained.Results and DiscussionsThe gyro output signal without locking region compensation is shown (Fig.2), and the gyro output signal with locking region compensation according to the formula is shown (Fig.4). The comparison between the two figures shows that the output fluctuation of laser gyro after compensation is much smaller than that before compensation. The data in Fig.2 and Fig.4 were analyzed respectively by Allan variance, and the results were shown (Fig.5). It can be seen that the Allan variance of the data after compensation moved down much more than that before compensation. According to the data fitting of the two curves, the random walk before the lock compensation can be calculated as $1.53 \mathrm{e}{\text{-}}3\left(^{\circ}\right)\sqrt {\rm{h}} $, and the random walk after the lock compensation is $3.14{\rm{e}}{\text{-}} 4 \left(^{\circ}\right)/ \sqrt {\rm{h}} $, which is only 1/5 of the one before the compensation. It is confirmed that the lock compensation can reduce the random walk of the gyro indeed. ConclusionsThe random error of each lock-in crossing in the ring laser gyro can generate the angle random walk (ARW) error in the output. In the frequency domain, the ARW error can be extended to the frequency band of useful signals, which is difficult to be filtered out by filtering method. Therefore, the random walk determines the ultimate accuracy of the navigation system. By recording the lock-in error of every lock crossing, the ARW of laser gyro is reduced. The Allan variance method is used to analyze the effect of lock compensation. The experimental results of a gyroscope show that the ARW after lock compensation is reduced to 1/5 of the original value. This is the first report of lock-in error compensation in engineering.
Nov. 25, 2023Vol. 52 Issue 11 20230156 (2023)
Qianhao Wang, Xiaojun Yang, Wenlong Wen, Hualong Zhao, and Yi Li
ObjectiveFemtosecond laser micromachining application scenarios commonly occur in atmospheric environments. When the femtosecond laser is focused and interacts with air, it ionizes to produce air plasma, which has a direct impact on the whole machining process. Among other things, the interaction of Kerr self-focusing with plasma scattering leads to filamentation, which changes the light field distribution, and air ionization can significantly affect the laser energy acting on the material. Studying the interaction between femtosecond laser and air, especially the process of ionization of air by laser pulses, is the key to leapfrogging to enhanced applications. To deeply understand the laser micromachining process in atmospheric environment, the transient evolution characteristics of air plasma generated by focused femtosecond laser pulses are studied by building a femtosecond time-resolved pump-probe shadow imaging system, and the temporal characteristics of air plasma under different focusing conditions are numerically simulated.MethodsA high time-resolved pump-probe shadow imaging system was built. The laser beam is focused in the air by a microscopic objective and imaged by another laser beam for detection(Fig.1). A 20× microscope objective was used for high-resolution imaging of the plasma to record the time-space evolution of the air plasma. The optical range difference between the pump light and the detection light is adjusted to determine the detection time interval, and the spatial morphology of the air plasma is characterized by the shadow image on the CCD. In the numerical simulation, the ionization model in atmospheric environment is established to obtain the complete process of plasma generation and dissipation in light calling ionization.Results and DiscussionsUnder the microscope focusing conditions at 20×, the plasma is growing and moving rapidly from 0 fs to 59 fs; After 64 fs, it enters a slow evolutionary stage, with the shadow moving speed and propagation distance slowly decreasing; And at 135 fs, the plasma enters a saturation stage and the shadow signal intensity stops growing (Fig.3). The wave front velocity of its ionization keeps decreasing with time and is overall less than the speed of light (Fig.4). From the computational model, it is obtained that the transition times between multiphoton ionization and tunneling ionization are -1.158τ and -1.26τ for 20-fold and 40-fold focusing conditions, and the times of complete dissipation of free electrons are 23.2 ps and 13.1 ps, respectively. ConclusionsA laser pulse with a pulse width of 290 fs, a single pulse energy of 160 μJ, and a central wavelength of 1 026 nm was used as the pump light pulse, and the time-space process of the focused femtosecond pulse transport ionization in air was investigated by building a femtosecond time-resolved pump-probe shadow imaging experiment. The time course of air plasma generation and disappearance was obtained by solving the free electron rate equation for different injection energies and focusing conditions numerically. The experimental results show that the ionized air plasma is shuttle-shaped, and the transient electron number density increases and then decreases as the delay time increases, while the extension velocity of the plasma gradually decreases from 2.9×10⁸ m/s to 0. Solving the free electron rate equation shows that the transient electron number density of the air plasma ionized by the femtosecond laser is higher under the focusing conditions of the high-NA objective, and the tunneling ionization contributes to a higher electron number density in the whole ionization process. The number of electrons contributing to the whole ionization process is higher; And considering the diffusion and compounding of ions, the decay of plasma density is faster under high NA focusing conditions, and the ionization and diffusion processes present a high degree of temporal asymmetry. The process optimization parameters in femtosecond laser micromachining are numerous and extensive, and often require a lot of labor and resources for experimental exploration. The existing micromachining computational models are unable to reproduce the actual processing results due to the lack of key physical parameters such as transient electron eigenvalues in the simulation model. Femtosecond time-resolved pumping probe technology can provide an important tool for transient measurement of physical feature parameters and improve the simulation model, thus increasing the accuracy of simulation results. Overall, femtosecond time-resolved pump-probe shadow imaging can provide a means to observe transient physical processes in different processing environments and is expected to become a powerful tool for online monitoring of high-end femtosecond processing equipment.
Nov. 25, 2023Vol. 52 Issue 11 20230158 (2023)
Rongchuan Zhang, Xiaoye Wang, Hongwei Zhang, Xiaoying Liu, Xitao Wang, Shengguang Qin, Jiaping Yin, Qichao Wang, and Songhua Wu
ObjectiveAircraft is one of the most important inventions in the early 20th century, which gave birth to the development of air transport industry and changed the transportation, economy, production and daily life of human beings. Subsequently, aviation safety issues have gradually become the focus of attention. The emergence of heavy aircraft, especially the emergence of B747-100, makes the aviation safety problems caused by aircraft wake vortex can not be ignored. Accurate identification of the position of the aircraft wake vortex core is the basis for dynamically reducing the wake vortex spacing. At present, the vortex core position extraction and vortex intensity evaluation based on coherent Doppler pulse lidar observation data have been realized with the algorithm. However, the interference of the background wind field and the need for calculation speed are major technical difficulties for the application of the existing wake vortex identification algorithm. In order to further improve the environmental adaptability and calculation accuracy of the wake vortex identification algorithm, this paper conducts corresponding research.MethodsAiming at the requirement of near real-time output of lidar wake vortex detection results and the problem of inaccurate vortex core positioning in the near-ground environment of existing algorithms, this paper optimizes the previous identification methods. By referring to the tangential velocity method and the concept of ROI (Regions Of Interest), the region is focused to reduce the introduction of interference. By referring to the radial wind speed method, the rotation characteristics of the wake vortex are introduced into the solution to improve the anti-interference ability of the algorithm. By referring to the fast identification method, the spectral width information is combined with the radial wind speed information to improve the accuracy of the vortex core location. The path integral method is used to reduce the influence of ground effect on the solution results. By referring to the optimization method, the verification conditions of the solution results are set up to improve the reliability of the solution results. Aiming at the problem that the deviation of some circulation calculation results in lidar wake vortex detection is too large, this paper optimizes from two aspects. First, for the circulation calculation deviation caused by the movement of the wake vortex during the scanning process, this paper proposes a new correction method, that is, the displacement of the wake vortex is calculated to correct the velocity distribution of the wake vortex, and then the circulation of the wake vortex is corrected; Secondly, the error sources in the correction process of the idealized aircraft wake vortex model are analyzed to reduce the introduction of errors in the fitting process.Results and DiscussionsThe calculation time of this method on the standard personal computer is usually less than 2 s, and it is verified by the observation data of Chengdu Shuangliu International Airport. Compared with the fast recognition method, the correct recognition rate of this method is increased by 2.8%, the false negative rate is decreased by 2.7%, and the false alarm rate is decreased by 20.86% (Fig.18). When the wake vortex interaction is strong, the consistency between the circulation correction method and the B-H model is stronger than that of the fast identification method, which is closer to the calculation results of the circulation theory (Fig.15). At the same time, this paper verifies that the introduction of near vortex core data will increase the correction error in the B-H model fitting process (Fig.16).ConclusionsIt has been verified that the optimization method proposed in this paper has significantly improved the recognition accuracy under near-ground conditions. Due to the complexity of the real atmosphere and terrain environment of the airport, the method still has a small amount of false identification, false alarm and missing report (Tab.3). The circulation correction method proposed in this paper mainly focuses on the circulation calculation problem caused by the stretching or compression of the wake vortex. In the future, it is necessary to consider the circulation deviation caused by system factors such as measurement resolution and volume averaging effect. NASA is also planning to quantify these errors to improve the ability of lidar to measure wake vortex intensity. Continuing to optimize the performance of the algorithm will be conducive to the application of lidar in airport security, aircraft design, air refueling, ship landing and other scenarios, and provide reliable data support for the realization of intelligent aviation.
Nov. 25, 2023Vol. 52 Issue 11 20230160 (2023)
Yikang Zhang, Xiaolin Sui, Bo Liu, Ziyan Wu, Bo Mei, and Bo Wang
ObjectiveIn lidar remote ranging, the lidar receiver needs to extract weak signals from noisy received signals. The detection ability of the lidar receiver for weak signals is an important part of ensuring the detection distance and accuracy of the lidar system. Improving the signal-to-noise ratio (SNR) of the demodulated signal can effectively improve the detection distance and accuracy of lidar. Under the premise of a certain laser transmission power, it is necessary to improve the SNR during the reception process. Traditional heterodyne lidar receivers typically down-convert the lidar echo signal to the baseband through two down-conversions. The first down-conversion directly mixes the echo light signal with the local oscillator light, which introduces additional mirror frequency noise. Due to the mirror frequency noise being the same as the useful signal frequency after demodulation, the noise cannot be eliminated through a filter after demodulation, resulting in a deterioration of the SNR of the demodulated signal. In contrast, using orthogonal demodulation can suppress the elimination of mirror frequency noise through the phase relationship between the two branches during the demodulation process, thereby improving the SNR of the demodulated signal. In practical applications, affected by the non-ideal state of the device, the two branches in the quadrature demodulation structure may not be able to achieve a fully balanced state. Therefore, the algorithm compensation for the orthogonality of the two branch signals is also worth in-depth study. The use of appropriate mirror frequency suppression down-conversion structures and the use of relevant algorithms for imbalance compensation is expected to improve the detection performance of lidar systems.MethodsBased on the principle of receiving and demodulating echo signals in a lidar system, and referring to structures such as Hartley and Weaver, an orthogonal down-conversion structure for optical signals in the receiver was constructed. At the same time, based on the statistical characteristics of the orthogonal signal, a compensation algorithm is used to compensate for the error of the demodulated quasi orthogonal signal to ensure that the mirror frequency noise is completely eliminated. Subsequently, the demodulated intermediate frequency signal is subjected to secondary down-conversion to obtain the baseband signal. Finally, by computing the SNR of two schemes can effectively determine the performance of suppression of the mirror frequency.Results and DiscussionsSimulation analysis and experimental verification show that the SNR using the biorthogonal demodulation scheme is superior to traditional heterodyne demodulation schemes. In addition, when there is amplitude or phase imbalance in the orthogonal structure, the use of correlation compensation algorithms can effectively eliminate the additional noise interference generated by this imbalance (Fig.9), further improving the SNR of the modulated signal. The results show that compared to traditional heterodyne lidar receivers, the SNR of the demodulated signal processed by this scheme is improved by about 3 dB (Fig.12).ConclusionsThis study is based on the background of coherent lidar remote ranging, and improves the down-conversion structure of the lidar receiver. By adopting an optoelectronic dual orthogonal down-conversion method, it effectively suppresses mirror frequency noise, improves the SNR of the demodulated signal, and ultimately improves the lidar detection distance and detection accuracy. Due to the fact that the I/Q imbalance compensation algorithm used in this scheme is based on the statistical characteristics of the signal, which relies on the length of the sampled signal and the integrity of its period, its compensation performance is not stable for different sampling signals. Therefore, researching more advanced compensation algorithms can achieve better mirror frequency suppression effect. Finally, this scheme only suppresses mirror frequency interference in frequency mixing, and in reality, there is also frequency related noise. The suppression of frequency related noise can further improve the effectiveness of signal noise control.
Nov. 25, 2023Vol. 52 Issue 11 20230172 (2023)
Zhengdong Fan, Hangyu Peng, Jun Zhang, Jingbo Wang, Jiye Zhang, and Lijun Wang
ObjectiveHigh-power 650-660 nm laser can weaken and destroy the target visible light detection equipment under relatively low-power density, and protect its own equipment. It has an important position in the field of visible optoelectronics confrontation. At present, due to its high-power output and near diffraction limited beam quality, solid-state laser is the main light source of this band and has been applied to photoelectric confrontation. However, pumping solid-state laser by semiconductor-laser and then frequency doubling to output 650-660 nm laser, the conversion efficiency is low.MethodsThis article builds an outer cavity spectrum beam system. The output end of the laser resonator is plated with anti-membrane, the reflectance is <1%. Output laser is plasticized by the fast axis collimator, beam transformation system and slow axis collimator. Various angles of the output laser are integrated into this part of their diffraction grating, and overlap on the refracting ring. After diffraction through the grille, the laser is perpendicular to the external cavity feedback through the outlet. Some laser beam feedback backs to the laser unit to form resonance. Because all light beams conform to the same grating equation and have the same diffraction angle, the diffraction grating selects different wavelengths for laser units based on the angle of incident into the grating. The laser unit's output laser is located in the same axis after the laser passes through the feedback mirror of the external cavity.Results and DiscussionsThe beams overlap in the x direction, which cannot be distinguished by light spots, indicating that the spectral beam is successfully achieved. Each laser unit is locked to different wavelengths. The spectral line width is 6.45 nm. Corresponding to the wavelength of the 10 laser units, no other peaks are found, indicating that each laser unit is completely locked (Fig.3). The output power measured after the spectral combining is 7.3 W, the electro-to-optical conversion efficiency is 23.09% (Fig.4). The beam quality is M2X= 1.95, M2Y= 11.11. The beam quality of a single laser unit is nearly 47 times compared to the laser beam quality (Fig.5). ConclusionsThe external cavity spectral combining technology was used to improve the beam quality of the 650 nm semiconductor laser sources, the output of 650 nm laser with CW power of 7.3 W. The spectral line width is 6.45 nm, and the electro-to-optical conversion efficiency is 23.4%. The beam quality was M2X = 1.95, and M2Y = 11.11. Compared with the laser beam quality, the quality of the beam is nearly 47 times, similar to the beam quality of a single laser unit. In the future, higher-power 650 nm laser can be obtained by increasing the number of combined laser units and polarization-combination, which provides effective ways to achieve high-power, high-beam quality, and high-conversion efficiency.
Nov. 25, 2023Vol. 52 Issue 11 20230198 (2023)
Pei Chen, Hongwei Zhang, Xiaoying Liu, Xinyu Zhang, Kaijun Zhang, Lijing Chen, Longyan Fu, and Songhua Wu
ObjectiveIn the data processing of wind field detection by coherent Doppler lidar, the Doppler frequency shift is extracted as the target for wind speed calculation, and the accuracy of Doppler frequency estimation directly affects the performance of wind field detection by coherent Doppler lidar. The accuracy of wind measurement is greatly affected by the interference of noise clutter, weakness of reflection signal, and wind field inhomogeneity, thus limiting the detection performance of the system, resulting in wind speed estimation outliers and detection range faults. The existing research on the power spectrum analysis method lacks the targeted research and multi-angle optimization attempts under the key technical limitations of weak signals. Therefore, effective peak retrieval of the power spectrum plays a decisive role in achieving accurate inversion of the wind field under the application limitation. Therefore, a power spectrum analysis method is proposed to improve the accuracy and detection performance of coherent Doppler lidar wind speed retrieval.MethodsIn order to improve the peak detection accuracy of the target signal under weak signal conditions and obtain the accurate frequency estimation of signal spectrum for wind speed inversion, the optimization of the frequency shift estimation algorithm and peak detection are explored. Specific optimization measures include the smoothing processing of the original power spectrum baseline: background noise removal algorithm (Fig.1-2), the resolution enhancement peak detection algorithm for the target signal (Fig.3), and the quality assessment of peak retrieval to achieve frequency estimation correction (Fig.4-5). A power spectrum analysis method based on nonlinear least squares noise fitting, combining linear prediction spectrum estimation and derivative enhancement algorithm is proposed (Fig.6).Results and DiscussionsThe commonly used maximum likelihood discrete spectrum peak estimation algorithm based on Fast Fourier Transform and the proposed frequency estimation synthesis algorithm are respectively applied to the measured radial wind speed data of coherent Doppler lidar, and the performance of the frequency estimation synthesis algorithm is evaluated. After applying the proposed algorithm, the stability of wind speed measurement has been significantly improved, the wind speed measurement error on several far-field distance bins has been effectively reduced, and the effective detection distance of wind speed has been effectively improved in all scanning directions. Through the statistical analysis of the autocorrelation coefficient, the temporal correlation and spatial correlation of the wind speed estimation are verified (Fig.10-11). The results show that the wind speed data obtained by the proposed power spectrum analysis method maintains good spatio-temporal continuity and spatial autocorrelation characteristics. The inversion results of lidar were compared with the reference results of the ultrasonic anemometer under spatio-temporal matching (Fig.15-16), and the effectiveness of the proposed power spectrum analysis method for improving the detection performance of coherent Doppler lidar was verified.ConclusionsOn the basis of Fast Fourier Transform, a power spectrum analysis method based on nonlinear least squares noise fitting, combining linear prediction spectrum estimation and derivative enhancement algorithm is proposed. The algorithm has the characteristics of high noise suppressing effect, great recognition ability of weak signal, and high accuracy of wind speed estimation. The results of temporal and spatial correlation analysis of wind speed data show that the proposed power spectrum analysis method has better stability of wind speed estimation, and the effective wind field detection distance is increased by 73.13% compared with the ML DSP algorithm. The comparison results with the ultrasonic anemometer show that the proposed algorithm has high recognition accuracy in the case of weak signal. The standard deviation between the wind speed results and the ultrasonic anemometer is reduced by 0.23 m/s compared with the ML DSP algorithm, and the BIAS rate is reduced by 0.3 m/s, effectively improving the accuracy of Doppler frequency estimation in the low SNR range.
Nov. 25, 2023Vol. 52 Issue 11 20230216 (2023)
Bo Zhang, Dongxia Hu, Zhitao Peng, Rui Zhang, Dandan Zhou, Zhao Dang, and Junpu Zhao
ObjectiveLaser time fiducial system is needed in high power laser facility for tracking synchronization change in experiment caused by disturbances such as collimation and device replacement. Traditional time fiducial is an electrical trigger pulse input to the AUX channel of oscilloscope which is convenient but has obvious jitter (about 150 ps). Moreover, the electrical trigger sensitive to the electromagnetic interference. Another time fiducial form is an infrared fiducial can transfer a long distance in fiber and been send to an independent channel of oscilloscope. Infrared fiducial has a good accuracy but employ a measurement channel. In this article, we propose a new time fiducial scheme based on optic-electric and electric-optic transformation for getting a blue time fiducial signal @450 nm which can use the vacuum photodiode detecting together with UV pulse. The scheme provides a rapid fiducial signal with long transmission ability for UV pulse synchronization monitor and has a monitoring precision as high as 10 ps.MethodsThe study presents a fiducial system scheme based on optic-electric and electric-optic conversion. Firstly, arbitrarily waveform generator driven a M-Z modulator to modulate continuous infrared laser and infrared time fiducial signal been produced. Secondly, infrared time fiducial transferred a long distance by SM fiber and been converted to electrical signal by a photodiode. Thirdly, the electrical signal drive a direct-modulation LD and a blue time fiducial signal @450 nm is gotten. The final fiducial signal can be reach an index of 47 mW output power, 10% power jitter and 120 ps laser pulse width.Results and DiscussionsAccording to the scheme, the monitor jitter caused by fiducial power jitter, fiber length variation follow with temperature, oscilloscope noise and photodiode noise have been tested and analyzed. According to the analysis, the scheme can get a monitor accuracy of 10 ps with a 24.5-25.5 ℃ temperature variation. An experiment for examine monitor accuracy is done with 24.8-25.2 ℃ temperature variation, the monitor accuracy gotten in experiment is 7.2 ps which is coincide with the theoretical analysis result (7.03 ps).ConclusionsIn this study, a fiducial system scheme based on optic-electric and electric-optic conversion is proposed for high power laser facility synchronization monitor. In the scheme, infrared time fiducial signal firstly been transferred a long distance by SM fiber and been converted to electrical signal by a photodiode, after that the electrical signal drive a direct-modulation LD and a blue time fiducial signal @450 nm is gotten. The final fiducial signal can be reach an index of 47 mW output power, 10% power jitter and 120 ps laser pulse width. The experiment and theoretical analysis indicates that the method can providing a rapid fiducial signal with long transmission ability for UV pulse synchronization monitor, the monitoring precision can be as high as 10 ps.
Nov. 25, 2023Vol. 52 Issue 11 20230234 (2023)
Yiqiang Zhao, Qi Zhang, Changlong Liu, Weikang Wu, and Yao Li
ObjectiveFull-waveform airborne LiDAR can not only obtain 3D point clouds, but also obtain full-waveform of the target. The classification of full-waveform LiDAR data is to assign a category label to each point based on data characteristics. It is an important part of data post-processing and has significant application value in the fields such as remote sensing and topographic mapping. However, existing methods overlook the correlation between full-waveform and point clouds geometry in terms of physical characteristics, and lack in-depth exploration of the correlation in neighborhood geometry and semantic features between point pairs. Therefore, the existing methods lack the ability to capture local structural information, which affects the classification effect. To address the above issues, a classification method based on the physical and geometric characteristics of the target is proposed. This method mines the high-dimensional feature association between 3D point clouds and full-waveforms on the high-dimensional physical characteristics of the target, and enhances the learning of local geometric structural information, thereby improving the classification ability of the model.MethodsA classification method based on target physical and geometric features is proposed. Firstly, a high-dimensional feature fusion module is proposed, which extracted the rich physical characteristics from the full-waveform, and extracted the geometric features of the point clouds. Based on the correlation between full-waveforms and point clouds on the physical characteristics of the target, the complex relationship between the two is learned through a dual low-rank matrix, and deeper physical features are excavated (Fig.2). Secondly, a local neighborhood feature enhancement module is designed to enhance the learning of local geometric structures by constructing a fully-connected neighborhood structure, mining the geometric and semantic correlations between neighboring point pairs (Fig.3). Finally, by using the hierarchical encoder-decoder structure, the characteristics of multiple receptive field can be conbined. A classification method based on the physical characteristics and geometric characteristics can be constructed to improve the classification ability of the model (Fig.4).Results and DiscussionsThe proposed method is based on the correlation between point clouds and full-waveforms on the physical characteristics of the target. By fusing the two, the physical meaning of the features is enriched and the learning of local geometric structures is enhanced. From Tab.2, it can be seen that the proposed method successfully generated correct labels for most points, achieving an average accuracy of 0.96, a recall of 0.90, and an F1 score of 0.92. Multiple methods such as FCN, GACNN, and FWNet2 are used for testing on the same dataset. Compared with FWNet2, which has the best performance among existing methods, our method has effective improvements in average accuracy, average recall, and average F1 score. Among them, compared with FWNet2, the accuracy, recall, and F1 score of our method have been improved by 0.02, 0.01, and 0.02 respectively in the ground category, and by 0.02, 0.04, and 0.03 respectively in the street category. The test results are shown (Fig.6). ConclusionsThis article proposes a classification algorithm based on the physical and geometric characteristics of the target. This method focuses on the rich physical characteristics and vertical structural information of the target contained in the full-waveform, as well as the correlation between full-waveforms and geometric features of point clouds. The fusion of the two features is achieved using a dual low-rank matrix; And based on the local neighborhood fully-connected structure, the learning of local structural information are strengthened, thus constructing an end-to-end full-waveform airborne LiDAR data classification network. Multiple experiments show that the average accuracy and recall of our classification method are as high as 0.96 and 0.90, respectively, indicating the effectiveness of this method. At the same time, it provides some possibilities for exploration in-depth feature extraction and fusion, based on the correlation in target physical characteristics between full-waveforms and point clouds.
Nov. 25, 2023Vol. 52 Issue 11 20230212 (2023)
© Copyright 2018-2021 | Chinese Laser Press.
All Rights Reserved 沪ICP备15018463号-20