


 View fulltext

2023
Volume: 52 Issue 5
24 Article(s)

Peizhan LI, Jiaqiang ZHONG, Wen ZHANG, Zheng WANG, Yue GEN, Qijun YAO, Wei MIAO, Yuan REN, Jing LI, and Shengcai SHI
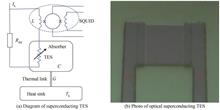
Superconducting Transition-edge Sensor (TES) is a thermal detector that measures the deposited energy by changing the superconducting film's resistance. Superconducting TES-based single-photon detectors with high detection efficiency, low dark count rate, photon-number and arriving-time resolving capability, are ideal detectors for faint and rapidly varying sources, playing a unique role in studying pulsars, neutron stars, white dwarfs and exoplanets. The critical temperature (TC) is the key parameter that determines the energy resolution (?EFWHM) of superconducting TES single-photon detectors, which can be finely tuned by baking the superconducting film or fabricated devices in the air. We studied the characteristics of titanium and titanium/gold bilayer films and the dependence of TC on baking time (tbaking) and baking temperature (Tbaking). It was found that the TC is logarithmically decreased with tbaking for a fixed Tbaking, while it is exponentially decreased with Tbaking for a fixed tbaking. By treating the phase-slip parameters as variables, we extended the two-fluid model to extract the key parameters of superconducting TESs including temperature and current sensitivity coefficients from the measured current-voltage curves at different bath temperatures. By adding an M factor to take the excess noise into account, the simulated ?EFWHM is consistent with the measured one. We then calculated the TC dependence of ?EFWHM for a 20 μm×20 μm Ti TES device and found that superconducting TESs with a TC of less than 170 mK can easily discriminate the photon numbers with a good ?EFWHM. Finally, we designed and fabricated titanium-based superconducting TES single-photon detectors, which were embedded in an optical cavity to improve the absorption efficiency. The optical cavity is composed of a dielectric mirror with 8 periods of Ta2O5/SiO2 layers and an anti-reflection coating with 2 periods of Ta2O5/SiO2 layers. The refractive index of Ta2O5, SiO2 and titanium film were measured with an ellipsometer, thus the calculated absorption efficiency of the optical cavity at 1 550 nm is nearly 100%, which is in agreement with the measured value with an IR spectrometer. The fabricated superconducting TES single-photon detector with an active area of 20 μm×20 μm is aligned to a single-mode fiber with the help of an IR microscope and a two-dimensional moving stage, which reached a coupling efficiency of nearly 100%. A 1 550 nm pulsed light source is used to measure the optical response. To measure the system detection efficiency (ηsys), we used a calibrated power meter and two precision attenuators to determine the average photon numbered incident (μin) on the superconducting TES. The detected photon number (μout) was obtained from the height histogram with a large count of pulse responses. Then ηsys is the ratio of μout to μin, ηsys=μout/μin. We realized high-performance superconducting TES single-photon detectors with a ηsys of higher than 90% and an ?EFWHM of 0.5 eV at 1 550 nm. In addition, we developed a superconducting TES single-photon detector to detect 850 nm photons. The thickness of titanium film was chosen to be 53 nm and its TC is beyond 400 mK, which makes possible to cool it with just a He-3 sorption cooler instead of a dilution refrigerator. While working at 300 mK, the superconducting TES single-photon detector with a ηsys of 13% and an ?EFWHM of 0.75 eV can still resolve 850 nm photon numbers. Such superconducting TES single photon detectors with high ηsys, good ?EFWHM and short recovery time pave the way for the detection of rapidly varying sources.
May. 25, 2023Vol. 52 Issue 5 0552201 (2023)
Wei YOU, Xuezong YANG, Yuxiang SUN, Muye LI, Huawei JIANG, Dijun CHEN, Weibiao CHEN, and Yan FENG
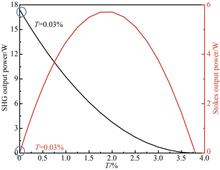
Single-frequency 589 nm laser can resonate with sodium atoms in the sodium layer (altitude of ~100 km) to generate intense return fluorescence which is used as a bright beacon for adaptive optics and is essential for large aperture telescopes to observe the universe clearly. This Sodium Guide Star Laser (SGSL) technology is of intense interest for applications in astronomical observation, space debris tracking, ground to space communication and mesospheric magnetometry. Due to the lack of efficient direct inversion gain medium at 589 nm and the strict requirements for laser output power and spectral linewidth, it is challenging to generate suitable SGSL.In this paper, we demonstrated a high-power single-frequency SGSL based on diamond Raman laser with intracavity Second Harmonic Generation (SHG). The laser operated in single longitudinal mode is due to the combination spatial-hole-burning-free Raman gain mechanism and harmonic self-suppression of axial-longitudinal modes. The pump was a linearly-polarized Yb-doped fiber laser at 1 018 nm with 3 dB spectral linewidth of 15.7 GHz and maximum output power of 82 W. The dimension of the diamond crystal was 7 mm×4 mm×1.2 mm and the Type I SHG crystal was LiB3O5 (LBO) cut at θ=90°, ?=0° with the dimension of 10 mm×4 mm×4 mm. The directions of 1018 nm pump polarization, diamond <111> axis and LBO slow axis were aligned parallel to each other, providing the highest Raman gain and SHG angle match. The output coupling of the resonator at Stokes wavelength was 0.03%. At the LBO temperature of 37.8 ℃, the SHG power increased up to a maximum of 16.5 W with a beam quality of M2=1.05 at the pump power of 82 W. The optical-to-optical conversion efficiency from 1 018 nm to 589 nm was 20%. The SHG output spectrum was measured using a scanning F-P interferometer and had a 3 dB linewidth of 16 MHz. Thus, the power spectral density of the SHG was 197 times higher than that of the pump.An analytical model about the external cavity Raman laser with intracavity SHG is adapted and used to predict the SHG and Stokes powers. The calculation results guide that a small output coupling at Stokes is critical to generate high SHG power. However, the influence of output coupling on the Stokes output power is more complicated due to the intracavity SHG. When the pump power is set to a fixed value of 82 W, Stokes output power shows a parabolic trend with the output coupling and reach the maximum at 2%. By tuning the LBO temperature and its phase-matching, the SHG output power and longitudinal-mode characteristics are analyzed theoretically and experimentally at the maximum pump power of 82 W. The temperature of the LBO crystal is tuned from 33 ℃ to 51 ℃ at a step of 0.5 ℃. The experimental temperature acceptable bandwidth of the LBO crystal is 13 ℃ which agrees well with the theoretical temperature acceptable bandwidth of 15 ℃. The maximum SHG power is achieved when the LBO temperature is tuned away from the optimum of 40.5 ℃ and the SHG power is only 10.7 W. The reason is that the intracavity Stokes intensity is getting weak due to the strong nonlinear loss when the LBO phase-matching is close to the optimum. The laser is maintaining single longitudinal mode operation for the LBO temperature from 33 ℃ to 45 ℃, and when the temperature exceeds this temperature, the laser is operating in multi-longitudinal modes.In summary, 1 018 nm Yb-fiber laser pumped external diamond Raman resonator with intracavity SHG has been demonstrated as an efficient technology to generate single-frequency 589 nm laser for SGSL applications. Due to the high Raman gain (10 cm/GW at 1 μm) and incomparable thermal conductivity (2 000 W/m?K) of diamond crystal, the diamond SGSL is well suited to achieve much higher power.
May. 25, 2023Vol. 52 Issue 5 0552202 (2023)
Tongjun LIU, Huiqi YE, Liang TANG, Zhibo HAO, Jian HAN, Yang ZHAI, and Dong XIAO
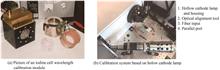
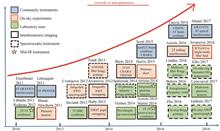
The radial velocity or Doppler spectroscopy is one of the most important methods to detect exoplanets and investigate astrophysical processes. This technique has made immense success in discovering hundreds of planets with various masses since 1990 s, leading to the era of intensive discovery of exoplanets. Typically, as the mass of exoplanets decreases, a higher precision of the radial velocity is required. It was estimated that detecting an earth-size planet around a sun-like star requires at least 10 cm/s precision over timescales of a year, which demands high precision and high stability wavelength calibration technology. However, the widely used wavelength calibration technology based on atomic absorption cells and hollow cathode lamps could not support 10 cm/s measurement precision due to the influence of a series of factors such as uneven distribution of spectral lines and spectral line broadening. The development of laser technology, especially the laser frequency comb, opens new horizons to the high precision wavelength calibration.In 2008, researchers brought an astro-comb system based on mode-locked laser generating high repetition frequency (>10 GHz) comb teeth which could be resolved clearly by spectrometer as a brand-new calibration source. The test results suggested that wavelength calibration with astro-comb had the potential to realize cm/s level precision, and in the next few years, the astro-comb system has been rapidly developed and further improved, gradually becoming the most successful high-precision wavelength calibration system available. Meanwhile, other high precision wavelength calibration technologies were also reported, including white light Fabry Perot etalon, electro-optic modulated astro-comb, micro resonator based astro-comb. These techniques also are the potential candidates to support 10 cm/s precision measurement, and are superior to the astro-comb system based on mode-locked laser in some aspects, such as system complexity and cost. Unlike the last generation techniques using atomic absorption cell and hollow cathode lamp, the calibration spectra of new generation techniques provide massive and dense peaks in frequency domain, which overcomes the defect of uneven distribution of atomic spectral lines.Nevertheless, there are still some issues that need to be addressed in order to achieve long-term wavelength calibration with 10 cm/s precision. The mode-locked laser astro-comb system inheriting high precision and high system complexity, more user-friendly turnkey system and wider frequency coverage are the focus of future development. On the contrary, although the white light Fabry Perot etalon has low system complexity, its absolute frequency acquisition of the transmission peaks and long-term stability need to be further improved. For the electro-optical modulated astro-comb and micro resonator based astro-comb, they could directly generate high repetition frequency combs without complicate filter system required in mode-locked laser astro-comb, but at present, their main working bands are in the near-infrared, and the visible wavelength coverage will be the main direction in the future. With the development of high-precision wavelength calibration techniques, it is foreseeable that the precision, long-term stability and coverage frequency will be improved, which would guarantee long-term wavelength calibration precision of 10 cm/s and meet the requirement of finding earth-analogs within the habitable zone of stars.In this paper, we summarized and illustrated the development and current status of wavelength calibration techniques using iodine absorption cells and Th-Ar lamps, as well as the new generation of high precision wavelength calibration techniques based on astro-combs and etalons. The basic principles and typical systems of new generation techniques are presented, their advantages and disadvantages are analyzed, and the future development prospects.
May. 25, 2023Vol. 52 Issue 5 0552203 (2023)
Zijian HAN, and Xiangyan YUAN
Astrophotonics is the application of versatile photonic technologies to channel, manipulate, and disperse guided light from one or more telescopes to achieve scientific objectives in astronomy in an efficient and cost-effective way. The field of astrophotonics spans a wide range of technologies, including collecting astronomical light into guided channels (fibers/waveguides), manipulating the transport and reconfiguration of the light, and filtering/dispersing/combining the guided light. A combination of one or more of these functionalities has led to a wide spectrum of astrophotonic instruments. The developments and demands from the telecommunication industry have driven a major boost in photonic technology and vice-versa in the last decades. The photonic platform of guided light in fibers and waveguides has opened the doors to next-generation instrumentation for both ground- and space-based telescopes in optical and near/mid-IR bands, particularly for the upcoming large-aperture telescopes. The large telescopes are pushing the limits of adaptive optics to reach close to a near-diffraction-limited performance. The photonic devices are ideally suited for capturing this AO-corrected light and enabling new and exciting science such as characterizing exoplanet atmospheres. The ongoing growth of photonics industry and astrophotonics displays a strong parallel with the development of radio communication and radio astronomy, where each positively influenced the other.The paper introduces the photonic lantern, an astrophotonic device that allow for a low-loss transformation of a multimode waveguide into a discrete number of single-mode waveguides and vice versa, thus enabling the use of single-mode photonic technologies in multimode systems. The paper discusses the theory and function of the photonic lantern, categories and manufacture of the device, and several applications in astronomical observations.How the uncoupled SM waveguide modes evolve through an adiabatic transition to become the modes of the MM waveguide can be described by analogy with the Kronig-Penney model for the interaction of electrons in a periodic potential well. In order to understand how a set of identical modes evolve into an equal number of non-degenerate modes, the entire taper transition of the photonic lantern must be modeled. At large lantern diameters the modes of the single-mode cores are strongly confined, and thus do not couple and remain near-degenerate. As the lantern diameter decreases, the modal fields expand, such that interaction between the single-mode cores increases. The resulting coupling leads the formation of non-degenerate supermodes that form from linear superposition of these original modes.While PLs come in a wide array of port counts and geometries, they can be largely classified into three groups. In what we call the “standard” PL, embedded cores are uniform in structure and refractive index. At the other extreme, “mode-selective” PLs use differing single-mode core radii or index contrasts, so that each fiber mode at the FMF-like lantern entrance routes to a distinct output por. Lastly, we term lanterns that operate between these two extremes “hybrid lanterns.” These lanterns have one core mismatched from the rest, thereby funnelling light from the fundamental fiber mode into a single output port while mixing the remaining light in the rest of the ports.Here we outline the five types of photonic lanterns that have been reported to date.1) Compact astronomical spectral filters. FBGs operate at the diffraction-limit which makes them difficult and inefficient to couple light to from either a seeing-limited telescope (a telescope that does not use Adaptive Optics (AO) to correct for the atmospheric turbulence) and/or a telescope which has a low performance AO system. The PLs described in the previous section form the ideal solution to collect light from such telescopes efficiently and exploit FBGs for spectral filtering.2) Efficient fiber scrambling. Due to imperfections in the fiber, light couples between modes and excites new modes as it propagates along the fiber leading to an unstable output beam that varies with wavelength and time. This effect can also be confused as a barycenter shift in the measured spectral line and is known as modal noise. To combat this, fibers are generally agitated. MCFs in combination with PLs offer a unique solution to these issues. Indeed, it was realized early-on that a back-to-back PL built from a MCF could offer mode scrambling properties.3) Wavefront sensing. The photonic lantern WFS (PL-WFS) represents a type of WFS, which addresses several of the limitations of current adaptive optics systems. Placing the WFS at the focal plane, rather than at a non-common pupil plane, has been long desired in adaptive optics as it eliminates non-common path error and is sensitive to wavefront errors not visible in the pupil plane (such as island modes).Photonic lanterns allow for a multimode core to be converted to several single-mode cores. Owing to the multimode input, a PL is ideally suited to efficiently couple a low-quality beam (as a result of the atmospheric turbulence) from the focus of a telescope while delivering a diffraction-limited beam to an instrument.In conclusion, the photonic lantern is a versatile and powerful concept, allowing the transformation of an optical multimode system into a single-mode one and enabling the use of single-mode-based photonic technologies in multimode systems for the first time. Photonic lanterns increase the functionality and possible applications of few-modal devices and systems. These mode convertors offer the possibility of improving the light collecting ability while keeping and opening new photonic functionalities in astrophotonics and astronomical instruments.
May. 25, 2023Vol. 52 Issue 5 0552204 (2023)
Kai ZHANG, Boqing WANG, Zhongyu YUE, Xinqiqige, Tong ZHOU, Mingda JIANG, Liang WANG, Bo MA, and Zhengyang LI
Sun Yat-sen University (SYSU) has a long history of astronomy education and research, founding the first astronomy department in China in 1927, building the CUHK Observatory in Yuexiu Mountain, Guangzhou in 1929, and establishing the School of Physics and Astronomy in Zhuhai Campus in 2015, with the Department of Astronomy starting to enroll undergraduate students in astronomy in 2019. The Department of Astronomy is committed to the discipline construction and scientific research in the fields of galactic cosmology, stellar and planetary physics, multi-messenger astronomy, and astronomical instrument technology. The school is building a modern astronomical observation facility that combines education and scientific research on the top of the mountain Da Nan Shan (22.344 191 N, 113.557 600 E) in the Zhuhai campus. The site has good astronomical observation conditions, with an altitude of 407 meters, annual observation days of 120 days, and a seeing range of 0.6"~2.5". The 1.2-meter telescope of Sun Yat-sen University is a multi-functional astronomical observation facility with a full-aperture 1.2-meter primary mirror, which can carry out diversified scientific observation in a full field of view of 15 degrees and achieve the construction purpose of integrating scientific research and education. A tricolour camera set will provide real-time colour information of celestial bodies to help quickly identify and classify target celestial bodies; the long-slit spectrograph can provide low-resolution (R=1 000~3 000) spectral observation capability for point sources and extended sources, helping to study the formation and evolution of galaxies, star clusters, and other targets; a fiber-fed high-resolution spectrograph will provide single-target high-resolution (R≥30 000) spectral observation capability to assist in the measurement of special astrochemical abundance and apparent velocity.The most important feature of the SYSU 1.2-meter telescope project is that integrates diversified functionalities in imaging and spectroscopic observation. It allows university teachers and students to carry out some experimental observation without the assistance of the professional staff, and can quickly and flexibly switch different observation methods, effectively meeting the requirements of education and research. An octahedral Cassegrain unit is designed to accommodate all the science instruments and their auxiliary devices. Every instrument can connect the fold Cassegrain focus by a switching mirror on the centre of the Cassegrain unit. The unit is divided to 4 layers from top to bottom, including the flange, instrument layer, electronic layer, and cable wrapper. A shield is also prepared to remove the stray light from the background. The long-slit spectrograph is composed of full dioptric lenses, which are able to fully cover all the spectrums over the science field of 5' along the slit. It can change the spectral resolution by switching the slit widths from 1" to 3", and selecting the observing band by using different grisms. Each grism has the same function, so that the dispersed beam at the central wavelength overlaps with the optical axis of the spectrograph. It results in that the instrument doesn't require optical alignment when switching the resolution or observing the band. The high-resolution spectrograph is a powerful workhorse instrument which connects the Cassegrain focus by a 25 m fiber. It adopts a standard “White Pupil” optical system to provide the required spectral resolution over the full wavelength range from 400 nm to 900 nm by using an echelle grating and a pair of cross-dispersed prisms. A 2 000×2 000 detector is used to cover all 55 orders of spectrums with similar image quality at different wavelengths. As a result of test, the mean of spectral resolution is higher than 40 000 over the full band. A calibration unit is composed of lamps, the integral sphere, and the beam projector. It is mounted on one of the instrument ports of the octahedral Cassegrain unit. The calibration unit is able to evenly illuminate a long area with a length of longer than 20 mm. The distance of 400 mm between the lenses and the illuminated area is used to turn the calibration beam to the different instruments, the high-resolution spectrograph or the long-slit spectrograph. The paper gives a detailed introduction to the development of the above spectroscopic facilities and some results of the related technical tests at the laboratory.
May. 25, 2023Vol. 52 Issue 5 0552205 (2023)

Hangxin JI, Guoxin BA, Jun LI, and Haoran YU
Modern astronomy has entered a new era of all-band, multi-messenger, and space-ground synergistic observation. Optical/Infrared telescopes and their instruments have an increasing demand for high-tech innovation. Any advanced technology and process that can improve the sensitivity, extent and accuracy of detection as well as reduce the volume and cost should be concerned by the instrument design. Several ground/space-based optical surveys telescopes, such as Large Synoptic Survey Telescope, Roman Space Telescope, Euclid, and China Space Station Telescope will commission in the following five years. The upcoming massive deep sky survey data will make optical astronomy enter an unprecedented development epoch. The astronomical community hopes to build various advanced astronomical instruments to explore and investigate any objects among the different scales of the universe. The hottest research in time-domain astronomy is the identification and characteristic analysis of various transient sources, such as Gravitational-Wave Electromagnetic Counterparts, silent Black-Hole flares, and Gamma-Bursts, so it needs the spectrograph have the capability of fast response, wide-band and high efficiency with one exposure. What's more, if the instrument has multi-mode, like, multi-color imaging, spectrograph with different resolution mode, polarimetry, it will be very popular to the community. The mid-low dispersion imaging spectrometer always has the characteristics of multi-modes, high efficiency and small volume, which is suitable for the optical band following-up observation of various transient targets. This kind of instrumentation is a workhorse spectrograph for all size of telescopes around the world, such as, Low Resolution Imaging Spectrometer at Keck I telescope, Focal Reducer and Spectrograph-2 at VLT, Faint Object Camera and Spectrograph (FOCAS) at Subaru Telescope, ESO Faint Object Spectrograph and Camera at 3.6 meters telescope. However, the working band of these spectrographs is mainly visible (365~900 nm). What's more, the “FOSC” type of spectrometers was designed as a single channel, each grism needs to work with an order filter to block the spectral overlapping from other orders, and it will reduce the total efficiency. This paper takes the 1.9m optical telescope as an example, and designs a dual-channel medium-low dispersion spectrograph based on an updated “FOSC” type, which can achieve three spectral resolution modes (R=500, 2 000 and 5 500) and the working band cover from ultraviolet to near infrared (310~1 000 nm) with high efficiency. According to the grating equation, spectral resolution and other key specification, the initial parameters of the spectrograph can be derived. An approximate symmetry dual-channel design is adopted in order to make the spectrograph having a high efficiency across the whole working band and also having a compact volume. The collimator system uses a catadioptric design rather than a refractive system to improve the efficiency and then splits the spectrograph into two channels. According to the process of GRISM and VPHG, the straight-through grism efficiency is optimized by adjusting the prism material and apex angle, then 4 grism parameters are obtained for each channel. During the camera optimization, materials absorption is carefully considered, and what's more, an aspherical surface is used to reduce the total lens number and an active focusing compensation lens were chosen to meet the requirement of working at a large dynamic temperature range (-30 ℃~20 ℃). The final performance of the spectrograph is quite good, the Blue and Red channels both have excellent image quality with the maximum RMS spot radius of less than 5 μm within the full field of view in resolution mode, the peak efficiency of the spectrograph is better than 60% and the minimum efficiency at both ends of the working band is better than 20%. This paper also has a short discussion about different technologies which could be used in our design to improve the total spectral efficiency, especially the cutting-edge process of curved chips which is expected to overturn the traditional camera system design in the near future. Therefore, taking red camera as an example, the simplified camera system with a curved chip can improve the overall spectral efficiency by at least 4%, which looks very promising.
May. 25, 2023Vol. 52 Issue 5 0552206 (2023)
Xiqun WANG, Zhuo LV, Yuanfangzhou WANG, Yu FU, Xu TAN, and Zhenyu JIN
The measurement and study of the Sun's magnetic field is an important branch of solar physics, most of the Sun's phenomena and processes are closely related to the magnetic of the Sun. Magnetograph is a solar narrowband observation system based on tunable filters. The magnetograph can measure the magnetic field and velocity field of the solar atmosphere with high accuracy and is a piece of important observation equipment for solar physics research. Due to processing and assembly errors and incidence angles in different fields of view, the central wavelength of the solar narrowband observation system will deviate from the calibrated wavelength, which is called wavelength drift. The wavelength drift of the observation system seriously affects the accuracy of the magnetic field and velocity field measurement. The wavelength drift must be measured accurately and corrected during the measurement of the magnetic field and velocity field. The wavelength drift is different for different fields of view. To achieve high-precision measurement of the magnetic field and velocity field, it is necessary to precisely measure the wavelength drift in the full field of view.Aiming at the wavelength drift problem of the narrowband solar observation system based on the Lyot filter of ground-based large aperture solar telescope, this paper proposes an online full-field wavelength drift measurement method. This method can realize the high-precision measurement of wavelength drifts in the full field of view without changing the structure of the observation system. Online measurement of system wavelength drift refers to scanning the system spectral lines based on the existing configuration of the observation system to obtain spectral profiles at each field of view. The line center of the field of view can be obtained by fitting the spectral profiles of different fields. The method of obtaining system wavelength by spectral profile scanning is an algorithm based on the light intensity. The fluctuation of light intensity at one field of view will affect the wavelength drift measurement here. The structure of the solar atmosphere and the change of atmospheric transmittance are two important reasons for the fluctuation of light intensity in data acquisition. The spatial structure of the solar atmosphere will shake irregularly in the field of view due to telescope tracking errors and atmospheric turbulence. The method in this paper can eliminate the light intensity error caused by these factors and improve the wavelength drift measurement accuracy. Firstly, control the telescope to point to different positions in the quiet area of the solar disk center, and acquire the data of each wavelength by flat field mode. The average of multi frame images can smooth out the solar atmospheric structure and reduce the error caused by these structures. Secondly, synchronous acquisition of light intensity of broadband channels can correct narrowband image intensity frame by frame. Finally, the scanning spectral profile will be obtained for each field of view. The Gaussian fitting method can obtain the wavelength drift result from the scanning spectral profile.We have carried out the experimental verification in the high-resolution solar photosphere observation system of the 1 m New Vacuum Solar Telescope (NVST) in the Fuxian Solar Observatory (FSO). The field of view of the experimental system is 102″. We observed 11 wavelength points of ±6 pm centered on 5 324.191 nm. And we acquired 10 images at each wavelength point 15 times. The experimental results show that: in the 102″ field of view, the static error amplitude of full field wavelength drift is 1.6 pm; the wavelength drift distribution in the field of view is close to the sphere; the mean wavelength drift redshifts gradually throughout the day. At the same time, through many times of measurements, the measurement error RMS of the online measurement method for wavelength drift proposed in this paper is less than 0.1 pm.The online measurement method of wavelength drift proposed in this paper realizes high-precision measurement of wavelength drift. The high-precision measurement of wavelength drift improves the measurement accuracy of the solar magnetic field and velocity field. The residual of spherical fitting of wavelength drift is less than 0.2 pm. It's a static error, which caused by the incident angle of the filter. The redshift of the mean wavelength drift comes from the Earth's rotation, it's a dynamic error. There are some ripples in the frequency drift result, the amplitude is 0.25 pm. They are caused by fringes on monochromatic images. Fringes on monochromatic images originate from the interference of monochromatic light passing through the filter at the detector window. Due to the limited accuracy of using the image processing method to remove ripples, it is better to use a window with a wedge angle in the system design to avoid interference. In addition, in order to improve the accuracy of full field wavelength drift measurement, it is also necessary to consider how to eliminate the influence of dirty spots in the observation system.
May. 25, 2023Vol. 52 Issue 5 0552207 (2023)
Junfeng HOU, Yingzi SUN, Jiaben LIN, Yang ZHANG, Dongguang WANG, Yuanyong DENG, and Zhiyong ZHANG
The sun is a huge plasma laboratory, in which all phenomena and processes are caused by electromagnetic interaction. Therefore, the observation and research of the solar magnetic field play an important role in solar physics and space weather science. At present, the measurement of solar magnetic field is mainly based on the Zeeman effect and its polarization variation in a narrowband spectrum. Therefore, for imaging equipment, the solar magnetic field measurement requires a filter with a bandwidth of about 0.01 nm. High precision and high sensitivity tunable narrowband imaging is one of the core technologies for solar telescopes to achieve accurate magnetic field observation. Lyot birefringent filter is an imaging filter invented by Lyot Bernard in 1933. It realizes ultra-narrow band filtering through the interference effect of high birefringent crystals, and is the most commonly used narrow band imaging device for solar telescopes. Traditional birefringent filters use rotating wave plates to adjust the central wavelength of transmission. However, mechanical modulation is not only slow, but also faces reliability risks such as life, bubbles, and oil leakage when applied to space telescopes. Based on this, with the rapid development of liquid crystal modulation technology in recent years, tunable liquid crystal birefringent filters are gradually favored. Instead of mechanical modulation, Liquid Crystal Variable Retarder (LCVR) is used to achieve wavelength adjustment through transmission, which is fast and free of risks such as bubbles and oil leakage, significantly improving the scientific performance and reliability of the filter. However, since LCVR is a liquid crystal electro-optic modulator, when tunable liquid crystal birefringent filters are applied to space telescopes, the retardation-voltage curve of LCVR may drift due to the combined effects of radiation, force, heat, charging and other factors, which may lead to divergence of the transmission profile of the filter and the drift of the central wavelength, thus reducing the measurement accuracy of the filter. Therefore, how to realize the in-situ calibration of tunable liquid crystal birefringent filter is the core problem. In 2014, Mudge Jason and Tarbell Theodore proposed a Fourier in situ calibration method, but this method only gives a theoretical formula of the first stage filter, and assumes that all stages of filter are completely linear independent, and its measurement error increases significantly with the retardation shift of LCVR. Therefore, this paper proposes a nonlinear fitting calibration method based on Fourier analysis. Based on the theory of polarization interference, Fourier analysis is used to obtain the phase offset of each stage of the birefringent filter; then, a functional model of the phase offset and the retardation drift of LCVR is established; finally, the nonlinear fitting method is used to obtain the retardation drift, so as to achieve the in-situ calibration of the birefringent filter. The simulation results show that the measurement accuracy of the new calibration method is within 0.1° when the retardation drift of LCVR is within ±45° and the central wavelength drift of the prefilter is within the range of [-0.17 nm 0.07 nm]; when the thickness manufacturing error of calcite crystal is within ± 10 μm, the retardation measurement error is within 1°; when the first order dispersion change of calcite crystal is within ± 10%, the measurement error is within 2°. In order to verify the validity of the calibration method, a tunable liquid crystal birefringent filter is experimented in Huairou Solar Observation Station (HSOS) in National Astronomical Observatory of the Chinese Academy of Sciences. Through experimental research, both methods are compared. The results show that the LCVR drift is within -40°, the measurement error of the nonlinear fitting method based on Fourier analysis is within 5°, and the corresponding birefringent filter (bandwidth 0.01 nm) center drift is less than 0.000 3 nm; The measurement error of Fourier method is within 20°. When LCVR offset reaches -60°, both calibration methods are invalid. The experimental results are basically consistent with the simulation analysis.
May. 25, 2023Vol. 52 Issue 5 0552208 (2023)
Zhiwei TAO, Congming DAI, Pengfei WU, Yichong REN, Haiping MEI, Wenqing XU, Gang XU, Jie TONG, Yunsong FENG, Ruizhong RAO, and Heli WEI
The rapid development of aerospace technology, such as GPS satellite navigation system, represented by high precision and sensitivity, is gradually gaining wide attention from researchers and replacing traditional radio navigation systems, playing an important role in military defense, space exploration, engineering surveying, air-to-air combat and other fields. However, due to the limitations of traditional electromagnetic theory, satellite navigation technology has relatively weak anti-electronic deception and electromagnetic jamming capabilities. In order to enhance the autonomy and reliability of the navigation system, a passive and strong counter-jamming navigation method, which is named as starlight navigation, has been proposed. In the 1950 s, the advent of star sensors has greatly improved the accuracy of starlight navigation. Star sensors are high-precision attitude-sensitive measuring instruments that measure the star vector component in the star sensor coordinate system by conducting the stellar observation, and determine the three-axis attitude of the carrier relative to the inertial coordinate system using known precise star positions. The high accuracy, strong counter-jamming ability, and independence from other systems of star sensor navigation technology have a wide range of applications and important military value on various airborne, shipborne, and vehicle-mounted platforms in near-earth space. However, as the development of observation platforms and the decrease in the observation height of star sensors in the atmosphere, a star sensor operating in the terrestrial space will inevitably be affected by sky background radiation, atmospheric turbulence, and atmospheric refraction during the observation. This three-part paper aims to extensively reveal these atmospheric effects on stellar observation. In Part I, we investigate how to reduce the effect of sky background radiation on star imaging by using polarization filtering technique. Based on the LIDAR measured data, we calculate the distribution and scattering characteristics of the entire atmospheric particles in typical regions. Concretely, we stratify the entire atmosphere based on specific calculation needs, taking into account the aerosol extinction profile, atmospheric density, and weather conditions of typical regions. We then calculate the aerosol particle number density, extinction coefficient, and scattering phase matrix, using the near-surface visibility, complex refractive index, and distribution type of aerosol particles, in conjunction with the Mie scattering theory. By combining the preprocessing data of atmospheric particles with the vector radiation transfer model, we employ the doubling and adding method and set the fixed parameters in this calculation model to study the polarization characteristics of the sky background in the near infrared band and obtain the polarization distributions of the sky background under different atmospheric and observation conditions. Furthermore, we analyze the effects of observation and solar position on the polarization distribution of the sky background under different values of wavelength. We show that using near-infrared light with a large value of wavelength and located in the absorption band for observation or increasing the observation altitude of the star sensor can suppress the sky background light to some extent by using polarization filtering technique. Other than that, we find that when the observing azimuth angle is certain, choosing a suitable observing angle can ensure the possibility of using polarization filtering technique at lower solar altitude to reduce the effect of sky background radiation on the star imaging. This research sheds light on the atmospheric effects on star imaging and provides insights into how polarization filtering technique can be used to reduce the impact of sky background radiation on stellar observation. Moreover, this study's findings have significant implications for the development of more effective and reliable star sensor navigation technology.
May. 25, 2023Vol. 52 Issue 5 0552209 (2023)
Zhiwei TAO, Congming DAI, Pengfei WU, Yichong REN, Haiping MEI, Jie TONG, Chuankai LUO, Chun QING, Yunsong FENG, Heli WEI, and Ruizhong RAO
The rapid development of aerospace technology, such as GPS satellite navigation system, represented by high precision and sensitivity, is gradually gaining wide attention from researchers and replacing traditional radio navigation systems, playing an important role in military defense, space exploration, engineering surveying, air-to-air combat and other fields. However, due to the limitations of traditional electromagnetic theory, satellite navigation technology has relatively weak anti-electronic deception and electromagnetic jamming capabilities. In order to enhance the autonomy and reliability of the navigation system, a passive and strong counter-jamming navigation method, which is named as starlight navigation, has been proposed. In the 1950 s, the advent of star sensors greatly improved the accuracy of starlight navigation. Star sensors are high-precision attitude-sensitive measuring instruments that measure the star vector component in the star sensor coordinate system by conducting the stellar observation, and determine the three-axis attitude of the carrier relative to the inertial coordinate system using known precise star positions. The high accuracy, strong counter-jamming ability, and independence from other systems of star sensor navigation technology have a wide range of applications and important military value on various airborne, shipborne, and vehicle-mounted platforms in near-earth space. However, as the development of observation platforms and the decrease in the observation height of star sensors in the atmosphere, a star sensor operating in the terrestrial space will inevitably be affected by sky background radiation, atmospheric turbulence, and atmospheric refraction during the observation. This three-part paper aims to extensively reveal these atmospheric effects on stellar observation. In Part II, we develop a starlight atmospheric propagation model to investigate the effects of atmospheric turbulence on star imaging. Based on the profile of atmospheric turbulence obtained by the ERA5 data of typical regions and optical turbulence prediction method, we employ von Karman spectrum of refractive index fluctuation and the so-called subharmoniccompensation-based fast-Fourier-transform algorithm to generate the corresponding random phase screens and calculate the spatial distribution, number, and strength of phase screens in accordance with the rule of equivalent Rytov-index interval phase screen. After that, we calculate the scintillation index of starlight for different moments and different observation conditions in typical regions by eliminating the apertureaveraging effect at the receiver. Further, we verify the reliability of the numerical calculation by comparing the theoretical counterpart of stellar scintillation. We investigate the scintillation effects and the jitter characteristics of starlight transmission in atmospheric turbulence and obtain the jitter displacements in the far field under typical observation height and zenith angle according to the far-field imaging theory. We show that the arrival angle and arrival angle fluctuation of stellar jitter are positively correlated with the scintillation index of starlight, and the effects of atmospheric turbulence on star imaging can be mitigated to a certain extent by increasing the observation altitude and reducing the observation zenith angle of the star sensor. This research provides a comprehensive analysis of atmospheric turbulence effects on star imaging and offers suggestions for improving stellar observation in terrestrial space. Moreover, these findings are of great significance for the practical application of star sensor navigation technology in various fields.
May. 25, 2023Vol. 52 Issue 5 0552210 (2023)
Zhiwei TAO, Congming DAI, Pengfei WU, Yichong REN, Haiping MEI, Yunsong FENG, Ruizhong RAO, and Heli WEI
The rapid development of aerospace technology, such as GPS satellite navigation system, represented by high precision and sensitivity, is gradually gaining wide attention from researchers and replacing traditional radio navigation systems, playing an important role in military defense, space exploration, engineering surveying, air-to-air combat and other fields. However, due to the limitations of traditional electromagnetic theory, satellite navigation technology has relatively weak anti-electronic deception and electromagnetic jamming capabilities. In order to enhance the autonomy and reliability of the navigation system, a passive and strong counter-jamming navigation method, which is named as starlight navigation, has been proposed. In the 1950s, the advent of star sensors has greatly improved the accuracy of starlight navigation. Star sensors are high-precision attitude-sensitive measuring instruments that measure the star vector component in the star sensor coordinate system by conducting the stellar observation, and determine the three-axis attitude of the carrier relative to the inertial coordinate system using known precise star positions. The high accuracy, strong counter-jamming ability, and independence from other systems of star sensor navigation technology have a wide range of applications and important military value on various airborne, shipborne, and vehicle-mounted platforms in near-earth space. However, as the development of observation platforms and the decrease in the observation height of star sensors in the atmosphere, a star sensor operating in the terrestrial space will inevitably be affected by sky background radiation, atmospheric turbulence, and atmospheric refraction during the observation. This three-part paper aims to extensively reveal these atmospheric effects on stellar observation. In Part Ⅲ, we select an optimal atmospheric refraction model for autonomous satellite navigation and study the effect of atmospheric refraction on star imaging. We introduce different models of refractive index and refraction calculation, and employ the parameter profile data of the U.S. standard atmosphere to calculate the refraction distribution characteristics of the plane-parallel atmosphere, spherical whole-layer atmosphere and spherical multiple-layer atmosphere. We compare and analyze the advantages and disadvantages of different refraction calculation models in terms of calculation accuracy, iteration number and algorithm speed, and theoretically and numerically select the most accurate and fast refraction calculation model for our specific calculation. Based on these models and the profile data of atmospheric parameters measured at different times in typical regions of China, we calculate the distribution of refraction angle, dispersion angle, lateral shift, and path elongation effect caused by atmospheric refraction under different observation conditions and values of wavelength, and evaluate the effect of the uncertainty of input parameters on the calculation of refraction. Lastly, we provide an illustrative example of a polynomial fitting function for the path elongation ratio at a particular observation height, which can be utilized for the fast computation of refractive effects in the real-time scenario. We find that we can most accurately calculate the refraction angle by the use of the Cassini model or the equivalent refraction index ray tracing method. Moreover, we reveal that the effect of atmospheric refraction on star imaging can be greatly reduced by increasing the observation height of the star sensor or decreasing the observation zenith angle of the star sensor compared to changing the value of wavelength. Finally, we found that when the input parameters exist noise and uncertainty, improving the accuracy of temperature measurement is more effective in reducing the error of refraction calculation than suppressing the noise of other parameters. This research sheds light on the atmospheric effects on star imaging and offers insights into improving the accuracy and reliability of autonomous satellite navigation. Moreover, the findings of this research could aid in the development of more reliable and accurate navigation systems in the future and the performance improvement of star sensors operating in terrestrial space.
May. 25, 2023Vol. 52 Issue 5 0552211 (2023)
Dong LIN, Zhuangzhuang ZHU, Jijun FENG, and Jinping HE
Multi-object spectroscopic detection has become one of the most important tools in astronomical observation, as it can simultaneously obtain a large amount of spectral information from celestial bodies. Astronomers have developed numerous research achievements in galaxy structure and evolution, outer planet detection and research, and cosmic large-scale structures and evolution through massive spectral data. The astronomical community has set up multiple large-scale spectral survey dedicated telescopes, obtaining tens of millions of spectral information in the past few decades. However, compared to the vast number of celestial bodies in the universe, the current amount of spectral data is still insignificant. For instance, the number of galaxies alone may exceed 100 billion, with an extremely large number of celestial bodies in each galaxy, such as the 100 billion to 400 billion stars in our Milky Way galaxy. Therefore, there is still much more unknown information waiting for exploration. In recent years, China has been actively promoting the second-phase project of survey telescopes and the establishment of new large-scale survey telescopes to maintain its world-leading position in large-scale spectroscopic survey technology and corresponding astronomical scientific research. This requires a significant increase in the number of multi-object spectroscopic detections. However, observing so many celestial spectra at the same time still presents significant technological and cost challenges. Currently, multi-object spectroscopy is generally based on fiber optic spectrographs. After collecting multi-object signals at the telescope focal plane, numerous fibers form a one-dimensional array at the entrance slit of the spectrograph, ultimately achieving multi-target spectral detection on a single instrument. With the same physical field of view, known large multi-object fiber optic spectrographs can measure hundreds of celestial spectra simultaneously due to their close to 300 mm aperture. However, only synchronously observing several hundred targets is far from sufficient when compared to the vast number of observation targets. Enlarging the aperture requires the use of large optical components, which not only brings about technical issues in manufacturing, modulation, and control but also causes an exponential increase in cost. Moreover, the spatial arrangement of input fibers in multi-object fiber optic spectrographs has reached a theoretical limit. When light energy propagates through optical fibers, it is mainly localized in the core, while the coating layer that each fiber independently possesses restricts further narrowing of the core distance, which may affect the pixel utilization efficiency of the astronomical detector, whose price is extremely high. In the observation environment with minimal disturbances from space and atmospheric turbulence, coupling efficiency can be achieved with small fiber cores, making the problem of detector utilization efficiency more serious. Therefore, at present, the method to enhance the observing quantity mainly relies on building more telescopes and terminal instruments, which will also exponentially increase costs, making it equally unacceptable. To solve this problem, this research uses dense waveguide photonic chips as the multi-object input mechanism and verifies in experiments that this device can effectively reduce the influence of large fiber cladding on fiber spatial arrangement, improving the detection efficiency of multi-object spectroscopy by at least four times, and the chip's optical efficiency can be greater than 90%. The waveguides used in this paper adopt mature planar waveguide technology, combined with end-face coupling technology of fiber-optic-waveguide, have the potential for large-scale production, and do not incur additional technical costs. Since all input channels are integrated into the chip, all target spectra have negligible relative spatial movement on the detector, making the relative spectral drift between different channels almost zero, improving the wavelength accuracy or radial velocity detection accuracy.In addition, based on waveguide rearrangement, multi-object spectroscopic detection also has advantages in two-dimensional layout and greater design freedom, providing a competitive multi-object input mechanism solution for extremely large-scale observation, especially for spatially large-scale spectroscopic surveys or integral field astronomical observation.
May. 25, 2023Vol. 52 Issue 5 0552212 (2023)
Feiyang SHA, Yu LIU, Xuefei ZHANG, Tengfei SONG, Hongqi ZHANG, Yongfeng WANG, and Mingzhe SUN
The solar corona is the outermost layer of the solar atmosphere, consisting of thin, highly ionized and hot plasma. In visible light, the solar corona is much dimmer than the photosphere, only one millionth as bright, so it is not visible in daylight. The only exception is during a total solar eclipse, when the moon blocks the light from the photosphere completely and reveals the corona. The coronagraph is a special telescope that can observe the solar corona even in the absence of a total solar eclipse. It creates an artificial eclipse by using an occulter to block the bright photosphere. Depending on the location of the occulter, there are two main types of coronagraphs: externally occulted and internally occulted. The externally occulted coronagraph blocks the direct sunlight with an occulter in front of the objective lens, but it also causes some vignetting in the field of view, which affects the quality of the observations. The internally occulted coronagraph has the occulter behind the objective lens, however, this means that some parts of the telescope, such as the objective lens and the tube, are exposed to direct sunlight and produce a lot of stray light, which needs to be strictly suppressed.We performed an experiment to explore how the amount of dust on the objective surface affects the intensity of the scattering background in the coronal image plane. We used the Lijiang 10 cm Lyot Coronagraph (Yunnan Observatories Green-line Imaging System, YOGIS), an internally occulted coronagraph that operates at a wavelength of 530.3 nm and has a main focal length of 1490 millimeters. YOGIS is a joint project between the Yunnan Observatories and the National Astronomical Observatory of Japan, and it is the only ground-based coronagraph in China that can perform regular observations, which has a total length of nearly 3 meters and a weight of 100 kilograms, and uses a CMOS camera with 2 048×2 048. The experiment was conducted at Lijiang Observatory (E100°01′4″, N26°41′42″), which is located at an altitude of 3 200 meters and has low atmospheric scattering, making it ideal for ground-based solar corona observation. Two experimenters and one observation assistant participated in the experiment on November 17, 2022, when the sky was clear and cloudless.The main goal of the experiment is to obtain dust information and measure its impact on the coronal image, called scattering background.To obtain dust data, we need the conjugate imaging of the objective lens. We achieve this by pointing the coronagraph at the sun and placing the camera at lens' focal plane. The resulting image has three parts. Firstly, light scattered by surface microroughness, which remains constant regardless of the cleanness level. Secondly, light scattered by dust particles on the objective surface, which varies depending on how clean it is. Finally, the light scattered by the earth's atmospheric is scattered by surface microroughness and dust particles, which is negligible compared to the second part. We use Otsu's method to process the image into binary pixels that show each particles' area, which tell us about its area and intensity. Assuming that the dust is distributed evenly on objective surface, we use total intensity (I) as a measure for dust information.To get the scattering background, we take two images of corona: one before and the other after cleaning the objective surface, and then align and subtract them. To account for the change in solar brightness, we normalize the two images by dividing them by their respective solar radiation intensities before subtraction.Based on the above two aspects, we conducted the experiments with the following steps. Firstly, we imaged lens and corona with significant dust on objective surface. Then we cleaned it and imaged again. This gave us scattering background and its related dust scattering points' intensity (I). Then, we converted this image into polar coordinates and took median intensities for each radius. This showed us that the scattering background decreased linearly with distance. We also saw that the slope and intercept of this linear equation depended linearly on dust intensity (I). Hence, we derived the function of the scattering background with respect to the distance and the total intensity of the scattering points (I).We can use these relationships to create different scattering background based on different intensities (I), and then subtract them from the corresponding coronal images to get the corrected ones. Our model is validated by comparing the intensity decay curves of the corrected coronal images with those of the clean images, which are similar. Our method not only effectively improves the quality of coronal data, but also makes faint coronal structure more prominent and clearer, which helps us to obtain more accurate results when analyzing the intensity decay trend of the inner corona and coronal structure changes. What's more, it will help us to further understand the effects of other stray light sources inside the coronagraph, helping the further technological development of large-aperture coronagraphs.The stray light of the internally occulted coronagraph can be divided into two parts: fixed and variable. The former does not change with time and environmental cleanliness, while the latter increases with decreasing environmental cleanliness. For the ground-based internally occulted coronagraph with regular observations, the scattering from dust on the objective surface is the variable stray light, as the dust continues to accumulate on the surface. Although the accumulation can be slowed down by frequent cleaning of the objective surface and the level of this stray light can be suppressed, the objective surface cannot be guaranteed to remain clean throughout the observation due to weather, atmospheric particle pollution and other factors. More importantly, this approach is somewhat subjective, as the observer cannot directly assess the current level of mirror cleanliness, resulting in an untimely cleaning and multiple disassembly of the objective lens, creating secondary contamination on the objective surface to some extent. So, the stray light levels are changing over time, leading to different amounts of scattered background in the coronal data, which brings great inconvenience in the analysis of the faint coronal structure and the coronal intensity calibration.
May. 25, 2023Vol. 52 Issue 5 0552213 (2023)
Yue DING, Hongxin ZHANG, Yupeng HUANG, Taisheng WANG, and Wenbin XU
Coronal is the outermost layer of the solar atmosphere, which ranges from the chromosphere across several sun radii. Coronal Mass Ejections (CMEs) eject large amounts of magnetized plasma from the sun's atmosphere into interplanetary space, resulting in massive solar explosions. Especially when CMEs spreads to the vicinity of the earth, they will produce geomagnetic disturbances such as geomagnetic storms, ionospheric storms, auroras, which have a destructive impact on satellite operations and ground infrastructure, and are one of the main driving sources of disastrous weather in space. The corona has long been studied internationally. Observations of the corona and coronal mass ejections help to study the effects of the sun's magnetic field on the earth. Meanwhile, they can monitor the severe space weather events affecting the earth and solar-terrestrial space. To realize the corona and coronal mass ejections observation better, and make more precise observation angles. The solar alignment system is designed in this paper. The entrance pupil diameter of the system is 40 mm, the focal length is 360 mm and the field of view is 2 degrees. With alignment system imaging to the sun, the center coordinates of the solar image on the detector are read through the program, so as to judge whether the coronagraph is aligned with the sun, and the observation Angle of the coronagraph is adjusted according to the coordinate offset calculation. The solar alignment system was applied to the three-disk externally occulted coronagraph for the experiment. The main parameters of the coronagraph are as follows: the field of view is ±20 degrees; the pixel resolution is 1.2 arcmin; the pixel size is 13.5 μm; the wavelength is from 630 nm to 730 nm; the effective F-number is 4; the focal length is 38 mm; and the transfer function is greater than 0.6. Compared with the brightness of the solar photosphere, the brightness of the corona light is very weak, so the suppression of stray light is the key problem of the coronagraph system. Based on the observable range of field of view and corona brightness curve, the design requirements of stray light suppression level of coronagraph are given. The suppression ability of diffraction of external occulter was compared between single-disk occulter and three-disk occulter. The comparison chart of diffraction field intensity between single-disk occulter and three-disk occulter at the incident aperture is obtained by numerical calculation. Coronagraph usually works against a pure black cosmic background. When conducting experiments in the laboratory, as its space is limited, the reflected and scattered light hitting the walls and reaching the camera surface can affect the stray light suppression level detection. Therefore, a black hole detection method is proposed to detect the total stray light of the coronagraph. The black hole refers to the semi-open black box with black absorbing film inside. In the range of visible light, the absorbent film has a very low reflectance and a strong ability to absorb light, which can minimize the influence of ambient light during the experiment. Finally, the detection device is built, the camera is used to shoot the direct solar light image and the stray light image of the system, and the gray value is read in the software to calculate the stray light suppression level. The experimental results show that the pointing accuracy of the coronagraph reaches 0.11', the diffraction stray light of the three-disk occulter is lower than the diffraction stray light of the single-disk occulter, and the suppression level of the total stray light of the coronagraph reaches 10-13 orders of magnitude. The stray light detection method has good results and high accuracy, and the alignment system has realized its expected function.
May. 25, 2023Vol. 52 Issue 5 0552214 (2023)
Fan WAN, Yue ZHONG, Zhongquan QU, Zhi XU, Hui ZHANG, and Yang PENG
To measure the phase retardance and the fast-axis position angel of non-achromatic waveplates accurately, a high-precision measurement system is established based on the fitting light intensity method and spectral analysis method, which can realize the high-precision measurement of the retardance of non-achromatic waveplates at 0°~360°. The measuring system is composed of a white light source, an aperture diaphragm, a narrow band filter, a Glan Taylor prism as polarization generator, a non-achromatic waveplate to be measured, a Glan Taylor prism as polarization analyzer, an optical power meter or spectrometer. When the phase retardance and the fast-axis position angel of non-achromatic waveplates are measured by the fitting light intensity method, the white light emitted by the white light source is collimated parallel by the collimating system, then it passes through an aperture diaphragm, a narrow filter and a polarization generator, which is modulated into monochromatic linearly polarized light. Next the linearly polarized light goes through the waveplates and the polarization analyzer, is finally received by the optical power meter. During the whole measuring process, the high precision motor drives non-achromatic waveplates that are to be measured to rotate uniformly. However, in the measurement process of spectral analysis measuring method, it is necessary to move the narrow filter out of the optical measurement path, and replace the power meter with the spectrometer as the terminal detection device, in this case, non-achromatic waveplates are not needed to rotate by the motor. Before the formal measurement of the retardance and the initial fast-axis position angle of waveplates, the stability of the measurement system and the sources of measurement errors are analyzed in detail in this paper. Under the light intensity measurement method, the influence of random errors such as light source intensity jetter, the initial fast-axis position angle and the rotating position angle of the rotating waveplate and some system errors like nonlinear effects of photoelectric response of the powermeter and deviation of collimated beam is simulated. And the reason why the fitting light intensity method can not measure the retardance at 180° of non-achromatic waveplates accurately is also analyzed detailly. Under the simulation of the spectral analysis method measuring the retardance of waveplates, we also simulate the influence caused by some random errors such as light source intensity jetter, wavelength monochromaticity and motor positioning errors. Then we suppressed the random errors mentioned above in the two measurement methods in the laboratory. And the nonlinear effect of the photoelectric response of the detector is also corrected. Finally, we measured the non-achromatic λ/4waveplate, 0.356λ non-achromatic waveplate and λ/2 non-achromatic waveplate at 632.8 nm by using this measurement system, and the measuring data were fitted by the nonlinear least squares method. The results of the phase retardance and fast-axis position angle of the non-achromatic waveplates were obtained. It can be seen from the actual measurement that the measurement accuracy of the retardance of the λ/4 waveplate and 0.356λ waveplate by the fitting light intensity method is relatively high, and the measurement error is less than 0.05°. The measurement accuracy is more than one order of magnitude higher than the traditional light intensity measuring method. Moreover, the measuring device of the fitting light intensity method is simple,fast and easy to operate. For the non-achromatic λ/2 waveplate, the spectral analysis method is adopted to measure the retardance under this system. in this case, the terminal device performed by the powermeter in the fitting light intensity method is switched by the spectrometer and Charge Coupled Device camera. And the narrow band filter is also removed in the light path. From the measurement results, we can know that the measuring error of the retardance is less than 0.02° by this measuring method, which is much smaller than the 0.70° of measuring error caused by the fitting light intensity method. So the spectral analysis method overcomes the defect that the retardance at 180° of the non-achromatic λ/2 waveplate can not be accurately measured by the light intensity method. Therefore, the phase retardance of non-achromatic waveplates from 0°to 360° and the fast-axis position angel can be measured accurately by the measurement system designed in this paper, which provides the basis for the accurate measurement of the polarimeter.
May. 25, 2023Vol. 52 Issue 5 0552215 (2023)
Liang TANG, Huiqi YE, Zhibo HAO, and Dong XIAO
In this paper, the influence of mirror parameters, fiber type and positioning error on the collimation quality of an off-axis parabolic reflective fiber collimator is simulated and analyzed. Compact off-axis parabolic reflective collimators with achromatic performance are widely deployed in optical systems requiring polychromatic illumination. For optical systems demanding a high level of long-term stability, fiber feeding allows for rigidification of the optical pathway, repeatable plug-in performance, and tight environmental control of the optomechanical assembly. However, light launched from the fiber end surface cannot be viewed as a perfect idealistic point source when high collimation quality is required. Different fiber core sizes, changes in far and near field energy distributions, and varying positioning errors may all affect the quality of the exit beam. From a geometric point of view, compared with axially symmetric transmissive fiber collimators, the response characteristics of the reflective off-axis parabolic collimator are more complex. Certain applications, with Fabry-Perot calibration sources for high-precision radial velocity observation and astronomical spectral calibration as a good example, are highly sensitive to changes within the angular energy distribution of the illumination condition. The radial velocity method is an important method for exoplanet detection. It measures the wavelength position changes over time of characteristic spectral lines in the star spectrum, possibly due to gravitational motions from accompany bodies. To enable detection of exoplanets residing in the habitable zone, it is necessary to achieve radial velocity measurement precision at m/s level or higher by means of simultaneous comparison with a high-precision calibration source. Fabry-Perot calibration sources have the advantages of broadband spectral coverage, uniform spectral line distribution, and robust performance for long-term continuous operation. When used in cooperation with traditional calibration sources such as thorium-argon hollow cathode lamps, it can significantly improve the wavelength calibration accuracy of high-resolution astronomical spectrographs. However, the Fabry-Perot calibration source requires the output spectrum peak to be maintained at an extremely high stability level (1 m/s change in peak position corresponds to 3.3×10⁻⁹ fractional drift in spectral line center). Faced with the challenges of wide operating band and extremely high spectral stability for high-precision radial velocity measurement, it is necessary to perform thermal-vacuum environmental control on the core Fabry-Perot etalon. Reflective off-axis parabolic fiber collimators are thus an ideal structure for coupling light into the Fabry-Perot etalon through the vacuum vessel. Yet, to the best of our knowledge, there is still a lack of relevant literature reports on the characteristics of collimation quality degradation caused by fiber positioning errors in those collimators. This paper navigates around the application requirements of the newly emerged Fabry-Perot astronomical spectral calibration system and jointly analyzes the experimentally measured fiber output results and the mathematical model of the off-axis parabolic mirror, to assess the response in collimation quality in regard to different system characteristics. Raytracing simulation studies are carried out in order to determine the influence of different input fibers and fiber positioning errors on the collimation characteristics of off-axis parabolic reflective collimators. It is derived that with the same collimator parameters, the larger the input fiber core diameter, the more sensitive it is to rotation positioning errors, and the smaller the input fiber core diameter, the more sensitive it is to shift positioning errors. Under the same reflective focal length, pointing of the collimated beam is less sensitive to fiber positioning errors when the collimator is of larger off-axis angle and shorter parent focal length, while the angular energy distribution of the collimated beam is less sensitive to errors when the collimator is of smaller off-axis angle and longer parent focal length. For applications that require higher parallelism and pointing stability of the outgoing light, an off-axis parabolic collimator with a large off-axis angle should be used under the condition of a certain reflective focal length. For applications that require higher stability of the angular energy distribution of the outgoing light, such as the Fabry-Perot spectral calibration system, off-axis parabolic collimators with small off-axis angles and long parent focal lengths should be selected within the allowable size constraints. For practical cases, system size, clear aperture limitations, machining and assembling tolerances, and other application-specific requirements also need to be considered.
May. 25, 2023Vol. 52 Issue 5 0552216 (2023)
Honglin ZHANG, Zhitao YANG, Yusa WANG, Zijian ZHAO, Jia MA, Dongjie HOU, Xiongtao YANG, Yuxuan ZHU, Yanji YAN, Yong CHEN, and Shijie WANG
One of the crucial components of an X-ray focusing lens's performance test is effective area calibration. The focusing lens will be calibrated on the ground before being launched into space. The X-ray source can't achieve the ideal condition of an incident on the mirror in parallel due to the distance restriction of the ground experimental device, so its calibration results will be different from those in orbit. In order to understand and correct the discrepancy between the effective area of the Wolter-Ⅰ X-ray focusing lens in ground calibration and in-orbit calibration, the effective area of the X-ray telescope carried by the Einstein probe was simulated and analyzed under two calibration conditions. The ground calibration experiment of effective area was carried out in the 100-meter X-ray calibration device of the Institute of High Energy Physics, Chinese Academy of Sciences.First, prior to designing the light source, the calibration model is created, then the incident conditions of on-orbit and ground light sources are taken into consideration. The program makes use of X-ray sources with energies of 1.49 keV, 4.5 keV, and 8.5 keV. Second, the light source used for the on-orbit calibration can be thought of as a parallel light source while the light source used for the ground calibration can be considered a point source. The effective area of the focusing lens under the two calibrations is determined using the two incident light sources to mimic the ground calibration and the on-orbit calibration, respectively. The deviation percentage of their effective areas is determined using the simulation data. To determine the connection between the effective area and the off-axis angle, the off-axis analysis of the focusing lens's effective area is performed within 1°, and the change diagram of the off-axis effective area is drawn. Lastly, the ground calibration experiment is run in the Institute of High Energy's 100-meter calibration device. The effective area of the focusing lens is determined using the photon count on the monitor before and after the addition of the focusing lens in the experiment, which employs continuous spectrum X-rays. The useful area is corrected based on the simulation-derived deviation ratio. In a similar manner, the off-axis experiment is conducted within 1, and the change diagram of the experiment's off-axis effective area is made.The findings indicate that when the X-ray energy is 1.49 keV, 4.5 keV, and 8.5 keV correspondingly, the effective area of ground calibration is 2.7%, 3.0%, and 4.0%, bigger than that of on-orbit calibration. The difference between them increases with increasing X-ray energy. This phenomenon is compatible with the energy-dependent decrease in X-ray reflectivity. In the simulation and experiment, the off-axis angle affects the focusing mirror's effective area, which falls by 20% when the off-axis angle approaches 10'. The research presented in this paper demonstrates that the effective area of ground calibration is always greater than the effective area of on-orbit calibration and that the effective area of on-orbit calibration of the focusing lens can be predicted using ground calibration data combined with simulation. The off-axis effective area of the focusing lens also demonstrates a clear relationship with the off-axis angle. This study's methodology can offer data references for the Wolter-Ⅰ focusing mirror-equipped X-ray astronomy satellite's effective area calibration.
May. 25, 2023Vol. 52 Issue 5 0552217 (2023)
Sheng BAO, Zhiying LIU, Yunhan HUANG, and Zhen ZHANG
In order to obtain a panoramic image of the inner wall of the pipeline with a large field of view, this paper uses a catadioptric panoramic optical system to achieve the panoramic imaging of the inner wall of the pipeline. However, most of the traditional catadioptric panoramic optical systems focus on the rear view, which will lead to the instability of the image distance plane of the system and the excessive pressure of the relay system. In addition, for the field of pipeline inner wall imaging, the angle between the main ray of the rear view field and the surface of the pipeline inner wall is too large, which will lead to serious information loss of the pipeline inner wall. However, the catadioptric panoramic imaging system designed in this paper pays more attention to the side view in order to obtain the information of the inner wall of the pipeline, and takes the vertical optical axis as the reference, with the pitch angle of ±25°, which is, the panoramic field of view of 360°×(65°~115°), which avoids the above problems. The mirror unit of the traditional catadioptric panoramic optical system mainly adopts even aspheric surfaces. However, due to the non orthogonality between its various coefficients, the mutual interference and even cancellation between the various coefficients, and the seriously small order of magnitude of the coefficients, the problem of low optimization efficiency of the optical system is extremely prominent. In this paper, through the study of Q-con function polynomials in three kinds of Q-type function polynomial theories, it can be seen that, compared with even aspheric surface, the base polynomials of Q-con function polynomials are orthogonal to each other, which avoids the problems of redundant interference, precision loss and numerical ill-condition caused by non-orthogonal, and provides more significant figures, improving the optimization design efficiency and machinability of an optical system. Based on the imaging principle and characteristics of the catadioptric panoramic optical system, combined with the special requirements of the panoramic imaging of the inner wall of pipeline, the relevant parameters of catadioptric panoramic optical system are formulated, and the size relationship of catadioptric panoramic optical system was analyzed. Based on the imaging characteristics, the design method of catadioptric panoramic optical system is analyzed, that is, the design method of constructing mirror unit and relay system respectively, field curvature compensation and splicing optimization. On the basis of the analysis of Q-con surface expression, this paper proposes to apply Q-con aspheric surface to the mirror element of the catadioptric panoramic optical system. The design of Q-con aspheric mirror element is analyzed, the fitting replacement and optimization method of Q-con aspheric surface of mirror element is put forward, and the catadioptric panoramic optical system based on the Q-con aspheric surface is designed. Finally, the field of view of the catadioptric panoramic optical system is (65°~115°)×360°, having a focal length of 1.24 mm, F number of 3.5, and a total length of 100 mm. The system consists of one mirror and eight lenses, in which the mirror unit adopts Q-con aspherical type, and the rest of the lenses are spherical. The Modulation Transfer Function (MTF) is greater than 0.4 at the Nyquist frequency of 93 lp/mm, and the imaging quality is close to the diffraction limit. In order to verify the advantages of Q-con surface in the design of catadioptric optical system compared with even aspheric surface, an even aspheric catadioptric panoramic system with the same parameters as Q-con aspheric catadioptric panoramic system was actually designed, and the two were analyzed and compared. The results show that compared with an even aspheric surfaces, the polynomial coefficients of Q-con aspheric surfaces are 5~17 orders of magnitude more than those of the corresponding even aspheric surfaces, which not only effectively improves the system design efficiency, processing and testing accuracy, reduces the cost, but also achieves the design results with higher image quality and smaller aperture.
May. 25, 2023Vol. 52 Issue 5 0552218 (2023)
Hongyan DENG, Yun SU, Guoxian ZHENG, Ming ZHAO, Yue ZHANG, and Zhiming TIAN
There are a large number of communication satellites and abandoned satellites in the geostationary orbit. High-resolution all-time imaging of space targets can afford useful information such as target fine structure, star attitude and working situation. Fine detection of large space debris also can provide some information for spacecraft rapid evasive. But the traditional passive space target detection payload is mainly faced with some problems. For example, the single-aperture imaging system has difficulties in optical processing and is limited by rocket carrying capacity. The space block deployable imaging system and passive optical synthetic aperture imaging system have sub-mirror shape control and phase adjustment problems. In addition, the film diffraction imaging system has serious chromatic aberration, resulting in poor imaging quality. Moreover, the night high resolution imaging ability of infrared payload is insufficient. So it is of great significance to carry out research on new space-based space object detection technology, realizing high-resolution and all-time detection of the space object. In this paper, a new type of active coherent optical synthetic aperture super-resolution imaging space object detection system is proposed based on the theory of macro-reflection Fourier ptychographic imaging. The theoretical model of macro reflection active coherent optical synthetic aperture super-resolution imaging based on light source scanning is shown. Then a general idea of "large field of view search imaging guide and small amplitude width active coherent optical synthetic aperture super-resolution imaging" is proposed. Where the large field of view search imaging system carried by the satellite platform provides pointing information of the target, the small amplitude width active coherent optical synthetic aperture super-resolution imaging system captures and aims the target under the guidance of the steering mechanism of the satellite platform. Then super-resolution imaging is performed. The small amplitude width active coherent optical synthetic aperture super-resolution imaging system is the main component of the space-based space object detection system. It includes an active coherent light generation unit, an optical imaging unit and an image super-resolution reconstruction unit. The macro reflective active coherent optical synthetic aperture system under a camera scanning mode requires frequent maneuver of the payloads, rapid attitude adjustment and high precision pointing. Considering the feasibility of space-based applications, a light source scanning mode is chosen instead of camera scanning mode. The operating principle of the new type of active coherent optical synthetic aperture super-resolution imaging space object detection system is as follows. The active coherent optical synthetic aperture super-resolution imaging space object detection system mainly adopts two working modes: global detection and regional detection. When it takes global detection mode, the space-based space object detection system operates at an orbit lower than the GEO, with a typical value of GEO-150km orbit. The space object detection system achieves tracking and imaging of global targets at GEO through relative drift of forward position. When it takes regional detection mode, the space-based space object detection system operates at an orbit higher than the GEO, with a typical value of GEO+150 km orbit. The space object detection system carries out the round-trip detection of a given area by forward drift, backward drift, ascent and descent movements formed by the altitude difference with the GEO orbit, so as to realize the tracking and imaging observation of the target in the corresponding area. Specifically, the near-infrared active lighting source is adjusted by the optical phased array, and then the sequential output of each beam is realized through computer program control. Due to the difference of orbital altitudes, a speed difference is produced between the active coherent optical synthetic aperture super-resolution imaging space object detection system and the target. In order to ensure the uniform scanning of coherent beams against the target, the system position feedback corrector is used to calibrate the beam scanning in real time. Then N×N frames of low resolution images are collected. Finally, the super-resolution image of space object is reconstructed from these low resolution images by using Fourier ptychographic algorithm. At the same time, a prototype of macro reflective active coherent optical synthetic aperture super-resolution imaging system is built, and some ground experiments are carried out. Results show that the system has super-resolution imaging capability. Finally, the feasibility of active coherent optical synthetic aperture super-resolution imaging technology is further confirmed. The active coherent optical synthetic aperture super-resolution imaging space object detection system proposed in this paper has all-time imaging capability. It is expected that this technology can greatly reduce the aperture requirements of space object optical detection payload and effectively reduce the difficulty of system development. It not only provides a new technical approach for space-based space object detection, but also provides a method for low Earth orbit to ground high-resolution imaging.
May. 25, 2023Vol. 52 Issue 5 0552219 (2023)
Liang ZHENG, Fan LI, Jiawei WANG, Jianbo LI, Li GAO, Ziyang HE, Xin SHANG, Wangbao YIN, Long TIAN, Wenhai YANG, and Yaohui ZHENG
The high sensitivity of gravitational wave detection provides a new way to explore the universe. Gravitational wave detection is a field of modern physics that has gained significant importance. The primary focus of space gravitational wave detection is to capture gravitational wave signals in the frequency range of 0.1 mHz to 1 Hz, which are mainly released by double compact star systems and astronomical events such as the merger of double black hole celestial bodies with a maximum mass ratio. This detection method complements ground-based gravitational wave and primary gravitational wave detection techniques. Space gravitational wave detection primarily relies on the establishment of a high-precision space inertial reference load ultra-stable platform across multiple satellites and high-precision inter-satellite laser interferometry technology as its core, including the tow-free control technology, ultra-high-precision inter-satellite laser interferometry technology, ultra-high sensitivity inertial sensing technology, precision formation technology, micro-new micro-push technology, and more. The laser source noise of spaceborne laser systems directly affects the sensitivity of ultra-high precision inter-satellite laser interferometry technology. Therefore, it is necessary to suppress laser intensity noise. Low noise laser source is essential to build a large-scale laser interferometer device for both space and ground-based gravitational wave detection. With suppressing the noise of the laser source by photoelectric feedback, the sensitivity of the gravitational wave detection device is improved. In the photoelectric feedback loop, the signal detected by the photodetector is first subtracted from the signal of voltage reference source, after passing through the proportional integral differentiator, it is then fed back to the pump photocurrent to suppress the noise of the laser source. During the feedback process, the photoelectric detection is the first stage to acquire the signal, the noise level of the photodetector will directly affect the performance of subsequent feedback loop. To improve the accuracy of the detection and level of the noise suppressing, the electronic noise of the photodetector must be restrained while the detection range must be expanded. To deal with the problems mentioned above, the photodetector with low noise is finally designed by choosing low noise voltage reference chip, low dark current photodiode, using low temperature drift factor element, designing transimpedance amplifiers circuit together with precise temperature controlling and electromagnetic shielding. Photodiodes need to be loaded with appropriate reverse bias for photoelectric conversion. The voltage stability of the reverse bias will directly affect the stability of photoelectric conversion in the photodiode, thus affecting the electronic noise of the photoelectric detection system. At the same time, the electronic noise of the photodetector is measured using a low noise power supply without a light source, and the electronic noise of the detector is tested using a high-precision multimeter. The performance of the designed photodetector is evaluated with the low frequency intensity noise evaluation system. The results show that the electronic noise spectral density of the detector is less than 1.649×10⁻⁵ V/Hz1/2,1.649×10-5 V/Hz1/2 at 0.1 mHz,6.95×10-6 V/Hz1/2 at 1 mHz,7.07×10-8 V/Hz1/2 at 1 Hz at the frequency of the space gravitational wave band. The gain of the photodetector is 40 dB with 8 mW laser injecting into the photodiode. The performance of the designed photodetector satisfies the requirement of laser noise suppressing for gravitational wave detection. In order to characterize the relative intensity noise of a laser light source and address the need for noise suppression in space gravitational wave detection, a system is developed to evaluate laser intensity noise for this purpose. This system includes a key device in the feedback loop for suppressing relative intensity noise within the frequency band of space gravitational wave detection: a low noise photodetector. Such photodetector plays a crucial role in the devices of laser noise suppressing for gravitational wave detection.
May. 25, 2023Vol. 52 Issue 5 0552220 (2023)
Yi HUANG, Kan WU, Zeyu XIAO, Tieying LI, Minglu CAI, and Jianping CHEN
Optical frequency comb is a kind of multi-wavelength laser source with uniform and coherent frequency lines. Recently, the application of optical frequency comb in different fields has been expanding, such as spectroscopy, atomic clock, optical communication and microwave photonics. In the past decades, there are three main methods to generate optical frequency comb: firstly, optical frequency comb is generated by model locked lasers with a fixed repetition frequency. However, this method is limited by the model locked lasers, and it has small adjustable range and inflexibility. Secondly, optical frequency comb is generated on micro ring or cavity with great Kerr nonlinearity on chip, and the micro ring and cavity are easily affected by temperature in this method. Third, optical frequency comb is generated by electro-optic modulation using electro-optic effect. This method is generally used to generate optical frequency comb outside the chip due to the limitation of electro-optic modulator. Supercontinuum traditionally is generated by inputting MHz femtosecond pulse into a highly nonlinear waveguide to broaden its spectrum. Recently, lithium niobate materials stand out among many materials because of its strong linear electro-optic effect and high modulation bandwidth. With the integrated lithium niobate modulator, ultra-low optical loss, high modulation bandwidth and low RF drive voltage can be achieved simultaneously. Moreover, integrated lithium niobate has become an ideal platform in nonlinear optics because of its large second-order nonlinear index and high third-order nonlinearity. In this paper, we use the push-pull Mach Zehnder modulation and a cascade phase modulator integrated on the lithium niobate platform to generate optical frequency comb, and then let the signal go through a dispersion compensation module to compress the time domain waveform into a femtosecond pulse. At last, the signal is input into the lithium niobite waveguide which has great second-order nonlinear and third-order nonlinear to generate the second harmonic in the waveguide. Then the second harmonic interferes with the fundamental wave to generate a supercontinuum spectrum. In this paper, our mathematical model includes both second-order and third-order nonlinear, and the process of generating the second harmonic and supercontinuum spectrum is simulated in numerical simulation. Firstly, we use the cascade lithium niobite to generate a pulse with 180 fs pulse width and 126.4 pJ energy. Then this femtosecond pulse is input into the lithium niobite waveguide to generate the supercontinuum spectrum by the nonlinear effect of lithium niobite. We analyze the spectrum evolution under different energy of input pulse. In the simulation, we discuss the appearance of dispersion wave in the process of supercontinuum. Then we make a simulation on smaller modulation depth in order to get a wider pulse signal, and observe the effect of different input energies on supercontinuum broadening under this modulation depth. Comparing the energy required for the supercontinuum broadening of the optical spectrum with the modulation depth of 21π and 28π, it can be found that the wider the pulse width is, the narrower the 10 dB bandwidth of the spectrum is, the higher the energy required to generate the supercontinuum spectrum is. Moreover, when the modulation depth is 21π, the spectral width is about 75% of the modulation depth of 28π, and the pulse width is about 1.25 times of the modulation depth of 28π. However, after passing through the same section of waveguide, the supercontinuum spectrum also needs about 3 times of the energy when the modulation depth is 28π. Therefore, we believe that the pulse width, namely the width of the spectrum, has a greater impact on the supercontinuum broadening of the signal spectrum than the energy of the input pulse. This work lists the pulse width, spectrum width and input energy of input pulse when the supercontinuum spectrum is generated in different modulation depths. At last, we also observe the relationship between the pulse width and input energy in a figure, and conclude that the input energy will increase approximately square with the decreasing of pulse width.
May. 25, 2023Vol. 52 Issue 5 0552221 (2023)
Zhifei LI, Rufeng TANG, Dongsheng ZHAI, Zhulian LI, Honglin FU, Kai HUANG, Jin CAO, and Yuqiang LI
Satellite laser ranging is one of the most accurate astronomical and geodynamic measurements. At present, the detectors used by most stations in the world are single-photon avalanche diodes. Due to the detection characteristics of single-photon avalanche diodes, energy fluctuations will cause walk errors in each ranging data during every daily observation. The existence of walk error limits the development of satellite laser ranging to higher precision, so it needs to be studied. This study first introduces the detection principle of single photon avalanche diodes, and explains why walk error exists in single photon avalanche diodes: the fluctuation of the number of echo photons. Secondly, based on the detection principle of the single photon avalanche diode, the theoretical calculation of the walk error and the calculation method of the photon number of the laser ranging echo are deduced. The method for calculating the number of photons can calculate the number of echo photons corresponding to the satellite laser ranging original data. According to the data processing protocol of satellite laser ranging, the data processing of satellite ranging data should be combined with the ground target ranging data. However, satellite echo photon numbers and the ground target echo photon numbers cannot be guaranteed to be strictly consistent, so there will still be walk error in the processed data. The simulation result of laser ranging of LAGEOS satellite and ground target can show the difference in echo photon numbers and walk error of two targets, which can explain the question above.Furthermore, a compensation method for the walk error of the satellite laser ranging measured data combined with the theoretical model is proposed. The operation process of the method is as follows: first, signal identification, photon number calculation, and walk error calculation are performed on the ground target laser ranging data; then, signal identification, photon number calculation and walk error calculation are performed on the satellite laser ranging data; at last, the difference between the two walk errors is added to the satellite laser ranging results. Combining the proposed method of calculating the number of echo photons with the simulation based on the 53 cm binocular laser ranging telescope of the Yunnan Astronomical Observatory of the Chinese Academy of Sciences, the calculation results of the echo photons numbers are obtained. Then we apply the walk error compensation method to the data processing process of the corresponding data. In this way, walk errors in the satellite laser ranging data can be compensated. We select the satellite laser ranging data from the laser ranging data of 6 satellites to practice this method and analyze the results. The data is part of the laser ranging data of Ajisai, Jason-3, KOMPSAT-5, LARES, Stella, and Swarm-B from 2017 to 2022. Among them, the five-year average compensation value of Ajisai is 41.9 ps (1.257 cm), Jason-3 is 28.5 ps (0.855 cm), KOMPSAT-5 is 28.7 ps (0.861 cm), LARES is 34.7 ps (1.041 cm), Stella is 22.6 ps (0.678 cm), Swarm-B is 450.7 ps (13.521 cm). At the same time, the maximum correction value appeared in the Swarm-B ranging data on January 5, 2020, which was 770 ps. This means the data exists a distance deviation of 23.1 cm. The reason is that Swarm-B satellite owns a low orbit altitude and its running speed is fast, which lead to low tracking accuracy of the telescope. As a result, the echo photon numbers will fluctuate more than other High-Orbit Satellite. In this study, we analyze and study the cause, simulation of walk error and how to compensate for it. The results show that using the proposed walk error compensation method in this study to process satellite laser ranging data can reduce the distance measurement value fluctuation caused by the fluctuation of the number of echo photons in the laser ranging data of each satellite. As a result, it can correct walk errors caused by energy changes in the data and improve data quality.
May. 25, 2023Vol. 52 Issue 5 0552222 (2023)
Qingsheng XUE, Haoxuan BAI, Fengqin LU, Jingyao YANG, and Hui LI
With the development of the hyperspectral imaging technology, it has been widely used and convinced as a useful detecting tool in many areas such as medical area, food safety and mineral exploration. But most of the hyperspectral imagers used nowadays are based on push-broom spectral imaging technology, which achieve spectral imaging through moving the spectral imager by scanning structure. The time resolution is sacrificed to obtain rather good spectral and spatial resolution in this kind of spectral imaging way. And that means the dynamic target and process can not be detected by this kind of hyperspectral imagers, so the application range of this kind technology is limited largely. Due to the defects mentioned above, a snapshot hyperspectral imager based on microlens array is developed in this paper. The principle of the instrument developed is introduced in this paper. Then the imaging principle of the microlens is introduced based on geometrical optics. The signal-to-noise calculation model of the hyperspectral imaging system based on microlens is then derived according to the imaging characteristics of this kind of system. Based on these theories derived above, the optical system is designed. The detector and the microlens were first determined before the optical design job begin. The detector has 2 048×2 048 pixels with a pixel size of 5.5 μm×5.5 μm. And the microlens array is composed of 100×100 microlens. The size of each microlens is 100 μm, and the focal length of the microlens is 0.5 mm. According to the microlens size and the detector size, the wavelength range of the whole system is determined as 500~700 nm. An objective lens is first designed, the F number of the objective is determined as 60 according to the calculation result, and the field of view of the objective lens is 36°.The objective lens has a telecentric feature on image side. Then the spectral imaging system is designed. The F number of the spectral imaging system is determined as 5 according to the F number of the microlens. A double amici prism is designed and used as the dispersion element in the spectral imaging system. The collimating lens and imaging lens in the spectral imaging system are symmetrical to eliminate the vertical aberration in the system and make the fabrication of the lens simpler. A simulation is taken after the design work has been finished. A prototype is set up in the laboratory according to the simulation result, and several performance verification experiments are taken to test the imaging and spectral performance of the system. The spatial and spectral calibration of the system are first taken. According to the calibration result, the monochromatic images of different bands can be extracted. To test the spectral resolution of the whole system, a mercury lamp is used to illuminate the system. And according to the test result, the spectral resolution of the system is 2.034 nm at 546.08 nm and 7.052 69 nm at 696.54 nm. A special target is used to test the spatial resolution of the whole system. According to the test result, the resolution of the whole system is 2.2 mm when the object distance is 1.1 m. Then a board with different color blocks and a standard white board are used as the target and detected by the whole system. Then the reflectance curves of different color blocks are calculated, which match the reflectance curves obtained by a commercial spectrometer. The test results show that the system has a good spectral and relatively good spatial detection capability. Comparing to the traditional push-broom spectral imager, the built system can improve the detecting efficiency of the spectral imaging detection, reduce the volume of the whole hyperspectral imaging system, and expand the application range of hyperspectral imaging technology.
May. 25, 2023Vol. 52 Issue 5 0552223 (2023)
© Copyright 2018-2021 | Chinese Laser Press.
All Rights Reserved 沪ICP备15018463号-20