


 View fulltext
Zhoulin DING, Yongji YU, and Xiaoqing LI
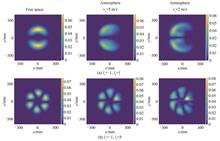
Bessel-Gaussian beams have potential applications in laser atmospheric engineering applications such as directed energy and space optical communication. The influence of the thermal blooming effect on composite Bessel-Gaussian (cBG) beams propagating in the atmosphere is studied using the multi-phase screen method and the fast Fourier transform to solve the thermal blooming equation. The Fast Fourier Transform (FFT) is capable of processing the propagation between the phase screens. Consequently, the propagation process of the cBG beam from zn to zn+1 can be divided into three steps: the first step is the vacuum propagation Δz/2 via the fast Fourier transform; The second step is the phase change caused by the atmospheric refractive index fluctuations; The last step is the remaining vacuum propagation Δz/2 via the fast Fourier transform again. Thus, the atmospheric propagation of the beam is converted into the propagation between the multi-phase screens, and the phase screens represent the disturbance of thermal blooming on the beam. Based on the above method, a 4D computer code is designed to simulate the time-dependent propagation of cBG beams in the atmosphere. To be convenient to analyze the thermal blooming effect of cBG beams, we provide the expression for the amplitude factor. Considering both the diffraction of the optical field and the time scale of the thermal blooming effect, we study the beam distortion, orbital angular momentum spectrum, and mode crosstalk of cBG beams under the thermal blooming effect. Due to the wind-dominated thermal blooming effect, the phase singularity positions cBG beams are irregularly shifted. By analyzing the orbital angular momentum spectrum of the cBG beam under the thermal blooming effect, we found that the energy between the initial modes of the beam is transferred to each other, producing mode crosstalk.With the increase of propagation distance or the decrease of crossing wind velocity, the strength of the thermal blooming effect increases, resulting in the enhancement of mode crosstalk. The relative crosstalk energy of the cBG beams gradually increases with time; until the absorption of beam power by the atmosphere is balanced by the heat exchange caused by the crossing wind, the thermal blooming effect reaches a steady state. The relative crosstalk energy no longer changes with time. The flow rate of a medium determines the speed of its energy transport. The thermal effects during beam propagation are stronger for lower wind speeds, resulting in stronger mode crosstalk. The relative crosstalk energy decreases with the difference value of an initial angular quantum number. Therefore, the cBG beam with a larger difference value of an initial angular quantum number has the weaker mode crosstalk affected by thermal blooming. The thermal blooming effect of rotating cBG beams is studied. A rotating cBG beam can spread uniformly in the atmosphere due to the thermal blooming effect controlled by the wind. Moreover, the mode crosstalk of rotating cBG beams is smaller than that of non-rotating cBG beams. The mode crosstalk of rotating cBG beams decreases with the difference value of radial wave number. To sum up, increasing the differences values of the initial angular quantum number and radial wave number can effectively reduce the mode crosstalk of cBG beams. The results obtained in this paper have important implications for the applications of BG beams in laser atmospheric engineering, such as directed energy and space optical communication.
Feb. 25, 2024Vol. 53 Issue 2 0201001 (2024)
Luxin DIAO, Mingjun WANG, Chaojun HUANG, Xiaohu WU, and Wei WANG
The oceans have a large amount of unexplored resources, so the exploration area of human beings is moving towards the unknown ocean as land resources are getting scarce. Underwater wireless optical communication technology with higher rates and better security has become the key to underwater environmental monitoring, wireless sensor networks, offshore exploration and communication between submarines. Vortex beams are a class of beams with helical phase wavefront carrying Orbital Angular Momentum (OAM), which have been widely used in the fields of optical communication, remote sensing and super-resolution imaging due to their specific helical phase structure and dark hollow ring light intensity distribution. The transmission of vortex beams in seawater environments is interfered by ocean turbulence, which results in light intensity scintillation, phase undulation and spot drift, which can degrade the communication quality. However, as human activities extend from free space to the marine environment, the demand for the communication capacity of underwater optical communication systems is increasing, so it is of great significance to study the coded communication of underwater vortex beams and their superposition states, and to further explore methods to suppress the effect of ocean turbulence on the transmission of the beams, for the underwater vortex optical communication systems.In this paper, power spectrum inversion method are used to establish a phase screen model of ocean turbulence, simulate real ocean turbulence, and study the light intensity and phase characteristics of Double Laguerre-Gaussian Vortex Beam (DLGVB) generated by coaxial superposition during transmission in ocean turbulence. The scintillation index of DLVGB beam under different ocean turbulence parameters and topological charge difference is simulated and analyzed. According to the scintillation index, the bit error rate of the underwater optical communication system based on On-off Keying (OOK) modulation under different ocean turbulence parameters is further calculated, and the bit error rate of the optical communication system under different topological charge difference is simulated and analyzed.The results show that the scintillation index of Double Laguerre-Gaussian Vortex Beam (DLGVB) increases with the decrease of turbulent kinetic energy dissipation rate, the increase of transmission distance, salinity temperature fluctuation equilibrium parameter and temperature variance dissipation rate. The main reason is that the intensity of ocean turbulence will gradually increase with the decrease of turbulent kinetic energy dissipation rate and the increase of salinity temperature fluctuation equilibrium parameter and temperature variance dissipation rate. Compared with the traditional Laguerre Gaussian vortex beam, the DLGVB beam with lower topological charge difference (v<10) can maintain relatively stable and low scintillation index in the environment with the increase of ocean turbulence intensity, and the scintillation index shows a trend of decreasing, then increasing and finally decreasing with the topological charge difference of the DLGVB beam, which is related to the number of splitting points of the beam and the dispersion of the energy; for the underwater vortex optical communication system, the BER decreases with the increase of turbulent kinetic energy dissipation rate and the decrease of temperature variance dissipation rate and salinity temperature fluctuation equilibrium parameter; the BER is lower when the temperature is dominant and higher when the salinity is dominant, so the communication performance is better when the temperature is dominant in the oceanic turbulence; when the topological charge difference is lower (v<10), the communication performance of DLGVB beams with different topological charge differences is better. When the topological charge difference value (v<10) is low, the communication BER of DLGVB beams with different topological charge difference values decreases with the increase of the signal-to-noise ratio, and the BER of DLGVB beams with a large topological charge difference value is smaller than that of DLGVB beams with a small topological charge difference value, so that DLGVB beams with a large topological charge difference value are selected to have a better quality of communication when the topological charge difference value (v<10) is low.Under the ocean turbulence environment, the use of DLGVB beams for transmission can effectively suppress the interference caused by ocean turbulence; when analyzing and designing the underwater optical communication system, combining vortex beams and their superposition states with the underwater optical communication based on OOK modulation, and selecting the optimal topological charge difference, can effectively improve the transmission and communication quality as well as the capacity of the communication system. The research results of this paper have important reference value for the study of transmission characteristics of vortex beams and their superposition states under ocean turbulence, as well as for the development needs and applications of continuous capacity expansion of underwater optical communication systems based on orbital angular momentum.
Feb. 25, 2024Vol. 53 Issue 2 0201002 (2024)
Calibration Method for Flickering Pixels under Compound Condition Operating Points of IRFPA Detector
Wenxin ZHAO, Xuefeng LAI, Yucheng XIA, Sujun LI, and Jinmei ZHOU
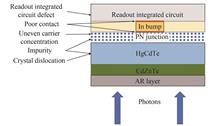
In recent years, there has been a growing demand for long-distance target detection, leading to an increased focus on dim and small target detection technology based on the infrared band. However, this technology is often plagued by false alarms caused by flickering pixels in the Infrared Focal Plane Array (IRFPA). The occurrence of flickering pixels is multifaceted, resulting from a combination of internal defects and external conditions. In practical applications of infrared systems, the detector's operating point is typically adjusted dynamically based on the target and scene, thereby altering the time-frequency characteristics of the flickering pixels. During the calibration process, a single operating point is insufficient to stimulate all flickering pixels, resulting in only a partial display of flickering pixels. Furthermore, gray-level image detection is affected by detector non-uniformity, making it difficult to detect flickering pixels with low responsivity and leading to instances of missed detection.Flickering pixels can be attributed to various internal defects, including defects in the readout integrated circuit, poor contact, uneven carrier concentration, impurities, crystal dislocation, and so on. Additionally, external stress variations also contribute to the occurrence of flickering pixels. The temporal characteristics of flickering pixels are jointly determined by internal defects and external stress conditions. The complex mechanisms of these defects and the variable external stress conditions result in the chaotic behavior in flickering pixels. By summarizing the causes and mechanisms of flickering pixels, four distinct categories have been identified based on their specific time-frequency characteristics: Class Ⅰ-Forward burst noise flickering pixel, Class Ⅱ-Opposite burst noise flickering pixel, Class Ⅲ-Step noise flickering pixel, and Class Ⅳ-1/f noise flickering pixel. These four categories exhibit different trends of variation under compound operating point conditions.The noise in Class I primarily originates from defect energy levels generated by semiconductor defects within the bandgap. This type of noise is highly sensitive to the system's operating state and increases with the PN junction's working current. The noise slowly increases with the increase of temporal noise at the operating point. On the other hand, Class Ⅱ noise refers to flickering pixels, which are a specific type of Random Telegraph Signal (RTS) noise. As the channel width in the PN junction increases, the impact of interface defects on the non-uniformity of carrier current diminishes, leading to increased noise as the working current of the PN junction decreases. The noise slowly decreases with the increase of temporal noise at the operating point. Class Ⅲ noise is generated under particular external stress conditions and has limited correlation with the PN junction's working current. It arises from the combined effect of internal defects and external stress, resulting in random step noise at specific operating points. In Class IV noise, poor crystal contact is the primary factor, influenced by the operational state. This type of noise is more pronounced at low frequencies, with an overall downward trend in its spectrum. Similar to Class I noise, the noise slowly increases with the increase of temporal noise at the operating point.Apart from typical flickering pixels, there are also flickering pixels with a mixture of various defects, displaying more complex characteristics. Due to these complexities, calibrating flickering pixels under a single operating point is challenging.In comparison, compound condition operating points provide more comprehensive excitation conditions, enabling a higher occurrence of flickering pixels. The calibration of flickering pixels is more efficient and allows for an increased detection rate under compound condition operating points. Additionally, energy images can correct image non-uniformity, while the response value remains unaffected by the integration time. Combining energy images with gray-level images helps overcome missed detections caused by detector non-uniformity. Therefore, a calibration method for flickering pixels is proposed to address the limitations of traditional calibration methods. This method employs twice average energy temporal noise and twice average gray-level temporal noise as thresholds to detect flickering pixels under compound condition operating points. The detection results are then merged to obtain the flickering pixels map.This article verifies the proposed method through experiments conducted using the HgCdTe IRFPA detector (320×256) and the French HGH company's surface source blackbody (DCN 1 000H4). The experimental results show that the average detection rate of flickering pixels at a single operating point has increased by 12.49%, while the overall detection rate of flickering pixels has improved by 9.41% compared to traditional methods. The calibration method effectively addresses the issues of insufficient excitation conditions for flickering pixels at a single operating point and miss detection of flickering pixels caused by detector non-uniformity, thereby improving the detection rate of flickering pixels.
Feb. 25, 2024Vol. 53 Issue 2 0204002 (2024)
Wenxuan HE, Zhengzhou WANG, Jitong WEI, Li WANG, and Dongchi YI
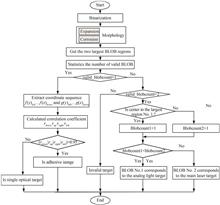
In order to solve the problem that the collimated target recognition algorithm of optical path docking cannot distinguish the adhesive state of double targets, a new method of collimated image dual optical target recognition based on Binary Large Object (BLOB) region feature analysis is proposed. There are two optical targets in the optical alignment image, that is, the simulated optical target and the main laser target. In the initial beam control stage, the positions of the two optical targets are random and uncertain, and there is a possibility of the two optical targets sticking together, which causes great difficulties in beam control. Therefore, optical path alignment needs to solve the image recognition problem in two cases: 1) In the initial beam control stage, when the main laser beam and the analog beam are just introduced, the adhesion recognition algorithm needs to be used to identify the adhesion state of the two optical targets. If the two optical targets are in the adhesion state, the two targets need to be completely separated by adjusting the 2D frame BM6XY motor; 2) In the case of two optical targets completely separated, it is necessary to distinguish between the analog light target and main laser target in the two optical targets. Firstly, the binary image is processed by digital morphology to calculate the area, center Cxy, axis length lenxy and region Reginxy, of each BLOB region in the whole image. Secondly, the number of valid BLOB regions vblobcount is counted, and the distance between the two maximum connected domains dir is calculated. When vblobcount>1 and dir>100, the collimation image is the completely separated double target image, otherwise it is the adhered image. Then, for the completely separated dual-target image, the number of BLOBs located in the two largest BLOB regions with the center of each BLOB region is counted. The small number of candidate BLOB regions is the main laser target, and the large number of candidate BLOB regions is the analog light target. Finally, for the adhered image, when dir<100, the two optical targets are in a close adhered state. The axis length coefficient len_xs is calculated. When len_xs≥1.2, the two targets are in a very close adhesion state, otherwise it is a single main excitation target or simulated light target. Moreover, the repetition accuracy analysis of the adhesive optical target recognition method based on edge feature analysis showed that the correlation coefficients of the adhesive image in the left, right, up and down directions are 0.967 1, 0.990 0, 0.999 7 and 0.922 4, respectively. The mean value of the correlation coefficients is 0.969 8 and the mean square error was 0.034 4. Among them, the correlation coefficients in the left, right and upper directions are greater than 0.95, which are marked by red, green and yellow curves respectively. The mean value of the correlation coefficients in the left, right and upper directions is 0.985 6, and the mean square error is 0.016 7. Since the third type of adhesive image is mainly the adhesive image formed after the laser target and the simulated optical target are migrated in the vertical direction, the overlap area is mainly located in the upper half of the adhesive image. The experimental results show that the proposed dual optical target recognition algorithm can not only realize the recognition of completely separated analog light targets and main laser targets with the error less than 3 pixels and the processing time less than 1 s, but also realize the identification of optical targets in the state of adhesion and a single independent optical target. It meets the requirements of self-adaptability, accuracy and efficiency of the optical alignment image recognition algorithm and the repetition accuracy of the recognition of different adhesive images, and can solve the problem of the optical alignment target recognition algorithm to accurately identify the adhesion state of two targets
Feb. 25, 2024Vol. 53 Issue 2 0210001 (2024)
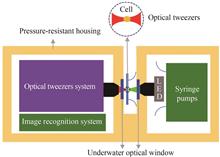
Jing WANG, Bo LIU, Kunxiang LIU, Fuyuan CHEN, and Bei LI
A significant hurdle in current deep-sea microbial research remains the inability to capture these microbes in their natural habitat. Optical tweezers, with their non-contact, low-damage, and highly precise capabilities, present an ideal solution for capturing and manipulating microorganisms in liquid environments, showing promise in capturing deep-sea microbes. However, existing research on optical tweezers primarily focuses on ideal mediums such as pure water and air, with few studies exploring their application and the alteration of trapping force characteristics in the deep-sea environment.In order to address the challenge of accurately capturing and collecting deep-sea microorganisms, this paper presents a designed optical tweezers acquisition system tailored for deep-sea environments. The system incorporates an optical tweezers module, a microfluidic chip, and a pressure-resistant cover, facilitating the in-situ capture and sorting of deep-sea microorganisms. In examining the alteration of trapping force in optical tweezers in deep-sea conditions compared to pure water, this study initially outlines the principle and methodology for calculating trapping force using the T-matrix method. Subsequently, it investigates the factors influencing optical tweezers' trapping power in the deep-sea environment, including changes in seawater's refractive index and light wave attenuation. To achieve this, a refractive index model for seawater at 1.5 km north latitude of 18° in the South China Sea is established, and the attenuation coefficient of seawater to light waves is estimated based on prior research data. Furthermore, under consistent experimental parameters, the study employs the T-matrix method to calculate the trapping force of Gaussian optical tweezers in both deep-sea conditions and pure water. This aims to capture spherical microorganisms of varying sizes and refractive indices, assessing the decrease in trapping force of optical tweezers in the deep-sea compared to pure water.Our experimental findings reveal that the shape of the dispersion curve of seawater at 1.5 km is almost the same as that of pure water on land, indicating a relatively gentle curve and an Abbe number exceeding 55, indicating minimal dispersion in seawater. Notably, compared to pure water, the refractive index of seawater is slightly higher, measuring 1.34 at a wavelength of 785 nm, a marginal increase from pure water's 1.33. At this juncture, the attenuation coefficient of seawater stands at approximately 2.3 m-1, resulting in a 92% transmittance through a 3.5 mm thick seawater layer. The study calculates the optical forces exerted by optical tweezers on spherical microorganisms with radii of 1 μm, 3 μm, 5 μm, and 10 μm in both the 1.5 km deep-sea environment and a pure water environment, with refractive indices of 1.35, 1.4, and 1.5, respectively. The findings indicate an average decrease of approximately 25% in maximum axial capturing force and about 20% in maximum transverse capturing force in the deep-sea environment compared to pure water on land. This emphasizes the greater influence of the increase in the medium's refractive index surrounding the target on the axial capturing force than on the transverse capturing force. Notably, these optical tweezers experiments employed the same laser power. Considering the greater attenuation of laser power in the deep-sea compared to pure water, the maximum trapping force of optical tweezers is proportional to the attenuation amplitude of the laser power.In summary, this study applies optical tweezers technology to in-situ capture deep-sea microorganisms, extending the technology's application domain. Additionally, it represents a comprehensive exploration of optical tweezers' functionality in a distinctive and demanding environment. These findings could serve as a valuable reference for future experiments developing deep-sea microbial sorting equipment utilizing optical tweezers technology.
Feb. 25, 2024Vol. 53 Issue 2 0214001 (2024)
Yubo GAO, Sizhi XU, Yewang CHEN, Minqiu LIU, Deqin OUYANG, Xu WU, Junzhan CHEN, Junqing ZHAO, Chunyu GUO, Xing LIU, Qitao LV, and Shuangchen RUAN
There is a growing demand for high-power lasers in industries such as laser cutting, welding, heat treatment, and marking. High efficiency oscillators with scalable power have the potential to streamline the system complexity and cost per Watt compared to amplification stages. The main challenge for power scaling is the heat load on the gain medium. Yb∶YAG crystals are attractive gain mediums because they offer high thermal conductivity, wide pump bands, low quantum defects, relatively long fluorescent lifetime, and high-quality crystal growth. Their energy-level scheme eliminates the problem of excited-state absorption, which makes the quantum defect become the primary heat source in the crystal. Complementing these advantages with suitable architectures with high surface-to-volume ratios such as fiber and Thin-disk Lasers (TDLs) enables excellent heat extraction. However, fiber lasers still face the challenge of nonlinear effects such as self-phase modulation and stimulated Raman scattering at high power. Alternatively, thin-disk lasers have improved the situation. We demonstrate a Yb∶YAG thin-disk laser that uses zero phonon line pumping. This type of laser system offers excellent power stability, high optical-optical conversion efficiency (>73%), and remarkable thermal management ability. Our design provides theoretical support for future research on the generation of kilowatt-level continuous and ultrafast pulses laser. We hope that our basic strategy and findings can be helpful in the design of higher power, more efficient thin-disk lasers and make them widely available in the industry.The Yb∶YAG crystal is simple in its energy level configuration, with only two energy states of the Yb3+ ion. The absorption peaks of the crystal are at 940 nm and 969 nm, with broadband pumping achieved near 940 nm resulting in a quantum defect of 8.7%. By opting for 969 nm wavelength pumping, the quantum defect decreases to 5.9%, reducing the thermal load by over 30% and improving the beam quality by diminishing thermal lensing and distortion effects. The pump module of the experimental device consists of a pumping source, a parabolic mirror, and two sets of folding prisms. A thin-disk crystal is placed at the focal point of the parabolic mirror and undergoes 12 reflections, equating to 24 round-trip passes, as the pumping light passes through the folding prisms and mirror. The final step involves redirecting the pumping light path using a planar reflector, ultimately achieving 48-pulse absorption. The frontal side of the thin-disk crystal has an antireflection layer, and the back side has a high reflection coating. The crystal is bonded onto a diamond substrate to facilitate superior thermal contact, low thermal resistance, and high mechanical strength, and the jet impingement technology is employed to cool the diamond heat sink. This setup and efficient cooling design improves absorption efficiency and reduce crystal thermal load, significantly enhancing laser output performance. We calculated the correlation between the absorption efficiency of the crystal and the number of pump cycles. As the number of cycles increases, so does the absorption efficiency. However, the efficiency eventually reaches a saturation point after a specific number of cycles. In this case, at cycle number 48, the crystal absorbs 95.3% of the pump light, indicating that it is almost fully saturated at this point. In the experiment, the impact of two pumping wavelengths, 969 nm and 940 nm, on the conversion efficiency of a Yb∶YAG thin-disk laser was analyzed. The results clearly demonstrate that the selection of the pumping wavelength can improve the quantum conversion efficiency and reduce the waste heat in the crystal. Besides, the design of the multiple pass pumping system can also significantly improve the resonator efficiency and crystal absorption efficiency. Utilizing a 969 nm zero phonon line pumping results in a reduced threshold pump power and a significant increase in optical-optical conversion efficiency. With the gradual increase in pump power, the optical-optical conversion efficiency also enhances. An output coupling experiment is performed using an output coupler with a transmission rate of 2%, and the overall structure of the laser system is also shown.A continuous wave Yb∶YAG thin disk laser system has been successfully developed, which exhibits exceptional capabilities. The system utilizes a VBG locked-wavelength 969 nm pump source and a 48-pass design. The cooling system employs jet impingement technology on a diamond heat sink. The experiment successfully achieved a maximum output power of 373 W and a peak optical-optical conversion efficiency of 73.37%. The Root Mean Square (RMS) power stability over a 2-hour period is less than 0.2%. The research shows the exceptional thermal management capabilities of this thin-disk laser system. It provides a foundation for future studies involving multi-kilowatt continuous thin-disk lasers, kilowatt-level green lasers, and ultrafast thin-disk lasers. We believe that the thin disk lasers with many advantages can be the ideal solution for the next generation of high-power, high-energy, peak-power lasers.
Feb. 25, 2024Vol. 53 Issue 2 0214002 (2024)

Qinghong LIAO, Menglin SONG, Jian SUN, and Haiyan QIU
To study the cavity magnetic system and the coupling of magnons and phonons, especially the quantum sideband interference effect, we investigate the magnomechanically induced transparency and fast-slow light effects based on a hybrid cavity magnetic system with an Optical Parametric Amplifier (OPA) placed in it.We first give the composition of the hybrid cavity magnetic system. The Y3Fe5O12 (YIG) sphere is placed in the cavity mode, close to the maximum magnetic field of the cavity field, and in a uniform bias field. At the location of the YIG sphere, the magnetic field (along the x-axis), driving magnetic field (along the y-direction), and bias magnetic field (along the z-direction) of the cavity mode are perpendicular to each other. The system supports three different types of excitation, namely photons, magnetons, and phonons. A uniform bias field (z-direction) is applied to the YIG sphere to excite the interaction between the magnetic dipole and the magnon mode coupled by the cavity field. The magnetostrictive force causes YIG vibration, thus establishing a magnon-phonon interaction in the sphere. The microwave field is applied to enhance the coupling between magnons and phonons. An OPA is put in the cavity and driven by a driving laser. Next, according to the system model, we give the total Hamiltonian of the system, and the definitions or descriptions of each parameter are provided. After obtaining the Hamiltonian of the system in a frame rotating at the driving field frequency, the Heisenberg equations of motion for the operators are derived by using perturbation theory. We establish the relationship between input and output to acquire the amplitude and group delay expressions for the output field. Finally, we study magnomechanically induced transparency and fast-slow light effects using experimentally achievable parameters.Through numerical simulation, the results show that in the absence of OPA, there is a magnomechanically induced transparency window when only the cavity photon-magnon coupling is present. In the case where the magnon-phonon coupling strength K is not equal to zero, a double magnetically induced transparent window appears, and the dispersion curve becomes steeper at the position where the probe-driving detuning is equal to phonon frequency. As the coupling strength K increases, the depth of the transparent window deepens, the central peak value of the absorption spectrum curve widens, and the distance between the peaks on both sides also increases. Moreover, introducing OPA gain (G) leads to a more pronounced yellow area on the left side of the resonance frequency, indicating an asymmetry in the absorption spectrum. This is because the steady-state behavior of the cavity field is influenced by changes in OPA gain, which alters the phonon number in the system and leads to an asymmetrical absorption spectrum. The absorption peak value also gradually increases with the gain G. Maintaining G and K constant, as the cavity photon-magnon coupling increases, the absorption spectrum front at the resonance frequency becomes sharp, the peaks on both sides gradually widen, and the peak value does not change significantly. Further, by increasing the gain of OPA, it is found that the transmission rate at the position where the probe-driving detuning is equal to phonon frequency is greater than 1, thus realizing the regulation of the window transmission spectrum. The positive value of the curve on both sides of the system group delay increases, while the negative value decreases by enhancing G, indicating that choosing the appropriate OPA parameters can realize the switch between the low light and the fast light as well as enhance the slow light effect.In conclusion, we investigate the magnomechanically induced transparency and fast-slow light effects in a hybrid cavity magnetic system assisted by an OPA theoretically. The research results can provide a reference for the research of quantum optics manipulation and quantum information storage.
Feb. 25, 2024Vol. 53 Issue 2 0227001 (2024)
Shichao FANG, Ran ZENG, Jingqiao XU, Xiaoyan LV, Haozhen LI, Shuna YANG, and Yaping YANG
With the advancement of optical temporal cloaking, this technology has attracted increasing attention, and the related theoretical and experimental studies were intensively carried out. Unlike spatial cloaking, which controls the path of electromagnetic wave propagation by manipulating controllable electromagnetic parameters of the medium, optical temporal cloaking does not result in light deviating from its expected spatial trajectory. Instead, the optical signals is divided into leading and trailing parts, which creates a temporal cloak window that can conceal events. Typically, two light signals are either speed up or slowed down, preventing them from reaching inside the temporal cloak window and interacting with non-emitting materials, thus rendering internal events unobservable to observers. This approach, which conceals events for a limited duration rather than the object itself, has broad application prospects in many fields. In this work, we explore the implementation of optical temporal cloaking via a chiral atomic medium with a five-level structure. By enhancing the laser control field and employing a weak probe field, coherent coupling between electric dipoles and magnetic dipoles can be induced during the transition process. Alterations to the external laser field allow for the control of magnetoelectric coupling, leading to significant chirality. Within the chosen five-level chiral atomic system, the generalized expressions in terms of the parameters related to the atomic medium and the light field are derived. Subsequently, based on the group refractive index, the output light pulse were calculated. Numerical calculations were then carried out to analyze the influence of the external field and the length of atomic medium for the five-level atomic system on the width of the temporal cloak window and the intensity of the light pulses that form the window. The results show that the input pulse generates left and right circularly polarized beams through the five-level chiral atomic medium. The intensity variation of the output pulse depends on the parameter of the external field, and the output time has different extents of advance or delay. An effective temporal window is formed within a certain parameter range. In the effective temporal window, the amplitude of the control field influences the width of the temporal window, while the phase of the control field hardly affect the window width. Furthermore, within the amplitude range of one of the two coupling fields, the temporal cloak window is nearly unaffected by that amplitude. Conversely, an increase in the amplitude of the other coupling field results in a reduction of the temporal cloak window width, while a weaker amplitude of the coupled field causes both output pulses to exhibit characteristics of speeding up. In a certain range of control field phase and coupling field phase, an effective cloaking time window can be observed, in which the optical pulse shows the opposite law to the control field phase change in the process of one of the coupling field phase change, while in the change process of the phase of the other coupling field, it shows a law similar to that of the control field phase change. As the length of the medium increases, the temporal window is gradually widened, but the intensity of the light pulse weakens due to increased loss in the medium. Therefore, it is necessary to avoid long transmission distance to ensure the effectiveness of optical temporal cloaking. Consequently, the acceleration and delay of the output pulses can be controlled effectively by manipulating the strength, phase, and detuning of the control and the coupling fields, and a significant temporal cloak window can be obtained, and this provides a tunable optical temporal cloaking scheme.
Feb. 25, 2024Vol. 53 Issue 2 0227002 (2024)
Jianan WEI, Hulin LIU, Ping CHEN, Yang LI, Kuinian LI, Yonglin WEI, Luanxuan HE, Xinnan ZHAO, Xiaofeng SAI, Deng LIU, Jinshou TIAN, and Wei ZHAO
Microchannel Plate Photomultiplier Tube (MCP-PMT), as a high-performance photodetector, has been widely used in various detection experiments in recent years. In previous studies, people mainly focused on improving the sensitivity and temporal resolution of optoelectronic detection devices, while ignoring the key factor of high linearity. With the continuous development of the demand for large dynamic detection, in-depth research and development of MCP-PMT with large dynamic range has become an urgent need for current research.The dynamic range of MCP-PMT is related to many factors, such as the intensity and frequency of input visible light, the material of the microchannel board, and the voltage values applied to each part of MCP-PMT. This article mainly starts from two aspects: the input light pulse frequency and the potential difference applied by the backend of MCP-PMT, and delves into the reasons why the output electrons of MCP-PMT deviate from normal linear multiplication.By combining theoretical analysis and experimental testing, the influence of the repetition frequency of pulse light signals and the potential difference between the second microchannel plate and the anode on the dynamic range of MCP-PMT was studied in detail. When the input light pulse width is 50 ns and the repetition frequency is 500 Hz, the maximum linear output of the anode can reach 2 V (i.e. 40 mA); when the repetition frequency increases to 1 000 Hz, the linear deviation degree reaches more than 10% when the anode output is 1 V (i.e. 20 mA); when the input light frequency further increases to 5 000 Hz and the anode output reaches 0.3 V(i.e. 6 mA), the degree of linear deviation has reached about 15%. As the electric potential difference between the second microchannel plate and the anode increases, the maximum linear output voltage of the anode shows fluctuating changes. When the electric potential difference between the second microchannel plate and the anode is around 200 V, the linear output voltage of the anode reaches its peak. As the electric potential difference increases, the linear output voltage of the anode begins to fluctuate, reaching the second peak at a electric potential difference of around 500 V.In this article, we investigated the influence of the frequency of pulse input light and the electric potential difference between the second microchannel plate and the anode on the dynamic range of MCP-PMT, and obtained two conclusions through experimental verification: 1) As the pulse input frequency increases, the output voltage of MCP-PMT will detach from the linear region earlier. 2) As the potential difference between MCP2 and the anode increases, the maximum linear output voltage of MCP-PMT does not simply vary monotonically, but exhibits a constantly fluctuating trend in resistance. On this basis, further exploration was conducted on the factors that constrain the dynamic range of MCP-PMT, namely insufficient wall charge supplementation and interference from space charge effects. When the frequency of the input pulse is high, the constraint on the dynamic range of MCP-PMT is mainly related to the former; when the electric potential difference between the second microchannel plate and the anode increases, due to the complex situation of a large number of secondary electrons transferring between the plates to the anode, the dynamic range will be affected by the space charge effect and cannot be directly proportional to the electric field strength.
Feb. 25, 2024Vol. 53 Issue 2 0204001 (2024)
Qiufeng SHANG, and Xiaoxu ZHANG
In order to improve the accuracy of shape sensing, this paper optimizes the sensing position based on the Non-dominated Sorting Genetic Algorithm-II (NSGA-II), and uses the Radial Basis Function-Particle Swarm Optimization (PSO-RBF) neural network algorithm to improve the accuracy of structural reconstruction. In this study, the goal was to reconstruct the shape of a 150 mm×150 mm×0.5 mm nitinol version. Firstly, the finite element model of the nitinol version was established by using ANSYS workbench software. After a series of operations such as meshing, adding constraints, adding materials, and modal analysis, the surface strain modal matrix and displacement modal matrix of the model were extracted. According to the modal analysis results and the principle of modal reconstruction, 8 sensing points can be selected to realize the shape reconstruction of the model. The strain mode matrix is used as the input matrix of the NSGA-II algorithm. According to the modal confidence criterion, the conditional number criterion and the modal mode shape similarity criterion, three objective functions were obtained. The NSGA-II multi-objective optimization algorithm, which introduces fast non-dominance sequences, business strategies and congestion operators, was used to select the best sensing location. It not only reduces the computational complexity of the algorithm, but also better retains the excellent individuals. Then, the wavelength of the center of the Fiber Bragg Grating (FBG) was demodulated by the SM125 interrogator, and the linear relationship between the wavelength change and curvature of the eight FBG centers was obtained by linear fitting. Since epoxy resin has a high strain transfer rate, the FBG was glued to the selected optimal sensing position. The nitinol plate was bent into different arcs to obtain FBG strain data. The displacement and shape of the nitinol plate at this time were recorded. The strain-mode mode shape, displacement mode mode and FBG strain data were input into the reconstruction algorithm. According to the modal reconstruction algorithm, the shape reconstruction was preliminarily realized, and the best sensing position point reconstruction results obtained by the K-means++ algorithm were compared. Finally, the PSO-RBF neural network algorithm was used to fit the nonlinear relationship between the reconstruction error and the reconstruction displacement. The PSO-RBF neural network algorithm has strong nonlinear fitting ability, which can avoid falling into local optimum. The ratio of the training, validation, and test sets is 6∶2∶2. In this way, the prediction of the reconstruction error can be realized, and the accuracy of the shape reconstruction can be improved. The NSGA-II algorithm was used to optimize the sensing position, and the FBG strain information was collected to reconstruct the structure shape, and the reconstruction effect was better than that of the K-means++ algorithm, and the root mean square error was reduced by 30% and the maximum error was reduced by 15% compared with the K-means++ algorithm. After fitting the nonlinear relationship between the reconstruction error and the reconstruction displacement by PSO-RBF, the root mean square error and the maximum error are reduced by 90% and 70% respectively compared with the non-error compensation, and the reconstruction shape is almost the same as the structural shape, which can achieve high-precision reconstruction of the structural shape. This paper successfully realizes the high-precision shape reconstruction of the nitinol version. By optimizing the optimal sensing position, the root mean square errors are 0.500 mm, 0.561 mm and 0.636 mm, and the maximum errors are 2.102 mm, 2.315 mm and 2.561 mm, respectively, when the bending curvature radius of the nitinol plate is 200 mm, 180 mm and 160 mm, respectively. When the bending curvature radius is 180 mm and 160 mm, the root mean square error is 0.038 mm and 0.046 mm, and the maximum error is 0.686 mm and 0.778 mm, respectively.
Feb. 25, 2024Vol. 53 Issue 2 0206001 (2024)
Yixu WANG, Yueheng LI, Ping HUANG, and Meiyan JU
The channel fading generated by seawater absorption and scattering, oceanic turbulence, and pointing error will severely reduce the communication quality of an Underwater Wireless Optical Communication (UWOC) system. Many scholars directly transplanted the weak atmospheric turbulence model to depict the oceanic turbulence statistics, and this had been proven to be incorrect by a series of laboratory measurements and associated data-fitting tests. So, it is obviously of great significance to study and evaluate the effects of a composite fading channel on the key performance of the UWOC system, especially with a proper weak oceanic turbulence model.In this paper, the Generalized Gamma Distribution (GGD) verified by a series of experimental tests was selected to characterize the weak oceanic turbulence. Then, a new hybrid fading channel model was proposed to more reasonably simulate the communication environment in the ocean, which had integrated the GGD weak turbulence, the zero/nonzero boresight pointing error, the implicit path loss and multipath propagation effect characterized by Fading Free Impulse Response (FFIR). Next, the mathematical expressions of the Probability Density Function (PDF) considering GGD weak turbulence and zero/nonzero boresight pointing errors were derived using higher transcendental Meijer-G and Whittaker functions. Subsequently, based on this, the closed-form expressions of the average Bit Error Rate (BER) were derived for the serial-relayed UWOC systems with both zero and nonzero boresight pointing errors, respectively. Finally, the accuracy and rationality of the derived closed-form formulas for the average bit error rate of the relaying UWOC system derived above were verified by some Monte Carlo numerical simulations; meanwhile, the influences of different key parameters on the system BERs were also investigated.The results show that the introduction of serial relaying nodes can effectively improve the end-to-end BER performance of the UWOC systems in a long-distance communication environment. With the increase of the relaying nodes number, the system's BER decreases rapidly at the same transmission power, indicating that the serial-relayed scheme dramatically improves the performance. For instance, if the end-to-end distance is fixed as 45 m and the target BER is set to be 10-3, under the zero boresight pointing error condition, the required node transmission power will be reduced to 24 dBm, 12 dBm, and 6 dBm, respectively, when the relaying node number is assumed to be 1 to 3 individually. Similar to the working situation of zero boresight pointing error, when there is a non-zero boresight pointing error, the serial relaying node still effectively improves the system's BER performance. Unfortunately, the delayed spread expansion of the FFIR caused by the increase of the initial divergence angle of light source, that is, the so-called Inter-symbol Interference (ISI), will seriously degrade this performance improvement. For example, when the initial divergence angle is increased from 0.01° to 3°, the transmission power needs to be increased in general by about 10~15 dBm to obtain the same BER compared with the original transmission one. In addition, the jitter standard deviation and the initial boresight displacement associated with the pointing error will also significantly impact the BER performance of the relaying UWOC systems. For instance, if the jitter standard deviation is enhanced from 10 cm to 20 cm, the node transmission power needs to be increased by nearly 20~25 dBm to achieve the same BER value; meanwhile, when the initial boresight displacement increases from 5 cm to 10 cm, the transmission power needs to be added by about 5 dBm to reach the same BER target. Therefore, when one considers the BER evaluation of the serial-relayed UWOC systems, it is necessary to consider the impacts of the initial divergence angle, the jitter standard deviation, and the initial boresight displacement on performance thoroughly.The analytical results of this paper can provide calculation support for analyzing the BER performance of the relaying UWOC systems.
Feb. 25, 2024Vol. 53 Issue 2 0206002 (2024)
Jianjiang ZHA, Yuanda WANG, Xuerong HE, Wei HOU, Jingsheng WANG, and Jianxiang WEN
Existing optical fibers struggle to support broadband dense wavelength division multiplexing and coarse wavelength division multiplexing transmissions, necessitating the development of optimized fibers with moderate dispersion, low dispersion slope, enlarged effective area, and low attenuation. Currently, None Zero Dispersion Shifted Fiber (NZDSF) fibers have a small effective area incompatible with conventional fibers, emphasizing the need for precise design control of the refractive index profile. Therefore, creating a S+C+L band NZDSF with a large effective area and low slope is crucial for meeting the escalating demand for bulk data transmission.The dispersion slope, a crucial parameter in optics, is determined by the interplay between waveguide and material properties. The effective area, a metric that signifies the fiber's optical performance, relies heavily on the refractive index profile and the chosen input wavelength. In order to find the appropriate dispersion slope and effective area, we need to find a suitable refractive index profile. In our research, we have employed a refined profile structure modal, featuring a triangular+ring core configuration embellished by a central depression and fabricated by a two-step process to prepare the core and cladding by using the Outside Vapor Deposition (OVD).Through experiments, adjustments were made to the doping levels in the core, thereby modifying the relative refractive index Δn1 and radius R1 of the first core layer. This enabled the formation of a triangular cross-sectional structure. Simultaneously, the relative refractive index Δn3 and thickness R3-R2 of the third core layer were also adjusted, resulting in distinct refractive index waveguide configurations. This approach strucks a balance between achieving low attenuation, a large effective area, a reduced dispersion slope, and an appropriate zero dispersion wavelength. After optimizing the preform preparation and drawing process, the optical fiber cross-section obtained has a high matching with the designed cross-section. The triangular structure of the first core layer has a relatively straight slope, and Δn1 is between 0.52% and 0.57%. In the third core layer, a slightly curved convex structure is formed due to the diffusion of GeO2, and Δn3 is between 0.13% and 0.17%. In line with the experimental findings, it has been observed that when the first core layer radius R1, the third core layer R3, and the second core layer's relative refractive index Δn2 remain relatively constant, an increase in Δn1 and a subsequent decrease in R2/R1 lead to a gradual reduction in the zero dispersion wavelength λ0 and a corresponding decline in the effective area Aeff. Our experimental target is to achieve a zero dispersion wavelength λ0 below 1460 nm, even approximating 1 420 nm, while maintaining a significant effective area Aeff. To balance these parameters, it is necessary to slightly reduce Δn1 to the range of 0.52% to 0.53% and adjust R2/R1 to approximately 2.6 to 2.7. By these adjustments, we can achieve a suitable equilibrium between the effective area Aeff and the zero dispersion wavelength λ0.The experimental fiber design achieved a mode field diameter of 9.35 μm and an effective area Aeff of 68 μm2. Additionally, the zero dispersion coefficient exceeding 1.5 ps·nm-1·km-1 at 1 460 nm, well-suited for S-band wavelength division multiplexing applications while effectively suppressing four-wave mixing in the S-band. Furthermore, the fiber exhibited a low dispersion slope of only 0.059 ps·nm-2·km-1, providing relatively suitable dispersion characteristics in the C and L bands. The fiber also exhibited superior attenuation coefficients of 0.276 dB·km-1 at 1 383 nm, effectively mitigating the impact of water absorption peaks. The attenuation coefficients at 1 550 nm and 1 625 nm were 0.195 dB·km-1 and 0.205 dB·km-1, respectively, facilitating extended transmission distances. Through comparison, it was confirmed that this S+C+L band NZDSF with low dispersion slope and large effective area is well-suited for high-speed, high-capacity, and long-distance optical communication systems.
Feb. 25, 2024Vol. 53 Issue 2 0206003 (2024)
Yang CAO, Wenjun XING, Xiaofeng PENG, and Chaoyuan BAO
With the advancement of the construction of space, space and ground integrated information networks, satellite communication systems nowhave a higher requirements for information transmission rate, satellite node storage capacity, satellite coverage and security. Traditional microwave communication methods are limited by bandwidth, speed, geographical location, spectrum, etc., and will be difficult to meet the ultra-high speed and ultra-large capacity communication requirements of multimedia broadband services for satellite networks. At the same time, laser communications are gradually becoming an important technical means for satellite communications due to its advantages of high transmission rate, high security and reliability, strong confidentiality, small terminal equipment, light weight and low power consumption. To achieve all-round coverage of communication signals, laser networking based on dynamic satellites and the establishment of high-speed, low-latency, high-reliability and large-capacity satellite communication systems will become the future development trend of satellite communication. In the future, space will inevitably gather a large number of products of human space activities, including rockets, satellites, and rocket ejections. As humans develop space, the increase in these space debris will also bring a series of hazards. Existing space debris research mainly focuses on how to avoid collisions with satellites and spacecraft in orbit. In addition, these space debris move randomly in space, which will block point-to-point laser communications. Therefore, more effective research on the reliability of satellite laser communication systems is needed.In order to solve the problem of inter-satellite link interruption that may be caused by space debris in low-orbit satellite laser communications, this paper proposes a Direction-enhanced Link State (DE-LS) routing algorithm. Firstly, the network topology of satellite communication is built. The polar orbit constellation model is selected. According to the orbital plane and the number of satellites, an initial and constant address is set for each satellite in the polar orbit constellation. Based on the changes in the satellite node addresses of the starting and ending points in different transmission tasks, the Direction Influencing Factor (DIF) is introduced. Then, based on the celestial motion patterns of satellites and space debris in polar orbit constellations. A joint simulation model of space debris and satellites is constructed to obtain the relative positions of satellites and debris at a given moment and to perform inter-satellite visibility analysis.. Based on the inter-satellite visibility data, a Direction Enhancement Index (DEI) is proposed corresponding to the four directions of each node. The direction impact factor and direction enhancement index are combined with the inter-satellite link distance and transmission delay to comprehensively represent the link cost. The cost is used as a measure to select the shortest path, and the shortest path is selected between each pair of satellite nodes in turn, and the number of routing hops is used as the evaluation index. The simulation experiment is carried out in the Walker constellation. Space debris and satellites are jointly modeled and simulated first. Then, in this environment, two situations are selected: the theoretical minimum number of hops in the same orbit is 4 hops and the theoretical minimum number in different orbits is 7 hops. Taking satellite communications No. 21 and No. 25 and satellite No. 21 and No. 55 as examples for routing selection, routing hop count and transmission delay are used as evaluation indicators, and compared with the Dijkstra routing algorithm, which also solves the shortest path. The simulation results show that the DE-LS algorithm can maintain the theoretical minimum number of hops when the link is interrupted. At the same time, it saves 14% of the hops and reduces the transmission delay by 17% compared with the Dijkstra algorithm, which reflects the effectiveness of DE-LS algorithm in avoiding faulty links.
Feb. 25, 2024Vol. 53 Issue 2 0206004 (2024)
Yong ZHENG, Jie YU, Hongkai CHEN, and Xing YI
In practical applications such as slope instability deformation, random cracking of concrete and collapse of wind turbines, position tracking always requires two-dimensional sensing. The fiber-optic displacement sensors have been widespread applied in civil engineering field due to their intrinsic advantages, including electromagnetic interference immunity, miniature size, electrically-passive operation, and multiplexing capability, however, they are not able to retrieve the displacement direction and amplitude simultaneously. In view of this reason, a vector displacement measurement sensing device based on Fiber Bragg Grating (FBG) with large range and simple structure is proposed to identify the displacement magnitude and direction of the monitored structure simultaneously. The sensing device is mainly constructed of four FBGs, a base, an upper free rotation rod, springs 1 and 2, self-made U-shaped structures 1 and 2. The pre-tensioned FBGs are respectively pasted on the inner and outer sides of center position of the U-shaped structure as the sensing unit. When the deformation occurs, the screw plays a connecting role, and the spring is not affected by the screw. The bottom spring of U-shaped structure 2 is connected with the monitored point, and the movement of the monitored point will cause axial tension of U-shaped structure 2. The force will be applied to the spring and the U-shaped structure. The internal and external sides of the U-shaped structure are subject to tension and compression, respectively. Additionally, the movement of U-shaped structure 2 causes the upper rod to rotate around the center point, which further makes the spring of U-shaped structure 1 elongate and produces tension on the U-shaped structure. FBGs are bonded to both the upper and lower surface of the stainless steel plate of the U-shaped structure for temperature compensation. Even if temperature change occurs in an FBG sensor unit, strain in the upper and lower two FBGs bonded to both surfaces of the stainless steel plate are equal, so thermal strain can be neglected. The sensing principle of determining the displacement direction and amplitude simultaneously is introduced, and its expression is also derived. Calibration experiments of six sets of auxiliary structures (i.e., core sensing elements) were conducted. The experimental results showed that the sensing element is characterized by a superb linearity, a measurement range of 0~140 mm, a sensitivity of 4.362 pm/mm, a hysteresis error of 3.25%, and a repeatability error of 6.62%, respectively. Additionally, an indoor accumulation slope model test was performed to verify the performance of the FBG displacement sensing device in monitoring the continuous sliding deformation process of soil. The displacement values calculated by FBG-based sensor is basically consistent with that measured by Particle Image Velocimetry (PIV) technology, with an average relative error of 5.63%. The maximum relative error of horizontal displacement is 10.83%, the minimum value is 0.11%, the maximum relative error of vertical displacement is 11.17%, the minimum value is 0.67%, which can meet the measurement requirement of the sensor in slope monitoring. The errors of some measuring points exceeding 10% may be due to the fact that the probe of FBG displacement sensing device was buried shallowly in the soil and not fully in accordance with the soil deformation. Meanwhile, the relative error of displacement azimuths calculated by two technologies is basically within 10%, with a maximum error of 10.31% and a minimum error of 0.09%, which is basically the same as the error analysis of above displacement. The error analysis of displacement azimuth calculated by two techniques also proves the reliability of the FBG displacement sensing device developed in this paper for monitoring vector deformation of soil slopes. This capability demonstrates its broad application prospects in the field of intelligent monitoring.
Feb. 25, 2024Vol. 53 Issue 2 0206005 (2024)
Ruizhi PAN, Yan FENG, Hexiang LIU, Haoxiang WANG, Hongpu ZHANG, Yinxiang ZHANG, and Hua ZHANG
With the development of smart robots, intelligent tactile sensing is increasingly applied in industrial production, which can greatly improve efficiency and accuracy. Compared with traditional electrical sensors, optical fiber Bragg Grating (FBG) sensors have significant advantages, such as flexibility, electromagnetic immunity, and small size. They also demonstrate high sensitivity and rapid response in perceiving strain and pressure. Current researches on FBG-based tactile sensing mainly focus on strain, temperature, sliding positioning and contact force deduced from the Bragg wavelength shift of FBG. However, there are relatively few researches on combining feature extraction, machine learning, and other cutting-edge technologies to achieve more sophisticated intelligent perception, such as material recognition.In this work, we presented a FBG based sliding-tactile sensing and classification training method for online material recognition by the differential properties of contact surface materials, such as roughness and stick-slip phenomenon. We developed a horizontal two-layer silicone rubber covered FBG sensing unit and its sliding-tactile perception system. When sliding on the certain material, a continuous strain exerts to FBG through the silicone rubber sensing unit and FBG's response changes.To classify efficiently, this paper extracted the mean maximum difference λB(max)-λBˉ, extreme difference λB(max)-λB(min), and standard deviation Δλ(std) of the FBG's wavelengths as the three-dimensional feature for mapping the material properties. And the classification training of the Support Vector Machine (SVM) algorithm and its classification model was developed. The results show that the classification accuracy is 96.6% for rough cloth, PLA and 800-grit sandpaper under the mixed dataset of 5 cm/s, 10 cm/s and 15 cm/s sliding speeds. Compared with the direct wavelength and traditional mean/median feature classification methods, this three-dimensional feature-based method exhibits superior classification capability and adaptability.In order to achieve further intelligent applications, this paper also designs an interactive computer control system, including wavelength acquisition, speed control and material recognition result display. It can control the sliding speed and online material recognition as well. Utilizing the prediction function trainedModel.predictFcn(t_test), the corresponding predicted results were presented after extracting three-dimensional features. In 36 tests, 5~15 cm/s random sliding speed (3 types of materials×3 samples×4 times slip) were carried out, and the correct predictions were 34 tests, which verifies that this method is effective and accurate.This work indicates that the FBG sensor has great potential in the field of material recognition by slip-tactile sensing. The research results can provide a novel online material recognition method for intelligent sensing robots.
Feb. 25, 2024Vol. 53 Issue 2 0206006 (2024)
Zhiyao MA, Donghui ZHENG, Lei CHEN, and Jun MA
Traditionally, the interferometric method has been employed to test the refractive index uniformity of flat optical materials. The method mainly involves two approaches: the overturning method and the transmission method. Both methods require a minimum of three flat samples, including the reference flat, the transmission flat, and the sample flat to be tested. This requirement for multiple flats increases the overall cost of testing.We have proposed a novel method for evaluating the refractive index uniformity of transmission flats, which only requires two flats, offering a significant improvement over existing method. The method is realized by using two surfaces of the transmission flat and one surface of the reference flat, and the sample flat is used as the transmission flat. Based on the even-and-odd functions, we can get the even-odd, odd-even and odd-odd parts of the refractive index uniformity directly. To the even-even part, we resolve it as the even-even-even (eee) and even-even-odd (eeo) part and we can calculate the eeo part by rotate 90° measurement result. Then we resolve the eee part into even-even-even-even (eeee) and even-even-even-odd (eeeo) part and get eeeo part through the rotate 45° measurement result. Finally, by neglecting high-order rotational symmetry terms, we can calculate the refractive index uniformity from the obtained components. This method with its step-by-step decomposition providing an effective and efficient approach to characterize the optical properties of the flat under test.Four random wavefronts are generated as the initial three surface error and the refractive index uniformity errors. The uniformity errors are recovered according to the proposed method. Compared the difference between the recovered results and the initial values, that only 0.6 ppm (10-6) in differ. Additionally, the residual error exhibits rotation invariance, which aligns with theoretical expectations. It is important to note that in the low and middle frequency ranges, the residual error is not affected by the surface error of the flat, but solely determined by the refractive index uniformity itself.The theory is verified the experiment on a 100 mm Zygo interferometer and the refractive index uniformity of the same flat is measured by the three flat transmission method. The test flat is made by quartz. The surface error of the two surfaces are better than λ/10. The flat has a certain wedge angle. The front and the back surface will not generate interference fringes. The reference flat is a microcrystalline flat, better than λ/10 as well.The result of the two flat method have the same shape with the three flat transmission method. The refractive index uniformity obtained by the two flats methods is only 0.2 ppm different from that obtained by the transmission method, and the peak-valley value is 3 nm different. To ensure accuracy in the evaluation process, error influence is analyzed considering factors such as rotation angle errors and pix offset errors. By evaluating the influence of error, the experimentally verified results illustrate the effectiveness of this method in accurately evaluating the refractive index uniformity of flat optical materials. The proposed method demonstrates promising potential in the evaluation of refractive index uniformity, reducing resource requirements, and improving cost-effectiveness.
Feb. 25, 2024Vol. 53 Issue 2 0212001 (2024)
Shengshuo CHEN, Yansong LI, Dongxu CHEN, Shijia KANG, Zhiguang XU, and Jun LIU
Optical voltage sensors based on electro-optical materials have many advantages such as wide measurement band, fast response and small size, which can realize the non-contact measurement of grid voltage, and how to improve the measurement accuracy of optical voltage sensors has become an urgent problem. Temperature stability has become one of the important factors affecting the measurement accuracy of optical voltage sensors. When considering the effect of temperature on the sensing unit electro-optical crystal, two problems are faced: first, there is a temperature gradient in the electro-optical crystal when the temperature changes, resulting in unequal temperature between the crystal surface and the internal optical path; second, the physical parameters of the crystal are also affected by the temperature. Therefore, the bismuth germanate crystal is used as the research object in this paper, and the output response equation of the optical voltage sensor under multi-physics field is analyzed in combination with the previously derived one. In the output response equation, it is concluded that the temperature drift is a low-frequency component and the applied voltage is a high-frequency component, so that the output signal of the sensor is separated from the AC signals and DC signals. However, after adding the temperature variation parameter to the output response equation, the correction result shows that the temperature variation parameter and the refractive index parameter of the crystal affected by temperature also exist in the high-frequency component, so it is necessary to estimate the states of these two parameters. Considering that electro-optical crystals are optical materials, the internal temperature can not be measured directly by destroying the crystal, so it is necessary to establish a relationship between the surface temperature and the internal temperature to calculate the internal temperature indirectly. A semi-analytic method is first used to establish the crystal transient temperature field model, and the direct substitution of the measured surface temperature data to obtain the internal temperature will introduce a large amount of noise error, so the state estimation of the internal temperature of the crystal is realized by Kalman filtering. The refractive index parameters of the crystal queried through the literature are limited by light wavelength or temperature and can not be adapted to the time-varying environment. Therefore, the crystal refractive index at initial temperature is estimated by the central differential Kalman filter combined with the low frequency component of the sensor output signal. Finally, the compensation voltage is calculated by substituting the correction parameters into the high-frequency component of the sensor output signal. In summary, a temperature compensation method based on temperature field and dual Kalman filter parameter estimation is proposed. The experimental results show that the simulation accuracy of the transient temperature field resolution formula is within 0.02% and the experimental measurement accuracy is about 0.2% under the environment where the sensor is exposed to an external temperature of [20 ℃,40 ℃] at a heating rate of 0.5 ℃/min, which verifies the correctness of the transient temperature field model construction. The relative error of the refractive index parameters of the crystal obtained by the central differential Kalman filter is 0.017 6% compared with the calculated results in the literature. The accuracy of the output voltage measurement is better than 0.52% using two correction parameters to compensate. The method improves the sensor measurement accuracy compared with the temperature compensation effect of the Back Propagation Neural Network under the same platform and the temperature compensation effect in the relevant literature.
Feb. 25, 2024Vol. 53 Issue 2 0212002 (2024)
Huiwen DONG, Jiaping ZHANG, Minlong LIAN, Dazhou XIAO, Weigang WANG, and Yuehui LU
For small objects in deep space exploration, the radiation temperature is about 100 K to 420 K. According to Wien's displacement law, deep space exploration targets cover the ultra-wide spectral range of 5 μm to 50 μm, and high-precision on-board calibration is the key to the accurate detection of deep space exploration loads. Therefore, it is necessary to develop an on-board calibration source with high emissivity and high temperature stability of ultra-wide spectrum. Aiming at the technical problems of detecting ultra-wide spectrum, high reflectivity and high temperature stability of radiometric calibration blackbody source on ultra-wide spectrum stars in deep space, this paper carries out in-depth research and experimental verification from several aspects such as simulation, key component design and sample detection methods, so as to ensure the engineering realization and application of high-index precision radiometric calibration blackbody source on stars. COMSOL Multiphysics software simulation based on finite element method, microstructure design of blackbody source, emittance detection method of blackbody source and radiation calibration test in laboratory were studied.Firstly, starting from the parameter optimization design of the blackbody surface microstructure, the means of improving the emissivity is transformed from qualitative research to quantitative calculation. The optimal design parameters for wide-spectrum emissivity design are obtained by optimizing the microstructure of the radiating surface of the on-board calibration blackbody source, and then carbon-based ultra-black coating material is selected to further improve the spectral emissivity of the blackbody source. The microstructure optimization junction and the superblack coating of the blackbody source on the star are optimized to increase the emissivity of the blackbody source on the star from 5 μm to 50 μm in the spectral range to 0.986, in which the ultra-wide spectrum is realized. Depending on the superblack coating, each material has different intrinsic radiation ability in different bands, and the coating is a composite porous structure, which makes it have high emission ability in a wide band. Secondly, by careful selection of blackbody source temperature controller and optimal design of temperature control system, the temperature measurement accuracy and stability of on-board calibration source are improved. The MF61 series film NTC thermistor is embedded on the blackbody surface to monitor the temperature of the blackbody surface in real time. The Thermoelectric Cooler (TEC) is a heating and cooling device that has been developed utilizing the Seebeck effect; The high-precision temperature measuring device is capable of accurately and effectively measuring the real-time surface temperature of a blackbody. It utilizes the high-precision voltage reference REF6225 and precision metal resistance current limiting to provide constant current output for NTC as a constant current source, while employing the precision digital-to-analog conversion chip ADS124S08 and four-wire resistance temperature detector for temperature measurement. Using Ohm's law, the voltage value is converted and fed back to the high precision temperature measurement circuit. The temperature measuring circuit sends control instructions to TEC drive current through comparison and analysis with the actual required temperature. The power management chip TPS63020 is used as controller, which can pull and inject current to drive TEC, and then heats up or cool down TEC to control the blackbody surface temperature. The temperature stability of the on-board calibration blackbody source reaches 0.16 K. Finally, the design and process reliability of the blackbody source are tested by comprehensive parameter measurement and evaluation. The design results are verified by measuring the emissivity of the blackbody source and the temperature stability of the blackbody source in the vacuum environment. The test results show that the spectral range of ultra-wide spectral calibration blackbody source for deep space detection is 5 μm to 50 μm, the normal average emissivity is 0.986, and the temperature stability reaches 0.16 K. The blackbody source will greatly improve the spectral range of high-emissivity radiometric calibration sources, and provide basic support for on-orbit high-precision radiometric calibration of deep space exploration loads.
Feb. 25, 2024Vol. 53 Issue 2 0212003 (2024)
Jing LI, Zhonghui SUN, Jinping NI, and Hui TIAN
Light screen is a photoelectric test equipment that adopts the principle of measuring the flying time in a fixed distance, commonly used to measure the flying velocity of projectile which also known as the initial velocity of projectile near the muzzle. For the same diameter projectile, distance measurement error is the main factor affecting the velocity measurement error when timing error is determined. Direct measurement methods such as steel rules and laser range finders are used to measure long target distance greater than 1 m in light screen, and measurement error of distance is generally 0.5 mm, the relative error of distance is not more than 0.5‰, which has little impact on the relation error of velocity measurement. For light screen of short target distance with target distance less than 200 mm, the above method is still used to measure distance, and the distance relative error is greater than 2.5‰, then the relative error of velocity measurement exceeds 2.5‰, which does not meet the requirements of the actual velocity measurement. In this paper, a target distance calibration method using the dual zone-block velocity measuring device is proposed, which consists of two sets of calibration light screens with the same principle. The target distances of the two sets of light-screen are consistent and much larger than the distances of calibrated light screens. Based on the transmission formula of velocity measurement error, a calculation method of minimum calibration distance under the determination of that error is given. Two sets of light screen are utilized for calibration to measure the velocity of the flying projectile at two points on the ballistic separated by a fixed distance. Combined with the distance between two points, the resistance parameters of projectile and instantaneous velocity at any time between two points are developed based on the ballistic equation. Based on the fact that the average velocity within a certain distance is equal to the instantaneous velocity at the midpoint of projectile flying time within that distance, considering the time sequence of projectile passing through calibration light screen and the calibrated light screen, the distance calibration formula of calibrated light screen is given, and the calibration error calculation formula is derived. The influence of calibration distance and layout spacing in dual zone-block device on the calibration error is analyzed when projectile's flying velocity is determined. If projectile velocity is constant, the calibration error decreases with the increase of calibration distance and layout spacing. Furthermore, when the calibration distance and layout spacing are fixed, the larger the projectile flying velocity, the greater the calibration error. Taking the target calibration test of three light screen as an example, the single zone-block calibration test and the dual zone-block calibration test are carried out, in which the calibration distance is 1 237 mm and the layout spacing is 1 996 mm. When the projectile velocity is 150 m/s, the calibration relation error of single zone-block device and dual zone-block device are 1.6‰ and 0.8‰, respectively. The velocity measurement is carried out with calibration results of dual zone-block, and the relation error of velocity measurement is 0.37‰, which meets the requirements of velocity measurement. We proposes a calibration method for dual zone-block screen velocity measuring device, which indirectly measures the target distance of light screen with unknown distance by using the calibration light screen with known long target distance. Meanwhile, the calibration method proposed can be used to calibrate the target distance of sensors for zone-block velocity measurement on various principles and usage level.
Feb. 25, 2024Vol. 53 Issue 2 0212004 (2024)
Chen LI, Hao LI, and Yanwei YANG
Inertial Measurement Unit (IMU) mainly measures and reports the specific force and angular velocity of an object. It usually consists of a three-axis accelerometer and a three-axis gyroscope. Traditional IMU have complex manufacturing processes and high costs. It is not easy to recycle, pollute the environment and cannot be biodegradable after being discarded. In this study, a kind of wood inertial measurement unit based on Laser-induced Graphene (LIG) is proposed.Camphor pine wood was selected as the sensor frame. The pine is placed in the vacuum chamber and adjust the vacuum degree in the vacuum chamber. Fiber laser and laser vibrators software was used to process LIG resistors at the pine frame resistor locations by adjusting laser frequency, laser power, scan speed, off-focus distance and other parameters, with a resistance value of about 100 Ω, and to connect these resistors into multiple Wheatstone bridges. Due to the sensor's design being symmetrical along the X- and Z-axes, only the Wheatstone bridge on the beam in the X- or Z-axis direction needs to be measured. Different inertial bodies are divided into balanced oscillator unit and unbalanced oscillator unit. The inertial body of the balanced oscillator unit is a spherical inertial body (Cr13), mainly measuring acceleration; The inertial body of the unbalanced dipole element is the inertial wheel (PLA), which mainly measures the angular acceleration. The theoretical formula shows that the acceleration range of IMU along X axis and Z axis is±10 g, the acceleration range along Y axis is -g~+3 g, the angular acceleration range around X axis and Z axis is±8 rad/s2, and the angular acceleration range around Y axis is±23 rad/s2.The product of this study is placed on a sports platform and uses a dynamic signal acquisition system to collect the output voltage of a Wheatstone bridge in the IMU. Through the joint test and comparison of the commercial acceleration sensor and unbalanced oscillator unit, it can be concluded that the designed sensor has the same change as the commercial sensor and has the ability to measure the angular rate. The results of this measurement of the Wheatstone bridge on the Z-axis beam are as follows: The sensitivity of the X-axis acceleration of the balanced oscillator unit is 0, and the sensitivity of the Y-axis acceleration is 8.695×10⁻⁴ mV/g, the Z-axis acceleration sensitivity is 0.200 mV/g, and the sensitivity to angular acceleration is 0. The sensitivity of Y-axis acceleration of the unbalanced oscillator unit is 1.110 mV/g, the sensitivity of the X-axis and Z-axis acceleration is 0, the sensitivity of the angular acceleration around the X-axis is 0.285 mV/(rad/s2), the sensitivity of the angular acceleration around the Y-axis is 0.305 mV/(rad/s2), and the sensitivity of the angular acceleration around the Z-axis is 0.765 mV/(rad/s2). By comparing the voltage output of Wheatstone in all directions of IMU under cyclic load, it is concluded that IMU of this design still has the ability to measure the angular rate and other parameters under multiple cyclic loads, so this design has a certain stability.We propose a wooden inertial measurement unit based on laser-induced graphene, which is made of biodegradable materials and has good sensitivity and certain stability. Compared to the IMU on the market, it is more environmentally friendly, cheaper, and more convenient to manufacture, with environmental advantages and market prospects. It can be used in the fields of wooden ships, vehicle engineering, or wooden buildings that require vibration measurement. In future research, the size of this wooden IMU can be further optimized, and element doping can be applied to LIG varistors to improve their conductivity and sensitivity.
Feb. 25, 2024Vol. 53 Issue 2 0212005 (2024)
Hongwei ZHANG, Rui QU, Weining CHEN, and Hongtao YANG
Aerial surveying and mapping is an important technical means of civil/military surveying and mapping, which can quickly obtain large-scale and high-precision scale mapping of the target area in a short period of time, and accurately obtain coordinate information of the target plane and elevation information on the map. The acquired information plays an important supporting role in digital city construction, land resources survey, military strategic planning, etc. With the development of aerial surveying and mapping technology, the requirements for aerial mapping cameras have been further improved. It is required that aerial mapping cameras can achieve wide width, high precision and large scale mapping. In order to meet the above requirements, the aerial mapping camera adopts scan imaging mode, but this imaging mechanism will introduce forward/scan image motion, which will affect the image quality. In order to satisfy the image stabilization accuracy of the aerial mapping camera, it is necessary to compensate the image motions. Therefore, a catadioptric aerial mapping camera based on secondary mirror image motion compensation is designed in this paper.Aiming at the dynamic image motion problem of the aerial mapping camera in the process of ground swing imaging, the vector aberration theory for a two-mirror telescopic systems is adopted. The secondary mirror is used as the image motion compensation element, and the comprehensive image motion compensation of the aerial mapping camera is realized through the secondary mirror multi-dimensional motion. However, in the process of compensating the image motion, the secondary mirror will be eccentric and inclined, which will cause the secondary mirror to be off-axis and affect the image quality. Therefore, a misalignment optical system model is established to study the relationship between the deviation vector of the secondary mirror field and the misalignment of the secondary mirror field, and the influence of the secondary mirror motion on the image quality is analyzed. Meanwhile, a design example of the optical-mechanical system of the catadioptric aerial mapping camera based on the secondary mirror image motion compensation is given. The effective focal length of the optical system is 450 mm, and the working spectrum is 435~900 nm. The field of view of the optical system is 4.17×3.13, and the F-number is 4.2. In the design process, the optical-mechanical system of aerial mapping camera adopts non-thermal design to adapt to the working environment of -40 ℃~60 ℃.In order to verify the image motion compensation ability of multi-dimensional motion of the optical element, an experimental platform is built to conduct laboratory imaging tests and field imaging tests on the aerial mapping camera. The laboratory imaging test results show that the dynamic resolution of the aerial mapping camera using the image motion compensation technology can reach 74 lp/mm, and the image motion compensation accuracy is better than 0.5 pixels, which meets the design expectation. In addition, the field imaging test results show that compared with disable image motion compensation function, the aerial survey camera with enable image motion compensation function can acquire sharp edges, clear images, and image quality can meet the expected requirements. Therefore, the camera has the advantages of high accuracy of image motion compensation, compact volume and high reliability, which lays a theoretical foundation for the direction of light and small, high precision and large scale mapping.
Feb. 25, 2024Vol. 53 Issue 2 0222001 (2024)
Gang JING, Zhi LIU, Peng LIN, Shutong LIU, and Qingfang JIANG
With the advancement of flight conditions for aerospace platforms, the impact of the boundary layer effect on space laser communication transmission is also growing. In order to reduce the influence of the boundary layer effect, corresponding correction methods must be studied. To provide verification conditions for the boundary layer effect correction system of laser communication on aerospace platforms, a simulator based on the Liquid Crystal Spatial Light Modulator (LC-SLM) was designed to simulate the boundary layer effect. This article first analyzes it from the perspective of geometric optics. It is assumed that the boundary layer is a thin layer (the inner and outer diameters are equal). The refractive index of the free flow is different from the refractive index of the boundary layer. Substituting them into the focal length formula of the lens makes it equivalent to a negative lens. Under different flight conditions, the focal length of the equivalent lens is different. Then use computer software to perform numerical analysis. Setting the wall curvature radius of the aerodynamic platform as 190 mm and the flight Mach number range as 0~5 Ma, in the case of troposphere (0~11 km), lower stratosphere (11~20 km), and upper stratosphere (20~32 km), the relationship curves are obtained between the Mach number, flight altitude, and the equivalent focal length of the negative lens representing the boundary layer effect. Research shows that as the Mach number increases, the equivalent focal length of the negative lens decreases, indicating a greater impact on the communication beam. Especially when the Mach number is small, the equivalent lens focal length changes more significantly with the Mach number. After that, the changes stabilized. In terms of flight altitude, the higher the flight altitude, the thinner the air and the lower the temperature, the boundary layer effect decreases accordingly until the equivalent lens focal length value approaches infinity, at which point it can basically be ignored.Based on the above analysis, the following is an introduction to the boundary layer simulation equipment. The core device of this simulator is the LC-SLM. The phase modulation grayscale image is obtained from the phase distribution function of the lens. The grayscale information controls the applied voltage of the LC-SLM, thereby controlling the deflection of the liquid crystal molecules in the LC-SLM, thereby affecting the response to light phase modulation. Load phase grayscale images of different focal lengths into the LC-SLM to realize the function of the zoom lens, and change the focal length of the simulated zoom lens to simulate the boundary layer effect under different flight conditions of the aviation platform. Due to the LC-SLM modulation depth is not an ideal 2π, and the relationship between the modulation depth and the loaded gray value is not an ideal mapping, the designed focal length value of the simulated zoom lens is inconsistent with the actual focal length value. Therefore, it is necessary to design and build an experimental platform to verify the accuracy of its simulation. This experiment uses a 1 550 nm laser as the light source, and emits parallel light after passing through the collimated beam expansion system. Since LC-SLM can only modulate linearly polarized light, a polarizer is added in front, and then enters the LC-SLM. The phase grayscale images of the lens focal lengths corresponding to the ten types of boundary layer effects in flight states are loaded into the LC-SLM respectively, and finally an infrared camera is used to receive and collect light spots at a close distance. There is a lot of noise in the original spot image, which will affect the accuracy of the spot size analysis. Therefore, the obtained original spot image is sequentially subjected to brightness adjustment, median filtering, threshold segmentation, morphological processing and edge coordinate extraction, and Hough transform circle fitting is used to obtain the spot centroid position and spot radius. Due to limitations of computer memory and computing power, the calculation accuracy is 0.05 pixel values. Then make an error line chart between the actual spot radius value of these ten sets of data and the theoretically calculated spot radius value. The calculated root mean square error is 0.043 75. This experiment verified the feasibility and effectiveness of the proposed boundary layer simulation method.
Feb. 25, 2024Vol. 53 Issue 2 0223001 (2024)
© Copyright 2018-2021 | Chinese Laser Press.
All Rights Reserved 沪ICP备15018463号-20